tasmia afsari
38
Executive summary This term paper is the based on the performance analysis of a bank operating in Bangladesh that is being listed in the Dhaka stock exchange. There are currentl y 29 banks list ed in Dhaka stock exchange. Based on the past stable performance I decided to work on Prime Bank Ltd and chose Eastern Bank Ltd for comparisons since they are close competitors. I evaluated the performance of both banks during the years 2004-2008 and used both companies annual report. I used the following kinds of ratio to analyze the performance. Liquidity ratios: Prime bank is in better position of liquidity management compared to eastern bank derived from conclusions using liquid security indicator, cash position indicator and capacity ratio. Leverage ratios: both prime and eastern bank is highly leveraged as they are financial institutions Efficiency ratios: eastern bank was superior to prime bank in terms of efficiency of tax management, asset utilization and operating efficiency. Profitability ratios: The overall profitability of eastern bank is better than prime bank ltd. Market Position ratios: Eastern bank is in superior position compared to prime bank in terms of EPS, Price earning ratio and market to book value ratio. At the beginning of the project, I gave a brief introduction about the company and methodology, limitations and description of all the ratios that is used in this project. 1
-
Upload
sarah-tasnia -
Category
Documents
-
view
228 -
download
0
Transcript of tasmia afsari
8/6/2019 tasmia afsari
http://slidepdf.com/reader/full/tasmia-afsari 1/38
Executive summary
This term paper is the based on the performance analysis of a bank operating in Bangladesh that
is being listed in the Dhaka stock exchange. There are currently 29 banks listed in Dhaka stock
exchange. Based on the past stable performance I decided to work on Prime Bank Ltd and chose
Eastern Bank Ltd for comparisons since they are close competitors. I evaluated the performance
of both banks during the years 2004-2008 and used both companies annual report. I used the
following kinds of ratio to analyze the performance.
Liquidity ratios: Prime bank is in better position of liquidity management
compared to eastern bank derived from conclusions using liquid security indicator, cash
position indicator and capacity ratio.
Leverage ratios: both prime and eastern bank is highly leveraged as they are financial
institutions
Efficiency ratios: eastern bank was superior to prime bank in terms of efficiency of tax
management, asset utilization and operating efficiency.
Profitability ratios: The overall profitability of eastern bank is better than
prime bank ltd.
Market Position ratios: Eastern bank is in superior position compared to prime bank in
terms of EPS, Price earning ratio and market to book value ratio.
At the beginning of the project, I gave a brief introduction about the company and methodology,
limitations and description of all the ratios that is used in this project.
1

8/6/2019 tasmia afsari
http://slidepdf.com/reader/full/tasmia-afsari 2/38
I used as many effective ratios as possible to evaluate the bank from every angle. After
calculating the ratios, I showed a time series, cross sectional graph to show the change over five
years and compare it with the other bank, and decided which one is comparatively doing well.
At the end of this project, I showed the final decision about the financial condition of both bank
and my recommendation. Included are calculations, extract from balance sheet and income
statement.
2

8/6/2019 tasmia afsari
http://slidepdf.com/reader/full/tasmia-afsari 3/38
Introduction
The main purpose of this assignment was to use the skill in strategic financial ratio analysis. I
had to demonstrate analytical abilities in explaining the implications of different ratios and
provide general assessment of a chosen company versus its competitor in the market.
I tried to complement my study of the absolute numbers by using ratios to ascertain trends,
identify areas of concern and identify areas of strength. I tried to provide the ‘Trend Analysis’ of
the ratios which graphically shows the likelihood of improvement and deterioration in financial
conditions of the firms. This project was about comparing two different public limited companies
from the banking industry.
I choose “Prime Bank Limited” as my main company and “Eastern Bank Ltd.” for
comparisons for the following year 2004-2008. The reasons behind choosing the companies were
simple. Prime bank limited is one of the banks that follows international standard in Banking and
Finance and its sheer size and stature as a Bank company is outstanding. As of early march 2010,
their stock prices were very good in the bank industry and the company’s performance reflectedin the stock prices. Its stock was listed as Category ‘A’ stocks on the Dhaka Stock Exchange.
Given the basic information about the company and its stock market performances, I was
convinced that Prime bank Limited would be a great company to work with. The financial
reports turned out to be straight forward, very well explained and user friendly.
To go put up against Prime bank Limited, I had to choose a company that was its close
competitor. Eastern Bank Limited is one of the modern banks in Bangladesh. As of early march
2010, their stock prices were excellent among the bank industry. Both the companies were trying
to increase market share and profitability.
3

8/6/2019 tasmia afsari
http://slidepdf.com/reader/full/tasmia-afsari 4/38

8/6/2019 tasmia afsari
http://slidepdf.com/reader/full/tasmia-afsari 5/38
Methodology
This report is based on ratio analysis of Prime Bank ltd and Eastern bank limited of the year
2004 to 2008.
Different types of data are used to complete this report. Data are collected from different sources.
The data about the companies are found from the website of the both company. The
mathematical data are found from the annual report of the both banks. I collected the financial
data from the annual report that was necessary for the ratio analysis. I mainly used the income
statement and balance sheet to analyze the ratios.
There are different types of ratio that can be used to analyze the financial condition of the bank.
Since the balance sheet and income statement of banks are very different from any other
company so I had to choose all the ratios very carefully.
I used the ratio analysis of five year in a time series and cross sectional graph to analyze all the
difficulties of both banks.
I used the dividend growth model to find out the intrinsic value of the company to compare it
with the current market price to see if the stock is over or under priced.
Finally, I compared both of them and made my recommendation. In some ratios, the
performance of the banks was very low or very high. I tried to find out the reasons behind this
problem and necessary solution.
5

8/6/2019 tasmia afsari
http://slidepdf.com/reader/full/tasmia-afsari 6/38
Limitation
Like any other analyzing process, I found some difficulties and problem at the time of preparing
the report. The limitations are given below.
Annual report of both company are not perfect. In the balance sheet the yearly
report are sometimes wrong and sometimes value of same data in different annual
report is different. Therefore, it is hard to find out the validity.
The ratio does not reflect the true financial condition of a bank all the time.
Inflation or deflation in economy does not affect the ratio analysis. Therefore, it
does not always show the true condition of a company.
Ratio analysis may find the problem but it does not provide any solution of the
problem.
6
8/6/2019 tasmia afsari
http://slidepdf.com/reader/full/tasmia-afsari 7/38
Overview of the bank
A group of visionary entrepreneurs established Prime Bank in April 1995. Known for its superior
service quality, brand Image, strong corporate Governance and a corporate culture committed to
excellence, Prime Bank is a top-tier bank in Bangladesh.
The Prime Bank Group focuses on a wide range of banking and financial services, which include
commercial banking, retail & SME asset management, Islamic banking, investment banking,
merchant banking and card business. Prime Bank is a market leader in corporate to consumer
banking and retail lending to SMEs in Bangladesh.
Prime Bank ranked 15th in Bangladesh by market capitalization, which stood at Tk.15349
million as at the end of 2008. DSE-20 Index has ranked it as fourth company as per performance.
The Prime Bank Group is the second largest banking group in Bangladesh by asset size, with
total assets of Tk. 110,437 million. The Bank’s deposits and lending growth were 24.83 and
30.29 respectively in 2008.
The Prime Bank Group has a large and well-distributed branch network of 70 full fledged
branches and 3 Off shore Banking Unit & Booths in Bangladesh with a strong tradition of
service excellence. The Bank has also made its presence in Singapore through its fully owned
subsidiary Prime Exchange Co. Ltd. For facilitating inward foreign remittance to Bangladesh.
The Prime Bank Group has a strong capital base with a risk-weighted capital adequacy ratio of
10.88 percent and a Tier-1 of 8.67 percent at the end of 2008. The Group has one of the most
7
8/6/2019 tasmia afsari
http://slidepdf.com/reader/full/tasmia-afsari 8/38
efficient capital structures in Bangladesh. The Bank also has good asset quality in the banking
industry and very strong financial ratings.
Prime Bank continues to earn recognition and trust for its strong and sustained financial
performance and product management. In 2008, ICAB and SAFA Bronze Award in the region
honored Prime Bank with best bank award in Bangladesh.
The Prime Bank Group is committed to deliver value to its stakeholders. To its customers, the
Group will continue to provide effective and competitive financial solutions and services. To its
shareholders and investors, the Group will continue to enhance shareholder value through
consistent financial performance and efficient capital management. To its employees, the Group
will continue to foster a strong performance and learning culture that allows the development of
the best talents for the Group.
Stakeholders in the Prime Bank Group, including shareholders, customers, investors and the
public in general has access to various sources of information on the Prime Bank Group.
Prime Bank’s website at (www.prime-bank.com) and (www.primebank.com.bd) provide a wide
range of information about the bank’s corporate information, Board of Directors, senior
management, corporate vision mission, financial information, corporate philosophy products and
services and awards and recognition of the bank.
Credit Rating on Prime Bank Limited by CRISL
Long Term Short Term
Surveillance
Rating (2007)AA ST-2
Entity Rating(2006)
AA ST-2
Outlook Stable
Date of Rating 29th June, 2008
Literature Review
8
8/6/2019 tasmia afsari
http://slidepdf.com/reader/full/tasmia-afsari 9/38
To analyze the performance of any commercial bank we need the published financial statements
of the institution notably the Report of Condition, the Report of Income and the stock price in
over the period of assessment. We need to find out the key objectives of the company and using
various techniques evaluate the performance of the company. One key objective of a commercial
bank is to maximize the value of the firm or stock.
The technique used for performance appraisal is financial ratio analysis. Two types of ratio
comparisons can be made: cross sectional and time series. Cross sectional analysis or
benchmarking involves the comparison of financial ratios at the same point of time with their
competitors. Time series analysis evaluates performance over time, which enables to assess the
firm’s progress.
Financial ratios are divided into five basic categories: liquidity, profitability, leverage, efficiency
and market position. Liquidity, activity and debt ratios primarily measure risk. Profitability
measure return. Market ratios capture both risk and return.
• PROFITABILITY AND EFFICIENCY RATIOS
Financial analysts use profitability ratios as surrogates for indicators of stock values. Some of
these ratios are return on equity, return on assets, net interest margin, net noninterest margin, net
operating margin, earning spread, earning per share.
Return on assets is primarily an indicator of managerial efficiency. It indicates how capable
management has been in converting assets into net earnings.
Return on equity is a measure of the rate of return flowing to shareholders. It indicates the net
benefit that the stockholder has received from investing their capital in the financial firm.
9
8/6/2019 tasmia afsari
http://slidepdf.com/reader/full/tasmia-afsari 10/38
8/6/2019 tasmia afsari
http://slidepdf.com/reader/full/tasmia-afsari 11/38
Net interest margin (NIM) or net interest income to total assets is an indication of managements
efficiency in achieving a positive spread between interest revenue and interest cost by close
control over earning assets and pursuit of the cheapest source of funding.
Net noninterest margin or net non-interest income to total assets measures the amount of
noninterest revenue stemming from service fees the financial firm has been able to collect
relative to noninterest expenses such as salaries, maintenance and loan loss expenses.
Net operating margin or net operating income to total assets is also a measurement of
profitability and efficiency just like the previous two ratios. It indicates how well management
and staff have been able to keep growth of revenue ahead of rising costs.
Earning spread is another traditional measure of earning efficiency. The spread measures the
effectiveness of a financial firms intermediation function in borrowing and lending money and
the intensity of competition in the firm’s market area. Greater competition other factors held
constant will squeeze the difference between average asset yield and average liability cost.
Earning per share is generally of interest to present or prospective stockholders and management.
EPS represents the number of dollars earned during the period on behalf of each outstanding
share of common stock.
• LIQUIDITY RATIOS
Cash position indicator or cash and deposit due from depository institution / total assets indicates
the percentage of total assets in cash in vault and other depository institution. The greater the
ratio the stronger the position to handle immediate cash needs.
Liquid security indicator or government security / total assets compares the most marketable
securities an institution can hold with the overall size of its asset portfolio. The greater the
proportion of government security, the more liquid the depository institutions position tends to
be.
11
8/6/2019 tasmia afsari
http://slidepdf.com/reader/full/tasmia-afsari 12/38
Capacity ratio or net loans and leases / total assets are really a negative liquidity indicator
because loans and leases are often the most illiquid of assets.
• Market ratios
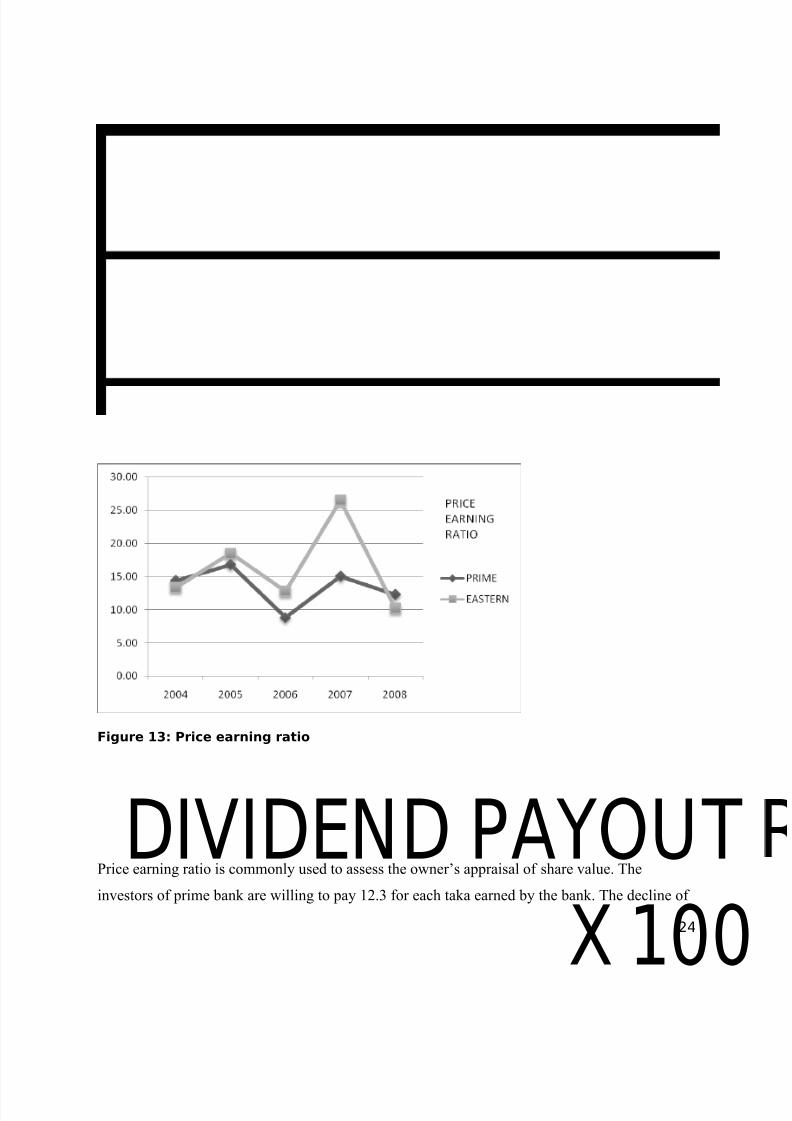
Price earning ratio is commonly used to assess the owner’s appraisal of share value. The P/E
ratio measures the amount that investors are willing to pay for each dollar of a firm’s earnings.
The level of this ratio indicates the confidence that investors have in the firm’s future
performance. The higher the P/E ratio, the greater the confidence.
Market to book value ratio provides an assessment of how investors view the firm’s
performance. It relates the market value of the firms shares to their book strict accounting value.
To calculate the firms M/B ratio we need to calculate book value per share of common stock.
Book value per share of common stock = common stock equity / no of outstanding common
stock
Market / book ratio = market price per share of stock/ book value per share of common stock
• LEVERAGE
Debt ratio measures the proportion of total assets financed by the firm’s creditors. The higher
this ratio, the greater the amount of other people’s money being used to generate profits.
Findings and Analysis
o PROFITABILITY AND EFFICIENCY RATIO
12

8/6/2019 tasmia afsari
http://slidepdf.com/reader/full/tasmia-afsari 13/38
TAX MANAGEMEN
EXPENSE CONTROL EF
NET OP. INCOME/TOTFigure 1: Return on equity
13
8/6/2019 tasmia afsari
http://slidepdf.com/reader/full/tasmia-afsari 14/38
ROE indicates the return on equity earned on stockholders investment.
Prime banks return was steady during 2006-07 (27%) but dropped in 2008 (19%). The reasons
maybe low pretax income, lack of efficient control of expenses and unable to allocate assets to
high yielding loan and investment.
Eastern banks return improved in 2008 (17%) from previous year (11%).
Although the ROE of prime bank is higher than eastern bank but the return on equity of prime
bank has declined significantly over the year. So eastern bank is in a better position.
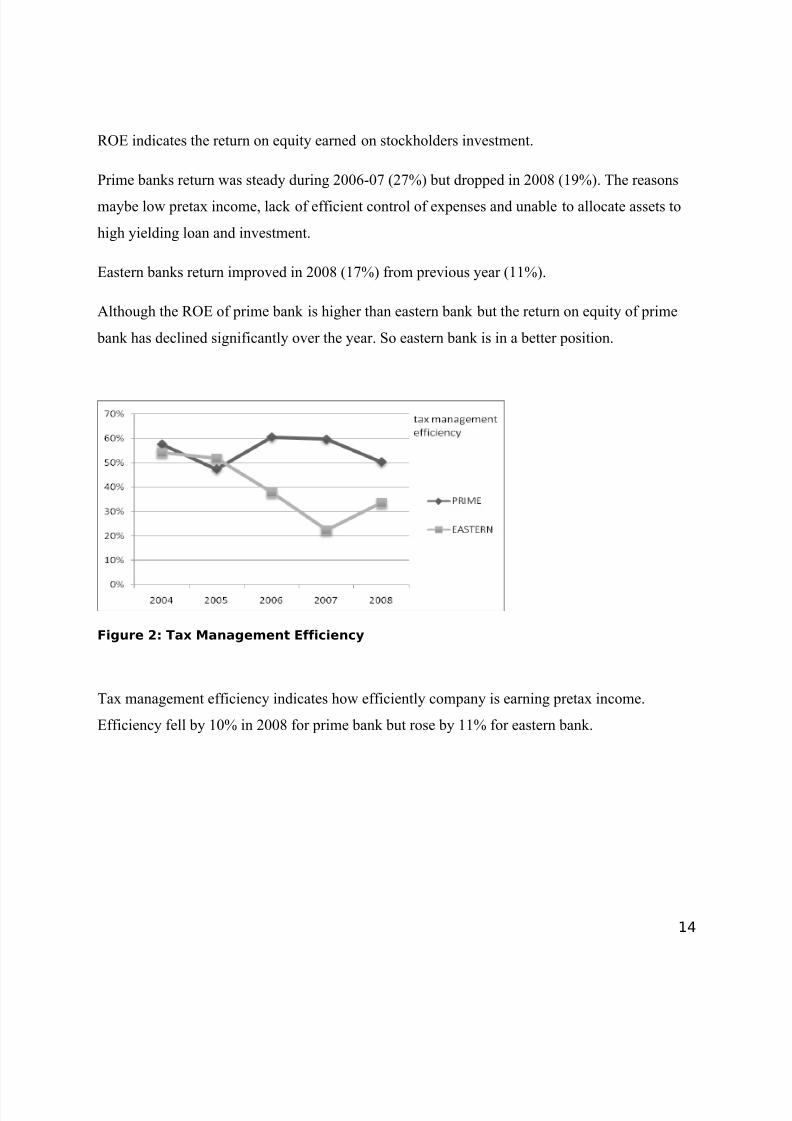
Figure 2: Tax Management Efficiency
Tax management efficiency indicates how efficiently company is earning pretax income.
Efficiency fell by 10% in 2008 for prime bank but rose by 11% for eastern bank.
14
8/6/2019 tasmia afsari
http://slidepdf.com/reader/full/tasmia-afsari 15/38
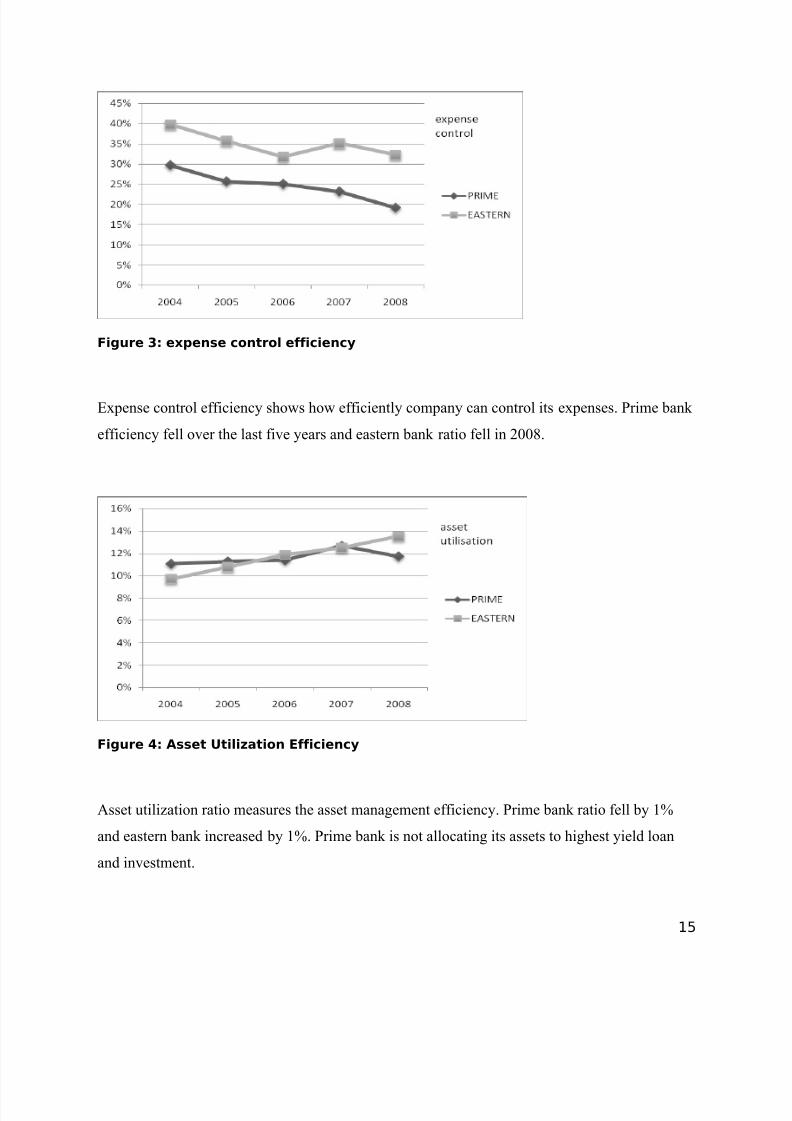
Figure 3: expense control efficiency
Expense control efficiency shows how efficiently company can control its expenses. Prime bank
efficiency fell over the last five years and eastern bank ratio fell in 2008.
Figure 4: Asset Utilization Efficiency
Asset utilization ratio measures the asset management efficiency. Prime bank ratio fell by 1%
and eastern bank increased by 1%. Prime bank is not allocating its assets to highest yield loan
and investment.
15
8/6/2019 tasmia afsari
http://slidepdf.com/reader/full/tasmia-afsari 16/38
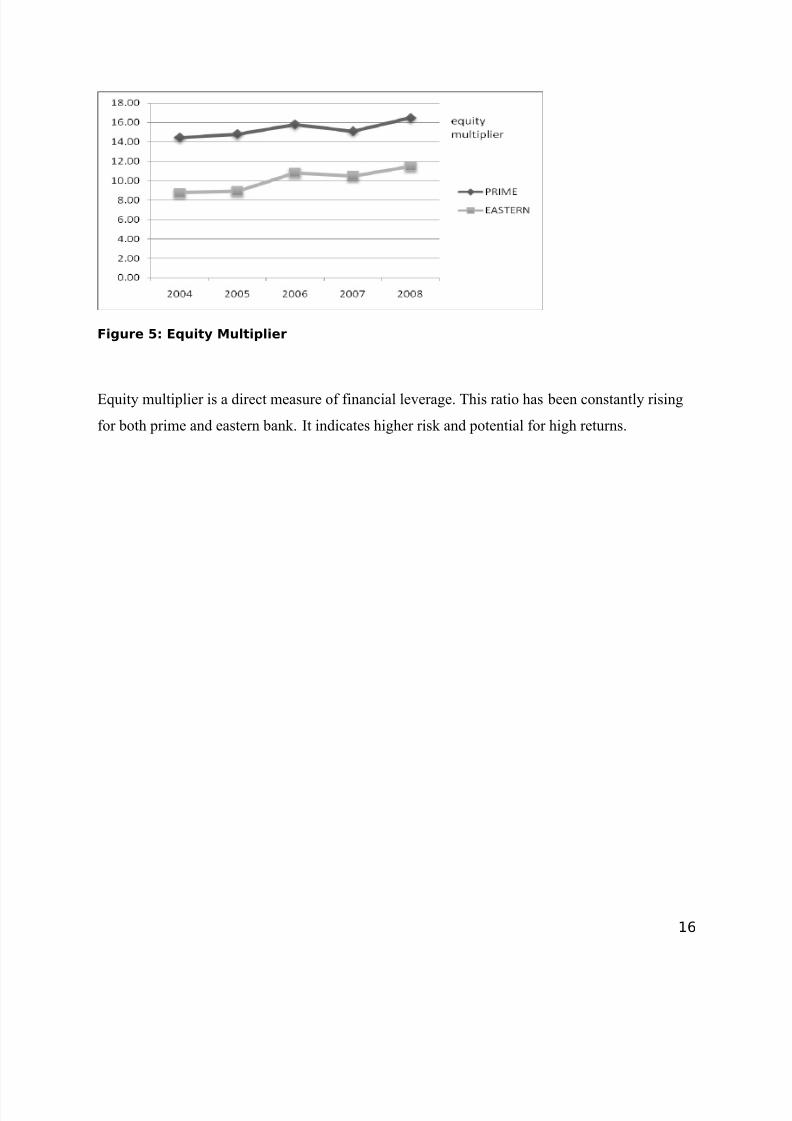
Figure 5: Equity Multiplier
Equity multiplier is a direct measure of financial leverage. This ratio has been constantly rising
for both prime and eastern bank. It indicates higher risk and potential for high returns.
16
8/6/2019 tasmia afsari
http://slidepdf.com/reader/full/tasmia-afsari 17/38
RETURN ON ASSET (
NET INTEREST MARGININEREST INCOME – INT
TOTAL ASSETS
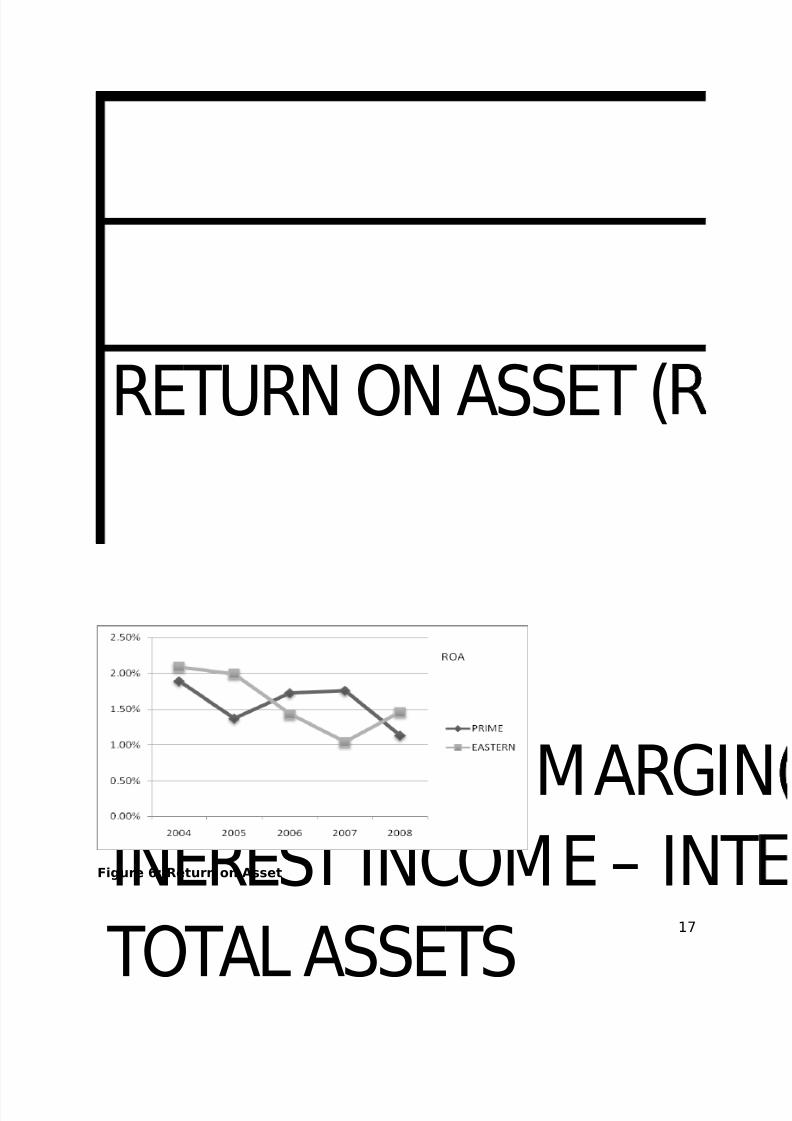
Figure 6: Return on Asset
17
8/6/2019 tasmia afsari
http://slidepdf.com/reader/full/tasmia-afsari 18/38
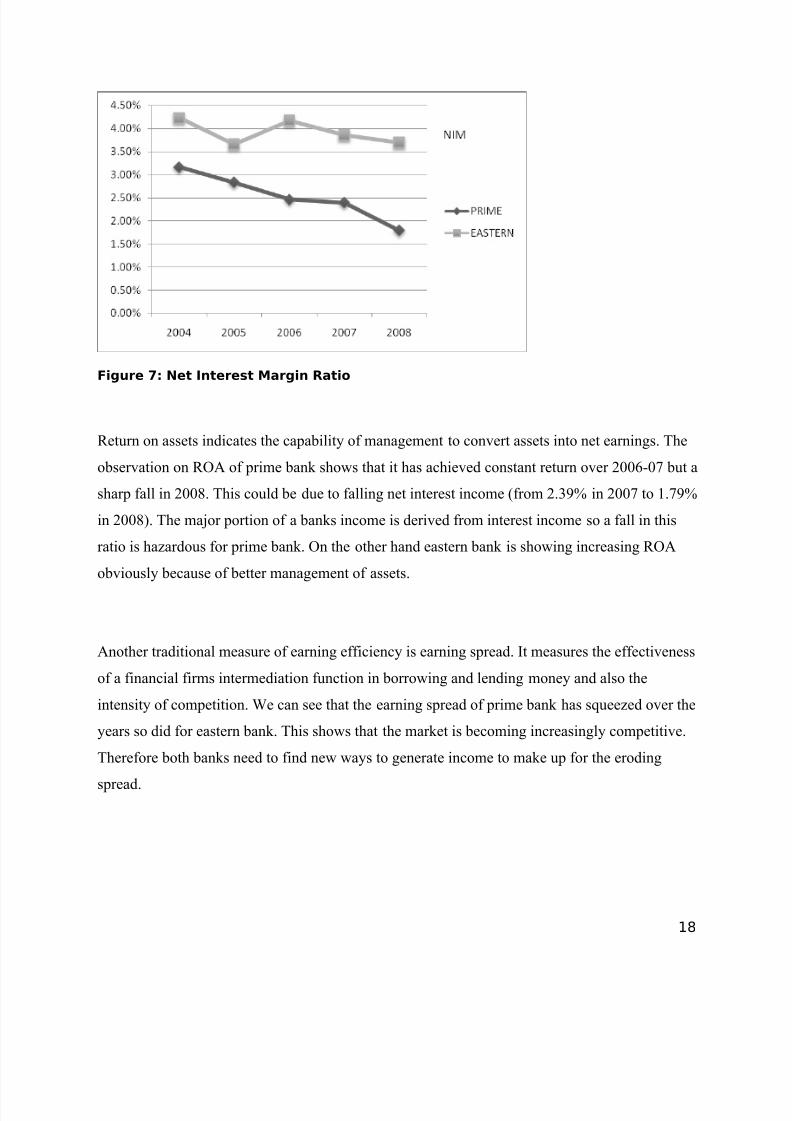
Figure 7: Net Interest Margin Ratio
Return on assets indicates the capability of management to convert assets into net earnings. The
observation on ROA of prime bank shows that it has achieved constant return over 2006-07 but a
sharp fall in 2008. This could be due to falling net interest income (from 2.39% in 2007 to 1.79%
in 2008). The major portion of a banks income is derived from interest income so a fall in this
ratio is hazardous for prime bank. On the other hand eastern bank is showing increasing ROA
obviously because of better management of assets.
Another traditional measure of earning efficiency is earning spread. It measures the effectiveness
of a financial firms intermediation function in borrowing and lending money and also the
intensity of competition. We can see that the earning spread of prime bank has squeezed over the
years so did for eastern bank. This shows that the market is becoming increasingly competitive.
Therefore both banks need to find new ways to generate income to make up for the eroding
spread.
18
8/6/2019 tasmia afsari
http://slidepdf.com/reader/full/tasmia-afsari 19/38
OPERATING EFFIC
OPERATING EX
OPERATING
EM PLOYEE PROD
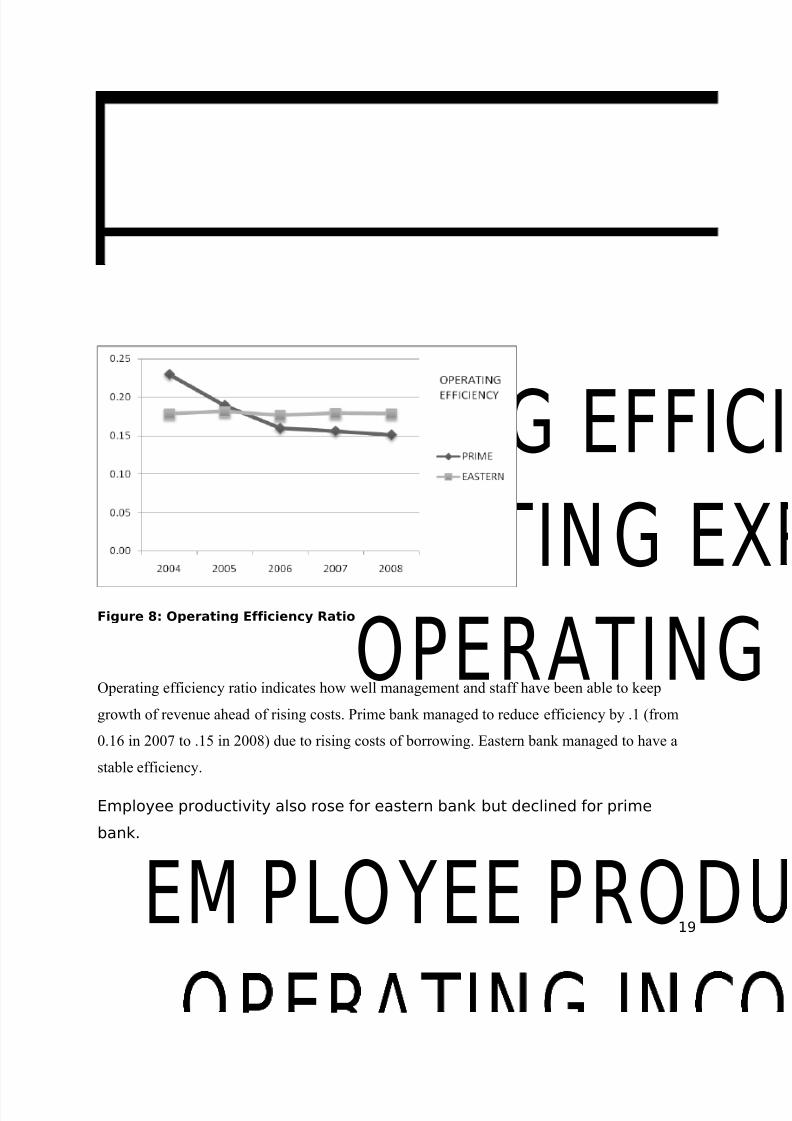
Figure 8: Operating Efficiency Ratio
Operating efficiency ratio indicates how well management and staff have been able to keep
growth of revenue ahead of rising costs. Prime bank managed to reduce efficiency by .1 (from
0.16 in 2007 to .15 in 2008) due to rising costs of borrowing. Eastern bank managed to have a
stable efficiency.
Employee productivity also rose for eastern bank but declined for prime
bank.
19
8/6/2019 tasmia afsari
http://slidepdf.com/reader/full/tasmia-afsari 20/38
o LIQUIDITY POSITION
LIQUID SECURITIES IN
GOVERNMENT SECU
ASSETS
CASH POSITION INDI
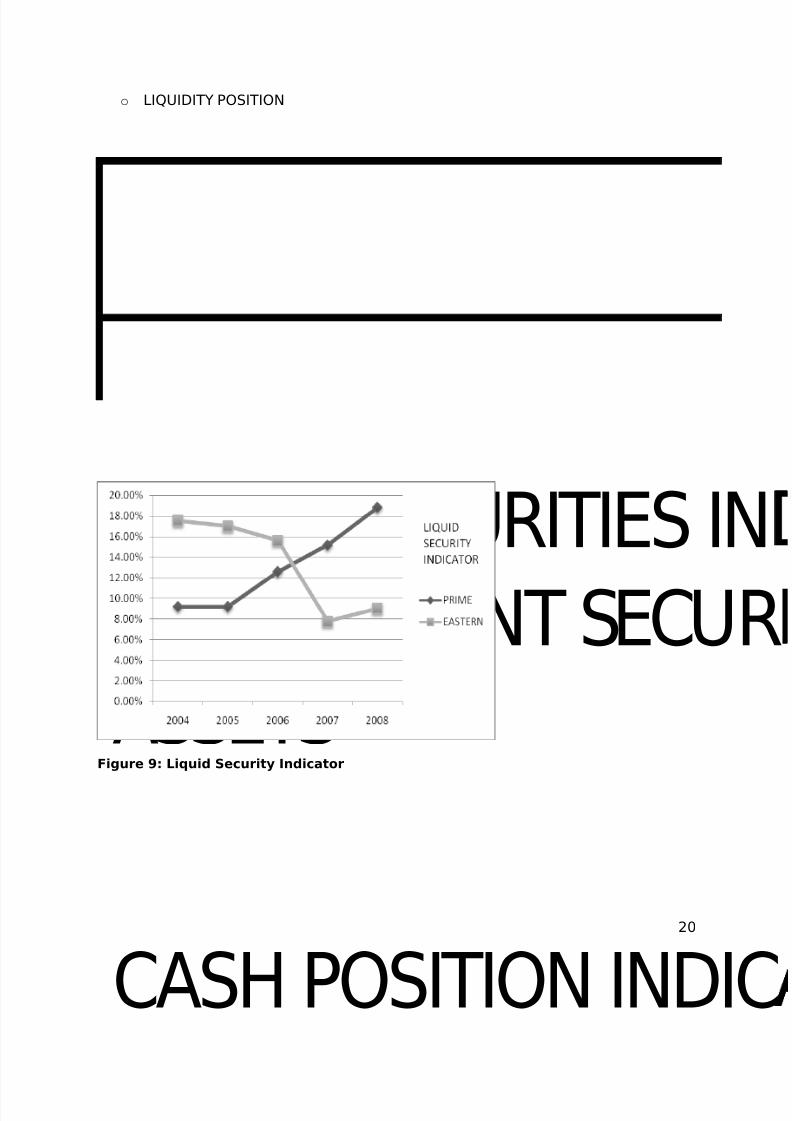
Figure 9: Liquid Security Indicator
20
8/6/2019 tasmia afsari
http://slidepdf.com/reader/full/tasmia-afsari 21/38
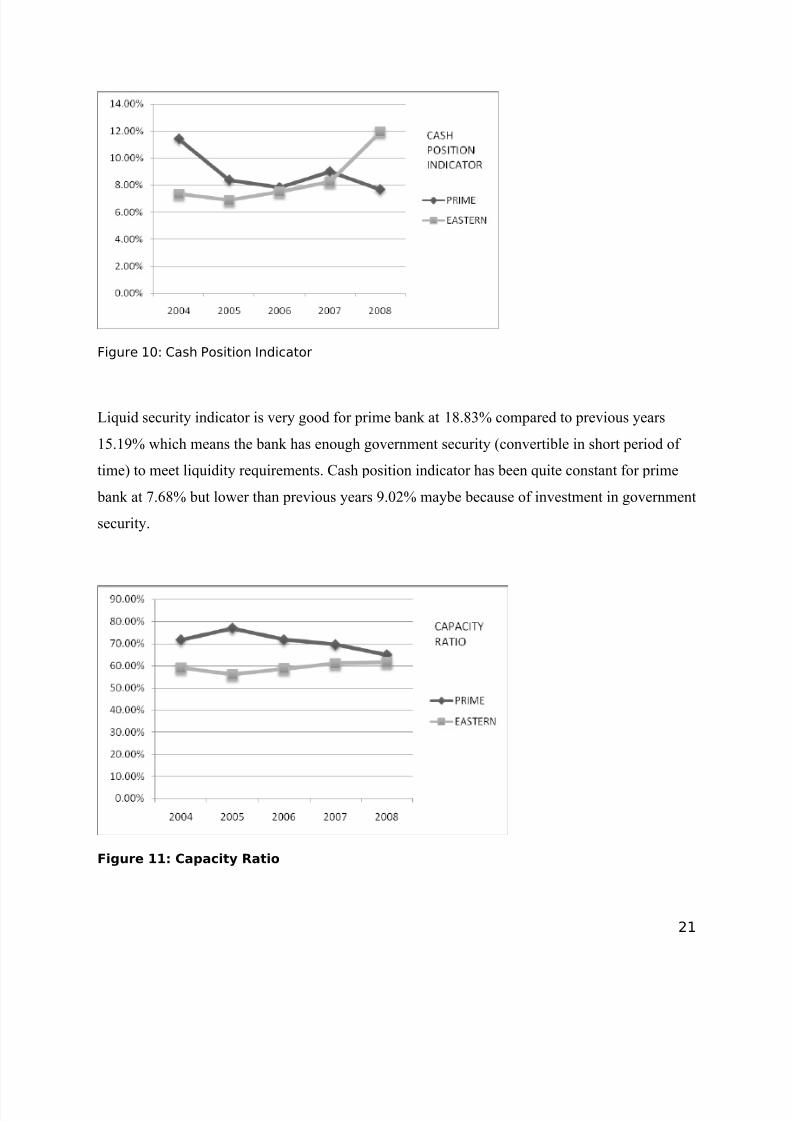
Figure 10: Cash Position Indicator
Liquid security indicator is very good for prime bank at 18.83% compared to previous years
15.19% which means the bank has enough government security (convertible in short period of
time) to meet liquidity requirements. Cash position indicator has been quite constant for prime
bank at 7.68% but lower than previous years 9.02% maybe because of investment in government
security.
Figure 11: Capacity Ratio
21

8/6/2019 tasmia afsari
http://slidepdf.com/reader/full/tasmia-afsari 22/38
Rising liquid security indicator proves the lower capacity ratio. Company has been investing in
government and private interest bearing security rather than increasing loans and leases.
Therefore, capacity ratio fell from previous year 69.57% to 64.92%. This is good for liquidity
because loans and leases are the most illiquid of all assets. However, it may indicate opportunity
cost of greater earning capacity.
The liquidity position of prime is very good and in a confident position not to disrupt the
reputation of the company.
On the other hand, liquidity position of eastern bank is not better than prime bank in terms of
liquid security indicator and cash position indicator and the capacity ratio do not show greater
investment in loans and leases. Maybe they are holding too much cash in vault or other
depository institution or invested in capital expenditure.
22
8/6/2019 tasmia afsari
http://slidepdf.com/reader/full/tasmia-afsari 23/38
DEBT RATIO: T
LIABILITIES/TOTA
DEBT TO EQUIT
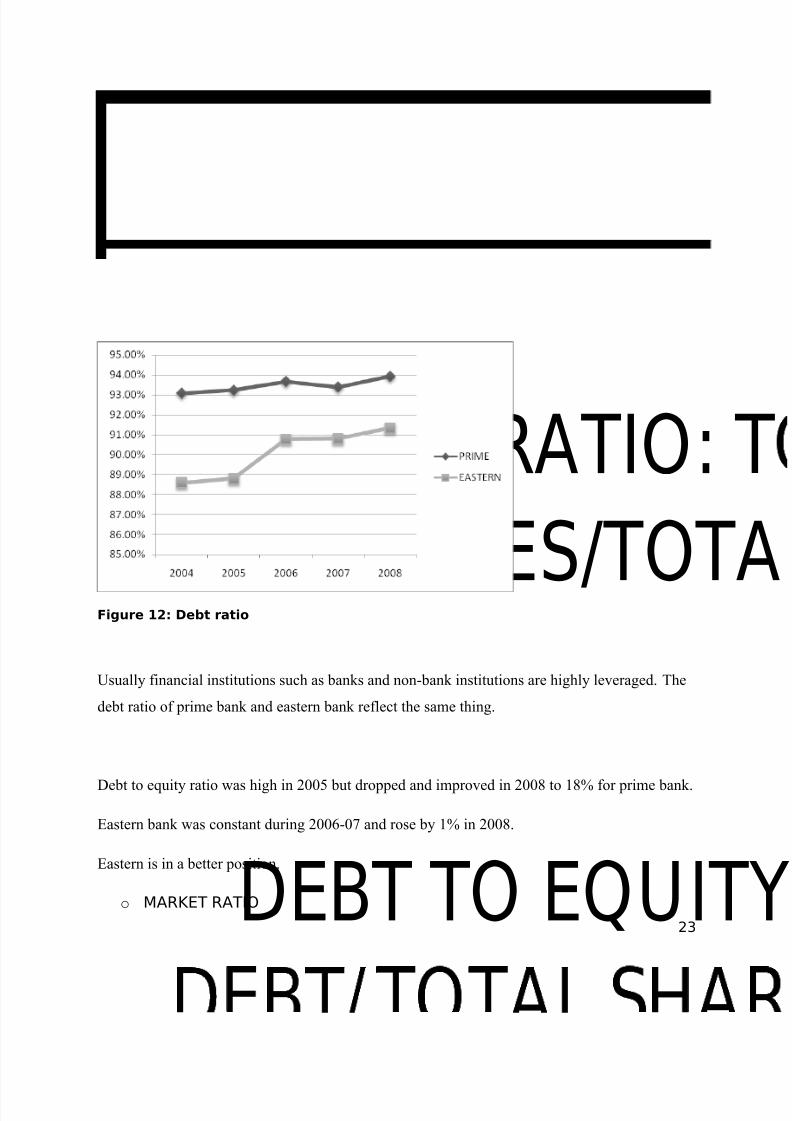
Figure 12: Debt ratio
Usually financial institutions such as banks and non-bank institutions are highly leveraged. The
debt ratio of prime bank and eastern bank reflect the same thing.
Debt to equity ratio was high in 2005 but dropped and improved in 2008 to 18% for prime bank.
Eastern bank was constant during 2006-07 and rose by 1% in 2008.
Eastern is in a better position.
o MARKET RATIO
23
8/6/2019 tasmia afsari
http://slidepdf.com/reader/full/tasmia-afsari 24/38
8/6/2019 tasmia afsari
http://slidepdf.com/reader/full/tasmia-afsari 25/38
this ratio proves the falling confidence of investors in the firm’s future performance. But in the
investors point of view lower P/E ratio is better because they are paying less for each taka
earned.
Eastern bank faced similar loss of confidence from investors as their P/E ratio also declined amid
increased earning per share. This ratio is 10.24 for eastern bank and 12.3 for prime bank.
In investors point of view eastern ratio is preferred.
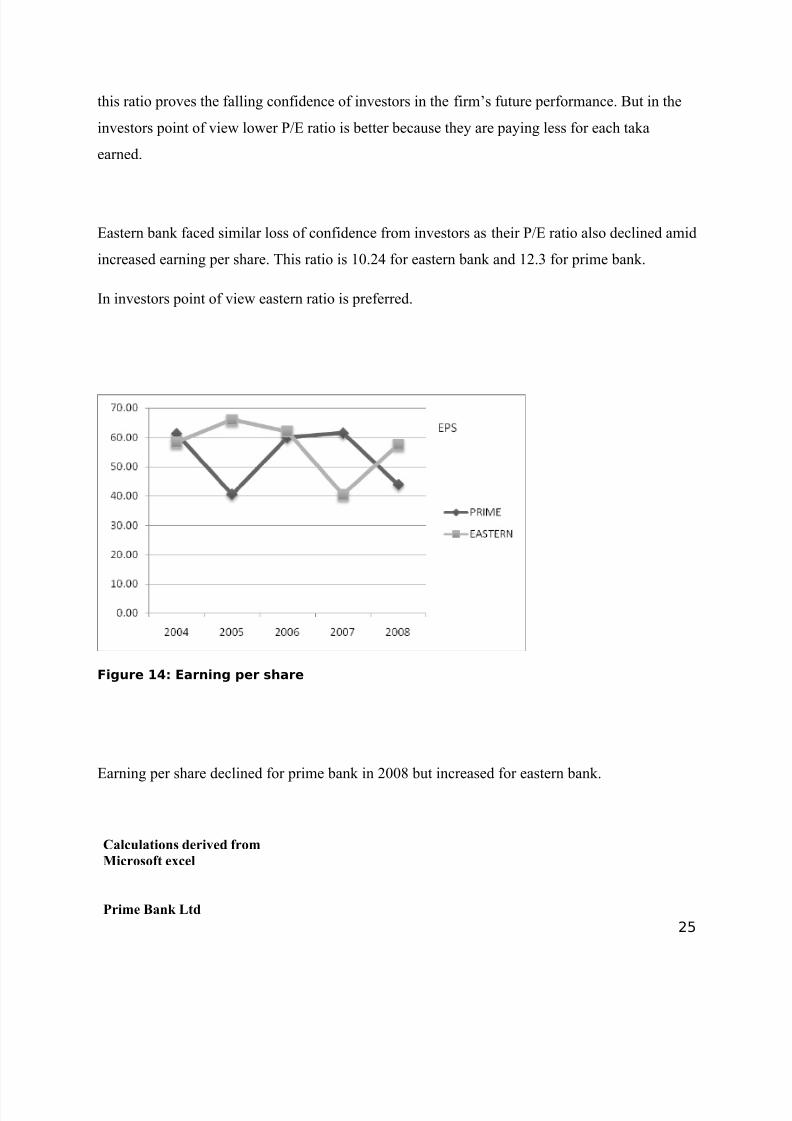
Figure 14: Earning per share
Earning per share declined for prime bank in 2008 but increased for eastern bank.
Calculations derived from
Microsoft excel
Prime Bank Ltd
25
8/6/2019 tasmia afsari
http://slidepdf.com/reader/full/tasmia-afsari 26/38
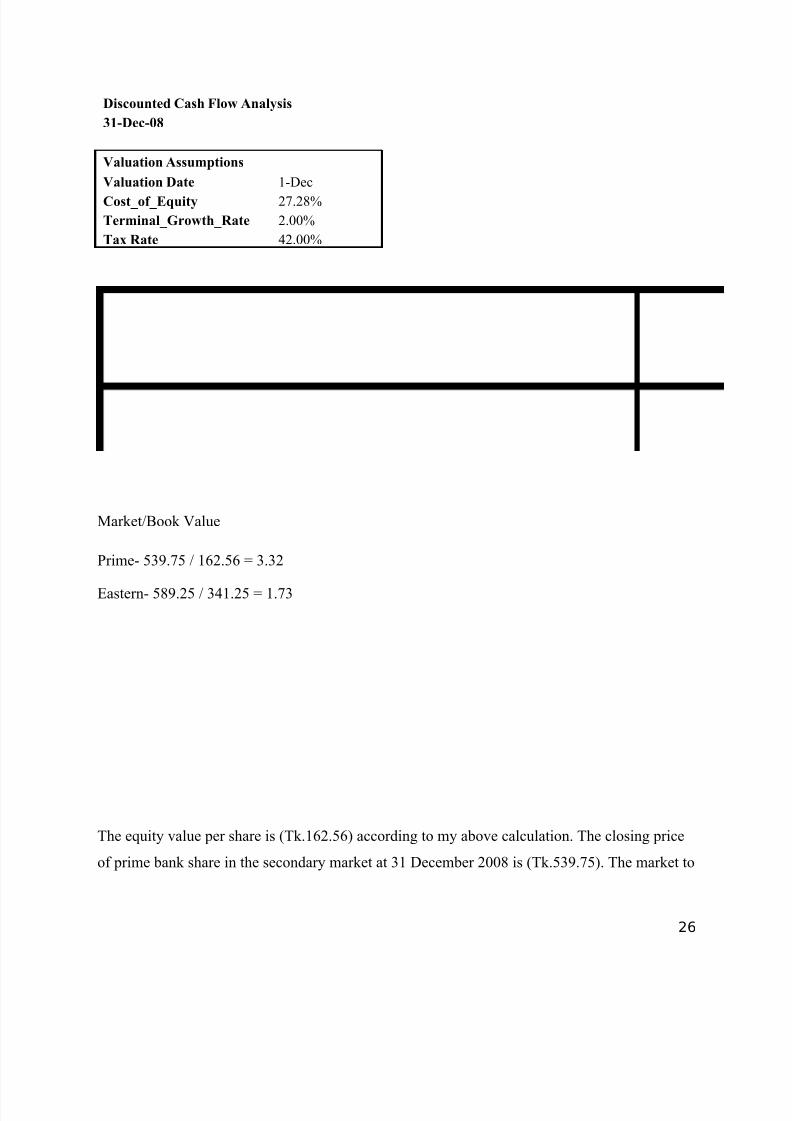
Discounted Cash Flow Analysis
31-Dec-08
Valuation Assumptions
Valuation Date 1-Dec
Cost_of_Equity 27.28%
Terminal_Growth_Rate 2.00%
Tax Rate 42.00%
Market/Book Value
Prime- 539.75 / 162.56 = 3.32
Eastern- 589.25 / 341.25 = 1.73
The equity value per share is (Tk.162.56) according to my above calculation. The closing price
of prime bank share in the secondary market at 31 December 2008 is (Tk.539.75). The market to
26

8/6/2019 tasmia afsari
http://slidepdf.com/reader/full/tasmia-afsari 27/38
book value ratio suggests 3.32. The market price of the share is overpriced. It means if the
market reaches a position of correctness than the price of share might fall.
On the other hand, the equity value of eastern bank is 341.25 according to some calculations.
The closing price is Tk. 589.25 as at 31 December 2008. The market to book value is 1.73.
The ratio is lower for eastern bank so this stock is preferred over the other.
Recommendation
27

8/6/2019 tasmia afsari
http://slidepdf.com/reader/full/tasmia-afsari 28/38
TAX MANA
EXPENSE C
EQUITY MULTIPLIER
ROE
ROA
NET INTEREST MARGI
NET NON INTEREST MA
Profitability
The overall profitability of eastern bank is better than prime bank ltd.
The average ROE of prime bank shows favorable than eastern bank, yet it is declining in 2008 so
it is not reflective of good earnings this year. The ROA of prime bank is falling due to falling net
interest income. On the other hand, eastern bank is showing increasing trend. Eastern bank has a
stable operating efficiency compared to prime banks declining ratio.
Liquidity
Prime bank is in better position of liquidity management compared to eastern bank derived from
conclusions using liquid security indicator, cash position indicator and capacity ratio.
28
8/6/2019 tasmia afsari
http://slidepdf.com/reader/full/tasmia-afsari 29/38

8/6/2019 tasmia afsari
http://slidepdf.com/reader/full/tasmia-afsari 30/38
The outcome of this report suggests that an investor holding prime bank shares at the time should
sell off their shares to avoid depletion of their wealth. The advice to prospective investors is to
utilize their money by investing in eastern bank shares because the prospects are rewarding.
Both the companies are first generation banks and have achieved considerable amount of growth
since their inception. The markets for secondary shares are always risky in Bangladesh because
the stock market here is what is known as ‘inefficient market’. Sometimes the fundamentals of a
company does not reflect actual price of the share in the market. However, I tried my best to get
a picture from my viewpoint and present a recommendation.
Bibliography
30

8/6/2019 tasmia afsari
http://slidepdf.com/reader/full/tasmia-afsari 31/38
1. http://ebl.com.bd
2. Annual Reports of Eastern Bank Ltd (2004-2008).
3. www.primebank.com.bd/
4. Annual Re ports of Prime Bank Limited (2004-2008).
5. Peter S. Rose & Sylvia C. Hudgins, Bank Management & Financial Services, 7th edition,
2008, McGraw-Hill publications.
31

8/6/2019 tasmia afsari
http://slidepdf.com/reader/full/tasmia-afsari 32/38
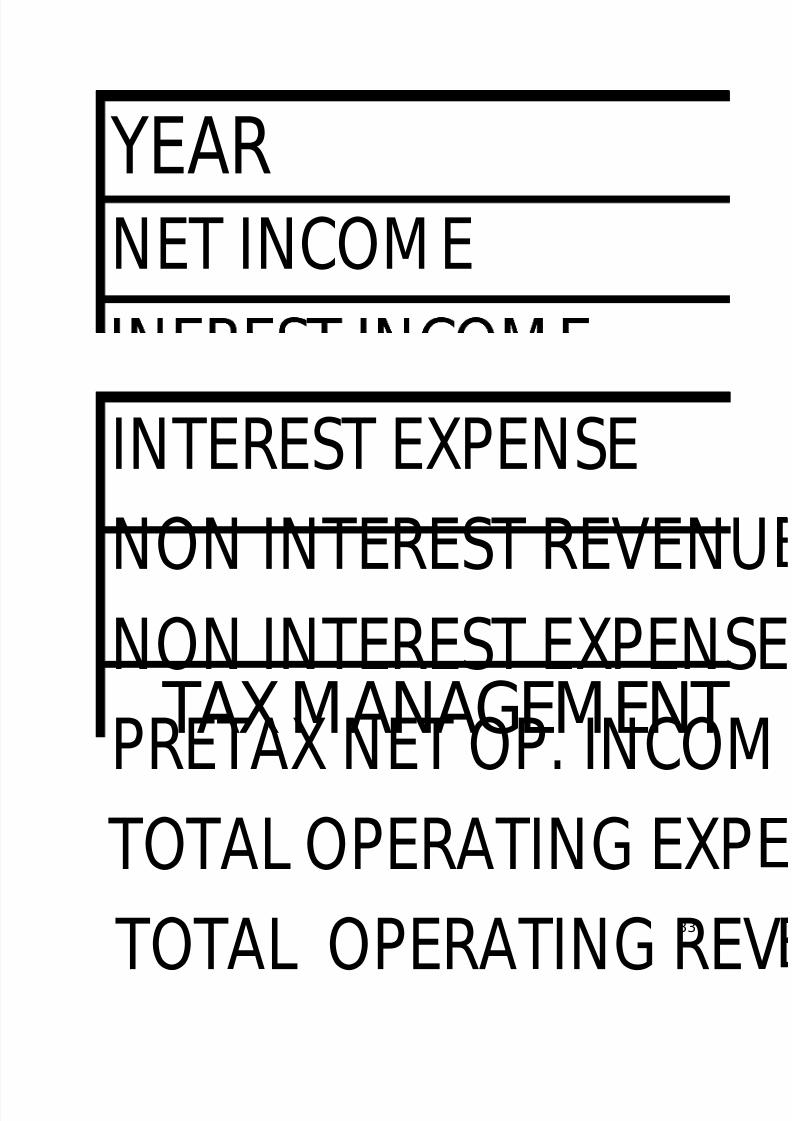
Appendix 1
Profitability ratio and efficiency ratio
32
8/6/2019 tasmia afsari
http://slidepdf.com/reader/full/tasmia-afsari 33/38
YEAR
NET INCOM E
INTEREST EXPENSE
NON INTEREST REVENU
NON INTEREST EXPENS
PRETAX NET OP. INCOM
TOTAL OPERATING EXP
TOTAL OPERATING RE
TAX MANAGEMENT
33
8/6/2019 tasmia afsari
http://slidepdf.com/reader/full/tasmia-afsari 34/38
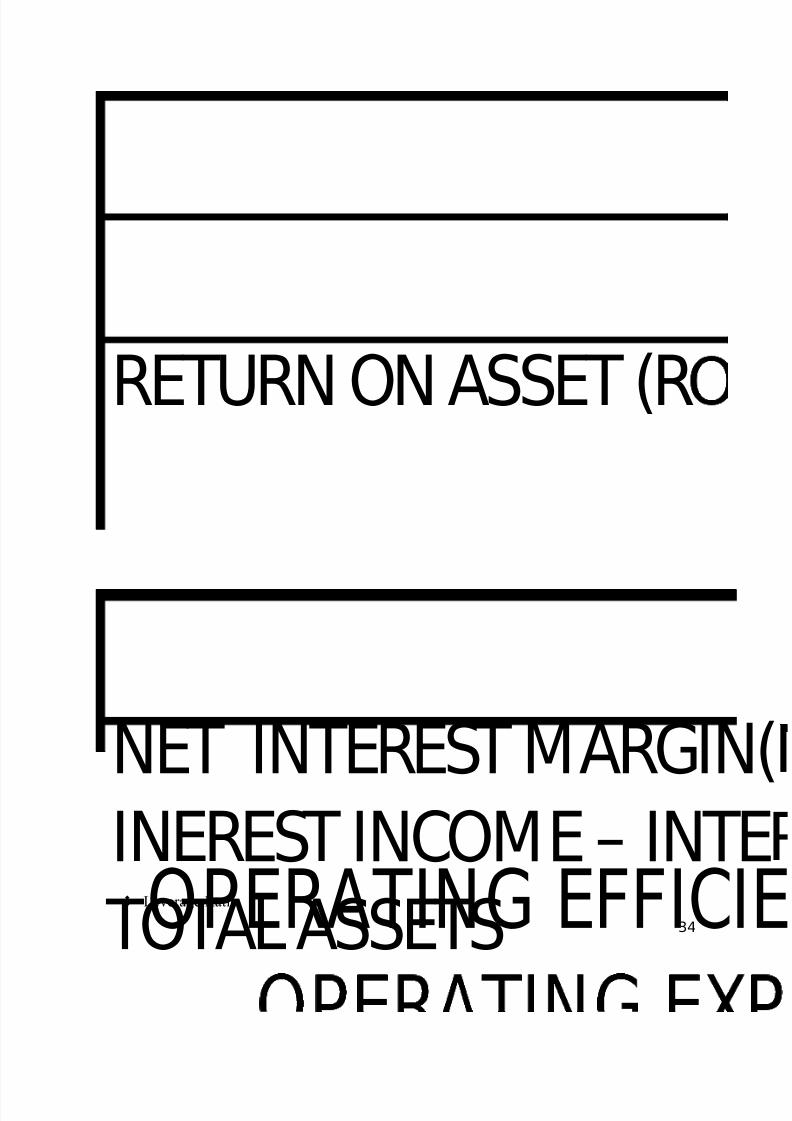
RETURN ON ASSET (R
NET INTEREST MARGININEREST INCOME – INT
TOTAL ASSETSOPERATING EFFICI Leverage Ratio
34
8/6/2019 tasmia afsari
http://slidepdf.com/reader/full/tasmia-afsari 35/38
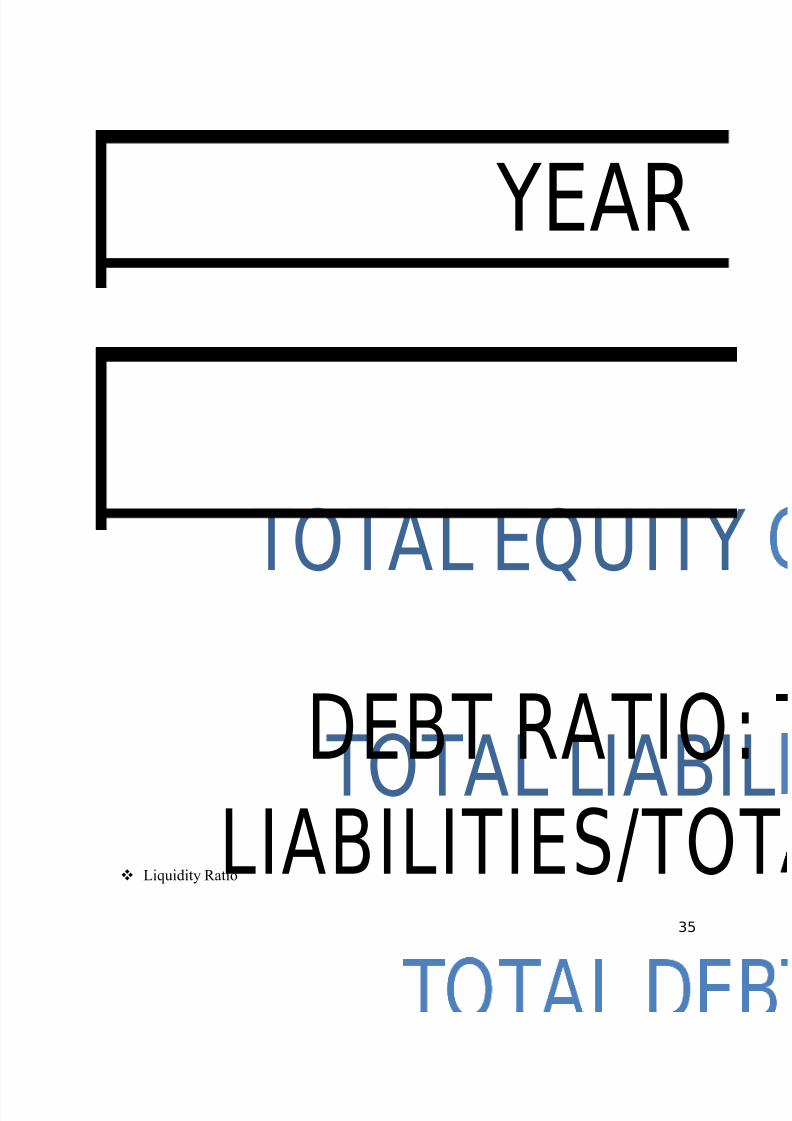
YEAR
TOTAL EQUITY
TOTAL LIABIDEBT RATIO
LIABILITIES/TO Liquidity Ratio
35

8/6/2019 tasmia afsari
http://slidepdf.com/reader/full/tasmia-afsari 36/38
GOVERNM ENT SECU
YEA
CASH & DEPOSIT DU
INSTITUTION
NET LOANS AND LEA
Market Ratio
36

8/6/2019 tasmia afsari
http://slidepdf.com/reader/full/tasmia-afsari 37/38

8/6/2019 tasmia afsari
http://slidepdf.com/reader/full/tasmia-afsari 38/38
Appendix 2