TASMANIAN TRAVEL & PHYSICAL ACTIVITY STUDY … · Fellow, University of the ... Activity Study 2017...
39
TASMANIAN TRAVEL & PHYSICAL ACTIVITY STUDY 2017 Summary Report Report prepared by Anna Lyth, Melanie Sharman & Verity Cleland February 2018
Transcript of TASMANIAN TRAVEL & PHYSICAL ACTIVITY STUDY … · Fellow, University of the ... Activity Study 2017...
TASMANIAN TRAVEL & PHYSICAL ACTIVITY STUDY 2017 Summary Report
Report prepared by Anna Lyth, Melanie Sharman & Verity Cleland
February 2018

i
Table of contents Table of contents i
Acknowledgements ii
Glossary and abbreviations iii Glossary iii Abbreviations iv
BACKGROUND 1
METHOD AND PARTICIPATION 3 Study Design 3 Recruitment 3 Participation and statistical confidence 4 Survey analysis areas 6
RESULTS 8 Measures of accessibility – car, bike, bus 8 Bus use 10 Trip mode and length 13 Health and physical activity indicators 17 Bus use and walking 19 Barriers to the use of public transport 20 Facilitating the use of public transport 22
CONCLUSIONS AND FUTURE INQUIRY 26
Endnotes (references and notes) 28
Appendix A 30 Tasmanian Travel Behaviour & Physical Activity Survey – Question topics 30
ii
Acknowledgements This project was funded by a Menzies Institute for Medical Research, University of Tasmania, seed grant. Verity Cleland is supported by a Heart Foundation Future Leader Fellowship. We would like to thank our study partners, particularly Metro Tasmania, the Tasmanian Department of Health and Human Services and City of Hobart for their in-kind contributions to the project.
This project was approved by the Tasmanian Social Sciences Human Research Ethics Committee (ID H0016327) on the 10 February 2017.
Full list of project investigators:
• Dr Verity Cleland, Menzies Institute for Medical Research, University of Tasmania (Project Lead)
• Dr Anna Lyth, RED Sustainability Consultants & Adjunct Senior Research Fellow, University of the Sunshine Coast
• Mr Corey Peterson, Commercial Services & Facilities (Sustainability), University of Tasmania
• Dr Kim Jose, Menzies Institute for Medical Research, University of Tasmania
• Dr Fay Johnston, Menzies Institute for Medical Research, University of Tasmania
• Dr Jagannath Aryal, School of Geography and Spatial Sciences, University of Tasmania
• Associate Professor Leigh Blizzard, Menzies Institute for Medical Research, University of Tasmania
• Professor Andrew Palmer, Menzies Institute for Medical Research, University of Tasmania
Preferred report citation Lyth A, Sharman MJ, and Cleland V. (2018). Tasmanian Travel and Physical Activity Study 2017 - Summary Report, University of Tasmania, Hobart.

iii
Glossary and abbreviations
Glossary Active Transport The combined total of walking, running, cycling, skating,
skateboarding or other physically active (definition see below) travel modes. Includes travel to and from public transport.
Confidence level A measure of the reliability of a result.
Main mode The single transport mode used for the furthest distance in the journey.
Margin of error A measure of the accuracy of the results of a survey.
Modal share Also called mode split or mode share, modal share is the percentage of travellers or trips using a particular type of transport.
Multi-modal Multi-mode journeys involve more than one step/mode of transport in a journey from origin to final destination.
Physical activity Any bodily movement produced by skeletal muscles that requires energy expenditure
Moderate physical activity - this includes activities that take moderate physical effort and make you breathe somewhat harder than normal. While walking can be a form of moderate exercise we do not include walking in this category for this survey. Examples include - carrying light loads, cycling at a regular pace, doubles tennis, gentle swimming and pilates. Vigorous physical activity - this includes activities that make you breathe much harder than normal. Examples include - heavy lifting, digging, weight training, aerobics, fast bicycling, running and lap swimming.
Trip A trip is travel on one route, on one mode. When a transfer to another route or mode is made, a new trip has commenced.
Journey A journey is the act of travelling from one major origin (e.g. home) to an endpoint destination (e.g. work). A journey may be one trip but may also consist of one or more trips where transfers occur between routes or modes. Undertaking a journey of more than one trip is also referred to as trip chaining or trip linking where the journey involves multiple trip purposes (e.g. travelling from home to work and dropping off children at school or stopping at the shops on the way).

iv
Transfer A transfer occurs at the end of a single trip. It is a change of transport mode or route, to another service or route to continue a journey.
Abbreviations ABS Australian Bureau of Statistics
ES Eastern Shore
GHHT Greater Hobart Household Travel Survey
GHR Greater Hobart Region
GL Greater Launceston
G-SB Glenorchy to Sandy Bay corridor
KB Kingborough (Local Government Area)
L-B Latrobe to Burnie corridor
TAPAS Tasmanian Travel and Physical Activity Study
1
SNAPSHOT
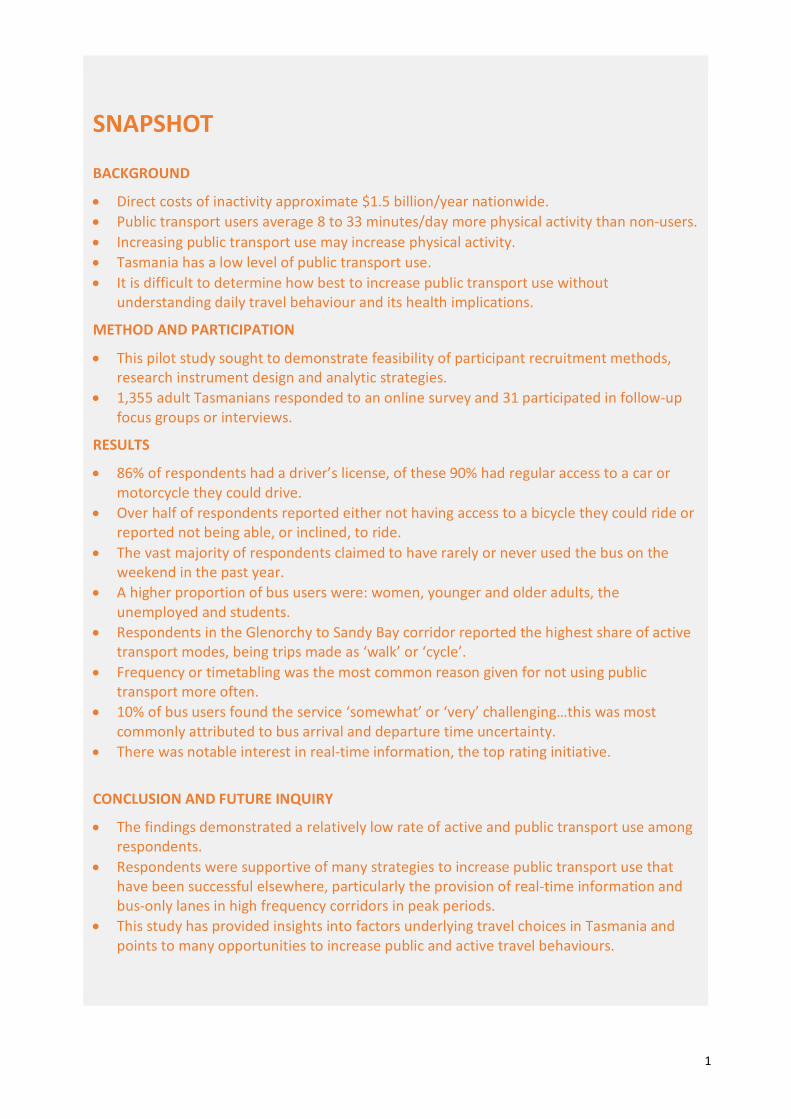
BACKGROUND
• Direct costs of inactivity approximate $1.5 billion/year nationwide. • Public transport users average 8 to 33 minutes/day more physical activity than non-users. • Increasing public transport use may increase physical activity. • Tasmania has a low level of public transport use. • It is difficult to determine how best to increase public transport use without
understanding daily travel behaviour and its health implications.
METHOD AND PARTICIPATION
• This pilot study sought to demonstrate feasibility of participant recruitment methods, research instrument design and analytic strategies.
• 1,355 adult Tasmanians responded to an online survey and 31 participated in follow-up focus groups or interviews.
RESULTS
• 86% of respondents had a driver’s license, of these 90% had regular access to a car or motorcycle they could drive.
• Over half of respondents reported either not having access to a bicycle they could ride or reported not being able, or inclined, to ride.
• The vast majority of respondents claimed to have rarely or never used the bus on the weekend in the past year.
• A higher proportion of bus users were: women, younger and older adults, the unemployed and students.
• Respondents in the Glenorchy to Sandy Bay corridor reported the highest share of active transport modes, being trips made as ‘walk’ or ‘cycle’.
• Frequency or timetabling was the most common reason given for not using public transport more often.
• 10% of bus users found the service ‘somewhat’ or ‘very’ challenging…this was most commonly attributed to bus arrival and departure time uncertainty.
• There was notable interest in real-time information, the top rating initiative.
CONCLUSION AND FUTURE INQUIRY
• The findings demonstrated a relatively low rate of active and public transport use among respondents.
• Respondents were supportive of many strategies to increase public transport use that have been successful elsewhere, particularly the provision of real-time information and bus-only lanes in high frequency corridors in peak periods.
• This study has provided insights into factors underlying travel choices in Tasmania and points to many opportunities to increase public and active travel behaviours.

1
BACKGROUND Physical inactivity substantially increases the risk of cardiovascular disease,
stroke, type 2 diabetes, hypertension, colon cancer and breast cancer – six of
the top 10 leading causes of death in high-income countries1. Direct costs of
inactivity approximate $1.5 billion/year in Australia alone2. However, around
half of Australian adults are not active at recommended levels3. Targeting
‘incidental’ physical activity – that is, activity accumulated as part of daily life –
is a promising public health approach for shifting the population prevalence of
physical activity in a more favourable direction.
Increasing public transport use may be one such avenue for increasing physical
activity. The structure and design of the built environment and the transport
options available can either deter or encourage individuals to be more active4.
A systematic review of international studies concluded that public transport
users average 8 to 33 minutes/day more physical activity than non-users and
are 3.5 times more likely to be classified as sufficiently active compared to car
drivers5. However, there is little evidence of effective strategies for increasing
public transport use for public health benefit.
In Tasmania (with a population approaching 520,000 people6), more than half
of residents live outside the capital city, many in dispersed but significantly
sized regional centres. The predominant mode of public transport is bus, with
most services provided by Metro Tasmania. Australian Bureau of Statistics
(ABS) 2011 Population Census data suggest that only around 3% of Tasmanians
use public transport regularly for the journey to work specifically7, while The
Greater Hobart Household Travel Survey 2008-09 (GHHTS) reported that 4% of
trips for all purposes in the Greater Hobart Region were by public transport8.
Both the ABS and GHHTS data sets point to a very low public transport user
base in Tasmania, irrespective of the purpose. Further, both sets of data refer
to the main (or primary) mode9 of transport used for a trip, which tends to
mask the complicated nature of much travel and that many journeys involve
more than one mode or trip step. Reporting the primary mode under-reports
the amount of walking undertaken within a trip, including walking to and from
bus stops or parked cars.
Direct costs of inactivity
approximate $1.5
billion/year...
Public transport users average 8 to 33
minutes/day more physical
activity than non-users...
Increasing public
transport use may increase
physical activity…
Tasmania has a low level of
public transport use…

2
It is this complexity and the implications of people’s daily travel practices for
physical activity and wellbeing that this study focused on. Without the
understanding of these complexities and the factors associated with them,
there is little evidence for transport and health providers and policy-makers, to
base decisions about where and how best to direct their efforts to increase
public transport use. This pilot study therefore aimed to build greater
understanding of:
• Tasmanians’ travel patterns, transport modes and journey types;
• the relationship between travel behaviours, physical activity and health;
• attitudes towards, preferences and perceptions of public transport use;
• the spatiality of travel patterns, behaviour and travel modes; and
• the perceived acceptability and potential impact of strategies to increase public transport use.
It is difficult to determine how
best to increase public
transport use without
understanding daily travel
behaviour and its health
implications…

3
METHOD AND PARTICIPATION
Study Design The Tasmanian Travel and Physical Activity Study (TAPAS) was a pilot study
seeking to demonstrate feasibility of participant recruitment methods,
research instrument design and analytic strategies. It consisted of an online
survey and nested qualitative focus groups and in-depth interviews. The online
survey was completed by respondents during the period March-April 2017 and
follow-up focus groups and interviews were held in June-August 2017. The
focus groups and interviews were conducted to gain a deeper understanding
of the survey findings.
Recruitment To recruit survey participants, convenience methods were used including:
• social media (Facebook and Twitter);
• traditional media (local newspaper);
• promotion through a concurrent online travel behaviour survey for University of Tasmania staff and students;10
• promotion through key professional networks and organisations; and
• distribution of promotional flyers on buses, in the Hobart Metro Tasmania shop and on the windscreens of cars in Park and Ride locations.
To recruit for the focus groups and interviews, survey respondents were
invited to express interest at the completion of their online survey. Those
indicating interest were purposively recruited, ensuring diversity regarding
age, gender, education level and public transport use. Focus groups and
interviews were clustered around regions of interest, either due to
new/altered bus services, low patronage or high growth (further detail below).
The online survey was conducted using the Survey Monkey11 online tool.
Respondents needed to provide consent, be 18 years or over and reside in
Tasmania to participate. Participants reported:
• their travel behaviour for the previous week, particularly the trips they made each day (trip purpose, transport mode and trip length in time);
This pilot study sought to
demonstrate feasibility of
participant recruitment
methods, research
instrument design and
analytic strategies…

4
• their frequency in use of public transport over the previous year and their opinions about the challenges and quality of public transport services (including frequency, reliability, access, information and ticketing) used;
• their rating of strategies that would be most likely to encourage them to use public transport;
• their past week physical activity (days per week and minutes per week of walking, moderate physical activity and vigorous physical activity)5;
• their general health; and
• sociodemographic information (employment status, household type, age, gender, postcode and suburb of residence and employment).
Survey question topics and response options are outlined more fully in
Appendix A.
Participation and statistical confidence Survey participation is outlined in Table 1. The data provide useful indicators of
spatial and sociodemographic difference. While the findings may not be
generalisable to the broader Tasmanian community because of the pilot
nature of the project and recruitment method used, we have a high level of
confidence in the data relating to particular areas within Tasmania.
The participation response was extremely positive, particularly for the Greater
Hobart Region (GHR) 12, with the majority (84%) of survey respondents residing
in the GHR. The GHR sample size provides a 90% confidence level and margin
of error +/- 2.7 percentage points for the region13. Consequently, much of our
reporting from the survey is focused on the GHR and areas within this region.

5
Table 1: Survey participation and completion
Survey sample area Total survey responses (survey hits)
includes partial completions
Total survey completions
Completion rate
Tasmania (TAS) 1355 1091 80.5%
Greater Hobart Region (GHR) 1127 923 81.9%
Other corridors/areas of interest
Glenorchy to Sandy Bay corridor (G-SB) 611 513 83.9%
Kingborough (KB) 215 183 85.1%
Eastern Shore (ES) 154 117 76.0%
Latrobe-Burnie (L-B) 70 59 84.3%
Greater Launceston (GL) 62 48 77.4%
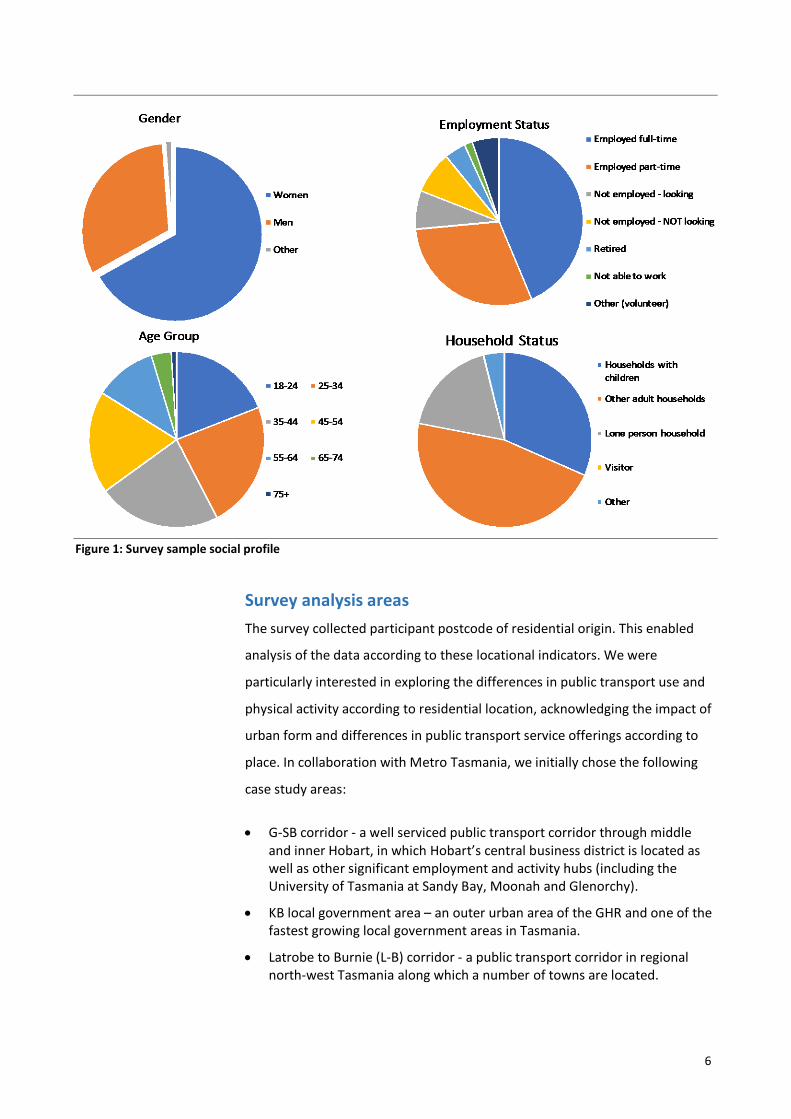
Survey participants came from a cross section of Tasmania in terms of gender,
age group, employment status and household status. The survey participants’
social profile is tabled in Appendix B, with some select variables presented in
Figure 1.
Three focus groups were conducted in Hobart involving 26 survey participants
residing in the GHR and telephone interviews were completed with five survey
participants who resided in the north-west of Tasmania. The focus groups were
stratified according to residence within three areas of the Hobart municipality -
Kingborough (KB), Glenorchy to Sandy Bay (G-SB) and the Eastern Shore (ES).
1,355 adult Tasmanians responded to an online survey and 31 participated in follow-up focus groups or interviews…
6
Figure 1: Survey sample social profile
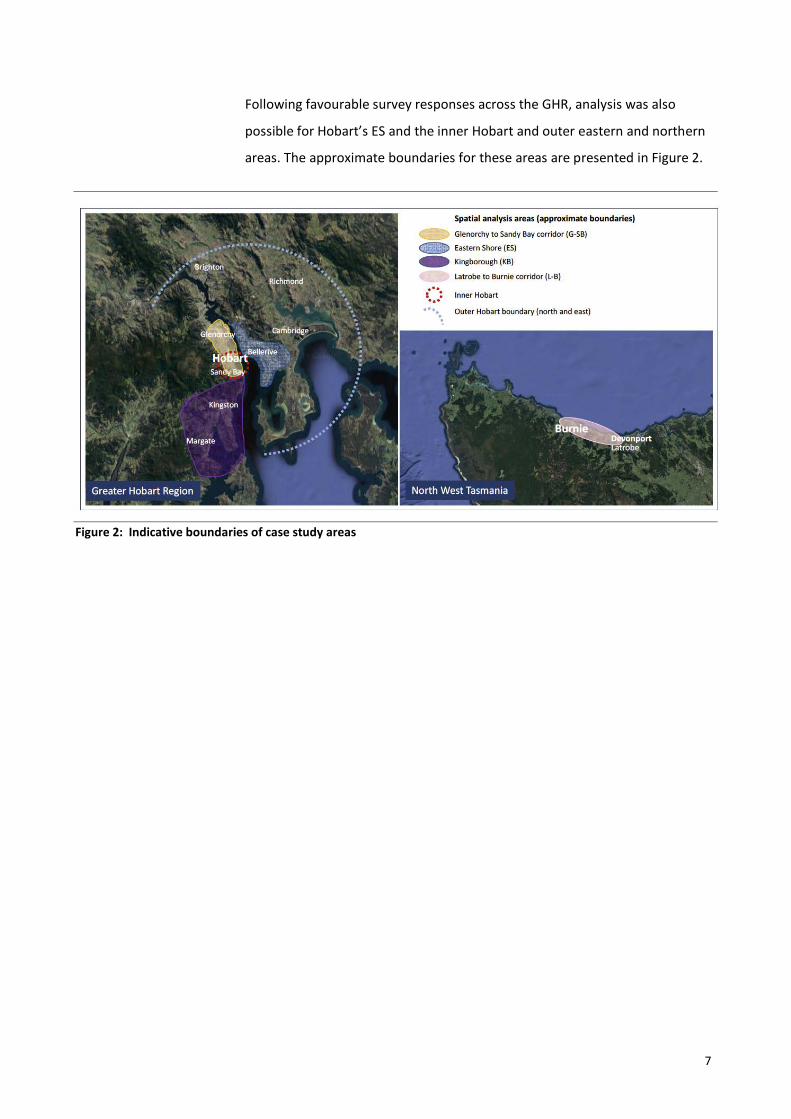
Survey analysis areas The survey collected participant postcode of residential origin. This enabled
analysis of the data according to these locational indicators. We were
particularly interested in exploring the differences in public transport use and
physical activity according to residential location, acknowledging the impact of
urban form and differences in public transport service offerings according to
place. In collaboration with Metro Tasmania, we initially chose the following
case study areas:
• G-SB corridor - a well serviced public transport corridor through middle and inner Hobart, in which Hobart’s central business district is located as well as other significant employment and activity hubs (including the University of Tasmania at Sandy Bay, Moonah and Glenorchy).
• KB local government area – an outer urban area of the GHR and one of the fastest growing local government areas in Tasmania.
• Latrobe to Burnie (L-B) corridor - a public transport corridor in regional north-west Tasmania along which a number of towns are located.
7
Following favourable survey responses across the GHR, analysis was also
possible for Hobart’s ES and the inner Hobart and outer eastern and northern
areas. The approximate boundaries for these areas are presented in Figure 2.
Figure 2: Indicative boundaries of case study areas

8
RESULTS Presented here is a summary of results from the online survey with a specific
focus on travel behaviour, public transport use and its relationship to physical
activity. Also provided are quotes from the focus groups and interviews where
appropriate to give readers greater insights into the survey findings.
Measures of accessibility – car, bike, bus The survey asked about measures of accessibility to motor vehicles, bicycles
and bus services. Some 86% of respondents had a driver’s license, of these
90% had regular access to a car or motorcycle they could drive (Figure 3).
These measures confirm the very high level of accessibility to motor vehicle
travel options.
The survey also enquired as to the relative accessibility of respondents to a
bicycle they can ride, to gauge the potential for cycling, as an active transport
mode. Of all respondents, a little over half reported either not having access to
a bicycle they can ride or reported not being able, or inclined, to ride (Figure
3).
Figure 3: Access to motor vehicles and bicycles (all respondents)
86% of respondents
had a driver’s license, of
these 90% had regular access
to a car or motorcycle…
Over half of respondents reported not
having access to a bicycle or
not being able, or inclined, to
ride…
9
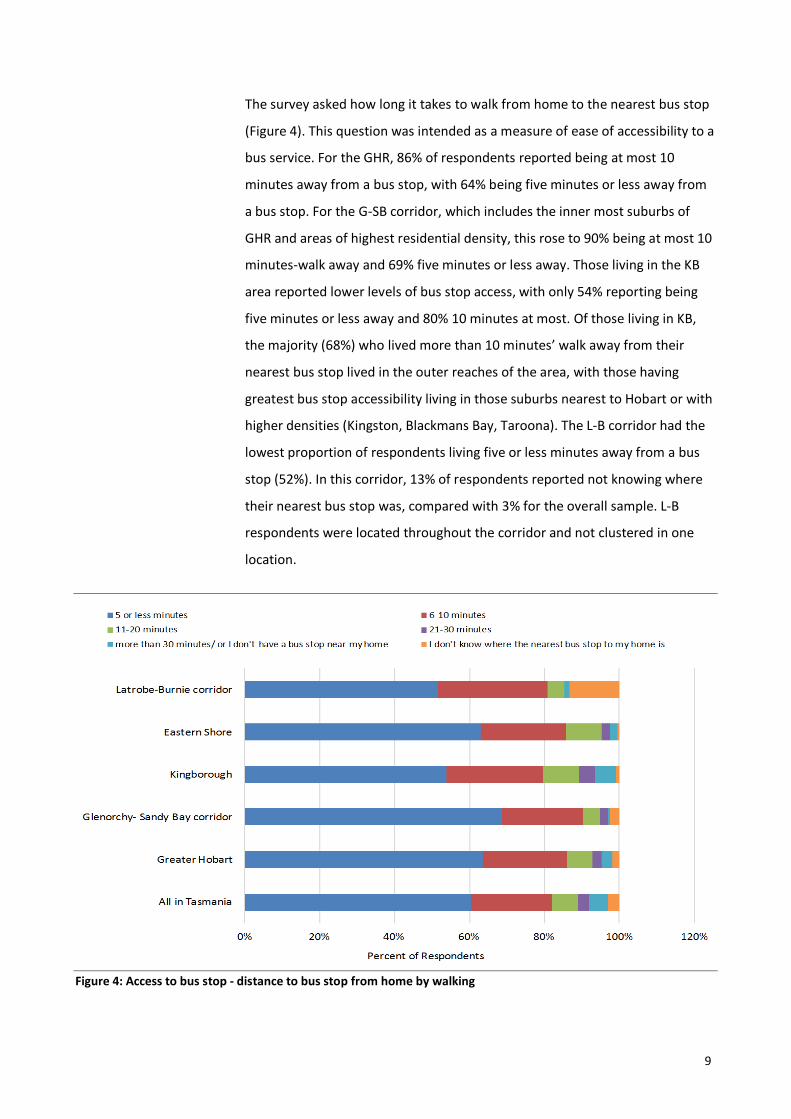
The survey asked how long it takes to walk from home to the nearest bus stop
(Figure 4). This question was intended as a measure of ease of accessibility to a
bus service. For the GHR, 86% of respondents reported being at most 10
minutes away from a bus stop, with 64% being five minutes or less away from
a bus stop. For the G-SB corridor, which includes the inner most suburbs of
GHR and areas of highest residential density, this rose to 90% being at most 10
minutes-walk away and 69% five minutes or less away. Those living in the KB
area reported lower levels of bus stop access, with only 54% reporting being
five minutes or less away and 80% 10 minutes at most. Of those living in KB,
the majority (68%) who lived more than 10 minutes’ walk away from their
nearest bus stop lived in the outer reaches of the area, with those having
greatest bus stop accessibility living in those suburbs nearest to Hobart or with
higher densities (Kingston, Blackmans Bay, Taroona). The L-B corridor had the
lowest proportion of respondents living five or less minutes away from a bus
stop (52%). In this corridor, 13% of respondents reported not knowing where
their nearest bus stop was, compared with 3% for the overall sample. L-B
respondents were located throughout the corridor and not clustered in one
location.
Figure 4: Access to bus stop - distance to bus stop from home by walking

10
Bus use Respondents were asked about their frequency of bus use on weekdays
(Monday-Friday) and the weekend (Saturday and Sunday) over the past year.
Additionally, respondents were asked to report their actual travel for the
previous seven days, including a detailed breakdown of modes of transport
used for their trips and trip steps. From these diary recordings specific trip
characteristics could be determined, with particular interest in bus use and the
walking associated with it.
Figures 5 and 6 break down bus use frequency by weekdays and weekends and
place. They show some variation within the GHR, with the area of least
frequent (rarely/never) bus use being reported by KB respondents (almost
60%) and the area of highest frequency (every/most weekdays) bus use
reported by ES respondents (32%). This compares with 23% for the GHR and
22% for the overall sample. In the L-B corridor, the vast majority (78%) of
respondents claimed to rarely or never use the bus on weekdays, while 13%
claimed to have used the bus frequently.
Figure 5: Frequency of bus use – weekdays (past year)

11
Figure 6: Frequency of bus use – weekends (past year)
For weekends, the vast majority of respondents claimed to have rarely or
never used the bus in the past year. The pattern was consistent across the
overall sample and according to the places of interest within the study. In the
L-B corridor, weekday and weekend frequency of bus use was similar. Analysis
of bus trip purpose (Figure 7) (based on respondent’s travel patterns for the
previous seven days) showed that respondents in the L-B corridor reported
less commuting by bus compared with the overall sample and the GHR (33%
for the overall sample, 32% for the GHR and just 14% for L-B). This much lower
use of the bus for commuting thereby accounts for a good part of the low
weekday bus use in L-B.
The reasons for using the bus were similar spatially within the GHR sample, but
not within the L-B corridor. The bus was used to get to or from work for 32% of
reported trips in the GHR. It was marginally higher in KB and lower in the G-SB
corridor. The latter has a high proportion of student residents and key higher
education campuses located within it (e.g. the University of Tasmania and
TAFE), likely explaining the second highest bus use purpose being ‘for
study/education’14.
The vast majority of
respondents claimed to
have rarely or never used a
bus on the weekend in the
past year…

12
Figure 7: Bus use by trip purpose (based on trip diary entries for the previous seven days)
Table 2 presents the proportion of bus users by selected socio-demographic
variables. A higher proportion of bus users were: women, younger and older
adults, the unemployed and students. Of these groups, those aged 18-24 and
the unemployed displayed the highest proportions of public transport use.
Those groups who used the bus the least were most commonly employed
and/or living in households with children under 18, consistent with evidence
that suggests that households with children tend to create more complicated
household travel demands that promote car use15.
A higher proportion of
bus users were: women,
younger and older adults, the
unemployed and students…

13
Table 2: Bus user and non-bus user by socio-demographic variables
Socio-demographic variables Bus users Non-bus users
All 41% 59%
Gender, %)
Woman 42% 58%
Man 38% 62%
Age, %
18-24 57% 43%
25-54 36% 64%
Age 65+ 45% 55%
Employment status,%
Employed full-time 32% 68%
Not employed (looking for work) 68% 32%
Student (Full-time) 53% 47%
Household type, %
Couple or lone parent with children 36% 64%
Note: Non-bus users were identified as those who specified ‘rarely or never’ used bus on weekdays in the past year, while ‘bus users’ were identified as those who stated they used a bus either every day, most days or sometimes on weekdays.
Trip mode and length The survey asked respondents to record the trips they made each day for the
seven days prior. This included recording the purpose of the trip, the mode of
transport used for each trip and the length of the trip in time. Based on one
weekday in the week (Monday)16, the mean number of trips made by
individuals in the GHR sample was 3.8 trips per day. This included all trips
within a longer journey, including walking to and from bus stops or car parks
and dropping off or picking up household members or others as part of a chain
of trips. A journey and the trip components are defined in the glossary and
depicted in Figure 8.

14
Figure 8: Example of trip components (trip chain) made within a longer journey between two main origins and destinations
As an indicator of difference between bus users and non-bus users in the GHR,
the mean number of trips per day for non-bus users was 3.7 and for bus users
was 4.0. The higher number of trips per day for bus users reflected the higher
proportion of multi-modal and multi-route journeys from main origin to final
destination made by bus users. Examples of multi-modal journeys include:
• walking either side of a bus trip;
• being dropped off or picked up at a bus stop;
• driving then parking and riding the bus; or
• transferring from one bus route service to another bus route service.
Figure 9 displays the transport mode reported for all trips including very short
trips (5 minutes or less). The overall and GHR samples are compared with
select case study corridors and areas.

15
Figure 9: Transport mode of all trips reported (all trip lengths including walk trips of 5 minutes or less)
Figure 10: Walk trip length

16
Respondents in the G-SB corridor reported the highest share of active modes,
being trips made as ‘walk’ or ‘cycle’ (35% and 11% respectively). The walk trips
included those to and from other modes of transport, such as the bus, as well
as walking as the single mode. The proportion of the latter (walking as the
single mode) was highest for the G-SB corridor than for other GHR areas. The
median walk trip length category for G-SB walk trips was 11-15 minutes
compared with 6-10 minutes for all other GHR walk trips. Some 55% of G-SB
walk trips were more than 10 minutes and 26% were more than 20 minutes.
This compared with 34% and 12% respectively for all other GHR participants
(Figure 10).
Some 90% of all walk and cycle trips across the GHR sample were 30 minutes
or less. Within developed countries, a 30 minute time budget tends to be the
upper limit for those walking to urban services, particularly jobs, while 10
minutes is the accepted time people will take to get to public transport or to a
local amenity17. The G-SB corridor forms the highest density transport corridor
in Tasmania and contains major activity and employment centres, such as the
Hobart CBD, the University of Tasmania and other inner-middle urban
commercial hubs. These urban activities and urban form heighten the
opportunity of G-SB residents to undertake shorter trips conducive to active
modes such as walking and cycling compared with the rest of the GHR.
Figure 11: Cycle trip length
Respondents in the G-SB corridor
reported the highest share
of active transport
modes - being trips made as
‘walk’ or ‘cycle’…

17
In the KB and ES areas the proportion walking was at least ten percentage
points down on the G-SB corridor (22% for KB and 25% for ES), while in L-B,
walking trips were almost three times lower than the G-SB corridor (12%).
Cycling as a mode of transport was highest in the G-SB corridor at 11% of all
trips. This compares with lower rates of cycling in other GHR areas such as the
ES and KB where cycling trips made up 3% and 4% of all trips respectively. The
cycling share for these two areas was even lower than L-B. Of the cycle trips
recorded, the median cycle trip length category for G-SB was 11-15 minutes
compared with 26-30 minutes for all other GHR cycle trips (Figure 11). This
indicates that G-SB residents in this study cycled more regularly for shorter
trips than respondents residing in other parts of the GHR.
Regarding all car modes (passenger, multi-occupant driver, sole driver), car use
was highest in L-B (73%). Within the GHR, KB had the highest share of car
modes (62%) and G-SB the lowest (41%). This difference suggests a much
lower rate of physical activity associated with day-to-day travel among
respondents in the KB area. Similar patterns in other outer urban areas of the
GHR (specifically the northern and eastern fringes of the GHR) were also
identified.
Health and physical activity indicators Survey participants reported on their general health using a five point Likert
scale of ‘excellent’ through to ‘poor’ health (Figure 12). Overall, there was
limited difference across the GHR spatially, but in the L-B corridor notably
fewer respondents reported having ‘excellent’ or ‘very good’ health compared
with the overall and GHR samples (42% in L-B compared with 59% and 60% for
the overall sample and GHR respectively). At the other end of the spectrum, a
higher proportion of L-B respondents reported ‘fair’ or ‘poor’ health.

18
Figure 12: Self-reported general health
Within the GHR there was little difference in self-reported health across the
case study areas, however a higher proportion of KB participants reported
excellent/very good health and fair/poor health than the GHR overall. For
inner Hobart and outer Hobart suburbs, there was a noticeably higher
proportion of respondents in inner Hobart suburbs reporting the highest
health ratings, while the opposite was true for outer Hobart suburbs. These
observations are consistent with international studies of commute distance
and health and likely reflect sociodemographic patterning of health and
physical activity behaviour18.
Similar spatial patterns were apparent for weekly physical activity (walking,
moderate and vigorous). Self-reported frequency and duration of physical
activity were multiplied to generate an estimate of weekly minutes of physical
activity. L-B respondents reported the least amount of physical activity per day
compared with the overall sample and the other case study areas. This group
also reported half the median minutes of physical activity per week than inner
Hobart locations (160 minutes/week compared with 318 minutes/week). For

19
the GHR, respondents in the ES and inner Hobart suburbs reported the highest
levels of physical activity while respondents in the KB and other north and east
outer Hobart suburbs reported the least amount of physical activity.
Bus use and walking The survey asked respondents who took the bus in the previous seven days
whether they had chosen to walk further to a bus stop at any time. This
question was asked to ascertain the proportion of people consciously choosing
to incorporate physical activity into their journeys involving public transport.
As presented in Table 3, compared with those who did not choose to walk
further than needed to a bus stop, the group who chose to walk further:
• were more commonly men;
• were more commonly living in a lone person household;
• recorded higher mean and median minutes walked per week; and
• were more likely to report the highest health rating (excellent) and less likely to report good, fair, or poor general health.
Table 3: Respondents taking the bus who chose to walk further than needed to a bus stop by selected sociodemographic variables and median minutes walked per week
Variable Walk further to a bus stop?
Yes frequently (every time or most times)
Yes sometimes No (not at all)
All 16% 25% 59% Gender, % Women 12% 21% 67% Men 20% 21% 59% Household type, % Couple with children 13% 18% 69%
Couple without children 11.5% 18.5% 70%
Lone person household 21% 19% 60% Self-reported health, % Excellent 18% 21% 61% Very good 15% 21% 64% Good/Fair/Poor 11.5% 22% 66.5%
Weekly PA, Median (minutes) Weekly walking reported (median minutes for sample)
210 175- 150

20
Barriers to the use of public transport The survey asked participants ‘what stops them from using public transport
more often’ as an indicator of barriers to public transport use. Public transport
frequency or timetabling was the most frequntly identified reason (18% of all
responses), followed by the claim that public transport did not suit the
complicated nature of personal travel (12%). These same barriers also
commonly emerged in the focus groups and interviews. Preference for other
modes (either driving or catching a lift with a family member/friend or using
active modes) followed as third and fourth most common reasons (Figure 13).
Figure 13: What stops you from using public transport more often?
Note: Respondents were asked to choose up to three reasons from a list. The response options were provided in randomised order.
Frequency or timetabling was
the most common reason
for not using public transport
more often…

21
For participants who had used the bus in the previous seven days they were
asked how challenging they found the bus service to be and to qualify their
response if they had found it challenging. Of all the bus user respondents
(n=510), 10% stated that they found the bus service either ‘somewhat’ or
‘very’ challenging to use. The reasons for this response type are outlined in
Figure 14. The top two most common reasons revolved around bus arrival or
departure uncertainty, specifically claims that buses had not arrived when they
were scheduled or frustrations about not knowing whether the bus was
running early or late. Addressing this uncertainty was a strong theme in the
focus groups and interviews as one way of improving the attractiveness of bus
services, “…that’s my major reason for not using the buses anymore, is the
unreliability”.
Figure 14: For what reasons did you find the bus service challenging to use?
Note: Sample is for those who found the bus service at least somewhat challenging, n=57. Respondents were asked to choose up to three reasons from a list. The response options were provided in randomised order.
10% of bus users found the
service ‘somewhat’ or
‘very’ challenging… this was most
commonly attributed to
bus arrival and departure time
uncertainty…
22
Facilitating the use of public transport In order to establish the Tasmanian community’s perceived acceptability and
potential impact of strategies to increase public transport use, the survey
asked participants to rate the liklihood or not of using the bus more often
given 10 hypothetical initiatives. The initiatives identified were those
commonly implemented to improve public transport systems, or those that are
salient to public transport and public health in Tasmania. They are outlined
here within themed groups:
• Fare pricing intitatives
• Free travel outside peak times (before 7am, between 9am and 3pm and after 6.30pm);
• Free travel before 7am; and
• Half price travel outside of peak times (before 7am, between 9am and 3pm and after 6.30pm).
• Information initiatives
• Written or electronic information on how to make the most of bus services (brochures, better website information);
• Speaking to someone by telephone to help you plan your journey and answer any questions; and
• Provision by bus service providers of real-time information (electronic signs or smart phone apps that tell you when the next bus is due to arrive).
• Loyalty and incentive scheme initiatives
• A public transport loyalty scheme where reward points can be converted to Greencard credit; and
• An employer incentive scheme that rewards employees for bus travel to and from work (e.g. Greencard credit).
• Infrastructure and transport engineering initiatives
• 'Park and ride' or 'bike and ride' facilities (where a network of formal car parking and bicycle storage facilities connect to high frequency bus services in outer urban areas); and
• Bus only lanes along high frequency bus service corridors during morning and afternoon peak periods so buses can travel quicker than the traffic.
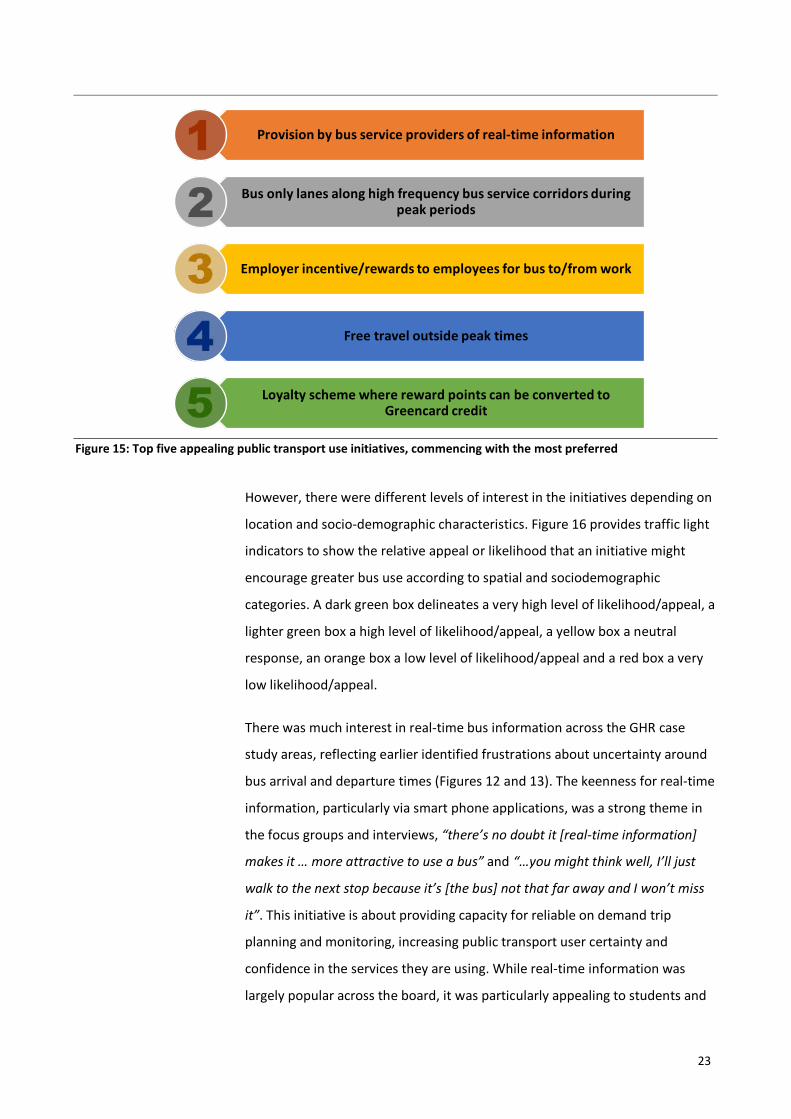
Respondents rated their likelihood of use on a Likert five point scale from
‘extremely likely’ through to ‘not at all likely’. There was notable interest in
real-time information, the top rating initiative (Figure 15). The second most
highly rated initiative were bus lanes (or high occupancy vehicle lanes) along
high frequency bus service corridors during peak periods.
There was
notable interest in real-
time information,
the top rating initiative…
23
Figure 15: Top five appealing public transport use initiatives, commencing with the most preferred
However, there were different levels of interest in the initiatives depending on
location and socio-demographic characteristics. Figure 16 provides traffic light
indicators to show the relative appeal or likelihood that an initiative might
encourage greater bus use according to spatial and sociodemographic
categories. A dark green box delineates a very high level of likelihood/appeal, a
lighter green box a high level of likelihood/appeal, a yellow box a neutral
response, an orange box a low level of likelihood/appeal and a red box a very
low likelihood/appeal.
There was much interest in real-time bus information across the GHR case
study areas, reflecting earlier identified frustrations about uncertainty around
bus arrival and departure times (Figures 12 and 13). The keenness for real-time
information, particularly via smart phone applications, was a strong theme in
the focus groups and interviews, “there’s no doubt it [real-time information]
makes it … more attractive to use a bus” and “…you might think well, I’ll just
walk to the next stop because it’s [the bus] not that far away and I won’t miss
it”. This initiative is about providing capacity for reliable on demand trip
planning and monitoring, increasing public transport user certainty and
confidence in the services they are using. While real-time information was
largely popular across the board, it was particularly appealing to students and
Provision by bus service providers of real-time information
Bus only lanes along high frequency bus service corridors during peak periods
Employer incentive/rewards to employees for bus to/from work
Free travel outside peak times
Loyalty scheme where reward points can be converted to Greencard credit

24
those living in inner Hobart and the G-SB corridor and ES. Likewise, the
provision of dedicated bus lanes was of interest among respondents across the
GHR, in inner and outer urban areas alike. One participant in the ES focus
group said that if she saw the bus lane working as intended she would think
“…I wish I could be in that bus, why am I driving?”. This initiative also had the
most appeal to households with children at home, who were otherwise
disinterested in other initiatives. Potentially, it is reducing journey time that is
the reason for the interest in bus lanes.
There was a broad level of appeal for loyalty or reward schemes, including
employer-led incentive programs, as well as free travel outside of peak
periods, the former being most appealing across the GHR. Free or half price
travel outside of peak periods was of most appeal to those living in G-SB and
inner Hobart where frequency of bus services outside of peak periods is likely
highest, although there was interest by ES and some outer Hobart
respondents. Students showed particular keenness for free travel and reward
schemes, reflecting both their tendency for highest public transport usage than
other population groups in this survey.
In the L-B corridor none of the options aforementioned appealed strongly.
Interview participants residing in north-west Tasmania said that lack of
congestion, good motor vehicle related infrastructure and readily accessible
parking were reasons for the lack of attractiveness of the hypothetical
strategies to increase public transport use. This is not surprising given the
regional/rural nature of this area.
Although it does not appear in the top five Tasmanian initiatives overall, ‘park
and ride’ (the bus) or facilities that enable ‘cycle and ride’ did have some
appeal among those living in middle and outer areas of the GHR, especially
those living in KB, the ES and outer eastern and northern fringes of the GHR.
Packaged with dedicated bus lanes in high frequency bus corridors, rather than
a stand-alone initiative, this strategy may have even more potential for those
parts of the region. Participants in the focus groups highlighted that parking
restrictions in suburban streets (e.g. 2 hours) can prevent opportunities for
combining public or active transport options with car use.

25
Figure 16: Matrix showing relative appeal of options to encourage public transport use

26
CONCLUSIONS AND FUTURE INQUIRY This study has achieved its aims of: documenting travel patterns, transport
modes and journey types within Tasmania; exploring the relationship between
travel behaviours, physical activity and health; enhancing understanding of
attitudes towards, preferences for and perceptions of public transport use;
developing our understanding of the spatiality of travel patterns, behaviour
and travel modes; and establishing the perceived acceptability and potential
impact of strategies to increase public transport use
Consistent with previous work, the findings of this pilot study demonstrated a
relatively low rate of active and public transport use among respondents,
highlighting significant opportunities for improvement. Key challenges to
public transport use include the complexity of travel behaviours and
infrequent or unreliable services. Despite many participants living in close
proximity to bus stops, many of those who were public transport users chose
not to incorporate more physical activity into their daily life by walking to/from
bus stops further away. This finding represents an important public health
opportunity to increase physical activity.
Respondents were supportive of many strategies to increase public transport
use, particularly the provision of real-time information and bus-only lanes in
high frequency corridors in peak periods. By having ready access to real-time
information about bus services (for example on smart phones) public transport
consumers heighten their confidence in the bus service system which in turn
informs personal travel choices and enhances travel efficiency. Reward and
incentive-based schemes were also popular. These strategies were consistent
with the most common barriers to bus use documented in this study – namely
public transport frequency and timetabling issues. Further work is needed to
understand the impact of these types of strategies both on public transport
use and physical activity behaviour.
Limitations of this study include its non-probability sampling design, meaning
the generalisability of findings may be limited, although the large sample
included heterogeneity in terms of travel behaviours, sociodemographic
characteristics and physical activity behaviour. Self-reported data are subject
The findings demonstrated
a relatively low rate of active
and public transport use
among respondents…
Respondents were
supportive of a number of
strategies to increase public
transport use that have been
successful elsewhere,
particularly the provision of
real-time information
and bus-only lanes in high
frequency corridors in
peak periods…

27
to reporting and recall biases and further work in this area should use
validated, objective measures where possible. Further, only the likely impact of
hypothetical strategies to increase public transport use was assessed; the
actual impact of these strategies should be subject to rigorous empirical
testing.
Despite these limitations, this is the first study in Tasmania to comprehensively
document the complexity of travel behaviours in the broader community
across the State and to focus on the public health implications of public and
active forms of travel. It provides insights into factors underlying travel choices
in Tasmania and points to many opportunities to increase public and active
travel behaviours. Doing so is likely to have important health, social, economic
and environmental implications for all Tasmanians. There is now substantial
opportunity for further analysis of the dataset, including cross tabulation
against sociodemographic variables and other research inquiry not reported
here.
This study has provided
insights into factors
underlying travel choices
in Tasmania and points to
many opportunities
to increase public and
active travel...

28
Endnotes (references and notes)
1 Medibank Private. The cost of physical inactivity: Medibank Private; 2007.
2 Australian Department of Health. Australia's Physical Activity and Sedentary Behaviour Guidelines for Adults (18-64 years). Canberra: Australian Government Department of Health; 2014.
3 Australian Bureau of Statistics. Australian Health Survey: Physical Activity, 2011-12. Canberra: ABS; 2013.
4 Heart Foundation, 2010. Healthy by Design: a guide to planning and designing environments for active living in Tasmania, Hobart. https://www.heartfoundation.org.au/images/uploads/main/Programs/Tasmania-healthy-by-design.pdf
5 Rissel C, Curac N, Greenaway M, Bauman A. Physical activity associated with public transport use--a review and modelling of potential benefits. Int J Environ Res Public Health. Jul 2012;9(7):2454-2478.
6 ABS 2016 Census: Tasmania http://abs.gov.au/ausstats/[email protected]/mediareleasesbyReleaseDate/7F1A862B6F8B6BA0CA258148000A41AC?OpenDocument (accessed 21_12_17)
7 ABS 2011 Population Census; and Tasmanian Department of Infrastructure, Energy and Resources, n.d. Journey to Work Data Analysis: An analysis of 2011 ABS Census Data relating to journey to work pattern, Hobart. https://www.stategrowth.tas.gov.au/policies_and_strategies/journey (accessed 21_12_17).
8 Tasmanian Department of Infrastructure, Energy and Resources, 2010. The Greater Hobart Travel Survey: Summary of analysis and key findings, Hobart. http://www.transport.tas.gov.au/road/plans_strategies/greater_hobart_household_travel_survey (last accessed 21_012_17).
9 The main mode is generally defined as the single transport mode used for the furthest distance in the journey.
10 UTAS Travel Behaviour Survey 2017
http://www.utas.edu.au/infrastructure-services-development/sustainability/transport/utas-travel-surveys (accessed 20_09_17).
11 https://www.surveymonkey.com
12 The Greater Hobart Region (GHR) is taken to mean the Greater Capital City Statistical Area (GCCSA) defined by the Australian Bureau of Statistics. Respondents living within postcodes contained within this area were included in the GHR sample group.
13 A confidence level of 90 per cent means that there is a probability of at least 90 per cent that the result is reliable. The larger the margin of error around a value, the less accurate the value. The Greater Hobart confidence level was based on the estimated 2016 population over 18 years old (ABS). We used the Survey Monkey Sample Size calculator to calculate confidence and margins of error https://www.surveymonkey.com/mp/sample-size-calculator/.
14 For more detail on student travel behaviour associated with the University of Tasmania, refer to: Lyth, A., Peterson, C., & Singh, K. 2017. University of Tasmania 2017 Travel Behaviour Survey: Summary of Findings. University of Tasmania, Hobart. http://www.utas.edu.au/commercial-services-development/sustainability/transport/utas-travel-surveys (accessed 21_12_17).
15 Lyth-Gollner, Anna and Dowling, R., 2002, “Implications of Household Form, Gender & Parenting Cultures on Car Use & Urban Transport Policy: a Sydney Study”, 25th Australasian Transport Research Forum Incorporating the BTRE Transport Policy Colloquium, October 2-4, Canberra, ACT.
29
http://atrf.info/papers/2002/index.aspx (accessed 21_12_17).
16 For this preliminary analysis the trips per weekday was calculated using trip records for Monday only. Further analysis can be undertaken across all daily records to verify the weekday and weekend mean trips per day over a week.
17 Newman P., and Kenworthy, J., 2006. Urban Design to Reduce Automobile Dependence. Opolis 2(1) 35-52. http://escholarship.org/uc/item/2b76f089 (accessed 21_12_17).
18 e.g., Hansson, E., Mattisson, K., Bjork, J., Ostergren, P., and Jakobsson, K., 2011. Relationship between commuting and health outcomes in a cross-sectional population survey in southern Sweden. BMC Public Health, 11:834. http://www.biomedcentral.com/1471-2458/11/834 (accessed 21_12_17).

30
Appendix A
Tasmanian Travel Behaviour & Physical Activity Survey – Question topics The survey was open to Tasmanian adults aged 18 years or over. Residential location 1. Tasmanian postcode and suburb of residence Private transport access 2. Current driver’s license 3. Access to a car or motorcycle that they can drive or ride 4. Access to a bicycle that they can ride Public transport access/use 5. Length of time to walk from home to the nearest bus stop 6. Frequency of public transport (buses) use in Tasmania on weekdays (Monday to Friday) in the past year 7. Frequency of public transport (buses) use in Tasmania on weekends (Saturday or Sunday) in the past
year 8. Barriers to public transport use (up to three randomised reasons) 9. Frequency of bus use in the last 7 days 10. Choosing to walk further than needed to a bus stop to catch a bus anytime in the last 7 days 11. Purpose of bus travel in the last 7 days 12. Ease of the bus service used in the last 7 days 13. Up to three reasons for finding the bus service challenging (for those participants who stated some
level of challenge using bus services in the last 7 days, randomised list of reasons provided) 14. Bus company used (if travelled by bus in the past year)
Travel diaries - last 7 days 15. Travel activity over the previous 7 days, including trip purpose, trip mode, trip length? Public transport information and ticketing 16. Metro Greencard ownership 17. Use of public transport website or app (such as the Metro Tasmania App) 18. Purpose of use of public transport trip or accessibility website or app for 19. Frequency of use of public transport website or app Rating of bus use incentives 20. Likelihood that the following strategies would encourage more frequent public transport use (options
for rating against five point Likert scale ‘extremely likely, likely not sure/maybe, not likely, not at all likely’) • Free travel outside peak times (before 7am, between 9am and 3pm and after 6.30pm) • Free travel before 7am • Half price travel outside of peak times (before 7am, between 9am and 3pm and after 6.30pm) • A loyalty scheme where reward points can be converted to Greencard credit (10 points for every trip
so 100 points = $5 Greencard credit) • Employer's provide incentives/rewards to employees for bus travel to and from work (e.g. Greencard
credit) • Park and ride' or 'bike and ride' facilities (where formal car parking and bicycle storage facilities
connect to high frequency bus services in outer areas)

31
• Written or electronic information on how to make the most of bus services (brochures, better website information)
• Speaking to someone by telephone to help you plan your journey and answer any questions • Provision by bus service providers of real-time information (electronic signs or smart phone apps that
tell you when the next bus is due to arrive) • Bus only lanes along high frequency bus service corridors during peak periods so buses can travel
quicker than the traffic (e.g. 7am to 9am and 3pm to 6.30pm)
Physical activity 21. Injury, illness or disability restricting physical activity 22. Typicality of past week physical activity 23. Frequency of walking 10 minutes or more in the last 7 days (number of days) 24. Duration of time spent walking (10 minutes or more) 25. Frequency of moderate physical activity 10 minutes or more in the last 7 days (number of days) 26. Duration of time spent doing moderate physical activity (10 minutes or more) 27. Frequency of vigorous physical activity 10 minutes or more in the last 7 days (number of days) 28. Duration of vigorous physical activity (10 minutes or more) Sociodemographic information 29. Age (18-24, 25-34, 35-44, 45-54, 55-64, 65-74, 75 or over) 30. Gender (woman, man, trans, prefer not to disclose, other) 31. Household composition 32. English language spoken at home 33. Student status (not student, full-time, part-time) 34. Employment status 35. Location (postcode) of workplace (workplace at which spent most time last week) 36. Highest level of education completed 37. General health 39. Participants were provided with the opportunity to provide any other information about their travel or
physical behaviour as an open comment

32
Appendix B
Survey respondent sociodemographic profile by geographical areas
TAPAS survey sample area
TAS GHR G-SB KB ES L-B GL
Gender
Men 31.9% 33.0% 33.7% 33.3% 29.1% 33.9% 27.3%
Women 66.9% 66.0% 65.7% 66.7% 67.5% 61.0% 72.7% All other (incl. Trans/prefer not to specify) 1.2% 1.0% 0.6% 0.0% 3.4% 5.1% 0.0%
Age
18-24 19.0% 19.4% 22.8% 12.6% 13.7% 33.9% 2.3%
25-34 23.3% 24.1% 25.5% 23.5% 24.8% 13.6% 27.3%
35-44 22.6% 22.9% 20.0% 24.6% 30.8% 13.6% 20.4%
45-54 18.9% 19.6% 18.9% 21.9% 16.2% 13.6% 20.4%
55-64 11.5% 9.9% 9.5% 12.0% 7.7% 18.6% 18.2%
65-74 3.7% 3.1% 2.5% 4.9% 3.4% 3.4% 11.4%
75+ 1.0% 1.0% 0.8% 0.5% 3.4% 3.4% 0.0%
Employment status (staff)
Full-time (35hrs+ per week) 43.7% 44.2% 40.1% 48.6% 53.9% 42.4% 31.8%
Part-time (20-34 hrs per week) 16.5% 16.6% 15.2% 17.5% 19.7% 6.8% 20.4%
Part-time (<20hrs per week) 13.4% 14.1% 15.2% 15.3% 8.5% 10.2% 9.1%
Not employed (looking for work) 7.4% 7.1% 8.6% 4.9% 3.4% 11.9% 13.6%
Not employed (not looking for work) 8.1% 8.5% 12.7% 4.4% 2.6% 11.9% 2.3%
Retired 4.1% 3.7% 3.5% 3.3% 6.9% 5.1% 13.6%
Not able to work 1.6% 1.3% 1.0% 0.5% 0.0% 3.4% 4.5%
Other (includes volunteers) 5.2% 4.5% 3.9% 5.5% 5.1% 8.5% 4.5%
Household Type Couple with children (u18) living at home 26.3% 27.0% 19.8% 38.2% 33.3% 15.2% 25.0% Couple without children (u18) living at home 25.1% 23.6% 26.1% 22.9% 20.5% 39.0% 27.3%
One parent family 5.3% 5.6% 4.7% 4.4% 8.5% 5.1% 2.3%
Other family 2.1% 2.2% 2.7% 0.6% 1.7% 1.7% 0.0%
Group (adults living tog.) 19.2% 19.4% 21.6% 16.4% 17.9% 20.3% 20.4%
Lone person 18.0% 18.2% 20.6% 15.9% 14.5% 16.9% 22.7%
Visitor 0.1% 0.1% 0.2% 0.0% 0.0% 0.0% 0.0%
Other 3.8% 3.9% 4.3% 1.6% 3.4% 1.7% 2.3%

33
Language usually spoken at home
English 97.6% 97.4% 96.1% 98.4% 99.1% 98.3% 97.7%
Other 2.4% 2.6% 3.9% 1.6% 0.9% 1.7% 2.3%
Student
Full-time student 23.6 % 25.0 % 32.9% 18.6% 12.0% 28.8% 11.4%
Part-time student 10.9% 10.9% 12.7% 13.1% 5.1% 16.9% 2.3%
Not enrolled as student 65.5% 64.1% 54.5% 68.3% 82.9% 54.2% 86.4%
Education attainment
Yr 10 or less 5.4% 4.7% 2.7% 2.2% 9.4% 5.1% 9.1%
Yr 12 17.0% 16.7% 19.5% 9.8% 14.5% 33.9% 6.8%
Trade/apprenticeship 1.9% 1.7% 1.4% 2.2% 0.8% 0.0% 9.1%
Certificate/diploma 23.0% 21.0% 14.2% 23.5% 30.8% 25.4% 34.1%
University Bachelor Degree 32.5% 33.9% 35.7% 39.3% 34.2% 25.4% 27.3%
Higher University Degree 20.1% 21.9% 26.5% 22.9% 10.3% 10.8% 13.6%
General health description
Excellent 20.0% 20.5% 21.4% 22.9% 17.1% 18.6% 15.9%
Very Good 38.3% 39.3% 39.4% 41.0% 41.0% 23.7% 38.6%
Good 30.5% 29.8% 29.4% 24.0% 33.3% 42.4% 29.5%
Fair 9.1% 8.2% 7.2% 10.9% 6.8% 15.3% 11.4%
Poor 2.0% 2.2% 2.5% 1.1% 1.7% 0.0% 4.5% Current injury, illness, disability restricting physical activity
Yes 13.2% 12.4% 12.6% 11.3% 7.4% 16.7% 20.4%
No 86.8% 87.6% 87.4% 88.7% 92.6% 83.3% 79.5%