![Blast Loading of Epoxy Panels Using a Shock Tubeing an alternative way to investigate material behavior subjected to blast loading [1]. The shock tube is a well understood instrument,](https://static.fdocuments.us/doc/165x107/5ed47b375b5aa30cb3151bb9/blast-loading-of-epoxy-panels-using-a-shock-tube-ing-an-alternative-way-to-investigate.jpg)
Task Force to investigate Distribution Transformer Loading ...
49
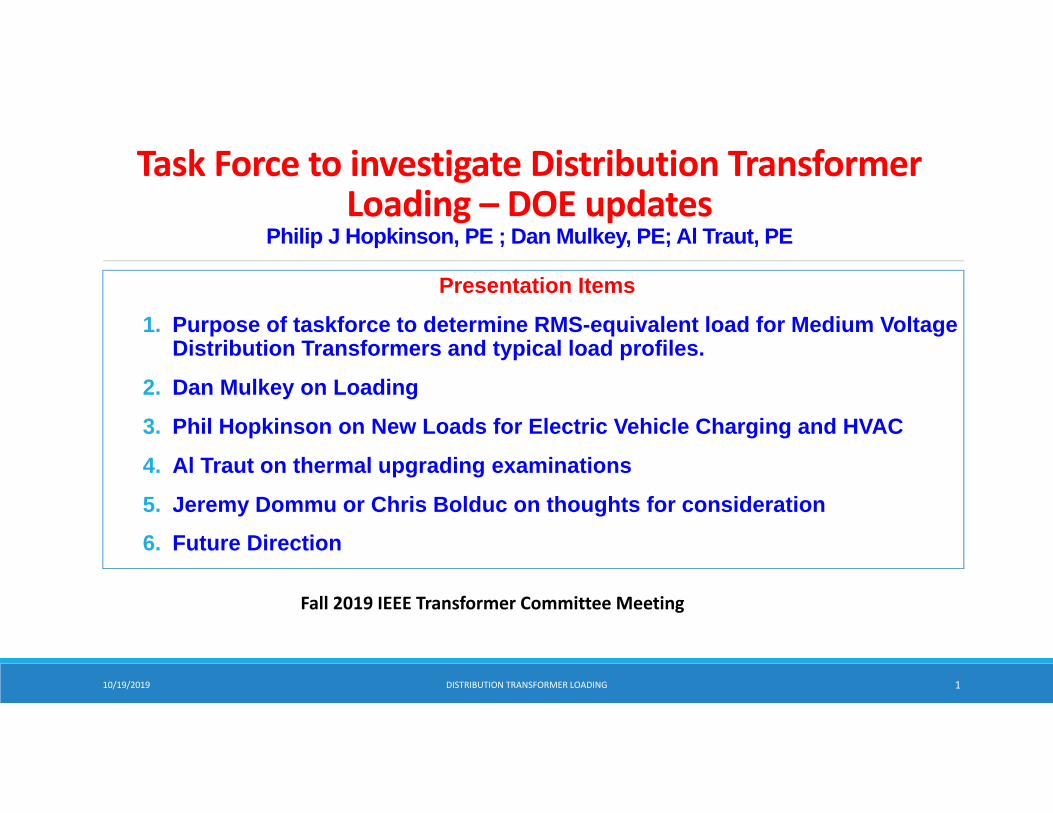
Task Force to investigate Distribution Transformer Loading – DOE updates Philip J Hopkinson, PE ; Dan Mulkey, PE; Al Traut, PE Presentation Items 1. Purpose of taskforce to determine RMS-equivalent load for Medium Voltage Distribution Transformers and typical load profiles. 2. Dan Mulkey on Loading 3. Phil Hopkinson on New Loads for Electric Vehicle Charging and HVAC 4. Al Traut on thermal upgrading examinations 5. Jeremy Dommu or Chris Bolduc on thoughts for consideration 6. Future Direction 10/19/2019 DISTRIBUTION TRANSFORMER LOADING 1 Fall 2019 IEEE Transformer Committee Meeting
Transcript of Task Force to investigate Distribution Transformer Loading ...
Task Force to investigate Distribution Transformer Loading – DOE updates
Philip J Hopkinson, PE ; Dan Mulkey, PE; Al Traut, PE
Presentation Items
1. Purpose of taskforce to determine RMS-equivalent load for Medium Voltage Distribution Transformers and typical load profiles.
2. Dan Mulkey on Loading
3. Phil Hopkinson on New Loads for Electric Vehicle Charging and HVAC
4. Al Traut on thermal upgrading examinations
5. Jeremy Dommu or Chris Bolduc on thoughts for consideration
6. Future Direction
10/19/2019 DISTRIBUTION TRANSFORMER LOADING 1
Fall 2019 IEEE Transformer Committee Meeting

Loading and Statistics Terms

10/19/2019 DISTRIBUTION TRANSFORMER LOADING 3
Transformer Loading TermsLoad Factor: (Average load / peak load) over a specified timeAnnual Load Factor: (Average yearly load / peak load for the year) Capacity Factor: ratio of actual electrical energy output over a given period of time to the maximum possible electrical energy output over that period. = Average Load / CapabilityUtilization Factor: ratio of the maximum demand to the capacity = Max Load / Capability
IEEE C57.120 Transformer Loss Evaluation:TLF: Transformer Loading Factor (root‐mean‐square of yearly load / nameplate) Energy cost varies by the load losses vary as the square of this factor.PRF: Peak Responsibility Factor (transformer load at system peak / transformer peak load)PUL: Peak‐per‐Unit Load (Average of yearly peaks over lifetime of transformer / nameplate)

10/19/2019 DISTRIBUTION TRANSFORMER LOADING 4
Statistics TermsMean: is the "average" you're used to, where you add up all the numbers and then divide by the number of numbers.
Median: is the "middle" value in the list of numbers. To find the median, your numbers have to be listed in numerical order from smallest to largest, so you may have to rewrite your list before you can find the median.
Mode: is the value that occurs most often. If no number in the list is repeated, then there is no mode for the list.
Standard Deviation: is a measure that is used to quantify the amount of variation or dispersion of a set of data values. A low standard deviation indicates that the data points tend to be close to the mean (also called the expected value) of the set, while a high standard deviation indicates that the data points are spread out over a wider range of values.
Kurtosis: is a measure of the "tailedness" of the probability distribution. It is a descriptor of the shape of a probability distribution.

Annual Load Factor:Average Annual Load / Peak Annual Load
10/19/2019 DISTRIBUTION TRANSFORMER LOADING 5

10/19/2019 DISTRIBUTION TRANSFORMER LOADING 6
Annual Load Factor – Residential Only
Average Annual Load / Peak Annual Load
Num
ber o
f Transform
ers
RMS / Peak
Mode: 0.28
Average / Peak
Mode: 0.26
Rounded to 2 Digits
0.17 to 0.35 0.13 to 0.31
Range at ≈ ½ of the mode:
Range at ≈ ½ of the mode:

10/19/2019 DISTRIBUTION TRANSFORMER LOADING 7
Annual Load Factor – Commercial Only
Average Annual Load / Peak Annual Load
Num
ber o
f Transform
ers
RMS / Peak
Mode: 0.35
Average / Peak
Mode: 0.37
0.16 to 0.510.24 to 0.55
Range at ≈ ½ of the mode:
Range at ≈ ½ of the mode:

10/19/2019 DISTRIBUTION TRANSFORMER LOADING 8
Annual Load Factor – Mixed Use Res/Comm
Average Annual Load / Peak Annual Load
Num
ber o
f Transform
ers
RMS / PeakMode: 0.31
Average / Peak
Mode: 0.29
0.21 to 0.38 0.18 to 0.34
Range at ≈ ½ of the mode:
Range at ≈ ½ of the mode:

Annual Load FactorBy kVA Size
10/19/2019 DISTRIBUTION TRANSFORMER LOADING 9

10/19/2019 DISTRIBUTION TRANSFORMER LOADING 10
Num
ber o
f Transform
ers
Annual Load Factor – Single‐Phase Banks
Average Annual Load / Peak Annual Load25 kVA 50 kVA 100 kVA
Mode: 0.27
0.15 to 0.320.10 to 0.29
Mode: 0.20 Mode: 0.26
0.16 to 0.32
Range at ≈ ½ of the mode:
Range at ≈ ½ of the mode:
Range at ≈ ½ of the mode:

10/19/2019 DISTRIBUTION TRANSFORMER LOADING 11
Num
ber o
f Transform
ers
Annual Load Factor – Three‐Phase Banks
Average Annual Load / Peak Annual Load75 kVA 300 kVA 500 kVA
Mode: 0.30
0.21 to 0.49
0.20 to 0.41
Mode: 0.30 Mode: 0.38
0.23 to 0.54Range at ≈ ½ of the mode:
Range at ≈ ½ of the mode:
Range at ≈ ½ of the mode:

Annual Load Factor By Customer Count
10/19/2019 DISTRIBUTION TRANSFORMER LOADING 12

10/19/2019 DISTRIBUTION TRANSFORMER LOADING 13
Num
ber o
f Transform
ers
Annual Load Factor – Number of Customers / Transformer Bank
Average Annual Load / Peak Annual Load
1 Cust/Bank12,232 Banks
2 Cust/Bank8,317 Banks
Mode: 0.20
0.12 to 0.250.09 to 0.21
Mode: 0.15
Mode: 0.23
0.16 to 0.29
4 Cust/Bank5,497 Banks
3 Cust/Bank5,661 Banks
Mode: 0.22
0.15 to 0.27
Range at ≈ ½ of the mode:
Range at ≈ ½ of the mode:
Range at ≈ ½ of the mode:
Range at ≈ ½ of the mode:
10/19/2019 DISTRIBUTION TRANSFORMER LOADING 14
Num
ber o
f Transform
ers
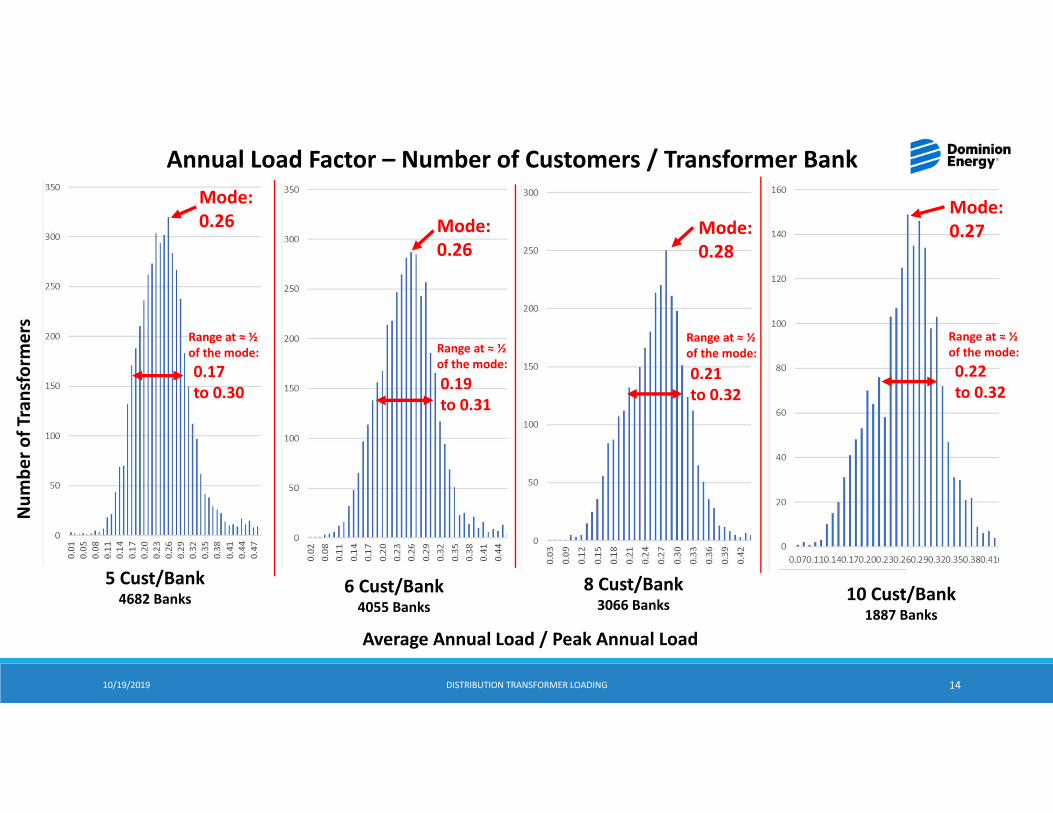
Annual Load Factor – Number of Customers / Transformer Bank
Average Annual Load / Peak Annual Load
10 Cust/Bank1887 Banks
Mode: 0.26
0.17 to 0.30
0.22 to 0.32
Mode: 0.27Mode:
0.26
0.19to 0.31
Mode: 0.28
0.21 to 0.32
5 Cust/Bank4682 Banks
6 Cust/Bank4055 Banks
8 Cust/Bank3066 Banks
Range at ≈ ½ of the mode: Range at ≈ ½
of the mode:
Range at ≈ ½ of the mode:
Range at ≈ ½ of the mode:

10/19/2019 DISTRIBUTION TRANSFORMER LOADING 15
Num
ber o
f Transform
ers
Annual Load Factor – Number of Customers / Transformer Bank
Average Annual Load / Peak Annual Load
Dominion 1 Cust/Bank12,232 Banks, Mixed Use
Dominion 1 Cust/Bank7194 Banks, Residential only
Mode: 0.15
0.09 to 0.200.09 to 0.21
Mode: 0.15
Mode: 0.26
0.10 to 0.42
Toronto Hydo 1 Cust/Bank131 Banks, Residential only
Range at ≈ ½ of the mode:
Range at ≈ ½ of the mode:
Range at ≈ ½ of the mode:

10/19/2019 DISTRIBUTION TRANSFORMER LOADING 16
Annual Load Factor
• Dominion 2018 All Transformers: 0.258• Dominion 2018 Residential Only Transformer: 0.26• Dominion 2018 Commercial Only Transformer: 0.37• Dominion 2018 Mixed Use Res/Comm Transformer:
0.29• Duke Energy Transformer LF: 0.2• Toronto Hydro 2013 Residential Transformer: 0.29• PG&E 2006 Residential Customer: 0.39
• Dominion 2018 All Transformers: 0.288• Dominion 2018 Residential Only Transformer:
0.28• Dominion 2018 Commercial Only Transformer:
0.35• Dominion 2018 Mixed Use Res/Comm
Transformer: 0.31• Duke Energy Transformer LF: 0.3
RMS Average / Peak Load Numerical Average / Peak Load
Annual Load Factor Summary• 0.3 is a reasonable number• Increases with increasing transformer size• Increases with increasing customer count

Peak kW Load / Nameplate kVA
10/19/2019 DISTRIBUTION TRANSFORMER LOADING 17
A version of Utilization Factor

10/19/2019 DISTRIBUTION TRANSFORMER LOADING 18
Peak kW Load / Nameplate kVA
Num
ber o
f Transform
ers
Mode: 0.46
0.24 to 0.93
Data issues
60,725 Transformer BanksMix of Residential and Commercial Customers
Range at ≈ ½ of the mode:

10/19/2019 DISTRIBUTION TRANSFORMER LOADING 19
Peak kW Load / Nameplate kVA
Num
ber o
f Transform
ers
Mode: 0.51
0.27 to 0.95
Residential Only39,546 Banks
Commercial Only10,745 Banks
Mixed Use10,062 Banks
Mode: 0.00
0.00 to 0.66
0.24 to 0.88
0.41
Mode: 0.53
Range at ≈ ½ of the mode:
Range at ≈ ½ of the mode:
Range at ≈ ½ of the mode:

10/19/2019 DISTRIBUTION TRANSFORMER LOADING 20
Peak kW Load / Nameplate kVA
• ConEdison Overall Average Capacity Factor = 26% Network System Second contingency design
• Toronto Hydro – Residential Only – Mode: 0.9 • Duke Energy – Mode: 0.7• Dominion – Overall – Mode: 0.46• Dominion – Residential Only – Mode: 0.46• Dominion – Commercial Only – Mode: 0.00 [w/o zero loads, Mode = 0.41]• Dominion – Mixed Use – Mode: 0.53
Peak/NP Summary• Need more data

Peak Responsibility Factor: Load at System Peak / Peak Load
10/19/2019 DISTRIBUTION TRANSFORMER LOADING 21

10/19/2019 DISTRIBUTION TRANSFORMER LOADING 22
Num
ber o
f Transform
ers
Load at System Peak / Peak Load
Mode: 0.32
58,634 Transformer Banks
0.17 to 0.94
Range at ≈ ½ of the mode:

10/19/2019 DISTRIBUTION TRANSFORMER LOADING 23
Num
ber o
f Transform
ers
Load at System Peak / Peak Load
Mode: 0.32
0.17 to 0.89
Residential Only – 38,846 Banks
Range at ≈ ½ of the mode:

10/19/2019 DISTRIBUTION TRANSFORMER LOADING 24
Num
ber o
f Transform
ers
Load at System Peak / Peak Load
Mode: 0.91
0.01 to 0.97
Commercial Only – 9862 Banks
Range at ≈ ½ of the mode:
10/19/2019 DISTRIBUTION TRANSFORMER LOADING 25
Num
ber o
f Transform
ers
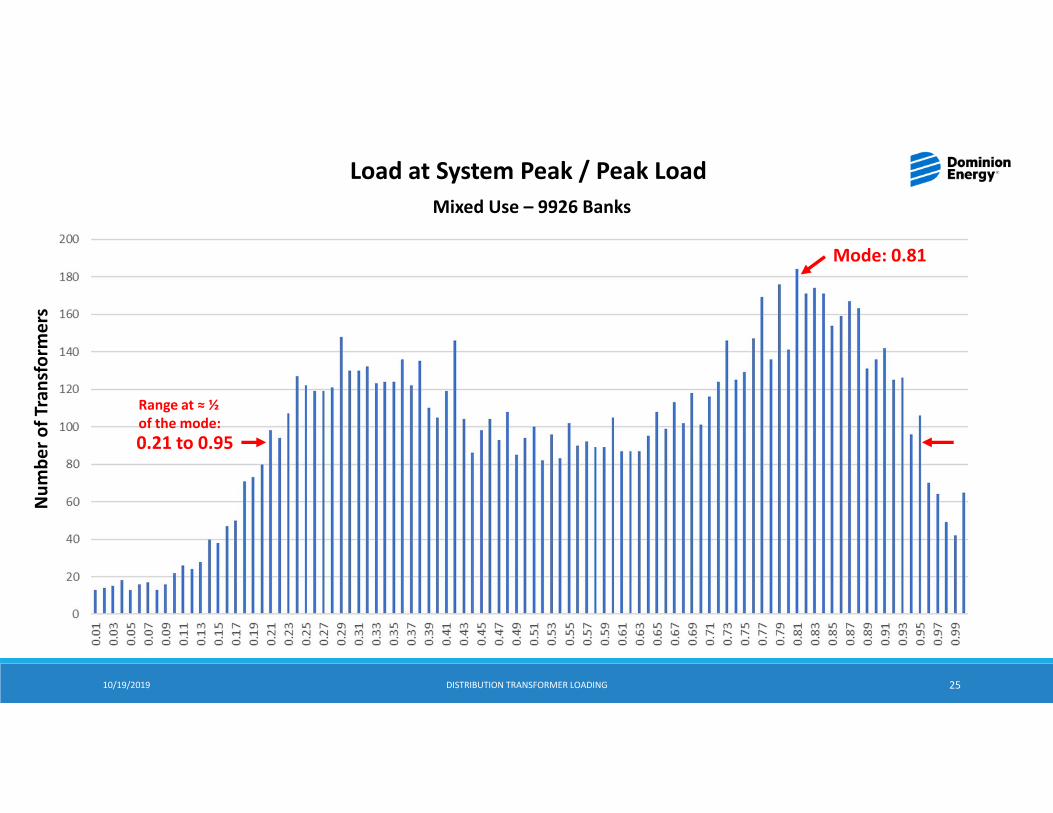
Load at System Peak / Peak Load
Mode: 0.81
0.21 to 0.95
Mixed Use – 9926 Banks
Range at ≈ ½ of the mode:

10/19/2019 DISTRIBUTION TRANSFORMER LOADING 26
Peak Responsibility Factor:
• Dominion – Overall – Mode: 0.32 Range: 0.17 – 0.94• Dominion – Residential Only – Mode: 0.32 Range: 0.17 – 0.89• Dominion – Commercial Only – Mode: 0.91 Range: 0.01 – 0.97• Dominion – Mixed Use – Mode: 0.81 Range: 0.21 – 0.95
Peak Responsibility Factor Summary• Most of the population isn’t anywhere near the mode value

Transformer Load Data Needed – DOE
10/19/2019 DISTRIBUTION TRANSFORMER LOADING 27

10/19/2019 DISTRIBUTION TRANSFORMER LOADING 28
For the purpose of evaluating potential energy conservation standards for distribution transformers, DOE has published a Request for Information (RFI)* requesting transformer or customer load profile data. The data requested would ideally be for a full calendar year of kWh data (typically in 15, 30, or 60‐minute intervals), with the customer type through the NAICS or SIC code, and the supplying transformer bank characteristics.
Customer load and transformer bank data can be provided by native data export to text in platform neutral format through a secure web portal.
Department of Energy (DOE)
Dan Mulkey707‐776‐[email protected]
Jeremy Dommu202 586‐[email protected]
CONTACT:
*Published June 18, 2019, in the Federal Register Vol. 84, No. 117, pg. 28239.doe.govhttps://www.regulations.gov/document?D=EERE‐2019‐BT‐STD‐0018‐0001

10/19/2019 DISTRIBUTION TRANSFORMER LOADING 29
Customer Data:Transformer ID serving the customerCustomer type: Residential or the NAICS or SIC code for businessesLoad Data per time period
• Date & Time (at beginning or end of time frame)• kWhr consumed
Transformer Bank Data:Installation location
• State• 5‐digit Zip code
Transformer ID (unique identifier)Transformer Type (e.g. overhead, pad‐mount, submersible, network, etc.)Bank nameplate kVA (sum of individual transformer units or nameplate of a three‐phase transformer)
• Unit #1 kVA• Unit #2 kVA• Unit #3 kVA
Date & time of system peak

Transformer Load Data Needed – IEEE
10/19/2019 DISTRIBUTION TRANSFORMER LOADING 30

10/19/2019 DISTRIBUTION TRANSFORMER LOADING 31
Desired transformer bank information
This Excel spreadsheet template is posted in the Working Group section of the committee web page

10/19/2019 DISTRIBUTION TRANSFORMER LOADING 32
Desired transformer customer information
This Excel spreadsheet template is posted in the Working Group section of the committee web page

10/19/2019 DISTRIBUTION TRANSFORMER LOADING 33
Desired transformer load information
This Excel spreadsheet template is posted in the Working Group section of the committee web page

New Loads for Electric Vehicle Charging and HVAC
10/19/2019 DISTRIBUTION TRANSFORMER LOADING 34
10/19/2019 DISTRIBUTION TRANSFORMER LOADING 35
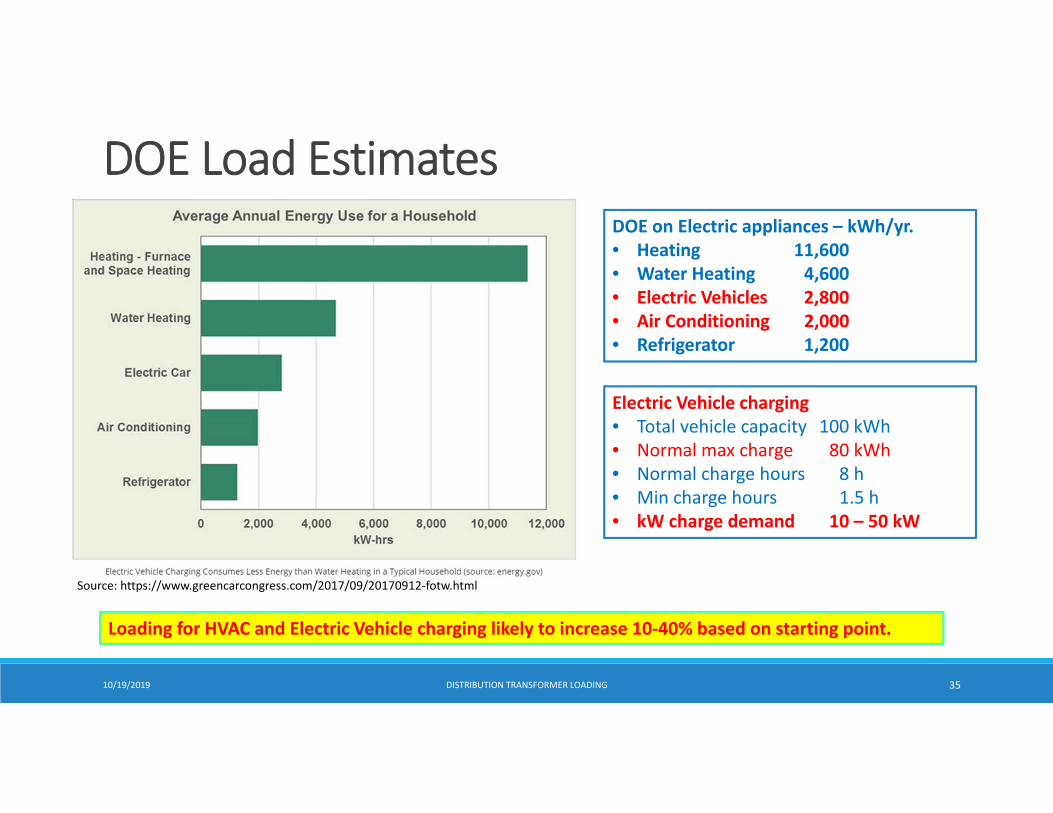
DOE on Electric appliances – kWh/yr.• Heating 11,600• Water Heating 4,600 • Electric Vehicles 2,800• Air Conditioning 2,000• Refrigerator 1,200
Electric Vehicle charging• Total vehicle capacity 100 kWh• Normal max charge 80 kWh• Normal charge hours 8 h• Min charge hours 1.5 h• kW charge demand 10 – 50 kW
DOE Load Estimates
Loading for HVAC and Electric Vehicle charging likely to increase 10‐40% based on starting point.
Source: https://www.greencarcongress.com/2017/09/20170912‐fotw.html

10/19/2019 DISTRIBUTION TRANSFORMER LOADING 36
Amazon EVSE Level 2 Chargers• 240V, 10A/16A, 2.4kW/3.8kW• 240V, 16A, 3.8 kW• 240V, 30A, 7.2 kW• 240V, 32A, 7.7 kW• 240V, 40A, 9.6 kW
Amazon EVSE Level 1 Chargers• 110V, 15/16A, 1.7kW/1.8kW
Vehicle Level 1 (120V) Level 2 (240V)Honda Clarity 19h 3.5h
Fiat 500e / Nissan Leaf 17h 6.5h
BMWi 16.5h 6h
Chevy Volt 12h 4h
Ford Fusion C‐Max 10.5h 2.5h
Toyota Prius 6.5h 2.5h
Electric Vehicle Charging Today
kW charge demand 10 kW 50 kW@ 120 V 1Ø 83 A 417 A@ 240 V 1Ø 42 A 208 A@ 480 V 3Ø 12 A 60 A
EPA Estimated Charging Range
Feasible insomeResidentialServices
Feasible in CommercialServices
Time for Full Charge

10/19/2019 DISTRIBUTION TRANSFORMER LOADING 37
2020 Porsche Taycan ‐ The “first electric vehicle to be built on an 800‐volt electrical architecture. This design allows Porsche to offer more powerful 270‐kilowatt charging that can recharge the battery from five to 80 percent in 22.5 minutes. That said, 800‐volt DC fast chargers are rare; only a handful currently exist. More common 400‐volt DC fast‐charging is limited to 50 kilowatts of power, unless you opt for the $460 150‐kilowatt charger.” [Car and Driver]
Electric Vehicle Charging Today
Tycan has three charging modes:• 400V DC @ 50 kW• 400V DC @ 150 kW• 800V DC @ 270 kWNot compatible with home charging
US Infrastructure DesignResidential: • 1Ø AC 120/240V, typical service: 200A, 38.4 kVA • 1Ø AC 120/240V, typical max: 400A, 77 kVANon‐Residential: • 3Ø AC 120/208V, typical max: 4000A, 1152 kVA• 3Ø AC 277/480V, typical max: 4000A, 2659 kVANote: Main switches are typically limited to 80% of main switch
Watch your units! These charging modes do not translate directly into transformer load:• AC vs DC• Unmatched voltages• Efficiency of transformation (drives transformer load up)• Use of energy storage (drives transformer load down)
Conclusion: These DC Fast‐Chargers will not add load to distribution transformers. Instead they will add new distribution transformers to the system.

10/19/2019 DISTRIBUTION TRANSFORMER LOADING 38
New loads for electric Vehicle & HVAC point to higher Distribution Transformer Loading
Three clear choices
1. Let loads rise with existing 65 C rise installation practicesa. RMS‐equivalent load expected closer to 50% of nameplateb. Peak loading will in some cases exceed rated hot spot of 80 C rise for 65 C class insulation and shorten expected life
2. Install larger transformersa. Larger physical sizeb. Greater cost to usersc. Expect higher core lossesd. Hot spot temperatures likely will not exceed rated 80 C rise
3. Make use of new higher thermal class materialsa. No size increaseb. No core watts increasec. Natural Ester fluid to replace mineral oilb. Possibly new thermally upgraded solid insulationc. Cost likely less than with option 2 above

Thought Experiment onDual Rated Distribution Transformers
10/19/2019 DISTRIBUTION TRANSFORMER LOADING 39

10/19/2019 DISTRIBUTION TRANSFORMER LOADING 40
Temperature Rise Limits at Continuous Nameplate kVA with 30C Ambient
Insulating Liquid Mineral Oil Ester
Thermal Class 120 130 120 130 140 155 180
Top Oil Rise 65 65 90 90 90 90 90
Average Winding Rise 65 75 65 75 85 95 115
Hot Spot Rise 80 90 80 90 100 115 140
Insulating Liquid Mineral Oil Ester
Thermal Class 120 130 120 130 140 155 180
Top Oil Maximum 120 120 140 140 140 140 140
Hot Spot Maximum 180 180 180 180 180 195 220
Mineral Oil + Thermally upgraded kraft paper is 120 Thermal Class Ester + Thermally upgraded kraft paper is 140 Thermal Class Maximum peak load 200% of nameplate kVA
Peak Temperature when Loaded Beyond Nameplate kVA

10/19/2019 DISTRIBUTION TRANSFORMER LOADING 41
kVA 65/85C Rise 15/22 25/34 50/60 100/118Winding Rise C 47 85 53 85 65 85 65 85% Impedance 2.19 3.30 2.12 2.93 1.95 2.37 2.73 3.25% Regulation 2.02 3.12 1.88 2.66 1.68 2.07 2.15 2.60Total Watts 233 490 332 599 564 800 1073 1514
Example designs use natural ester + thermally upgraded kraft paper 140 thermal classBase kVA based on 65C winding rise and meets DOE minimum efficiencyThermal kVA based on 85C winding riseReference temperature for losses based on winding rise + 20C15 and 25kVA designs are constrained by minimum mechanical requirementsVoltage regulation based on 0.85 power factor
Example Overhead Transformers Dual kVA Continuous Loading

10/19/2019 DISTRIBUTION TRANSFORMER LOADING 42
kVA 65/85C Rise 15/22 25/34 50/60 100/118Ambient Profile SI W/SC SI W/SC SI W/SC SI W/SCPeak kVA 26 29 39 44 68 76 130 145% Impedance 4.08 4.63 3.42 3.93 2.70 3.10 3.58 4.05% Regulation 3.92 4.46 3.14 3.65 2.40 2.80 2.89 3.33
Example Overhead Transformers Dual kVA Peak Loading
Utility Peak kVA set as the max load that would not exceed:• Hot Spot of 190˚C mineral oil or 200˚C natural ester• Top Oil of 110˚C mineral oil or 120˚C natural ester• Total Aging of 13,140 hours (1 1/2 years of aging in a single year)Summer Interior (SI) or Winter/Summer Coastal (W/SC) ambient based on 2006 heat‐storm year hourly temperature profileLoad Shape – average customer load shape curves from 2006Note: In these particular cases, the 120˚C top oil max was the limiting factor

(SI = Summer Interior, W/SC = Winter)
10/19/2019 DISTRIBUTION TRANSFORMER LOADING 43
Transformer @BaseNP
@ThermalNP @SI Peak @W/SC
Peak15/22 2.42 3.74 4.70 5.3525/34 2.26 3.19 3.77 4.3850/60 2.02 2.48 2.88 3.36100/118 2.58 3.12 3.47 4.00
85% PF Voltage Drop on 120 V base
Design Limit = 8.5 V for Transformer, Secondary and Service

10/19/2019 DISTRIBUTION TRANSFORMER LOADING 44
Design and Application Considerations for Dual kVA Transformers
Transformer Design Considerations Material selection to meet desired thermal class Thermal design differences for different liquids Coil ducting practice (size, quantity and location) to support higher loads Component selection for higher continuous loads (leads, bushings, switches, etc) Switching and load interrupting at higher loads and liquid temperatures. Under oil fuse and LV breaker operation. Is de‐rating required for higher oil temperatures? Gaskets and seals for different liquids and temperatures Gas space volume, liquid level and tank pressure coordination Maximum conductor temperatures under long duration short circuit
Transformer Application Considerations Conductor sizing for transformer installation External fuse selection Maximum voltage drop at peak loads External transformer touch temperature (eg, padmounts)

10/19/2019 DISTRIBUTION TRANSFORMER LOADING 45
Mulkey’s Utility Application of Dual Rated Distribution Transformers
Designs:• Estimate the expected customer loads• Minimize capital expenditure without exceeding:
• The SI, SC, or W thermal limit• The 6.5 volt drop limit for transformer, secondary, and service• If residential, the flicker limit • If non‐residential, size the concrete pad/vault to hold a
transformer capable of serving the full service‐ampacity (e.g. Initially install 150 kVA on a concrete pad capable of holding a 2500 kVA on a 3000A 480V Main)
kVA 65/85C Rise 15/22 25/34 50/60 100/118Ambient Profile SI W/SC SI W/SC SI W/SC SI W/SCPeak kVA 26 29 39 44 68 76 130 14585% PF Voltage Drop 4.70 5.35 3.77 4.38 2.88 3.36 3.47 4.00Present 65˚C Peak kVA 20 23 30 35 55 65 110 130
(SI = Summer Interior, W/SC = Winter/Summer Coastal)
Operations:• Assure within design limits when notified of
load increase• Verify temperature limits exceeded if
flagged as overloaded• Voltage/Flicker complaint, measure to
confirm voltage out of bounds
New Dual Rated designs offer increased loadability

10/19/2019 DISTRIBUTION TRANSFORMER LOADING 46
Mulkey’s Utility Application of Dual Rated Distribution Transformers
Residential designs are typically voltage or flicker limited.Non‐residential designs are typically transformer capability limited.
Likely Net Results:
Residential Designs– no change in initial design and installations as these are typically voltage limited– minor reduction in need for replacements
Commercial Designs– minor reduction in average size initially installed– moderate reduction in need for replacements

Summary
10/19/2019 DISTRIBUTION TRANSFORMER LOADING 47

10/19/2019 DISTRIBUTION TRANSFORMER LOADING 48
Annual Load Factor Summaryo 0.3 is a reasonable numbero Increases with increasing transformer sizeo Increases with increasing customer count
We need more load datao Particularly for Peak / Nameplate
Societal changes are underway that add load to distribution transformerso Electric Vehicleso Increased HVAC o Switch from electric/gas to all electric service
Higher design temperatures for transformers are feasibleo What should the limits be?
Summary

10/19/2019 DISTRIBUTION TRANSFORMER LOADING 49
1. EV Charger Types & Transformer Loading:a) Class 1 is only 1 kW, uses 120V 1Ø, and
takes forever. Can be added to and used at any home.
b) Class 2 is better but can go up to 6 kW, uses 240V 1Ø, and still takes a long time. Can be added to and used at some homes.
c) Class 3 is fast but is a very big load, needs at least 240V 1Ø, but bigger/quicker ones require 208V 3Ø or 480V 3Ø. Usually will require an additional distribution transformer.
2. We would like to see more loading data3. We wonder if our DOE friends have any
thoughts to share?
Next Steps? Electric Vehicle Charging Summary:
https://chargehub.com/en/electric‐car‐charging‐guide.html#charginglevels
https://www.evchargesolutions.com/Delta‐EV‐DC‐Quick‐Charger‐Wallbox‐p/deltadcfcsingle.htm
Delta's newly‐launched 25kW Wallbox DC Quick EV Charger Max. output power: 25kWOutput voltage range: 200‐500Vdc (SAE Combo); 50‐500Vdc (CHAdeMO)Max. 94% power efficiencyAvailable in 3 power inputs
3 phase, 208 volt3 phase, 480 volt1 phase, 240 volt
Single‐Phase Three‐PhaseLoad kVA 120V 240V 120V 277V
25kVA 208A 104A 69A 30A50kVA 417A 208A 139A 60A