Task 23 Task Meeting The Role of Customers in Delivering ... DSM Task 23 Experts Meeting No... ·...
107
Task 23 Task Meeting The Role of Customers in Delivering Effective Smart Grids 4 th and 5 th July Steinkjer, Norway
Transcript of Task 23 Task Meeting The Role of Customers in Delivering ... DSM Task 23 Experts Meeting No... ·...

Task 23 Task Meeting
The Role of Customers in Delivering
Effective Smart Grids
4th
and 5th
July
Steinkjer, Norway

Agenda Day One: Thursday 4th July
09:00 Sub-task 2:
Re-cap on aims / objectives of sub-task
Review of progress
Identify any gaps
Agree way forward
10:00 Review of case studies 15 minute (max) presentation by Experts on country case study – focus on presenting
main lessons learnt from customer perspective
Netherlands (Yvonne)
Norway (Even)
Sweden (Magnus)
11:00 Break
11:30 Review of case studies – continued
Italy (Simone)
UK (Esther)
Republic of Korea (Yeoungjin)
Re-cap of main lessons learnt (All)
12:30 Update from UK team
Consumer survey
13:00 Lunch
14:00 DemoSteinkjer demonstration
17:00 Close
2

Agenda Day Two: Friday 5th July
09:00 Sub-task 3:
Re-cap on aims / objectives of sub-task
Review of progress
Identify any gaps
Agree way forward
10:00 Sub-task 4:
Re-cap on aims / objectives of sub-task
Agree way forward
10:45 Break
11:00 Sub-task 5:
Re-cap on aims / objectives of sub-task
Agree way forward
11:45 Date / location of next meeting
What happens at end of current work programme?
12:00 Lunch
13:00 Close
3

Agenda Day One: Thursday 4th July
09:00 Sub-task 2:
Re-cap on aims / objectives of sub-task
Review of progress
Identify any gaps
Agree way forward
10:00 Review of case studies 15 minute (max) presentation by Experts on country case study – focus on presenting
main lessons learnt from customer perspective
Netherlands (Yvonne)
Norway (Even)
Sweden (Magnus)
11:00 Break
11:30 Review of case studies – continued
Italy (Simone)
UK (Esther)
Korea (Yeoungjin)
Re-cap of main lessons learnt (All)
12:30 Update from UK team
Consumer survey
13:00 Lunch
14:00 DemoSteinkjer demonstration
17:00 Close
4

Overall Aim
“ to identify and, where possible, quantify the risks and rewards associated with Smart Meters and Smart Grids from the perspective of the consumer, both now and in
the future”
5
Scope
– “limited to customers with Smart Meters and thus, likely to be expected to play an important role in the future as Smart Grids are deployed”
• Customer Types – Residential
– Small Commercial, business and local authority customers
• Have similar access to the market as residential customers
6

Expected Outcome
• Identification of the factors that need to be addressed in order to ensure Smart Grids are able to achieve their full potential by ensuring that all industry stakeholders, including customers, benefits from their deployment.
• Achieved through: – Understanding of impact of energy markets on customers
– Understanding of interaction between technology and customers
– Identification of Risks and Rewards associated with Smart Grids from the perspective of customers
– Identification of offers and programmes that help ensure Smart Grids meet the needs of customers
7
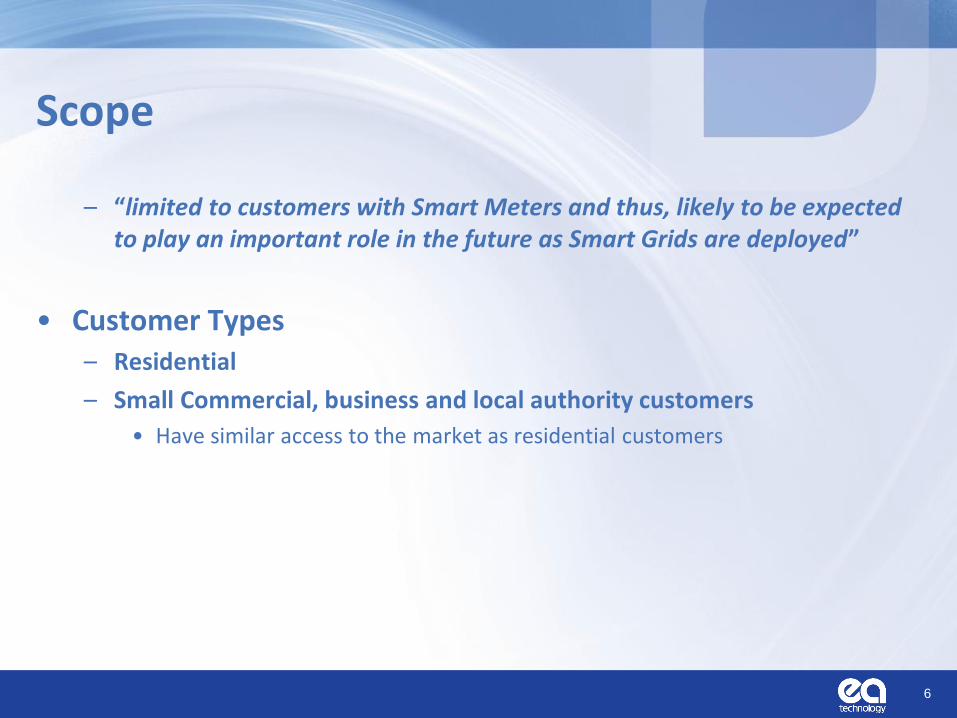
Task XXIII – overview of work programme
8
Impact of
markets (ST1)
Interaction with
technology (ST2)
Risks and
Rewards (ST3) D
efi
nit
ion
of
off
ers
an
d
pro
gra
ms
(ST
4)
Syn
thesis
an
d
Dis
se
min
ati
on
(S
T5)
Customer perspective

Task 23:
9
TECHNOLOGY TOOLS
POLICY
CUSTOMER
SMART GRID
TECHNOLOGY TOOLS
POLICY
CUSTOMER
TECHNOLOGY TOOLS
POLICY
CUSTOMER
TECHNOLOGY TOOLS
POLICY
CUSTOMER
SMART GRID
Technology: • Smart meter
• In-home display
• Smart appliances
Policy: • Smart meter standards
• Smart appliance standards
• Mandate for Time of Use tariffs
• Market structure
• Settlement arrangements
• Billing arrangements
Tools: • Time of Use Tariff
• Energy services
• Demand aggregation
• Energy advice

ST 2: Interaction with Technology
Activity Funding Status Agree scope of
technologies to be included
Cost Share and Task Share Done
Background research on
agreed technologies
Cost Share Done
Country specific
experiences from specific
pilots and trials
Task Share On-going
Assess TRLs and MRLs Cost Share On-going
Identify key factors impact
on customers
Cost Share On-going
What we said we would do
Subtask 2 Report
• Background
• Approach
• Consumer Surveys
• Case Studies
• Conclusions
11

Sub-Task 2: Scope widened to look at interventions not just technology
12
Intervention Description
Time of Use Tariff (T)
A form of pricing that penalises consumers that use energy at certain times and/or rewards consumption at other times. This can include static Time of Use (ToU) tariffs, Critical Peak Pricing (CPP), Peak Time Rebates (PTR), Real Time Pricing (RTP).
Control (C)
Controls to actively manage the pattern of consumption. This can include direct load control, automatic load controls, home energy management systems, thermostats for heating and air-conditioning and building energy management systems.
Feedback (F)
Feedback of energy end use information based on the actual energy end use of the individual, i.e. relying on data collected from the smart meter. This can include in-home displays of real time and historic data, web based feedback and billing information. Alternative forms of feedback also exist, such as web-based feedback or the use of smart phones or other portable devices.
Advice (A)
Advice on how consumers can deliver outcomes that support the effective delivering of Smart Grids. This can include advice targeted to an individual on processes/end uses that can be managed, or general advice distributed to groups.

Understanding Energy Behaviour
13

Approach
• Consumer Surveys – 21 surveys reviewed
– Looking at customer reactions to:
• Smart Grids / Smart Metering
• Electricity industry in general
• Other related topics (travel)
• Case Studies – ~30 case studies selected
– Case study template used to gather information
14

Assessment
• Four criteria – Initiative Readiness Level
– Market Readiness Level
– Customer Willingness
– Customer Engagement
15

Initiative Readiness Level
16
IRL 9: Actual system completed and qualified through successful operations
IRL 8: Actual system completed and qualified through test and demonstration
IRL 7: System prototype demonstration in an operation environment
IRL 6: System/subsystem or prototype demonstration in a relevant environment
IRL 5: Components and/or basis subsystem validation in a relevant environment
IRL 4: Components and/or basis subsystem validation in a laboratory environment
IRL 3: Analytical and experimental critical function and/or characteristic proof-of-concept
IRL 2: Concept and/or application formulated
IRL 1: Basic principles observed and reported
IRL 9
IRL 6
IRL 5
IRL 3
IRL 2
IRL 4
IRL 8
IRL 7
IRL 1

Market Readiness Level
17
MRL 9: Approach fully understood and accepted by vast majority of consumers. (e.g. a mobile phone has become a social ‘norm’ rather than landlines for many calls)
MRL 8: Most consumers understand the principles, but only accepted as the ‘norm’ for certain groups (e.g. the use of a Smart Phone to access the internet is regarded as the ‘norm’ for young)
MRL 7: Benefits reasonably well understood by all, but may not be sufficient to drive demand except for certain niche markets (i.e. costs considered to outweigh the benefits) (e.g. iPAD)
MRL 6: General awareness of benefits, but majority of individuals unable to identify the costs/benefits to themselves. (e.g. need for a 3D TV not well justified)
MRL 5: Some customers actively attempting to find out more, i.e. there is some ‘market pull’ from early adopters, but benefits/costs not well understood by most customers.
MRL 4: Some customers aware of basic principles , but limited or no information on potential benefits/costs )
MRL 3: Some consumers starting to actively find out more
MRL 2: Some consumer awareness – but limited, small minority open minded to the idea
MRL 1: Consumers as a whole are unaware
MRL 9
MRL 6
MRL 5
MRL 3
MRL 2
MRL 4
MRL 8
MRL 7
MRL 1

Customer Willingness
• How were participants invited to take part in the initiative? – Was it voluntary?
• How were they recruited?
• Was there a high drop out rate?
– Was it mandatory?
• What were the main concerns of customers?
• Were any changes made to accommodate customer concerns?
• What happened at the end of the initiative? – Did they revert back to ‘business as usual’?
– Did they retain the interventions (i.e. did they stay on the ToU tariff)?
18

Customer Engagement
• The extent to which customers were actively engaged in an initiative, – By how much did their energy consumption behaviour change
• Quantitative – % energy reduction
– % peak reduction
• Qualitative – Reduced thermostat settings
– Switched off appliances when not used
– Shifted usage of appliances
19
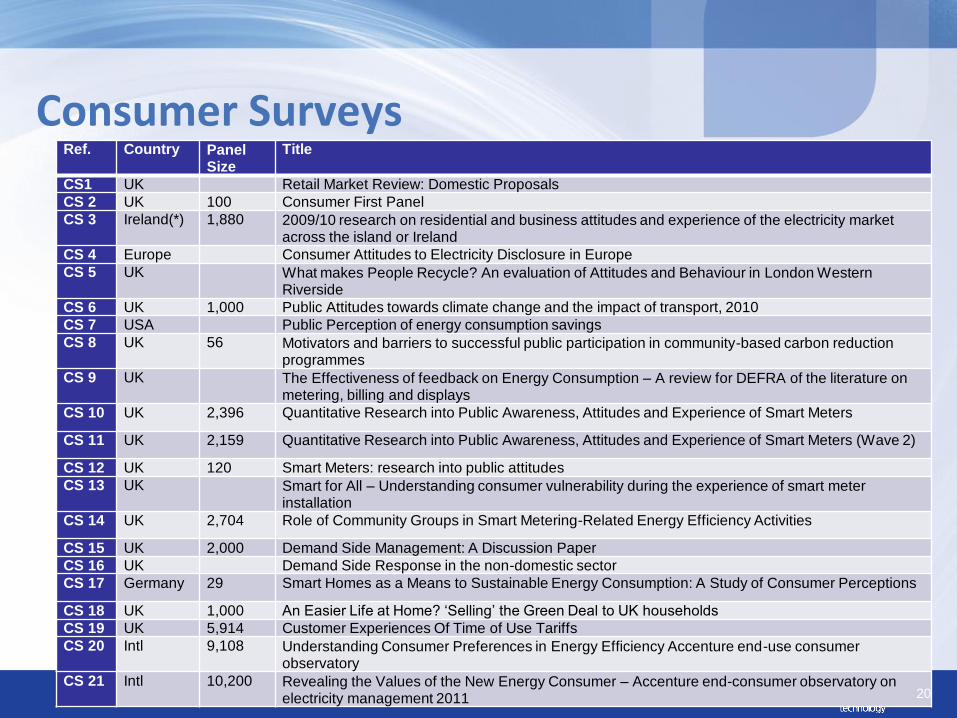
Consumer Surveys Ref. Country Panel
Size Title
CS1 UK Retail Market Review: Domestic Proposals CS 2 UK 100 Consumer First Panel CS 3 Ireland(*) 1,880 2009/10 research on residential and business attitudes and experience of the electricity market
across the island or Ireland CS 4 Europe Consumer Attitudes to Electricity Disclosure in Europe CS 5 UK What makes People Recycle? An evaluation of Attitudes and Behaviour in London Western
Riverside CS 6 UK 1,000 Public Attitudes towards climate change and the impact of transport, 2010 CS 7 USA Public Perception of energy consumption savings CS 8 UK 56 Motivators and barriers to successful public participation in community-based carbon reduction
programmes CS 9 UK The Effectiveness of feedback on Energy Consumption – A review for DEFRA of the literature on
metering, billing and displays CS 10 UK 2,396 Quantitative Research into Public Awareness, Attitudes and Experience of Smart Meters
CS 11 UK 2,159 Quantitative Research into Public Awareness, Attitudes and Experience of Smart Meters (Wave 2)
CS 12 UK 120 Smart Meters: research into public attitudes CS 13 UK Smart for All – Understanding consumer vulnerability during the experience of smart meter
installation CS 14 UK 2,704 Role of Community Groups in Smart Metering-Related Energy Efficiency Activities
CS 15 UK 2,000 Demand Side Management: A Discussion Paper CS 16 UK Demand Side Response in the non-domestic sector CS 17 Germany 29 Smart Homes as a Means to Sustainable Energy Consumption: A Study of Consumer Perceptions
CS 18 UK 1,000 An Easier Life at Home? ‘Selling’ the Green Deal to UK households CS 19 UK 5,914 Customer Experiences Of Time of Use Tariffs CS 20 Intl 9,108 Understanding Consumer Preferences in Energy Efficiency Accenture end-use consumer
observatory CS 21 Intl 10,200 Revealing the Values of the New Energy Consumer – Accenture end-consumer observatory on
electricity management 2011 20

Overview of results of
Consumer Surveys
21

22
Consumer understanding of the electricity industry

Consumer Awareness of the Electricity Market – an example
Are consumers aware of the industry stakeholders and what they do?
Role Residential Customers
Republic of Ireland
ESB
Networks
Supplier Don’t know
Responsibility for
power failure
repair
56% 28% 15%
Maintenance of
grid
56% 25% 18%
Responsibility for
Meter reading
17% 64% 16%
Responsibility for
billing and
payment
10% 74% 14%
Findings from the 2009/2010 research on residential and business attitudes and experiences of the electricity market across the island
of Ireland, The Research Perspective Ltd for CER and Utility Regulator, 2010, p20

Implications?
24
Reasons for not switching electricity supplier
Like current service A factor 54%
Not a factor 19%
No reason to A factor 46%
Not a factor 28%
Concern about an alternative
supplier’s provision of a reliable supply
of electricity
A factor 36%
Not a factor 34%
Concern about alternative supplier to
be as responsive if there is a power
outage
A factor 35%
Not a factor 35%
Do not believe that prices will remain
as low as the alternative supplier
claims
A factor 35%
Not a factor 32%
Which electricity supplier
should I choose?

25
Consumer awareness of specific
technologies and concepts – Smart
Meter example
Yes, I have one 5%
Yes, but I don't have
one 44%
No, I have never heard
of them 50%
Before today, had you heard of smart meters?
Quantitative Research into Public Awareness, Attitudes, and Experience of Smart Meters, wave 2, Feb 2013,
MORI for DECC

26
Consumer awareness of specific
technologies and concepts – Smart
Meter example
Quantitative Research into Public Awareness, Attitudes, and Experience of Smart Meters, wave 2, Feb 2013,
MORI for DECC
A great deal 5%
A fair amount
19%
Just a little 56%
Heard but know
nothing 20%
How much, if anything, would you say you know about smart meters?

Comments on Smart Meters …
• “It is quite a good idea really but they want every home in the UK to have one and it makes you think who is going to pay for it? The costs will be passed onto us one way or another, they always are.”
• “I find it hard to see why an energy supplier should give you a device that means you use less of their product.”
• “I’ve got a smart meter, it’s a white one, they booked and told us when they were going to come, they said it was a smart meter, but I had no idea what that meant, I didn’t know it transmitted data till this gentleman said just now.
27 Smart Meters: research into public attitudes, Navigator for DECC, 2012

Consumer awareness of technologies In Home Display example
• Participants in a trial were asked “Do you have a visual display in your home, that tells you how much electricity or gas you are using?”
Intervention RTD
(elec only)
RTD
(dual fuel)
RTD + ToU RTD + Usage
Alarm
RTD +
Heating
controller
Total
Yes 45.8% 35.2% 50.9% 62.4% 36.1% 46.5%
No 54.2% 64.8% 49.1% 37.6% 63.9% 53.5%
Number 83 105 114 109 97 508
Energy Demand Research Project: Final Analysis, AECOM, June 2011
RTD = real time display
ToU = time of use (tariff)
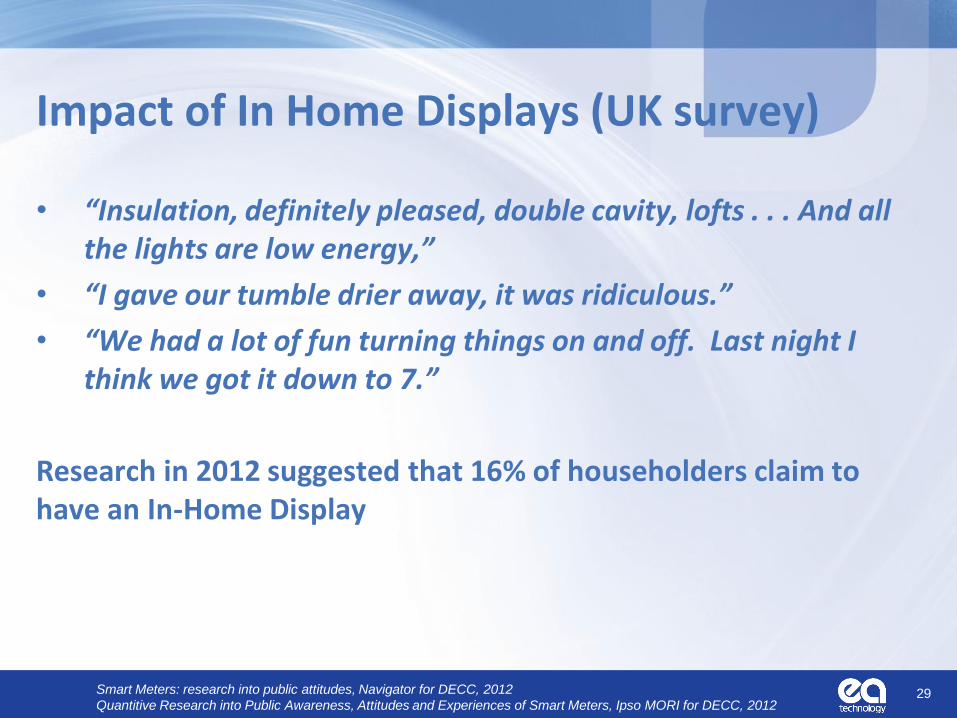
Impact of In Home Displays (UK survey)
• “Insulation, definitely pleased, double cavity, lofts . . . And all the lights are low energy,”
• “I gave our tumble drier away, it was ridiculous.”
• “We had a lot of fun turning things on and off. Last night I think we got it down to 7.”
Research in 2012 suggested that 16% of householders claim to have an In-Home Display
29 Smart Meters: research into public attitudes, Navigator for DECC, 2012
Quantitive Research into Public Awareness, Attitudes and Experiences of Smart Meters, Ipso MORI for DECC, 2012

Consumer Awareness of Energy Efficiency
• What actions lead to the greatest energy savings?
• What is the magnitude of energy savings?
30 Understanding Consumer Preferences in Energy Efficiency, Accenture end-consumer observatory on electricity management 2010
yes, 75%
no, 25%
Do you think you understand enough about the actions you can take to to optimise your energy consumption?
yes, 75%
no, 25%
Do you think you understand enough about the actions you can take to to optimise your energy consumption?

Consumer Awareness of Energy Efficiency
• What actions lead to the greatest energy savings?
• What is the magnitude of energy savings?
• A 2010 US study found: – Consumers not proficient at identifying ways of saving energy
• Focus on curtailment actions rather than energy efficiency improvements
• Tendency to underestimate energy use
• Particularly the magnitude of differences
31 Public perceptions of energy consumption and savings, Shahzeen Z et al., PNAS, 2010

Understanding of specific technologies and concepts - DSR
• Very little awareness that the wholesale cost of electricity changes within the day
• Difficulty understanding the benefits of deferring peak electricity consumption
Demand Side Response: A discussion paper, 82/10, Ofgem, July 2010, p33
32

Awareness of pattern of
consumption? An example
Source: SEMO
€305/MWh
€52/MWh
Disjoint between retail price paid by customers and wholesale price
Retail price (€/MWh)
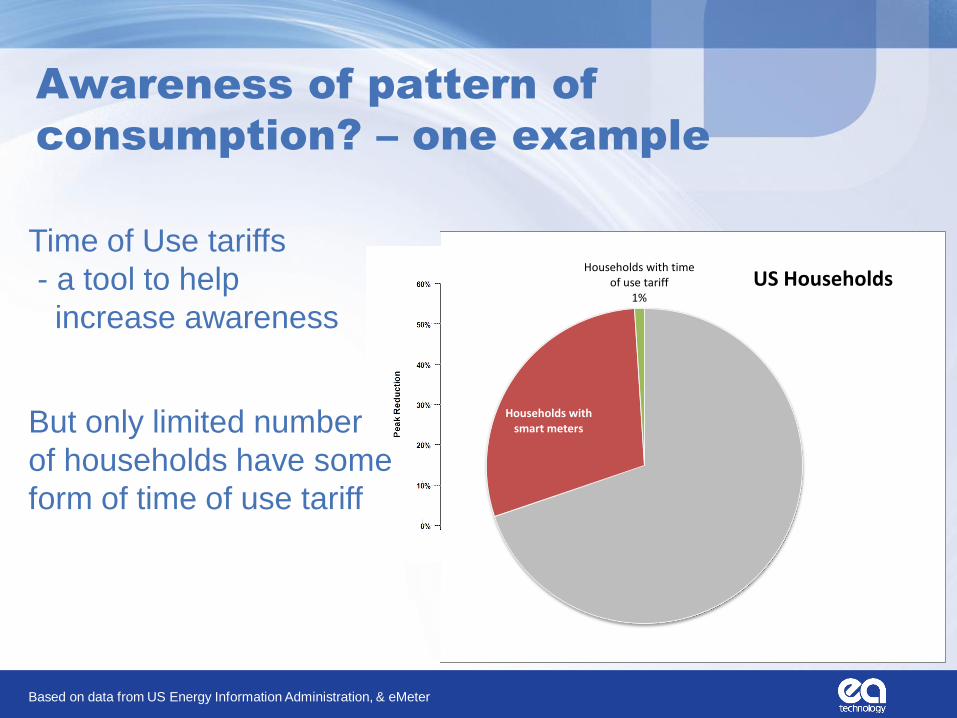
Awareness of pattern of
consumption? – one example
Households with smart meters
Households with time of use tariff
1%
US Households
But only limited number
of households have some
form of time of use tariff
Based on data from US Energy Information Administration, & eMeter
Time of Use tariffs
- a tool to help
increase awareness
How long might the process of changing public attitudes and behaviours take?
• Look at two examples:
– Drink Driving in the UK
– Recycling in the UK
35
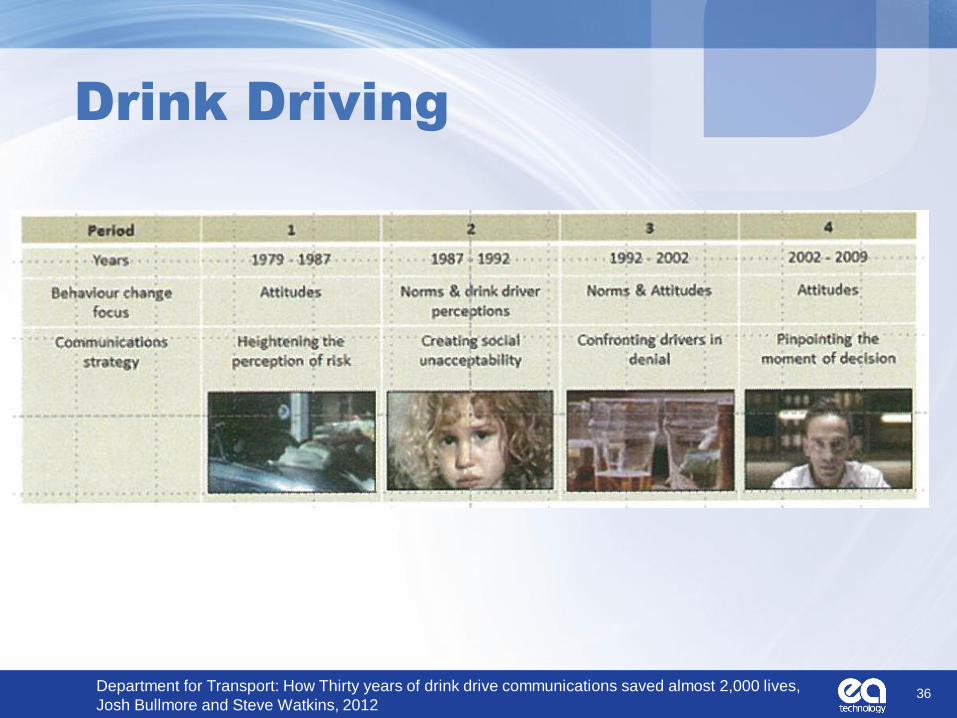
Drink Driving
36 Department for Transport: How Thirty years of drink drive communications saved almost 2,000 lives,
Josh Bullmore and Steve Watkins, 2012

Drink driving
37

38
Recycling - England
http://www.defra.gov.uk/statistics/environment/waste/wrfg16-recycrates/

Why do consumers participate in Smart Grid related initiative?
• Money?
• Environment?
• Communal good?
• Other benefits?
39
Money?
• Consumer First Panel: financial incentive required to motivate a change in behaviour;
• An Ofgem survey of DSR trials found clear financial benefits of between 7 and 10% of a households electricity bill;
• Ofgem note that there was a correlation between the price signal and the peak load reduction achieved;
•Demand Side Response: A Discussion Paper, 82/10, Ofgem, Juky 2010, p33
40
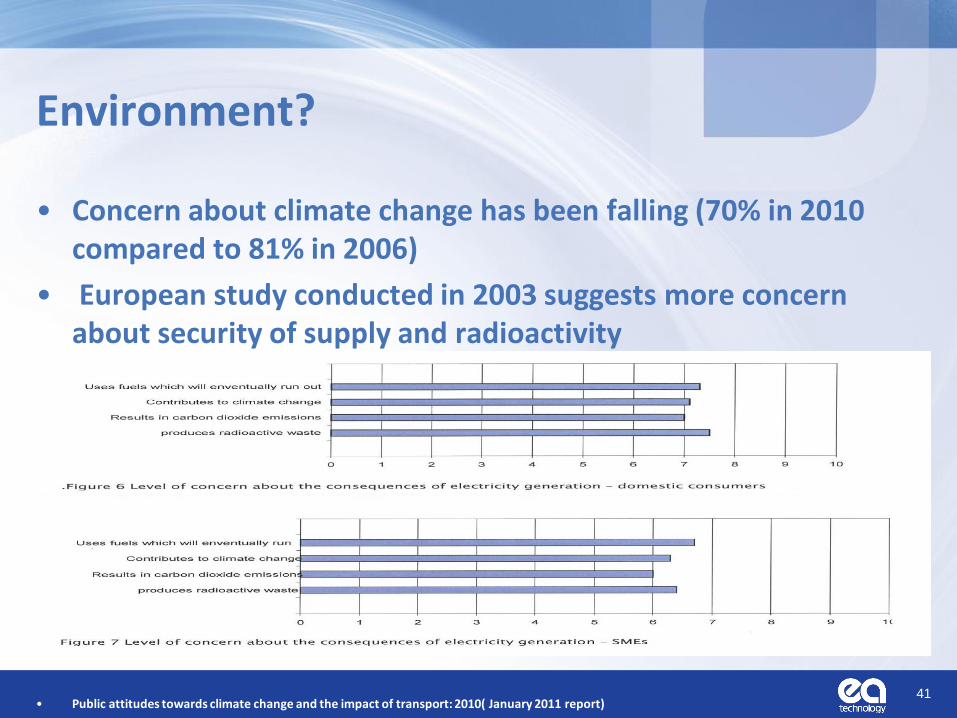
Environment?
• Concern about climate change has been falling (70% in 2010 compared to 81% in 2006)
• European study conducted in 2003 suggests more concern about security of supply and radioactivity
• Public attitudes towards climate change and the impact of transport: 2010( January 2011 report)
• Consumer attitudes to electricity disclosure in Europe, 4C Electricity, 2003
41

Environment?
• “Environment, no, not at the moment, it should, and if everything in garden was rosy and times not so hard you would pay attention to that, and it would be a factor, but that’s not the way things are at the moment.”
• “I could do more but the eco thing irritates me slightly, don’t do this, do that, but one Jumbo for Spain uses more energy in one take off than my whole street does in a year.”
• “They’re not doing it for the good of the environment.”
•Smart Meters: research into public attitudes, p36
42

Communal good?
Eco-Watts trial, Brittany, France.
• Problems with network constraints limiting supply to the Brittany peninsular, - only generates 8% of electricity it uses and a high level of electric heating
• Introduced a voluntary scheme to encourage households to alter electricity use during periods of peak demand
• 9,400 customers signed up in 2008/9. By 2012 50,000 households had signed up
• Demand reduced by 2-3% in the winter of 2011/12 during critical periods
• Alerts delivered by internet, SMS, Mobile phone apps, RSS feeds and email
• No rewards, just an explanation about the problem and the threat of a loss of supply, plus a sense of community in the region
Would this work in the everywhere?
•http://www.ecowatt-bretagne.fr/
43
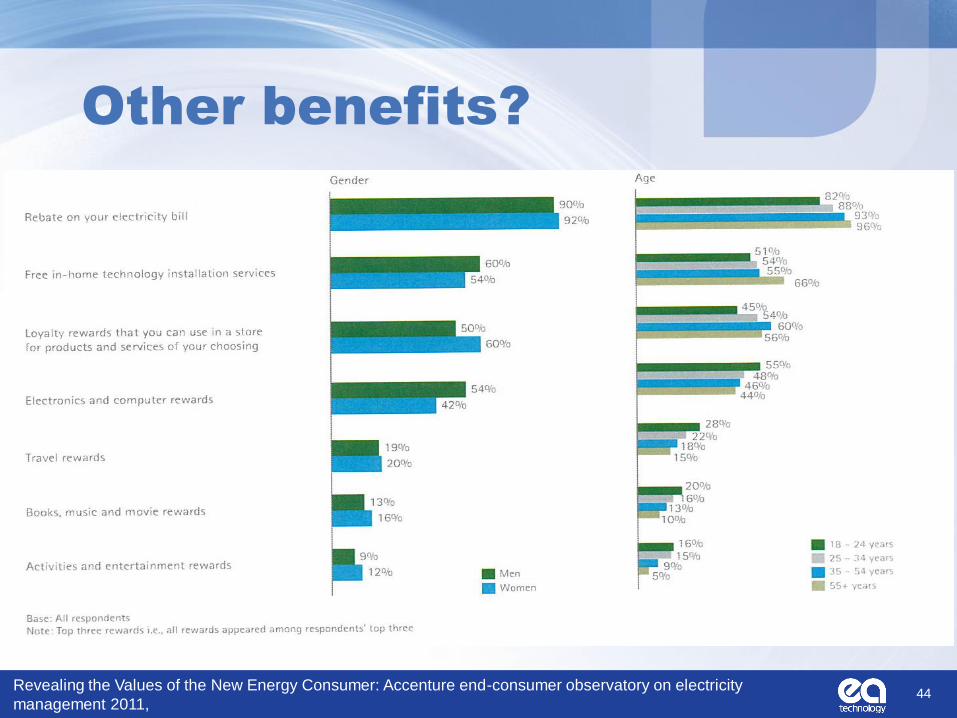
Other benefits?
44 Revealing the Values of the New Energy Consumer: Accenture end-consumer observatory on electricity
management 2011,

Will consumers participate?
47
27
58
37
21
46
0
10
20
30
40
50
60
70
use public transportmore
cycle more often walk more often
%
Willingness to use other modes more often instead of travelling by car
willing to able to
45 Public attitudes towards climate change and the impact of transport: 2010 (January 2011 report, ONS,

Conclusion of Consumer Surveys
• Increasing interest in energy efficiency but ignorance of structure of the industry, Smart Meters and DSR;
• Consumers are motivated by money but other, non-financial rewards could be considered;
• They may be willing to consider DSR • Not well understood at the moment
46
Overview of Case Studies – so fare
• General Comments – Lots of trials underway
• Little published to date
– ‘What did not go well’
• Not well publicised
– Focus generally on % load reduction / £ savings
47

Early conclusions from case studies - based on UK, US, Australia results - will be updated following meeting for NE, NO, IT, SE, KR case studies
• Pilots involving Time of Use Tariffs: – Customers often provided with assurance that they will not pay more
than they would have done
– Some customer unwilling to operate appliances at night due
• safety concerns
• Loss of convenience
– Customer disappointed by scale of bill reduction
– Customers are willing to compromise on comfort
• CPP trials of a/c and heating
48
Early conclusions from case studies - based on UK, US, Australia results - will be updated following meeting for NE, NO, IT, SE, KR case studies
• Control of end use appliances – Most experience is with air-conditioning / space heating
• In areas where these contribute significantly to peak load
– In UK – no single load contributes to peak load (from domestic) • With possible exception of lighting / cooking
• Not obvious targets for peak load shifting
– Customers willingness to cede control of their appliances to third parties varies considerably
• Examples from US show willingness is ‘high’
• Examples from Australia suggest willingness is much lower
– Worry about damage occurring to their equipment
– Unhappy about installers entering their property
• Large incentives often provided to persuade customers to participate
– Free heating system (UK / remote control of heat pumps)
49

Early conclusions from case studies - based on UK, US, Australia results - will be updated following meeting for NE, NO, IT, SE, KR case studies
• Feedback via IHDs – Displays including £’s liked by customers
– Traffic light displays liked
– Audible warnings disliked
– Interaction with a computer – less popular
– More effective if combined with energy efficiency advice
• Even where they are already aware of that advice
50

Next steps
• Incorporate findings from remaining case studies
• Complete report
• Circulate to Experts for approval
• Circulate to ExCo for approval
• Publish
51

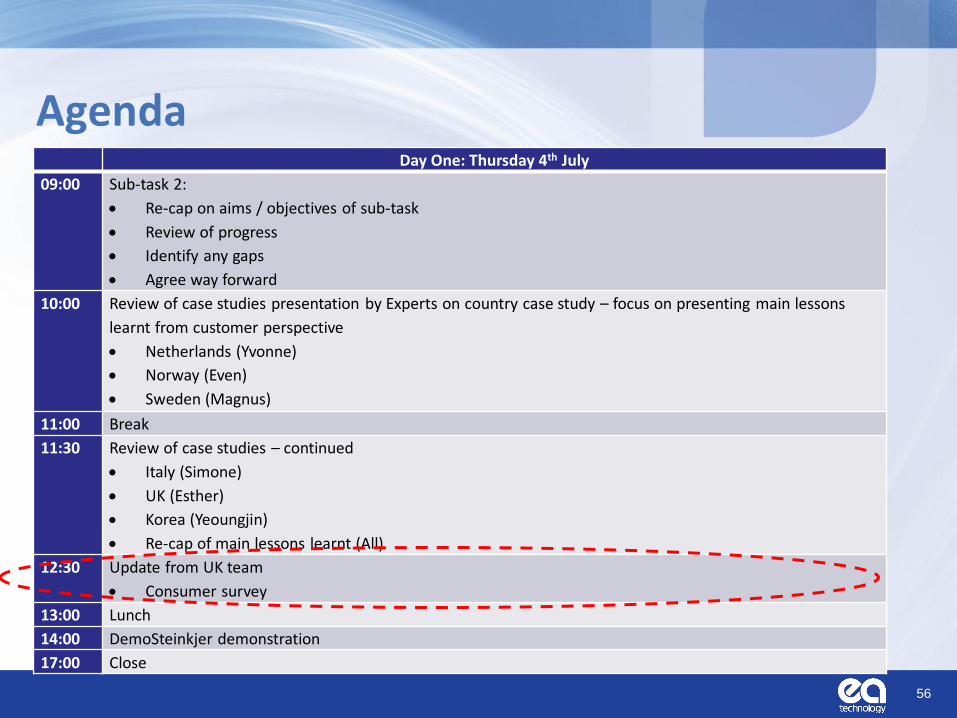
Agenda Day One: Thursday 4th July
09:00 Sub-task 2:
Re-cap on aims / objectives of sub-task
Review of progress
Identify any gaps
Agree way forward
10:00 Review of case studies presentation by Experts on country case study – focus on presenting main lessons
learnt from customer perspective
Netherlands (Yvonne)
Norway (Even)
Sweden (Magnus)
11:00 Break
11:30 Review of case studies – continued
Italy (Simone)
UK (Esther)
Korea (Yeoungjin)
Re-cap of main lessons learnt (All)
12:30 Update from UK team
Consumer survey
13:00 Lunch
14:00 DemoSteinkjer demonstration
17:00 Close
52

Review of Case Studies
• Main points to highlight: – What did customer like?
– What customers didn’t like?
– Was it difficult to recruit / retain customers?
53

Case Studies
• Discussion – General conclusions
– Main learning points
– What worked well / what didn’t work well?
54

ST 2: Interaction with Technology
Activity Funding Status Agree scope of
technologies to be included
Cost Share and Task Share Done
Background research on
agreed technologies
Cost Share Done
Country specific
experiences from specific
pilots and trials
Task Share On-going
Assess TRLs and MRLs Cost Share On-going
Identify key factors impact
on customers
Cost Share On-going
What we said we would do
Agenda Day One: Thursday 4th July
09:00 Sub-task 2:
Re-cap on aims / objectives of sub-task
Review of progress
Identify any gaps
Agree way forward
10:00 Review of case studies presentation by Experts on country case study – focus on presenting main lessons
learnt from customer perspective
Netherlands (Yvonne)
Norway (Even)
Sweden (Magnus)
11:00 Break
11:30 Review of case studies – continued
Italy (Simone)
UK (Esther)
Korea (Yeoungjin)
Re-cap of main lessons learnt (All)
12:30 Update from UK team
Consumer survey
13:00 Lunch
14:00 DemoSteinkjer demonstration
17:00 Close
56

Agenda Day One: Thursday 4th July
09:00 Sub-task 2:
Re-cap on aims / objectives of sub-task
Review of progress
Identify any gaps
Agree way forward
10:00 Review of case studies presentation by Experts on country case study – focus on presenting main lessons
learnt from customer perspective
Netherlands (Yvonne)
Norway (Even)
Sweden (Magnus)
11:00 Break
11:30 Review of case studies – continued
Italy (Simone)
UK (Esther)
Korea (Yeoungjin)
Re-cap of main lessons learnt (All)
12:30 Update from UK team
Consumer survey
13:00 Lunch
14:00 DemoSteinkjer demonstration
17:00 Close
57

Agenda Day Two: Friday 5th July
09:00 Sub-task 3:
Re-cap on aims / objectives of sub-task
Review of progress
Identify any gaps
Agree way forward
10:00 Sub-task 4:
Re-cap on aims / objectives of sub-task
Agree way forward
10:45 Break
11:00 Sub-task 5:
Re-cap on aims / objectives of sub-task
Agree way forward
11:45 Date / location of next meeting
What happens at end of current work programme?
12:00 Lunch
13:00 Close
58

ST 3: Risks and Rewards
59
What we said we would do
Activity Status
Produce a matrix showing the
interrelationship between industry
stakeholder needs and customer
needs
Cost Share On-going
Identify specific case studies or
example scenarios Cost Share / Task Share In parallel with ST2
Identify risks and rewards arising
from case study / scenario analysis Cost Share / Task Share On-going
Develop a risk-reward calculator Cost Share -
Impact of markets
Interaction with
technology
Risks and
Rewards
Definition of
offers and
programs
Synthesis and
Dissemination
Customer perspective

ST 3: Risk and rewards
• Customer’s do not consider risks and rewards on an economically rational basis?
• Limited value in developing a ‘risk – reward calculator’
• Alternative approach proposed
• Focus on learning from case studies using a qualitative approach
• Use specific examples to highlight types of risks that are identified by consumers themselves
– If appropriate, quantify risks and rewards in a selected number of examples
60

ST 3: Risks and Rewards
What is risk?
• The possibility of misfortune or loss and is generally defined as the combination of: – The probability / likelihood of an undesirable event or outcome
occurring; and
– The resulting consequences / impacts if the undesirable event occurs
and what is reward?
• The possibility of fortune or gain and is generally defined as the combination of: – The probability / likelihood of a desirable event or outcome
occurring; and
– The resulting consequences / impacts if the desirable event occurs

Undesirable/Desirable Outcomes? Undesirable Desirable
Money / financial
(£, $, €,
loyalty points)
Spend more on electricity
(ToU tariff & don’t/can’t shift
demand)
Spend less on electricity
(ToU tariff & do shift demand, or
already have favourable energy
profile)
Receive a penalty for not
delivering a demand reduction
(Demand Response contract)
Receive payments for delivering
demand reduction / energy efficiency
(Demand Response contract)
Time /
Inconvenience
(minutes / hours)
Can’t use appliances at times of
peak demand
Time saved (through use of remote /
automatic control of appliances?)
Additional time taken to shop
around (e.g. to choose a smart
appliance)

Undesirable/Desirable Outcomes?
Undesirable Desirable
Comfort
(degC / year of
over/under
heating)
Colder house (if heating poorly
controlled or interruption too long)
Improved comfort through
avoided over/under-heating
Hotter house (if air-condition
poorly controlled or interruption
too long)
Environmental
(kg CO2 / year)
Increased CO2 emissions
(operation of standby generators)
Reduced CO2 emissions
(avoided use of fossil fired
central generation)
‘Feel good’
(units ??)
‘Feel Bad’ if can’t do anything to
change pattern of demand
‘Feel Good’ factor (e.g. feeling
that ‘doing your bit’ to help
reduce impact on the climate)
Network Security
(CMLs, CIs)
Improved security of supply
(reduced instances of black-
outs/brown outs)

Undesirable/Desirable Outcomes?
Undesirable Desirable
Others that lead to the consequences already identified:
Safety
Fire arising from appliances
running unattended while home is
unoccupied
• Impacts will be financial, time,
loss of ‘feel good’
Remote / Automated systems
could provide warnings that
appliances have been left on
unattended, or that no electricity
use may indicate that an elderly
person needs assistance.
Privacy
Misuse of data (i.e. to plan a
burglary)
• Impacts will be financial, time,
loss of ‘feel good’
Data could be used to advantage
of customers (to indicate when
appliances are faulty)

Decision Making process
• There are many different factors that affect the decision making process
66

Ambiguity
effect
Negativity
bias
Ingroup bias False-
consensus
effect
Status quo
bias
Illusion-of-
truth effect
Irrational
escalation.
Forer effect. Primacy effect Positivity
effect
Less-is-
better effect
Anchoring Neglect of p
robability
Just-world
phenomenon
Functional
fixedness
Stereotyping. Illusory
correlation
Conjunction
fallacy
Pro-
innovation bias
Change bias Empathy gap. Loss aversion.
Availability
heuristic
Observation
selection
bias
Naive cynicism Forer effect or
Barnum effect
Subjective
validation
Leveling and
Sharpening
Conservatism
(Bayesian)
Reactance Conservatism
/ Regressive
Bias
Essentialism Mere exposure
effect
Availability
cascade
Observer-
expectancy
effect
Outgroup
homogeneity bias
Framing effect Survivorship
bias
Levels-of-
processing
effect
Contrast effect Reactive
devaluation
Consistency
bias
Exaggerated
expectation
Money illusion
Congruence
bias
Post-
purchaserati
onalization
Choice-
supportive bias
Illusion of
validity
Serial position
effect Processing diffi
culty effect Reminiscence
bump Rosy retrospect
ion Self-relevance
effect Self-
serving bias Subadditivity
effect
Backfire effect Omission
bias
Projection bias Frequency
illusion
Texas sharpsh
ooter fallacy
List-
length effect
Curse of
knowledge
Recency bias Context effect Experimenter's
or expectation
bias
Moral
credential
effect.
Bandwagon
effect
Optimism
bias
Self-serving bias Gambler's
fallacy
Time-
saving bias
Misinformation
effect.
Decoy effect Recency
illusion
Cross-race
effect
Illusory
correlation
Source
Confusion .
Base rate
fallacy
Ostrich
effect
System
justification
Hard-
easy effect
Unit bias Misattribution Denomination
effect
Restraint bias Cryptomnesia Impact bias Spacing effect
Belief bias Outcome
bias.
Trait ascription
bias
Hindsight bias Well travelled
road effect
Modality effect Distinction bias Rhyme as
reason effect
Egocentric bias Information
bias
Stereotypical
bias
Attentional
bias
Normalcy
bias
Moral luck Focusing effect Subadditivity
effect
Lag effect Conservatism /
regressive
bias
Pseudo
certainty effect
Childhood amn
esia
Endowment
effect
Ludic fallacy.
Bias blind
spot
Overconfide
nce effect
Ultimate attribution
error
Hostile media
effect
Zero-risk bias Mood-
congruent
memory bias
Duration
neglect
Risk
compensation.
Fading affect
bias
Insensitivity to
sample size
False
consensus
effect
Choice-
supportive
bias
Pareidolia. Worse-than-
average effect
Hot-
hand fallacy
Zero-
sum heuristic
Next-in-
line effect.
Selective
perception.
False memory Social
desirability bias
Humor effect Just-world
hypothesis
Clustering
illusion
Pessimism
bias
Memory errors and
biases
Hyperbolic
discounting.
Social
biases
Osborn effect Semmelweis
reflex
Generation
effect.
Dunning Kruger
effect
Persistence Hindsight bias
Confirmation
bias
Planning
fallacy
Bizarreness
effect
Illusion of
control
Actor-
observer bias
Part-list
cueing effect
Selection bias. Google effect Egocentric bias Picture
superiority
effect
Defensive
attribution
hypothesis
Social
comparison
bias
Placement
bias
Recency effect Zeigarnik effect Verbatim effect
Telescoping
effect
Peak-end rule
Extrinsic
incentives bias Fundamental
attribution error Tip of the
tongue Von Restorff
effect
Suggestibility. Suffix effect
Illusory
superiority
Illusion of
transparency
Illusion of
external
agency
Illusion of
asymmetric
insight
Halo effect
Group
attribution error
67

Selected Factors That Affect Decision Making in Smart Grid context
• Loss Aversion
• Framing Effect
• How risks are valued – Absolute vs Relative
• The amount / type of choices available
• Faulty Discounting
• Priming
68

Risks & Rewards are not treated in the same way
• The ‘pleasure’ of winning £100
vs
• The ‘pain’ of losing £100
‘pain’ of losing £100 = 2+ x ‘pleasure’ of winning £100
As a result – losses and gains are treated differently
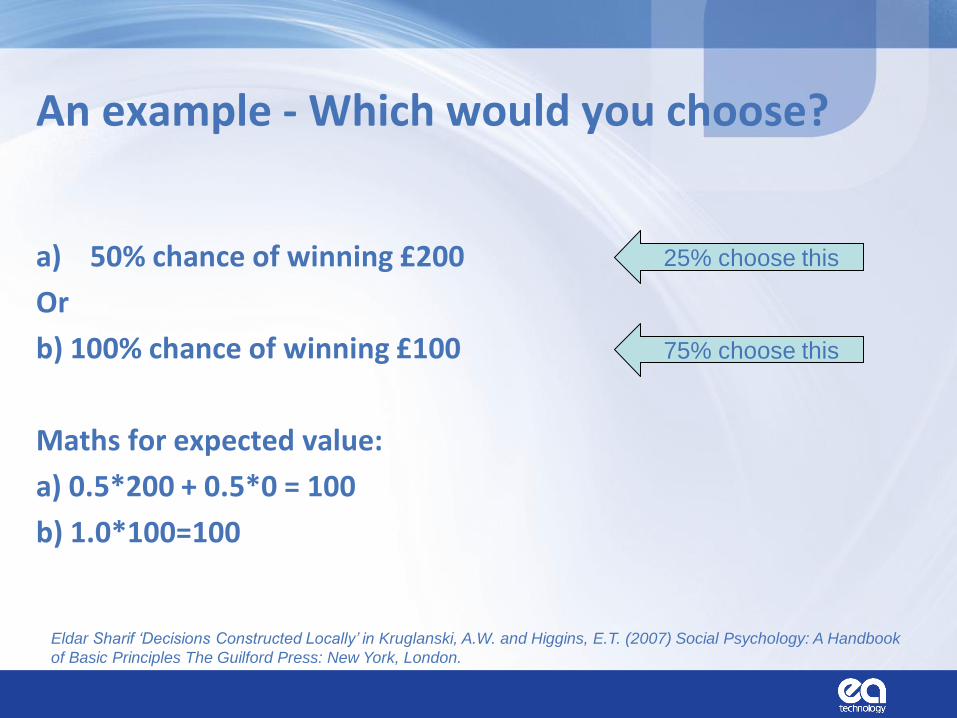
An example - Which would you choose?
a) 50% chance of winning £200
Or
b) 100% chance of winning £100
Maths for expected value:
a) 0.5*200 + 0.5*0 = 100
b) 1.0*100=100
25% choose this
75% choose this
Eldar Sharif ‘Decisions Constructed Locally’ in Kruglanski, A.W. and Higgins, E.T. (2007) Social Psychology: A Handbook
of Basic Principles The Guilford Press: New York, London.

An example - Which would you choose?
a) 50% chance of losing £200
Or
b) 100% chance of losing £100
Maths for expected value:
a) 0.5*200 + 0.5*0 = 100
b) 1.0*100 = 100
65% choose this
35% choose this
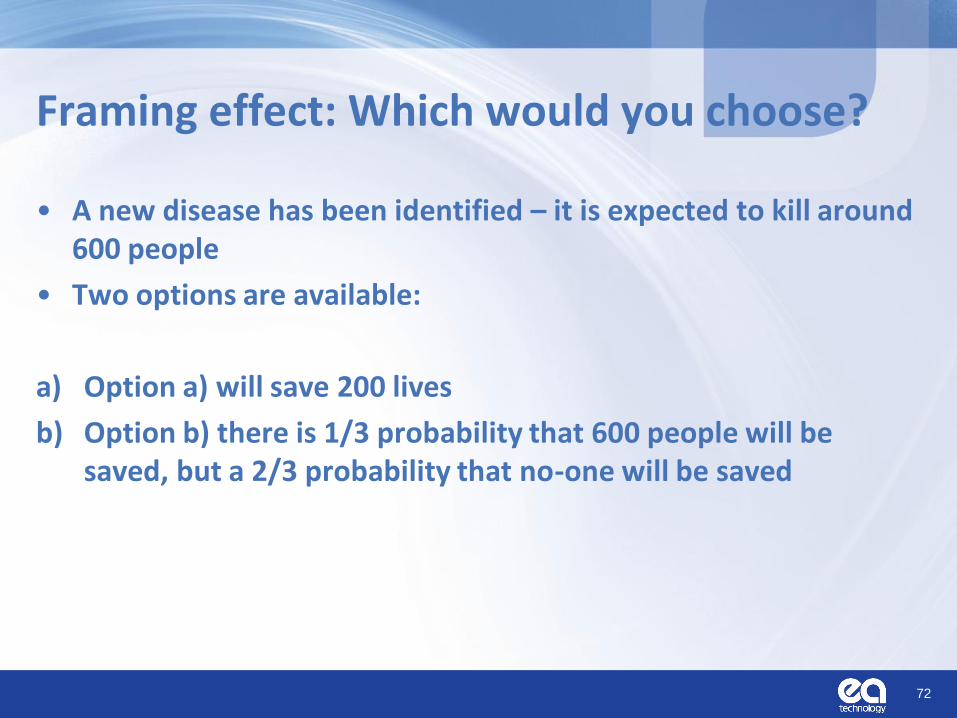
Framing effect: Which would you choose?
• A new disease has been identified – it is expected to kill around 600 people
• Two options are available:
a) Option a) will save 200 lives
b) Option b) there is 1/3 probability that 600 people will be saved, but a 2/3 probability that no-one will be saved
72

What about now?
• A new disease has been identified – it is expected to kill around 600 people
• What if you are given these two options:
c) Option c) 400 people will die
d) there is 1/3 probability that no-one will die, but a 2/3 probability that everyone will die
73

Benefits & Risks not valued in absolute terms
Example 1:
• You are just about to buy a new pen: – Arrive at the shop and see it for $25
– A shopper says
• “You can get the same pen in a store a 15 minute drive away for $18”
– Would you drive 15 mins to save $7?
– Most people say they would
74
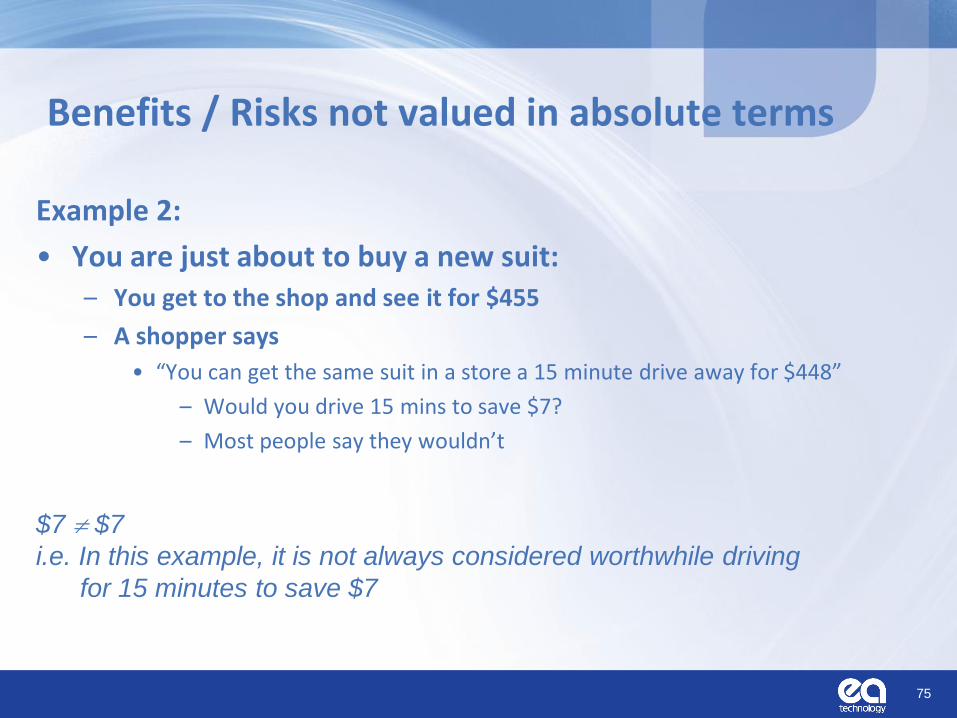
Benefits / Risks not valued in absolute terms
Example 2:
• You are just about to buy a new suit: – You get to the shop and see it for $455
– A shopper says
• “You can get the same suit in a store a 15 minute drive away for $448”
– Would you drive 15 mins to save $7?
– Most people say they wouldn’t
75
$7 $7
i.e. In this example, it is not always considered worthwhile driving
for 15 minutes to save $7

Faulty Discounting
• People (generally) do not discount linearly with time
• Would you rather receive $100 now or $110 tomorrow? – More people prefer to receive $100 now rather than £110 in a day’s time
• Would you rather receive $100 in 30 days, or $110 in 31 days’ time? – Very few people choose £100 after 30 days’ time if they have the option to
choose £110 in 31 days’ time instead.
• Both options involve choosing whether or not to gain an additional £10 by delaying payment by one day. – Referred to as Hyperbolic discounting
– People tend to prefer to receive a smaller reward sooner rather than a larger reward later
• But this changes as the reward gets further into the future
76

Priming
• Consumers remember an item best in the form and context in which they first learned about it
77

Quantifying risks/rewards
– an example
78

Loft Insulation - example
• Rewards:- ~ £180/year reduced heating bill
~ 730kg/year reduced CO2 emissions
79 Source: Energy Saving Trust, http://www.energysavingtrust.org.uk/Insulation/Roof-and-loft-insulation
Based on three bedroomed semi-detached house, with no insulation, heated with gas

Loft Insulation
• Risks (example numbers only!!!):-
80
Type Consequence Probability Risk
Scratched paintwork €30 0.33 € 10
Damaged ceiling €200 0.01 € 2
Time (sorting) 8 hours 1 € 80
Damage to wiring €150 0.001 < € 1
Theft of valuable item €1000 .0004 < € 1
Total € 94
Is there another example?

ST 3: Risks and Rewards
81
What we said we would do
Activity Status
Produce a matrix showing the
interrelationship between industry
stakeholder needs and customer
needs
Cost Share On-going
Identify specific case studies or
example scenarios Cost Share / Task Share In parallel with ST2
Identify risks and rewards arising
from case study / scenario analysis Cost Share / Task Share On-going
Develop a risk-reward calculator Cost Share -
Impact of markets
Interaction with
technology
Risks and
Rewards
Definition of
offers and
programs
Synthesis and
Dissemination
Customer perspective

Stakeholder Needs
Want / opportunity Measure
Government Delivery of energy policy, meeting of
renewables and emissions targets
MW of installed renewable
generation
Number of electric cars
Installations of heat pumps etc.
Generators
(decentralised)
To be able to dispatch / store all electricity
generated Generating plant not constrained off
Suppliers
Best use of available resources and
therefore minimising energy costs
Smart meters will enable suppliers to
provide energy advice / tailored solutions
to customers
Meeting CO2 reduction obligations
Increased profitability
Improved customer satisfaction
leading to reduced customer churn
Reduction in CO2
Distribution Network
Operators
Facilitate the move to a low carbon
economy
Alleviate network constraints
Development of network in cost-effective
manner
Deferment or avoidance of network
investment
Optimised use of the existing
network
System Operator Sufficient resources to maintain balance
of supply and demand in real time System Availability
Appliance
Developers /
Manufacturers
Opportunities to develop smart equipment
/ appliances Number of appliances sold
82

Customer Needs
Want / need Examples
Customer Tangible benefits
Cost savings
Time savings
Incentives
(Improved comfort)
Information on usage / learning
Customer Autonomy
Choice (products / tariffs / service offering)
Control over home environment
Control over how information is shared / used
Some customer groups "Feel good" factor Reduced emissions / impact on climate
83

The interrelationship between industry stakeholder needs and customer needs
84
Cost savings Customers
Suppliers
Network
operators Behavioural Changes
Reduced energy
costs
ToU Tariff Deferred / avoided
CAPEX
Increased
profitability
Reduced network
charges
Outperform
regulatory targets Increased
profit

The interrelationship between industry stakeholder needs and customer needs
85
Information /
learning Customers
Cost savings
Suppliers
Network
Operators
Smart meter
data
Improved utilisation /
optimisation of network
assets
Improved
customer
satisfaction
Customer
retention
Increased
profits
Reduced energy
costs
Behavioural
changes
Reduced CO2
emissions
Carbon Emissions
Reduction
Obligation
Reduced network
charges Cost savings
Outperform
regulatory targets
Increased
profit

Matrix of needs / Interrelationship
• Use of flow charts rather than a matrix – Is this acceptable?
– Is this useful?
• Which other ‘scenarios’ should be considered?
86

ST 3: Risks and Rewards
87
What we said we would do
Activity Status Produce a matrix showing
the interrelationship
between industry
stakeholder needs and
customer needs
Cost Share On-going
Identify specific case
studies or example
scenarios
Cost Share / Task Share In parallel with ST2
Identify risks and rewards
arising from case study /
scenario analysis
Cost Share / Task Share On-going
Develop a risk-reward
calculator Cost Share Selected example(s)
Impact of markets
Interaction with
technology
Risks and
Rewards
Definition of
offers and
programs
Synthesis and
Dissemination
Customer perspective

Agenda Day Two: Friday 5th July
09:00 Sub-task 3:
Re-cap on aims / objectives of sub-task
Review of progress
Identify any gaps
Agree way forward
10:00 Sub-task 4:
Re-cap on aims / objectives of sub-task
Agree way forward
10:45 Break
11:00 Sub-task 5:
Re-cap on aims / objectives of sub-task
Agree way forward
11:45 Date / location of next meeting
What happens at end of current work programme?
12:00 Lunch
13:00 Close
88

Impact of
markets
Interaction with
technology
Risks and
Rewards
Definition
of offers
and
programs
Synthesis and
Dissemination
Customer perspective
Overview

Sub-task 4: What we said we would do
90
Activity Approach
Review of different approaches to
the implementation of Smart Grids
Operating Agent /
Participants
Cost Share /
Task Share
Identify examples of best practice Operating Agent Cost Share
Identify tools and measures Operating Agent Cost Share
Quantify potential impact of the
implementation of selected tools on
implementation of Smart Grids
Operating Agent Cost Share

Subtask4: Overview of proposal
• Smart Grid Implementation Requirements in order to achieve customer ‘buy-in’: – need to provide tangible benefits to customers
– need to minimise risks to customers
– What things should / could be mandated?
– What things should / could be standardised?
91
“The grid has gotten smarter over the last few years, but it has not captured the
imagination of mainstream consumers. Why? It’s because most people can’t
figure out how the smart grid improves their daily lives”, Gene Wang
http://www.smartgridnews.com/artman/publish/Business_Consumer_Engagement/Smart-homes-for-the-smart-grid-5818.html#.UdGSBZ1wapo
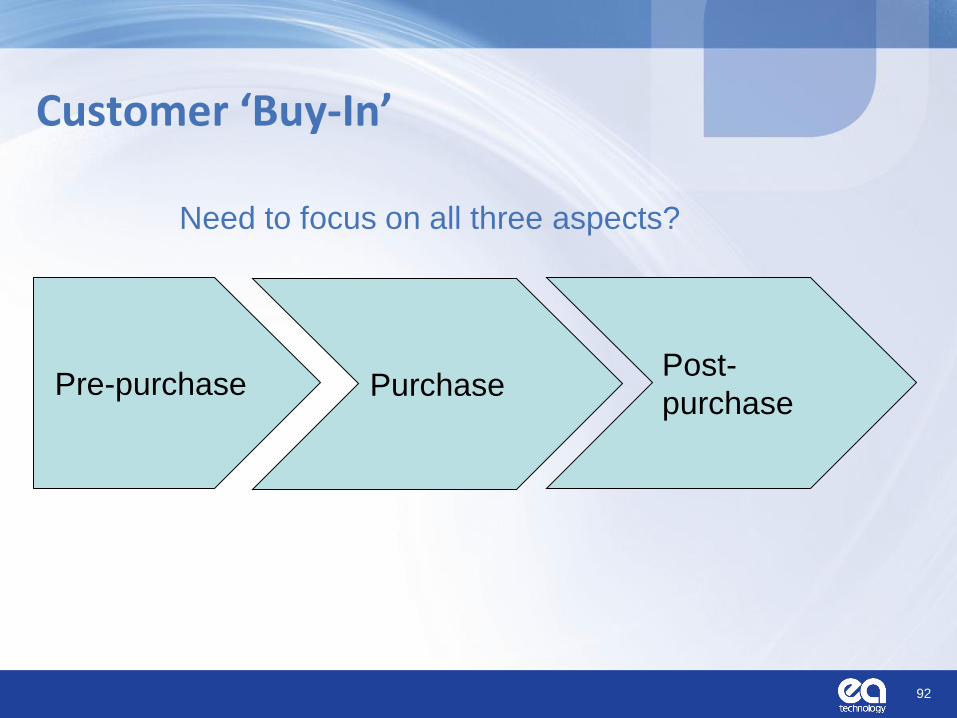
Customer ‘Buy-In’
92
Pre-purchase Purchase Post-
purchase
Need to focus on all three aspects?

Customer ‘Buy-In’
93
Pre-purchase Purchase Post-
purchase
Do I need to buy a car?
• Do I already have a car?
- Is it suitable for my needs?
• Can I use public transport?
• Can I walk/cycle?
What kind of car do I buy?
• A family car
• Car with lots of safety features
• A car that ‘looks good’
• A car that doesn’t cost too much
- to buy
- to run
- to maintain
How do I use my car
• Drive as efficiently as possible
• Always maintained / serviced
• Walk short distances
Car buying example

Car Advertising – target audiences
94
Family car
Sports car
Electric car
Offering:
• tailored to meet specific
needs of target audience
What is the target
audience for smart
grids?

Target market for Smart Grid offerings
Segmentation for dynamic pricing structures (Duneworks)
• Segment 1: Idealistic savers
• Segment 2: Selfless inconsistent energy savers
• Segment 3: Thrifty energy savers
• Segment 4: Materialistic energy consumers
• Segment 5: Comfort-oriented indifferent energy consumers
• Segment 6: Problem Conscious welfare oriented energy consumers
95

Toolbox of options
96

Options for Segment 1
97
Segmentation approach
• Is the Segmentation approach useful for Task 23
• Are the Segments appropriate for Task 23
98

Designing Offers – initial thoughts
• Tariffs: – Some choice (not too much / not too little)
– Default position needs to be chosen carefully
• What is the social norm?
• Technology: – Standards to ensure key technologies are compatible with DSR
• Heat pumps
• Electric vehicles
• Air-conditioners
– Appliances
• Need to prove benefits of smart appliances first
99
Allows possibility for customers to
participate in DSR in the future

Designing Offers – initial thoughts
• Feedback (In Home Displays):
• Advice / Education – 1 on 1 advice is very effective but very expensive
– Wide-scale customer campaigns can be effective
• Switch-over to Digital TV in UK
10
0
Mandated
Ensures all customers have
opportunity to receive feedback
‘one-size’ does not fit all
Optional Provides customers with choice
(do they want feedback and how
do they want to receive it)
Many reasons why customers
will not ‘take-up’ feedback

Key Requirements For Successful Smart Grids
• Access: – To information and communication networks
• Choice – Of products, partners and service offerings
• Control – Over the home environment and private information
• Value – From new services, products and quality of life
• Others
10
1
Tendril “A Vision of the Consumer Smart Grid”

Discussion
• Approach?
• Next steps?
• Outputs?
10
2
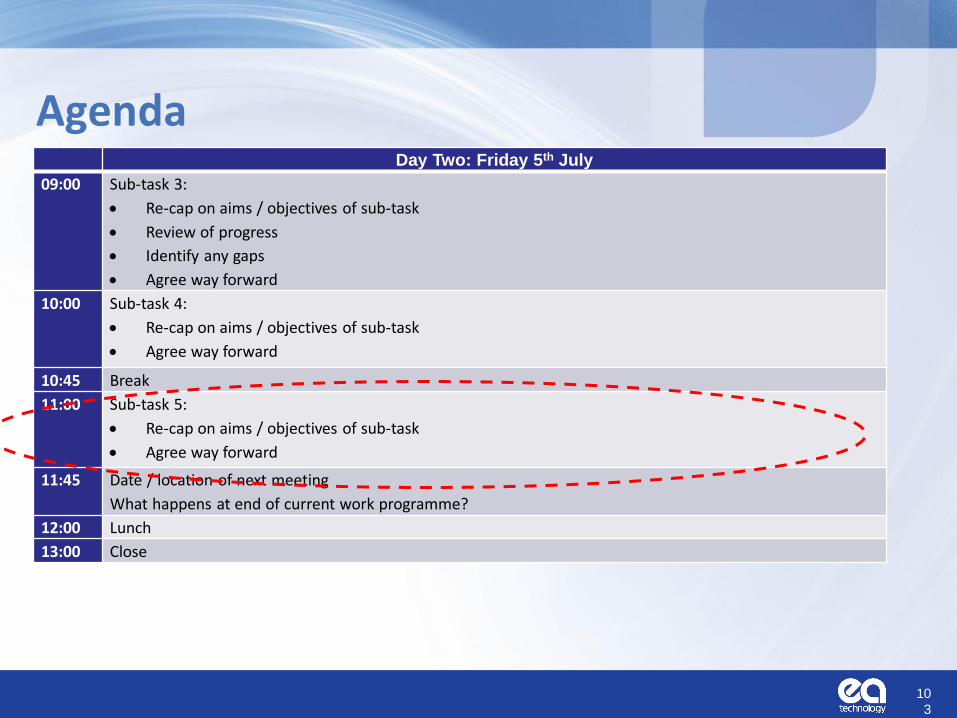
Agenda Day Two: Friday 5th July
09:00 Sub-task 3:
Re-cap on aims / objectives of sub-task
Review of progress
Identify any gaps
Agree way forward
10:00 Sub-task 4:
Re-cap on aims / objectives of sub-task
Agree way forward
10:45 Break
11:00 Sub-task 5:
Re-cap on aims / objectives of sub-task
Agree way forward
11:45 Date / location of next meeting
What happens at end of current work programme?
12:00 Lunch
13:00 Close
10
3
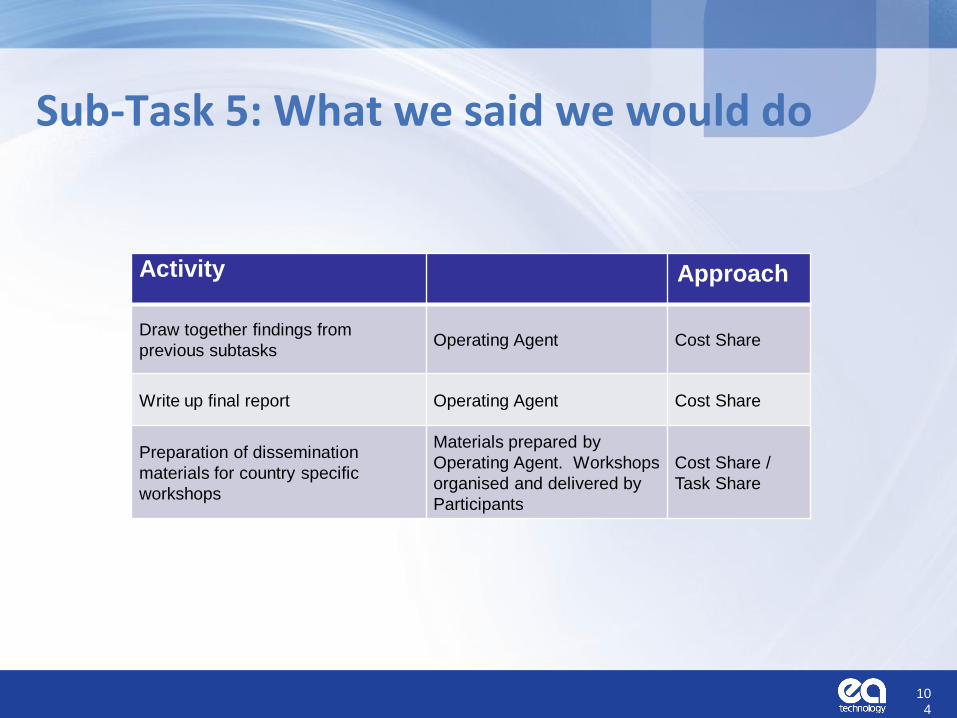
Sub-Task 5: What we said we would do
10
4
Activity Approach
Draw together findings from
previous subtasks Operating Agent Cost Share
Write up final report Operating Agent Cost Share
Preparation of dissemination
materials for country specific
workshops
Materials prepared by
Operating Agent. Workshops
organised and delivered by
Participants
Cost Share /
Task Share

Sub-Task 5
• What are National Experts planning for the dissemination phase? – What materials are required?
• Power-point
• Executive summary
• Newsletter articles
10
5
Discussion of what needed

Work Programme
10
6
Jun
-12
Jul-
12
Au
g-1
2
Sep
-12
Oct
-12
No
v-1
2
De
c-1
2
Jan
-13
Feb
-13
Mar
-13
Ap
r-1
3
May
-13
Jun
-13
Jul-
13
Au
g-1
3
Sep
-13
Oct
-13
No
v-1
3
1 2 3 4 5 6 7 8 9 10 11 12 13 14 15 16 17 18
Subtask 1 Impact of markets
Subtask 2 Impact of technologies
Subtask 3 Risks and Rewards
Subtask 4 Tools
Subtask 5 Dissemination
Forecast
Planned
Actual
Planned
Actual
Planned
Actual
Planned
Forecast
Planned

Summary
• Re-cap on agreed actions – Sub-task 2
– Sub-task 3
– Sub-task 4
– Sub-task 5
• Date / Location of Final Meeting
10
7