Targeting those most at risk from firecouncilmeetings.lewisham.gov.uk/documents/s22987/Appendix B -...
10
Targeting those most at risk from fire Fifth London Safety Plan Supporting document No.5 Consultation draft March 2013
Transcript of Targeting those most at risk from firecouncilmeetings.lewisham.gov.uk/documents/s22987/Appendix B -...
Targeting those most at risk from fire
Fifth London Safety Plan
Supporting document No.5
Consultation draft
March 2013
Page 1
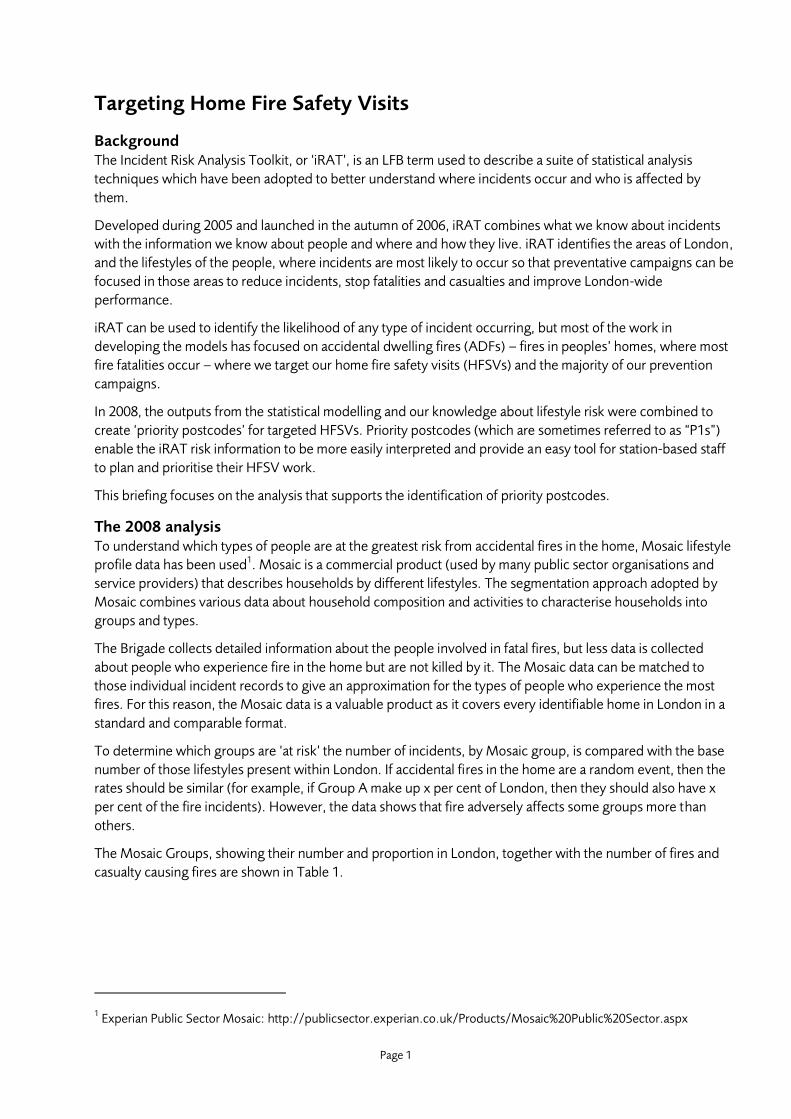
Targeting Home Fire Safety Visits
Background The Incident Risk Analysis Toolkit, or ‘iRAT’, is an LFB term used to describe a suite of statistical analysis
techniques which have been adopted to better understand where incidents occur and who is affected by
them.
Developed during 2005 and launched in the autumn of 2006, iRAT combines what we know about incidents
with the information we know about people and where and how they live. iRAT identifies the areas of London,
and the lifestyles of the people, where incidents are most likely to occur so that preventative campaigns can be
focused in those areas to reduce incidents, stop fatalities and casualties and improve London-wide
performance.
iRAT can be used to identify the likelihood of any type of incident occurring, but most of the work in
developing the models has focused on accidental dwelling fires (ADFs) – fires in peoples’ homes, where most
fire fatalities occur – where we target our home fire safety visits (HFSVs) and the majority of our prevention
campaigns.
In 2008, the outputs from the statistical modelling and our knowledge about lifestyle risk were combined to
create ‘priority postcodes’ for targeted HFSVs. Priority postcodes (which are sometimes referred to as “P1s”)
enable the iRAT risk information to be more easily interpreted and provide an easy tool for station-based staff
to plan and prioritise their HFSV work.
This briefing focuses on the analysis that supports the identification of priority postcodes.
The 2008 analysis To understand which types of people are at the greatest risk from accidental fires in the home, Mosaic lifestyle
profile data has been used1. Mosaic is a commercial product (used by many public sector organisations and
service providers) that describes households by different lifestyles. The segmentation approach adopted by
Mosaic combines various data about household composition and activities to characterise households into
groups and types.
The Brigade collects detailed information about the people involved in fatal fires, but less data is collected
about people who experience fire in the home but are not killed by it. The Mosaic data can be matched to
those individual incident records to give an approximation for the types of people who experience the most
fires. For this reason, the Mosaic data is a valuable product as it covers every identifiable home in London in a
standard and comparable format.
To determine which groups are ‘at risk’ the number of incidents, by Mosaic group, is compared with the base
number of those lifestyles present within London. If accidental fires in the home are a random event, then the
rates should be similar (for example, if Group A make up x per cent of London, then they should also have x
per cent of the fire incidents). However, the data shows that fire adversely affects some groups more than
others.
The Mosaic Groups, showing their number and proportion in London, together with the number of fires and
casualty causing fires are shown in Table 1.
1 Experian Public Sector Mosaic: http://publicsector.experian.co.uk/Products/Mosaic%20Public%20Sector.aspx
Page 2
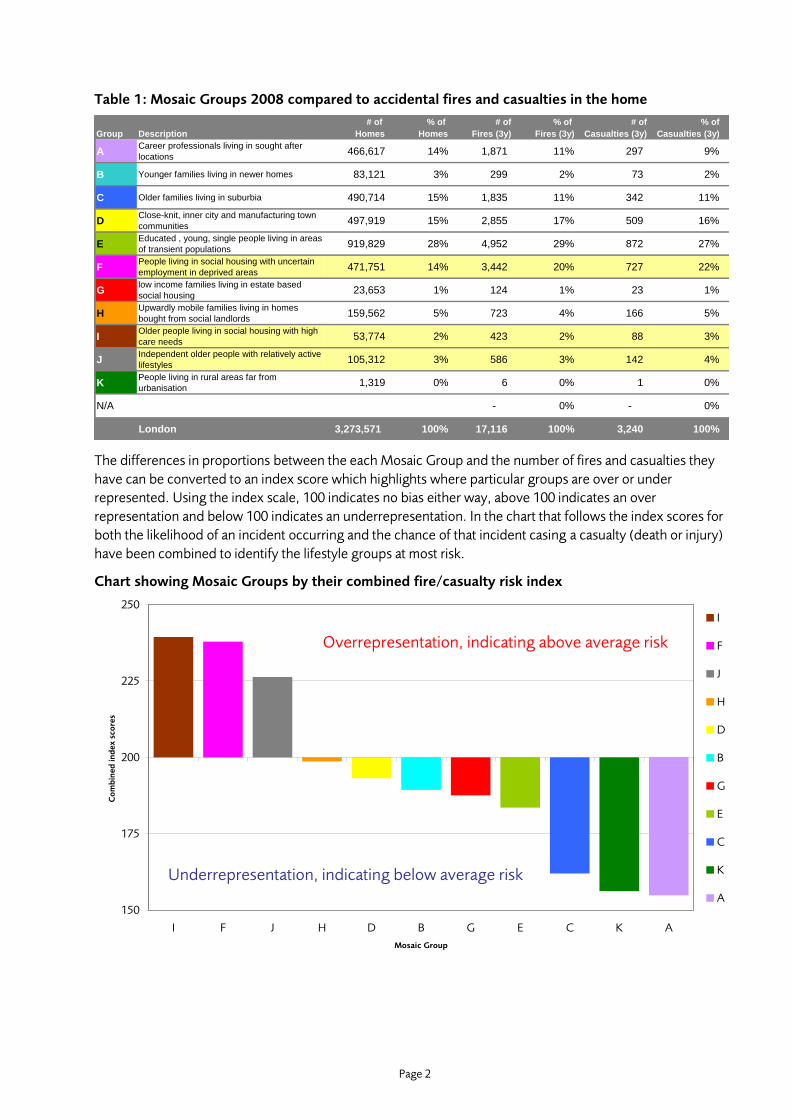
Table 1: Mosaic Groups 2008 compared to accidental fires and casualties in the home
The differences in proportions between the each Mosaic Group and the number of fires and casualties they
have can be converted to an index score which highlights where particular groups are over or under
represented. Using the index scale, 100 indicates no bias either way, above 100 indicates an over
representation and below 100 indicates an underrepresentation. In the chart that follows the index scores for
both the likelihood of an incident occurring and the chance of that incident casing a casualty (death or injury)
have been combined to identify the lifestyle groups at most risk.
Chart showing Mosaic Groups by their combined fire/casualty risk index
# of % of # of % of # of % of Fires per
Group Description Homes Homes Fires (3y) Fires (3y) Casualties (3y) Casualties (3y) 10,000 Homes
ACareer professionals living in sought after
locations 466,617 14% 1,871 11% 297 9% 13
B Younger families living in newer homes 83,121 3% 299 2% 73 2% 12
C Older families living in suburbia 490,714 15% 1,835 11% 342 11% 12
DClose-knit, inner city and manufacturing town
communities 497,919 15% 2,855 17% 509 16% 19
EEducated , young, single people living in areas
of transient populations 919,829 28% 4,952 29% 872 27% 18
FPeople living in social housing with uncertain
employment in deprived areas 471,751 14% 3,442 20% 727 22% 24
Glow income families living in estate based
social housing 23,653 1% 124 1% 23 1% 17
HUpwardly mobile families living in homes
bought from social landlords 159,562 5% 723 4% 166 5% 15
IOlder people living in social housing with high
care needs 53,774 2% 423 2% 88 3% 26
JIndependent older people with relatively active
lifestyles 105,312 3% 586 3% 142 4% 19
KPeople living in rural areas far from
urbanisation 1,319 0% 6 0% 1 0% 15
N/A - 0% - 0%
London 3,273,571 100% 17,116 100% 3,240 100% 17
150
175
200
225
250
I F J H D B G E C K A
Mosaic Group
Co
mb
ine
d in
de
x s
core
s
I
F
J
H
D
B
G
E
C
K
A
Underrepresentation, indicating below average risk
Overrepresentation, indicating above average risk
Page 3
From this analysis the target groups for home fire safety visits were identified as groups I, F and J. A summary
description of the lifestyles of those groups is presented below2;
Group I – generally consists of elderly people who are mostly reliant on state benefits, and live in
housing designed by local authorities and housing associations. Some live in old people's homes or
sheltered accommodation, while others live in small bungalows, set in small enclaves within larger
council estates. Most of these people spend money only on the basic necessities of life.
Group F – is comprised of many people who are struggling to achieve the material and personal
rewards that are assumed to be open to all in an affluent society. Few hold down rewarding or well
paying jobs and, as a result, most rely on the council for their accommodation, on public transport to
get around and on state benefits to fund even the bare essentials. The lack of stability in many family
formations undermines social networks and leads to high levels of anti-social behaviour among local
children.
Group J – consists mostly of pensioners who own their homes and who have some source of
income beyond the basic state pension. Many of these people have, on retirement, moved to the
seaside or the countryside to live among people similar to themselves. Today many of these people
have quite active lifestyles and are considered in their purchasing decisions.
2008 Summary From the 2008 analysis around 630,000 homes were identified as being in a Priority Postcode. This
represented 19 per cent of the homes in London which accounted for 26 per cent of the accidental dwelling
fires and 30 per cent of the casualties they caused.
Mosaic’s new public sector segmentation
The postcode and household details in Mosaic are updated annually (so allowing new homes to be
incorporated), but at the end of 2009 Experian (the providers of Mosaic) undertook a detailed update of the
Mosaic Public Sector product. This update involved a whole new segmentation analysis to create a new set of
Groups and Types. It isn’t surprising that there are similarities between the profiles of the lifestyles in the two
segmentations, but Mosaic 2009 has 15 Groups (compared with 11 previously) and 69 Types (compared to 64
previously).
Updating the priority postcode analysis As with the analysis undertaken in 2008, the new Mosaic segmentation data has been used with the Brigades
incident data so that comparisons can be made between the proportions of each type of lifestyle in London
and the number of incidents they experience.
2 Multimedia Guide to Mosaic Public Sector – Summary descriptions
Page 4
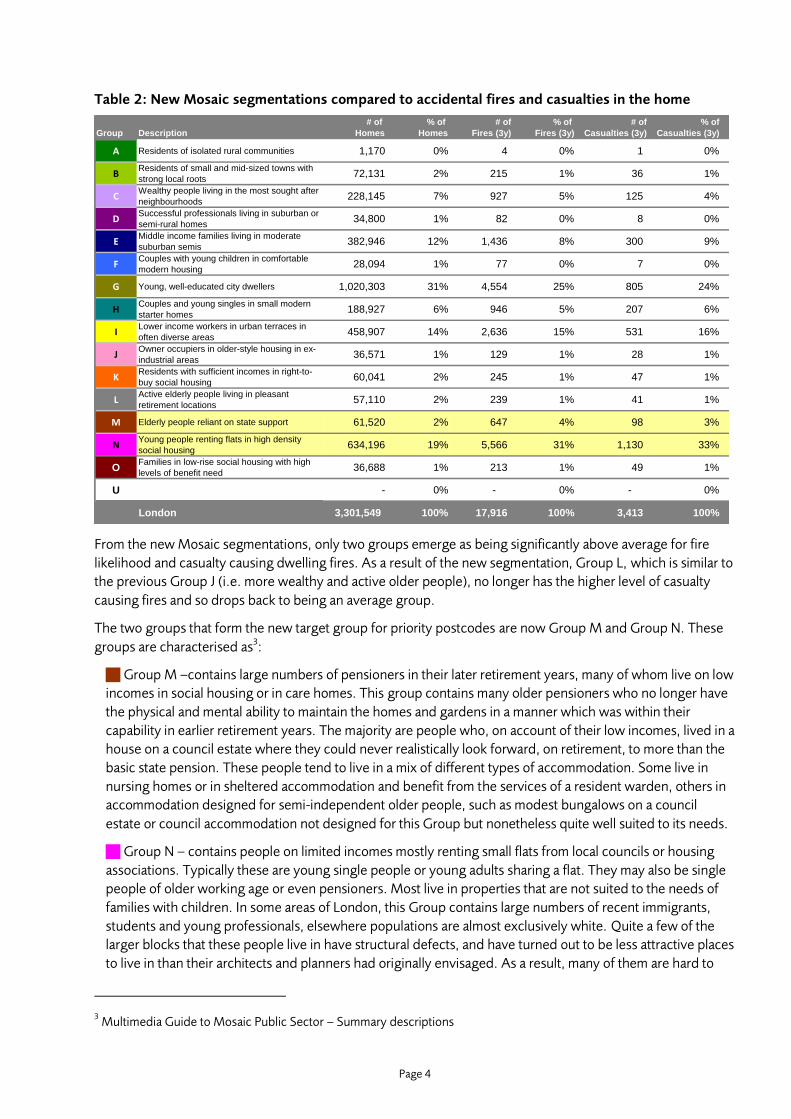
Table 2: New Mosaic segmentations compared to accidental fires and casualties in the home
From the new Mosaic segmentations, only two groups emerge as being significantly above average for fire
likelihood and casualty causing dwelling fires. As a result of the new segmentation, Group L, which is similar to
the previous Group J (i.e. more wealthy and active older people), no longer has the higher level of casualty
causing fires and so drops back to being an average group.
The two groups that form the new target group for priority postcodes are now Group M and Group N. These
groups are characterised as3:
Group M –contains large numbers of pensioners in their later retirement years, many of whom live on low
incomes in social housing or in care homes. This group contains many older pensioners who no longer have
the physical and mental ability to maintain the homes and gardens in a manner which was within their
capability in earlier retirement years. The majority are people who, on account of their low incomes, lived in a
house on a council estate where they could never realistically look forward, on retirement, to more than the
basic state pension. These people tend to live in a mix of different types of accommodation. Some live in
nursing homes or in sheltered accommodation and benefit from the services of a resident warden, others in
accommodation designed for semi-independent older people, such as modest bungalows on a council
estate or council accommodation not designed for this Group but nonetheless quite well suited to its needs.
Group N – contains people on limited incomes mostly renting small flats from local councils or housing
associations. Typically these are young single people or young adults sharing a flat. They may also be single
people of older working age or even pensioners. Most live in properties that are not suited to the needs of
families with children. In some areas of London, this Group contains large numbers of recent immigrants,
students and young professionals, elsewhere populations are almost exclusively white. Quite a few of the
larger blocks that these people live in have structural defects, and have turned out to be less attractive places
to live in than their architects and planners had originally envisaged. As a result, many of them are hard to
3 Multimedia Guide to Mosaic Public Sector – Summary descriptions
# of % of # of % of # of % of Fires per
Group Description Homes Homes Fires (3y) Fires (3y) Casualties (3y) Casualties (3y) 10,000 Homes
A Residents of isolated rural communities 1,170 0% 4 0% 1 0% 11
BResidents of small and mid-sized towns with
strong local roots 72,131 2% 215 1% 36 1% 10
CWealthy people living in the most sought after
neighbourhoods 228,145 7% 927 5% 125 4% 14
DSuccessful professionals living in suburban or
semi-rural homes 34,800 1% 82 0% 8 0% 8
EMiddle income families living in moderate
suburban semis 382,946 12% 1,436 8% 300 9% 12
FCouples with young children in comfortable
modern housing 28,094 1% 77 0% 7 0% 9
G Young, well-educated city dwellers 1,020,303 31% 4,554 25% 805 24% 15
HCouples and young singles in small modern
starter homes 188,927 6% 946 5% 207 6% 17
ILower income workers in urban terraces in
often diverse areas 458,907 14% 2,636 15% 531 16% 19
JOwner occupiers in older-style housing in ex-
industrial areas 36,571 1% 129 1% 28 1% 12
KResidents with sufficient incomes in right-to-
buy social housing 60,041 2% 245 1% 47 1% 14
LActive elderly people living in pleasant
retirement locations 57,110 2% 239 1% 41 1% 14
M Elderly people reliant on state support 61,520 2% 647 4% 98 3% 35
NYoung people renting flats in high density
social housing 634,196 19% 5,566 31% 1,130 33% 29
OFamilies in low-rise social housing with high
levels of benefit need 36,688 1% 213 1% 49 1% 19
U - 0% - 0% - 0%
London 3,301,549 100% 17,916 100% 3,413 100% 18
Page 5
let. In the smaller blocks, especially in London and in Scotland, there are a number of parents with young
children sometimes living in conditions of serious overcrowding. Not necessarily living in housing of their
own choice, many residents are disadvantaged by living among neighbours who suffer seriously high levels
of unemployment and sickness, and who experience low incomes and high levels of social deprivation.
At this stage of the analysis priority postcodes would make up 21 per cent of the homes in London and
account for 35 per cent of the accidental dwelling fires and 36 per cent of the casualties they have caused. This
is a marked increase in the effectiveness of Priority Postcode targeting as a result of the new segmentation.
Improving performance in outer London boroughs Given the characteristic of Group N, it is not surprising that the majority of postcodes of this type are located
towards inner London. For example, in an inner London Borough, priority postcodes can make up around 56
per cent of the homes in the borough and account for 63 per cent of the dwelling fires and 71 per cent of the
casualties. Whereas in an outer London borough, priority postcodes could make up only two per cent of the
homes in the borough and account for five per cent of the dwelling fires and five per cent of the casualties.
This in itself is not a problem. But as fire engines are for the most part located in their own stations, there is a
need to identify sufficient and appropriate local work (local risk) for those crews to carry out. For this reason a
way of identifiying the local risks of outer London boroughs was considered.
The 15 Mosaic Groups can be further segmented into 69 different Types. Analysis was undertaken to see
whether any of the Types in Groups N and M presented less risk, and if that was the case (and therefore could
be excluded from the total), were there any Types in the outer-London boroughs that presented a notable
local risk (and should be added into the Priority Postcode list).
From the Type analysis of Groups N and M, four Types were found to have lower risk likelihood scores and
were excluded from the target group (a reduction of 74,000 homes). Fourteen boroughs were examined for
local risk factors and 85,000 homes in these boroughs were added to the Priority Postcode target list.
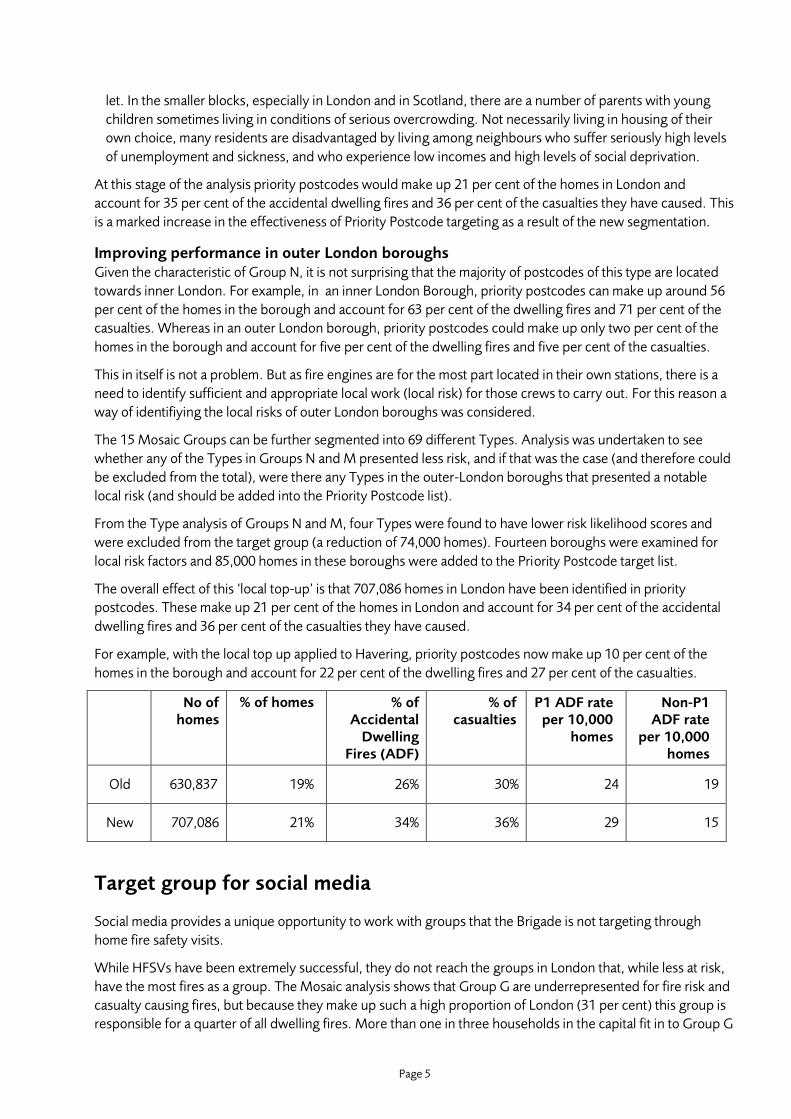
The overall effect of this ‘local top-up’ is that 707,086 homes in London have been identified in priority
postcodes. These make up 21 per cent of the homes in London and account for 34 per cent of the accidental
dwelling fires and 36 per cent of the casualties they have caused.
For example, with the local top up applied to Havering, priority postcodes now make up 10 per cent of the
homes in the borough and account for 22 per cent of the dwelling fires and 27 per cent of the casualties.
No of homes
% of homes % of Accidental
Dwelling Fires (ADF)
% of casualties
P1 ADF rate per 10,000
homes
Non-P1 ADF rate
per 10,000 homes
Old 630,837 19% 26% 30% 24 19
New 707,086 21% 34% 36% 29 15
Target group for social media
Social media provides a unique opportunity to work with groups that the Brigade is not targeting through
home fire safety visits.
While HFSVs have been extremely successful, they do not reach the groups in London that, while less at risk,
have the most fires as a group. The Mosaic analysis shows that Group G are underrepresented for fire risk and
casualty causing fires, but because they make up such a high proportion of London (31 per cent) this group is
responsible for a quarter of all dwelling fires. More than one in three households in the capital fit in to Group G
Page 6
– a lifestyle our communications team describe as YEPILs; Young Educated People In London. Trying to
encourage this group of Londoners to change their behaviour in order to reduce fires has proven a particularly
difficult challenge as they do not respond to direct forms of communication - such as local newspaper articles
or HFSVs - that have proven effective with other groups of Londoners.
With YEPILs being heavy users of Web 2.0 (two-way rather than a one-way broadcast form of
communication), and in particular social media, the Brigade will use the social media opportunities to help
facilitate behavioural change to help Londoners help protect themselves from fire. We have already been able
to demonstrate, through the use of short term social media campaigns, how we can reduce fires in this
particular group. However, in the coming years, we will expand this work to develop more opportunities to
nudge people into protecting themselves from fire.
Source note: Some of this document is an extract from report FEP1740 “Home fire safety visits (HFSVs)
– targeting those most at risk from fire” considered at a meeting of the LFEPA Community Safety
Committee on 9 June 2011.
Page 7
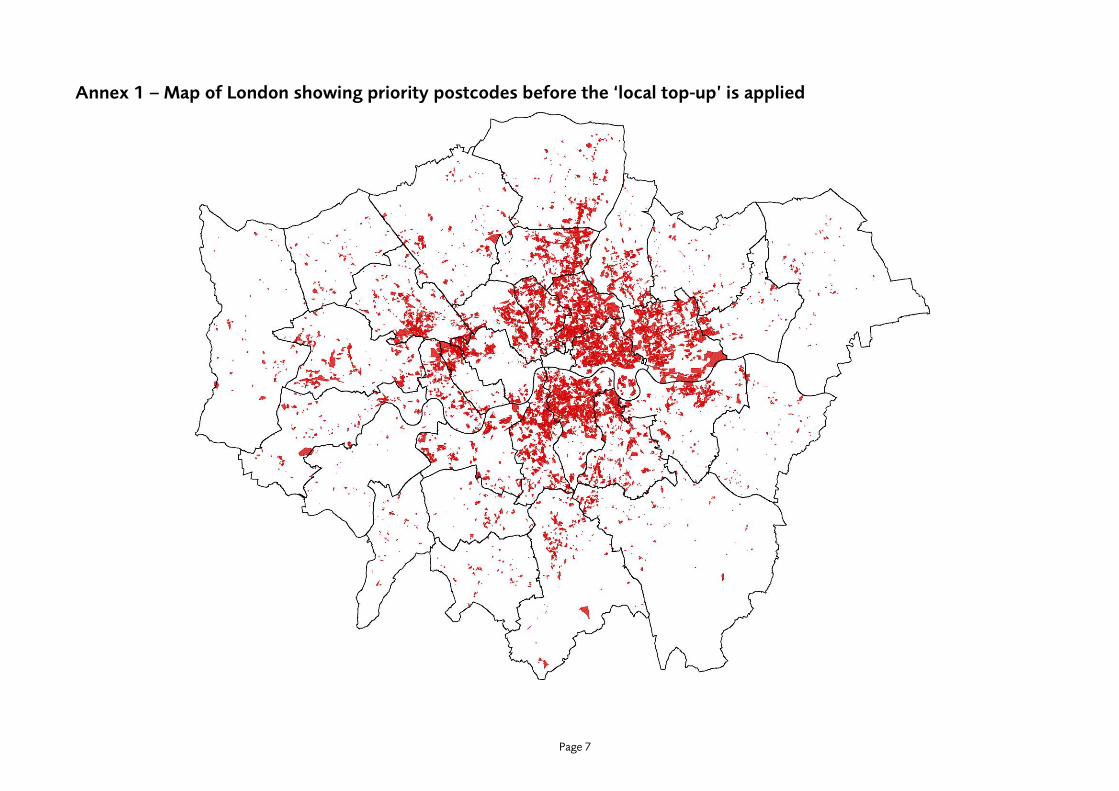
Annex 1 – Map of London showing priority postcodes before the ‘local top-up’ is applied
Page 8
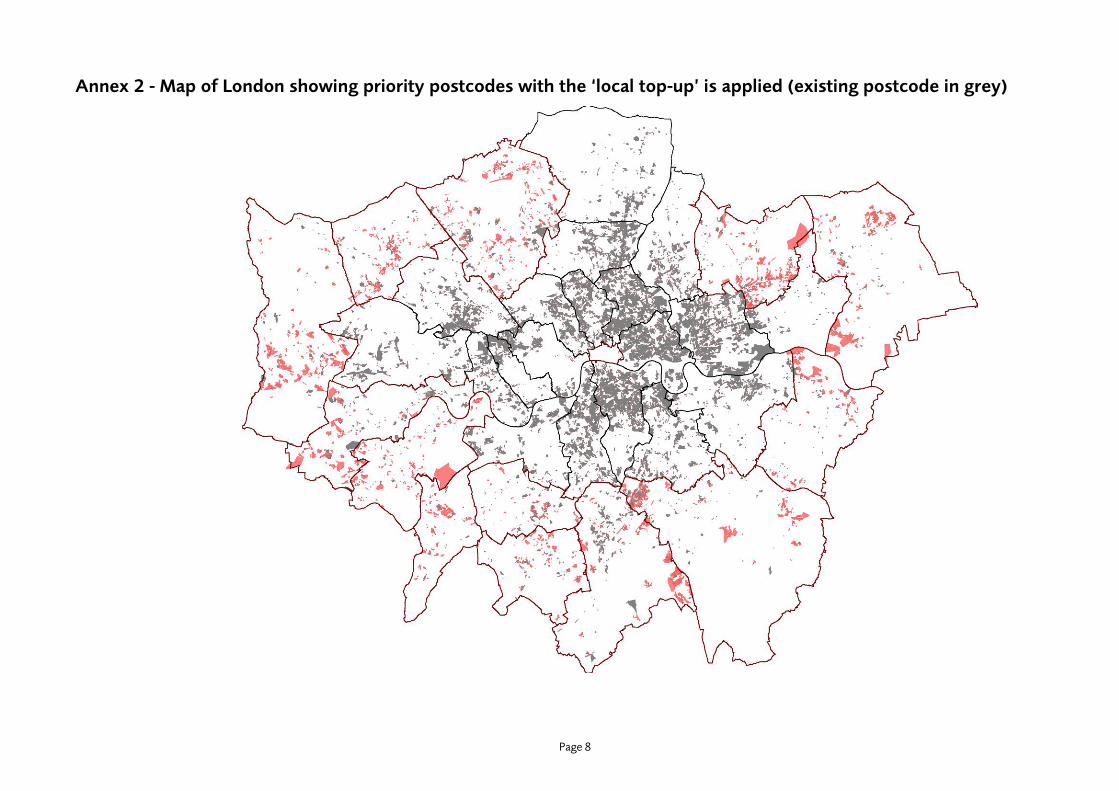
Annex 2 - Map of London showing priority postcodes with the ‘local top-up’ is applied (existing postcode in grey)
Page 9
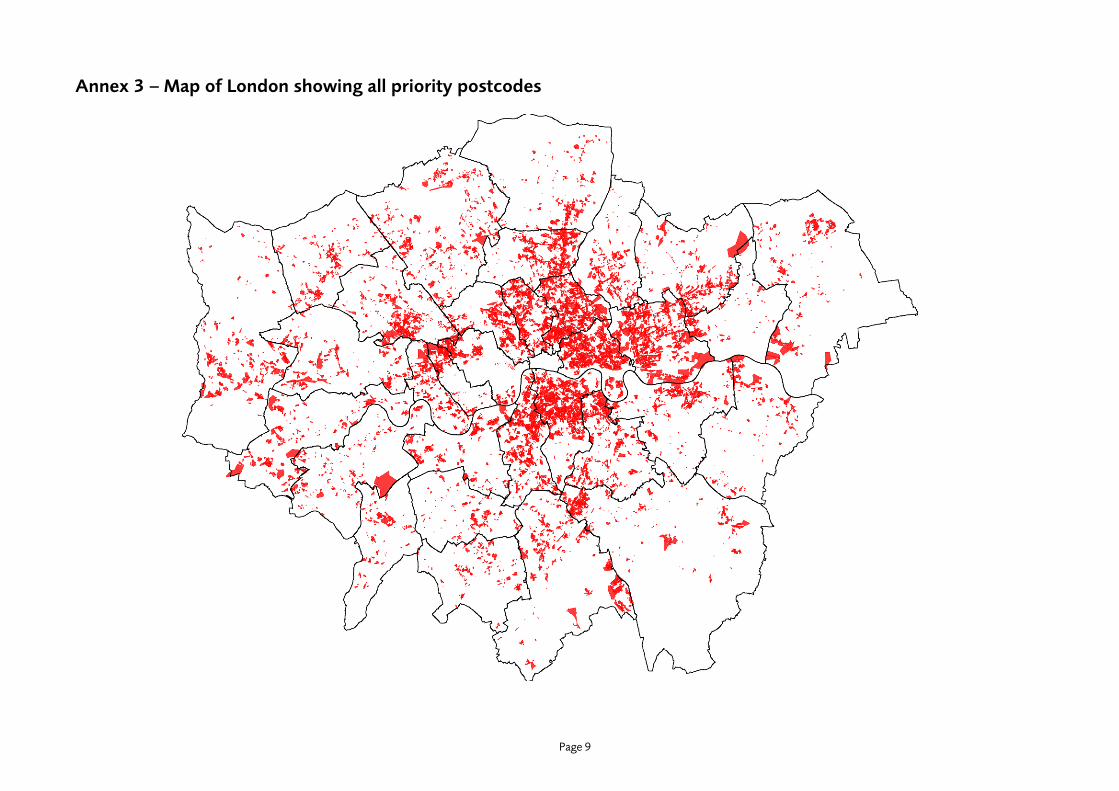
Annex 3 – Map of London showing all priority postcodes


![Reducing dementia risk by targeting modifiable risk ... · Several risk factors have been identified which can either augment or reduce one’s risk of developing dementia [6, 7].](https://static.fdocuments.us/doc/165x107/5f0212f37e708231d4027164/reducing-dementia-risk-by-targeting-modifiable-risk-several-risk-factors-have.jpg)