Targeting: Principles and Practicepdf.usaid.gov/pdf_docs/PNACH731.pdfTARGETING: PRINCIPLES AND...
25
TARGETING: PRINCIPLES AND PRACTICE !TECHNICAL GUIDE #9! John Hoddinott International Food Policy Research Institute 2033 K Street, N.W. Washington, D.C. 20006 U.S.A. March, 1999
Transcript of Targeting: Principles and Practicepdf.usaid.gov/pdf_docs/PNACH731.pdfTARGETING: PRINCIPLES AND...
TARGETING: PRINCIPLES AND PRACTICE
!TECHNICAL GUIDE #9!
John Hoddinott
International Food Policy Research Institute2033 K Street, N.W.Washington, D.C. 20006 U.S.A.
March, 1999

CONTENTS
1. Introduction . . . . . . . . . . . . . . . . . . . . . . . . . . . . . . . . . . . . . . . . . . . . . . . . . . . . . . . . . . . 9-1
2. The Principles of Targeting . . . . . . . . . . . . . . . . . . . . . . . . . . . . . . . . . . . . . . . . . . . . . . . . 9-1
3. The Practice of Targeting . . . . . . . . . . . . . . . . . . . . . . . . . . . . . . . . . . . . . . . . . . . . . . . . 9-15
Funding for data collection and analysis of these data has been supported by the1
International Fund for Agricultural Development (TA Grant No. 301-IFPRI). We gratefullyacknowledge this funding, but stress that ideas and opinions presented here are our responsibilityand should, in no way, be attributed to IFAD.
1. INTRODUCTION1
Targeting lies at the heart of attempts to reach the poorest of the poor. But targeting is not
nearly as straightforward as is often suggested. Indeed, it is possible that a targeted intervention
will be more costly, and less effective, than one made available to all households or that is
randomly allocated. For this reason, it is important that development practitioners have a good
understanding of the principles and practice of targeting.
This guide outlines operational methodologies that will improve the targeting of rural
development projects. It begins by considering the principles underlying targeting. It argues that
targeting should never be undertaken for its own sake. Rather, it should be assessed against a
benchmark, such as the impact on reducing the severity of food insecurity. It is important to
recognize that targeting is not costless. Targeting is effective only when the benefits associated
with additional reductions in food insecurity outweigh the additional costs associated with doing
so. The guide then considers the practice of targeting. It is argued that there is a strong case for
geographical targeting. However, regional rankings can be very sensitive to the criteria used in
the identification process. By contrast, the case for household targeting is considerably weaker.
Project controllers and others interested in reading about these topics in more detail are
advised to consult Besley and Kanbur (1993); Grosh (1994); Haddad, Sullivan, and Kennedy
(1992); and Subbarao (1997).
2. THE PRINCIPLES OF TARGETING
Defining the Objective
Many development agencies seek to improve household food security, often defined as
adequate access to food at all times, throughout the year and from year to year. Suppose this
general definition is specified more narrowly. Specifically, a person is food-secure if the number
of calories available for her to eat exceeds her requirements. If caloric availability is less than
nutritional requirements, she is described as food insecure. Accordingly, it is tempting to assume

Daily caloricavailibility
Requirements
B D CLeast food-secure Most food-secure
Individuals
Food insecurity gap
A
9-2
that the objective of targeting is to produce the greatest decrease in the percentage of individuals
who are food insecure.
Unfortunately, matters are not quite so simple. Consider Figure 1. The horizontal axis is
ranking of individuals from least to most food secure. The vertical axis shows individual caloric
availability; the horizontal line indicating requirements. Note that the number of calories
available to person A is just below her requirements whereas caloric availability for person B is
significantly below requirements. Suppose enough calories were 'transferred' from the B to A so
that A can now meet her requirements. The measure of food insecurity—percentage
insecure—would register an improvement, even though the poorest person has been made worse
off. It is not obvious that this is what is intended when interventions are being designed to
reduce food insecurity.
An alternative way of measuring food insecurity might be in terms of a food insecurity gap.
This can be thought of as the total amount of increase in food security needed to eliminate food
Figure 1—Stylized distribution of food security

P(") ' (1 / n)j qi'1 [(z & yi) / z]a ,
P(2) ' (1 / n)j qi'1 [(z & yi) / z]2 .
9-3
insecurity among all food-insecure households. In the example above, this would be calculated
by adding up the caloric shortfalls of all individuals for whom availability was less than
requirements—the shaded area in Figure 1. This measure signals the folly of using the
percentage measure. In the example above, although percentage of food-insecure individuals
falls, the food insecurity gap would increase. However, consider a second example. The number
of calories available to person C is below her requirements; caloric availability for person D is
even lower than C's. 'Transferring' a small amount of calories from D to C causes both
individuals to remain food insecure. The percentage measure would remain unchanged as would
the food insecurity gap. However, the most food-insecure person is now even more food
insecure and this is not being captured in either measure. One way of resolving this would be to
apply more weight to a reduction in food insecurity among the most food-insecure individuals.
Such a measure explicitly emphasizes the severity of food insecurity.
Now consider the following formula:
where n is the number of individuals; y is the measure of food security for the ith person; zi
represents the cut-off between food security and insecurity (expressed here in terms of caloric
requirements); q is the number of food-insecure individuals; and " is the weight attached to the
severity of food insecurity.
Giving no weight to the severity of food insecurity is equivalent to assuming that " = 0.
The formula collapses to P(0) = q / n, or the percentage measure.
Giving equal weight to the severity of food insecurity among all food-insecure households
is equivalent to assuming that " = 1. Summing the numerator gives the food insecurity gap;
dividing this by z expresses this figure as a ratio.
Giving more weight to the severity of food insecurity among the most food-insecure
households is equivalent to assuming that " > 1. A common approach in the poverty literature is
to set " = 2, yielding
P(") ' (1 / n)j qi'1 [(z & yi) / z]a ,
9-4
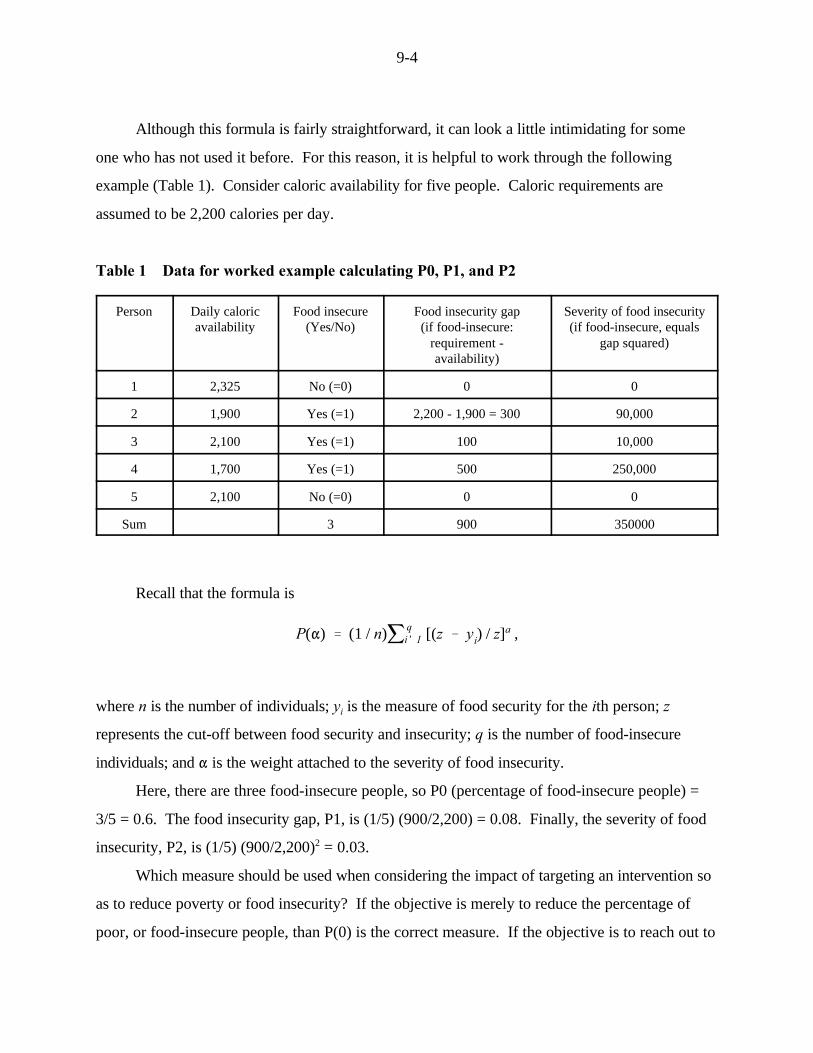
Although this formula is fairly straightforward, it can look a little intimidating for some
one who has not used it before. For this reason, it is helpful to work through the following
example (Table 1). Consider caloric availability for five people. Caloric requirements are
assumed to be 2,200 calories per day.
Table 1—Data for worked example calculating P0, P1, and P2
Person Daily caloric Food insecure Food insecurity gap Severity of food insecurityavailability (Yes/No) (if food-insecure: (if food-insecure, equals
requirement - gap squared)availability)
1 2,325 No (=0) 0 0
2 1,900 Yes (=1) 2,200 - 1,900 = 300 90,000
3 2,100 Yes (=1) 100 10,000
4 1,700 Yes (=1) 500 250,000
5 2,100 No (=0) 0 0
Sum 3 900 350000
Recall that the formula is
where n is the number of individuals; y is the measure of food security for the ith person; zi
represents the cut-off between food security and insecurity; q is the number of food-insecure
individuals; and " is the weight attached to the severity of food insecurity.
Here, there are three food-insecure people, so P0 (percentage of food-insecure people) =
3/5 = 0.6. The food insecurity gap, P1, is (1/5) (900/2,200) = 0.08. Finally, the severity of food
insecurity, P2, is (1/5) (900/2,200) = 0.03.2
Which measure should be used when considering the impact of targeting an intervention so
as to reduce poverty or food insecurity? If the objective is merely to reduce the percentage of
poor, or food-insecure people, than P(0) is the correct measure. If the objective is to reach out to

9-5
the poorest of the poor, then P(2) is the correct metric. An agnostic approach is to present both
measures.
The Benefits and Costs of Targeting
The basic case for targeting is tantalizingly simple. As above, food security is defined in
terms of their being enough calories available for individuals to satisfy their requirements. Using
survey data, food acquisition is graphed, ordering the sample from worst to best-off. This initial
ordering is represented by a dashed line in both panels of Figure 2. In the left-hand panel, a
uniform transfer of calories of amount z is given to every person. By doing so, every person
meets their minimum caloric requirements. In the right-hand panel, anyone with caloric
consumption less than z is given a transfer sufficiently large so as to bring their initial
consumption plus transfer up to minimum requirements. This achieves the same objective but at
far less cost. The uniform transfer is plagued by two sources of excessive expenditure: leakages
to the nonpoor (represented by the black quadrilateral); and payments to the poor in excess of
their needs (represented by the empty triangle).
The case for targeting is complicated by several factors. First, targeting is not costless—it
imposes administrative costs that reduce the amount of money available for the actual
intervention. These costs will vary with the degree, or fineness, of targeting. One might imagine
that there are certain fixed costs associated with targeting. Initial targeting, say, on the basis of
geography, may be relatively costless (Technical Guide #2—Food and Nutrition Security Data on
the World Wide Web—is one source.) As targeting moves below a certain geographical level
(say the district) to villages to households, and to individuals, it becomes increasingly costly.
Second, when interventions are targeted, there is the very real possibility that some food-insecure
households will be missed and some food-secure households will benefit. This can be described
as errors of inclusion and exclusion. An error of inclusion is one in which an intervention
reaches individuals who were not intended to be beneficiaries. An error of exclusion occurs
when intended beneficiaries are not able or permitted to participate in the intervention. Table 2
provides an illustration of this.

9-6
Figure 2—The benefits of targeting
Table 2—Errors of inclusion and exclusion
Food insecure Food secure
Participate in intervention Success Inclusion error45 20 65
Do not participate Exclusion error Success 3515 20
60 40 100
There are four groups in Table 2. There are food-insecure households who participate in
the intervention and food-secure households who do not participate. Both groups are indicative
of successful targeting. The food secure who participate, 20 percent of the population, are
counted as an error of inclusion. The food insecure who do not participate, 15 percent of the
population, are counted as an error of exclusion.

9-7
An alternative way of looking at this phenomenon involves calculating leakage and
undercoverage rates. Leakage is calculated by looking at program participants—those found in
the top row of Table 2. The number of food-secure beneficiaries is divided by the total number
of participants—20/65, yielding a leakage rate of about 30 percent. Undercoverage is calculated
by looking at those who should be participants in the intervention but are not—those found the
bottom left-hand cell of Table 2—relative to the total number of potential beneficiaries. The
number appearing in the bottom left-hand cell is divided by the total number of food-insecure
households—15/60, yielding an undercoverage rate of 25 percent.
All other things being equal, lower leakage (inclusion error) is preferable to higher
leakage. Lower undercoverage (exclusion error) is preferable to higher exclusion error. Why do
these errors exist? Some undercoverage may be due to factors such as lack of knowledge that the
intervention exists or the presence of constraints (say catastrophic illness or sudden death, which
reduces household labor supply) that make it impossible for an eligible household to participate.
Some eligible households may decide that the benefits associated with participation do not
outweigh the costs associated with doing so. Some leakage may occur due to faulty project
design or implementation.
Two additional factors that affect leakage and undercoverage rates are the indicators used
to screen participants and the resources available to fund participation. In order to focus solely
on these, suppose that none of the reasons for inclusion or exclusion listed above are applicable.
There are 100 households in the sample of which 33 are food insecure (Table 3). Consider, as a
baseline, a scenario in which there are enough resources to provide this intervention to exactly 33
households. In the absence of any further information on these households, participation is by
random draw.
Leakage is 67 percent (22/33) as is undercoverage. In fact, leakage is constant no matter
how many households participate. Undercoverage falls monotonically from 100 percent—when
all households are excluded—to zero when all households are included.
Now consider the case where we can target on the basis of an indicator that perfectly
captures household food security. This generates Table 4. Here, both errors of inclusion and
exclusion are zero as are the measures of leakage and undercoverage. Now suppose all
households are permitted to participate. Undercoverage remains at zero, but leakage would rise

9-8
Table 3—Errors of inclusion and exclusion under random draw
Food insecure Food secure
Participate in intervention Success Inclusion error11 22 33
Do not participate Exclusion error Success 6722 45
33 67 100
Table 4—Errors of inclusion and exclusion under perfect targeting
Food Insecure Food Secure
Participate in intervention Success Inclusion error33 0 33
Do not participate Exclusion error Success 670 67
33 67 100
to 67 percent. Conversely, if no household were permitted to participate, leakage would be zero,
but undercoverage would rise to 100 percent.
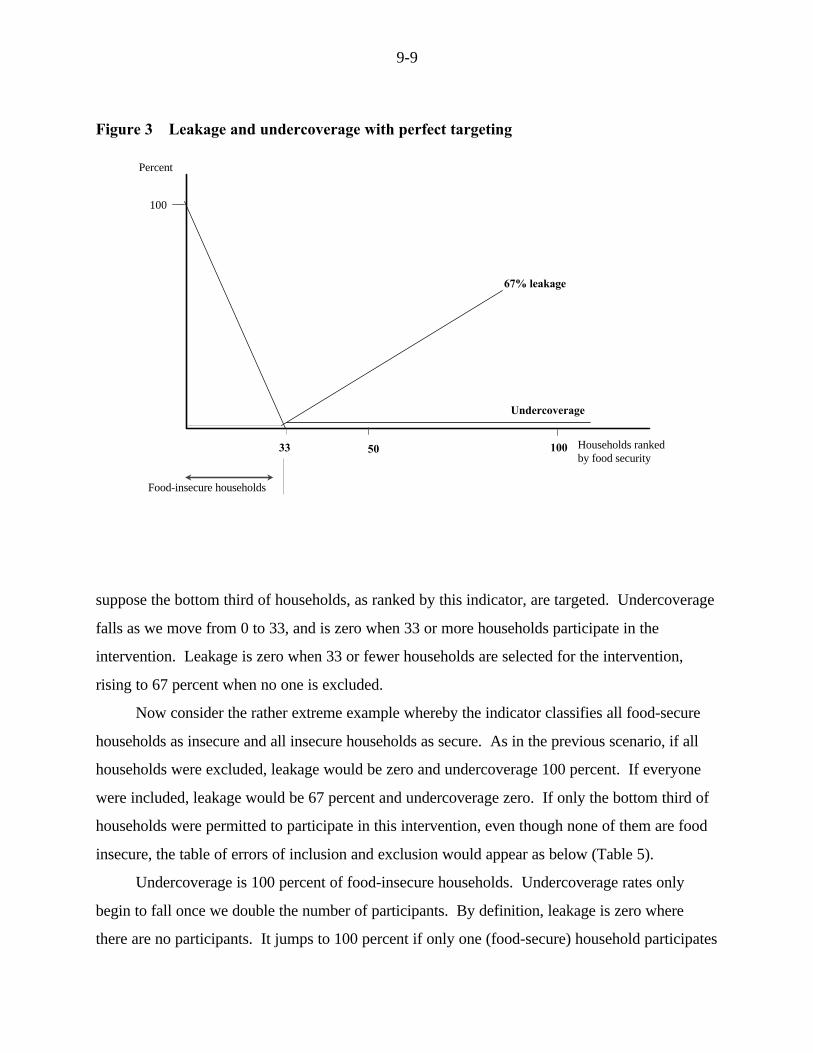
Figure 3 shows the leakage and undercoverage rates as the number of households
permitted to participate in the intervention is varied, under the assumption that an indicator is
available that identifies without any errors food-secure and -insecure households. The horizontal
axis is based on this perfect indicator of household food security. It ranks households on the
basis of their degree of food security relative to the total population. Moving from left to right is
associated with increasing household food security. Relative to the median household, denoted
by '50', all households to the left have lower degrees of food security, all households to the right
have higher degrees of food security. Recall that 33 percent of the population are food insecure.
The vertical axis measures percentage errors associated with leakage and undercoverage. Now
100
33 50 100
67% leakage
Percent
Undercoverage
Food-insecure households
Households rankedby food security
9-9
Figure 3—Leakage and undercoverage with perfect targeting
suppose the bottom third of households, as ranked by this indicator, are targeted. Undercoverage
falls as we move from 0 to 33, and is zero when 33 or more households participate in the
intervention. Leakage is zero when 33 or fewer households are selected for the intervention,
rising to 67 percent when no one is excluded.
Now consider the rather extreme example whereby the indicator classifies all food-secure
households as insecure and all insecure households as secure. As in the previous scenario, if all
households were excluded, leakage would be zero and undercoverage 100 percent. If everyone
were included, leakage would be 67 percent and undercoverage zero. If only the bottom third of
households were permitted to participate in this intervention, even though none of them are food
insecure, the table of errors of inclusion and exclusion would appear as below (Table 5).
Undercoverage is 100 percent of food-insecure households. Undercoverage rates only
begin to fall once we double the number of participants. By definition, leakage is zero where
there are no participants. It jumps to 100 percent if only one (food-secure) household participates

100
33 50 100
Leakage 67%
Percent
Undercoverage
Food-insecure households
Households rankedby food security
67
9-10
Table 5—Errors of inclusion and exclusion under 'worst case' targeting
Food insecure Food secure
Participate in intervention Success Inclusion error0 33 33
Do not participate Exclusion error Success 6733 34
33 67 100
in the intervention and remains at that rate until the 68 household is enrolled in the intervention. th
This is shown in Figure 4.
The purpose of these examples is to illustrate a simple point: bad targeting has the
potential to produce worse outcomes than no targeting at all. It also tempts the project controller
to think of targeting issues in terms of the trade-offs between leakage and undercoverage.
Consider a more realistic case in which an imperfect indicator of household food security is
available. Reducing the number of beneficiaries will reduce leakage, but at the cost of increased
Figure 4—Leakage and undercoverage under 'worst case' targeting
9-11
undercoverage. How should one assess the trade-off between these? One might be tempted to
assume that the objective should be to minimize the sum of leakage and undercoverage, but this
is incorrect. Such an objective implicitly measures the success of targeting not in terms of its
impact on poverty, but instead on the identity of the recipients. In the literature on the targeting
of social programs, where the greatest priority is to improve the welfare of the poor, reducing
undercoverage is more important than minimizing leakage. If the priority is to conserve limited
budget funds, measures to reduce leakage are given greater weight.
For project staff, the objective of targeting should be seen as the maximization of the
reduction in food insecurity, given a fixed budget constraint. The example below develops this
further.
An Extended Example
One development project is ongoing in the Zone Lacustre region of Mali, an area with very
high levels of food insecurity. A major component of the project is the improvement of irrigation
facilities so as to better capture water emanating from the annual flooding of the Niger River. By
doing so, the project seeks to increase yields of sorghum and rice and to stabilize these yields
across years.
As part of this TAG, IFPRI surveyed 275 households in the Zone Lacustre. These
households reside in 10 villages that are grouped geographically into three areas. Data from the
first survey round, collected at the height of the hungry season, indicates that food insecurity is a
significant problem. Across all households, caloric availability per person per day was 2,100.
Approximately 69 percent of individuals were not obtaining their minimum calorie requirements
of 2,200 calories per day.
Would the food security impact of this project by improved by targeting areas, villages, or
households within this region? Answering this question requires an assumption regarding the
nature of the intervention. Here, it is assumed that the resources of the project are sufficient to
increase the availability of sorghum by 23 kilograms per year for every person in the sample.
After taking into account processing, this is equivalent to increasing caloric availability by 100
calories per day. It is further assumed that if this intervention were made available to only half
the households in this sample, (approximately) twice the amount of sorghum would be available
9-12
to each person. That is, it is assumed that no costs are incurred in identifying recipient
households. Nor does the cost of the intervention vary with the number of participants. These
assumptions are made in order to keep the budget for the intervention fixed. They are relaxed
later in the example.
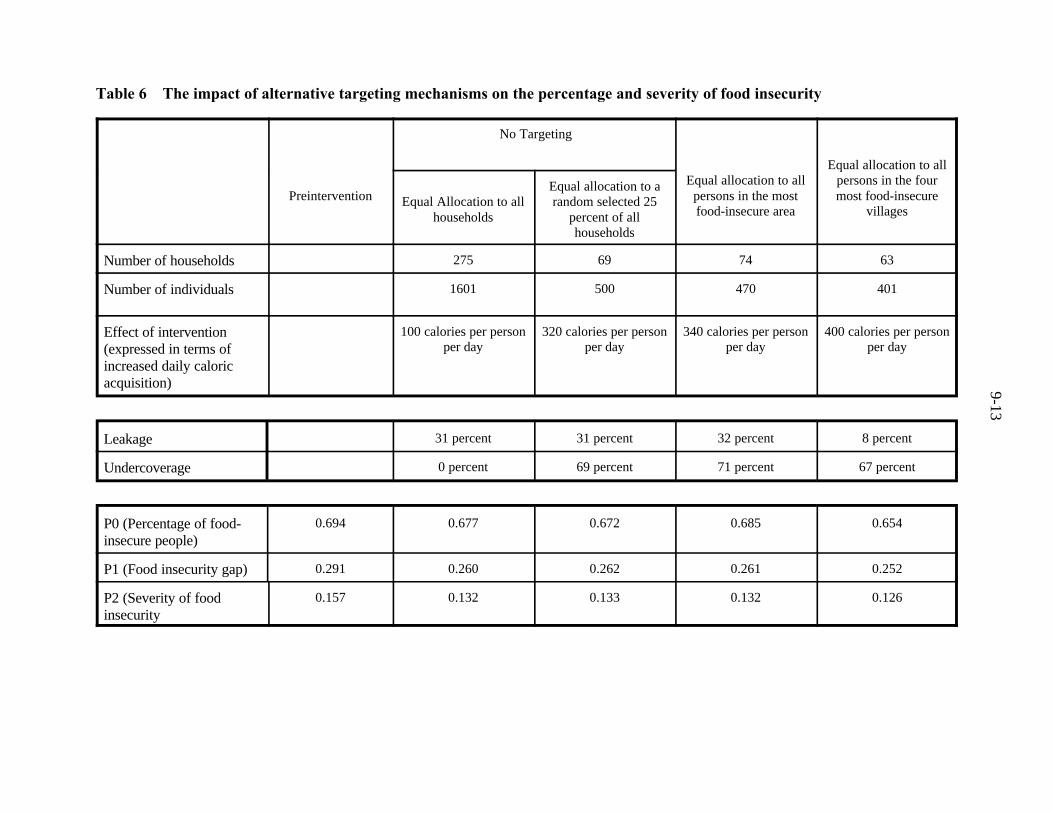
Suppose that no targeting took place. Every household and every person benefits from the
intervention with the result that daily per capita caloric availability rises by 100 calories. This
will be called a universal intervention. Table 6 summarizes its impact. By definition,
undercoverage is zero (everyone food-insecure person is a participant) and leakage will be 31
percent (every food-secure person is also a participant). The percentage of food-insecure
people—the P0 measure—falls by about 2.5 percent. The measure of the severity of food
insecurity falls by 15 percent, from 0.157 to 0.132. An alternative to this base case is to assume
that households are randomly selected to participate in this intervention. Assuming that one out
of every fourth household is selected this way makes it possible to increase the impact of the
intervention on each individual to 320 calories per day. This is called the random intervention.
Leakage is exactly the same as under the universal intervention. Since households are selected
randomly, one would expect that 31 percent of the participants would be food-secure and this is
precisely what is observed. Undercoverage is 69 percent. Recall that it measures the proportion
of individuals who the intervention fails to cover. Given that only 25 percent of households are
participants, it is not surprising that undercoverage is much higher under a random intervention
than under the universal intervention. But note that the impact on the percentage and severity of
food insecurity is virtually identical under either. The intuition for this can be found by going
back to Figure 1. Although everyone participates under the universal intervention, the benefits to
participation are relatively small. Consequently, only those whose existing caloric availability is
close to requirements are lifted out of food insecurity. The random intervention, although
affecting only a smaller number of individuals, has a larger impact and therefore can pull
individuals with lower existing caloric availability out of food insecurity.
Now suppose the intervention is targeted to the area where average daily per person
caloric availability is the lowest. Even though each person is now receiving three and a half
times the amount of calories when compared to a universal intervention, it performs no better in
terms of reducing the percentage or severity of food insecurity. By contrast, targeting the four
9-13
Table 6—The impact of alternative targeting mechanisms on the percentage and severity of food insecurity
Preintervention persons in the most most food-insecure
No Targeting
Equal allocation to all persons in the four
food-insecure area villages
Equal allocation to all
Equal Allocation to all random selected 25households percent of all
Equal allocation to a
households
Number of households 275 69 74 63
Number of individuals 1601 500 470 401
Effect of intervention(expressed in terms ofincreased daily caloricacquisition)
100 calories per person 320 calories per person 340 calories per person 400 calories per personper day per day per day per day
Leakage 31 percent 31 percent 32 percent 8 percent
Undercoverage 0 percent 69 percent 71 percent 67 percent
P0 (Percentage of food-insecure people)
0.694 0.677 0.672 0.685 0.654
P1 (Food insecurity gap) 0.291 0.260 0.262 0.261 0.252
P2 (Severity of foodinsecurity
0.157 0.132 0.133 0.132 0.126
9-14
most food-insecure villages generates a slightly better impact on the percentage measure. The
P2, or severity measure, is significantly improved, falling 20 percent from the preintervention
case.
These results come about for the following reason. The most food-insecure area has three
villages. One is the most food-insecure village in the sample, the other two are about average.
As a result, when targeting this sector, much of the intervention is "wasted" in the sense that
benefits go to individuals who are not food insecure. Targeting the poorest four villages does not
produce a much greater impact on the percentage measure because so many people are so far
below their requirements. However, it is for exactly this reason that the impact on the severity
measure is much higher.
Based on this information, should the intervention be made universally available, allocated
randomly or targeted? It is at this point that the costs of targeting, which up to now have been
assumed to be zero, become important. Suppose there is a fixed cost associated with providing
this intervention to each household. If this were the case, the random intervention is to be
preferred over the universal intervention. Either produces the same impact on all measures of
food insecurity, but the random allocation will do so more cheaply. Note that the random
allocation is preferable, even though the rate of undercoverage is much higher. It is not clear
whether the random allocation is preferable to one targeted to the most food-insecure area. Both
have comparable rates of leakage and undercoverage, both produce equal reductions in the
percentage and severity measures, and both reach about the same number of households.
Targeting would only be preferable if the costs associated with obtaining the data necessary to
target are more than offset by the possibility that providing the intervention in only one area was
cheaper than spreading across an equal number of households scattered over the Zone Lacustre.
The case for targeting by village is slightly stronger. Although this might be more costly than
targeting the poorest area, it requires reaching a smaller number of households and yields a much
larger reduction in the severity of food insecurity. If the savings associated with working in only
four villages instead of working with slightly more households spread out over the entire Zone
outweigh the costs of collecting the information necessary to target, then this form of targeting
would be preferable on the basis of its improved impact on the severity of food insecurity.
9-15
3. THE PRACTICE OF TARGETING
In this section, we assume that there are gains associated with targeting, either in terms of
reducing the cost of providing the intervention or in terms of increasing the impact on food
security. The next issue to consider is how to target interventions. Broadly speaking,
interventions can be administratively targeted or self-targeted. We review these approaches in
turn.
Administratively Targeted Interventions
Administratively targeted interventions are those in which project staff determine who will
participate. Eligibility is based on a set of criteria. Administrative targeting can be further
subdivided into indicator-based targeting and means testing.
Indicator-based targeting begins by recognizing that means testing may be very costly and
may not be entirely accurate. It assumes that there is an identifiable characteristic or set of
characteristics that are correlated with, say, food insecurity or poverty. Data on these
characteristics are assumed to be relatively easy to obtain. An obvious indicator for project staff
to use is geography. Geographical targeting works best when food security differs across regions
but is similar within regions. The within-region homogeneity aspect is one that sometimes goes
unappreciated. If subregions exhibit great variations in their degree of food insecurity, one risks
siting an intervention in a relatively well-off area within a larger, poorer one. For this reason,
geographic targeting works best when the geographic units are relatively small districts as
opposed to provinces, counties as opposed to states, and so on. Geographic targeting is also
attractive on the grounds that it is easier and less expensive to administer. Further, as the
example in the previous section illustrated, concentrating resources on fewer units (districts,
villages, or households) can have a larger impact on food insecurity.
It is also important to be clear on the criteria used to target geographically. Does
attempting to reach the poorest of the poor mean (1) siting interventions where the percentage of
food-insecure households is highest (that is, targeting on percentage (P0) measure described in
Section 2); (2) siting interventions where there are many food-insecure people (that is, targeting
on absolute numbers—sometimes expressed on a density basis); or (3) siting interventions based
9-16
on the extent of food insecurity among the food insecure (that is, targeting on severity, the P2
measure described in Section 2)? These different measures will not necessarily yield the same
rankings. Again, the Zone Lacustre data can be used to illustrate this. Using the same definition
of food security as in Section 2 (caloric availability relative to requirements), each village is
ranked according to these criteria. The rankings are in descending order of insecurity: a 1 means
that the village is the most insecure according to this criteria; a 10 means that it is the most food-
secure.
A particularly notable village in Table 7 is Gouaty. Based on the criteria developed in
Section 2, 95 percent of individuals living in this village are food insecure. However, Gouaty is
the smallest village in the study. Consequently, it fares poorly when ranked in terms of absolute
numbers.
Suppose funding was only sufficient to provide the development intervention in three
villages. Using percentage of food insecure as the criterion, these would be Gouaty, Angira, and
Hamakoira. Using absolute numbers, they would be N'goro, Ouaki, and Tomba. Using severity,
they would be Angira, Tomba, and Hamakoira. Note that no two rankings produce an identical
list of villages.
In the example considered above, villages are ranked on the basis of a single criterion. In
practice, project staff may have access to multiple indicators on poverty and household food
security. In these circumstances, it is possible to develop a "targeting algorithm"—a statistical
method that assigns weights to the relative importance of each indicator. The Appendix presents
an example of such an algorithm that was applied to a development project in Côte d'Ivoire.
These algorithms are also discussed in Technical Guide #7.
Targeting at the household level can be done on the basis of indicators (using the algorithm
method described above) or means testing. Under means testing, the project obtains information
on every potential participant and based on this information and the criteria for participation, a
person is either selected or not selected. A range of methods are available to do this. These are
described in Table 8.

9-17
Table 7—Ranking 10 Zone Lacustre villages by percentage, absolute numbers, and severityof food insecurity
Criteria
Village Percentage Absolute Numbers Severity
Aldianabangou 9= 6 5=
Tomba 6 3 2=
Hamakoira 2= 5 2=
Mangourou 8 7 10
Gouaty 1 8= 4
N'goro 5 1 8
Tomi 4 8= 9
Goundam Touskel 9= 10 5=
Ouaki 7 2 5=
Angira 2= 4 1

9-18
Table 8—Household targeting mechanisms
Mechanism Advantages Disadvantages requirementsAdministrative
Community-based identification
Community Simple Communities have incentive to Staff to conduct PRAidentifies food- overstate degree of food activitiesinsecure Inexpensive insecurity.households, for ˆ triangulation is needed. Record keepingexample by usinggroup informant Need relatively skilled staff torating (see undertake PRA activityTechnical Guide#6). Since community rankings are
relative to community measures,may lead to inconsistencies interms of access to interventionsacross communities.
Household self-reported status
Household reports Simple Inaccurate Staff to conductlevel of food interviewssecurity, for Inexpensive Households have enormousexample, by incentive to lie, especially when Record keepingreporting changes in no triangulating information iscomposition, collected.frequency, and sizeof meals relative tonorm.
Measured food security status
Household food Accurate Expensive Staff to conductsecurity is longer interviewsmeasured, for Difficult for households Lengthyexample, via direct to offer deceptive Staff to enter andobservation, 24- information analyze datahour or 7-day recall. Additional data are Detailed data entrycollected to adjust and record keepingfor household size,seasonality and totriangulatemeasured foodsecurity.
(continued)

9-19
Table 8—Continued
Mechanism Advantages Disadvantages requirementsAdministrative
Proxy measure of food security
A synthetic food Weighting algorithm Requires longer interview than Staff to conductsecurity score is ensures uniformity in self-reported status, but shorter interviewscalculated on the assessment across than measured food securitybasis of a set of communities. Detailed recordeasily collected Weighting algorithm is inflexible keepingindicators of food Not clear to households and may not detect specialsecurity, e.g., how to deceive circumstances, e.g., natural Computerized optionhousehold size, effectively disasters. requires data entrygender of head, capacity. Softwarediversity of diet, May be seen as arbitrary if design can beetc. communities and households do centralized.
Score can be algorithm Previous analyticalcalculated on-site or work and periodiccomputer. updates to establish
not understand weighting
proxy variables andweights
Fieldworker assessment of food security
Subjectively assess Can detect special Uniformity and consistency across Staff conductsame information circumstances and within communities hard to interviewscollected under maintainproxy measurement Record keeping
May be perceived as open tofavoritism, bribery
Nutritional status
Anthropometry (see Objective, verifiable, Nutritional status is an outcome of Specialized staffTechnical Guide accurate indication of several factors of which food#5) need security is only one ˆ targeting Computerized analysis
interventions based on this of datameasure may not be appropriate.
Unclear how households withoutsmall children will be assessed
Requires specialist staff to makemeasurements
Source: Adapted from Grosh (1994).

9-20
There are several common problems that affect virtually all methods of targeting of
individuals or households. First, indicators of well-being will move over time in response to
both transitory and secular, or permanent, phenomena. Targeting on the basis of information
collected at a single point in time may include households that are no longer food insecure and
miss households that have fallen into food insecurity. Second, the marginality of poor and food-
insecure households manifests itself in many ways, including geographic inaccessibility.
Household-level targeting, therefore, will require an aggressive effort to seek out the poorest
members of any community.
A further problem is the incentive that individuals and communities have to misrepresent
themselves in order to increase the likelihood that they will be selected for an intervention. This
was brought home to the IFPRI team rather dramatically as part of participatory rapid appraisal
(PRA) work it undertook in the Zone Lacustre. One component of these exercises was a group
rating activity (see Technical Guide #6). In one village, we began this activity by asking the
community to provide a local definition of food security. Based on the definition that was
eventually agreed upon, we then asked the community to classify households into one of three
groups: always food insecure; sometimes food insecure; never food secure. After a brief
discussion, we were told that all households in this village were always food insecure. We
queried this remark as our household survey work had indicated to us a certain degree of
economic differentiation within this village. Although many households were poor, the
household-level data on crop production and livestock indicated that this was not the case for all
households. After a protracted discussion, it emerged that these villagers had assumed—despite
our frequent denials—that we would use this information as a targeting mechanism, and hence
were at pains to disavow any admission of food security in their village.
One can readily imagine such deception—which is carried out for entirely understandable
reasons—also occurring when households or individuals are the unit of response. Where
targeting is on the basis of characteristics, for example, possession of consumer durables,
households will have an incentive to hide these. If the indicator is household size, households
will have an incentive to amalgamate. One solution to this difficulty is to not reveal the criteria
used to select households. But this solution runs counter to the notion of transparency and
participation that underlie the interventions of many development agencies. An alternative

9-21
solution is the use of an objective measure such as child anthropometry. But, as is discussed
further in Technical Guide #5, this is not always appropriate. For example, it excludes
households with no children.
Finally, it is worth noting that communities may resist the notion of household or
individual targeting. Such an approach might be seen as creating or exacerbating social tensions
within villages. The selection of individual households can place local staff in an awkward
position, caught between the demands of households to be included and more senior staff who
demand adherence to specified targeting criteria.
Self-Targeting
An alternative to administratively targeting interventions is self-targeting. Under self-
targeting, the intervention is, in principle, available to anyone who wishes to take part. However,
it is designed in such a way that it is only attractive to poorer households. The classic example is
that of public works programs that pay a subsistence wage. In the context of most development
interventions, examples of self-targeting could include tying the intervention to some time
commitment on the part of households. For example, only households who provide labor to a
public works program, who attend meetings with agricultural extension workers or with local
health staff, would be eligible to receive a package of interventions such as credit and seeds. The
assumption here is that the time costs—in terms of foregone earnings—would be such that only
poorer households would want to participate. Alternatively, the intervention could be designed
in such a way as to focuse on crops or livestock that are especially important for poor people.
Research on improved varieties of cassava is an excellent example as it is a crop consumed
primarily by the poor. Self-targeting can also be seen as a means of reaching particular
household members such as women. For example, the intervention could be focused on crops
grown only by women (though careful design must be undertaken to ensure that these are not
then appropriated by men).
Self-targeting requires particularly careful project design. Poorly self-targeted
interventions may be attractive to no one, not even the poor. This could occur, for example,
where there is no demand for the intervention or where the costs of participation outweigh the
benefits. Information on the design of these interventions can be obtained through participatory

9-22
appraisal techniques, such as the conceptual mapping of threats to food security and SWOT
(Strengths, Weaknesses, Opportunities, and Threats) analysis. These are described in Technical
Guide #6.

9-23
REFERENCES
Besley, T., and R. Kanbur. 1993. The principles of targeting. In Including the poor, ed. M.
Lipton and J. Van Der Gaag. Washington, D.C.: World Bank.
Grosh, M. 1994. Administering targeted social programs in Latin America: From platitudes to
practice. Washington, D.C.: World Bank.
Haddad, L., J. Sullivan, and E. Kennedy. 1992. Identification and evaluation of alternative
indicators of food and nutrition security. International Food Policy Research Institute,
Washington, D.C.
Subbarao, K., A. Bonnerjee, J. Braithwaite, S. Carvalho, K. Ezemenari, C. Graham, and A.
Thompson. 1997. Safety net programs and poverty reduction: Lessons from cross-
country experience. Washington, D.C.: World Bank.