Targeting factor D of the alternative complement pathway ... · apeutic target in the alternative...
14
MACULAR DEGENERATION Copyright © 2017 The Authors, some rights reserved; exclusive licensee American Association for the Advancement of Science. No claim to original U.S. Government Works. Targeting factor D of the alternative complement pathway reduces geographic atrophy progression secondary to age-related macular degeneration Brian L. Yaspan, 1 David F. Williams, 2 Frank G. Holz, 3 Carl D. Regillo, 4 Zhengrong Li, 1 Amy Dressen, 1 Menno van Lookeren Campagne, 1 Kha N. Le, 1 Robert R. Graham, 1 Tatiana Beres, 1 Tushar R. Bhangale, 1 Lee A. Honigberg, 1 Ashley Smith, 1 Erin C. Henry, 1 Carole Ho, 1 Erich C. Strauss; 1 * for the MAHALO Study Investigators † Geographic atrophy is an advanced form of age-related macular degeneration (AMD) and a leading cause of vision loss for which there are no approved treatments. Genetic studies in AMD patients have implicated dys- regulation of the alternative complement pathway in the pathogenesis of geographic atrophy. Lampalizumab is a potential therapeutic that targets complement factor D, a pivotal activator of the alternative complement pathway. The MAHALO phase 2 clinical trial was a multicenter, randomized, controlled study that evaluated lampa- lizumab administered by intravitreal injection monthly (n = 42) and every other month (n = 41) versus sham control (n = 40) in patients with geographic atrophy secondary to AMD. The primary endpoint was the mean change in lesion area from baseline to month 18 as measured by fundus autofluorescence. Specific AMD-associated genetic polymorphisms were also analyzed. The MAHALO study met its primary efficacy endpoint with an acceptable safety profile; monthly lampalizumab treatment demonstrated a 20% reduction in lesion area progression versus sham control [80% confidence interval (CI), 4 to 37%]. A more substantial monthly treatment benefit of 44% reduction in geographic atrophy area progression versus sham control (95% CI, 15 to 73%) was observed in a subgroup of com- plement factor I (CFI ) risk-allele carriers (57% of the patients analyzed were CFI risk-allele carriers). The MAHALO study shows a potential treatment effect in patients with geographic atrophy and supports therapeutic targeting of the alternative complement pathway for treating AMD pathogenesis. INTRODUCTION Age-related macular degeneration (AMD) is the leading cause of ir- reversible and profound visual impairment in industrialized countries (1). Advanced AMD is distinguished by either neovascular disease or geographic atrophy. The majority of severe vision loss in advanced disease has been associated with neovascular AMD; however, with the advent of available treatments for this form of the disease, geographic atrophy-related visual impairment is increasing relative to neovascular AMD. Geographic atrophy affects more than 5 million patients world- wide, and it is associated with devastating effects on visual function that affect the quality of life (2, 3). Geographic atrophy is characterized by irreversible visual impairment resulting from loss of photoreceptors, retinal pigment epithelium, and the choriocapillaris. Geographic atrophy represents a significant unmet medical need because there are no approved or effective therapies to prevent progression of the disease and associated visual loss ( 4). AMD is a multifactorial disease with genetic and environmental risk factors (5). Preclinical modeling of human AMD presents significant challenges, including replicating advanced age, complex genetic risk factors, and decades of environmental exposures that may contribute to the development and progression of geographic atrophy (6). More- over, murine models have limitations because they lack the specialized human macular anatomy involved in AMD. Although mouse models have been used to study various aspects of AMD, currently there is no preclinical model that approximates the pathological spectrum of ge- ographic atrophy. Consequently, identifying potential therapeutic targets for treating geographic atrophy has focused on human genetic studies. Although the precise pathogenesis of AMD remains to be determined, it is well established that there is a major genetic contribution to dis- ease risk. Several studies have demonstrated that polymorphisms in loci containing genes coding for proteins in the alternative complement pathway are strongly associated with the risk of developing AMD, in- cluding the advanced forms of the disease. Confirmed AMD common risk loci include genes encoding complement factor H (CFH), com- plement factor I (CFI), complement component 3 (C3), and one locus containing complement component 2 (C2) and complement factor B (CFB) designated as C2/CFB (7, 8). With the exception of C2, all of these complement components are primarily associated with the alter- native complement pathway (9). Moreover, dysregulation of the com- plement system, particularly the alternative complement pathway, has been implicated in the pathogenesis of AMD (4, 10). Furthermore, re- cent studies have shown increased concentrations of complement pro- teins in the serum of AMD patients compared to controls, including complement factor D (CFD) (11, 12), a pivotal regulator of the alter- native complement pathway. CFD acts early in the alternative comple- ment pathway, is a rate-limiting enzyme of the pathway, and is present at relatively low plasma concentrations compared to other complement factors (13). For these reasons, we considered CFD as a potential ther- apeutic target in the alternative complement pathway for treating ge- ographic atrophy. Lampalizumab, previously referred to as FCFD4514S and anti –factor D, is an antigen-binding fragment (Fab) of a humanized monoclonal antibody (mAb) directed against CFD (14). Lampalizumab selectively inhibits CFD-mediated activation and amplification of the alternative complement pathway, but it does not affect initiation of 1 Genentech Inc., South San Francisco, CA 94080, USA. 2 VitreoRetinal Surgery, PA, Minneapolis, MN 55404, USA. 3 Department of Ophthalmology, University of Bonn, Bonn, Germany. 4 Wills Eye Hospital, Philadelphia, PA 19107, USA. *Corresponding author. Email: [email protected] †MAHALO study investigators are listed in the Acknowledgments. SCIENCE TRANSLATIONAL MEDICINE | RESEARCH ARTICLE Yaspan et al., Sci. Transl. Med. 9, eaaf1443 (2017) 21 June 2017 1 of 13 by guest on June 8, 2019 http://stm.sciencemag.org/ Downloaded from
Transcript of Targeting factor D of the alternative complement pathway ... · apeutic target in the alternative...

SC I ENCE TRANS LAT IONAL MED I C I N E | R E S EARCH ART I C L E
MACULAR DEGENERAT ION
1Genentech Inc., South San Francisco, CA 94080, USA. 2VitreoRetinal Surgery, PA,Minneapolis, MN 55404, USA. 3Department of Ophthalmology, University of Bonn,Bonn, Germany. 4Wills Eye Hospital, Philadelphia, PA 19107, USA.*Corresponding author. Email: [email protected]†MAHALO study investigators are listed in the Acknowledgments.
Yaspan et al., Sci. Transl. Med. 9, eaaf1443 (2017) 21 June 2017
Copyright © 2017
The Authors, some
rights reserved;
exclusive licensee
American Association
for the Advancement
of Science. No claim
to original U.S.
Government Works.
http://stm.sci
Dow
nloaded from
Targeting factor D of the alternative complementpathway reduces geographic atrophy progressionsecondary to age-related macular degenerationBrian L. Yaspan,1 David F. Williams,2 Frank G. Holz,3 Carl D. Regillo,4 Zhengrong Li,1
Amy Dressen,1 Menno van Lookeren Campagne,1 Kha N. Le,1 Robert R. Graham,1 Tatiana Beres,1
Tushar R. Bhangale,1 Lee A. Honigberg,1 Ashley Smith,1 Erin C. Henry,1 Carole Ho,1
Erich C. Strauss;1* for the MAHALO Study Investigators†
Geographic atrophy is an advanced form of age-related macular degeneration (AMD) and a leading cause ofvision loss for which there are no approved treatments. Genetic studies in AMD patients have implicated dys-regulation of the alternative complement pathway in the pathogenesis of geographic atrophy. Lampalizumab isa potential therapeutic that targets complement factor D, a pivotal activator of the alternative complementpathway. The MAHALO phase 2 clinical trial was a multicenter, randomized, controlled study that evaluated lampa-lizumab administered by intravitreal injection monthly (n = 42) and every other month (n = 41) versus sham control(n = 40) in patients with geographic atrophy secondary to AMD. The primary endpoint was the mean change inlesion area from baseline to month 18 as measured by fundus autofluorescence. Specific AMD-associated geneticpolymorphisms were also analyzed. The MAHALO study met its primary efficacy endpoint with an acceptable safetyprofile; monthly lampalizumab treatment demonstrated a 20% reduction in lesion area progression versus shamcontrol [80% confidence interval (CI), 4 to 37%]. A more substantial monthly treatment benefit of 44% reduction ingeographic atrophy area progression versus sham control (95% CI, 15 to 73%) was observed in a subgroup of com-plement factor I (CFI) risk-allele carriers (57% of the patients analyzed were CFI risk-allele carriers). The MAHALO studyshows a potential treatment effect in patients with geographic atrophy and supports therapeutic targeting of thealternative complement pathway for treating AMD pathogenesis.
enc
by guest on June 8, 2019emag.org/
INTRODUCTIONAge-related macular degeneration (AMD) is the leading cause of ir-reversible and profound visual impairment in industrialized countries(1). Advanced AMD is distinguished by either neovascular disease orgeographic atrophy. The majority of severe vision loss in advanceddisease has been associated with neovascular AMD; however, with theadvent of available treatments for this form of the disease, geographicatrophy-related visual impairment is increasing relative to neovascularAMD. Geographic atrophy affects more than 5 million patients world-wide, and it is associated with devastating effects on visual function thataffect the quality of life (2, 3). Geographic atrophy is characterized byirreversible visual impairment resulting from loss of photoreceptors,retinal pigment epithelium, and the choriocapillaris. Geographic atrophyrepresents a significant unmetmedical need because there are no approvedor effective therapies to prevent progression of the disease and associatedvisual loss (4).
AMD is a multifactorial disease with genetic and environmental riskfactors (5). Preclinical modeling of human AMD presents significantchallenges, including replicating advanced age, complex genetic riskfactors, and decades of environmental exposures that may contributeto the development and progression of geographic atrophy (6). More-over, murine models have limitations because they lack the specializedhuman macular anatomy involved in AMD. Although mouse modelshave been used to study various aspects of AMD, currently there is no
preclinical model that approximates the pathological spectrum of ge-ographic atrophy. Consequently, identifying potential therapeutic targetsfor treating geographic atrophy has focused on human genetic studies.Although the precise pathogenesis of AMD remains to be determined,it is well established that there is a major genetic contribution to dis-ease risk. Several studies have demonstrated that polymorphisms inloci containing genes coding for proteins in the alternative complementpathway are strongly associated with the risk of developing AMD, in-cluding the advanced forms of the disease. Confirmed AMD commonrisk loci include genes encoding complement factor H (CFH), com-plement factor I (CFI), complement component 3 (C3), and one locuscontaining complement component 2 (C2) and complement factor B(CFB) designated as C2/CFB (7, 8). With the exception of C2, all ofthese complement components are primarily associated with the alter-native complement pathway (9). Moreover, dysregulation of the com-plement system, particularly the alternative complement pathway, hasbeen implicated in the pathogenesis of AMD (4, 10). Furthermore, re-cent studies have shown increased concentrations of complement pro-teins in the serum of AMD patients compared to controls, includingcomplement factor D (CFD) (11, 12), a pivotal regulator of the alter-native complement pathway. CFD acts early in the alternative comple-ment pathway, is a rate-limiting enzyme of the pathway, and is presentat relatively low plasma concentrations compared to other complementfactors (13). For these reasons, we considered CFD as a potential ther-apeutic target in the alternative complement pathway for treating ge-ographic atrophy. Lampalizumab, previously referred to as FCFD4514Sand anti–factor D, is an antigen-binding fragment (Fab) of a humanizedmonoclonal antibody (mAb) directed against CFD (14). Lampalizumabselectively inhibits CFD-mediated activation and amplification of thealternative complement pathway, but it does not affect initiation of
1 of 13
SC I ENCE TRANS LAT IONAL MED I C I N E | R E S EARCH ART I C L E
the classical or mannose-binding lectin pathways of the complementsystem (9, 15, 16).
The MAHALO phase 2 clinical trial [ClinicalTrials.gov identifier,NCT01229215; EudraCT (European Union Drug Regulating Author-ities Clinical Trials) number, 2010-019183-36] investigated the safety,tolerability, pharmacokinetics, and evidence of activity of lampalizumab,including targeted genetic analyses, in patients with geographic atrophysecondary to AMD.
Dow
nloa
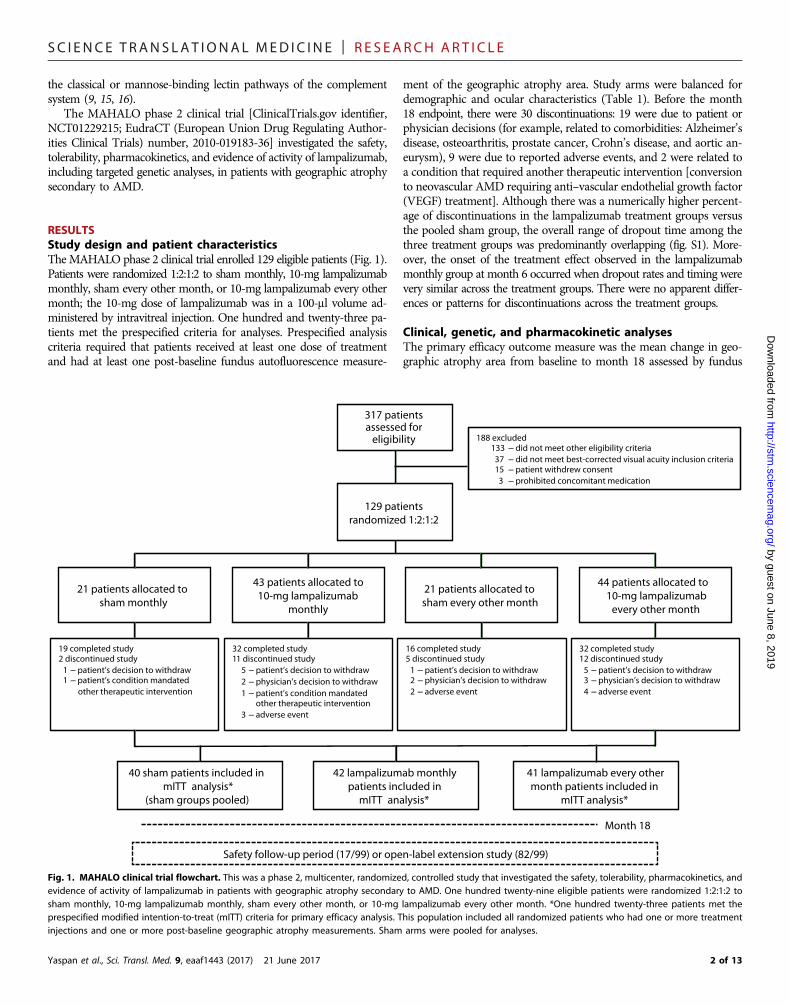
RESULTSStudy design and patient characteristicsTheMAHALO phase 2 clinical trial enrolled 129 eligible patients (Fig. 1).Patients were randomized 1:2:1:2 to sham monthly, 10-mg lampalizumabmonthly, sham every other month, or 10-mg lampalizumab every othermonth; the 10-mg dose of lampalizumab was in a 100-ml volume ad-ministered by intravitreal injection. One hundred and twenty-three pa-tients met the prespecified criteria for analyses. Prespecified analysiscriteria required that patients received at least one dose of treatmentand had at least one post-baseline fundus autofluorescence measure-
Yaspan et al., Sci. Transl. Med. 9, eaaf1443 (2017) 21 June 2017
ment of the geographic atrophy area. Study arms were balanced fordemographic and ocular characteristics (Table 1). Before the month18 endpoint, there were 30 discontinuations: 19 were due to patient orphysician decisions (for example, related to comorbidities: Alzheimer’sdisease, osteoarthritis, prostate cancer, Crohn’s disease, and aortic an-eurysm), 9 were due to reported adverse events, and 2 were related toa condition that required another therapeutic intervention [conversionto neovascular AMD requiring anti–vascular endothelial growth factor(VEGF) treatment]. Although there was a numerically higher percent-age of discontinuations in the lampalizumab treatment groups versusthe pooled sham group, the overall range of dropout time among thethree treatment groups was predominantly overlapping (fig. S1). More-over, the onset of the treatment effect observed in the lampalizumabmonthly group at month 6 occurred when dropout rates and timing werevery similar across the treatment groups. There were no apparent differ-ences or patterns for discontinuations across the treatment groups.
Clinical, genetic, and pharmacokinetic analysesThe primary efficacy outcome measure was the mean change in geo-graphic atrophy area from baseline to month 18 assessed by fundus
by guest on June 8, 2019http://stm
.sciencemag.org/
ded from
Safety follow-up period (17/99) or open-label extension study (82/99)
Month 18
317 patients assessed for
eligibility
129 patients randomized 1:2:1:2
188 excluded 133 did not meet other eligibility criteria
37 did not meet best-corrected visual acuity inclusion criteria 15 patient withdrew consent
3 prohibited concomitant medication
44 patients allocated to 10-mg lampalizumab every other month
21 patients allocated to sham every other month
43 patients allocated to 10-mg lampalizumab
monthly
21 patients allocated to sham monthly
19 completed study 2 discontinued study
1 patient’s decision to withdraw 1 patient’s condition mandated
other therapeutic intervention
32 completed study 11 discontinued study
5 patient’s decision to withdraw
2 physician’s decision to withdraw
1 patient’s condition mandated other therapeutic intervention
3 adverse event
16 completed study 5 discontinued study
1 patient’s decision to withdraw 2 physician’s decision to withdraw
2 adverse event
32 completed study 12 discontinued study
5 patient’s decision to withdraw 3 physician’s decision to withdraw
4 adverse event
41 lampalizumab every othermonth patients included in
mITT analysis*
40 sham patients included in mITT analysis*
(sham groups pooled)
42 lampalizumab monthly patients included in
mITT analysis*
Fig. 1. MAHALO clinical trial flowchart. This was a phase 2, multicenter, randomized, controlled study that investigated the safety, tolerability, pharmacokinetics, andevidence of activity of lampalizumab in patients with geographic atrophy secondary to AMD. One hundred twenty-nine eligible patients were randomized 1:2:1:2 tosham monthly, 10-mg lampalizumab monthly, sham every other month, or 10-mg lampalizumab every other month. *One hundred twenty-three patients met theprespecified modified intention-to-treat (mITT) criteria for primary efficacy analysis. This population included all randomized patients who had one or more treatmentinjections and one or more post-baseline geographic atrophy measurements. Sham arms were pooled for analyses.
2 of 13

SC I ENCE TRANS LAT IONAL MED I C I N E | R E S EARCH ART I C L E
by guest on June 8, 2019http://stm
.sciencemag.org/
Dow
nloaded from
autofluorescence. Geographic atrophy may result in severe, irreversiblevisual function deficits; however, the decline in vision with diseaseprogression may be variable depending on the location of the geo-graphic atrophy lesion. As a result, geographic atrophy lesion area andprogression may not correlate well with central vision loss. Therefore,the quantitative measurement of geographic atrophy area progressionby fundus autofluorescence imaging has become an acceptable pri-mary endpoint for clinical studies.
In the primary analysis study population (mITT all-comer), the ad-justed mean change (that is, least-squares mean change adjustedfor baseline geographic atrophy area) from baseline to month 18 was2.9 mm2 in the pooled sham group, 2.3 mm2 in the lampalizumabmonthly group, and 3.1 mm2 in the lampalizumab every other monthgroup (Fig. 2A and table S1); the unadjusted mean change from base-line to month 18 was similar: 2.9, 2.2, and 3.1 mm2 in the correspond-ing treatment groups, respectively (table S1). Compared with growthof the geographic atrophy area in the pooled sham group, the reduc-tion in geographic atrophy area growth was 0.6 mm2 [80% confidenceinterval (CI), 0.1 to 1.1] for the lampalizumab monthly group and−0.2 mm2 (80% CI, −0.7 to 0.3) for the lampalizumab every other monthgroup (table S1). The lampalizumab monthly arm showed a 20% re-duction in mean change in geographic atrophy area progression relativeto the pooled sham group at month 18 (Fig. 2A). The 20% reductionin the monthly arm (80% CI, 4 to 37%; P = 0.117) met the prespecifiedsignificance level (P < 0.2) for the MAHALO phase 2 study. The pre-specified significance level in the MAHALO phase 2 was selected giventhat this was a proof-of-concept, hypothesis-generating clinical studywith smaller sample size designed to identify minimal treatment efficacythat would be investigated in confirmatory phase 3 studies (17, 18). Effi-cacy in the monthly lampalizumab arm was observed as early as month 6and continued for the duration of the 18-month study. In the primaryanalysis, there was no apparent treatment benefit observed in the lampa-lizumab every other month arm as compared with the pooled sham con-trol group. An evaluation of the lampalizumab treatment response andgeographic atrophy area progression from baseline to month 18 was alsoperformed in the primary analysis population based on stratificationof baseline geographic atrophy lesion area: <4 disc areas (<10 mm2)versus ≥4 disc areas (≥10 mm2) (a disc area is an anatomic metric
Yaspan et al., Sci. Transl. Med. 9, eaaf1443 (2017) 21 June 2017
equivalent to approximately 2.5 mm2). At month 18 relative to the shamcontrol group, the treatment effect of monthly lampalizumab was similarbetween these two subgroups [0.511 mm2 (80% CI, −0.069 to 1.092) inthe subgroup of <4 disc areas versus 0.536 mm2 (80% CI, −0.313 to1.385) in the subgroup of ≥4 disc areas]; these results showed thatmonthly lampalizumab treatment reduced geographic atrophy areaprogression regardless of baseline lesion size.
As a secondary endpoint and an independent imaging assessment,color fundus photography was used to evaluate the mean change ingeographic atrophy area from baseline to month 18. The adjusted meanarea change from baseline to month 18 was 2.8 mm2 in the pooled shamgroup, 2.2 mm2 in the lampalizumab monthly group, and 2.7 mm2 in thelampalizumab every other month group (table S1); the unadjusted meanchange from baseline to month 18 was 2.8, 2.1, and 2.6 mm2 in thepooled sham group, lampalizumab monthly group, and lampalizumabevery other month group, respectively (table S1). The results of colorfundus photography were consistent with the primary efficacy outcomewith fundus autofluorescence. Best-corrected visual acuity was also in-cluded as a secondary outcome measure with the objective to evaluatethe safety of lampalizumab versus sham treatment on visual acuity;best-corrected visual acuity is a test using standardized and optimalmethods to measure visual function in clinical trials. The mean changefrom baseline in best-corrected visual acuity at month 18 was −4.9 letters(80% CI, −7.3 to −2.4) for the pooled sham group, −3.3 letters (80%CI, −5.7 to −0.9) for the monthly lampalizumab group, and −1.4 letters(80% CI, −3.8 to 1.1) for the every other month lampalizumab group(Fig. 2B and table S2). The best-corrected visual acuity results showedno safety concerns with lampalizumab treatment relative to the shamcontrol.
Targeted genetic analyses and clinical subgroup outcomesWe hypothesized that common variants within the alternative com-plement pathway may affect geographic atrophy progression andlampalizumab treatment response. We performed a targeted, explor-atory genetic analysis to assess this possibility. To limit the multiple test-ing burden, we selected four single-nucleotide polymorphisms (SNPs)in loci containing complement genes: CFH, C2/CFB, CFI, and C3. Theselected SNP from each locus (CFH, rs1329428; C2/CFB, rs429608;
Table 1. Baseline characteristics of individual cohorts and all mITT patients. EOM, every other month; BCVA, best-corrected visual acuity; DA, disc area (1 DA =2.54 mm2); GA, geographic atrophy.
Sham pooled(n = 40)
Lampalizumab monthly(n = 42)
Lampalizumab EOM(n = 41)
All mITT patients(n = 123)
Patient demographics
Age (years), mean (SD)
78.5 (7.3) 80.4 (7.2) 77.2 (7.3) 78.7 (7.3)Sex (female), n (%)
24 (60.0) 28 (66.7) 18 (43.9) 70 (56.9)Race (white), n (%)
40 (100.0) 40 (95.2) 41 (100.0) 121 (98.4)Study eye characteristics
BCVA letters, mean (SD)
45.9 (13.4) 47.6 (12.8) 49.5 (11.0) 47.7 (12.4)Snellen equivalent (median)
20/125 20/100 20/100 20/100Total area of GA, DA (SD)
3.48 (1.65) 3.37 (1.52) 3.37 (1.93) 3.41 (1.69)Total area of GA, mm2 (SD)
8.85 (4.18) 8.56 (3.86) 8.56 (4.90) 8.65 (4.30)3 of 13

SC I ENCE TRANS LAT IONAL MED I C I N E | R E S EARCH ART I C L E
CFI, rs17440077; and C3, rs2230199) represented the variant, or bestavailable proxy, most associated by P value assessment with AMD riskfrom a recent genetic meta-analysis by the AMD Gene Consortium(8). Because of sample size considerations, risk-allele heterozygotesand homozygotes were combined into one group and designated asrisk-allele carriers. An assessment of geographic atrophy progressionand treatment effect at the CFH and C2/CFB loci was precluded bythe high prevalence of risk-allele carriers, 96% at the CFH and 98%at the C2/CFB loci. The prevalence of these risk alleles in the MAHALOstudy is consistent with other reports of risk-allele frequency in bilat-eral geographic atrophy cases (6) (table S3). An analysis of the C3 riskallele did not reveal an association with disease progression or treat-ment response (table S4). However, in carriers of the CFI risk allele,we observed a potential association with geographic atrophy progres-sion and a significant association (P = 0.0037) with lampalizumab
Yaspan et al., Sci. Transl. Med. 9, eaaf1443 (2017) 21 June 2017
by guehttp://stm
.sciencemag.org/
Dow
nloaded from
treatment response (table S4). Of the patients assayed in the MAHALOstudy, 57% were carriers of the common CFI risk allele.
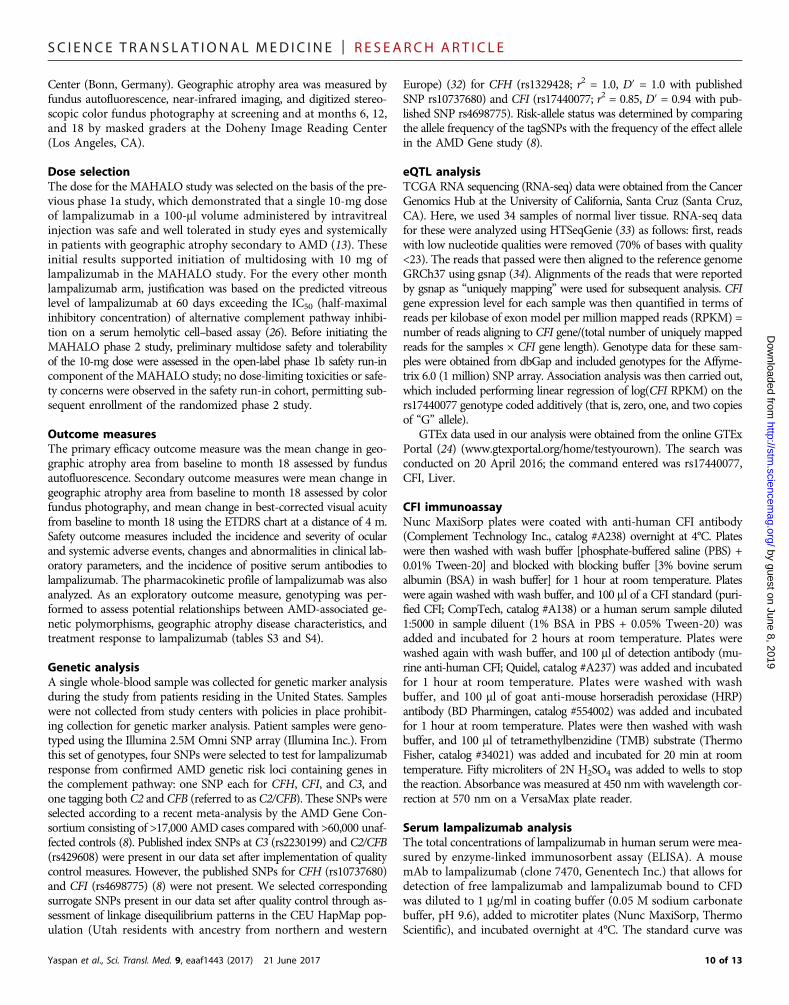
To assess disease progression based on CFI genotype, geographicatrophy area was measured by fundus autofluorescence in risk-allelecarriers and compared with noncarriers in the pooled sham group. Insham-treated CFI risk-allele carriers, a numerical increase of 49% ingeographic atrophy area progression at month 18 was observed ascompared with the sham-treated CFI risk-negative subgroup (Fig. 3and table S5). However, the study was not powered to detect a differ-ence in geographic atrophy area between the CFI risk-allele carriergroup and the CFI risk-negative sham group. Given the relatively smallsample size of the MAHALO phase 2 study, this numerical trend be-tween CFI risk-allele carrier and CFI risk-negative subgroups will re-quire further investigation in the ongoing phase 3 trials. The CFI genotypewas also evaluated for a potential association with lampalizumab treat-ment response. For CFI risk-allele carriers, there was a 44% reductionin geographic atrophy area progression at month 18 in the monthlylampalizumab-treated subgroup relative to the CFI pooled sham sub-group (95% CI, 15 to 73%; P = 0.0037) (Fig. 4A and table S5); representa-tive fundus autofluorescence images are shown in Fig. 4B. However, therewas no apparent lampalizumab treatment effect in CFI risk-negativepatients (Fig. 4C and table S5). On the basis of the mixed-effect modelwith baseline geographic atrophy area as a continuous variable, timepoint as a categorical variable, treatment, time-by-treatment interaction,treatment-by-CFI status, and baseline geographic atrophy category(≥10 mm2 versus <10 mm2), the test of treatment-by-CFI interactionshowed a P value of 0.014, suggesting an outcome consistent with apotential predictive marker. Moreover, the CFI subgroup analysis sug-gested that the 20% reduction in geographic atrophy area observed inthe monthly lampalizumab all-comer analysis (Fig. 2A) was driven ex-clusively by the 44% reduction in geographic atrophy area in the CFIrisk-allele carrier subgroup (Fig. 4, A and C).
Next, we analyzed the CFI genotype in the every other month sub-groups. In the CFI risk-allele carrier subgroup treated with lampalizumab
st on June 8, 2019
0
1
2
3
4
5
6
0 6 12 18
Sham pooled CFI+ Sham pooled CFI-(n = 14, 13, 12) (n = 18, 15, 17)
Month
4.2
2.8
Leas
t-sq
uare
s m
ean
chan
ge fr
om
base
line
in g
eogr
aphi
c at
roph
y ar
ea (m
m2 )
Fig. 3. Differential geographic atrophy area progression by fundus autofluo-rescence in the CFI+ (risk-allele carriers) versus CFI− (risk-negative) sham treat-ment subgroups. In sham-treated CFI risk-allele carriers, a numerical increase of49% in geographic atrophy area progression at month 18 was observed as com-pared with the sham-treated CFI risk-negative subgroup. The least-squares meanwas estimated from a linear mixed-effect model that included baseline geographicatrophy area as a continuous variable, time point as a categorical variable, treat-ment, time-by-treatment interaction, and baseline geographic atrophy category(≥10 mm2 versus <10 mm2). Vertical bars are 95% CIs of the least-squares mean.In parentheses, n corresponds to the number of patients at the 6-, 12-, and 18-monthtime points, respectively.
0
1
2
3
4
0 6 12 18
Leas
t-sq
uare
s m
ean
chan
ge fr
om b
asel
ine
in
geog
raph
ic a
trop
hy a
rea
(mm
2 )
Month
3.12.9
2.3
Sham pooled Lampalizumab monthly(n = 42)
Lampalizumab every other month
(n = 41)
(n = 40)
Sham pooled Lampalizumab monthly(n = 42)
Lampalizumab every other month
(n = 41)
(n = 40)
A
0 1 2 3 4 5 6 7 8 9 10 11 12 13 14 15 16 17 18–8
–6
–4
–2
0
2
4
6
Leas
t-sq
uare
s m
ean
chan
ge
from
bas
elin
e in
bes
t-co
rrec
ted
visu
al a
cuit
y (le
tter
s)
Month
–1.4
–3.3
–4.9
B
Fig. 2. Changes in geographic atrophy area and best-corrected visual acuityafter lampalizumab treatment. Shown are mean changes from baseline to month18 in geographic atrophy area by fundus autofluorescence (A) and in best-correctedvisual acuity (B) based on the mITT population. (A) The lampalizumab monthly armshowed a 20% reduction in mean change in geographic atrophy area progressionrelative to the pooled sham group at month 18; this result met the prespecified sig-nificance level (P < 0.2) for the study. (B) The best-corrected visual acuity resultsshowed no safety concerns with lampalizumab treatment relative to the sham con-trol. Adjusted mean in (A) and (B) is the least-squares mean from the stratified anal-ysis of variance (ANOVA) model adjusted for baseline geographic atrophy andbaseline best-corrected visual acuity, respectively, using last observation carriedforward (LOCF) data. Vertical bars are ±1 SE of the least-squares mean.
4 of 13

SC I ENCE TRANS LAT IONAL MED I C I N E | R E S EARCH ART I C L E
by guest on June 8, 2019http://stm
.sciencemag.org/
Dow
nloaded from
every other month, an 18% reduction in geographic atrophy area pro-gression at month 18 was observed relative to the pooled sham subgroup(95% CI, −11 to 47%; P = 0.2266; Fig. 5A and table S5). The efficacyobserved in the CFI risk-allele carrier monthly (44% reduction) and everyother month (18% reduction) subgroups appeared to be suggestive ofa dose response with lampalizumab (Fig. 5A). Moreover, as observed in
Yaspan et al., Sci. Transl. Med. 9, eaaf1443 (2017) 21 June 2017
the monthly lampalizumab-treated CFIrisk-negative patients, there was no appar-ent treatment effect in the CFI risk-negativeevery other month subgroup (Fig. 5B andtable S5). We also explored a potential ef-fect of CFI risk-allele carrier status on treat-ment response in patients with betterbaseline visual acuity (20/50 to 20/100);results from this assessment showed a54% reduction (95% CI, 21 to 88%; P =0.0029) in geographic atrophy area progres-sion at month 18 withmonthly administra-tion of lampalizumab and a 31% reduction(95% CI, −2 to 65%; P = 0.0676) in geo-graphic atrophy area progression at month18 with every other month lampalizumabtreatment relative to pooled sham control(table S6). Gender segmentation based onCFI risk-allele carrier status was also eval-uated in the pooled sham subgroup andshowed a more rapid mean change ingeographic atrophy area from baselineto month 18 in women versus men(5.02 mm2 versus 3.18 mm2, respectively)(table S7); however, the individual lam-palizumab treatment benefit for womenand men was nevertheless comparablewith the combined CFI risk-allele carriermonthly subgroup reduction of 44% ingeographic atrophy area progression atmonth 18 relative to the pooled shamcontrol (Fig. 4A).
SNP rs17440077 was selected as a proxyfor the published SNP rs4698775 (r2 = 0.85)because it was not on the genotyping plat-form. Subsequently, we imputed and geno-typed SNP rs4698775; efficacy results withSNP rs4698775 were consistent with SNPrs17440077 (fig. S2 and table S8). Raremissense variants of CFI have also beenreported to be enriched in AMD cases rela-tive to controls (19–21). In the MAHALOanalysis, six patients carried CFI missensevariants and were equally distributed acrossthe treatment arms; the extremely smallsample size prevented a meaningful analy-sis of the missense variants.
Functional association withthe CFI risk SNPSNP rs17440077 is an intronic variant,which is not in linkage disequilibrium withany amino acid coding CFI variants. To in-
vestigate a potential functional consequence of the risk haplotype de-fined by SNP rs17440077, we examined whether this variant may bean expression quantitative trait locus (eQTL) affecting messenger RNA(mRNA) expression of endogenous CFI. We analyzed expression datafrom normal tissues from The Cancer Genome Atlas (TCGA) (22).The TCGA database contains both tumor and normal tissue samples;
C
B
A
0
1
2
3
4
5
6
0 6 12 18Month
3.12.8
Sham pooled CFI− Lampalizumab monthly CFI− (n = 18, 15, 17) (n = 12, 11, 9)
0
1
2
3
4
5
6
0 6 12 18
Sham pooled CFI+(n = 14, 13, 12) (n = 17, 17, 16)
Lampalizumab monthly CFI+
4.2
2.3
Leas
t-sq
uare
s m
ean
chan
ge fr
om b
asel
ine
in
geog
raph
ic a
trop
hy a
rea
(mm
2 )
Leas
t-sq
uare
s m
ean
chan
ge fr
om b
asel
ine
in
geog
raph
ic a
trop
hy a
rea
(mm
2 )
Month
Sham CFI+ Baseline Month 18
Lampalizumab monthly CFI+ Baseline Month 18
Fig. 4. Geographic atrophy progression in CFI risk-allele carriers and risk-negative subpopulations after monthlylampalizumab treatment. Shown is geographic atrophy progression by fundus autofluorescence in the CFI+ (risk-allele carriers) and CFI− (risk-negative) subgroups (rs17440077) with monthly lampalizumab treatment versus shamtreatment. (A) In the CFI+ subpopulation, there was a 44% reduction in geographic atrophy area progression withmonthly lampalizumab treatment versus sham control at month 18. (B) Representative fundus autofluorescenceimages at baseline and month 18 for the CFI+ subpopulation. Relative geographic atrophy area progression is shownfor the sham and lampalizumab monthly treated groups. (C) In the CFI− subpopulation, there was no apparent benefitwith monthly lampalizumab treatment versus sham control at month 18. The least-squares mean was estimated from alinear mixed-effect model that included baseline geographic atrophy area as a continuous variable, time point as acategorical variable, treatment, time-by-treatment interaction, and baseline geographic atrophy category (≥10 mm2
versus <10 mm2). Vertical bars are 95% CIs of the least-squares mean. In parentheses, n corresponds to the numberof patients at the 6-, 12-, and 18-month time points, respectively.
5 of 13

SC I ENCE TRANS LAT IONAL MED I C I N E | R E S EARCH ART I C L E
by guest on June 8, 2019http://stm
.sciencemag.org/
Dow
nloaded from
however, we only used data from normal tissues to avoid potential tu-mor effects. The highest expression of CFI was in the liver. This is con-sistent with liver being the site of synthesis for CFI, and this finding wasalso observed in the BioGPS centralized gene portal (23). In 34 TCGAnormal liver samples, there was a statistically significant association (P =0.02) between the SNP rs17440077 genotype and CFI expression, withthe AA genotype (homozygous risk negative) associated with increasedmRNA compared to AG (heterozygous risk carrier) and GG (homozy-gous risk carrier) genotypes (Fig. 6). This direction of effect is con-sistent with risk-allele carriers having decreased CFI activity, leading
Yaspan et al., Sci. Transl. Med. 9, eaaf1443 (2017) 21 June 2017
to complement-driven geographic atrophyarea progression. As with the geographic at-rophy area efficacy analysis, SNP rs4698775eQTL results (P = 0.02) were consistentwith SNP rs17440077. Additionally, we as-sessed the online Genotype-Tissue Expres-sion (GTEx) expression database portal(24); in 97 liver tissue samples, the direc-tion of the effect was aligned with theTCGA-based analysis (P = 0.10).
To further investigate a possible func-tional effect of the CFI SNP, we measuredCFI in patient serum from the MAHALOstudy. In patients with the common CFIvariant, we did not observe a statisticallysignificant difference in serumCFI concen-trations between CFI risk-allele carriers andCFI risk-negative carriers for rs17440077(fig. S3) or rs4698775 (fig. S4). However,as with a previous report showing less CFIin the serum of carriers of CFI rare aminoacid–changing variants (21), we found thata subgroup of CFI rare variant carriers inthe MAHALO study had decreased CFI inserum (figs. S3 and S4). Our eQTL analysisand rare variant serum data suggested thatboth common and rare risk variants mayresult in decreased CFI and that odds ratiosfor these variants should be considered ininterpreting these results. The odds ratiofor the common variant in the AMDGeneConsortium study is 1.14 (8), whereas theodds ratio for the G119R rare variant is22.20 (20). On the basis of these differences,we may anticipate that any observable ex-pression difference would be much moreprofound in a rare variant carrier, and asmall expression difference for the commonvariant may not be detectable in a serum as-say with the relatively small MAHALOsample size. Our results appear to suggestthat the transcript-based eQTL approachmay be a more powerful method to inves-tigate expression differences for a CFIcommon variant carrier in the MAHALOstudy. Moreover, steady-state serum con-centration of CFI is not only a reflectionof transcriptional activity in the liver butalso a reflection of protein translation,
protein turnover, and biodistribution; these variables may make itchallenging to detect small CFI protein differences in serum. For serumanalyses, much larger sample sets may be required to detect a significantdifference in serum CFI on the basis of the common CFI risk allele.
Ocular and systemic safety outcomesThe MAHALO study demonstrated an acceptable safety profileduring the 18-month treatment period (Table 2). There were numer-ically more cases of systemic (nonocular) serious adverse events(SAEs) in the pooled sham group (Table 2). The most common study
B
A
0
1
2
3
4
5
6
0 6 12 18
2.92.8
3.1
0
1
2
3
4
5
6
0 6 12 18
4.2
3.4
2.3
Month
Leas
t-sq
uare
s m
ean
chan
ge fr
om b
asel
ine
in
geog
raph
ic a
trop
hy a
rea
(mm
2 )
Leas
t-sq
uare
s m
ean
chan
ge fr
om b
asel
ine
in
geog
raph
ic a
trop
hy a
rea
(mm
2 )
Sham pooled CFI+ (n = 14, 13, 12)
Lampalizumab every other month CFI+(n = 19, 15, 14) (n = 17, 17, 16)
Lampalizumab monthly CFI+
Sham pooled CFI−
(n = 18, 15, 17)
Lampalizumab every other month CFI−(n = 9, 10, 9)
Lampalizumab monthly CFI−
(n = 12, 11, 9)
MonthFig. 5. Geographic atrophy progression in CFI risk-allele carriers and risk-negative subpopulations afterlampalizumab treatment. Geographic atrophy area by fundus autofluorescence in the CFI+ risk-allele carriers(A) and CFI− risk-negative (B) subpopulations (rs17440077) after monthly and every other month lampalizumab treat-ment versus sham treatment. (A) In the CFI+ subpopulation, there was an 18% reduction in geographic atrophy areaprogression with lampalizumab treatment every other month versus sham control at month 18; moreover, there wasa potential dose response between the monthly and every other month lampalizumab treatment subpopulations.(B) Consistent with the CFI− monthly lampalizumab subgroup, there was no apparent treatment benefit with everyother month lampalizumab treatment versus sham control at month 18. The least-squares mean was estimatedfrom a linear mixed-effect model that included baseline geographic atrophy area as a continuous variable, timepoint as a categorical variable, treatment, time-by-treatment interaction, and baseline geographic atrophy category(≥10 mm2 versus <10 mm2). Vertical bars are 95% CIs of the least-squares mean. In parentheses, n corresponds to
the number of patients at the 6-, 12-, and 18-month time points, respectively.6 of 13

SC I ENCE TRANS LAT IONAL MED I C I N E | R E S EARCH ART I C L E
by guest on June 8, 2019http://stm
.sciencemag.org/
Dow
nloaded from
eye ocular adverse events were considered to be associated with theinjection procedure (Table 2) and were similar to other agents admin-istered intravitreally. There were no intraocular infections (endophthal-mitis), and rates of intraocular inflammation and intraocular pressureelevation were consistent with the anti-VEGF Fab ranibizumab ratesin neovascular AMD (25). At baseline, the mean study eye intraocularpressure was similar across the sham and lampalizumab monthly andevery other month treatment groups. Mean changes from baseline inpredose intraocular pressure at each month were negligible for each ofthe treatment groups in the study eye; most patients had a change of<5 mmHg postdose compared with predose intraocular pressure inthe study eye at each treatment visit. There were no unanticipatedor unmanageable SAEs reported, and there were no deaths or ocularSAEs suspected to be caused by the study drug. There were no ocularSAEs in the study eye that led to treatment discontinuation. Summa-ries of ocular adverse events in fellow (nonstudy) eyes, systemic ad-verse events, and adverse events suspected to be caused by study drugare presented in tables S9 to S11, respectively. As shown in table S11,adverse events suspected to be caused by the study drug based on in-vestigator opinion were minimal; moreover, the vast majority of ad-verse events suspected to be caused by the study drug were reported assingle events with no clear or consistent safety signal. Laboratory testresults from serum chemistry, hematology, complement assays, andurinalysis did not identify any patterns of lampalizumab-related ef-fects. The immunogenicity rates for lampalizumab were consistent withthe anti-VEGF Fab ranibizumab in neovascular AMD studies (25), andthere was no apparent anti-therapeutic antibody effect on efficacy, safe-ty, or pharmacokinetics.
Serum, aqueous, and pharmacokinetic analysesLampalizumab concentrations in serum samples were quantified tocharacterize systemic pharmacokinetics. At prespecified time points inlampalizumab-treated patients, observed and model-predicted serumlampalizumab concentrations using a population pharmacokineticsand pharmacodynamics model were well below the minimum con-
Yaspan et al., Sci. Transl. Med. 9, eaaf1443 (2017) 21 June 2017
centration required to show transient systemic inhibition of the alter-native complement pathway in preclinical studies (table S12) (26, 27).Serum lampalizumab concentrations appeared to reach steady stateafter the first dose in both the monthly and every other month groups.On the basis of the geometric means of the trough concentration(Cmin)–based accumulation ratios, the monthly and every other monthgroups did not demonstrate systemic accumulation of lampalizumabbetween the first dose and subsequent doses as evidenced by accumu-lation ratios of about 1 (table S13). The noncompartmental andmodel-based population pharmacokinetic analysis for the MAHALOstudy showed that the ocular half-life of lampalizumab after intra-vitreal administration was 6 days, which agrees with the previous re-sults (13). In the MAHALO study, we measured CFD and lampalizumabin the aqueous humor and used modeling to predict concentrations ofstudy drug and ocular target suppression in the vitreous humor; thisanalysis showed that free target (CFD) was substantially suppressed upto day 60 after administration of lampalizumab (27). MAHALO pop-ulation pharmacokinetic analysis showed that once lampalizumabentered the systemic circulation, it was cleared relatively quickly witha serum half-life of about 9 hours (27). Furthermore, the pharmaco-kinetic analysis showed that there were no apparent differences in ocularor serum exposures between CFI risk–allele positive and risk-negativesubgroups (table S12); these results indicate that pharmacokinetic-related factors did not contribute to the efficacy observed in patientswith the CFI common risk allele.
DISCUSSIONGeographic atrophy continues to represent a significant unmet med-ical need because there are no approved or effective treatments for thisvision-impairing advanced form of AMD. Various aspects of geo-graphic atrophy have been investigated in mouse models (6); however,as a result of inadequate animal models that cannot replicate thecomplexity and anatomic features of the human disease, discoveryand validation of new therapeutic targets for geographic atrophy havefocused on human AMD genetic studies. Aberrant activation of thealternative complement pathway has been implicated in the patho-genesis of AMD. Moreover, common variant genetic analyses have dem-onstrated a strong correlation between the risk of developing AMDand genes regulating the alternative complement pathway, includingthe critical negative regulators CFH and CFI, as well as CFB and C3.CFD is a pivotal, rate-limiting enzyme that acts early in the alternativecomplement pathway. The MAHALO study targeted CFD with lampa-lizumab in patients with geographic atrophy secondary to AMD.
The MAHALO efficacy results represent a potential treatment benefitin reducing geographic atrophy area progression with a complementinhibitor. Moreover, lampalizumab efficacy was increased in a sub-population of patients: the 20% reduction in geographic atrophy areaobserved in the monthly lampalizumab all-comer analysis was drivenby the 44% reduction in geographic atrophy area in the CFI risk-allelecarrier subgroup. The MAHALO study results also show that modu-lating the complement system can alter the course of geographic at-rophy, a hypothesis supported by human genetics where common andrare variants in genes of the alternative complement pathway increaserisk of AMD. Finally, we report eQTL data as a potential functionalassociation with the CFI common risk SNP, where the presence of therisk allele is associated with decreased expression of CFI mRNA. Ascompared with the all-comer MAHALO population, an exploratorysubanalysis by CFI genotype increased the observed lampalizumab
Liver tissue, P = 0.02
5.5
6.0
AA AG GG
CFI e
xpre
ssio
n le
vel
GenotypeAA (n = 19)
AG (n = 12)
GG (n = 3)
CFI+ CFI−
Fig. 6. CFI mRNA expression in normal liver tissue differs by rs17440077 geno-type. Expression of CFImRNA in tissue from TCGA database (22) was analyzed andfound to differ according to the rs17440077 genotype. The highest expression ofCFI mRNA was in the liver, the site of CFI synthesis.
7 of 13

SC I ENCE TRANS LAT IONAL MED I C I N E | R E S EARCH ART I C L E
by guest on June 8, 2019http://stm
.sciencemag.org/
Dow
nloaded from
treatment effect more than twofold (20% versus 44%) in the monthlygroup and enabled detection of a treatment effect in the lampalizumabevery other month group. Moreover, the magnitude of the lampalizu-mab treatment benefit in monthly and every other month CFI risk-allele carriers was suggestive of a dose response that was not apparentin the all-comer population. Furthermore, although SNP rs17440077is located within an intron of the gene CCDC109B, given the strongcomplement component associated with AMD risk, CFI appears to
Yaspan et al., Sci. Transl. Med. 9, eaaf1443 (2017) 21 June 2017
represent the most plausible causal gene at this locus. Presumably, be-cause of a comparatively lower odds ratio of 1.14 for the strongest as-sociated common SNP at the CFI locus in AMD risk, CFI has not beenconsidered a major contributor to AMD pathogenesis as compared withthe CFH and ARMS2/HTRA1 loci (8). However, a recent next-generationsequencing study has shown that rare CFI missense mutations areenriched about fourfold in AMD cases compared with controls (19).Moreover, another study has shown that this type of variation has a
Table 2. Adverse events in the MAHALO phase 2 clinical trial. All data are n (%). AE, adverse event; MedDRA, Medical Dictionary for Regulatory Activities.
Overall profile
Adverse event
Sham pooled(n = 42)
Lampalizumab monthly(n = 43)
Lampalizumab EOM(n = 44)
Patients with at least one event, n (%)
Ocular SAEs in the study eye
1 (2.4) 0 3 (6.8)Ocular SAEs in the fellow eye
1 (2.4) 0 2 (4.5)Systemic (nonocular) SAEs
15 (35.7) 11 (25.6) 10 (22.7)Ocular AE in the study eye suspected to be caused by study drug
0 4 (9.3) 3 (6.8)Nonocular AE suspected to be caused by study drug
0 1 (2.3) 1 (2.3)Ocular adverse events in the study eye (occurring in ≥3 patients in any group; all treated patients)
MedDRA-preferred term
Sham pooled(n = 42)
Lampalizumab monthly(n = 43)
Lampalizumab EOM(n = 44)
Any ocular AEs in the study eye, n (%)
24 (57.1) 36 (83.7) 30 (68.2)Ocular AEs in the study eye occurring in ≥3 patients in any group, n (%)
AMD
0 2 (4.7) 3 (6.8)Blepharitis
2 (4.8) 1 (2.3) 6 (13.6)Cataract
3 (7.1) 2 (4.7) 3 (6.8)Conjunctival hemorrhage
9 (21.4) 21 (48.8) 15 (34.1)Conjunctival edema
0 1 (2.3) 3 (6.8)Dry eye
0 2 (4.7) 3 (6.8)Eye irritation
1 (2.4) 4 (9.3) 4 (9.1)Eye pain
4 (9.5) 10 (23.3) 6 (13.6)Eye pruritus
3 (7.1) 1 (2.3) 3 (6.8)Foreign body sensation in eyes
1 (2.4) 4 (9.3) 2 (4.5)Intraocular pressure increased
0 6 (14.0) 7 (15.9)Lacrimation increased
1 (2.4) 3 (7.0) 4 (9.1)Ocular hyperemia
2 (4.8) 3 (7.0) 5 (11.4)Punctate keratitis
1 (2.4) 4 (9.3) 2 (4.5)Retinal hemorrhage
3 (7.1) 1 (2.3) 3 (6.8)Vision blurred
1 (2.4) 2 (4.7) 3 (6.8)Vitreous detachment
3 (7.1) 2 (4.7) 4 (9.1)Vitreous floaters
1 (2.4) 3 (7.0) 2 (4.5)8 of 13

SC I ENCE TRANS LAT IONAL MED I C I N E | R E S EARCH ART I C L E
by guest on June 8, 2019http://stm
.sciencemag.org/
Dow
nloaded from
large impact on AMD risk (P = 3.9 × 10⁻⁶; odds ratio, 22.20) (20).Additionally, a recent study has examined the relationship betweenserum CFI and the presence of rare CFImissense variants in advancedAMD cases (21). This report found that 42% of advanced AMD caseswith a rare CFI missense variant had lower CFI as compared to 8% ofadvanced AMD cases without a rare variant. This study also assessed apreviously reported common SNP rs10033900 at the CFI locus and foundno differences in CFI serum concentrations comparing risk-positive andrisk-negative homozygotes. Another recent study assessed the effect ofSNP rs2285714 at the CFI locus on geographic atrophy progressionand found no apparent association (28). Notably, SNPs rs10033900and rs2285714 are in relatively strong linkage disequilibrium witheach other (r2 = 0.78; table S14) but not with SNPs rs17440077 andrs4698775 (r2 < 0.35; table S14) that were used in the MAHALO anal-ysis. Consistent with the findings in these reports, we did not identifya potential CFImarker association or observe differential CFI gene ex-pression in eQTL analysis with either SNP rs10033900 or rs2285714.Consequently, whereas the causal variant at the CFI locus remains tobe determined, SNP rs17440077 (or SNP rs4698775) as tested in theMAHALO study analysis would seem to represent a more plausiblecandidate or proxy as compared with either SNP rs10033900 or SNPrs2285714 given the observed treatment response in risk-allele carrierMAHALO patients and the apparent differential CFI gene expressionin the eQTL analysis.
Our data from the MAHALO phase 2 study provide a proof of con-cept for targeting CFD in patients with geographic atrophy secondary toAMD. As noted, the results of this study involved a relatively limitednumber of geographic atrophy patients; consequently, conclusions onlong-term safety and efficacy of lampalizumab will require more exten-sive investigation in ongoing phase 3 clinical trials.
A limitation of our study is the relatively small sample size inher-ent in phase 2 investigations. Our results do not exclude the possibilitythat CFI risk-negative patients may also show benefit from inhibitionof complement activity but require increased dosing for evidence ofefficacy. Furthermore, although genetic analyses for disease character-istics and treatment response were prespecified, the precise SNPs forthe analysis were not predefined. Our observations of the potentialpredictive effect in geographic atrophy associated with the commonCFI SNP rs17440077 (or SNP rs4698775) were based on the MAHALOinclusion and exclusion criteria and study population; for meaning-ful evaluations, comparative analyses in other geographic atrophy studypopulations should be performed with a randomized design and theMAHALO inclusion and exclusion criteria (for example, baseline geo-graphic atrophy lesion characteristics in the absence of choroidal neo-vascularization, banded or diffuse fundus autofluorescence patterns, andfellow eye geographic atrophy disease burden). Finally, the MAHALOstudy was not designed to detect a difference at month 18 in geographicatrophy area progression between the CFI risk–allele positive and CFIrisk-negative sham subgroups; the numerical difference observed atmonth 18 between these subgroups and a potential prognostic effectwill require further assessment in the ongoing phase 3 lampalizumabtrials (CHROMA, NCT02247479; SPECTRI, NCT02247531).
The results from the MAHALO phase 2 study provide evidence thattargeting CFD in the alternative complement pathway has the po-tential to be an effective and safe treatment for patients with geographicatrophy secondary to AMD. Our results indicate that modulating thealternative complement pathway can alter the course of geographicatrophy, thus supporting the complement hypothesis in the patho-genesis of AMD.
Yaspan et al., Sci. Transl. Med. 9, eaaf1443 (2017) 21 June 2017
MATERIALS AND METHODSStudy designMAHALO was an 18-month multicenter, randomized, single-masked,sham injection–controlled, phase 2 study conducted in the UnitedStates (ClinicalTrials.gov identifier, NCT01229215) and Germany(EudraCT number, 2010-019183-36) between May 2011 and April2013. Institutional review board and ethics committee approval wasobtained before study initiation at each of the 32 study sites; all pa-tients provided written informed consent. MAHALO enrolled 129patients who met the inclusion criteria for the study (Fig. 1). Atmonth 18, patients either continued into the open-label extensionstudy (ClinicalTrials.gov identifier, NCT01602120; EudraCT num-ber, 2012-000578-41) or completed a 3-month safety follow-up pe-riod (Fig. 1).
Inclusion criteriaFor enrollment, patients had to meet the following major inclusioncriteria: age 60 to 89 years; willingness and ability to provide informedconsent; for the study eye, best-corrected visual acuity of 20/50 to 20/400 inclusive (Snellen equivalent) using Early Treatment DiabeticRetinopathy Study (ETDRS) charts; for both study and nonstudy eyes,geographic atrophy secondary to AMD in the absence of choroidalneovascularization; for the study eye, a geographic atrophy lesion sizeof ≥2.5 mm2 and ≤17.5 mm2; geographic atrophy lesion must residecompletely within fundus autofluorescence imaging field; banded ordiffuse fundus autofluorescence patterns adjacent to the geographicatrophy lesion; and sufficiently clear ocular media.
Exclusion criteriaMajor exclusion criteria included the following: geographic atrophyin the study eye that fails to meet lesion size criteria or extends beyondthe fundus autofluorescence imaging field, geographic atrophy ineither eye due to causes other than AMD, focal or no fundus autofluo-rescence pattern adjacent to the geographic atrophy lesion, active orhistory of neovascular AMD, diabetic retinopathy in either eye, activeor history of infectious or inflammatory ocular disease in either eye, se-lect ocular and systemic conditions including malignancy, and the useof prohibited concomitant medications.
Randomization, masking, and treatment scheduleEligible patients were enrolled on day 0 and randomized across fourarms using an interactive web response system in a 1:2:1:2 ratio to re-ceive shammonthly injections, intravitreal 10-mg lampalizumab month-ly injections, sham every other month injections, or intravitreal 10-mglampalizumab every other month injections. Because there is risk with-out potential benefit with a placebo intravitreal injection, sham injectionshave served as the acceptable control for study drug injections (29, 30).Randomization was stratified by baseline geographic atrophy lesion size,<4 disc areas (<10 mm2) versus ≥4 disc areas (≥10 mm2). All patientsfollowed a monthly visit schedule regardless of treatment group assign-ment. Patients, study personnel responsible for performing the best-corrected visual acuity assessment, and the reading center were maskedto treatment assignment; the primary efficacy endpoint (geographic at-rophy area by fundus autofluorescence) was an objective, quantitativeoutcome measure that was not influenced by a patient’s perception oftreatment assignment. Screening eligibility for geographic atrophy lesioncharacteristics [geographic atrophy secondary to AMD, perilesionalautofluorescence patterns (31), and geographic atrophy in the absenceof choroidal neovascularization] was completed at the GRADE Reading
9 of 13
SC I ENCE TRANS LAT IONAL MED I C I N E | R E S EARCH ART I C L E
by guest on June 8, 2019http://stm
.sciencemag.org/
Dow
nloaded from
Center (Bonn, Germany). Geographic atrophy area was measured byfundus autofluorescence, near-infrared imaging, and digitized stereo-scopic color fundus photography at screening and at months 6, 12,and 18 by masked graders at the Doheny Image Reading Center(Los Angeles, CA).
Dose selectionThe dose for the MAHALO study was selected on the basis of the pre-vious phase 1a study, which demonstrated that a single 10-mg doseof lampalizumab in a 100-ml volume administered by intravitrealinjection was safe and well tolerated in study eyes and systemicallyin patients with geographic atrophy secondary to AMD (13). Theseinitial results supported initiation of multidosing with 10 mg oflampalizumab in the MAHALO study. For the every other monthlampalizumab arm, justification was based on the predicted vitreouslevel of lampalizumab at 60 days exceeding the IC50 (half-maximalinhibitory concentration) of alternative complement pathway inhibi-tion on a serum hemolytic cell–based assay (26). Before initiating theMAHALO phase 2 study, preliminary multidose safety and tolerabilityof the 10-mg dose were assessed in the open-label phase 1b safety run-incomponent of the MAHALO study; no dose-limiting toxicities or safe-ty concerns were observed in the safety run-in cohort, permitting sub-sequent enrollment of the randomized phase 2 study.
Outcome measuresThe primary efficacy outcome measure was the mean change in geo-graphic atrophy area from baseline to month 18 assessed by fundusautofluorescence. Secondary outcome measures were mean change ingeographic atrophy area from baseline to month 18 assessed by colorfundus photography, and mean change in best-corrected visual acuityfrom baseline to month 18 using the ETDRS chart at a distance of 4 m.Safety outcome measures included the incidence and severity of ocularand systemic adverse events, changes and abnormalities in clinical lab-oratory parameters, and the incidence of positive serum antibodies tolampalizumab. The pharmacokinetic profile of lampalizumab was alsoanalyzed. As an exploratory outcome measure, genotyping was per-formed to assess potential relationships between AMD-associated ge-netic polymorphisms, geographic atrophy disease characteristics, andtreatment response to lampalizumab (tables S3 and S4).
Genetic analysisA single whole-blood sample was collected for genetic marker analysisduring the study from patients residing in the United States. Sampleswere not collected from study centers with policies in place prohibit-ing collection for genetic marker analysis. Patient samples were geno-typed using the Illumina 2.5M Omni SNP array (Illumina Inc.). Fromthis set of genotypes, four SNPs were selected to test for lampalizumabresponse from confirmed AMD genetic risk loci containing genes inthe complement pathway: one SNP each for CFH, CFI, and C3, andone tagging both C2 and CFB (referred to as C2/CFB). These SNPs wereselected according to a recent meta-analysis by the AMD Gene Con-sortium consisting of >17,000 AMD cases compared with >60,000 unaf-fected controls (8). Published index SNPs at C3 (rs2230199) and C2/CFB(rs429608) were present in our data set after implementation of qualitycontrol measures. However, the published SNPs for CFH (rs10737680)and CFI (rs4698775) (8) were not present. We selected correspondingsurrogate SNPs present in our data set after quality control through as-sessment of linkage disequilibrium patterns in the CEU HapMap pop-ulation (Utah residents with ancestry from northern and western
Yaspan et al., Sci. Transl. Med. 9, eaaf1443 (2017) 21 June 2017
Europe) (32) for CFH (rs1329428; r2 = 1.0, D′ = 1.0 with publishedSNP rs10737680) and CFI (rs17440077; r2 = 0.85, D′ = 0.94 with pub-lished SNP rs4698775). Risk-allele status was determined by comparingthe allele frequency of the tagSNPs with the frequency of the effect allelein the AMD Gene study (8).
eQTL analysisTCGA RNA sequencing (RNA-seq) data were obtained from the CancerGenomics Hub at the University of California, Santa Cruz (Santa Cruz,CA). Here, we used 34 samples of normal liver tissue. RNA-seq datafor these were analyzed using HTSeqGenie (33) as follows: first, readswith low nucleotide qualities were removed (70% of bases with quality<23). The reads that passed were then aligned to the reference genomeGRCh37 using gsnap (34). Alignments of the reads that were reportedby gsnap as “uniquely mapping” were used for subsequent analysis. CFIgene expression level for each sample was then quantified in terms ofreads per kilobase of exon model per million mapped reads (RPKM) =number of reads aligning to CFI gene/(total number of uniquely mappedreads for the samples × CFI gene length). Genotype data for these sam-ples were obtained from dbGap and included genotypes for the Affyme-trix 6.0 (1 million) SNP array. Association analysis was then carried out,which included performing linear regression of log(CFI RPKM) on thers17440077 genotype coded additively (that is, zero, one, and two copiesof “G” allele).
GTEx data used in our analysis were obtained from the online GTExPortal (24) (www.gtexportal.org/home/testyourown). The search wasconducted on 20 April 2016; the command entered was rs17440077,CFI, Liver.
CFI immunoassayNunc MaxiSorp plates were coated with anti-human CFI antibody(Complement Technology Inc., catalog #A238) overnight at 4°C. Plateswere then washed with wash buffer [phosphate-buffered saline (PBS) +0.01% Tween-20] and blocked with blocking buffer [3% bovine serumalbumin (BSA) in wash buffer] for 1 hour at room temperature. Plateswere again washed with wash buffer, and 100 ml of a CFI standard (puri-fied CFI; CompTech, catalog #A138) or a human serum sample diluted1:5000 in sample diluent (1% BSA in PBS + 0.05% Tween-20) wasadded and incubated for 2 hours at room temperature. Plates werewashed again with wash buffer, and 100 ml of detection antibody (mu-rine anti-human CFI; Quidel, catalog #A237) was added and incubatedfor 1 hour at room temperature. Plates were washed with washbuffer, and 100 ml of goat anti-mouse horseradish peroxidase (HRP)antibody (BD Pharmingen, catalog #554002) was added and incubatedfor 1 hour at room temperature. Plates were then washed with washbuffer, and 100 ml of tetramethylbenzidine (TMB) substrate (ThermoFisher, catalog #34021) was added and incubated for 20 min at roomtemperature. Fifty microliters of 2N H2SO4 was added to wells to stopthe reaction. Absorbance was measured at 450 nm with wavelength cor-rection at 570 nm on a VersaMax plate reader.
Serum lampalizumab analysisThe total concentrations of lampalizumab in human serum were mea-sured by enzyme-linked immunosorbent assay (ELISA). A mousemAb to lampalizumab (clone 7470, Genentech Inc.) that allows fordetection of free lampalizumab and lampalizumab bound to CFDwas diluted to 1 mg/ml in coating buffer (0.05 M sodium carbonatebuffer, pH 9.6), added to microtiter plates (Nunc MaxiSorp, ThermoScientific), and incubated overnight at 4°C. The standard curve was
10 of 13

SC I ENCE TRANS LAT IONAL MED I C I N E | R E S EARCH ART I C L E
by guest on June 8, 2019http://stm
.sciencemag.org/
Dow
nloaded from
prepared in 10% normal human serum (BioreclamationIVT) contain-ing mouse immunoglobulin G (IgG) (50 mg/ml; Equitech-Bio Inc.).Assay controls and samples were diluted at a minimum of 1:10 in as-say buffer containing mouse IgG (50 mg/ml). Standards, controls, andsamples were added to the plates and incubated overnight at roomtemperature. Human CFD (100 ng/ml; Complement Technology Inc.),biotin-labeled mouse mAb to CFD (clone 4676, Genentech Inc.), high-sensitivity streptavidin-HRP (Thermo Scientific), and tetrabutylammo-nium borohydride substrate (Kirkegaard & Perry Laboratories Inc.) weresequentially added, and the reaction was stopped with 1 M phosphoricacid. Plates were read using a microplate reader (SpectraMax 190;Molecular Devices LLC), and lampalizumab concentrations were calcu-lated from a four-parameter fit of the standard curve on each plate (SoftMaxPro; Molecular Devices LLC). The minimum quantifiable lampalizumabconcentration in human serum was 350 pg/ml.
Aqueous lampalizumab analysisThe total concentrations of lampalizumab in human aqueous humorwere measured by ELISA. A mouse mAb to lampalizumab (clone7470, Genentech Inc.) that allows for detection of free lampalizumaband lampalizumab bound to CFD was diluted to 2 mg/ml in coatingbuffer (0.05 M sodium carbonate buffer, pH 9.6), added to microtiterplates (Nunc MaxiSorp, Thermo Scientific), and incubated overnight at4°C. The standard curve was prepared in assay buffer containing mouseIgG (50 mg/ml; Equitech-Bio Inc.). Assay controls and samples were di-luted at a minimum of 1:100 in assay buffer containing mouse IgG.Standards, controls, and samples were added to the plates and incu-bated for 2 hours at room temperature. Human CFD (50 ng/ml; Com-plement Technology Inc.), HRP-labeled mouse mAb to CFD (clone4676, Genentech Inc.), and TMB substrate (Kirkegaard & Perry Labora-tories Inc.) were sequentially added, and the reaction was stoppedwith 1 M phosphoric acid. Plates were read using a microplate reader(SpectraMax 190; Molecular Devices LLC), and lampalizumab concen-trations were calculated from a four-parameter fit of the standard curveon each plate (SoftMax Pro; Molecular Devices). The minimum quan-tifiable lampalizumab concentration in human serum was 30 ng/ml.
Pharmacokinetic analysisPharmacokinetic parameters were analyzed using noncompart-mental analysis and model-based population pharmacokinetic/pharmacodynamic (PK/PD) analysis. An extensive model-based pop-ulation PK/PD analysis has been reported elsewhere (27) and was usedto predict serum and aqueous concentrations over the entire timecourse to enable peak concentration (Cmax) and area under the curve(AUC) calculation. Noncompartmental pharmacokinetic analysis wasused to evaluate drug concentration data and determine AUC over the18-month course of lampalizumab treatment (AUC0–18m), Cmax, Cmin,and half-life. Serum drug concentrations of lampalizumab thatmeasured lower than the lower limit of quantification (LLOQ) wereassigned a value of 50% of the LLOQ.
Statistical analysisAll efficacy analyses were conducted in the mITT population, definedas all randomized patients who received at least one dose of treatmentand had at least one post-baseline fundus autofluorescence measure-ment. Prespecified analyses of the primary endpoint were performedusing a stratified ANOVA model with baseline geographic atrophylesion size as the stratification variable; missing data were imputedusing the LOCF method. Sensitivity analyses were performed using
Yaspan et al., Sci. Transl. Med. 9, eaaf1443 (2017) 21 June 2017
a linear mixed-effect model with a random effect for each patientbased on observed data. The linear mixed-effect model included base-line geographic atrophy area (as the continuous variable), time point(as the categorical variable), treatment, time-by-treatment interaction,and baseline geographic atrophy category (≥10 mm2 versus <10 mm2).This approach made use of data from patients who had post-baselinemeasurements but discontinued the study before month 18 and pro-vided more precise estimation of treatment effect. Sensitivity analysesusing a linear mixed-effect model with intercept and time as randomeffects were also performed (tables S15 and S16). A major objectiveof this study was to investigate evidence of activity of lampalizumab ingeographic atrophy patients. Given the relatively small sample size ofproof-of-concept studies including the MAHALO study, there was noformal statistical comparison of reduction in geographic atrophy areaprogression between the monthly and every other month lampalizumabtreatment groups; moreover, no multiplicity adjustment was made forefficacy analyses. All analyses were performed using SAS (version 9.2;SAS Institute Inc.). All efficacy endpoints were evaluated independent-ly for each lampalizumab treatment group compared with the pre-specified pooled sham analysis group. The MAHALO efficacy datawere also analyzed by the square root transformation method (35).The adjusted mean change from baseline to month 18 by the squareroot transformation method was 0.5, 0.4, and 0.5 mm2 in the pooledsham, lampalizumab monthly, and every other month groups, respec-tively. In the CFI risk-allele carrier subgroup, the adjusted mean changefrom baseline to month 18 was 0.7, 0.4, and 0.6 mm2 in correspondingtreatment groups. The reduction in geographic atrophy area growth wasabout 20% (80% CI, 1 to 29%) in the lampalizumab primary analysismonthly group and 43% (95% CI, 17 to 70%) in the CFI risk-allele car-riers treated with monthly lampalizumab. These results with the squareroot transformation method were consistent with findings from theleast-squares mean primary and subgroup efficacy analyses. To assessthe impact of missing data, we performed sensitivity analyses with variousimputations methods; the treatment difference between lampalizumaband the pooled sham groups (reduction rate) was consistent acrossthe sensitivity analyses (table S17). Safety data were summarizedfor all randomized patients who received at least one injection; pa-tients were assessed according to actual treatment received by use ofobserved data without imputation. The sample size calculation for theMAHALO study was designed to provide power (80%) to detect a treat-ment effect of 0.94 mm2/year on geographic atrophy area progression at atwo-sided significance level of 0.2. An SD of 1.7 mm2/year based on avail-able literature (31) and a projected 25% dropout rate were assumed incalculating the sample size of 40 patients in lampalizumab monthlyand lampalizumab every other month treatment groups, and 40 patientsin the pooled sham control with 20 patients each in sham monthly andsham every other month groups.
SUPPLEMENTARY MATERIALSwww.sciencetranslationalmedicine.org/cgi/content/full/9/395/eaaf1443/DC1Fig. S1. Kaplan-Meier plot of time to study discontinuation by treatment group.Fig. S2. Geographic atrophy progression with monthly and every other month lampalizumabtreatment.Fig. S3. Average CFI serum concentrations by rs17440077 genotype.Fig. S4. Average CFI serum concentrations by rs4698775 genotype.Table S1. Mean change in geographic atrophy area from baseline to month 18 by fundusautofluorescence and color fundus photography based on the mITT population (LOCFmethod).Table S2. Least-squares mean change in best-corrected visual acuity from baseline based onthe mITT population using LOCF data.
11 of 13

SC I ENCE TRANS LAT IONAL MED I C I N E | R E S EARCH ART I C L E
hD
ownloaded from
Table S3. SNP genotype counts and allele frequencies for patients assayed in the MAHALO study.Table S4. Least-squares mean change in geographic atrophy area from baseline to month 18by risk-allele status.Table S5. Least-squares mean change in geographic atrophy area (mm2) by fundusautofluorescence from baseline by CFI status (rs17440077) based on the mITT population(observed data).Table S6. Geographic atrophy progression by fundus autofluorescence in CFI+ subgroups(rs17440077) with monthly and every other month lampalizumab treatment versus shamcontrol and baseline best-corrected visual acuity of 20/50 to 20/100 (Snellen equivalent).Table S7. Least-squares mean change in geographic atrophy area (mm2) from baseline tomonth 18 by gender: CFI risk-allele carriers in mITT patients.Table S8. Least-squares mean change in geographic atrophy area (mm2) by fundusautofluorescence from baseline by CFI status (rs4698775) based on the mITT population(observed data).Table S9. Ocular adverse events in the fellow eye during the 18-month treatment periodoccurring among ≥3 patients in any treatment group (safety-evaluable patients).Table S10. Systemic (nonocular) adverse events during the 18-month treatment periodoccurring among ≥3 patients in any treatment group (safety-evaluable patients).Table S11. Adverse events suspected to be caused by study drug during the 18-monthtreatment period (safety-evaluable patients).Table S12. Serum and aqueous exposures in lampalizumab-treated patients.Table S13. Summary of estimated accumulation ratios in lampalizumab-treated patients.Table S14. CFI SNPs and relationships.Table S15. Predicted mean change in geographic atrophy area from baseline: mITT patients.Table S16. Predicted mean change in geographic atrophy area from baseline by CFIstatus: mITT patients.Table S17. Least-squares mean change in geographic atrophy area from baseline to month 18(study eye): mITT patients.Source data
by guest on June 8, 2019ttp://stm
.sciencemag.org/
REFERENCES AND NOTES1. L. S. Lim, P. Mitchell, J. M. Seddon, F. G. Holz, T. Y. Wong, Age-related macular
degeneration. Lancet 379, 1728–1738 (2012).2. W. L. Wong, X. Su, X. Li, C. M. Cheung, R. Klein, C.-Y. Cheng, T. Y. Wong, Global prevalence
of age-related macular degeneration and disease burden projection for 2020 and 2040:A systematic review and meta-analysis. Lancet Glob. Health 2, e106–e116 (2014).
3. J. S. Sunness, G. S. Rubin, C. A. Applegate, N. M. Bressler, M. J. Marsh, B. S. Hawkins,D. Haselwood, Visual function abnormalities and prognosis in eyes with age-relatedgeographic atrophy of the macula and good visual acuity. Ophthalmology 104,1677–1691 (1997).
4. F. G. Holz, E. C. Strauss, S. Schmitz-Valckenberg, M. van Lookeren Campagne, Geographicatrophy: Clinical features and potential therapeutic approaches. Ophthalmology 121,1079–1091 (2014).
5. F. G. Holz, S. Schmitz-Valckenberg, M. Fleckenstein, Recent developments in thetreatment of age-related macular degeneration. J. Clin. Invest. 124, 1430–1438 (2014).
6. M. van Lookeren Campagne, J. LeCouter, B. L. Yaspan, W. Ye, Mechanisms of age-relatedmacular degeneration and therapeutic opportunities. J. Pathol. 232, 151–164 (2014).
7. M. B. Gorin, Genetic insights into age-related macular degeneration: Controversiesaddressing risk, causality, and therapeutics. Mol. Aspects Med. 33, 467–486 (2012).
8. L. G. Fritsche, W. Chen, M. Schu, B. L. Yaspan, Y. Yu, G. Thorleifsson, D. J. Zack, S. Arakawa,V. Cipriani, S. Ripke, R. P. Igo Jr., G. H. S. Buitendijk, X. Sim, D. E. Weeks, R. H. Guymer,J. E. Merriam, P. J. Francis, G. Hannum, A. Agarwal, A. M. Armbrecht, I. Audo, T. Aung,G. R. Barile, M. Benchaboune, A. C. Bird, P. N. Bishop, K. E. Branham, M. Brooks,A. J. Brucker, W. H. Cade, M. S. Cain, P. A. Campochiaro, C.-C. Chan, C.-Y. Cheng, E. Y. Chew,K. A. Chin, I. Chowers, D. G. Clayton, R. Cojocaru, Y. P. Conley, B. K. Cornes, M. J. Daly,B. Dhillon, A. O. Edwards, E. Evangelou, J. Fagerness, H. A. Ferreyra, J. S. Friedman,A. Geirsdottir, R. J. George, C. Gieger, N. Gupta, S. A. Hagstrom, S. P. Harding, C. Haritoglou,J. R. Heckenlively, F. G. Holz, G. Hughes, J. P. A. Ioannidis, T. Ishibashi, P. Joseph, G. Jun,Y. Kamatani, N. Katsanis, C. N. Kielhauer, J. C Khan, I. K. Kim, Y. Kiyohara, B. E. K. Klein, R. Klein,J. L. Kovach, I. Kozak, C. J. Lee, K. E. Lee, P. Lichtner, A. J. Lotery, T. Meitinger, P. Mitchell,S. Mohand-Saïd, A. T. Moore, D. J. Morgan, M. A. Morrison, C. E. Myers, A. C. Naj, Y. Nakamura,Y. Okada, A. Orlin, M. C. Ortube, M. I. Othman, C. Pappas, K. H. Park, G. J. T. Pauer,N. S. Peachey, O. Poch, R. R. Priya, R. Reynolds, A. J. Richardson, R. Ripp, G. Rudolph, E. Ryu,J.-A. Sahel, D. A. Schaumberg, H. P. N. Scholl, S. G. Schwartz, W. K. Scott, H. Shahid,H. Sigurdsson, G. Silvestri, T. A. Sivakumaran, R. T. Smith, L. Sobrin, E. H. Souied,D. E. Stambolian, H. Stefansson, G. M. Sturgill-Short, A. Takahashi, N. Tosakulwong,B. J. Truitt, E. E. Tsironi, A. G. Uitterlinden, C. M. van Duijn, L. Vijaya, J. R. Vingerling,E. N. Vithana, A. R. Webster, H. E. Wichmann, T. W. Winkler, T. Y. Wong, A. F. Wright,D. Zelenika, M. Zhang, L. Zhao, K. Zhang, M. L. Klein, G. S. Hageman, G. M. Lathrop,K. Stefansson, R. Allikmets, P. N. Baird, M. B. Gorin, J. J. Wang, C. C. W. Klaver, J. M. Seddon,M. A. Pericak-Vance, S. K. Iyengar, J. R. W. Yates, A. Swaroop, B. H. F. Weber, M. Kubo,
Yaspan et al., Sci. Transl. Med. 9, eaaf1443 (2017) 21 June 2017
M. M. Deangelis, T. Leveillard, U. Thorsteinsdottir, J. L. Haines, L. A. Farrer, I. M. Heid,G. R. Abecasis, Seven new loci associated with age-related macular degeneration.Nat. Genet. 45, 433–439 (2013).
9. D. Ricklin, G. Hajishengallis, K. Yang, J. D. Lambris, Complement: A key system for immunesurveillance and homeostasis. Nat. Immunol. 11, 785–797 (2010).
10. K. M. Loyet, L. E. Deforge, K. J. Katschke Jr., L. Diehl, R. R. Graham, L. Pao, L. Sturgeon,S.-C. Lewin-Koh, J. G. Hollyfield, M. van Lookeren Campagne, Activation of the alternativecomplement pathway in vitreous is controlled by genetics in age-related maculardegeneration. Invest. Ophthalmol. Vis. Sci. 53, 6628–6637 (2012).
11. C. M. Stanton, J. R. W. Yates, A. I. den Hollander, J. M. Seddon, A. Swaroop, D. Stambolian,S. Fauser, C. Hoyng, Y. Yu, K. Atsuhiro, K. Branham, M. Othman, W. Chen, E. Kortvely,K. Chalmers, C. Hayward, A. T. Moore, B. Dhillon, M. Ueffing, A. F. Wright, Complement factorD in age-related macular degeneration. Invest. Ophthalmol. Vis. Sci. 52, 8828–8834 (2011).
12. H. P. N. Scholl, P. Charbel Issa, M. Walier, S. Janzer, B. Pollok-Kopp, F. Börncke,L. G. Fritsche, N. V. Chong, R. Fimmers, T. Wienker, F. G. Holz, B. H. F. Weber,M. Oppermann, Systemic complement activation in age-related macular degeneration.PLOS ONE 3, e2593 (2008).
13. D. V. Do, D. J. Pieramici, M. van Lookeren Campagne, T. Beres, M. Friesenhahn, Y. Zhang,E. C. Strauss, A phase IA dose-escalation study of the anti-factor D monoclonal antibodyfragment FCFD4514S in patients with geographic atrophy. Retina 34, 313–320 (2014).
14. K. J. Katschke Jr., P. Wu, R. Ganesan, R. F. Kelley, M. A. Mathieu, P. E. Hass, J. Murray,D. Kirchhofer, C. Wiesmann, M. van Lookeren Campagne, Inhibiting alternative pathwaycomplement activation by targeting the factor D exosite. J. Biol. Chem. 287, 12886–12892(2012).
15. E. C. Schramm, S. J. Clark, M. P. Triebwasser, S. Raychaudhuri, J. M. Seddon, J. P. Atkinson,Genetic variants in the complement system predisposing to age-related maculardegeneration: A review. Mol. Immunol. 61, 118–125 (2014).
16. S. McHarg, S. J. Clark, A. J. Day, P. N. Bishop, Age-related macular degeneration and therole of the complement system. Mol. Immunol. 67, 43–50 (2015).
17. L. Rubinstein, J. Crowley, P. Ivy, M. Leblanc, D. Sargent, Randomized phase II designs.Clin. Cancer Res. 15, 1883–1890 (2009).
18. S. A. Cannistra, Phase II trials in journal of clinical oncology. J. Clin. Oncol. 27, 3073–3076(2009).
19. J. M. Seddon, Y. Yu, E. C. Miller, R. Reynolds, P. L. Tan, S. Gowrisankar, J. I. Goldstein,M. Triebwasser, H. E. Anderson, J. Zerbib, D. Kavanagh, E. Souied, N. Katsanis, M. J. Daly,J. P. Atkinson, S. Raychaudhuri, Rare variants in CFI, C3 and C9 are associated with highrisk of advanced age-related macular degeneration. Nat. Genet. 45, 1366–1370 (2013).
20. J. P. H. van de Ven, S. C. Nilsson, P. L. Tan, G. H. Buitendijk, T. Ristau, F. C. Mohlin,S. B. Nabuurs, F. E. Schoenmaker-Koller, D. Smailhodzic, P. A. Campochiaro, D. J. Zack,M. R. Duvvari, B. Bakker, C. C. Paun, C. J. F. Boon, A. G. Uitterlinden, S. Liakopoulos,B. J. Klevering, S. Fauser, M. R. Daha, N. Katsanis, C. C. W. Klaver, A. M. Blom, C. B. Hoyng,A. I. den Hollander, A functional variant in the CFI gene confers a high risk of age-relatedmacular degeneration. Nat. Genet. 45, 813–817 (2013).
21. D. Kavanagh, Y. Yu, E. C. Schramm, M. Triebwasser, E. K. Wagner, S. Raychaudhuri,M. J. Daly, J. P. Atkinson, J. M. Seddon, Rare genetic variants in the CFI gene are associatedwith advanced age-related macular degeneration and commonly result in reducedserum factor I levels. Hum. Mol. Genet. 24, 3861–3870 (2015).
22. The Cancer Genome Atlas Research Network, The Cancer Genome Atlas;http://cancergenome.nih.gov [accessed 16 December 2014].
23. C. Wu, C. Orozco, J. Boyer, M. Leglise, J. Goodale, S. Batalov, C. L. Hodge, J. Haase, J. Janes,J. W. Huss III, A. I. Su, BioGPS: An extensible and customizable portal for queryingand organizing gene annotation resources. Genome Biol. 10, R130 (2009).
24. GTEx Consortium, The Genotype-Tissue Expression (GTEx) pilot analysis: Multitissue generegulation in humans. Science 348, 648–660 (2015).
25. Genentech Inc., Lucentis® (ranibizumab injection); www.gene.com/download/pdf/lucentis_prescribing.pdf [accessed 13 February 2015].
26. K. M. Loyet, J. Good, T. Davancaze, L. Sturgeon, X. Wang, J. Yang, K. N. Le, M. Wong,P. E. Hass, M. van Lookeren Campagne, P. C. Haughney, A. Morimoto, L. A. Damico-Beyer,L. E. DeForge, Complement inhibition in cynomolgus monkeys by anti–factor D antigen-binding fragment for the treatment of an advanced form of dry age-related maculardegeneration. J. Pharmacol. Exp. Ther. 351, 527–537 (2014).
27. K. N. Le, L. Gibiansky, M. van Lookeren Campagne, J. Good, T. Davancaze, K. M. Loyet,A. Morimoto, E. C. Strauss, J. Y. Jin, Population pharmacokinetics and pharmacodynamicsof lampalizumab administered intravitreally to patients with geographic atrophy.Clin. Pharmacol. Ther. Pharmacometrics Syst. Pharmacol. 4, 595–604 (2015).
28. F. Grassmann, M. Fleckenstein, E. Y. Chew, T. Strunz, S. Schmitz-Valckenberg, A. P. Göbel,M. L. Klein, R. Ratnapriya, A. Swaroop, F. G. Holz, B. H. F. Weber, Clinical and geneticfactors associated with progression of geographic atrophy lesions in age-related maculardegeneration. PLOS ONE 10, e0126636 (2015).
29. D. M. Brown, P. K. Kaiser, M. Michels, G. Soubrane, J. S. Heier, R. Y. Kim, J. P. Sy,S. Schneider, Ranibizumab versus verteporfin for neovascular age-related maculardegeneration. N. Engl. J. Med. 355, 1432–1444 (2006).
12 of 13
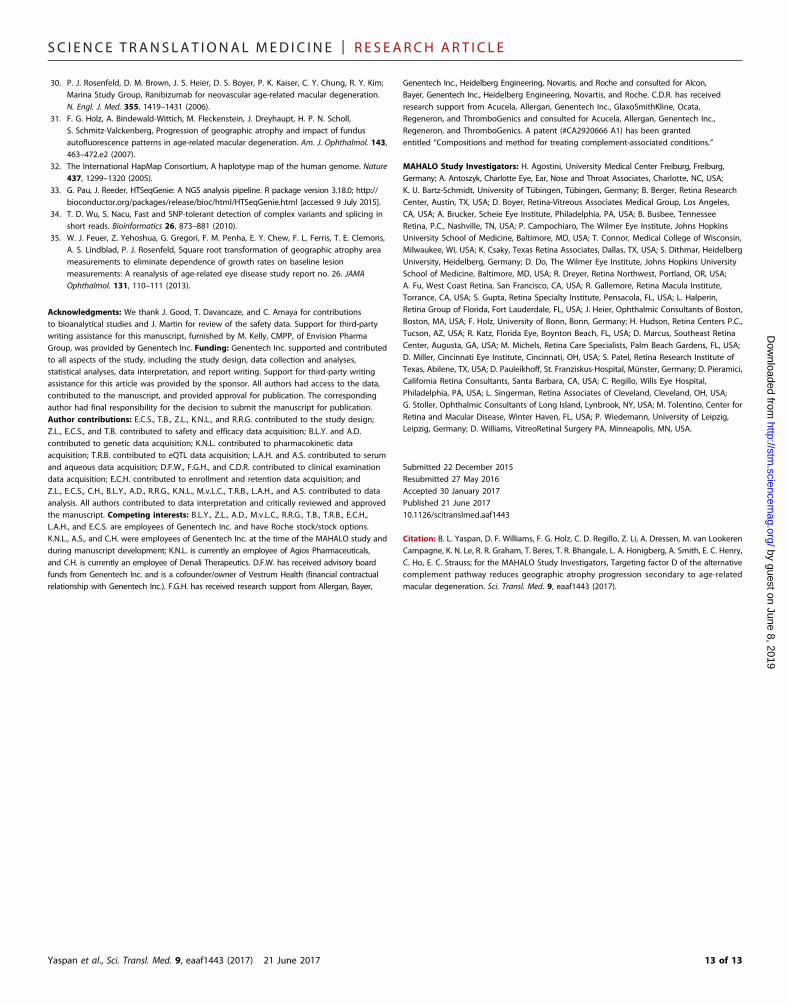
SC I ENCE TRANS LAT IONAL MED I C I N E | R E S EARCH ART I C L E
by guest ohttp://stm
.sciencemag.org/
Dow
nloaded from
30. P. J. Rosenfeld, D. M. Brown, J. S. Heier, D. S. Boyer, P. K. Kaiser, C. Y. Chung, R. Y. Kim;Marina Study Group, Ranibizumab for neovascular age-related macular degeneration.N. Engl. J. Med. 355, 1419–1431 (2006).
31. F. G. Holz, A. Bindewald-Wittich, M. Fleckenstein, J. Dreyhaupt, H. P. N. Scholl,S. Schmitz-Valckenberg, Progression of geographic atrophy and impact of fundusautofluorescence patterns in age-related macular degeneration. Am. J. Ophthalmol. 143,463–472.e2 (2007).
32. The International HapMap Consortium, A haplotype map of the human genome. Nature437, 1299–1320 (2005).
33. G. Pau, J. Reeder, HTSeqGenie: A NGS analysis pipeline. R package version 3.18.0; http://bioconductor.org/packages/release/bioc/html/HTSeqGenie.html [accessed 9 July 2015].
34. T. D. Wu, S. Nacu, Fast and SNP-tolerant detection of complex variants and splicing inshort reads. Bioinformatics 26, 873–881 (2010).
35. W. J. Feuer, Z. Yehoshua, G. Gregori, F. M. Penha, E. Y. Chew, F. L. Ferris, T. E. Clemons,A. S. Lindblad, P. J. Rosenfeld, Square root transformation of geographic atrophy areameasurements to eliminate dependence of growth rates on baseline lesionmeasurements: A reanalysis of age-related eye disease study report no. 26. JAMAOphthalmol. 131, 110–111 (2013).
Acknowledgments: We thank J. Good, T. Davancaze, and C. Amaya for contributionsto bioanalytical studies and J. Martin for review of the safety data. Support for third-partywriting assistance for this manuscript, furnished by M. Kelly, CMPP, of Envision PharmaGroup, was provided by Genentech Inc. Funding: Genentech Inc. supported and contributedto all aspects of the study, including the study design, data collection and analyses,statistical analyses, data interpretation, and report writing. Support for third-party writingassistance for this article was provided by the sponsor. All authors had access to the data,contributed to the manuscript, and provided approval for publication. The correspondingauthor had final responsibility for the decision to submit the manuscript for publication.Author contributions: E.C.S., T.B., Z.L., K.N.L., and R.R.G. contributed to the study design;Z.L., E.C.S., and T.B. contributed to safety and efficacy data acquisition; B.L.Y. and A.D.contributed to genetic data acquisition; K.N.L. contributed to pharmacokinetic dataacquisition; T.R.B. contributed to eQTL data acquisition; L.A.H. and A.S. contributed to serumand aqueous data acquisition; D.F.W., F.G.H., and C.D.R. contributed to clinical examinationdata acquisition; E.C.H. contributed to enrollment and retention data acquisition; andZ.L., E.C.S., C.H., B.L.Y., A.D., R.R.G., K.N.L., M.v.L.C., T.R.B., L.A.H., and A.S. contributed to dataanalysis. All authors contributed to data interpretation and critically reviewed and approvedthe manuscript. Competing interests: B.L.Y., Z.L., A.D., M.v.L.C., R.R.G., T.B., T.R.B., E.C.H.,L.A.H., and E.C.S. are employees of Genentech Inc. and have Roche stock/stock options.K.N.L., A.S., and C.H. were employees of Genentech Inc. at the time of the MAHALO study andduring manuscript development; K.N.L. is currently an employee of Agios Pharmaceuticals,and C.H. is currently an employee of Denali Therapeutics. D.F.W. has received advisory boardfunds from Genentech Inc. and is a cofounder/owner of Vestrum Health (financial contractualrelationship with Genentech Inc.). F.G.H. has received research support from Allergan, Bayer,
Yaspan et al., Sci. Transl. Med. 9, eaaf1443 (2017) 21 June 2017
Genentech Inc., Heidelberg Engineering, Novartis, and Roche and consulted for Alcon,Bayer, Genentech Inc., Heidelberg Engineering, Novartis, and Roche. C.D.R. has receivedresearch support from Acucela, Allergan, Genentech Inc., GlaxoSmithKline, Ocata,Regeneron, and ThromboGenics and consulted for Acucela, Allergan, Genentech Inc.,Regeneron, and ThromboGenics. A patent (#CA2920666 A1) has been grantedentitled “Compositions and method for treating complement-associated conditions.”
MAHALO Study Investigators: H. Agostini, University Medical Center Freiburg, Freiburg,Germany; A. Antoszyk, Charlotte Eye, Ear, Nose and Throat Associates, Charlotte, NC, USA;K. U. Bartz-Schmidt, University of Tübingen, Tübingen, Germany; B. Berger, Retina ResearchCenter, Austin, TX, USA; D. Boyer, Retina-Vitreous Associates Medical Group, Los Angeles,CA, USA; A. Brucker, Scheie Eye Institute, Philadelphia, PA, USA; B. Busbee, TennesseeRetina, P.C., Nashville, TN, USA; P. Campochiaro, The Wilmer Eye Institute, Johns HopkinsUniversity School of Medicine, Baltimore, MD, USA; T. Connor, Medical College of Wisconsin,Milwaukee, WI, USA; K. Csaky, Texas Retina Associates, Dallas, TX, USA; S. Dithmar, HeidelbergUniversity, Heidelberg, Germany; D. Do, The Wilmer Eye Institute, Johns Hopkins UniversitySchool of Medicine, Baltimore, MD, USA; R. Dreyer, Retina Northwest, Portland, OR, USA;A. Fu, West Coast Retina, San Francisco, CA, USA; R. Gallemore, Retina Macula Institute,Torrance, CA, USA; S. Gupta, Retina Specialty Institute, Pensacola, FL, USA; L. Halperin,Retina Group of Florida, Fort Lauderdale, FL, USA; J. Heier, Ophthalmic Consultants of Boston,Boston, MA, USA; F. Holz, University of Bonn, Bonn, Germany; H. Hudson, Retina Centers P.C.,Tucson, AZ, USA; R. Katz, Florida Eye, Boynton Beach, FL, USA; D. Marcus, Southeast RetinaCenter, Augusta, GA, USA; M. Michels, Retina Care Specialists, Palm Beach Gardens, FL, USA;D. Miller, Cincinnati Eye Institute, Cincinnati, OH, USA; S. Patel, Retina Research Institute ofTexas, Abilene, TX, USA; D. Pauleikhoff, St. Franziskus-Hospital, Münster, Germany; D. Pieramici,California Retina Consultants, Santa Barbara, CA, USA; C. Regillo, Wills Eye Hospital,Philadelphia, PA, USA; L. Singerman, Retina Associates of Cleveland, Cleveland, OH, USA;G. Stoller, Ophthalmic Consultants of Long Island, Lynbrook, NY, USA; M. Tolentino, Center forRetina and Macular Disease, Winter Haven, FL, USA; P. Wiedemann, University of Leipzig,Leipzig, Germany; D. Williams, VitreoRetinal Surgery PA, Minneapolis, MN, USA.
Submitted 22 December 2015Resubmitted 27 May 2016Accepted 30 January 2017Published 21 June 201710.1126/scitranslmed.aaf1443
Citation: B. L. Yaspan, D. F. Williams, F. G. Holz, C. D. Regillo, Z. Li, A. Dressen, M. van LookerenCampagne, K. N. Le, R. R. Graham, T. Beres, T. R. Bhangale, L. A. Honigberg, A. Smith, E. C. Henry,C. Ho, E. C. Strauss; for the MAHALO Study Investigators, Targeting factor D of the alternativecomplement pathway reduces geographic atrophy progression secondary to age-relatedmacular degeneration. Sci. Transl. Med. 9, eaaf1443 (2017).
n J
13 of 13
une 8, 2019
progression secondary to age-related macular degenerationTargeting factor D of the alternative complement pathway reduces geographic atrophy
C. Henry, Carole Ho, Erich C. Strauss and for the MAHALO Study InvestigatorsCampagne, Kha N. Le, Robert R. Graham, Tatiana Beres, Tushar R. Bhangale, Lee A. Honigberg, Ashley Smith, Erin Brian L. Yaspan, David F. Williams, Frank G. Holz, Carl D. Regillo, Zhengrong Li, Amy Dressen, Menno van Lookeren
DOI: 10.1126/scitranslmed.aaf1443, eaaf1443.9Sci Transl Med
carriers.progression versus sham control was observed in a subgroup of patients who were complement factor I risk-alleleacceptable safety profile. A more substantial monthly treatment benefit of 44% reduction in geographic atrophy progression compared to sham control with monthly lampalizumab treatment. Moreover, lampalizumab showed ancomplement pathway. The MAHALO study met its primary efficacy endpoint with a 20% reduction in lesion area degeneration. Lampalizumab is a specific inhibitor of complement factor D, a pivotal regulator of the alternativetrial that evaluated lampalizumab in patients with geographic atrophy secondary to age-related macular
now report the results of the MAHALO phase 2 randomized, controlledet al.which there is no treatment. Yaspan Geographic atrophy secondary to age-related macular degeneration is a major cause of vision loss for
Illuminating a new treatment for macular degeneration
ARTICLE TOOLS http://stm.sciencemag.org/content/9/395/eaaf1443
MATERIALSSUPPLEMENTARY http://stm.sciencemag.org/content/suppl/2017/06/19/9.395.eaaf1443.DC1
CONTENTRELATED
http://stm.sciencemag.org/content/scitransmed/11/475/eaat5580.fullhttp://stm.sciencemag.org/content/scitransmed/10/466/eaat4544.fullhttp://stm.sciencemag.org/content/scitransmed/10/451/eaas9164.fullhttp://stm.sciencemag.org/content/scitransmed/10/435/eaao4097.fullhttp://stm.sciencemag.org/content/scitransmed/10/428/eaan5861.full
REFERENCES
http://stm.sciencemag.org/content/9/395/eaaf1443#BIBLThis article cites 32 articles, 7 of which you can access for free
PERMISSIONS http://www.sciencemag.org/help/reprints-and-permissions
Terms of ServiceUse of this article is subject to the
is a registered trademark of AAAS.Science Translational Medicinetitle licensee American Association for the Advancement of Science. No claim to original U.S. Government Works. TheScience, 1200 New York Avenue NW, Washington, DC 20005. 2017 © The Authors, some rights reserved; exclusive
(ISSN 1946-6242) is published by the American Association for the Advancement ofScience Translational Medicine
by guest on June 8, 2019http://stm
.sciencemag.org/
Dow
nloaded from