Targeted monitoring study for veterinary medicines in the ...
120
Targeted monitoring study for veterinary medicines in the environment Science Report: SC030183/SR SCHO0806BLHH-E-P
Transcript of Targeted monitoring study for veterinary medicines in the ...

Targeted monitoring study forveterinary medicines in theenvironmentScience Report: SC030183/SR
SCHO0806BLHH-E-P

2 Targeted monitoring study for veterinary medicines in the environment
The Environment Agency is the leading public body protecting andimproving the environment in England and Wales.
It’s our job to make sure that air, land and water are looked after byeveryone in today’s society, so that tomorrow’s generations inherit acleaner, healthier world.
Our work includes tackling flooding and pollution incidents, reducingindustry’s impacts on the environment, cleaning up rivers, coastalwaters and contaminated land, and improving wildlife habitats.
This report is the result of research commissioned and funded by theEnvironment Agency’s Science Programme.
Published by:Environment Agency, Rio House, Waterside Drive, Aztec West,Almondsbury, Bristol, BS32 4UDTel: 01454 624400 Fax: 01454 624409www.environment-agency.gov.uk
ISBN: 1844325792© Environment Agency Month YearAll rights reserved. This document may be reproduced with priorpermission of the Environment Agency.
The views expressed in this document are not necessarilythose of the Environment Agency.
This report is printed on Cyclus Print, a 100% recycled stock,which is 100% post consumer waste and is totally chlorine free.Water used is treated and in most cases returned to source inbetter condition than removed.
Further copies of this report are available from:The Environment Agency’s National Customer Contact Centre byemailing [email protected] or bytelephoning 08708 506506.
Author(s):
Alistair B A Boxall, Lindsay A Fogg, Donald J Baird,Chris Lewis, Trevor C Telfer, Dana Kolpin, Anthony Gravell,Emma Pemberton, Tatiana Boucard
Dissemination Status: Publicly available
Keywords: veterinary medicines, prioritisation, modelling,monitoring
Research Contractor:Cranfield Centre for EcoChemistry, Shardlow, Derbyshire, DE722GN. Tel: 01332 799000
Environment Agency’s Project Managers:
Tatiana Boucard and Emma Pemberton, Wallingford
Collaborators:
Cranfield University, Environment Agency LaboratoriesUniversity of Stirling, US Geological Survey, Central ScienceLaboratory
Science Project reference:SC030183
Product code: SCHO0806BLHH-E-P

Science at the Environment AgencyScience underpins the work of the Environment Agency. It provides an up-to-date understandingof the world about us and helps us to develop monitoring tools and techniques to manage ourenvironment as efficiently and effectively as possible.
The work of the Environment Agency’s Science Group is a key ingredient in the partnershipbetween research, policy and operations that enables the Environment Agency to protect andrestore our environment.
The science programme focuses on five main areas of activity:
• Setting the agenda, by identifying where strategic science can inform our evidence-basedpolicies, advisory and regulatory roles;
• Funding science, by supporting programmes, projects and people in response to long-termstrategic needs, medium-term policy priorities and shorter-term operational requirements;
• Managing science, by ensuring that our programmes and projects are fit for purpose andexecuted according to international scientific standards;
• Carrying out science, by undertaking research – either by contracting it out to researchorganisations and consultancies or by doing it ourselves;
• Delivering information, advice, tools and techniques, by making appropriate productsavailable to our policy and operations staff.
Steve Killeen
Head of Science
3 Targeted monitoring study for veterinary medicines in the environment

4 Targeted monitoring study for veterinary medicines in the environment
Executive SummaryVeterinary medicines are widely used to treat disease and to protect the health ofanimals. Dietary additives may be incorporated into the feed of animals to improveanimal productivity. During their use, both types of substances have the potential tobe released to the environment.
Consequently, the marketing authorisation holder provides an environmentalassessment to the licensing authorities as part of the authorisation process. Aproduct is authorised for sale only where the licensing authority is satisfied that theenvironmental risk is sufficiently low. This study was performed to gain a greaterunderstanding of the actual concentrations of approved veterinary medicines in theenvironment once they are in use. The project built upon a previous study funded bythe Environment Agency, which brought together data on the usage, routes of entry,and the fate and effects of veterinary medicines in use in the UK. The informationwas used to prioritise these veterinary medicines in use in the UK in terms of theirpotential to be released to the environment and their ecotoxicity. A list of prioritycompounds was developed for further consideration.
In the current study, this priority list was refined. A pragmatic and scientifically soundrisk-based ranking approach was developed and applied to each of the compoundson the priority list in order to gain a greater understanding of the risks they pose tothe environment (soil, surface water and groundwater) relative to others on the list.
Using this approach, 18 compounds were deemed worthy of monitoring. Amonitoring study was performed over an 11-month period to determineconcentrations of seven of the 18 compounds in the UK environment. With theexception of enrofloxacin and its metabolite ciprofloxacin, all the study compoundswere detected in one or more environmental compartments (see table below).
Concentrations of antibacterials in soils ranged from 0.5 µg kg-1 (trimethoprim) to305 (oxytetracycline) µg kg-1. Maximum concentrations of antibacterials in waterranged from 0.02 µg kg-1 (trimethoprim) to 21.1 (lincomycin) µg l-1; the parasiticides(doramectin and ivermectin) were not detected. Concentrations of antibacterials insediment were 0.5–813 µg kg-1 and those for doramectin and ivermectin were 2.7and 4.9 µg kg-1 respectively.
Maximum measured concentrations were generally lower than predicted no effectconcentrations derived from available ecotoxicity data. It is probable that theaverage concentrations across the broader UK agricultural landscape will be lowerstill for many of the determinands. This is because the monitoring programme:
• considered the highest ranked compounds and scenarios;• selected sites with characteristics that would enhance environmental
contamination;• focused on occasions when the compounds were likely to be released to the
environment.

Targeted monitoring study for veterinary medicines in the environment 5
The results therefore indicate that, in general, concentrations of these veterinarymedicines in the UK environment are likely to be below those that could affectaquatic and terrestrial organisms
However, the study did identify some areas where future work is warranted,including:
• further assessment of the potential impacts of selected medicines on the soilenvironment;
• investigations into the fate and effects of parasiticides in sediment;• assessment of those compounds that could not be studied in this project due
to insufficient data;• further assessment of the potential impacts of the other 11 (of the 18)
selected veterinary medicines on the environment;• monitoring of groundwater.
Maximum measured environmental concentrations of study veterinary medicinesFaeces/litter
(µg kg-1)Soil
(µg kg-1)Water(µg l-1)
Sediment(µg kg-1)
ciprofloxacin 0.28 ND - -doramectin 112 - ND 2.69enrofloxacin 2.92 ND - -ivermectin (pigs) - 46$ (1,985^) ND -ivermectin(cattle)
1,850 - ND 4.91
lincomycin - 8.5 21.1 8.9oxytetracycline - 305 4.49 813sulfadiazine - 0.8* 4.13 0.8*trimethoprim - 0.5* 0.02* 0.5*
* Values are indicative values only.$ The treatment dose and duration at study site were significantly higher than recommended, so concentrationsunder typical treatment regimes are likely to be more than an order of magnitude lower.^ Concentration around/below feeding stations

6 Targeted monitoring study for veterinary medicines in the environment
ContentsExecutive Summary 4Acknowledgements 111 Introduction 122 Ranking of priority compounds 15
2.1 Method 152.1.1 Refinement of priority list 162.1.2 Collation of data on usage, fate and ecotoxicity 162.1.3 Exposure assessment 172.1.4 Effects assessment 212.1.5 Ranking procedure 21
2.2 Results 222.2.1 Refinement of priority list 222.2.2 Data on usage, fate and effects 222.2.3 Exposure assessment 262.2.4 Effect assessment 282.2.5 Risk characterisation 29
2.3 Summary of the ranking process 393 Monitoring of veterinary medicines in the UK environment 41
3.1 Site selection 41
3.2 Monitoring 423.2.1 Sampling approaches 423.2.2 Monitoring regimes employed at each site 453.2.3 Analysis 483.2.4 Soil characterisation 50
3.3 Results 503.3.1 Indoor pigs 503.3.2 Outdoor pigs 533.3.3 Cattle at pasture 543.3.4 Poultry 57
3.4 Summary of field results 574 Discussion 595 Conclusions 68References & Bibliography 69List of acronyms and abbreviations 73

Targeted monitoring study for veterinary medicines in the environment 7
Appendix 1 Prediction of environmental concentrations 74Appendix 2 Treatment scenarios used to assess the study compounds 88Appendix 3 Sorption data for the study compounds 93Appendix 4 Persistence of the study compounds in manure and soil 94Appendix 5 Public domain aquatic toxicity data for the priority compounds 795Appendix 6 Terrestrial toxicity data for the priority compounds 0100Appendix 7 Terrestrial ranking for the pasture treatments 0107Appendix 8 Aquatic ranking for pasture treatment scenarios 109Appendix 9 Groundwater ranking for pasture scenarios 1111Appendix 10 Terrestrial ranking for intensive treatment scenarios 113Appendix 11 Aquatic ranking for intensive treatment scenarios 1115Appendix 12 Groundwater ranking for intensive treatment scenarios 1117Appendix 13 Soil characteristics 11119

8 Targeted monitoring study for veterinary medicines in the environment
List of figuresFigure 2.1 Approach used to identify priority veterinary medicines for monitoring
Figure 2.2 Schematic of the ranking scheme
Figure 3.1 Measured daily rainfall at the indoor pig scenario monitoring site
Figure 3.2 Concentrations of the study medicines in soil samples taken from a fieldtreated with slurry from the intensively reared pigs
Figure 3.3 Concentrations of lincomycin, oxytetracycline, sulfadiazine andtrimethoprim in stream water during the study period
Figure 3.4 Concentrations of the study medicines in sediment samples taken froma stream adjacent to a field treated with pig slurry
Figure 3.5 Concentrations of ivermectin in soil samples obtained from outside thefeeding stations and around/below the feeding stations at the outdoorpig farm
Figure 3.6 Concentrations of doramectin in faecal material collected from theoutdoor cattle farm
Figure 3.7 Concentrations of doramectin in stream sediment
Figure 3.8 Concentrations of ivermectin in faecal material obtained from theoutdoor cattle site
Figure 3.9 Concentrations of ivermectin in sediment obtained from the outdoorcattle site

Targeted monitoring study for veterinary medicines in the environment 9
List of tablesTable 1.1 ‘High risk’ compounds subjected to full risk characterisation
Table 1.2 ‘High risk’ compounds requiring further data for full risk characterisation
Table 2.1 Assessment factors used to derive aquatic PNECs
Table 2.2 Assessment factors used to derive terrestrial PNECs
Table 2.3 Veterinary medicines removed from or added to the priority list
Table 2.4 List of priority compounds for further assessment
Table 2.5 Sorption and persistence data used in the ranking process
Table 2.6 Predicted TWA concentrations in soil and surface water and maximumpredicted groundwater concentrations for the study compounds used totreat pasture animals
Table 2.7 Predicted TWA concentrations in soil and surface water and maximumpredicted groundwater concentrations for the study compounds used totreat intensively reared livestock
Table 2.8 Predicted maximum concentrations in receiving waters for the threepriority compounds used in aquaculture during and 24-hours aftertreatment
Table 2.9 Terrestrial ecotoxicity data and PNECs for the study compounds
Table 2.10 Aquatic ecotoxicity data and PNECs for the study compounds
Table 2.11 Priority compounds and scenarios identified for pasture animals (i.e.those compounds and scenarios with an RCR >1 or a concentration ingroundwater > 0.1 µg l-1, listed in order of increasing RCR orPECgroundwater)
Table 2.12 Priority compounds and scenarios identified for intensively rearedanimals (i.e. those compounds and scenarios with an RCR >1 or aconcentration in groundwater > 0.1 µg l-1, listed in order of increasingRCR or PECgroundwater)
Table 2.13 Compounds identified as of potential concern for inclusion in thetargeted monitoring programme
Table 3.1 Treatment scenarios used at the monitoring sites
Table 3.2 Veterinary medicines selected for monitoring

10 Targeted monitoring study for veterinary medicines in the environment
Table 3.3 Maximum measured environmental concentrations of study veterinarymedicines
Table 4.1 Comparison of modelled treatment scenarios with actual treatmentsused on the monitored farms
Table 4.2 Comparison of maximum measured concentrations in surface waterswith PNECs
Table 4.3 Comparison of maximum measured concentrations in soils with PNECs
Targeted monitoring study for veterinary medicines in the environment 11
AcknowledgementsThe authors would like to acknowledge the assistance of the Veterinary MedicinesDirectorate and members of the National Office of Animal Health (NOAH) in theproject.
In particular, we would like to thank Dr Paul Cooper, Dr Audrey Kelly, Dr Mark Crane,Mr Stephen Dawson, Mr John Fitzgerald, Dr Peter Jones, Mrs Carol Long, ProfessorRandolph Richards and Dr Alex Tait.

12 Targeted monitoring study for veterinary medicines in the environment
1 IntroductionVeterinary medicines are widely used to treat disease and to protect the health ofanimals. Some dietary additives are also incorporated into the feed of animals rearedfor food in order to improve their productivity. Compounds used include parasiticides,antibiotics and antifungals. Feed additives are not veterinary medicines and areauthorised under different legislation. Most of the compounds considered in this studyare authorised as veterinary medicines, but a few are authorised as feed additives.For simplicity, the term ‘veterinary medicine’ is used in this report to cover both.
Through its chemicals strategy Managing Chemicals for a Better Environment(Environment Agency 2003), the Environment Agency aims to focus its activities onthose chemicals most likely to affect the environment. This can only be achieved ifthe release and subsequent potential effects of these chemicals are understood.
During their use, veterinary medicines have the potential to be released to theenvironment. Consequently, the marketing authorisation holder provides anenvironmental assessment to the licensing authorities as part of the authorisationprocess. A product is authorised for sale only where the licensing authority is satisfiedthat the environmental risk is sufficiently low. This study was performed to gain agreater understanding of the actual concentrations of approved veterinary medicinesin the environment once they are in use.
Releases of veterinary medicines to the environment may occur directly (e.g. wherethey are used in fish farms) and indirectly via the application of animal manurecontaining excreted products to land. A number of groups of veterinary medicineshave been well studied and their risks to the environment are relatively wellunderstood; these are primarily:
• sheep dip chemicals (Environment Agency 1998, 2000, 2001; SEPA 2000)• fish farm medicines (Jacobsen and Berglind 1988, Davies et al. 1998);• anthelmintics (Wall and Strong 1987, McCracken 1993, Ridsill-Smith 1993,
Strong 1993, McKellar 1997).
However, there are scant data available in the public domain on the potentialenvironmental impacts of other groups of veterinary medicines.
To gain a greater understanding of the impacts on the environment arising from theuse of veterinary medicinal products, the Environment Agency commissioned areview of all available information on veterinary medicines in the environment (Boxallet al. 2002, 2004). The review considered:
• current regulatory mechanisms• current usage• likely exposure routes• environmental fate and behaviour• environmental effects.
Targeted monitoring study for veterinary medicines in the environment 13
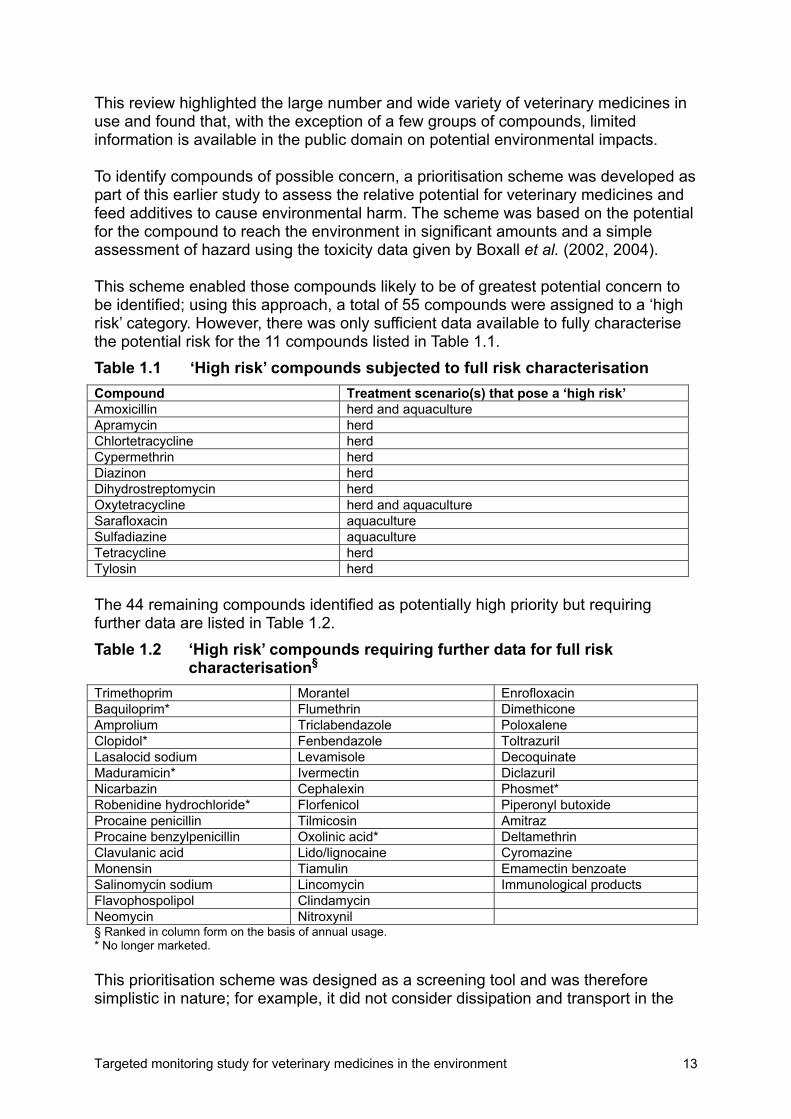
This review highlighted the large number and wide variety of veterinary medicines inuse and found that, with the exception of a few groups of compounds, limitedinformation is available in the public domain on potential environmental impacts.
To identify compounds of possible concern, a prioritisation scheme was developed aspart of this earlier study to assess the relative potential for veterinary medicines andfeed additives to cause environmental harm. The scheme was based on the potentialfor the compound to reach the environment in significant amounts and a simpleassessment of hazard using the toxicity data given by Boxall et al. (2002, 2004).
This scheme enabled those compounds likely to be of greatest potential concern tobe identified; using this approach, a total of 55 compounds were assigned to a ‘highrisk’ category. However, there was only sufficient data available to fully characterisethe potential risk for the 11 compounds listed in Table 1.1.Table 1.1 ‘High risk’ compounds subjected to full risk characterisationCompound Treatment scenario(s) that pose a ‘high risk’Amoxicillin herd and aquacultureApramycin herdChlortetracycline herdCypermethrin herdDiazinon herdDihydrostreptomycin herdOxytetracycline herd and aquacultureSarafloxacin aquacultureSulfadiazine aquacultureTetracycline herdTylosin herd
The 44 remaining compounds identified as potentially high priority but requiringfurther data are listed in Table 1.2.Table 1.2 ‘High risk’ compounds requiring further data for full risk
characterisation§
Trimethoprim Morantel EnrofloxacinBaquiloprim* Flumethrin DimethiconeAmprolium Triclabendazole PoloxaleneClopidol* Fenbendazole ToltrazurilLasalocid sodium Levamisole DecoquinateMaduramicin* Ivermectin DiclazurilNicarbazin Cephalexin Phosmet*Robenidine hydrochloride* Florfenicol Piperonyl butoxideProcaine penicillin Tilmicosin AmitrazProcaine benzylpenicillin Oxolinic acid* DeltamethrinClavulanic acid Lido/lignocaine CyromazineMonensin Tiamulin Emamectin benzoateSalinomycin sodium Lincomycin Immunological productsFlavophospolipol ClindamycinNeomycin Nitroxynil§ Ranked in column form on the basis of annual usage.* No longer marketed.
This prioritisation scheme was designed as a screening tool and was thereforesimplistic in nature; for example, it did not consider dissipation and transport in the

14 Targeted monitoring study for veterinary medicines in the environment
environment and no information was provided on which environmental compartments(e.g. soil, surface water, groundwater and air) were most likely to be exposed.
The Environment Agency therefore commissioned this follow-on study in order to:
• refine the prioritisation exercise;
• investigate further those compounds identified as being of greatest potential tocause harm to gain greater understanding of the risks they pose to theenvironment (soil, surface water and groundwater) relative to othercompounds on the priority list;
• develop and perform a targeted environmental monitoring programme toascertain whether those compounds identified as posing the greatest risk arepresent in the environment at ecologically significant levels.
This work will inform the Environment Agency’s approach to these compounds. It willhelp to ensure that the monitoring programme is effectively targeted, identify theneed (if any) for pollution prevention measures and guide future research initiatives.
Section 2 of this report describes the refinement of the prioritisation exercise and thedevelopment and application of a ranking scheme to identify the relative risks posedto the environment following the use of the priority compounds as either livestock oraquaculture treatments.
Section 3 describes the performance of a targeted monitoring study to generateinformation on concentrations of seven of the highest ranked compounds in the UKenvironment. Section 4 offers a general discussion of the results, while the overallconclusions are drawn in Section 5.

Targeted monitoring study for veterinary medicines in the environment 15
2 Ranking of priority compoundsThe screening-based approach described in Section 1 prioritised compounds basedon information on usage and available ecotoxicity data. However, the approach wasqualitative and did not consider how a compound is likely to behave in theenvironment.
This study was therefore undertaken to refine the previous approach by developing aranking scheme that incorporated information on:
• different treatment scenarios for an active substance;• environmental fate and effects
The aim was to identify those medicines and treatment scenarios with the greatestpotential to cause harm and which thus warrant further study. The scenarios andcompounds identified were considered of interest for inclusion in a targeted risk-based monitoring programme (see Section 3).
2.1 MethodThe ranking was performed in a number of discrete stages (Figure 2.1).
In the first stage, the priority list from the previous Environment Agency project(Boxall et al. 2002) was reviewed and refined to ensure that it was up-to-date,accurate and reflected current regulatory concerns. Information on the usage, fateand effects of each of the compounds on the refined priority list was then collated andused to estimate their concentrations in the main environmental compartments.Predicted no-effect concentrations were calculated from available ecotoxicity data.
By comparing predicted environmental concentrations (PECs) with predicted no-effect concentrations (PNECs), it was possible to rank compounds and treatmenttypes in terms of their potential to cause harm for the environmental compartmentssoil, surface water and sediment. Impacts on groundwaters were assessed solely onthe basis of concentration, i.e. compounds of potential environmental concern werethose with maximum environmental concentrations predicted to exceed 0.1 µg l-1, thecurrent limit for pesticides in drinking water. An outline of the scheme is given inFigure 2.2.
The aim of the scheme was not to characterise the risks posed by each compoundindividually (this is already done during the authorisation of its use), but to determinethe level of risk associated with the use of a particular compound in relation to otherson the priority list. This approach allowed those compounds with a higher potential tocause harm to be identified.

16 Targeted monitoring study for veterinary medicines in the environment
The process is outlined below. Detailed descriptions of the exposure calculations aregiven in Appendix 1. The results from each stage are given in Section 2.2 andsummarised in Section 2.3.
2.1.1 Refinement of priority listThe priority list from the previous project was reviewed to take account of:
• changes in marketing authorisation status;• revised treatment information;• usage information provided by the industry;• current knowledge on the fate and effects of each compound;• concerns of Environment Agency staff and representatives of the Veterinary
Medicines Directorate (VMD).
The priority list included a number of groups of compounds that were similar, i.e. theywere from the same chemical class and would be expected to be used and act in asimilar way. In such cases, one representative substance was selected for furtherassessment.
The results of the review were used to adjust the priority list for further assessment;some compounds were removed and some were added (see Section 2.2.1).
2.1.2 Collation of data on usage, fate and ecotoxicityData on typical treatment scenarios, environmental fate and persistence, and theecotoxicological effects of each of the priority compounds were obtained from arange of sources.
Information on the typical treatment scenarios (dosage used for each substance,treatment durations, metabolism and the frequency of treatments over a year) wascollated for each substance from a number of sources including:
• Veterinary Applied Pharmacology and Therapeutics (4th edn.) (Brander et al.1977);
• The Veterinary Formulary (1st edn.) (Debuf 1991);• Diseases of Poultry (10th edn.) (Calneck et al. 1997)• Veterinary Medicine (9th edn.) (Radostis et al. 2000);• Compendium of Data Sheets for Veterinary Products (NOAH 2002);• personal communications with a number of veterinary surgeons in large
animal practice;• personal communications with veterinary pharmaceutical companies.
As many of the compounds on the priority list are used in a number of differentproducts, it was necessary to obtain typical scenarios for each species and eachproduct type. Scenarios were developed for group treatments using information fromthe National Office of Animal Health (NOAH) Compendium and were selected torepresent a ‘worst case’ (i.e. where a range of doses was given, the highest wasselected and where a range of treatment durations was possible, the longest wasselected). All scenarios developed were circulated to NOAH members for comment

Targeted monitoring study for veterinary medicines in the environment 17
and many were revised based on feedback received during this consultationexercise.
Information on physico-chemical properties (octanol–water partition coefficients, soilsorption coefficients and dissociation constants), persistence in soils and surfacewaters, and ecotoxicity to both aquatic and terrestrial species were collated from anumber of sources. These included:
• the initial Environment Agency review of veterinary medicines in use in the UK(Boxall et al. 2002, 2004);
• recently published data in scientific journals;• environmental assessments for veterinary medicines available from the US
Food and Drink Administration (FDA) website (www.fda.gov/cvm/default.html)• data provided in confidence by manufacturers of compounds on the priority
list.
Data on sorption were required in the ranking scheme to determine movement tosurface waters and groundwaters, but experimental values for sorption were rarelyavailable. Therefore, an indication of the sorption potential of these compounds in soilwas obtained using quantitative structure–property relationships. Previous work(Boxall A B A and Tolls J, unpublished data) indicated that, while the estimates werepoor, they would generally underestimate sorption and hence would provide aconservative estimation of movement of a substance to groundwaters or to surfacewaters. Estimations were obtained using the Syracuse Research Corporation (SRC)PCKOC package (SRC 1996) and structures were input to the program usingSMILES notation.
2.1.3 Exposure assessmentSimple modelling approaches were used to estimate exposure concentrations arisingfrom the use of compounds to treat pasture animals, housed animals and inaquaculture. These are outlined below and full details of the methods and theequations used are provided in Appendix 1.
Pasture animalsVeterinary medicines may be used to treat a range of animal types that are kept onpasture. For medicines applied orally or by injection, the medicine may be releaseddirectly to soils or surface waters in urine or faeces. Topical treatments may bewashed off.
In this study, veterinary medicines used in the treatment of cattle, pigs, horses andsheep at pasture were considered.

18 Targeted monitoring study for veterinary medicines in the environment
Figure 2.1 Approach used to identify priority veterinary medicines formonitoring
Review and initial prioritisation ofveterinary medicines in use in the UK
(Boxall et al. 2002)
55 veterinarymedicines identified
for further study(Tables 1.1 and 1.2)
Refinement of priority list
34 prioritycompounds for
further assessment(Table 2.4)
Risk-based ranking ofpriority substances
Data on current marketingauthorisation status, fate and
behaviour, usage andEnvironment Agency/VMD
concerns
Data treatment regimes, sorption,persistence and ecotoxicity
18 compoundsfor monitoring(Table 2.13)
Targeted monitoring study forveterinary medicines in the
UK environment

Targeted monitoring study for veterinary medicines in the environment 19
Figure 2.2 Schematic of the ranking scheme
Data on usage, properties and effects
Soil PEC Soil PNEC Aquatic PEC AquaticPNEC
GroundwaterPEC
Calculation of risk characterisation ratio (RCR)
Ranking

20 Targeted monitoring study for veterinary medicines in the environment
Concentrations of each of the priority compounds in soil, surface water andgroundwater arising from the treatment of animals on pasture were obtained using acombination of exposure assessment models. The methods were based onapproaches developed specifically for veterinary medicines (e.g. Montforts 1999);where methods developed for veterinary medicines were not available, methodsdeveloped for pesticides were used.
The modelling approach assumed that all of the administered medicine was excretedand that this was then released directly to soil, where it mixed with the top 5-cm layer,or to a surface water body of set dimensions. Subsequent movement of the medicinefrom soil to groundwater was estimated using information on sorption andpersistence in soils.
All models were run in Microsoft® Excel.
Intensively reared livestockIntensively reared livestock are typically housed for long periods of time. Manure,slurry or litter arising from these animals is collected and stored before being spreadonto land, as fertiliser, at relatively high application rates (ADAS 1997 and 1998).
Veterinary medicines used to treat intensively reared animals may be released tosoils during the slurry/manure application process and may subsequently betransported to surface water (via runoff and drainage) and/or groundwater. Themodelling approach for intensively reared livestock (cattle, pigs, poultry) (Spaepen etal. 1997) therefore considered estimates of:
• concentrations in manure and slurry at the time of application to land usinginformation on treatment regime, manure storage and persistence in manure;
• concentrations in soil using information on the concentration of the medicine inslurry, typical slurry application rates for the UK and a soil mixing depth of 5cm;
• concentrations in surface waters assuming that the main route of entry is indrainflow;
• groundwater concentrations using a soil leaching model and information onsorption and persistence in soils.
Aquaculture treatmentsAquaculture treatments are employed in aquaculture systems to treat:
• eggs in hatcheries;• free-living stock within pond or tank-based systems.
Two modelling scenarios were therefore used:
• a trout hatchery (for the egg treatment);• a land-based trout farm (for fish treatments).
The hatchery scenario assumed a farm with a continuous flow egg hatchery system,with treatment applied into the water supply to ensure a fixed concentration of the

Targeted monitoring study for veterinary medicines in the environment 21
chemical for a specified time period (30 minutes). It was assumed that the farm had asettlement pond, which ultimately discharged into a river.
The stocked fish scenario assumed a farm consisting of ten raceways (concretetanks) operating at a high stocking density, and discharging into a river via asettlement pond. Although the stocking density used was high, the scenario wasconsidered representative of a large commercial land-based aquaculture facility inEngland and Wales.
Models used for the simulations were based on plug flow of the medicine through thefarm system over a 24-hour period, and were implemented as a Microsoft Excelspreadsheet.
2.1.4 Effects assessmentPNECs were derived from available ecotoxicity data. The ‘base set’ data (i.e.daphnids, fish, alga, earthworms, plants, soil microbes) were used to derive PNECsand appropriate uncertainty factors were applied. Uncertainty factors for the aquaticstudies were based on those used in the Committee for Veterinary MedicinalProducts (CVMP) guidance document (CVMP 1997). The terrestrial values wereselected to reflect the type and amount of data available. The factors used are givenin Tables 2.1 and 2.2.
Table 2.1 Assessment factors used to derive aquatic PNECsInformation available Assessment factor<3 standard test endpoints (one from each taxonomic group) 1000Three standard test endpoints 100
Table 2.2 Assessment factors used to derive terrestrial PNECsInformation availableLowest end-point is an EC50Lowest end-point is a NOEC from a chronic studyThree tests from earthworms, plants and microbes<3 tests have been performed
YES–
YESNO
NOYESYESNO
YESNONOYES
NOYESNOYES
Assessment factor 100 10 1000 100
2.1.5 Ranking procedureRisk characterisation ratios (RCRs) were calculated for both soil and surface waterfor each compound and treatment scenario. These ratios were obtained from the timeweighted averaged (TWA) PEC and the PNEC using Equation 2.1.
PNECPECTWA RCR = Equation 2.1
The RCRs were then used to rank compounds and scenarios. For groundwater,compounds and scenarios were ranked purely on the basis of the maximumpredicted concentration.

22 Targeted monitoring study for veterinary medicines in the environment
Those compounds and scenarios with a RCR >1 or which had a predictedconcentration in groundwater of 100 ng l-1 were identified for further assessmentduring the monitoring phase of the project.
2.2 Results
2.2.1 Refinement of priority listFollowing the review of the priority list developed during the previous project, 27compounds were removed (Table 2.3). An additional six compounds were added tothe list either because they had received a marketing authorisation since the previousproject was completed or because of concerns over their high toxicity to aquatic andterrestrial organisms.
The final priority list (Table 2.4) for further assessment contained 34 compounds fromthe antibacterial, ectoparasiticide and feed additive groups.
2.2.2 Data on usage, fate and effectsIn total, 211 scenarios were developed covering the use of each of the studycompounds to treat intensively reared livestock and pasture animals. Thesescenarios are detailed in Appendix 2.
Data obtained from the public domain on the environmental fate and ecotoxicity ofthe final list of priority compounds are presented in Appendices 3–6. Additional dataon a number of priority compounds were provided by their manufacturers. These datawere used along with the public domain data to estimate PECs and PNECs but, dueto their confidential nature, the values are not presented in the report.
Tables 2.5, 2.9 and 2.10 show that experimental or predicted data on sorption,persistence and ecotoxicity (i.e. allowing an assessment of potential risks to at leastone of the environmental compartments) were available for 22 of the 34 compoundson the refined priority list.
For 13 of the compounds (amprolium, chlorhexidine, clavulanic acid, decoquinate,dicyclanil, lasalocid, levamisole, morantel, nicarbazin, nitroxynil, poloxalene, procainepenicillin, and salinomycin), insufficient data were available for ranking purposes ineither the terrestrial or aquatic compartments.

Targeted monitoring study for veterinary medicines in the environment 23
Table 2.3 Veterinary medicines removed from or added to the priority listCompound ReasonRemoved from the priority listamitraz Very rarely used as an ectoparasiticide.baquiloprim No longer has marketing authorisation.cephalexin Used only on companion animals.chlortetracycline, tetracycline Use characteristics and properties are very similar to
oxytetracycline, which is also on the priority list.clopidol No longer has marketing authorisation.diazinon, cypermethrin, deltamethrin Environmental risks are well understood and a
number of Environment Agency projects werealready investigating these compounds.
dihydrostreptomycin, neomycin, clindamycin,flavophospholipol
Use characteristics and/or properties are very similarto apramycin, which is also on the priority list.
dimethicone An excipient.emamectin benzoate Used as a marine aquaculture treatment so outside
the scope of the current study.flumethrin Substance used only to treat bees.immunological products Vaccines, etc. so chemical assessment
inappropriate.lidocaine and lignocaine Both are highly volatile so unlikely to enter aquatic or
terrestrial systems.maduramicin No longer has marketing authorisation.oxolinic acid No longer has marketing authorisation.phosmet No longer has marketing authorisation.piperonyl butoxide Used only in non-food producing animals.procaine benzylpenicillin Use characteristics and properties are very similar to
procaine penicillin, which is also on the priority list.robenidine No longer has marketing authorisation.sarafloxacin Used only rarely as an aquaculture treatment.toltrazuril Use characteristics and properties are very similar to
diclazuril, which is also on the priority list.Added to the priority listbronopol Compound used in aquaculture, which received
market authorisation since the previous project wascompleted.
chlorhexidine Believed to be widely used.dicyclanil New active substance expected to be used in large
amounts with high potential to enter the environment.doramectin, eprinomectin, moxidectin Highly toxic to aquatic and terrestrial organisms.
Table 2.4 List of priority compounds for further assessmentamoxicillinamproliumapramycinbronopolchlorhexidineclavulanic acidcyromazinedecoquinatediclazurildicyclanildoramectinenrofloxacin
eprinomectinfenbendazoleflorfenicolivermectinlasalocidlevamisolelincomycinmonensinmorantelmoxidectinnicarbazin
nitroxyniloxytetracyclinepoloxaleneprocaine penicillinsalinomycinsulfadiazinetiamulintilmicosintriclabendazoletrimethoprimtylosin

24 Targeted monitoring study for veterinary medicines in the environment
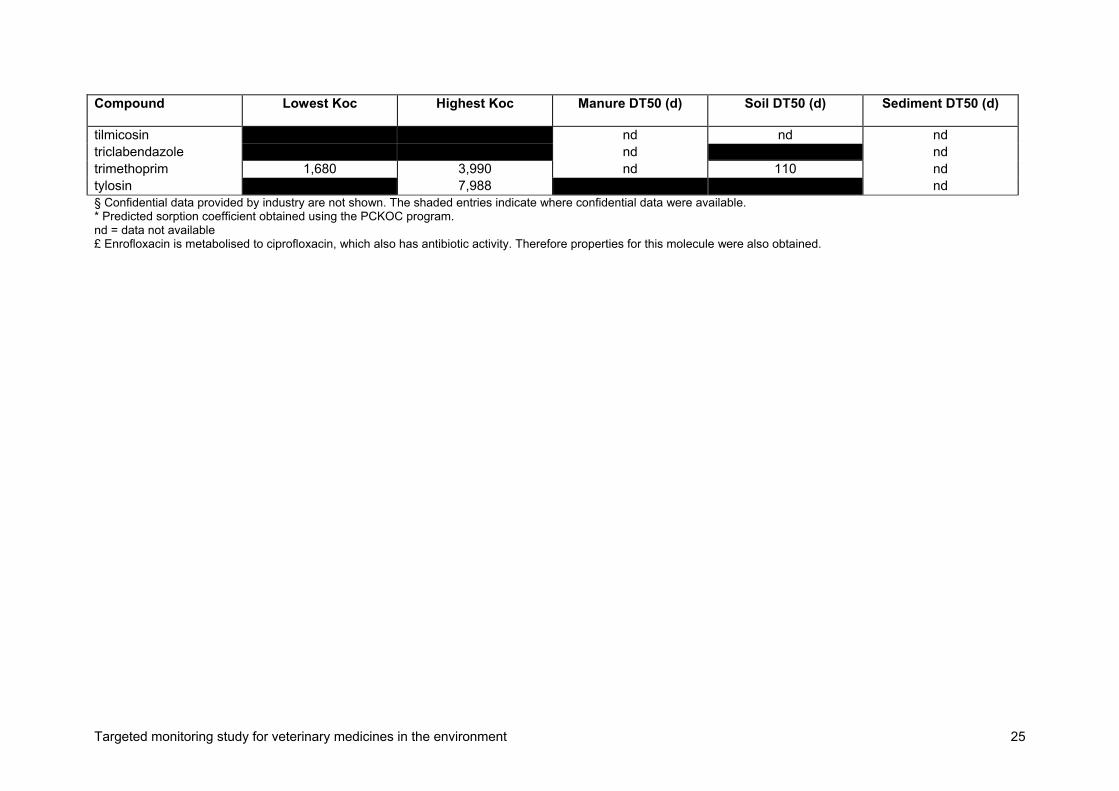
Table 2.5 Sorption and persistence data used in the ranking process§
Compound Lowest Koc Highest Koc Manure DT50 (d) Soil DT50 (d) Sediment DT50 (d)
amoxicillin 866* 866* 4 0.29 ndamprolium nd nd nd nd ndapramycin nd ndbronopol nd nd ndchlorhexidine nd nd nd nd ndciprofloxacin£ 35,342 134,465 nd nd ndclavulanic acid nd nd nd nd ndcyromazine 21* 21* nd 142 nddecoquinate nd nd nd nd nddiclazuril nd 303 nddicyclanil nd nddoramectin 7,520 86,900 nd 79 ndenrofloxacin nd 696 ndeprinomectin 126 (cow pats) 150 ndfenbendazole nd ndflorfenicol 24 52 nd ndivermectin nd 56 ndlasalocid 323* 323* nd nd ndlevamisole 8,652* 8,652* nd nd ndlincomycin 59* 59* nd nd ndmonensin nd ndmorantel 13,100* 13,100* nd nd ndmoxidectin 18,000 41,000 nd 62 ndnicarbazin nd nd nd nd ndnitroxynil nd nd nd nd ndoxytetracycline 27,792 93,317 nd 18 70poloxalene nd nd nd nd ndprocaine penicillin 421* 421* nd nd ndsalinomycin nd nd nd 64 ndsulfadiazine nd ndtiamulin nd nd nd nd nd
Targeted monitoring study for veterinary medicines in the environment 25
Compound Lowest Koc Highest Koc Manure DT50 (d) Soil DT50 (d) Sediment DT50 (d)
tilmicosin nd nd ndtriclabendazole nd ndtrimethoprim 1,680 3,990 nd 110 ndtylosin 7,988 nd§ Confidential data provided by industry are not shown. The shaded entries indicate where confidential data were available.* Predicted sorption coefficient obtained using the PCKOC program.nd = data not available£ Enrofloxacin is metabolised to ciprofloxacin, which also has antibiotic activity. Therefore properties for this molecule were also obtained.

26 Targeted monitoring study for veterinary medicines in the environment
2.2.3 Exposure assessment
Pasture animalsConcentrations in soil, surface water and groundwater arising from the treatment of arange of pasture animals (cattle, pigs, horses and sheep) were obtained for 22 of thestudy compounds and for a wide range of treatment types.
The highest concentrations in soil and surface water were observed for theaminoglycosides lincomycin, apramycin and tilmicosin. The lowest concentrationswere observed for the milbemycins (moxidectin) and macrocyclic lactones (ivermectinand doramectin) (Table 2.6).
Predicted groundwater concentrations for a large proportion (17 out of 22) of thecompounds were <100 ng l-1. However, concentrations for five compounds(apramycin, florfenicol, lincomycin, tilimicosin and tylosin) in groundwater exceeded100 ng l-1, with lincomycin having a predicted maximum concentration of >2.5 µg l-1.
The concentrations given in Table 2.6 have been generated for ranking purposes onlyand should not be interpreted as expected environmental concentrations. The simplemodelling approaches applied and the assumptions used to develop the values arelikely to greatly overestimate concentrations in the environment.Table 2.6 Predicted TWA concentrations in soil and surface water and
maximum predicted groundwater concentrations for the studycompounds used to treat pasture animals
Compound Soil (mg kg-1) Aquatic (mg l-1) Groundwater (µg l-1)amoxicillin 0.0001–0.0009 0.0012–0.040 0.000apramycin 0.14–1.51 0.035–0.38 0.072–0.469chlorhexidine 0.0076 0.0019 0.000cyromazine 0.019 0.0044 0.035doramectin 0.00038–0.0035 0.00010–0.00094 0.000enrofloxacin 0.012–0.19 0.0029–0.047 0.004–0.059eprinomectin 0.0036 0.00094 0.001fenbendazole 0.0041–0.03 0.002–0.004 0.000florfenicol 0.057 0.019 0.124ivermectin 0.00025–0.0088 6.9 x 10⁻⁵–0.0051 0.000–0.002levamisole 0.010–0.075 0.0026–0.019 0.003–0.023lincomycin 0.010–1.07 0.0019–0.27 0.239–2.505morantel 0.0083–0.14 0.0021–0.036 0.000moxidectin 2.5 x 10⁻⁶–3.4 x 10⁻⁵ 6.9 x 10⁻⁷–3.7 x 10⁻⁶ 0.000nitroxynil 0.014–0.076 0.0035–0.019 0.000oxytetracycline 0.019–0.18 0.007–0.044 0.000–0.001poloxalene 0.0083 0.0021 0.000sulfadiazine 0.0069–0.124 0.004–0.068 0.003–0.039tiamulin 0.0076–0.23 0.002–0.058 0.000tilmicosin 0.0014–0.56 0.00035–0.14 0.002–0.173trimethoprim 0.0026–0.086 0.0007–0.0089 0.001–0.018tylosin 0.002–0.26 0.00058–0.073 0.003–0.297
Targeted monitoring study for veterinary medicines in the environment 27
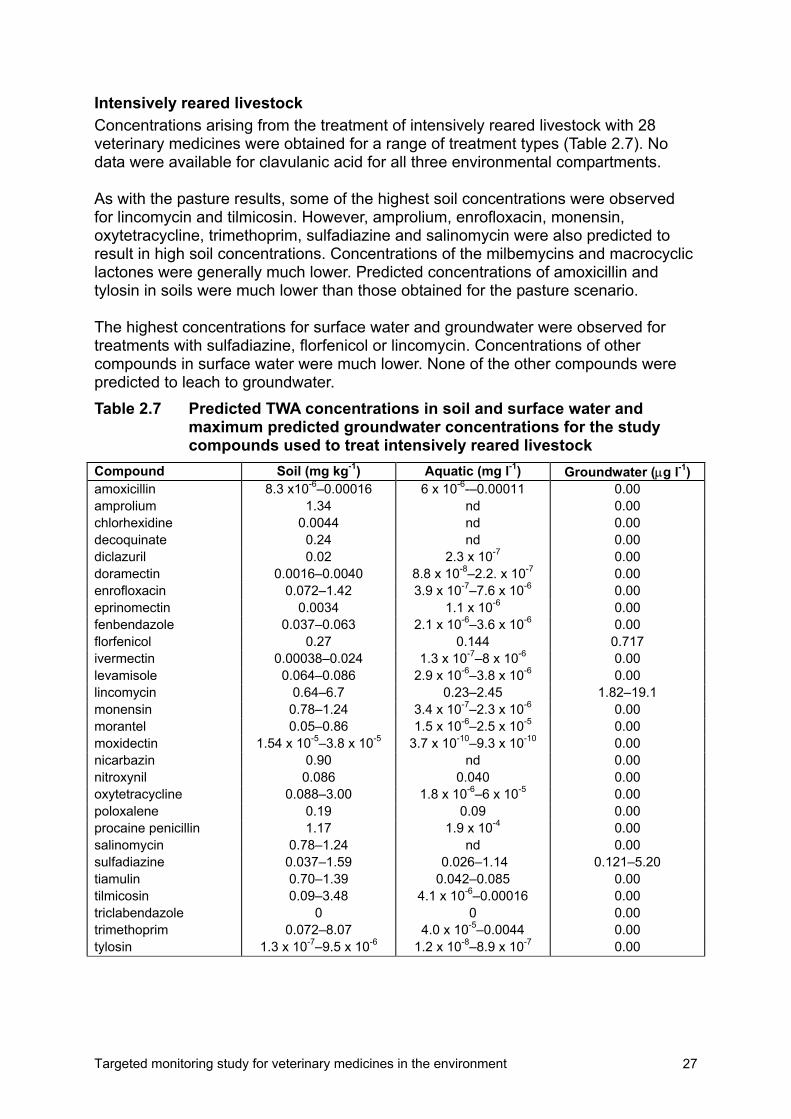
Intensively reared livestockConcentrations arising from the treatment of intensively reared livestock with 28veterinary medicines were obtained for a range of treatment types (Table 2.7). Nodata were available for clavulanic acid for all three environmental compartments.
As with the pasture results, some of the highest soil concentrations were observedfor lincomycin and tilmicosin. However, amprolium, enrofloxacin, monensin,oxytetracycline, trimethoprim, sulfadiazine and salinomycin were also predicted toresult in high soil concentrations. Concentrations of the milbemycins and macrocycliclactones were generally much lower. Predicted concentrations of amoxicillin andtylosin in soils were much lower than those obtained for the pasture scenario.
The highest concentrations for surface water and groundwater were observed fortreatments with sulfadiazine, florfenicol or lincomycin. Concentrations of othercompounds in surface water were much lower. None of the other compounds werepredicted to leach to groundwater.Table 2.7 Predicted TWA concentrations in soil and surface water and
maximum predicted groundwater concentrations for the studycompounds used to treat intensively reared livestock
Compound Soil (mg kg-1) Aquatic (mg l-1) Groundwater (µg l-1)amoxicillin 8.3 x10⁻⁶–0.00016 6 x 10⁻⁶-–0.00011 0.00amprolium 1.34 nd 0.00chlorhexidine 0.0044 nd 0.00decoquinate 0.24 nd 0.00diclazuril 0.02 2.3 x 10⁻⁷ 0.00doramectin 0.0016–0.0040 8.8 x 10⁻⁸–2.2. x 10-7 0.00enrofloxacin 0.072–1.42 3.9 x 10⁻⁷–7.6 x 10⁻⁶ 0.00eprinomectin 0.0034 1.1 x 10⁻⁶ 0.00fenbendazole 0.037–0.063 2.1 x 10⁻⁶–3.6 x 10⁻⁶ 0.00florfenicol 0.27 0.144 0.717ivermectin 0.00038–0.024 1.3 x 10⁻⁷–8 x 10⁻⁶ 0.00levamisole 0.064–0.086 2.9 x 10⁻⁶–3.8 x 10⁻⁶ 0.00lincomycin 0.64–6.7 0.23–2.45 1.82–19.1monensin 0.78–1.24 3.4 x 10⁻⁷–2.3 x 10⁻⁶ 0.00morantel 0.05–0.86 1.5 x 10⁻⁶–2.5 x 10⁻⁵ 0.00moxidectin 1.54 x 10⁻⁵–3.8 x 10⁻⁵ 3.7 x 10⁻¹⁰–9.3 x 10⁻¹⁰ 0.00nicarbazin 0.90 nd 0.00nitroxynil 0.086 0.040 0.00oxytetracycline 0.088–3.00 1.8 x 10⁻⁶–6 x 10⁻⁵ 0.00poloxalene 0.19 0.09 0.00procaine penicillin 1.17 1.9 x 10⁻⁴ 0.00salinomycin 0.78–1.24 nd 0.00sulfadiazine 0.037–1.59 0.026–1.14 0.121–5.20tiamulin 0.70–1.39 0.042–0.085 0.00tilmicosin 0.09–3.48 4.1 x 10⁻⁶–0.00016 0.00triclabendazole 0 0 0.00trimethoprim 0.072–8.07 4.0 x 10⁻⁵–0.0044 0.00tylosin 1.3 x 10⁻⁷–9.5 x 10⁻⁶ 1.2 x 10⁻⁸–8.9 x 10⁻⁷ 0.00

28 Targeted monitoring study for veterinary medicines in the environment
Aquaculture treatmentsPredicted maximum concentrations in receiving waters for the three prioritycompounds used as aquaculture treatments are presented in Table 2.8.
Highest peak concentrations were predicted for amoxicillin, followed byoxytetracycline and bronopol. Model predictions indicated that, within 24 hours oftreatment, all three compounds would have dissipated and would be undetectable.Table 2.8 Predicted maximum concentrations in receiving waters for the
three priority compounds used in aquaculture during and 24-hoursafter treatment
Compound Treatment dose orconcentration
Peak concentration(µg l-1)
Concentrationafter 24 h (µg l-1)
Number of repeatdoses
amoxicillin 160 mg kg-1 531 0 10
bronopol 50 mg l-1 9.5 0 1
oxytetracycline 75 mg kg-1 236 0 8
2.2.4 Effect assessmentUsing the collated ecotoxicity data (public domain data are given in Appendices 5 and6), it was possible to derive PNECs for the terrestrial environment for 21 of the studycompounds (Table 2.9).
The number of terrestrial data points for these study compounds was variable, withonly eprinomectin and fenbendazole having a full dataset, i.e. earthworms, plants andmicrobes and chronic no observable effect concentration (NOEC) data. Many of thecompounds had only one or two standard endpoints and hence an uncertainty factorof 100 or 1,000 was applied.
In addition to the results of the standard studies, some data were available on theeffects on other organisms; a comparison of effect concentrations from these studieswith the calculated PNECs indicated that the PNECs were generally much lower. Thehighest PNECs (i.e. least toxic compounds) were for cyromazine, diclazuril,fenbendazole, salinomycin and tiamulin; these all exceeded 1 mg kg-1. LowestPNECs (i.e. most toxic compounds) were observed for enrofloxacin and tilmicosin,with PNECs for both compounds being <1 µg kg-1.
It was possible to determine an aquatic PNEC for a total of 22 of the studycompounds (Table 2.10). The aquatic datasets were more complete than theterrestrial datasets with full datasets (i.e. fish 96 h LC50, daphnid 48 h EC50 andalgae 96 h EC50) being available for 14 of the study compounds.
The highest PNECs were observed for amoxicillin, lincomycin and enrofloxacin; theseall exceeded 100 µg l-1. The lowest aquatic PNECs were observed for themacrocyclic lactones and milbemycins, with PNECs for ivermectin, doramectin,eprinomectin and moxidectin all being in the low ng l-1 range. This probably reflectsthe insecticidal mode of action of these compounds.

Targeted monitoring study for veterinary medicines in the environment 29
2.2.5 Risk characterisationRisk characterisation ratios and predicted groundwater concentrations for each of thepasture and intensively reared animal scenarios investigated are given in Appendices7–12.
Because of a lack of data on the ecotoxicity and physico-chemical properties of manyof the study compounds, it was not possible to determine either a riskcharacterisation ratio or a groundwater concentration for them. Consequently, it wasnot possible to rank these compounds in one or more of the environmentalcompartments. Compounds with insufficient data were:
• amprolium• chlorhexidine• clavulanic acid• decoquinate• dicyclanil• lasalocid• levamisole• morantel• nicarbazin• nitroxynil• poloxalene• procaine penicillin• salinomycin.
Pasture animalsFor those veterinary medicines used to treat pasture animals, a total of 15compounds were identified that had a RCR >1 (Table 2.11). These included:
• antimicrobial agents (from the sulfonamide, macrolide, fluoroquinolone,pleuromutilin, chloramphenicol and aminoglycoside groups);
• compounds used as endoparasiticides (from the macrocyclic lactone,milbemycin and benzimidazole groups).
Treatments for pigs and cattle were generally ranked higher (i.e. posed a greater risk)than treatments for sheep and horses.
Seven compounds (apramycin, enrofloxacin, florfenicol, lincomycin, sulfadiazine,tilmicosin, tylosin) had an RCR ≥1 for the soil compartment with 12 compounds(apramycin, doramectin, eprinomectin, fenbendazole, ivermectin, moxidectin,oxytetracycline, sulfadiazine, tiamulin, tilmicosin, trimethoprim, tylosin) having anRCR >1 in the aquatic environment. Four compounds (apramycin, florfenicol,lincomycin, tylosin) were identified as having the potential to leach to groundwater.
Intensively reared animalsFor those compounds used to treat intensively reared animals, a total of 10compounds were identified that had an RCR >1 (Table 2.12). These included:

30 Targeted monitoring study for veterinary medicines in the environment
• antibacterial agents (from the tetracycline, amidine, sulfonamide,fluoroquinolone, chloramphenicol and aminoglycocide groups);
• an endectocide (ivermectin).
In terms of the different environmental compartments, eight compounds(enrofloxacin, florfenicol, lincomycin, monensin, oxytetracycline, sulfadiazine,tilmicosin, trimethoprim) had an RCR >1 for the soil compartment and fivecompounds (florfenicol, ivermectin, lincomycin, sulfadiazine, tiamulin) had an RCR >1for the aquatic environment. Only three compounds (florfenicol, lincomycin,sulfadiazine) would be expected to leach to groundwater.
Sulfadiazine, florfenicol and lincomycin were ranked highest in terms of their risk toall three environmental compartments.
Aquaculture treatmentsAll of the aquaculture compounds had an RCR >1. In terms of ranking, bronopol wasranked highest, followed by oxytetracycline and amoxicillin.

Targeted monitoring study for veterinary medicines in the environment 31
Table 2.9 Terrestrial ecotoxicity data and PNECs for the study compoundsCompound Trophic levels
covered (std)Most sensitive endpoint Concentration
(mg kg-1 )Uncertainty
factorPNEC
(mg kg-1)Most sensitive nonstandard endpoint
Concentration(mg kg-1 )
amoxicillin nd nd nd nd nd nd ndamprolium nd nd nd nd nd nd ndapramycin 2 tomato seedling growth NOEC 36 100 0.36 A. chroococcum 0.1bronopol nd nd nd nd nd nd ndchlorhexidine nd nd nd nd nd nd ndclavulanic acid nd nd nd nd nd nd ndcyromazine 1 earthworm 14 d LC50 1000 1000 1 nd nddecoquinate nd nd nd nd nd nd nddiclazuril 2 plant emergence NOEC 100 100 1 Candida albins - no growth 100dicyclanil nd nddoramectin 2 ryegrass root elongation NOEC 1.6 100 0.016 E. foetida 28 d NOEC 2enrofloxacin 2 wheat NOEC growth <0.13 100 <0.00013 nd ndeprinomectin 3 plant NOEC 0.47 10 0.047 nd ndfenbendazole 3 tomato seedling growth NOEC 36 10 3.6 L. terrestris 28 d NOEC 56florfenicol 1 microbes MIC/NOEC 0.4 100 0.004 nd ndivermectin nd ndlasalocid nd nd nd nd nd nd ndlevamisole nd nd nd nd nd nd ndlincomycin 2 microbes MIC/NOEC 0.78 100 0.0078 nd ndmonensin 3 radish LC50 emergence 9.8 100 0.098 nd ndmorantel nd nd nd nd nd nd ndmoxidectin 1 plant NOEC 4 100 0.04 earthworm 28 d LC50 37.2nicarbazin nd nd nd nd nd nd ndnitroxynil nd nd nd nd nd nd ndoxytetracycline 1 Phaseolus vulgaris LC50 <160 100 <1.6 Enchytraeus cryptucus
EC50 reproduction2701
poloxalene nd nd nd nd nd nd ndprocaine penicillin nd nd nd nd nd nd ndsalinomycin 1 microbes NOEC 100 100 1 nd ndsulfadiazine nd ndtiamulin 1 microbes NOEC 500 100 5 nd ndtilmicosin 2 microbes MIC 0.024 100 0.00024 nd nd

32 Targeted monitoring study for veterinary medicines in the environment
Compound Trophic levelscovered (std)
Most sensitive endpoint Concentration(mg kg-1 )
Uncertaintyfactor
PNEC(mg kg-1)
Most sensitive nonstandard endpoint
Concentration(mg kg-1 )
triclabendazole A. aegypiti NOEC 10trimethoprim nd ndtylosin 1 A. chroococcum 5 1000 0.05 nd ndConfidential data provided by industry are not shown. The shaded entries indicate where confidential data were available.

Targeted monitoring study for veterinary medicines in the environment 33
Table 2.10 Aquatic ecotoxicity data and PNECs for study compoundsCompound Trophic
levelscovered
Most sensitive endpoint EC50(mg l-1 )
Proposeduncertainty
factor
CalculatedPNEC
(mg l-1 )
Most sensitive nonstandard endpoint
Effectconcentration
(mg l-1 )amoxicillin 1 S. capricornutum 72 h
EC50250 1000 0.25 M. aeruginosa 72 h EC50 0.0037
amprolium nd nd nd nd nd nd ndapramycin nd ndbronopolclavulanic acid nd nd nd nd nd nd ndcyromazine 2 Lepomis machrochirus 96
h LC5089.7 1000 0.0897 Gambusa affinis 72 h LC50 0.037
decoquinate nd nd nd nd nd nd nddiclazuril 2 Lepomis machrochirus 96
h LC500.5 1000 0.0005 Daphnia magna 21 d
reproduction NOEL0.16
dicyclanildoramectin 3 Daphnia magna 48 h
EC500.0001 100 0.000001 nd nd
enrofloxacin 3 Lepomis machrochirus96h LC50
79.5 100 0.795 Daphnia magna chronicNOEL
9.8
eprinomectin 3 Daphnia magna 48 hEC50
0.00045 100 0.0000045 nd nd
fenbendazole 2 Daphnia magna 48 hEC50
0.012 1000 0.000012 nd nd
florfenicol 3 S. capricornutum 72 hEC50
>2.9 100 >0.029 S. capricornutum 72 hNOEC
2.9
ivermectin 3 Daphnia magna 48 hEC50
0.000025 100 0.00000025 Gammarus 96 h LC50 0.00003
lasalocid nd nd nd nd nd nd ndlevamisole nd nd nd nd nd nd ndlincomycin 1 Daphnia magna 48 h
EC50379.4 1000 0.3794 Daphnia magna -
phototactic behaviourdecreased
5
monensin 2 Onchorhynchus mykiss96 h LC50
9 1000 0.009 Onchorhynchus mykissbehaviour
>1.12
morantel nd nd nd nd nd nd nd

34 Targeted monitoring study for veterinary medicines in the environment
Compound Trophiclevels
covered
Most sensitive endpoint EC50(mg l-1 )
Proposeduncertainty
factor
CalculatedPNEC
(mg l-1 )
Most sensitive nonstandard endpoint
Effectconcentration
(mg l-1 )moxidectin 3 Daphnia magna 48 h
EC500.00003 100 0.0000003 Daphnia magna chronic
NOEL0.000011
nitroxynil nd nd nd nd nd nd ndoxytetracycline 3 S. capricornutum 72 h
EC504.5 100 0.045 P. vannamei 48 h NOEC
intoxication0.055
poloxalene nd nd nd nd nd nd ndprocainepenicillin
nd nd nd nd nd nd nd
salinomycin nd nd nd nd nd Oryzias latipes 63.5sulfadiazine M. aeruginosa 72 h EC50 0.135tiamulin 3 S. capricornutum 72 h
EC500.165 100 0.00165 M. aeruginosa 72 h EC50 0.003
tilmicosin 2 Daphnia magna 48 hEC50
57.3 1000 0.0573 nd nd
triclabendazole Trout non-standard 0.14trimethoprim 2 S. capricornutum 72 h
EC5016 1000 0.016 M. aeruginosa 72 h EC50 112
tylosin M. aeruginosa 72 h EC50 0.034Confidential data provided by industry are not shown. The shaded entries indicate where confidential data were available.NOEL = no observed effect level

Targeted monitoring study for veterinary medicines in the environment 35
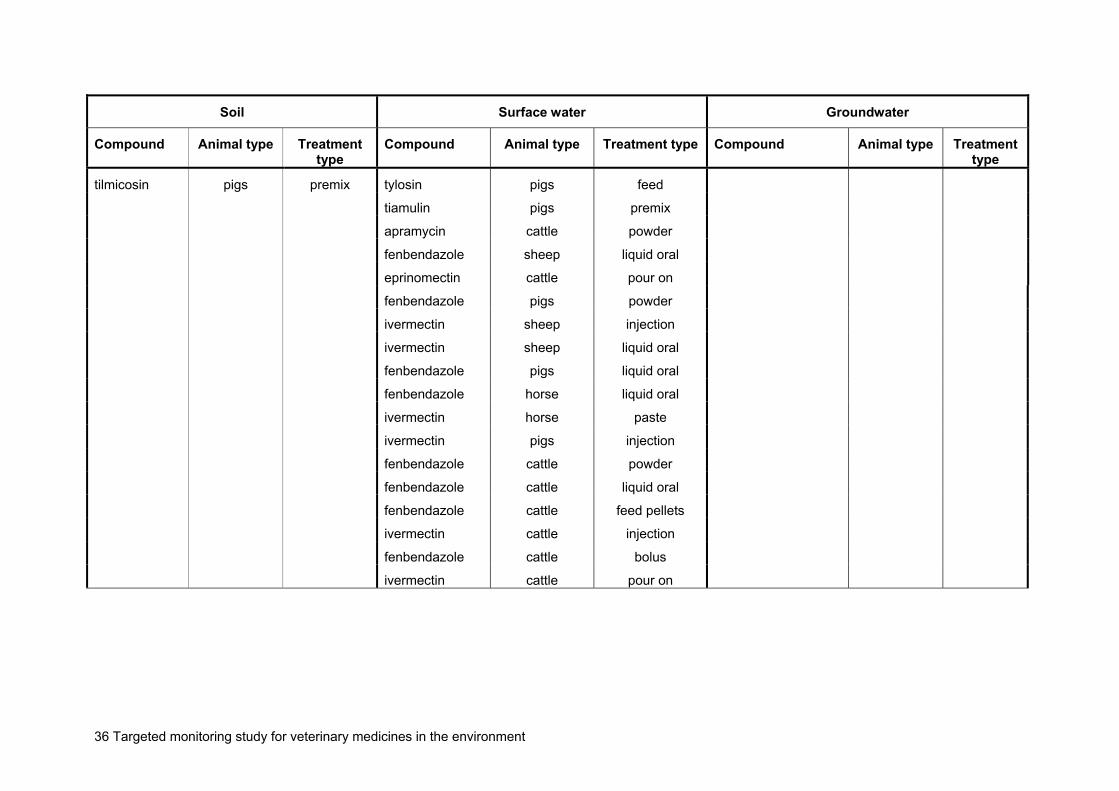
Table 2.11 Priority compounds and scenarios identified for pasture animals (i.e. those compounds and scenarios with anRCR >1 or a concentration in groundwater > 0.1 µg l-1, listed in order of increasing RCR or PECgroundwater).
Soil Surface water Groundwater
Compound Animal type Treatmenttype
Compound Animal type Treatment type Compound Animal type Treatmenttype
sulfadiazine pigs injection doramectin sheep injection apramycin pigs premix
sulfadiazine pigs suspension sulfadiazine pigs suspension apramycin pigs powder
sulfadiazine sheep injection sulfadiazine horse granules florfenicol cattle injection
tylosin cattle soluble trimethoprim pigs powder tilmicosin horse injection
apramycin cattle powder doramectin pigs injection tylosin pigs premix
sulfadiazine horse injection sulfadiazine cattle injection lincomycin cattle soluble
tilmicosin sheep injection moxidectin sheep injection tylosin pigs soluble
sulfadiazine horse granules moxidectin sheep liquid oral apramycin cattle injection
lincomycin pigs soluble tilmicosin pigs premix lincomycin cattle powder
sulfadiazine cattle injection doramectin cattle injection lincomycin pigs premix
florfenicol cattle injection oxytetracycline pigs feed
tylosin pigs soluble tylosin sheep injection
tilmicosin cattle injection tylosin pigs soluble
enrofloxacin pigs piglet doser doramectin cattle pour on
tylosin pigs feed apramycin sheep oral
lincomycin pigs premix tylosin cattle soluble
enrofloxacin pigs injection apramycin pigs premix
enrofloxacin cattle oral apramycin pigs powder
enrofloxacin cattle injection moxidectin cattle pour on
36 Targeted monitoring study for veterinary medicines in the environment
Soil Surface water Groundwater
Compound Animal type Treatmenttype
Compound Animal type Treatment type Compound Animal type Treatmenttype
tilmicosin pigs premix tylosin pigs feed
tiamulin pigs premix
apramycin cattle powder
fenbendazole sheep liquid oral
eprinomectin cattle pour on
fenbendazole pigs powder
ivermectin sheep injection
ivermectin sheep liquid oral
fenbendazole pigs liquid oral
fenbendazole horse liquid oral
ivermectin horse paste
ivermectin pigs injection
fenbendazole cattle powder
fenbendazole cattle liquid oral
fenbendazole cattle feed pellets
ivermectin cattle injection
fenbendazole cattle bolus
ivermectin cattle pour on

Targeted monitoring study for veterinary medicines in the environment 37
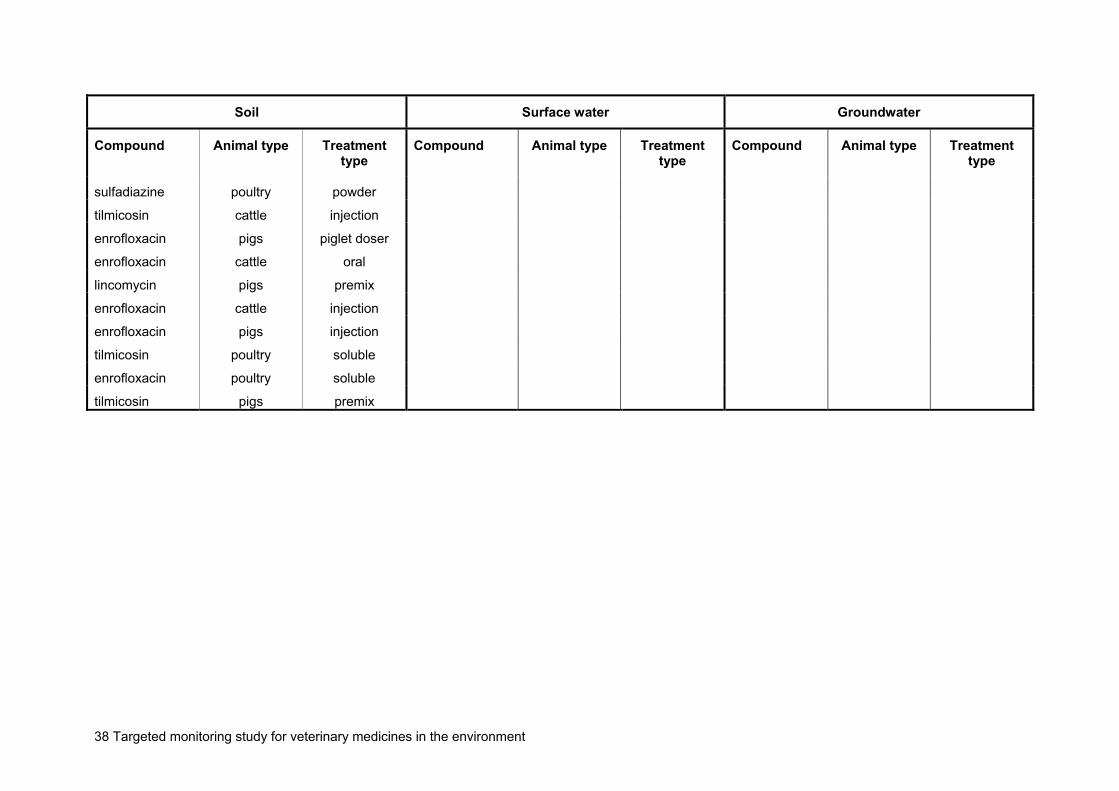
Table 2.12 Priority compounds and scenarios identified for intensively reared animals (i.e. those compounds andscenarios with an RCR >1 or a concentration in groundwater > 0.1 µg l-1, listed in order of increasing RCR orPECgroundwater).
Soil Surface water Groundwater
Compound Animal type Treatmenttype
Compound Animal type Treatmenttype
Compound Animal type Treatmenttype
oxytetracycline cattle topical ivermectin cattle pour on sulfadiazine cattle bolus
trimethoprim poultry powder ivermectin pigs injection sulfadiazine cattle injection
trimethoprim pigs powder sulfadiazine cattle injection florfenicol cattle injection
oxytetracycline pigs injection florfenicol cattle injection sulfadiazine pigs injection
oxytetracycline pigs topical sulfadiazine pigs injection sulfadiazine pigs suspension
oxytetracycline pigs soluble sulfadiazine pigs suspension lincomycin pigs soluble
monensin cattle premix sulfadiazine poultry soluble sulfadiazine poultry soluble
trimethoprim poultry soluble sulfadiazine pigs powder sulfadiazine pigs powder
sulfadiazine cattle bolus tiamulin pigs premix sulfadiazine poultry powder
monensin poultry premix sulfadiazine poultry powder lincomycin pigs premix
sulfadiazine cattle injection tiamulin poultry soluble
oxytetracycline pigs feed additive tiamulin pigs injection
trimethoprim cattle bolus lincomycin pigs premix
sulfadiazine pigs injection
sulfadiazine pigs suspension
florfenicol cattle injection
sulfadiazine poultry soluble
sulfadiazine pigs powder
38 Targeted monitoring study for veterinary medicines in the environment
Soil Surface water Groundwater
Compound Animal type Treatmenttype
Compound Animal type Treatmenttype
Compound Animal type Treatmenttype
sulfadiazine poultry powder
tilmicosin cattle injection
enrofloxacin pigs piglet doser
enrofloxacin cattle oral
lincomycin pigs premix
enrofloxacin cattle injection
enrofloxacin pigs injection
tilmicosin poultry soluble
enrofloxacin poultry soluble
tilmicosin pigs premix

Targeted monitoring study for veterinary medicines in the environment 39
2.3 Summary of the ranking processThe ranking scheme has allowed those treatment scenarios that pose the highestrisk to the environment along with the environmental compartments most at risk to beidentified for each compound. A total of 18 compounds (Table 2.13) were identified aspotential determinands for the targeted risk-based monitoring study.Table 2.13 Compounds identified as of potential concern for inclusion in the
targeted monitoring programmeCompound Treatment
groupScenario Soil Surface water Groundwater
amoxicillin f A X √ Xapramycin c,p P √ √ √bronopol f A X √ Xdoramectin c,p,s P X √ Xenrofloxacin c,p, po I,P √ X Xeprinomectin c P X √ Xfenbendazole p,h,s, c P X √ Xflorfenicol c, I,P √ √ √ivermectin c,p, s, h I,P √ √ Xlincomycin p, c I,P √ √ √monensin po, c I √ X Xmoxidectin c,s P X √ Xoxytetracycline p,f, c I,P,A √ √ √sulfadiazine c,h,s,p, po I,P √ √ √tiamulin p, po I,P X √ Xtilmicosin p,c, s, po I,P √ √ Xtrimethoprim p,c,po I,P √ √ Xtylosin p,c, s P √ √ √c = cattle, p = pigs, s = sheep, h = horse, po = poultry, f = fishP = pasture, I = intensive, A = aquaculture
Only three compounds (triclabendazole, cyromazine and diclazuril) could beexcluded from further consideration on the basis of the ranking procedure.
• Triclabendazole is extensively metabolised and released to the environment inamounts lower than detection limits (Novartis, personal communication).
• Cyromazine is used to treat sheep at low therapeutic doses; concentrations insoil and surface water were therefore considerably lower than PNECs.
• Diclazuril is used to treat poultry and sheep at low therapeutic doses;concentrations in soil and surface water were therefore considerably lowerthan PNECs.
Insufficient data meant it was not possible to rank a number of compounds, i.e.
• amprolium• chlorhexidine• clavulanic acid• decoquinate• dicyclanil• lasalocid• levamisole

40 Targeted monitoring study for veterinary medicines in the environment
• morantel• nicarbazin• nitroxynil• poloxalene• procaine penicillin• salinomycin.
It is therefore recommended that attempts should be made to obtain data for thesecompounds. It may also be appropriate to include some of them in a futuremonitoring programme, selected on the basis of concentration alone.

Targeted monitoring study for veterinary medicines in the environment 41
3 Monitoring of veterinarymedicines in the UK environment
A targeted monitoring programme was carried out between January and December2004. Compounds and scenarios to be monitored were selected on the basis of theranking results described in Section 2. In reviewing these results, the project boarddecided at this stage in the project, on the basis of the resources available, to targetmonitoring effort into the investigation of land-based livestock scenarios. No furtherinvestigation into fish farming medicines and scenarios was conducted.
3.1 Site selectionA number of sites were visited in January 2004 and assessed in terms of theirsuitability as potential monitoring sites. The following criteria were considered duringsite visits:
• Soil and hydrological characteristics. Ideally, the characteristics of thestudy sites should correspond to the characteristics used in the rankingprocess in order that they represent a potentially high exposure scenario.Consequently, for sites receiving manure application, preference was given tosites with underdrained clay soils and, for pasture treatments, preference wasgiven to sites where small watercourses were present.
• Area to which slurry or manure was applied. Preference was given to siteswhere slurry or manure from treated animals was applied to a large proportionof the site.
• Potential inputs of veterinary medicines from other sources.
• Type of animal treated and method of treatment. Preference was given tosites using one of the top-ranked treatment scenarios identified for thecompound.
• Number of veterinary medicines used. Preference was given to sites usinga number of the highest ranked study compounds.
Four study sites were selected using these criteria. These were:
• an indoor intensive pig facility;• a cattle farm where animals are kept on pasture from May to
October/November;• an outdoor pig unit;• a turkey unit.
At the cattle farm, two sets of animals kept separately, were selected for study.

42 Targeted monitoring study for veterinary medicines in the environment
Using these scenarios, it was possible to monitor seven of the study compoundsidentified by the ranking process (see Table 2.13) as high priority when used to treatlivestock. Details of the sites and compounds are given in Tables 3.1 and 3.2.Concentrations of ciprofloxacin, a metabolite of enrofloxacin, were also monitored atthe turkey site.
Details of the sampling approaches, the sites and the specific monitoring routinesapplied at each site are given below.
3.2 Monitoring3.2.1 Sampling approachesAt each site, different media (soil, faeces, sediment and water) appropriate to the siteand treatment scenario were collected. The sampling procedures adopted for thesemedia are described below.
FaecesSamples from freshly deposited pats (at least nine) were collected and consolidated.A sub-sample (250 ml) was transferred to a plastic bottle (Nalgene) and sent foranalysis to the Environment Agency National Laboratory Service (NLS) Llanelli. Anyunused sample was transferred to freezer storage.
SoilOn each sampling occasion, duplicate soil samples were collected from the top 10cm of the soil profile using a 30 mm i.d. gouge auger. Samples were chilled duringtransport back to the laboratory. A 300 g sub-sample taken from one of the fieldsamples was sent for analysis and the second field sample was transferred to freezerstorage.
SedimentOn each field visit, sediment (approximately a 1-litre composite sample) wascollected from several points at each sampling station. A sub-sample (250 ml) wastransferred to a plastic bottle (Nalgene) and sent for analysis to NLS Llanelli. Anyunused sample was transferred to freezer storage.
WaterContinuous monitoring of waters was achieved using EPIC automatic water samplersconfigured to collect samples on a timed basis. A single composite sample of around400 ml (comprising 8 × 50 ml samples taken every 3 hours) was collected on a dailybasis. Samples were collected in borosilicate glass bottles and following collectionwere transferred to silanised glass bottles (Azlon) for shipping to NLS Llanelli forresidue analysis.

Targeted monitoring study for veterinary medicines in the environment 43
Table 3.1 Treatment scenarios used at the monitoring sites
Scenario Location Medicines used Active ingredient Dose Duration(days)
Frequency
Intensively reared pigs(indoor pigs)
Nottinghamshire/Lincolnshire
LincoSpectin lincomycin*spectinomycin
33–44 mg/animal/day33–44 mg/animal/day
3535
11
Tetramin 200 oxytetracycline* 1,800 mg/animal/day 35 1
Trimediazine sulfadiazine*trimethoprim*
113 mg/animal/day23 mg/animal/day
3535
11
Pigs at pasture(outdoor pigs)
Nottingham Aurofac 100 GranularIvomec Premix
chlortetracyclineivermectin*
8 g/sow/day75 mg/sow/day
1414
11
Cattle at pasture North Derbyshire Dectomax Pour-on doramectin* 25 ml/animal NA 2
Cattle at pasture North Derbyshire Qualimintic Pour-on ivermectin* 0.1 ml/kg NA 2
Poultry NortheastYorkshire
VetremoxBaytril 10% Oral Solution
amoxicillin**enrofloxacin*
15 mg/kg/day10 mg/kg/day
33
11
NA = not applicable* Study compound** Priority compound but not investigated as it was only identified as being of potential risk when used in aquaculture.

44 Targeted monitoring study for veterinary medicines in the environment
Table 3.2 Veterinary medicines selected for monitoringVeterinarymedicine Class CAS No. Structure
Doramectin macrocycliclactone 117704-25-3
O O
O
O
O
O
OH
O
OO
O
O
HO
H
H
H H
H
H
H
H
HO HH
H
Enrofloxacin fluoroquinolone 93106-60-6N
F
O
OH
O
N
N
Ivermectin macrocycliclactone 70288-86-7
O O
O
O
O
OO
O
O
HO
O
O
OH
H
H
H H
H
H
H
H
HHOH
H
Lincomycin lincosamide 154-21-2N
O
HN
OHO
S
HO
HO OH
Oxytetracycline tetracycline 6153-64-6
OH
H
O
N
OHO
H
OH
OH
OHHO
NH2
O
Sulfadiazine sulphonamide 68-35-9NH2SO
NH
O
N
N
Trimethoprim pyrimidine 738-70-5N
N NH2
NH2
O
O
O
CAS = Chemical Abstracts Service

Targeted monitoring study for veterinary medicines in the environment 45
3.2.2 Monitoring regimes employed at each site
Indoor pigsThe indoor pig scenario consisted of a 420 sow unit using:
• LincoSpectin (lincomycin) to treat weaners from 8 to 12 weeks of age;• Trimediazine (sulfadiazine/trimethoprim) to treat weaners (3–7 weeks of age);• Tetramin (oxytetracycline) on sows as a five-week treatment when necessary.
Weaners up to 12 weeks of age and about 140 sows were kept on slats; from 12weeks of age, the pigs were fattened on straw. Slurry from slats was transferred toand stored in an earth bank lagoon, which was emptied twice a year. Solid manurefrom sow yards and fattening yards was also spread onto land (set-aside).
An umbilical system was used to spread the slurry onto a 29.4 ha field between 9and 16 March 2004. Slurry was applied at a rate of 78,600 l/ha. The field had amodern drainage system comprising plastic drains and gravel backfill (to within 40 cmof the surface). Laterals were spaced at 20 and 40 m, and the field was mole drained(about 10 years ago, to within 50 cm of the surface). There were six drain outfallsalong the receiving ditch monitored during the experiment.
Following guidance provided by the farmer, one of the six drain outfalls (the one mostlikely to run) was fitted with a float switch to monitor the presence/absence ofdrainflow. A rain gauge and soil temperature probe were placed in the field margin tomonitor hourly rainfall totals and soil temperature. An auto-sampler was positioned tocollect water samples from the ditch at the furthest and most accessible pointdownstream.
Samples of soil were collected from across the field using a ‘W’ formation samplingstrategy and combined. Samples of stream water were collected during periods ofdrainflow and following significant rainfall.
Outdoor pigsThe outdoor pig unit was located on arable land and consisted of 1,125 sows, 300farrowing sows/gilts, 550 dry/serviced sows/gilts and 275 gilts and boars. All breedingstock were routinely wormed twice a year using Ivomec Premix for Pigs – a mealmixture containing 0.6% w/w ivermectin, which is incorporated into rations. The pigsalso received Aurofac 100 Granular (premix containing 100 g per kg chlortetracycline)in the ration as a therapeutic antimicrobial treatment to maintain herd fertility andhealth.
The treatments were administered as a blanket programme and, during treatment,the unit operated a closed system. The breeding pigs received rations containingivermectin and chlortetracycline for a period of 1–2 weeks. The farrowing sowsreceived the medicated ration over the full 14-day period and were thus targeted formonitoring as they presented a worst case scenario. The ration, in the form of acompound paddock nut, was fed to the sows ad lib (average 10 kg/sow/day).Treatment began on 28 April 2004 and was completed by 10 May 2004. The rationwas fed to the pigs via feeding stations.

46 Targeted monitoring study for veterinary medicines in the environment
The farrowing unit was situated on a single block of land split into 28 farrowingpaddocks. Each paddock was approximately 0.4 ha in size and accommodated 8–12sows. Average stocking density was 25 sows per ha.
Soil samples were collected from three paddocks occupied by sows that hadreceived the medicated ration, and from beneath and around the feed stations. Soilsamples were collected 1, 7, 14, 21, 28, 60 and 122 after the last day of thetreatment period. In addition, an untreated soil sample was collected from anadjacent field.
Cattle at pastureMonitoring of doramectin and ivermectin was performed using a mixed breed herdthat consisted of 150 head suckler cows and 250 associated young stock. All cattlewere housed over winter and turned out onto blocks of land in the first week of May.Once turned out, cattle typically stay outdoors until October/November.
Two groups of animals, having direct access to surface water (with no other source ofdrinking water), were identified for treatment with doramectin and ivermectin.
DoramectinTwenty-five store cattle, 6-12 months old (average weight 250 kg) were treated ontwo occasions, eight weeks apart, with Dectomax Pour-On for Cattle (0.5% w/v pour-on solution containing 5 mg/ml doramectin). The first treatment was administered inthe farmyard on 6 May 2004. The second treatment was administered in-field on 1July 2004. On each occasion, each animal received a 25 ml topical application alongthe midline (base tail to withers). Following the first treatment, the cattle weretransported to summer grazing – nine fields of permanent pasture (9.47 ha in total),approximately 2 miles from the farm. The cattle were initially turned out onto 4.54 ha(four fields) of grassland. The remaining five fields (4.93 ha) were made available foraftermath grazing after a cut of hay had been taken.
A stream ran along the boundary of the four fields in which the cattle were initiallyturned into. There were two sizeable access points for the livestock to obtain drinkingwater (stock access to the full length of a stream is not considered good farmingpractice). There was no other source of drinking water for this block of land andlivestock entered the stream to drink frequently, particularly during warmer spells ofweather.
Faeces samples were taken:
• 7, 14, 21, 28 and 35 days after treatment 1;• immediately prior to treatment 2;• 7, 15, 21, 28, 36 and 43 days after treatment 2.
A pretreatment sample of stream water was collected prior to cattle turnout and priorto the second treatment. Thereafter, daily samples (400 ml – obtained by taking 50 mlevery three hours) were taken using an auto-sampler positioned immediatelydownstream of the second drinking access point to the stream. Water samples werebulked for analysis as follows:

Targeted monitoring study for veterinary medicines in the environment 47
• 1–7, 7–14, 14–21, 21–28, 28–35, 35–42 and 42–49 days after treatment 1;• 1–7, 7–15, 15–21, 22–28, 28–36, 36–43, 43–50, 50–57, 57–61, 61–64 and
64–70 days after treatment 2.
IvermectinCalves were treated with the cattle wormer Qualimintic Pour-On, containing 5% w/vivermectin (5 mg/ml) on two occasions.
The first treatment was administered in the farmyard on 25 June 2004. On thisoccasion, a total of 26 cattle were treated (25 calves and one newly calved heifer).Animals were treated with the recommended dose of 1 ml per 10 kg bodyweight (500µg ivermectin per kg bodyweight).
The second treatment was administered in the farmyard on 6 August 2004. On thisoccasion, a total of 37 animals were treated. Additions of ‘qualifying’ individuals to thegroup and the removal of some of the larger animals since the first treatment resultedin more animals being treated on this occasion.
On each occasion, the formulation was administered topically along the midline of theback (base tail to withers). Following the first treatment, the calves were turned ontoa block of grazing land consisting of seven individual fields (15.57 ha in total)adjacent to the farm. Grazing was restricted at this time and cattle had access to fivefields (12.0 ha). Following treatment 2, the group was given access to the remainingtwo fields (2.29 ha).
A small brook bisected the fields and the cattle used this as a drinking waterresource. The cattle had to traverse the brook to access half of the total grazing area.
Samples from freshly deposited pats were collected:
• 4, 7, 14, 21 and 28 days after treatment 1;• 4, 7 and 14 days after treatment 2.
A sample of stream water was collected prior to cattle turnout following treatment 1.Additional water samples were taken daily (400 ml – obtained by taking a 50 mlsample every three hours). Samples collected were either analysed separately (1 and2 days after treatment 1 and 1, 2 and 3 days after treatment 2) or consolidated (2–4,4–7, 7–14, 14–21, 21–28, 28–34 and 34–42 days after treatment 1, and 7–10 and10–14 days after treatment 2). Grab samples were also collected 7, 21 and 31 daysafter treatment.
PoultryThe poultry scenario consisted of a turkey unit of 60,000 birds. Birds were treatedwith Baytril 10% Oral Solution (enrofloxacin), administered via the drinking water at arate of 1 litre per 10,000 kg bodyweight per day (10 mg kg-1 bodyweight equivalent)and Vetremox (amoxicillin trihydrate) where 150 g/day was administered for 3 days.
Litter from the unit was collected and transported to the field site between 21 and 27July 2004. Litter was stored before being spread on a 18.6 ha field on 24 August

48 Targeted monitoring study for veterinary medicines in the environment
2004. Following this, the field was sprayed-off (Roundup), drag-tined (29 August2004) and paraploughed. It was top-tilthed, drilled and rolled on 7 September 2004.
Samples of soil were taken from the treated field 21, 42, 64, 90 and 120 days afterlitter application.
3.2.3 Analysis
AvermectinsThe target analytes (ivermectin and doramectin) were extracted from river waterusing solid phase extraction (SPE).
Target analytes were extracted from soils and sediments using an acceleratedsolvent extraction (ASE) system using 95 per cent methanol/5 per cent water as theextraction solvent. Extracts were evaporated to low volume prior to reverse phaseclean-up using a semi-preparative liquid chromatography system with a fractioncollector that allowed individual isolation of the target analytes. Clean-up provedessential for good ion ratio confirmation.
The extracts were analysed using a high performance liquid chromatography/massspectrometry (HPLC/MS) system with an atmospheric pressure chemical ionisation(APCI) ion source. No derivatisation of the analytes was required prior to HPLC/MS.Confirmation of residues was achieved using ion trap MS/MS.
Recoveries in water ranged from 79 per cent (doramectin) to 103 per cent(eprinomectin), with limits of detection of 0.87, 0.21, 3.97 and 0.68 ng l-1 fordoramectin, ivermectin, eprinomectin and moxidectin respectively.
Recoveries of ivermectin and doramectin in soil were 80 and 91 per cent respectively,with limits of detection of 3.9 µg kg-1 for doramectin and 4.8 µg kg-1 for ivermectin.
Recoveries in sediment were 75 per cent for doramectin and 87 per cent forivermectin respectively, with limits of detection of 0.84 µg kg-1 for doramectin and 0.2µg kg-1 for ivermectin.
EnrofloxacinEnrofloxacin was extracted from soils using an ASE system using acidified methanolas the extraction solvent. Extracts were evaporated to low volume prior to clean-upon a SPE column. Clean-up proved essential for good ion ratio confirmation.
Analysis of extracts was carried out using a HPLC/MS system with an APCI ion source.Confirmation of residues was achieved using ion trap MS/MS. Recoveries from spiked soilwere 86–91 per cent, with a limit of detection of 0.97 µg kg-1. Concentrations ofciprofloxacin (a major metabolite of enrofloxacin) were also determined.

Targeted monitoring study for veterinary medicines in the environment 49
LincomycinLincomycin was extracted from river water using SPE.
Lincomycin was extracted from soils and sediments using an ASE system using 70per cent acetonitrile/30 per cent water as the extraction solvent. Extracts wereevaporated to low volume prior to clean-up on an SPE column. Clean-up provedessential for good ion ratio confirmation.
Analysis of extracts was carried out using a HPLC/MS system equipped with anelectrospray ionisation (ESI) source. Confirmation of residues was achieved usingion trap MS/MS.
Recoveries in water ranged from 75 to 79 per cent with a limit of detection of27.5 ng l-1.
Recoveries in soil ranged from 60 to 80 per cent with a limit of detection of1.26 µg kg-1.
Recoveries in sediment ranged from 58 to 74 per cent with a limit of detection of1.48 µg kg-1.
Oxytetracycline, trimethoprim, sulfadiazineSpike recovery tests were performed alongside each set of samples usingpretreatment stream water. Recoveries for oxytetracyline, sulfadiazine andtrimethoprim were 17–85 per cent, 9–16 per cent and 56–69 per cent respectively.
The National Laboratory Service performed a review of the performance testing andresults arising from the analytical methods for oxytetracycline, trimethoprim andsulfadiazine. The review concluded that:
• concentrations of oxytetracycline in water samples were significantly abovethe limit of detection (LOD) and spiking studies resulted in an acceptablerecovery of 85 per cent. Measurements of oxytetracycline in water weretherefore likely to provide a true reflection of actual values.
• concentrations of oxytetracycline in soil samples and sulfadiazine in watersamples were significantly above the LOD. Spiking studies resulted inrecoveries below 50 per cent but with low relative standard deviations. It wastherefore recommended that a correction factor be applied to correct forrecovery.
• concentrations of sulfadiazine in soil and sediment and trimethoprim in water,soil and sediment were close to the LOD. Spike recoveries for these sampleswere low. Results for trimethoprim and sulfadiazine in these matrices shouldtherefore only be considered as indicative values.
As a result of the review, a correction factor was applied to measurements ofoxytetracycline in soil and sulfadiazine in water samples.

50 Targeted monitoring study for veterinary medicines in the environment
3.2.4 Soil characterisationSoil properties were determined at each site in accordance with the United StatesDepartment of Agriculture (USDA) and UN Food and Agriculture Organization (FAO)guidelines.
A composite sample was taken from the top soil horizon and a sub-sample (500 g)was analysed for:
• percentage sand• percentage silt• percentage clay (six fractions)• pH (in water and potassium chloride)• organically bound carbon• cation exchange capacity (CEC).
Properties are given in Appendix 13.
3.3 Results3.3.1 Indoor pigsThere was a total of 123 mm of rainfall during the study period (9 March to 7 May2004) (Figure 3.1), compared with average rainfall data for the Nottingham area forMarch and April of 92 mm (45.3 mm in March, 46.6 mm in April). The monitored fielddrain was flowing throughout the logging period.
Figure 3.1 Measured daily rainfall at the indoor pig monitoring site
SoilBefore the slurry was applied, concentrations of lincomycin, oxytetracyline,trimethoprim and sulfadiazine in soil were at or below LODs (Figure 3.2). The highestconcentrations of lincomycin, oxytetracycline and sulfadiazine were then observed insamples taken within two weeks of slurry application. Concentrations of these had
0
5
1 0
1 5
2 0
2 5
3 0
09/03
/2004
11/03
/2004
13/03
/2004
15/03
/2004
17/03
/2004
19/03
/2004
21/03
/2004
23/03
/2004
25/03
/2004
27/03
/2004
29/03
/2004
31/03
/2004
02/04
/2004
04/04
/2004
06/04
/2004
08/04
/2004
10/04
/2004
12/04
/2004
14/04
/2004
16/04
/2004
18/04
/2004
20/04
/2004
22/04
/2004
24/04
/2004
26/04
/2004
28/04
/2004
30/04
/2004
02/05
/2004
04/05
/2004
06/05
/2004
Rai
nfal
l (m
m)
S lu r ry a p p lic a t io n
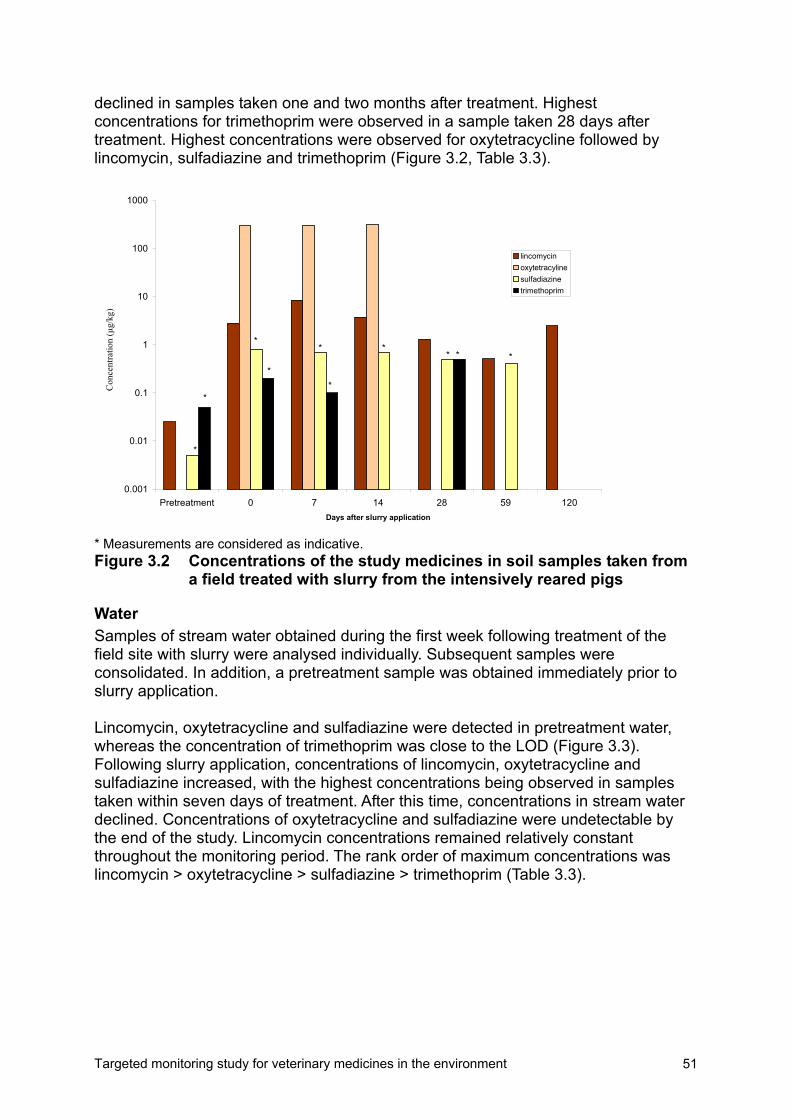
Targeted monitoring study for veterinary medicines in the environment 51
declined in samples taken one and two months after treatment. Highestconcentrations for trimethoprim were observed in a sample taken 28 days aftertreatment. Highest concentrations were observed for oxytetracycline followed bylincomycin, sulfadiazine and trimethoprim (Figure 3.2, Table 3.3).
* Measurements are considered as indicative.Figure 3.2 Concentrations of the study medicines in soil samples taken from
a field treated with slurry from the intensively reared pigs
WaterSamples of stream water obtained during the first week following treatment of thefield site with slurry were analysed individually. Subsequent samples wereconsolidated. In addition, a pretreatment sample was obtained immediately prior toslurry application.
Lincomycin, oxytetracycline and sulfadiazine were detected in pretreatment water,whereas the concentration of trimethoprim was close to the LOD (Figure 3.3).Following slurry application, concentrations of lincomycin, oxytetracycline andsulfadiazine increased, with the highest concentrations being observed in samplestaken within seven days of treatment. After this time, concentrations in stream waterdeclined. Concentrations of oxytetracycline and sulfadiazine were undetectable bythe end of the study. Lincomycin concentrations remained relatively constantthroughout the monitoring period. The rank order of maximum concentrations waslincomycin > oxytetracycline > sulfadiazine > trimethoprim (Table 3.3).
0.001
0.01
0.1
1
10
100
1000
Pretreatment 0 7 14 28 59 120Days after slurry application
Con
cent
ratio
n (u
g/kg
)
lincomycinoxytetracylinesulfadiazinetrimethoprim
*
*
*
*
*
*
** * *
Con
cent
ratio
n (µ
g/kg
)

52 Targeted monitoring study for veterinary medicines in the environment
* Measurements are considered as indicative.
Figure 3.3 Concentrations of lincomycin, oxytetracycline, sulfadiazine andtrimethoprim in stream water during the study period
SedimentAll the study compounds were detected in stream sediment prior to slurry application(Figure 3.4). Following slurry application, concentrations in sediment increased.Concentrations of lincomycin and oxytetracyline then declined over time, whereasthose of sulfadiazine and trimethoprim remained relatively constant. The rank orderof maximum concentrations was oxytetracycline > lincomycin > trimethoprim >sulfadiazine (Table 3.3).
* Measurements are considered as indicative.Figure 3.4 Concentrations of the study medicines in sediment samples taken
from a stream adjacent to a field treated with pig slurry
0.001
0.01
0.1
1
10
100
Pretrea
tmen
t 1 2 3 4 5 6 77-1
212
-1724
-3039
-45 120
Days after slurry application
Con
cent
ratio
n (u
g/L)
lincomycinoxytetracyclinesulfadiazinetrimethoprim
* *
*
* *
*
Con
cent
ratio
n (µ
g/l)
0.1
1
10
100
1000
Pretreatment 7 14 28 50 59 120Days after slurry application
Con
cent
ratio
n (u
g/kg
) lincomycinoxytetracyclinesulfadiazinetrimethoprim
**
*
*
*
*
**
*
*
Con
cent
ratio
n (µ
g/kg
)
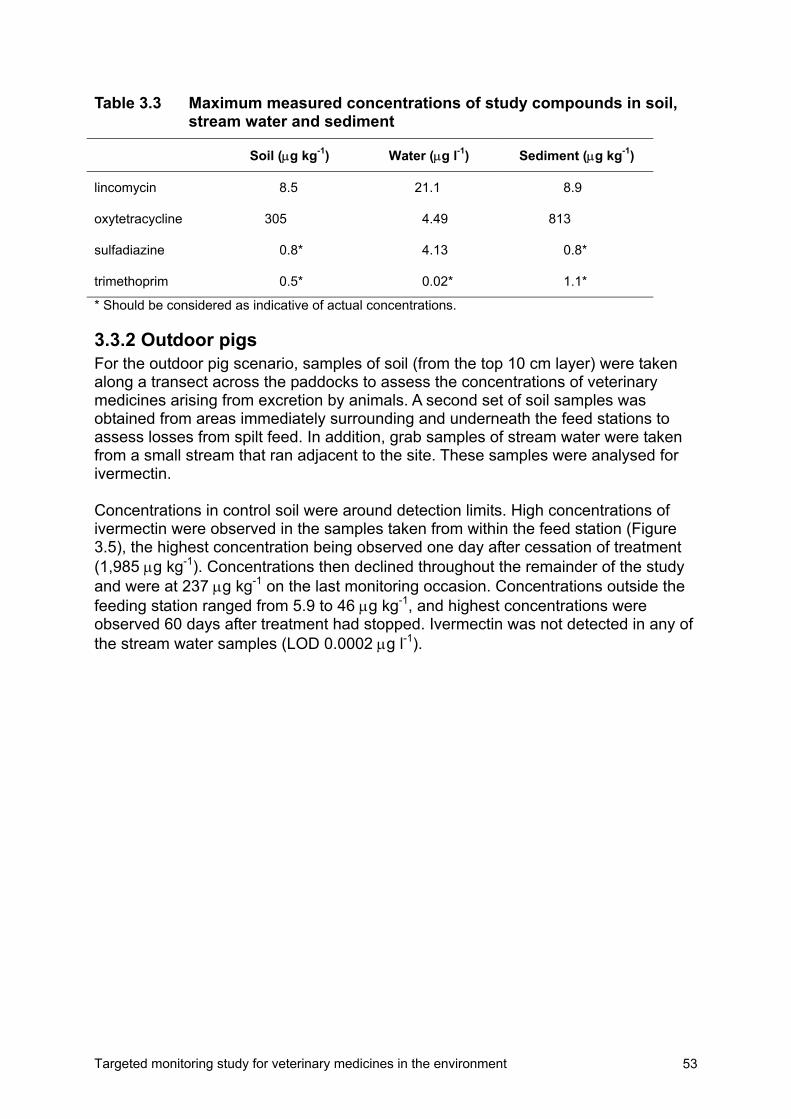
Targeted monitoring study for veterinary medicines in the environment 53
Table 3.3 Maximum measured concentrations of study compounds in soil,stream water and sediment
Soil (µg kg-1) Water (µg l-1) Sediment (µg kg-1)
lincomycin 8.5 21.1 8.9
oxytetracycline 305 4.49 813
sulfadiazine 0.8* 4.13 0.8*
trimethoprim 0.5* 0.02* 1.1*
* Should be considered as indicative of actual concentrations.
3.3.2 Outdoor pigsFor the outdoor pig scenario, samples of soil (from the top 10 cm layer) were takenalong a transect across the paddocks to assess the concentrations of veterinarymedicines arising from excretion by animals. A second set of soil samples wasobtained from areas immediately surrounding and underneath the feed stations toassess losses from spilt feed. In addition, grab samples of stream water were takenfrom a small stream that ran adjacent to the site. These samples were analysed forivermectin.
Concentrations in control soil were around detection limits. High concentrations ofivermectin were observed in the samples taken from within the feed station (Figure3.5), the highest concentration being observed one day after cessation of treatment(1,985 µg kg-1). Concentrations then declined throughout the remainder of the studyand were at 237 µg kg-1 on the last monitoring occasion. Concentrations outside thefeeding station ranged from 5.9 to 46 µg kg-1, and highest concentrations wereobserved 60 days after treatment had stopped. Ivermectin was not detected in any ofthe stream water samples (LOD 0.0002 µg l-1).

54 Targeted monitoring study for veterinary medicines in the environment
1
10
100
1000
10000
Pretreatment 1 7 14 21 28 60
Days after treatment
Con
cent
ratio
n (µ
g/kg
)
Outside feedlotAround/below feedlot
Figure 3.5 Concentrations of ivermectin in soil samples obtained fromoutside the feeding stations and around/below the feeding stationsat the outdoor pig farm
3.3.3 Cattle at pasture
Doramectin
FaecesSamples of faecal material, stream water and sediment were taken from the outdoorcattle site. The cattle were found to drink from the stream at two access points.Observations made during site visits indicated that they had a preference for thedownstream site. Cattle were observed standing in the stream and its margins onseveral site visits, particularly during warm weather. Poaching and damage to thearea leading down to the stream were evident and there was a lot of faecal materialpresent in and around the stream.
Faecal material was collected weekly. The highest concentration (112 µg kg-1) wasobserved in a sample obtained seven days after the first treatment (Figure 3.6).Concentrations then declined and were at 11 µg kg-1 35 days after treatment. Asimilar pattern was observed for the second treatment. The maximum concentration(56 µg kg-1) was observed seven days after treatment; this then declined throughoutthe monitoring period to 2.5 µg kg-1 43 days after treatment.

Targeted monitoring study for veterinary medicines in the environment 55
Figure 3.6 Concentrations of doramectin in faecal material collected from theoutdoor cattle farm
WaterWater samples were obtained from the stream over time. Concentrations ofdoramectin in these samples were all below the LOD (0.001 µg l-1).
Concentrations in sediment obtained prior to and within four weeks of the first cattletreatment were all below the LOD (0.84 mg kg-1) (Figure 3.7). Doramectin was thendetected in samples taken 35 days after treatment 1 and samples taken immediatelybefore the second doramectin treatment. Subsequently, doramectin was detected inall samples taken within four weeks of the second treatment. Doramectinconcentrations were below the limit of quantification thereafter.
Figure 3.7 Concentrations of doramectin in stream sediment
IvermectinCattle treated with ivermectin were kept on an area of pasture bisected by a smallbrook that was the sole source of drinking water. During site visits, cattle wereobserved either standing in (drinking or defecating) or crossing the brook. The area
0
20
40
60
80
100
120
7 14 21 28 35 7 15 21 28 36 43
Days after treatment
Con
cent
ratio
n (µ
g/kg
)
Treatment 1 Treatment 2
0
0.5
1
1.5
2
2.5
3
Pretreatment
7 14 21 28 35
56/Pretreatment
7 21 28 43 50 61
Days after treatment
Con
cent
ratio
n (µ
g/kg
)
Treatment 1 Treatment 2

56 Targeted monitoring study for veterinary medicines in the environment
around the brook was steep and covered in faecal material. There was visualevidence of transport of faecal material from the slope to the brook through walking inand runoff.
Maximum concentrations of ivermectin in faecal material were observed in samplesobtained 4 and 7 days after treatment (Figure 3.8). Concentrations in subsequentsamples were more than an order of magnitude lower and were below the LOD(0.005 mg kg-1) four weeks after treatment.
Figure 3.8 Concentrations of ivermectin in faecal material obtained from theoutdoor cattle site
Concentrations of ivermectin in water samples taken from the brook over time wereall lower than the LOD (0.0002 µg l-1). Before the first treatment, ivermectin wasdetected in sediment at a level of 0.78 µg kg-1. Concentrations in sediment samplestaken following treatment ranged from 0.82 to 4.9 µg kg-1 (Figure 3.9). There was norelationship between the concentration in sediment and time after treatment.
The maximum concentration (1.5 µg kg-1) following the second treatment wasobserved in a sediment sample obtained four days after treatment. Concentrations insediment then declined to below the LOD (0.2 µg kg-1) 14 days after treatment.
0
0.2
0.4
0.6
0.8
1
1.2
1.4
1.6
1.8
2
4 7 14 21 28
Days after treatment
Con
cent
ratio
n (m
g/kg
)

Targeted monitoring study for veterinary medicines in the environment 57
Figure 3.9 Concentrations of ivermectin in sediment obtained from theoutdoor cattle site
3.3.4 PoultryLitter from the turkey unit was analysed for enrofloxacin and its major metaboliteciprofloxacin. Samples were also taken from a field treated with the litter over a threemonth period.
Both enrofloxacin and ciprofloxacin were detected in the turkey litter atconcentrations of 2.92 and 0.28 µg kg-1 respectively. Enrofloxacin and ciprofloxacinwere not detected in any of the soil samples (LOD 1 µg kg-1).
3.4 Summary of field resultsEighteen veterinary medicines were identified for inclusion in a monitoringprogramme using the risk-based ranking approach described in Section 2. Four studysites were selected that used one or more of the highest ranked compounds andtreatment scenarios.
Using these four study sites, it was possible to investigate the exposure to sevenveterinary medicines (doramectin, enrofloxacin, ivermectin, lincomycin,oxytetracycline, sulfadiazine and trimethoprim) from four different scenarios (indoorpigs, outdoor pigs, cattle at pasture and poultry).
The ranking process also considered a number of environmental scenarios thatwould be expected to promote the transport of veterinary medicines to surface waterbodies. Aquatic exposure assessments for compounds applied to land in slurry ormanure were based on a heavy underdrained soil scenario, whereas assessmentsfor pasture animals focused on the situation where a small stream is present in apasture field. Both study sites where surface waters were monitored were similar tothe associated model scenario. Slurry from the indoor pig site was applied to a large
0
1
2
3
4
5
6
Pretreatment 7 14 21 28 34 42 4 7 14 21
Days after treatment
Con
cent
ratio
n (µ
g/kg
)
Treatment 1 Treatment 2

58 Targeted monitoring study for veterinary medicines in the environment
field of heavy soil that drained via mole drains to a small stream. Outdoor cattle werekept on fields where small bodies of water were present.
At each study site, the monitoring was targeted to detect the highest exposureconcentrations arising from the treatment. Hence, stream water was monitoredcontinuously at the indoor pig and outdoor cattle study sites, and samples of soil andsediment were taken on a number of occasions following either application of slurryor litter or the cessation of treatment.
The maximum concentrations measured for each determinand across the differentsites are summarised in Table 3.3. These are likely to provide an indication of ‘worst’case maximum concentrations for the scenarios studied.Table 3.3 Maximum measured environmental concentrations of study
veterinary medicinesFaeces/litter
(µg kg-1)Soil
(µg kg-1)Water(µg l-1)
Sediment(µg kg-1)
ciprofloxacin 0.28 nd - -doramectin 112 - nd 2.69enrofloxacin 2.92 nd - -ivermectin (pigs) - 46 (1,985^) nd -ivermectin (cattle) 1,850 - nd 4.91lincomycin - 8.5 21.1 8.9oxytetracycline - 305 4.49 813sulfadiazine - 0.8* 4.13 0.8*trimethoprim - 0.5* 0.02* 0.5** Indicative values only.$ The treatment dose and duration at study site were significantly higher than recommended, soconcentrations under typical treatment regimes are likely to be more than an order of magnitude lower.^ Concentration around/below feeding stations.

Targeted monitoring study for veterinary medicines in the environment 59
4 DiscussionA previous Environment Agency study (Boxall et al. 2002) reviewed information onthe usage, fate and ecotoxicity of veterinary medicines in use in the UK. Using thisinformation, compounds were prioritised in terms of their potential to enter theenvironment and cause harm in order to identify compounds of potential concern. Atotal of 55 compounds were assigned to a ‘high risk’ category but sufficient data wereonly available to fully characterise the potential risk of 11 compounds. Thisprioritisation approach was designed as a simple screening tool and did not provideany information on which environmental compartments were at most risk from aparticular compound and on the level of risk associated with it.
This study was therefore performed to:
• refine the prioritisation results using newly available data;• rank compounds in terms of their relative environmental risks using ‘worst
case’ estimates of environmental exposure and available ecotoxicologicaldata;
• perform targeted monitoring for compounds with a ‘high risk’ ranking toestablish whether veterinary medicines are present in the environment atecologically significant concentrations.
Following advice from the Veterinary Medicines Directorate and veterinary medicinemanufacturers, a number of compounds were removed from the initial priority list(some no longer held a marketing authorisation and some were used very rarely oronly in small quantities). Conversely, a number of compounds were added to the list,either because they were considered highly toxic to aquatic or terrestrial organisms(e.g. the macrocyclic lactone endectocides) or they had recently been grantedmarketing authorisations (bronopol, dicyclanil) and were expected to be used insignificant amounts. Following a review of the priority list, 34 compounds wereselected for further assessment.
A pragmatic and scientific approach was developed and adopted to enable theidentification of those compounds and scenarios that warranted further study by theEnvironment Agency. The scheme used a risk-based approach to identify thosecompounds with the highest potential relative to other veterinary medicines to impactthe environment. It allowed the identification of those treatment scenarios for eachcompound that pose the highest relative risk to the environment along with theenvironmental compartments most likely to be exposed.
A total of 18 priority compounds were identified as potential determinands for atargeted monitoring study. The risk-based ranking procedure allowed threecompounds (triclabendazole, cyromazine and diclazuril) to be excluded from themonitoring programme. Due to insufficient data, it was not possible to rank a numberof compounds given on the initial priority list, namely amprolium, chlorhexidine,clavulanic acid, decoquinate, dicyclanil, lasalocid, levamisole, morantel, nicarbazin,nitroxynil, poloxalene, procaine penicillin, and salinomycin. The relative risks of theseto the environment, compared with the compounds for which full datasets were

60 Targeted monitoring study for veterinary medicines in the environment
available, are unknown. It is therefore recommended that attempts should be madeto obtain data for these compounds in the future.
The ranking scheme used assumptions that are likely to overestimate trueenvironmental concentrations. In addition, the risk characterisation ratios used are, ingeneral, unlikely to reflect actual risks in the environment. Some of the reasons forthis are given below.
• The treatment scenarios used represent ‘worst case’ treatments. For manycompounds, these scenarios may only apply to a small proportion of animalseach year.
• The assessments considered group treatments. For some compounds, it islikely that, at the whole farm scale, the concentrations in the differentenvironmental compartments (soil, surface water, groundwater, etc.) will bediluted by the presence of untreated animals in a herd.
• Apart from a few compounds, metabolism was not considered in theassessments.
• Surface water simulations assume that a substance is released to a staticditch. Removal by flowing waters or partitioning to sediment material was notconsidered. In the ‘real’ environment, medicines applied in slurry will entersurface water in short-lived pulses (Kay et al. 2004), which are likely todissipate rapidly.
• Groundwater simulations were based on vulnerable soil types. They assumeda groundwater depth of 1 m and used maximum predicted concentrations ofveterinary medicines. In the ‘real’ environment, these concentrations are likelyto be significantly diluted.
• Aquaculture simulations were based on a simplified scenario, which was likelyto overestimate receiving water concentrations for compounds stronglysorbing to soil (e.g. oxytetracycline). In all cases, substances would likely existin surface waters for less than 24 hours (in many cases, considerably shorter).
The calculated RCRs therefore probably overestimate risk and are not intended to beused for risk assessment purposes. They are, however, appropriate for rankingpurposes as required in this study.
The results of the ranking procedure were used to design a targeted risk-basedmonitoring programme. Four study sites were selected, which used one or more ofthe highest ranked compounds. Using the four study sites, it was possible toinvestigate:
• exposure to seven veterinary medicines (doramectin, enrofloxacin, ivermectin,lincomycin, oxytetracycline, sulfadiazine and trimethoprim);
• four scenarios ( indoor pigs, outdoor pigs, cattle at pasture and poultry).

Targeted monitoring study for veterinary medicines in the environment 61
In order to draw conclusions on the potential environmental impacts of veterinarymedicines in use in the UK, the treatment scenarios at the study sites needed tocorrespond to the realistic ‘worst’ case scenarios used in the risk ranking. With theexception of ivermectin in outdoor pigs, treatment scenarios used at each of the siteswere similar to scenarios used in the modelling component of the project. At the pigfarm, animals were treated with ivermectin at a higher dose and for a longer periodthan recommended, receiving more than 10 times the recommended amount ofivermectin. Therefore, measured concentrations for ivermectin in soil at this site arelikely to be significantly higher than would be expected under recommendedtreatment regimes.
The characteristics (e.g. type of water body, animal density and manure application)of the study sites were selected to provide a high potential for environmentalexposure to the veterinary medicines (Table 4.1).
The monitoring study was performed over an 11-month period during 2004.
• With the exception of enrofloxacin and its metabolite ciprofloxacin, all thestudy compounds were detected in one or more environmental compartment.
• Concentrations of antibacterials in soil ranged from 0.5 µg kg-1 (trimethoprim)to 305 (oxytetracycline) µg kg-1.
• Maximum measured concentrations for ivermectin in soil were 1,985 µg kg-1
around the feeding stations and 46 µg kg-1 elsewhere in the field. The amountof ivermectin given to the pigs was more than an order of magnitude higherthan recommended, so concentrations of ivermectin arising fromrecommended treatment regimes are likely to be significantly lower.
• Maximum concentrations of antibacterials in water ranged from 0.02 µg l-1
(trimethoprim) to 21.1 (lincomycin) µg l-1. The parasiticides (doramectin andivermectin) were not detected.
• Concentrations of antibacterials in sediment ranged from 0.5 to 813 µg kg-1
and the concentrations of doramectin and ivermectin were 2.7 and 4.9 µg kg-1
respectively.
At the indoor pig farm, concentrations of the study compounds in soil prior toapplication of the slurry were around analytical limits of detection. At this point,however, oxytetracycline and sulfadiazine were detected in stream water and all thestudy compounds were detected in stream sediment. Discussions with the farmowner revealed that a field drain that discharges into the stream passes under the pigunit. The detections may therefore be explained by the leakage of slurry from the unitinto the underlying field drain.
Following application of the slurry to the field, all the study compounds were detectedin soils. The relative ranking of the compounds based on maximum concentrationswas oxytetracycline > lincomycin > sulfadiazine > trimethoprim.

62 Targeted monitoring study for veterinary medicines in the environment
Table 4.1 Comparison of modelled treatment scenarios with actual treatments used on the monitored farmsModelled treatment scenario Monitored treatment scenario
Dose(mg kg-1 )
Duration(days)
Frequency Total (mg) Dose(mg kg-1)
Duration(days)
Frequency Total (mg)
doramectin 0.2 1 3 0.6 0.5 1 2 1.0enrofloxacin 10 10 1 100 10 14 1 140ivermectin (pigs) 0.1 7 1 0.7 0.75 14 1 10.5ivermectin (cattle) 0.5 1 3 1.5 0.5 1 2 1.0lincomycin 22 21 1 462 2.2 35 1 77oxytetracycline 20 15 1 300 18 35 1 630sulfadiazine 25 3 1 75 5.7 35 1 200trimethoprim 8 5 1 40 1.15 35 1 40

Targeted monitoring study for veterinary medicines in the environment 63
Concentrations of oxytetracycline were more than an order of magnitude greater thanlincomycin and more than two orders of magnitude greater than sulfadiazine andtrimethoprim. These differences in concentration cannot be explained by thedifferences in the animal treatment regimes and suggest that some of the studycompounds are degraded during slurry storage.
Rainfall occurred soon after application of slurry to the field and measurements ofconcentrations in stream water samples indicated that all the compounds weretransported from the soil to the adjacent stream in runoff. The highest concentrationswere observed during the first week following slurry application. The rank order interms of maximum concentrations was lincomycin > oxytetracycline > sulfadiazine >trimethoprim. After one week, concentrations of most of the study compoundsdeclined and oxytetracycline, sulfadiazine and trimethoprim were undetectable insamples taken from 12 days after slurry application. A similar pattern was obtained ina recent field monitoring study where manure spiked with tetracyclines, sulfonamidesand macrolides was applied to a tile drained field (Kay et al. 2004). A limited amountof published data is available on concentrations of tetracyclines, macrolides,sulfonamides and trimethoprim in surface waters in the US (Kolpin et al. 2002);maximum concentrations of macrolides and tetracyclines in these studies weresignificantly lower than in the present study.
The inputs of ivermectin and doramectin to surface waters were investigated at afarm where cattle are kept on pasture. A small water body was present on the twoareas of grassland used for the study. For both compounds, monitoring wasperformed over two treatment cycles. Analysis of faecal material indicated thatdoramectin, applied as a pour on, was excreted to the pasture over a five-weekperiod, with the highest faecal concentrations observed in samples taken in the firstweek following treatment. Ivermectin was excreted more quickly. These observationsagree with previous studies into the excretion of ivermectin and doramectin (Sommerand Steffansen 1993, Pfizer 1996, Steel and Hennessey 2001). Neither of thecompounds was detected in any of the surface water samples obtained. Thisprobably reflects the high sorptive potential of both compounds (Koc values forivermectin: 12,600–15,700; doramectin: 7,520–86,900), which means that anymaterial entering streams will be particle-associated and that it will be transported tothe stream sediment. Analysis of sediment samples supports this conclusion; bothdoramectin and ivermectin were detected in sediment at maximum concentrations of2.69 and 4.91 µg kg-1 respectively. The lack of any pattern in the analytical results forthe sediment indicated that there might be significant variation in concentrations ofboth compounds in sediment across a small area.
Concentrations of ivermectin were also measured at a site where pigs were keptoutdoors. Ivermectin was detected in all soil samples. Samples were taken fromaround and below the feeding stations as well as from outside the feeding stations.Highest concentrations were observed around the feeding stations in areas wherethere was evidence that feed had been spilt. Concentrations outside the feedingstations were generally much lower. As with the sediment data described above,there appeared to be considerable spatial variability in ivermectin concentrations.However, the data do indicate that the substance may persist in soil with anappreciable amount being observed both within and outside the feeding stations 60days after treatment. As the amount of ivermectin given to the pigs was more than an

64 Targeted monitoring study for veterinary medicines in the environment
order of magnitude higher than recommended, concentrations arising fromrecommended treatment regimes are likely to be significantly lower. This is supportedby previous studies where measured concentrations were significantly higher thanthose reported in previous monitoring studies (e.g. Nessel et al. 1989).
Inputs of enrofloxacin to soils were investigated at a large turkey unit where litter wasspread on a nearby field; concentrations of enrofloxacin in the soil over time weremeasured. Although enrofloxacin was detected in the litter, it was not detected in anysoil sample taken between 21 and 90 days after litter application. This suggested thatthe compound had degraded either during storage of the litter prior to application orfollowing application to the soil. Concentrations of ciprofloxacin, a metabolite ofenrofloxacin, were also measured. This substance was also detected in litter but notin any of the soil samples.
In order to put the monitoring data into some context, the maximum measuredenvironmental concentrations (MECs) for each of the compounds studied in themonitoring study were compared with PNECs (Tables 4.2 and 4.3).
Comparison of MECs for surface waters with available data on environmental effectsindicated that concentrations of the antibacterial compounds studied (oxytetracycline,sulfadiazine, trimethoprim and lincomycin) were at least an order of magnitude lowerthan their PNECs. It is therefore recommended that these compounds are not treatedas a high priority for further study. Concentrations of the parasiticides in all watersamples were below LODs. As the LODs were either the same as or lower thanPNECs, these compounds are also unlikely to be a major concern in the watercompartment.
Maximum MECs of oxytetracycline, sulfadiazine, trimethoprim, ivermectin andenrofloxacin in soils were also significantly lower than PNECs. These compoundsshould also not be treated as a priority in the future. In contrast, the maximumconcentrations of lincomycin found in soil were higher than its PNEC. Althoughimpacts from lincomycin cannot be ruled out, the endpoint used in deriving its PNECwas a no-observed effect concentration (NOEC) to which a conservative uncertaintyfactor of 100 was applied.
For the majority of compounds, no data were available on the toxicity to sediment-dwelling organisms. However, following release to surface waters, many of thecompounds are likely to partition to sediment and hence may have the potential toaffect benthic organisms. For pesticides, it has been proposed that compounds with asorption coefficient (Koc) exceeding 1,000 could pose a risk to sediment dwellers andthus should be considered experimentally (Maund et al. 1997). Fifteen of thecompounds assessed that would be expected to enter surface waters (i.e.amoxicillin, apramycin, doramectin, eprinomectin, fenbendazole, ivermectin,lasalocid, levamisole, morantel, moxidectin, oxytetracycline, procaine penicillin,tilmicosin, trimethoprim and tylosin) have Koc values greater than this trigger value.Sediment samples were therefore taken and analysed during the monitoring phase ofthe study.
All the compounds monitored for in sediment during this project (i.e. doramectin,ivermectin, lincomycin, oxytetracycline, sulfadiazine and trimethoprim) were detected.

Targeted monitoring study for veterinary medicines in the environment 65
However, due the absence of relevant ecotoxicological data, it was not possible toassess the significance of these measurements.
The only available data were for the effects of ivermectin on marine sedimentdwellers. Effects of ivermectin on feeding of Asterias rubens have been reported at<5 µg kg-1 (Thain et al. 1997). Because this value is similar to the maximumconcentration of ivermectin measured in stream sediment in this study, impacts ofivermectin on sediment-dwelling invertebrates cannot be ruled out. Doramectin has asimilar mode of toxic action and was observed at similar concentrations to ivermectin;this may also warrant further consideration.
While this study has identified some areas for concern, the overall results indicatethat the concentrations of veterinary medicines measured are significantly lower thanthose that might cause environmental effects. It is probable that concentrationsacross the broader UK agricultural landscape will be lower still because:
• the monitoring study focused on sites with characteristics that would enhanceenvironmental contamination (e.g. pasture land with small water bodiespresent, heavy underdrained soils);
• the monitoring regime focused on occasions when the compounds were likelyto be released to the environment.
However, the study highlighted a number of areas where future work is warranted.These include:
• a more detailed assessment of the potential impacts of veterinary medicineson soil;
• an assessment of the potential fate and impacts of parasiticides in sediment;
• consideration of those compounds, which despite being identified as highpriority, could not be assessed in the current study due to insufficient data;
• consideration of those compounds (11) where there were sufficient data toundertake ranking and where ranking placed them in the top 18, but for whichmonitoring was not pursued;
• monitoring studies to assess the potential to contaminate groundwater. Anumber of compounds were identified as being of potential concern to thisenvironmental compartment.
There are also a number of broader issues that could not be addressed in this study,but which warrant further consideration.
• A number of workers are investigating the use of more subtle endpoints suchas impacts on behaviour, physiology and biochemistry. Although highlyconservative uncertainty factors were used in this study, it may be beneficialfor the Environment Agency to review regularly the results arising from suchstudies.

66 Targeted monitoring study for veterinary medicines in the environment
• The current work focused on parent veterinary medicines, yet manycompounds are metabolised in the treated animal or degraded to othersubstances in the environment. The potential impacts of these degradationproducts (and degradation products from other chemical classes) should beassessed.
• This study has shown that soil and aquatic systems can contain a mixture ofveterinary medicines. When considering potential impacts, compounds aregenerally assessed on an individual basis. However, it would be beneficial tobegin to develop an understanding of the potential interactions of veterinarymedicines and other substances that might be present in the environment.
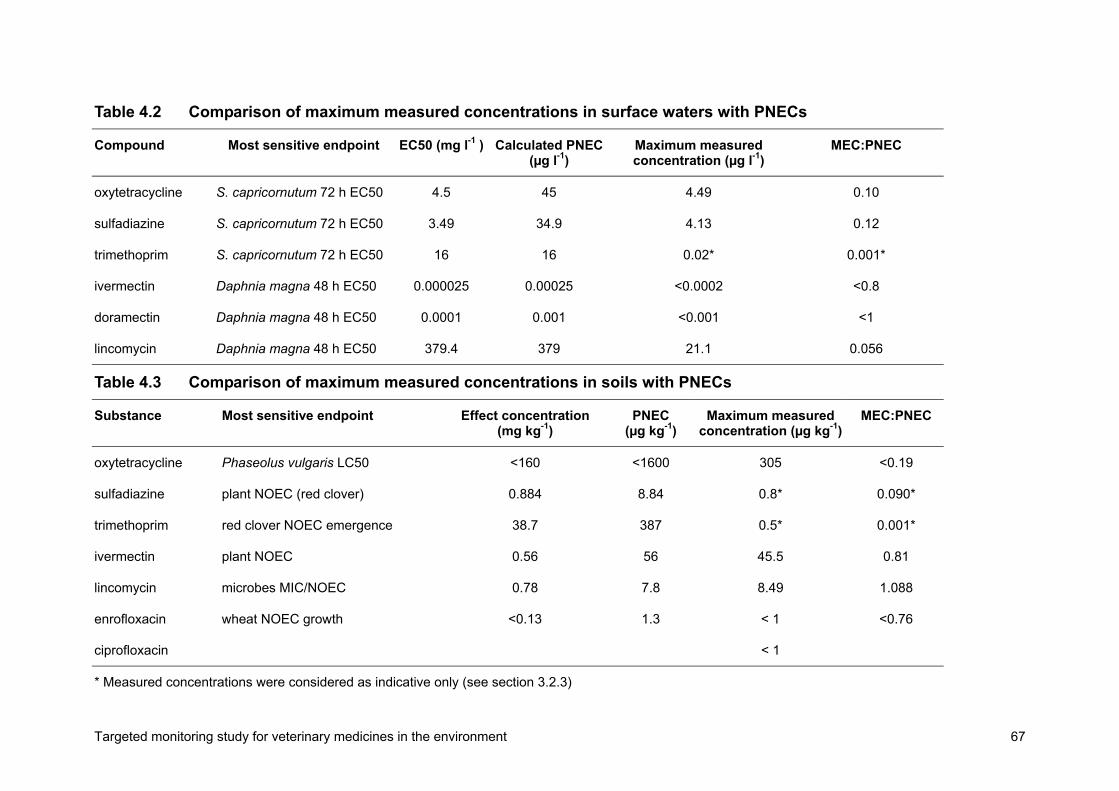
Targeted monitoring study for veterinary medicines in the environment 67
Table 4.2 Comparison of maximum measured concentrations in surface waters with PNECs
Compound Most sensitive endpoint EC50 (mg l-1 ) Calculated PNEC(µg l-1)
Maximum measuredconcentration (µg l-1)
MEC:PNEC
oxytetracycline S. capricornutum 72 h EC50 4.5 45 4.49 0.10
sulfadiazine S. capricornutum 72 h EC50 3.49 34.9 4.13 0.12
trimethoprim S. capricornutum 72 h EC50 16 16 0.02* 0.001*
ivermectin Daphnia magna 48 h EC50 0.000025 0.00025 <0.0002 <0.8
doramectin Daphnia magna 48 h EC50 0.0001 0.001 <0.001 <1
lincomycin Daphnia magna 48 h EC50 379.4 379 21.1 0.056
Table 4.3 Comparison of maximum measured concentrations in soils with PNECs
Substance Most sensitive endpoint Effect concentration(mg kg-1)
PNEC(µg kg-1)
Maximum measuredconcentration (µg kg-1)
MEC:PNEC
oxytetracycline Phaseolus vulgaris LC50 <160 <1600 305 <0.19
sulfadiazine plant NOEC (red clover) 0.884 8.84 0.8* 0.090*
trimethoprim red clover NOEC emergence 38.7 387 0.5* 0.001*
ivermectin plant NOEC 0.56 56 45.5 0.81
lincomycin microbes MIC/NOEC 0.78 7.8 8.49 1.088
enrofloxacin wheat NOEC growth <0.13 1.3 < 1 <0.76
ciprofloxacin < 1
* Measured concentrations were considered as indicative only (see section 3.2.3)

68 Targeted monitoring study for veterinary medicines in the environment
5 ConclusionsA pragmatic and scientifically sound risk-based ranking approach has beendeveloped and applied to those veterinary medicines identified as high priority by aprevious Environment Agency project.
Using the ranking scheme, 18 compounds were identified as worthy of monitoring inthe environment. The procedure identified those treatment scenarios that are mostlikely to cause harm and the environmental compartments that should be monitored.Based on the results of the ranking work, a monitoring study was performed todetermine concentrations in the UK environment of seven of the 18 compounds.
With a few exceptions, maximum measured environmental concentrations were lowerthan predicted no effect concentrations (PNECs). For many of the determinands,average concentrations across the broader UK agricultural landscape are likely to belower still as the monitoring programme:
• considered the highest ranked compounds and scenarios;• selected sites with characteristics that would enhance environmental
contamination;• focused on occasions when the compounds were likely to be released to the
environment.
The results thus indicate that, in general, concentrations of these veterinarymedicines in the UK environment are likely to be below those that could affectaquatic and terrestrial organisms.
However, the study identified some areas where future work is warranted. Theseinclude:
• a more detailed assessment of the potential impacts of veterinary medicineson soil;
• investigations into the fate and effects of parasiticides in sediment;• assessment of those compounds that could not be studied in this project due
to insufficient data, concentrating on issues arising from the environmental riskassessments submitted to gain marketing authorisation;
• further assessment of the potential impacts of the other 11 (of the 18) selectedveterinary medicines on the environment;
• monitoring of groundwater.

Targeted monitoring study for veterinary medicines in the environment 69
References & BibliographyADAS, 1997 Animal manure practices in the pig industry: survey report. Prepared byADAS Market Research Team, July 1997. Wolverhampton: ADAS.
ADAS, 1998 Animal manure practices in the dairy industry: survey report. Preparedby ADAS Market Research Team, March 1998. Wolverhampton, ADAS.
AH Robins Co., 1992 Environmental assessment for the use of salinomycin in poultryfeeds. Report NADA 128-686EA. Richmond, VA, USA: AH Robins Co.
Bayer Corp., 1996 Environmental assessment: enrofloxacin Baytril 3.23%concentrate antimicrobial solution. Report NADA 140-828EA. Shawnee Mission, KS,USA: Bayer Corp.
Boxall A B A, Fogg L A, Blackwell P A, Kay P and Pemberton E J, 2002 Review ofveterinary medicines in the environment. R&D Technical Report P6-012/8TR. Bristol:Environment Agency
Boxall A B A, Fogg L A, Blackwell P A, Kay P, Pemberton E J and Croxford A, 2004Veterinary medicines in the environment. Review of Environmental Contaminationand Toxicology, 180, 1–91.
Brander G C, Pugh D M and Bywater R J, 1977 Veterinary Applied Pharmacologyand Therapeutics (4th edn.). London: Baillière Tindall.
Brown C D, Hart A, Lewis K A and Dubus I G, 2003 p-EMA (I): simulating theenvironmental fate of pesticides for a farm-level risk assessment system. Agronomie,23, 67–74.
Callow B, 2000 Change to the method by which PSD estimates the losses ofpesticides to surface waters via drainflow. All Approval Holders Letter (AAHL) 01/00.York: Pesticides Safety Directorate (PSD).
Calneck B W, Barnes H J, Beard C W, McDougald L R and Saif Y M, 1997 EditorsDiseases of Poultry (10th edn.). Ames, IA, USA: Iowa State University Press.
Committee for Veterinary Medicinal Products (CVMP) 1997 Guidance onenvironmental risk assessment for veterinary medicinal products other than GMO-containing and immunological products. London: CVMP.
Davies I M, Gillibrand P A, McHenery J G and Rae G H, 1998 Environmental risk ofivermectin to sediment-dwelling organisms. Aquaculture, 163, 29–46.
Debuf Y M, 1991 The Veterinary Formulary (1st edn.). London: PharmaceuticalPress.

70 Targeted monitoring study for veterinary medicines in the environment
Elanco Animal Health, 1996 Environmental assessment for the use of micotil 300injection in early treatment of bovine respiratory disease. Report NADA 140-929EA.Indianapolis, IN, USA: Elanco Animal Health.
Elanco Products Co., 1989 Environmental assessment for the use of rumensinpremixes in feed of beef cattle for the prevention and control of coccidiosis. ReportNADA 095-735EA. Indianapolis, IN, USA: Elanco Products Co.
Environment Agency, 1998 Pesticides 1998: a summary of monitoring of the aquaticenvironment in England and Wales. Report prepared by the National Centre forEcotoxicology and Hazardous Substances, Wallingford. Bristol: Environment Agency.
Environment Agency, 2000 Welsh sheep dip monitoring programme. Cardiff:Environment Agency Wales.
Environment Agency, 2001 Pesticides 1999/2000: a summary of monitoring of theaquatic environment in England and Wales. Report prepared by National Centre forEcotoxicology and Hazardous Substances, Wallingford. Bristol: Environment Agency.
Environment Agency, 2003 Managing chemicals for a better environment. TheEnvironment Agency’s Strategy. Bristol: Environment Agency. Available from:http://www.environment-agency.gov.uk/commondata/acrobat/chemicalstrategy_577736.pdf [Accessed 28November 2005]
Fermenta Animal Health Company, 1994 Environmental assessment Denagard®(tiamulin) premixes. Supplement to NADA 139-472EA. Elwood, KS, USA: FermentaAnimal Health Company.
FOCUS, 1997 Surface water models and EU registration of plant protection products.Final report of the work of the Regulatory Modelling Working Group on Surface WaterModels of FOCUS (FOrum for the Co-ordination of pesticide fate models and theirUSe). European Commission Document 6476/VI/96. Available from:http://viso.ei.jrc.it/focus/index.html [Accessed 24 March 2006]
Fort Dodge Animal Health, 1997 Environmental assessment Cydectin® moxidectin0.5% pour-on for cattle. Overland Park, KS, USA: Fort Dodge Animal Health.
Hoechst-Roussel Agri-Vet Company, 1995 Environmental assessment: fenbendazolesuspension 10% in dairy cattle of breeding age. Report NADA 128-620. Somerville,NJ, USA: Hoechst-Roussel Ag-Vet Company.
Jacobsen P and Berglind L, 1988 Persistence of oxytetracycline in sediment from fishfarms. Aquaculture, 70, 365–370.
Kay P, Blackwell P A and Boxall A B A, 2004 Fate and transport of veterinaryantibiotics in drained clay soils. Environmental Toxicology and Chemistry, 23, No. 5,1136–1144.

Targeted monitoring study for veterinary medicines in the environment 71
Kolpin D W, Furlong E T, Meyer M T, Zaugg S D, Barber L and Buxton H T, 2002Pharmaceuticals, hormones and other organic wastewater contaminants in USstreams, 1999–2000: a national reconnaissance. Environmental Science andTechnology 36, 1202–1211.
Maund S, Barber I, Dulka J, Gonzalez-Valero J, Hamer M, Heimbach F, Marshall M,McCahon P, Staudenmaier H and Wustner D, 1997 Development and evaluation oftriggers for sediment toxicity testing of pesticides with benthic macroinvertebrates.Environmental Toxicology and Chemistry 16, 2590–2596.
McCracken D I, 1993 The potential for avermectins to affect wildlife. VeterinaryParasitology, 48, 273–280.
McKellar Q A, 1997 Ecotoxicology and residues of anthelmintic compounds.Veterinary Parasitology, 72, 413–435.
Merck and Company, 1996a Ivomec Eprinex (eprinomectin) pour-on for beef anddairy cattle: environmental assessment. Report NADA 141-079EA. Rahway, NJ,USA: Merck and Company.
Merck and Company, 1996b Ivomec SR bolus for cattle: environmental assessment.Report NADA 140-988EA. Rahway, NJ, USA: Merck and Company.
Montforts M H M M, 1999 Environmental risk assessment for veterinary medicinalproducts Part 1. Other than GMO-containing and immunological products. RIVMReport N. 613310001. Bilthoven, the Netherlands: RIVM.
National Office of Animal Health (NOAH), 2002 Compendium of Data Sheets forVeterinary Products (2002–2003 edn.). Enfield, Middlesex: NOAH.
Nessel R J, Wallace D H, Wehner T A, Tait W E and Gomez L, 1989 Environmentalfate of ivermectin in a cattle feedlot. Chemosphere, 18, 1531–1541.
Pfizer Inc., 1996 Environmental assessment: doramectin 0.5 % pour-on solution forthe treatment of parasitic infections in cattle. Report NADA 141-095EA. New York:Pfizer Inc.
Radostis O M, Gay C C, Blood D C and Hinchcliff K W, 2000 Veterinary Medicine (9thedn.). London: W B Saunders & Co.
Ridsill-Smith T J, 1993 Effects of avermectin residues in cattle dung on dung beetle(Coleoptera: Scarabaeidae) reproduction and survival. Veterinary Parasitology, 48,127–137.
Schering Plough Animal Health, 1996 Environmental assessment for the use ofNuflor injectable solution in cattle. Report NADA 141-063EA. Kenilworth, NJ, USA:Schering Plough Animal Health.

72 Targeted monitoring study for veterinary medicines in the environment
Scottish Environment Protection Agency (SEPA), 2000 Long-term biologicalmonitoring trends in the Tay System 1988–1999. Report FW1/00. SEPA EasternRegion. Stirling, Scotland: SEPA.
Sommer C and Steffansen B, 1993 Changes with time after treatment in theconcentrations of ivermectin in fresh cow dung and in cow pats aged in the field.Veterinary Parasitology, 48, 67–73.
Spaepen K, VanLeemput L, Wislocki P and Verschueren C, 1997 A uniformprocedure to estimate the predicted environmental concentration of the residues ofveterinary medicines in soil. Environmental Toxicology and Chemistry, 16, 1977–1982.
Steel J and Hennessy D, 2001 Factors affecting the rate and route of excretion ofveterinary parasiticides and their persistence in the environment. Paper presented ata workshop on veterinary parasiticides in Australia.
Strong L, 1993 Overview: the impact of avermectins on pastureland ecology.Veterinary Parasitology, 48, 3–17.
Syracuse Research Corporation (SRC), 1996 PCKOCWIN Version 1.6: Soiladsorption coefficient (Koc) program for Microsoft Windows 3.1. Syracuse, NY, USA:SRC.
Thain J E, Davies I M, Rae G H and Allen Y T, 1997 Acute toxicity of ivermectin to thelugworm Arenicola marina. Aquaculture, 159, 47–52.
Wall R and Strong L, 1987 Environmental consequences of treating cattle with theantiparasitic drug ivermectin. Nature, 327, 418–421.

Targeted monitoring study for veterinary medicines in the environment 73
List of acronyms and abbreviationsAPCI atmospheric pressure chemical ionisationASE accelerated solvent extractionCEC cation exchange capacityCVMP Committee for Veterinary Medicinal ProductsDT50 Time taken to degrade to 50 per cent of original concentration of the
compoundEC50 Concentration effective against 50 per cent of the organisms or
animals testedESI electrospray ionisationFAO Food and Agriculture Organization (of the United Nations)FDA Food and Drink Administration (in USA)HPLC high performance liquid chromatographyLC50 Concentration lethal to 50 per cent of the organisms or animals
testedLOD limit of detectionMEC measured environmental concentrationMIC minimum inhibitory concentrationMS mass spectrometrynd data not availableNLS National Laboratory Service (of the Environment Agency)NOAH National Office of Animal HealthNOEC no observable effect concentrationNOEL no observed effect levelPEC predicted environmental concentrationPNEC predicted no-effect concentrationRCR risk characterisation ratioSPE solid phase extractionTLM median tolerance limitTWA time weighted averageUSDA United States Department of AgricultureVMD Veterinary Medicines Directorate

74 Targeted monitoring study for veterinary medicines in the environment
Appendix 1 Prediction ofenvironmental concentrationsData on usage, sorption in soils and persistence in manure were used together withexposure assessment models to predict the concentrations of each of the studycompounds in soil, surface water and groundwater.
The lowest reported sorption coefficient was used to estimate movement to surfacewater and groundwater, and the longest reported DT50 (time taken to degrade to 50per cent of original concentration of the compound) was used to assess persistence.In the absence of information on the persistence of a substance in a particularmedium, a degradation half-life of 1,000 days was assumed.
A discussion of methods and models used and the predicted concentrations obtainedis provided below.
Pasture animalsVeterinary medicines are used to treat a range of animal types kept on pasture. Formedicines applied orally or by injection, the medicine may be released directly to soilor surface water in urine or faeces. Topical treatments may be washed off. In thisstudy, veterinary medicines used in the treatment of cattle, pigs, horses and sheep atpasture were considered.
Concentrations of each of the priority compounds in soil, surface water andgroundwater arising from the treatment of animals on pasture were obtained using acombination of exposure assessment approaches. These included:
• methods developed specifically for veterinary medicines (e.g. Montforts 1999);• methods developed for pesticides (where methods developed for veterinary
medicines were not available).
The models were run in Microsoft® Excel. The approaches used are described inmore detail below.
Concentrations in soilThe amount of each study compound released to soil by pasture animals wascalculated using Equation A1.
excretedexcreted Fx Tx Dx N x MA = Equation A1
where:
Aexcreted (mg ha-1) is the amount excreted (mg/animal);M is the mass of the animal (kg);

Targeted monitoring study for veterinary medicines in the environment 75
N is the stocking density of animals (animals ha-1);D is the dosage (mg kg-1);T is the duration of the treatment (days);F is the fraction of the administered dose excreted as the parent substance.
Data on the mass of individual animals used in the calculations are given in TableA1.1.
Table A1.1 Animal data used as the inputs to the pasture model (Montforts1999)
Cattle Horses Sheep PigsMass of animal (kg) 600 600 70 70Stocking density (animals ha-1) 9.5 3 15 25
To obtain a concentration in soil, it was assumed that the excreted veterinarymedicine is spread uniformly across a field and that it is evenly distributed in the top5 cm layer of the soil. A soil bulk density of 1,500 kg m-3 was used in the calculations.This clearly will not happen in the real world, where faeces are likely to be excreted indistinct patches. However, this simple approach was considered sufficient for theranking purposes of this study.
Where a substance was administered over a number of days and/or where therewere multiple applications during a year, the amount of substance remaining at thetime of the final application for each individual treatment was calculated usingEquation A2.
ktexcretedt ex AA −= Equation A2
where:
At is the amount left at the time of the final application (mg);k is the first order rate of degradation (d-1);t is the time between the earlier and the final application.
By summing the amounts left for each individual treatment at the end of the treatmentperiod, it was possible to estimate a total amount released to soils.
Following release to soils, the veterinary medicine may be degraded. Therefore, toaccount for potential degradation of the study compounds in soil, a time weightedaverage predicted environmental concentration in soil (TWA PECsoil) was calculatedusing Equation A3. The TWA PECsoil was calculated for a period of 21 days followingrelease to land. This time span was selected because it corresponds to the durationof typical terrestrial ecotoxicology tests (e.g. earthworm studies last for 14 days andplant studies for 28 days).

76 Targeted monitoring study for veterinary medicines in the environment
21x ln2)e(1x DT50x PECPECTWA
21 x )ln2/DT50( soil soil
soil
soil−−= Equation A3
Prediction of concentrations in groundwater
The guidance on the environmental risk assessment of veterinary medicines (CVMP1997) recommends that exposure models used for pesticides are used for estimatingconcentrations of veterinary medicines leaching to groundwaters. When determiningthe potential for pesticides to contaminate groundwaters, current regulatory practiceis to simulate average concentrations of a pesticide leaching through soil to 1 mdepth and to use this value as a protective surrogate for concentrations ingroundwater.
MACRO is one of the four leaching models recommended for European regulatoryuse for pesticides (FOCUS 1997). Unlike other models, it includes macropore flow –an important transport route in many UK soils. MACRO was therefore selected as themodel to use in this study to assess the leaching of veterinary medicines togroundwater. As this model has a long running time, a meta-version of the model wasused to determine maximum concentrations of each of the veterinary medicines. Thismeta-version was developed by running the model a number of times to generatelook-up tables (Brown et al. 2003). In this study, the look-up table for vulnerable claysoil associated with shallow groundwater was selected (Table A1.2). This soil type(H1) corresponds to areas where livestock are typically reared (e.g. Figure A1.1).
The lowest Koc and longest DT50 value for each study compound were selected.These values were then used in conjunction with the look-up table to estimate theconcentration leached. The DT50 for the compound was rounded up to the closestDT50 value in the table whereas the Koc value was rounded down. Values in thelook-up table were corrected for the actual application rate.
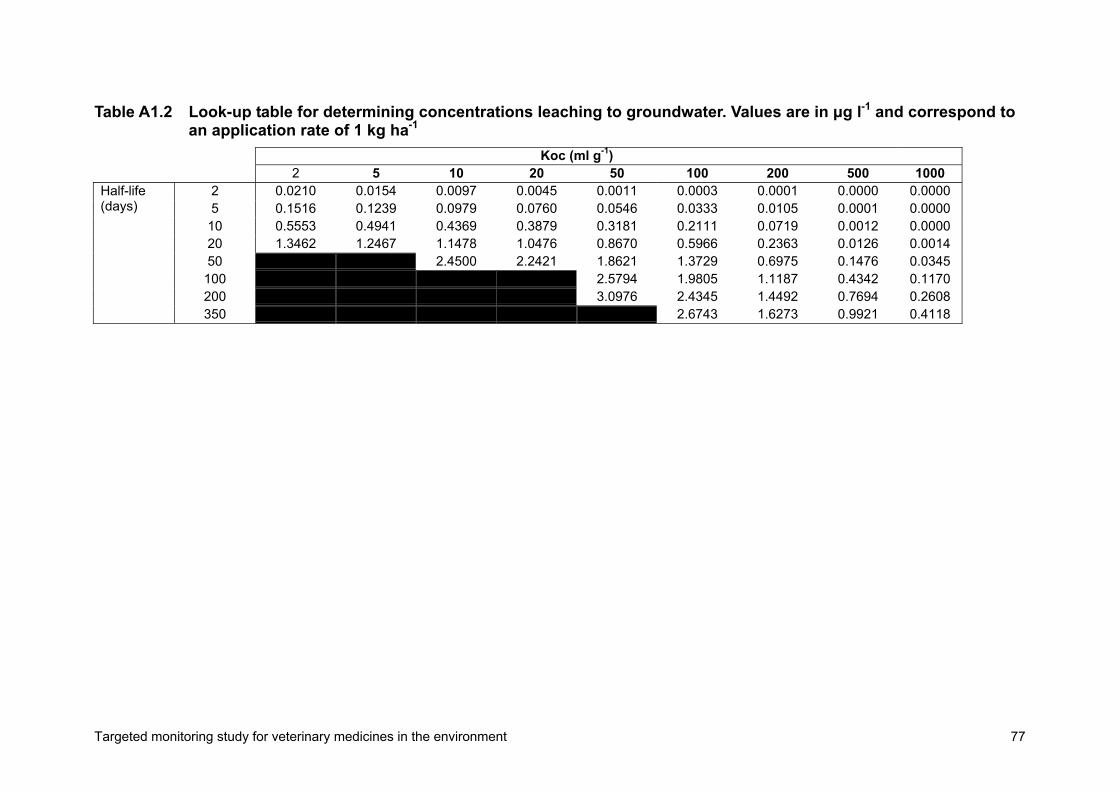
Targeted monitoring study for veterinary medicines in the environment 77
Table A1.2 Look-up table for determining concentrations leaching to groundwater. Values are in µg l-1 and correspond toan application rate of 1 kg ha-1
Koc (ml g-1) 2 5 10 20 50 100 200 500 1000
2 0.0210 0.0154 0.0097 0.0045 0.0011 0.0003 0.0001 0.0000 0.00005 0.1516 0.1239 0.0979 0.0760 0.0546 0.0333 0.0105 0.0001 0.0000
10 0.5553 0.4941 0.4369 0.3879 0.3181 0.2111 0.0719 0.0012 0.000020 1.3462 1.2467 1.1478 1.0476 0.8670 0.5966 0.2363 0.0126 0.001450 2.4500 2.2421 1.8621 1.3729 0.6975 0.1476 0.0345100 2.5794 1.9805 1.1187 0.4342 0.1170200 3.0976 2.4345 1.4492 0.7694 0.2608
Half-life(days)
350 2.6743 1.6273 0.9921 0.4118

78 Targeted monitoring study for veterinary medicines in the environment
Figure A1.1 Livestock densities corresponding to areas with HI soil type

Targeted monitoring study for veterinary medicines in the environment 79
Prediction of concentrations in surface waterConcentrations of each of the study compounds in surface water were predictedusing the method described by Montforts (1999). This assumes that:
• livestock roam freely on pasture;• excretion is as likely to occur in the stream as onto the pasture;• a hectare of pasture contains a slow flowing stream 100 m long, 1 m wide and
0.3 m deep.
Consequently 1 per cent of the excreted dose of a substance will be released to thestream and this will be diluted in 30,000 litres of water.
To account for potential degradation of the study compounds in water, a timeweighted average predicted environmental concentration in water (TWA PECwater)was calculated using Equation A4. The TWA PECwater was calculated for a period of21 days following release to the surface water. This time span was selected as itcorresponds to the duration of typical chronic aquatic ecotoxicology tests.
21x ln2e(1x DT50x PECPECTWA
21 x )ln2/DT50(water water
water
water−−= Equation A4
Intensively reared livestockIntensively reared livestock are typically housed for long periods of time. Manure,slurry or litter arising from these animals is collected and stored before being spreadonto land, as fertiliser, at relatively high application rates (ADAS 1997, 1998).Veterinary medicines used to treat intensively reared animals may be released tosoils during the slurry/manure application process and may subsequently betransported to surface water and groundwater.
The assessment scheme for livestock animals (cattle, pigs, poultry) considered:
• the effects of manure/slurry storage on the concentrations of veterinarymedicines;
• releases of manure and slurry to land;• the main transport routes for veterinary medicines to surface water and
groundwater.
Concentrations in slurry/manure, soil, groundwater and surface water arising from thetreatment of intensively reared livestock were predicted using a combination of:
• the Uniform Approach developed by Spaepen et al. (1997);• approaches described by Montforts (1999)• look-up tables developed by the UK Pesticides Safety Directorate for
movement to surface waters;

80 Targeted monitoring study for veterinary medicines in the environment
• look-up tables used in the p-EMA computer-based decision support tool forleaching to groundwater (Brown et al. 2003).
The different approaches used are described below. Each is either already beingused in the regulation of veterinary medicines or is used routinely in the regulation ormanagement of pesticides. The models were run using Microsoft Excel.
Concentrations in slurry and manureInitially the amount of substance excreted by an animal was calculated usingEquation A5.
excretedexcreted F x T x D x MA = Equation A5
where:
Aexcreted is the amount excreted (mg/animal);M is the mass of the animal (kg);D is the dosage (mg kg-1);T is the treatment duration (days) (a maximum of 70 days was set);F is the fraction of the administered dose excreted as the parent substance.
Data on the mass of individual animals and the manure/slurry production used in thecalculations are given in Table A1.3.
Table A1.3 Manure/slurry production and animal mass data used in thecalculations (Montforts 1999)
Cattle Pigs PoultryManure/slurry production (kg animal-1 d-1) 78.5 3.8 0.072Mass of animal (kg) 600 70 2
Where data were available on persistence in slurry or manure, the rate constant fordegradation in slurry and manure (RCslurry) was calculated using Equation A6 andreported half-lives in manure or slurry (DT50slurry (d)). The rate constant was thenused in Equation A7 to determine the fraction of compound in slurry or manure priorto application to land (Fapplication). It was assumed that storage time (tstorage) for manureor slurry is typically 70 days and that, on average, the residence time (tE) of the studycompound in the slurry or manure will be 35 days.
slurry
slurry
DT50ln2RC = Equation A6
eslurry x tRCnapplicatio eF = Equation A7
The concentration of each study substance in slurry (PECslurry (mg kg-1)) was thendetermined from the amount excreted, the fraction remaining prior to application and

Targeted monitoring study for veterinary medicines in the environment 81
the slurry production for individual animals (Pslurry (kg animal-1 d-1); Table A3) usingEquation A8.
napplicatio
storageslurry
slurry F x x tPAPEC
= Equation A8
Concentrations in soilGuidance limits exist on inputs of fertilising substances to land. The maximumrecommended amount of manure or slurry that could be applied to land wastherefore calculated using Equation A9 and data on:
• the concentrations of nitrogen or phosphorus in different manure/slurry types(PN or P (kg place-1 year-1)
• recommended nitrogen or phosphate limits for the United Kingdom (AN or P (kgha-1 year-1);
• the typical manure/slurry output for an animal holding (PE).
E
Por N
Por N P x PAM = Equation A9
The amount of each study substance applied to land (Aapplied (mg ha-1)) was thencalculated using Equation A10 from the predicted manure/slurry concentration andthe amount of manure that can be applied.
slurryapplied PEC x MA = Equation A10
The concentration of each substance in soil was then calculated using Equation A11.It was assumed that all the manure/slurry is applied to a field on one occasion eachyear and that the mixing depth (D) is 5 cm. A soil bulk density (BD) of 1,500 kg m-3
was used.
BD) x x100) x100(((D/100)MA
PECapplied
soil+
= Equation A11
To account for potential degradation of the study compounds in soil, a time weightedaverage predicted environmental concentration in soil (TWA PECsoil) was calculatedfor a 21-day period using Equation A12.
21x ln2)e(1x DT50x PECPECTWA
21 x )ln2/DT50( soil soil
soil
soil−−= Equation A12

82 Targeted monitoring study for veterinary medicines in the environment
Concentrations in surface watersUp to 30 per cent of the UK’s cereal crops may be grown on heavy clay soils (Callow2000), as may significant proportions of other crops. Many of these soils require theuse of sub-surface drainage systems to ensure that waterlogging does not occur.Such systems accelerate the passage of water through the soil profile and intosurface waters. As the soils are used extensively to grow crops, it is likely that theywill be fertilised with manure or slurry and hence veterinary medicines may bereleased to them. Recent work (Boxall et al. 2002, Kay et al. 2004) indicates thatsuch systems are a major route for transport of veterinary medicines applied in slurryto surface waters.
The UK Pesticides Safety Directorate has proposed an approach for estimating thelosses of pesticides to surface waters in drainflow (Callow 2000). The method isderived from results of research carried out at Brimstone Farm. Recent studies (Kayet al. 2004) indicate that the approach is appropriate for veterinary medicines. Hence,it was used in this study to estimate the proportion of a veterinary medicine moving tosurface waters and to calculate the resulting surface water concentration.
It was assumed that a rainfall event occurs and that a percentage of the appliedveterinary medicine per hectare is lost in 10 mm of drainflow (see Table A1.4). Thepercentage of veterinary medicine lost was determined from the lowest reported Kocvalue for a particular substance.Table A1.4 Veterinary medicine loss in drainflow
Koc (ml g-1) Veterinary medicine transported in 10 mmof drain water (%)
very mobile <15 1.9mobile 15–74 1.9moderately mobile 75–499 0.7slightly mobile 500–1000 0.5
1000–4000 0.02non mobile >4000 0.008
It is probable that dilution in the receiving water will occur and therefore an additionalfactor was included to account for this. It was assumed that the drain entered a ditch100 m long, 1 m wide and 30 cm deep. This equates to a dilution of the drainflow in afurther 30,000 litres of water (equivalent to the surface water body used in thepasture assessment).
To account for potential degradation of the study compounds in water, a timeweighted average predicted environmental concentration in water (TWA PECwater)was calculated for a period of 21 days following the drainflow event.
Concentrations in groundwaterA similar approach to that used for pasture animals was used to estimategroundwater concentrations. However, as it is very unlikely that slurry or manurewould be applied to the soil type investigated for the pasture animals (Hollis J,personal communication), a look-up table for a sandy soil where there will be highpotential for leaching was used instead (Table A1.5). The soil type (H2) is found inareas where livestock are reared (Figure A1.2).

Targeted monitoring study for veterinary medicines in the environment 83
The lowest Koc and longest DT50 value for each study compound were used. Thesevalues were then used in conjunction with the look-up table to estimate theconcentration leached; the DT50 for the compound was rounded up to the closestDT50 value in the table whereas the Koc value was rounded down. Values werecorrected for the actual application rate (Aapplied) of each study substance.

84 Targeted monitoring study for veterinary medicines in the environment
Table A1.5. Look-up table for determining concentrations leaching to groundwater. Values correspond to an applicationrate of 1 kg ha-1
Koc (ml g-1) 2 5 10 20 50 100 200 500 1000
2 0.0202 0.0085 0.0023 0.0003 0.0000 0.0000 0.0000 0.0000 0.00005 0.4173 0.2557 0.1170 0.0272 0.0007 0.0000 0.0000 0.0000 0.0000
10 1.6764 1.2301 0.7218 0.2396 0.0103 0.0002 0.0000 0.0000 0.000020 3.7688 3.1244 2.2020 0.9855 0.0741 0.0065 0.0001 0.0000 0.000050 4.7987 2.7829 0.8676 0.1505 0.0103 0.0000 0.0000
100 2.2853 0.6612 0.0695 0.0001 0.0000200 3.7797 1.6352 0.1849 0.0003 0.0000
Half-life(days)
350 2.4275 0.2831 0.0005 0.0000

Targeted monitoring study for veterinary medicines in the environment 85
Figure A1.2 Livestock densities corresponding to areas with H2 soil type

86 Targeted monitoring study for veterinary medicines in the environment
Aquaculture treatmentsThe veterinary medicines being assessed as aquaculture treatments are employed inaquaculture systems for two purposes:
• treatment of eggs in hatcheries (bronopol);• treatment of free-living stock within pond or tank-based systems (amoxicillin,
oxytetracycline).
Two modelling scenarios were therefore used:
• a trout hatchery (for the egg treatment);• a land-based trout farm (for fish treatments).
Hatchery scenarioThe hatchery scenario assumed a farm with a continuous flow egg hatchery system,with treatment applied into the water supply to ensure a fixed concentration of thetreatment chemical for a specified time period (30 minutes). It was assumed that thefarm had a settlement pond, which ultimately discharged into a river.
The model used for the simulations was based on plug flow of the medicine throughthe farm system over a 24-hour period, and was implemented as a Microsoft Excelspreadsheet. Details of farm system and the simulation parameters used are given inTable A1.6.Table A1.6 Details of the hatchery scenario used in the model simulations of
disease treatment emissions from land-based aquaculturefacilities
Species rainbow trout
Egg incubator volume (m3) 0.2
Treatment volume (m3) 0.2
Settlement pond volume (m3) 600
Farm discharge flow (l min-1) 6,000
Receiving water flow (l min-1) 20,000
Stocked fish scenarioThe stocked fish scenario assumed a farm consisting of 10 raceways (concretetanks) operating at a high stocking density and discharging into a river via asettlement pond. Although the stocking density used was high, the scenario wasconsidered representative of a large commercial land-based aquaculture facility inEngland and Wales.
The model used for the simulations was based on plug flow of the medicine throughthe farm system over a 24-hour period, and was implemented as a Microsoft Excelspreadsheet. Details of farm system and the simulation parameters used are given inTable A1.7.

Targeted monitoring study for veterinary medicines in the environment 87
Table A1.7 Details of the farm scenario used in the model simulations ofdisease treatment emissions from land-based aquaculturefacilities
Species rainbow trout
Stocking density (kg m-3) 400
Number of raceways 10
Raceway dimensions (length x width x depth) (m) 12 x 3 x 1
Settlement pond volume (m3) 600
Farm discharge flow (l min-1) 6,000
Receiving water flow (l min-1) 20,000
All scenarios were modelled using the recommended dose of each medicine (NOAH2002). In all cases, the simulations of medicine treatments indicated a similar patternof emission which was a pulse, peaking <1 hour after treatment, and dissipatingcompletely after 24 hours. This was considered worst case, as in practice, someadsorption/loss of the compound would be expected as it passed through the farmsystem.
The settlement pond acted as a buffer to compound release and thus, in the case ofcompounds with a high Koc (e.g. oxytetracycline), the possibility existed thatcompound could accumulate in the settlement pond, being released during stormevents or removed when the settlement pond was periodically cleaned out. In eithercase, the release of compound into the receiving waters was not likely to exceed animmediate treatment pulse, so the simpler scenario used here was again consideredto be worst case.

88 Targeted monitoring study for veterinary medicines in the environment
Appendix 2 Treatment scenarios used to assess thestudy compoundsCompound Treatment
groupCategory Method of
administrationDose (mg kg-1 ) Duration of
treatment(d)
Number oftreatments
per year
Proportion ofanimals treated
(%)
Metabolism (%)
amoxicillin cattle I,P injection 7 3 1 100 0sheep P injection 7 3 1 100 0pigs I,P injection 7 3 1 100 0cattle I,P bolus 400 mg/animal 1 1 100 0pigs I,P suspension 10 3 1 100 0poultry I powder 20 3 1 100 0pigs I,P feed additive 15 15 1 100 0
amprolium poultry I premix 5.7/animal/d 112 1 100 0apramycin pigs I,P injection 20 5 1 100 0
pigs I,P oral 20 5 1 100 0lambs P oral 20 5 1 100 0pigs I,P premix 8 18 1 100 0pigs I,P powder 12.5 12 1 100 0cattle I,P powder 40 5 1 100 0poultry I powder 12.5 5 1 100 0
chlorhexidine cattle I,P teat dip 4.5 mg/animal/d 1 365 100 0clavulanic acid cattle I,P injection 1.75 5 1 100 0
pigs I,P injection 1.75 5 1 100 0sheep P injection 1.75 5 1 100 0cattle I,P bolus 100 5 1 100 0
cyromazine sheep P pour-on 900 mg/animal 1 1 100 0decoquinate cattle I,P premix 1 28 1 100 0diclazuril poultry I premix 0.04/animal/d 112 1 100 0
sheep P oral suspension 1 1 2 100 0sheep P pour on 100 1 1 100 0
doramectin cattle I,P injection 0.2 1 3 100 0

Targeted monitoring study for veterinary medicines in the environment 89
Compound Treatmentgroup
Category Method ofadministration
Dose (mg kg-1 ) Duration oftreatment
(d)
Number oftreatments
per year
Proportion ofanimals treated
(%)
Metabolism (%)
sheep P injection 0.3 1 1 100 0pigs I,P injection 0.3 1 1 100 0
doramectin cattle I,P pour-on 0.5 1 2 100 0enrofloxacin cattle I,P injection 5 5 1 100 0
pigs I,P injection 5 5 1 100 0cattle I,P oral 2.5 5 1 100 0pigs I,P piglet doser 5 1 1 100 0poultry I soluble 10 10 1 100 0
eprinomectin cattle I,P pour-on 0.5 1 2 100 0fenbendazole horse P liquid oral 7.5 1 3 100 0
cattle I,P liquid oral 7.5 1 3 100 0sheep P liquid oral 5 1 2 100 0pigs I,P liquid oral 7.5 1 3 100 0cattle I,P feed pellets 7.5 1 3 100 0pigs I,P feed pellets 5 1 3 100 0cattle I,P powder 7.5 1 3 100 0pigs I,P powder 5 1 3 100 0cattle I bolus 86 mg/animal/d 140 1 100 0cattle P bolus 86 mg/animal/d 140 1 100 0
florfenicol cattle I,P injection 20 2 1 25 0ivermectin cattle I,P injection 0.2 1 3 100 0
sheep P injection 0.2 1 4 100 0pigs I,P injection 0.3 1 4 100 0sheep P liquid oral 0.2 1 2 100 0cattle I,P pour-on 0.5 1 3 100 0horse P paste 0.2 1 4 100 0cattle I,P bolus 12.7 mg/animal 135 1 100 0
lasalocid poultry I feed 99 mg/kg feed 112 1 100 0levamisole cattle I,P injection 7.5 1 2 100 0
sheep P injection 7.5 1 2 100 0cattle I,P liquid oral 7.5 1 2 100 0sheep P liquid oral 7.5 1 2 100 0

90 Targeted monitoring study for veterinary medicines in the environment
Compound Treatmentgroup
Category Method ofadministration
Dose (mg kg-1 ) Duration oftreatment
(d)
Number oftreatments
per year
Proportion ofanimals treated
(%)
Metabolism (%)
levamisole cattle I,P pour on 10 1 2 100 0lincomycin pigs I,P premix 22 21 1 100 0
pigs I,P soluble 4.4 10 1 100 0monensin poultry I premix 5/animal/d 112 1 100 0
cattle I premix 350/animal/d 182 1 100 0morantel sheep P liquid oral 5.94 1 6 100 0
cattle I,P bolus 131 mg/animal 90 1 100 0moxidectin cattle I,P injection 0.002 1 2 100 0
sheep P injection 0.002 1 2 100 0sheep P oral liquid 0.002 1 2 100 0cattle I,P pour-on 0.005 1 2 100 0
nicarbazin poultry I feed additive 1.8/animal/d 112 1 100 0nitroxynil cattle I,P injection 10 1 2 100 0
sheep P injection 10 1 2 100 0oxytetracycline horse P injection 5 5 1 25 0
cattle I injection 3 5 1 25 0cattle P injection 10 2 1 25 0sheep P injection 20 1 1 100 0pigs I injection 5 5 1 25 0pigs P injection 10 2 1 25 0cattle I,P bolus 20 1 1 25 0pigs I,P feed additive 20 15 1 100 0cattle I,P soluble 18 1 1 25 0pigs I,P soluble 30 1 1 25 0poultry I soluble 15 1 1 25 0sheep I injection 8 5 1 100 0sheep P injection 20 2 1 100 0sheep I aerosol 29 1 1 1 0horse P topical 29 1 1 80 0cattle I,P topical 29 1 1 80 0pigs I,P topical 29 1 1 80 0
poloxalene cattle I,P drench 22 1 1 5 0

Targeted monitoring study for veterinary medicines in the environment 91
Compound Treatmentgroup
Category Method ofadministration
Dose (mg kg-1 ) Duration oftreatment
(d)
Number oftreatments
per year
Proportion ofanimals treated
(%)
Metabolism (%)
poloxalene cattle I,P premix 22 1 1 5 0procainepenicillin
cattlesheeppigs
I,PI,PI,P
Injection, feedInjection, feedInjection, feed
8-108-108-10
3-53-53-5
111
100100100
000
salinomycin poultry I feed additive 2.5/animal/d 112 1 100 0pigs I feed additive 54/animal/d 182 1 100 0
sulfadiazine horse P injection 12 3 1 100 0cattle I,P injection 12 3 1 100 0sheep P injection 12 3 1 100 0pigs I,P injection 12 3 1 100 0cattle I,P bolus 1 g/d 5 1 25 0pigs I,P suspension 25 3 1 100 0horse P granules 25 3 1 100 0pigs I powder 25 5 1 100 0horse P paste 25 3 1 100 0horse P powder 25 5 1 10 0poultry I soluble 33 3 1 100 0poultry I powder 22 10 1 1
tiamulin pigs I injection 10 10 1 100 0pigs I premix 5 10 1 100 0pigs P injection 10 10 1 100 0pigs P premix 5 10 1 100 0poultry I soluble 25 3 1 100 0
tilmicosin cattle I injection 10 1 1 50 0cattle P injection 10 1 1 10 0sheep P injection 10 1 1 10 0pigs I premix 16 15 1 100 0pigs P premix 16 15 1 100 0poultry I soluble 25 3 1 100 0
triclabendazole cattle I oral liquid 12 1 1 100 100sheep P oral liquid 10 1 3 100 100cattle P oral liquid 12 1 3 100 100

92 Targeted monitoring study for veterinary medicines in the environment
Compound Treatmentgroup
Category Method ofadministration
Dose (mg kg-1 ) Duration oftreatment
(d)
Number oftreatments
per year
Proportion ofanimals treated
(%)
Metabolism (%)
trimethoprim horse P injection 3 2 1 25 20trimethoprim cattle I,P injection 3 3 1 25 20
sheep P injection 3 3 1 100 20pigs I injection 3 2 1 25 20pigs P injection 3 2 1 25 20cattle I,P bolus 200 mg/animal 5 1 25 20pigs I,P suspension 5 3 1 100 20horse P granules 5 3 1 100 20pigs I powder 8 5 1 100 20pigs P powder 8 5 1 100 20poultry I powder 8 5 1 100 20horse P paste 5 5 1 10 20pigs I soluble 5 5 1 100 20poultry I soluble 6 21 1 100 20poultry I powder 4 10 1 1 20
tylosin cattle I injection 10 3 1 100 0cattle P injection 10 1 1 10 0pigs I injection 20 2 1 100 0pigs P injection 10 1 1 10 0sheep P injection 10 3 1 100 0pigs I,P feed additive 6 21 1 100 0cattle I soluble 2 g/animal 14 1 50 0cattle P soluble 2 g/animal 14 1 50 0poultry I soluble 3.5 mg/animal 1 1 100 0pigs I soluble 25 1 1 100 0pigs P soluble 25 1 1 100 0
I = intensive; P = pasture

Targeted monitoring study for veterinary medicines in the environment 93
Appendix 3 Sorption data for thestudy compounds
Compound Soil type Kd Koc Source
diclazuril silty clay loam 204 – Boxall et al. 2002sandy loam 1824 –silt loam 1009 –silty clay loam 720 –
doramectin clay loam 71 7,520 Pfizer 1996clay loam 234 13,300silty clay loam 562 86,900steer faeces 15600 34,100
enrofloxacin chicken faeces 139 395 Bayer 1996turkey faeces 65 198
fenbendazole New Jersey soil 1000 – Hoechst Roussel 1995Texas soil 1000 –Louisiana soil 631 –New Jerseysediment
1000 –
florfenicol loam 0.95 46 Schering Plough 1996silt loam 0.16 24silt loam 0.88 52
ivermectin clay loam 333 12,600 Boxall et al. 2002silty clay loam 227 15,700
levamisole – – –monensin soil 9.3moxidectin soil 580 18,000–41,000 Fort Dodge 1997oxytetracycline sandy loam soil 680 42,506 Boxall et al. 2002
sandy soil 670 47,881sandy loam soil 1026 93,317loamy sand 417 27,792
tiamulin silt loam pH 8 88 – Fermenta 1994tiamulin clay 75 –tiamulin silt loam 74 –tiamulin loamy sand 8 –tilmicosin clay loam 318tilmicosin loam 181tilmicosin loam (pH 8.9) 86tilmicosin sandy loam 129tylosin sandy loam soil 128 7,988 Boxall et al. 2002tylosin sandy soil 10.8 771tylosin sandy loam soil 62.3 5,664tylosin loamy sand soil 8.3 553

94 Targeted monitoring study for veterinary medicines in the environment
Appendix 4 Persistence of the studycompounds in manure and soilCompound Test substrate DT50 (d) Source
amoxicillin calcareous soil 0.16 Boxall et al. 2002acidic soil 0.29manure < 4
ciprofloxacin 3 soils minimal after 65 d Bayer 1996decoquinate soil 18 months Boxall et al. 2002diclazuril sandy loam 303 Boxall et al. 2002
loam 183silty loam 130
doramectin clay loam 79 Pfizer 1996silt loam 62
loam 61enrofloxacin 3 soil types 359 – 696 Bayer 1996eprinomectin 3 soils approx. 64 d Merck and Co.
1996cow pats minimal over 126 d
florfenicol silty clay 9 Schering Plough1996
sandy loam 4loam 27
ivermectin soil/faeces mix (summer) 7–14 Boxall et al. 2002soil/faeces mix (winter) 91–217
sandy loam soil 14–28clay soil 28–56
sandy soil 56dung limited degradation after 45d
monensin soil, greenhouse conditions Elanco 1989soil + steer manure,
greenhouse conditions5.8
field dissipation (+ manure) 7.5field dissipation (– manure) 7.4
moxidectin soil (average of 3 types) 62 Fort Dodge 1997oxytetracycline sandy loam 16 Blackwell P,
personalcommunication
oxytetracycline clay loam 18salinomycin sandy loam <64salinomycin sandy loam <64
sandy loam 0% after 64 dtiamulin sand 48 Fermenta 1994
sandy loam 52silty clay loam 61
silt loam 97sand 43
silt loam 100clay 150
pH 8 soils 301tilmicosin clay loam >64 Boxall et al. 2002
loam >64sandy loam >64
slurry/manure limited degradation

Targeted monitoring study for veterinary medicines in the environment 95
Appendix 5 Public domain aquatic toxicity data for thepriority compounds
Compound Aquatic toxicity endpoint Units Value Source
amoxicillin M. aeruginosa EC50 mg l-1 0.0037 Boxall et al. 2002S. capricornutum NOEC mg l-1 250Rhodomonas salina EC50 mg l-1 3108
apramycin Rainbow trout 96 h LC50 mg l-1 >300 Boxall et al., 2002Bluegill sunfish 96 h LC50 mg l-1 >300D. magna 48 h EC50 mg l-1 101.6
cyromazine D. magna 48 h EC50 mg l-1 97.8 Boxall et al. 2002Deleatidium spp. 48 h LC50 mg l-1 >300Gambusia affinis 72 h LC50 mg l-1 0.037I. Punctatus 96 h LC50 mg l-1 91.6L. macrochirus 96 h LC50 mg l-1 89.7O. mykiss 96 h LC50 mg l-1 87.9Dugesia dorotocephala 72 h LC50 mg l-1 >10Dugesia tigrina 72 h LC50 mg l-1 >10Dugesia tigrina 72 h EC50 (reproduction) mg l-1 >10Dugesia tigrina 72 h EC50 (reproduction) mg l-1 >10
diclazuril L. macrochirus 96 h LC50 mg l-1 0.58D. magna 21 d reproduction NOEL mg l-1 0.16S. capricornutum 72 h EC50 mg l-1 >1.1Anabaena cylindrica MIC mg l-1 >100Nostoc muscorum MIC mg l-1 >1000Chironomus tentans 14 d NOEL mg kg-1 7.3
doramectin Selenastrum not acutely toxic Boxall et al. 2002,Pfizer 1996
D. magna 48 h EC50 mg l-1 0.0001D. magna 48 h NOEC mg l-1 0.000025L. macrochirus 96 h LC50 mg l-1 0.011L. macrochirus 96 h NOEC mg l-1 0.0023

96 Targeted monitoring study for veterinary medicines in the environment
Compound Aquatic toxicity endpoint Units Value Source
O. mykiss 96 h LC50 mg l-1 0.0051O. mykiss 96 h NOEC mg l-1 0.0025
enrofloxacin L. macrochirus 96 h LC50 mg l-1 79.5 Bayer 1996L. macrochirus 96 h NOEC mg l-1 18.6O. mykiss 96 h LC50 mg l-1 >196O. mykiss 96 h NOEC mg l-1 33.5D. magna 48 h EC50 mg l-1 79.9D. magna chronic NOEC mg l-1 9.8D. magna 48 h NOEC mg l-1 23Hyallela LC50 mg l-1 >206Selenastrum and Microcystis Effects observed on growthHyallela NOEC mg l-1 <12.7
eprinomectin D. magna 24 h EC50 mg l-1 0.0016 Merck and Co. 1996D.magna 48 h EC50 mg l-1 0.00045O. mykiss 96 h LC50 mg l-1 1.2O. mykiss 96 h NOEC mg l-1 0.37L. macrochirus 96 h LC50 mg l-1 0.37L. macrochirus 96 h NOEC mg l-1 0.14S. capricornutum 14 d MIC mg l-1 29S. capricornutum 14 d NOEC mg l-1 7
fenbendazole D. magna 48 h EC50 mg l-1 0.012 Boxall et al. 2002,Hoechst Roussel1995
S. gardneri 96 h LC50 mg l-1 7.5L. macrochirus 96 h LC50 mg l-1 >0.061L. macrochirus 7 d LC50 mg l-1 >0.061L. macrochirus 14 d LC50 mg l-1 0.035L. macrochirus 21 d LC50 mg l-1 0.019L. macrochirus 96 h LC50 mg l-1 0.08L. macrochirus 7 d LC50 mg l-1 0.08L. macrochirus 14 d LC50 mg l-1 0.033L. macrochirus 21 d LC50 mg l-1 0.028Zebra fish 48 h LC50 mg l-1 >500Zebra fish 96 h LC50 mg l-1 >500
florfenicol S. capricornutum (growth) LC50 mg l-1 >2.9S. capricornutum (growth) NOEC mg l-1 2.9D. magna 48 h EC50 mg l-1 >330

Targeted monitoring study for veterinary medicines in the environment 97
Compound Aquatic toxicity endpoint Units Value Source
D. magna 48 h NOEC mg l-1 <100L. macrochirus 96 h LC50 mg l-1 >830L. macrochirus 96 h NOEC mg l-1 830O. mykiss 96 h LC50 mg l-1 >780O.mykiss 96 h NOEC mg l-1 780
ivermectin Asterias rubens 10 d LC50 mg kg-1 23.6 Boxall et al. 2002C. volutator 10 d LC50 mg kg-1 0.18A. marina 10 d LC50 mg kg-1 0.018A. marina effects on feeding mg kg-1 <0.005A. marina effect on burrowing mg kg-1 >0.008S. gardneiri 96 h LC50 mg l-1 0.003L. macrochirus 96 h LC50 mg l-1 0.0048Crangon septemspinosa 96 h LC50 mg l-1 >.021Neomysis integer 96 h LC50 mg l-1 0.07Neomysis integer 48 h LC50 mg l-1 0.000026Gammarus sp. 96 h LC50 mg l-1 0.000033Palaemonectes varians 96 h LC50 mg l-1 0.054A. salina 24 h LC50 mg l-1 >0.3Sphaeroma rugicauda 96 h LC50 mg l-1 0.348Carcinas maenas 96 h LC50 mg l-1 0.957Crassotrea gigas (larvae) 96 h LC50 mg l-1 80–100Crassotrea gigas (spat) 96 h LC50 mg l-1 460Mytilus edulis 96 h LC50 mg l-1 400Tapes semidecassata (larvae) 96 h LC50 mg l-1 0.38Tapes semidecassata (spat) 96 h LC50 mg l-1 0.6Pecten maximus mg l-1 0.3Monodonta lineata mg l-1 0.78Nucella lapillus 96 h LC50 mg l-1 0.39Littorina littorea 96 h LC50 mg l-1 0.58Hydrobia ulvae 96 h LC50 mg l-1 >10Potamopyrgus jenkinsii 96 h LC50 mg l-1 <9Nereis diversicolor 96 h LC50 mg l-1 0.0075A. marina 10 d LC50 mg kg-1 0.023Biomphalaria glabrata 24 h LC50 mg l-1 0.03D. magna 48 h EC50 mg l-1 0.000025Chlorella pyrenoidosa 14 d NOEC mg l-1 <0.001
levamisole A. anguilla mg l-1 88% physiology effect over 25 h Boxall et al. 2002
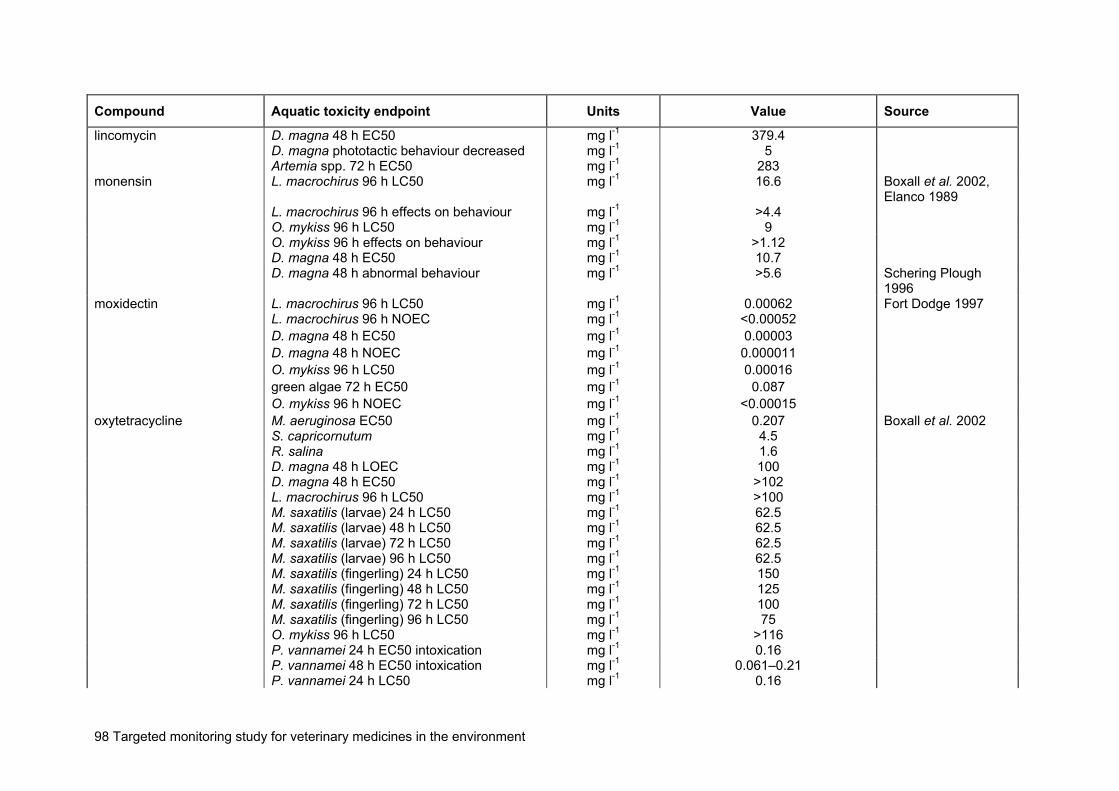
98 Targeted monitoring study for veterinary medicines in the environment
Compound Aquatic toxicity endpoint Units Value Source
lincomycin D. magna 48 h EC50 mg l-1 379.4D. magna phototactic behaviour decreased mg l-1 5Artemia spp. 72 h EC50 mg l-1 283
monensin L. macrochirus 96 h LC50 mg l-1 16.6 Boxall et al. 2002,Elanco 1989
L. macrochirus 96 h effects on behaviour mg l-1 >4.4O. mykiss 96 h LC50 mg l-1 9O. mykiss 96 h effects on behaviour mg l-1 >1.12D. magna 48 h EC50 mg l-1 10.7D. magna 48 h abnormal behaviour mg l-1 >5.6 Schering Plough
1996moxidectin L. macrochirus 96 h LC50 mg l-1 0.00062 Fort Dodge 1997
L. macrochirus 96 h NOEC mg l-1 <0.00052D. magna 48 h EC50 mg l-1 0.00003D. magna 48 h NOEC mg l-1 0.000011O. mykiss 96 h LC50 mg l-1 0.00016green algae 72 h EC50 mg l-1 0.087O. mykiss 96 h NOEC mg l-1 <0.00015
oxytetracycline M. aeruginosa EC50 mg l-1 0.207 Boxall et al. 2002S. capricornutum mg l-1 4.5R. salina mg l-1 1.6D. magna 48 h LOEC mg l-1 100D. magna 48 h EC50 mg l-1 >102L. macrochirus 96 h LC50 mg l-1 >100M. saxatilis (larvae) 24 h LC50 mg l-1 62.5M. saxatilis (larvae) 48 h LC50 mg l-1 62.5M. saxatilis (larvae) 72 h LC50 mg l-1 62.5M. saxatilis (larvae) 96 h LC50 mg l-1 62.5M. saxatilis (fingerling) 24 h LC50 mg l-1 150M. saxatilis (fingerling) 48 h LC50 mg l-1 125M. saxatilis (fingerling) 72 h LC50 mg l-1 100M. saxatilis (fingerling) 96 h LC50 mg l-1 75O. mykiss 96 h LC50 mg l-1 >116P. vannamei 24 h EC50 intoxication mg l-1 0.16P. vannamei 48 h EC50 intoxication mg l-1 0.061–0.21P. vannamei 24 h LC50 mg l-1 0.16
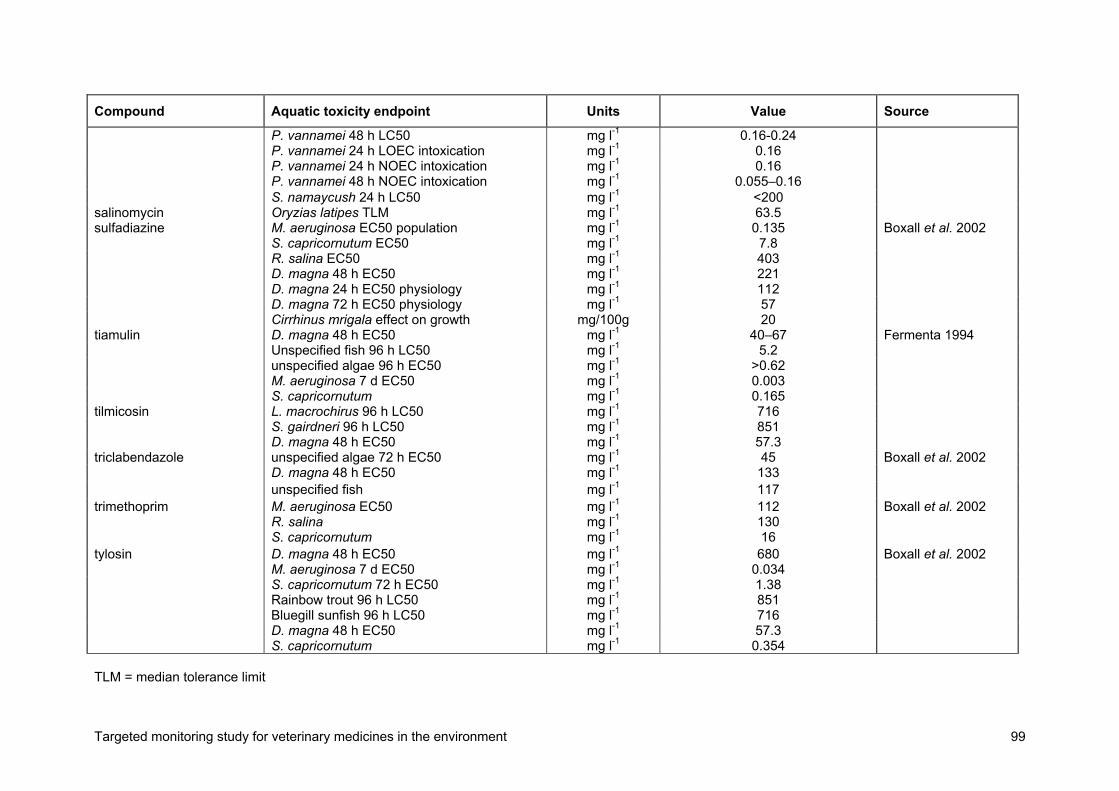
Targeted monitoring study for veterinary medicines in the environment 99
Compound Aquatic toxicity endpoint Units Value Source
P. vannamei 48 h LC50 mg l-1 0.16-0.24P. vannamei 24 h LOEC intoxication mg l-1 0.16P. vannamei 24 h NOEC intoxication mg l-1 0.16P. vannamei 48 h NOEC intoxication mg l-1 0.055–0.16S. namaycush 24 h LC50 mg l-1 <200
salinomycin Oryzias latipes TLM mg l-1 63.5sulfadiazine M. aeruginosa EC50 population mg l-1 0.135 Boxall et al. 2002
S. capricornutum EC50 mg l-1 7.8R. salina EC50 mg l-1 403D. magna 48 h EC50 mg l-1 221D. magna 24 h EC50 physiology mg l-1 112D. magna 72 h EC50 physiology mg l-1 57Cirrhinus mrigala effect on growth mg/100g 20
tiamulin D. magna 48 h EC50 mg l-1 40–67 Fermenta 1994Unspecified fish 96 h LC50 mg l-1 5.2unspecified algae 96 h EC50 mg l-1 >0.62M. aeruginosa 7 d EC50 mg l-1 0.003S. capricornutum mg l-1 0.165
tilmicosin L. macrochirus 96 h LC50 mg l-1 716S. gairdneri 96 h LC50 mg l-1 851D. magna 48 h EC50 mg l-1 57.3
triclabendazole unspecified algae 72 h EC50 mg l-1 45 Boxall et al. 2002D. magna 48 h EC50 mg l-1 133unspecified fish mg l-1 117
trimethoprim M. aeruginosa EC50 mg l-1 112 Boxall et al. 2002R. salina mg l-1 130S. capricornutum mg l-1 16
tylosin D. magna 48 h EC50 mg l-1 680 Boxall et al. 2002M. aeruginosa 7 d EC50 mg l-1 0.034S. capricornutum 72 h EC50 mg l-1 1.38Rainbow trout 96 h LC50 mg l-1 851Bluegill sunfish 96 h LC50 mg l-1 716D. magna 48 h EC50 mg l-1 57.3S. capricornutum mg l-1 0.354
TLM = median tolerance limit

100 Targeted monitoring study for veterinary medicines in the environment
Appendix 6 Terrestrial toxicity data for the prioritycompoundsCompound Terrestrial toxicity (endpoint) Terrestrial toxicity
(units)Terrestrial toxicity
(value)Source
apramycin bobwhite quail 14 d LD50 oral mg kg-1 1669 Boxall et al. 2002bobwhite quail 5 d LD50 (dietary) mg kg-1 >5000mallard duck 5 d LD50 (dietary) mg kg-1 >5000earthworm 14 d LD50 mg kg-1 >100A. chroococcum inhibition mg kg-1 0.1A. floss aqua mg kg-1 0.1R. leguminosarum mg kg-1 0.1R. japonicum mg kg-1 1–10corn seedling growth NOEC mg kg-1 1600cucumber seedling growth NOEC mg kg-1 1600ryegrass seedling growth NOEC mg kg-1 1600soybean seedling growth NOEC mg kg-1 1600tomato seedling growth NOEC mg kg-1 36wheat seedling growth NOEC mg kg-1 1600tomato seedling growth LOEC mg kg-1 64corn root elongation NOEC mg kg-1 970cucumber root elongation NOEC mg kg-1 970ryegrass root elongation NOEC mg kg-1 970soybean root elongation NOEC mg kg-1 1000tomato root elongation NOEC mg kg-1 1000wheat root elongation NOEC mg kg-1 1000Onthophagus gazella 7 d LC50 mg kg-1 >0.77Onthophagus gazella 7 d NOEC mg kg-1 0.77
cyromazine Mallard duck 14 d LD50 mg kg-1 >2510 Boxall et al. 2002Mallard duck 8d LD50 mg kg-1 >5620Honey bee 48 h LD50 mg/bee >0.025Northern bobwhite 14d LD50 mg kg-1 1785

Targeted monitoring study for veterinary medicines in the environment 101
Compound Terrestrial toxicity (endpoint) Terrestrial toxicity(units)
Terrestrial toxicity(value)
Source
Northern bobwhite 8d LC50 mg kg-1 >5620 earthworm 14 d LC50 mg kg-1 1000diclazuril corn, cucumber and ryegrass no effect on germination mg kg-1 830
corn, cucumber and ryegrass no effect on radiclelength
mg kg-1 830
pinto beans, soybean, wheat no effect on germination mg kg-1 700pinto beans, soybean, wheat no effect on radiclelength
mg kg-1 700
all six species no effect on shoot length, weight androot weight
mg kg-1 720
radish, wheat no effect on emergence mg kg-1 100lettuce 15% reduction in emergence mg kg-1 100corn, wheat, ryegrass, tomato, cucumber 21 d NOEC(morphology)
mg kg-1 914
L. terrestris 28 d NOEL (mortality) mg kg-1 1100E. foetida 14 d NOEC mg kg-1 900-1100
Mallard duck 14 d LD50 and NOEL mg kg-1 >2150Mallard duck 28 d NOEL (reproduction) mg kg-1 1000Japanese quail 42 d dietary no effect on eggproduction, fertility etc
mg kg-1 50
11 pathogenic + saprogenic fungi + 11 pathogenicbacteria, no effects except:Trichophyton mentagrophytes development inhibited mg l-1 100Candida albicans no growth mg l-1 100Soil respiration no effect
doramectin corn % germination NOEC mg kg-1 840 Boxall et al. 2002, Pfizer1996
cucumber % germination NOEC mg kg-1 840ryegrass % germination NOEC mg kg-1 6.6soy bean % germination NOEC mg kg-1 990tomato % germination NOEC mg kg-1 840wheat % germination NOEC mg kg-1 57corn % root elongation NOEC mg kg-1 840cucumber root elongation NOEC mg kg-1 840ryegrass % root elongation NOEC mg kg-1 1.6

102 Targeted monitoring study for veterinary medicines in the environment
Compound Terrestrial toxicity (endpoint) Terrestrial toxicity(units)
Terrestrial toxicity(value)
Source
soy bean % root elongation NOEC mg kg-1 990tomato % root elongation NOEC mg kg-1 840wheat % root elongation NOEC mg kg-1 57corn % seedling growth NOEC mg kg-1 980cucumber seedling growth NOEC mg kg-1 53–130ryegrass % seedling growth NOEC mg kg-1 <33soy bean % seedling growth NOEC mg kg-1 47tomato % seedling growth NOEC mg kg-1 47wheat % seedling growth NOEC mg kg-1 47Clostidium perfringens MIC mg l-1 40Nostoc MIC mg l-1 60Aspergillus flavus MIC mg l-1 600Pseudomonas aeruginosa MIC mg l-1 800Chaetomium globosum MIC mg l-1 800E. foetida 28 d LC50 mg kg-1 >1000E. foetida 28 d NOEC (growth) mg kg-1 2E. foetida 28 d LOEC (growth) mg kg-1 4Haemotobia irritans LC90 mg kg-1 dung 3O. gazella LC50 mg kg-1 dung 12.5O. gazella LC90 mg kg-1 dung 38.2
enrofloxacin soybean, lettuce, ryegrass, wheat, tomato, cucumberNOEC germination
mg kg-1 >882 Bayer 1996
cucumber effect on root growth mg kg-1 0.27cucumber effect on germination (soil) mg kg-1 9.1cucumber effect on root growth (soil) mg kg-1 9.1wheat effect on seedling growth NOEC mg kg-1 <0.13wheat effect on seedling growth NOEC (soil) mg kg-1 4.7Pseudomonas MIC mg kg-1 12.5Arthrobacter MIC mg kg-1 12.5Azobacter MIC mg kg-1 1.3Anabaena MIC mg kg-1 12.5Aspergillus MIC mg kg-1 >250Penicillium MIC mg kg-1 >250Trichoderma MIC mg kg-1 >250Test on soil with Arthrobacter and Azobacter noinhibitory effect
mg kg-1 500

Targeted monitoring study for veterinary medicines in the environment 103
Compound Terrestrial toxicity (endpoint) Terrestrial toxicity(units)
Terrestrial toxicity(value)
Source
eprinomectin bobwhite quail 14 d LD50 mg kg-1 272 Boxall et al. 2002, Merckand Co. 1996
bobwhite quail 14 d NOEC mg kg-1 <62.5mallard 14 d LD50 mg kg-1 24mallard 14 d NOEC mg kg-1 <7.8bobwhite (dietary) 8 d LC50 ppm 1813bobwhite (dietary) 8 d NOEC mg kg-1 1000mallard (dietary) 8 d LC50 ppm 447mallard (dietary) 8d NOEC mg kg-1 <10026 microbial species NOEC antimicrobial activity mg kg-1 1000L. terrestris 28 d LC50 mg kg-1 >951L. terrestris 28 d NOEC (mortality) mg kg-1 295L. terrestris 28 d NOEC (weight) mg kg-1 90.8cucumber, lettuce, soybean, ryegrass, tomato, wheatNOEC germination
mg kg-1 1300
cucumber, soybean NOEC root elongation mg kg-1 9.5lettuce, ryegrass, tomato, wheat NOEC root elongation mg kg-1 8.5cucumber, ryegrass, tomato, wheat NOEC shootlength and root weight
mg kg-1 0.47
lettuce, soybean NOEC shoot length and root weight mg kg-1 6.5fenbendazole Bacteria no effect concentration mg kg-1 100 Boxall et al. 2002,
Hoechst Roussel 1995Protozoa no effect concentration mg l-1 100Fungi no effect concentration mg l-1 100E. Foetida 14 d LC50 mg kg-1 1068E. Foetida 14 d 35% reduction in weight mg kg-1 100E. Foetida 14 d reduction in cocoon production mg kg-1 100L. terrestris 28 d LC50 mg kg-1 180L. terrestris 28 d LOEC mg kg-1 120L. terrestris 28 d NOEC mg kg-1 56corn germination NOEC mg kg-1 970cucumber germination NOEC mg kg-1 970ryegrass germination NOEC mg kg-1 970soybean germination NOEC mg kg-1 1000tomato germination NOEC mg kg-1 1000wheat germination NOEC mg kg-1 1000
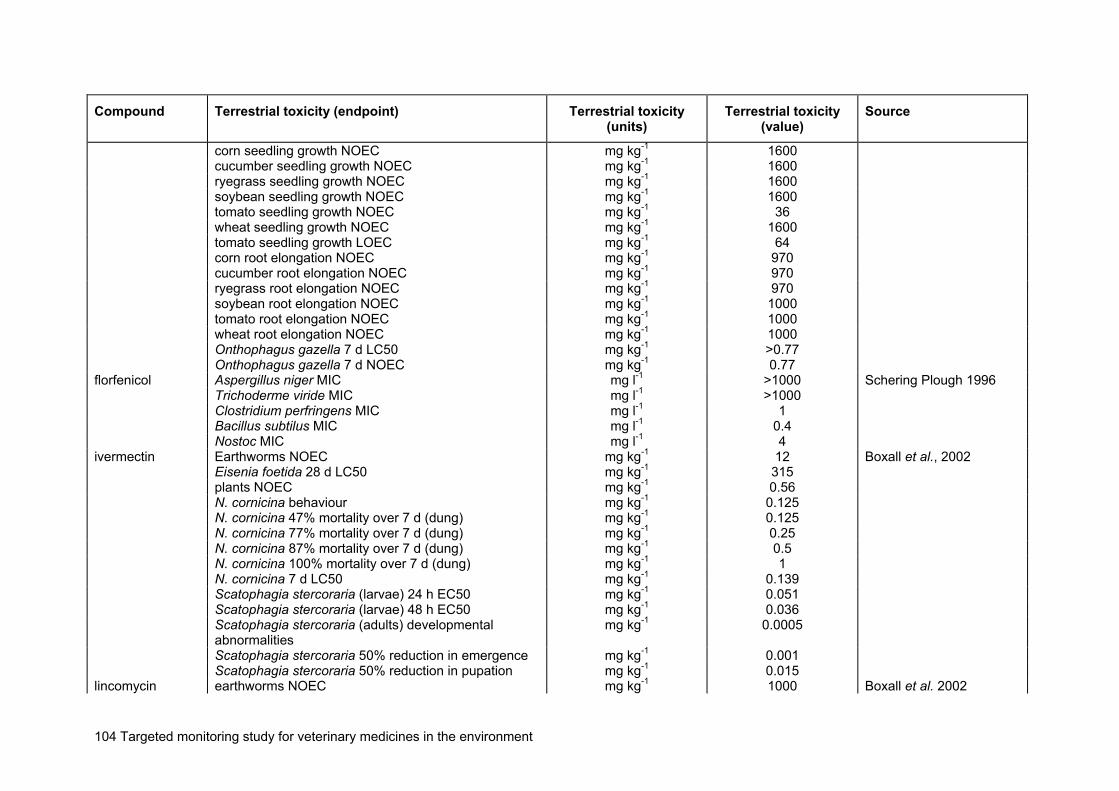
104 Targeted monitoring study for veterinary medicines in the environment
Compound Terrestrial toxicity (endpoint) Terrestrial toxicity(units)
Terrestrial toxicity(value)
Source
corn seedling growth NOEC mg kg-1 1600cucumber seedling growth NOEC mg kg-1 1600ryegrass seedling growth NOEC mg kg-1 1600soybean seedling growth NOEC mg kg-1 1600tomato seedling growth NOEC mg kg-1 36wheat seedling growth NOEC mg kg-1 1600tomato seedling growth LOEC mg kg-1 64corn root elongation NOEC mg kg-1 970cucumber root elongation NOEC mg kg-1 970ryegrass root elongation NOEC mg kg-1 970soybean root elongation NOEC mg kg-1 1000tomato root elongation NOEC mg kg-1 1000wheat root elongation NOEC mg kg-1 1000Onthophagus gazella 7 d LC50 mg kg-1 >0.77Onthophagus gazella 7 d NOEC mg kg-1 0.77
florfenicol Aspergillus niger MIC mg l-1 >1000 Schering Plough 1996Trichoderme viride MIC mg l-1 >1000Clostridium perfringens MIC mg l-1 1Bacillus subtilus MIC mg l-1 0.4Nostoc MIC mg l-1 4
ivermectin Earthworms NOEC mg kg-1 12 Boxall et al., 2002Eisenia foetida 28 d LC50 mg kg-1 315plants NOEC mg kg-1 0.56N. cornicina behaviour mg kg-1 0.125N. cornicina 47% mortality over 7 d (dung) mg kg-1 0.125N. cornicina 77% mortality over 7 d (dung) mg kg-1 0.25N. cornicina 87% mortality over 7 d (dung) mg kg-1 0.5N. cornicina 100% mortality over 7 d (dung) mg kg-1 1N. cornicina 7 d LC50 mg kg-1 0.139Scatophagia stercoraria (larvae) 24 h EC50 mg kg-1 0.051Scatophagia stercoraria (larvae) 48 h EC50 mg kg-1 0.036Scatophagia stercoraria (adults) developmentalabnormalities
mg kg-1 0.0005
Scatophagia stercoraria 50% reduction in emergence mg kg-1 0.001Scatophagia stercoraria 50% reduction in pupation mg kg-1 0.015
lincomycin earthworms NOEC mg kg-1 1000 Boxall et al. 2002

Targeted monitoring study for veterinary medicines in the environment 105
Compound Terrestrial toxicity (endpoint) Terrestrial toxicity(units)
Terrestrial toxicity(value)
Source
microbes MIC or NOEC mg kg-1 0.78monensin Earthworm 14 d, 6 out of 15 animals dead mg kg-1 100 Elanco 1996
Earthworm normal physical condition + no mortality mg kg-1 <22.514 plant species non phytotoxic mg kg-1 1–214 plant species – moderate to severe injury of severalspecies
mg kg-1 4–8
morantel Microbes MIC or NOEC mg kg-1 50 Boxall et al. 2002moxidectin bobwhite quail 21 d LD50 mg kg-1 278 Fort Dodge 1997
mallard duck 21 d LD50 mg kg-1 365chicken 14 d LD50 mg kg-1 283plant phytotoxicity NOEC kg/ha 4earthworm 28 d LC50 mg kg-1 37.2dung insects:O. gazella - adult NOEC mg kg-1 >0.50O. gazella - progeny EC50 mg kg-1 2.5677E. intermedius - adult NOEC mg kg-1 >0.50E. intermedius - progeny EC50 mg kg-1 0.4693E. intermedius - progeny NOEC mg kg-1 >0.269H. irritans exigua EC50 mg kg-1 0.134H. irritans exigua NOEC mg kg-1 0.064
oxytetracycline mallard duck 8 d LC50 ppm >5620 Boxall et al. 2002northern bobwhite 8 d LC50 ppm >5620northern bobwhite 14 d LC50 ppm >2000F. fimetaria LC50 mg kg-1 >5000F. fimetaria EC50 reproduction mg kg-1 >5000E. crypticus LC50 mg kg-1 >5000E. crypticus EC50 reproduction mg kg-1 2701A. caliginosa LC50 mg kg-1 >5000A. caliginosa EC50 reproduction mg kg-1 4420A. caliginosa EC50 growth mg kg-1 >5000A. caliginosa EC50 hatchability mg kg-1 >5000Phaseolus vulgaris LC100 mg kg-1 160
salinomycin gram -ve bacteria and fungi no effect mg l-1 100sulfadiazine Lupinus albus 1 d 13% reduction in root size mg kg-1 100 Boxall et al. 2002tiamulin microbes MIC or NOEC mg kg-1 500 Fermenta 1994tilmicosin corn, cucumber, soybean, wheat no effect on ppm 100

106 Targeted monitoring study for veterinary medicines in the environment
Compound Terrestrial toxicity (endpoint) Terrestrial toxicity(units)
Terrestrial toxicity(value)
Source
germinationcucumber radicle length reduced by 45% ppm 100corn, soybean and wheat no effect on radicle length ppm 100corn, cucumber, ryegrass, soybean, tomato, wheat 21dNOEC seed growth (sand)
mg kg-1 100
corn, ryegrass, soybean, tomato and wheat 21 dNOEC seed growth (sandy loam)
mg kg-1 300
cucumber seed growth significantly affected (sandyloam)
mg kg-1 100
earthworm 28 d NOEC mg l-1 918bobwhite 5 d dietary LD50 mg kg-1 >4820mallards 5 d dietary LD50 mg kg-1 >4710range of gram +ve and -ve organisms MIC mg kg-1 0.024-50
tylosin bobwhite quail 5 d LD50 (dietary) mg kg-1 4820 Boxall et al. 2002mallard duck 5 d LD50 (dietary) mg kg-1 4710earthworm 28 d LD50 mg kg-1 918C. globosum mg kg-1 >1000A. flavus mg kg-1 >1000C. acidvorans mg kg-1 250A. chroococcum mg kg-1 5F. fimetaria LC50 mg kg-1 >5000F. fimetaria EC50 reproduction mg kg-1 2520E. crypticus LC50 mg kg-1 3381E. crypticus EC50 reproduction mg kg-1 3109A. caliginosa LC50 mg kg-1 >5000A. caliginosa EC50 reproduction mg kg-1 4530A. caliginosa EC50 growth mg kg-1 >5000A. caliginosa EC50 hatchability mg kg-1 4823

Appendix 7 Terrestrial ranking forthe pasture treatmentsCompound Animal type Treatment type
RCR = 0fenbendazole sheep liquid oralmoxidectin sheep injectionmoxidectin sheep liquid oralmoxidectin cattle injectionmoxidectin cattle pour onoxytetracycline pigs injectiontrimethoprim cattle bolustrimethoprim pigs injection
RCR = 0.01cyromazine sheep pour ondoramectin sheep injectiondoramectin pigs injectiondoramectin cattle injectioneprinomectin cattle pour onfenbendazole pigs feed pelletsfenbendazole pigs powderfenbendazole pigs liquid oralfenbendazole horse liquid oralfenbendazole cattle bolusfenbendazole cattle powderfenbendazole cattle liquid oralfenbendazole cattle feed pelletsivermectin sheep injectionivermectin sheep liquid oralivermectin horse pasteoxytetracycline pigs solubleoxytetracycline sheep injectionoxytetracycline cattle injectionoxytetracycline cattle bolusoxytetracycline cattle injectionoxytetracycline cattle solubleoxytetracycline sheep injectionoxytetracycline horse topicaltiamulin pigs premixtiamulin pigs injectiontrimethoprim horse pastetrimethoprim sheep injectiontrimethoprim cattle injectiontrimethoprim pigs suspensiontrimethoprim horse granules
RCR = 0.1apramycin sheep oralapramycin pigs injectionapramycin pigs oralapramycin pigs premixapramycin pigs powderdoramectin cattle pour on
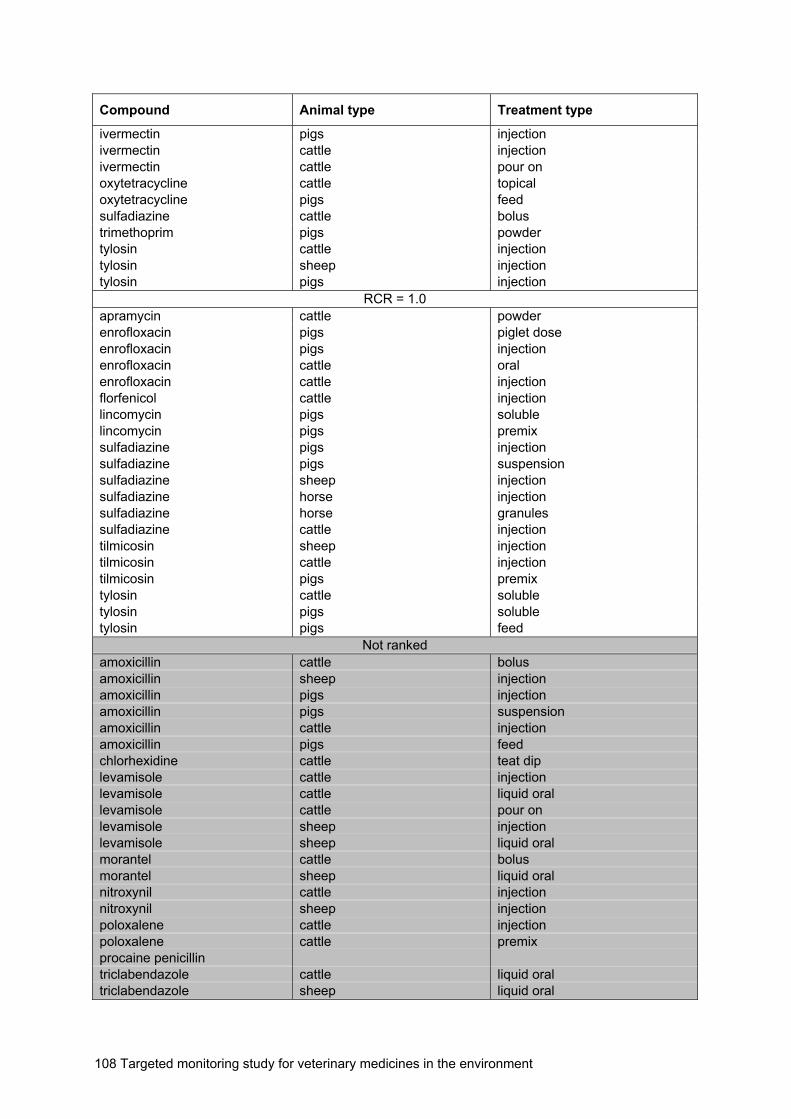
108 Targeted monitoring study for veterinary medicines in the environment
Compound Animal type Treatment type
ivermectin pigs injectionivermectin cattle injectionivermectin cattle pour onoxytetracycline cattle topicaloxytetracycline pigs feedsulfadiazine cattle bolustrimethoprim pigs powdertylosin cattle injectiontylosin sheep injectiontylosin pigs injection
RCR = 1.0apramycin cattle powderenrofloxacin pigs piglet doseenrofloxacin pigs injectionenrofloxacin cattle oralenrofloxacin cattle injectionflorfenicol cattle injectionlincomycin pigs solublelincomycin pigs premixsulfadiazine pigs injectionsulfadiazine pigs suspensionsulfadiazine sheep injectionsulfadiazine horse injectionsulfadiazine horse granulessulfadiazine cattle injectiontilmicosin sheep injectiontilmicosin cattle injectiontilmicosin pigs premixtylosin cattle solubletylosin pigs solubletylosin pigs feed
Not rankedamoxicillin cattle bolusamoxicillin sheep injectionamoxicillin pigs injectionamoxicillin pigs suspensionamoxicillin cattle injectionamoxicillin pigs feedchlorhexidine cattle teat diplevamisole cattle injectionlevamisole cattle liquid orallevamisole cattle pour onlevamisole sheep injectionlevamisole sheep liquid oralmorantel cattle bolusmorantel sheep liquid oralnitroxynil cattle injectionnitroxynil sheep injectionpoloxalene cattle injectionpoloxalene cattle premixprocaine penicillintriclabendazole cattle liquid oraltriclabendazole sheep liquid oral
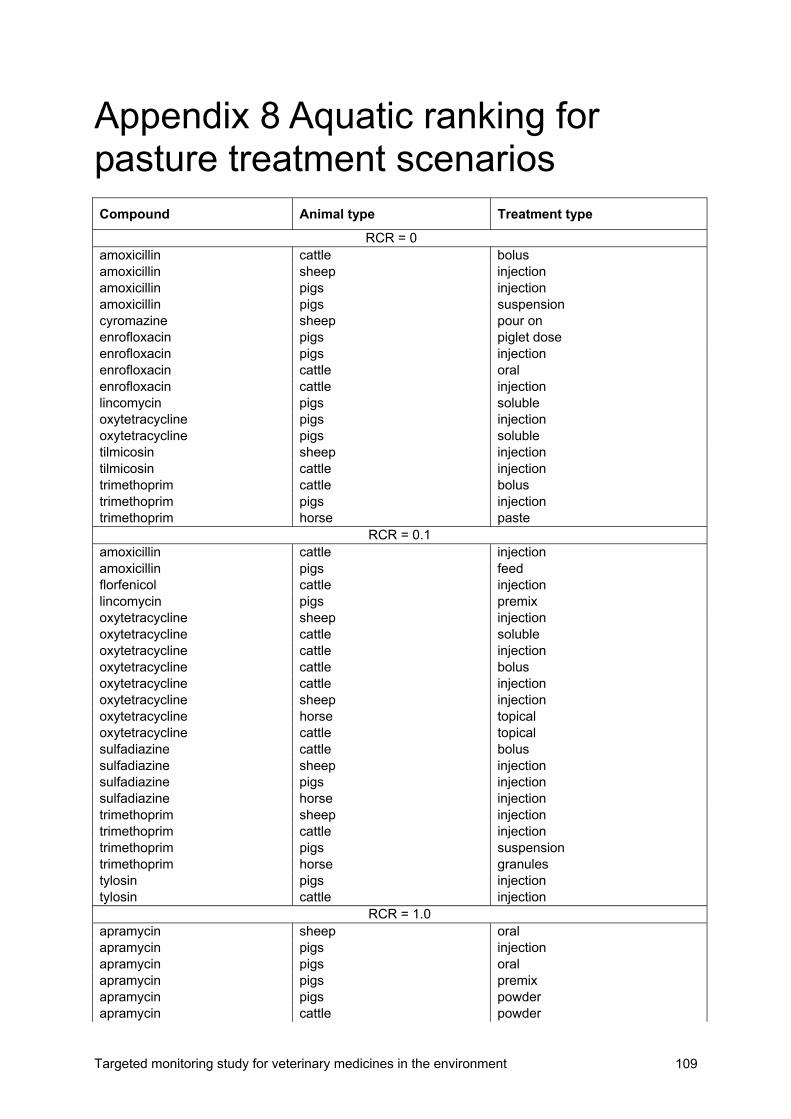
Targeted monitoring study for veterinary medicines in the environment 109
Appendix 8 Aquatic ranking forpasture treatment scenariosCompound Animal type Treatment type
RCR = 0amoxicillin cattle bolusamoxicillin sheep injectionamoxicillin pigs injectionamoxicillin pigs suspensioncyromazine sheep pour onenrofloxacin pigs piglet doseenrofloxacin pigs injectionenrofloxacin cattle oralenrofloxacin cattle injectionlincomycin pigs solubleoxytetracycline pigs injectionoxytetracycline pigs solubletilmicosin sheep injectiontilmicosin cattle injectiontrimethoprim cattle bolustrimethoprim pigs injectiontrimethoprim horse paste
RCR = 0.1amoxicillin cattle injectionamoxicillin pigs feedflorfenicol cattle injectionlincomycin pigs premixoxytetracycline sheep injectionoxytetracycline cattle solubleoxytetracycline cattle injectionoxytetracycline cattle bolusoxytetracycline cattle injectionoxytetracycline sheep injectionoxytetracycline horse topicaloxytetracycline cattle topicalsulfadiazine cattle bolussulfadiazine sheep injectionsulfadiazine pigs injectionsulfadiazine horse injectiontrimethoprim sheep injectiontrimethoprim cattle injectiontrimethoprim pigs suspensiontrimethoprim horse granulestylosin pigs injectiontylosin cattle injection
RCR = 1.0apramycin sheep oralapramycin pigs injectionapramycin pigs oralapramycin pigs premixapramycin pigs powderapramycin cattle powder

110 Targeted monitoring study for veterinary medicines in the environment
Compound Animal type Treatment type
doramectin sheep injectiondoramectin pigs injectiondoramectin cattle injectiondoramectin cattle pour oneprinomectin cattle pour onfenbendazole sheep liquid oralfenbendazole pigs feed pelletsfenbendazole pigs powderfenbendazole pigs liquid oralfenbendazole horse liquid oralfenbendazole cattle powderfenbendazole cattle liquid oralfenbendazole cattle feed pelletsfenbendazole cattle bolusivermectin sheep injectionivermectin sheep liquid oralivermectin horse pasteivermectin pigs injectionivermectin cattle injectionivermectin cattle pour onmoxidectin sheep injectionmoxidectin sheep liquid oralmoxidectin cattle injectionmoxidectin cattle pour onoxytetracycline pigs feedsulfadiazine pigs suspensionsulfadiazine horse granulessulfadiazine cattle injectiontiamulin pigs premixtiamulin pigs injectiontilmicosin pigs premixtrimethoprim pigs powdertylosin sheep injectiontylosin pigs solubletylosin cattle solubletylosin pigs feed
Not rankedchlorhexidine cattle teat diplevamisole cattle injectionlevamisole cattle liquid orallevamisole cattle pour onlevamisole sheep injectionlevamisole sheep liquid oralmorantel cattle bolusmorantel sheep liquid oralnitroxynil cattle injectionnitroxynil sheep injectionpoloxalene cattle injectionpoloxalene cattle premixprocaine penicillintriclabendazole cattle liquid oraltriclabendazole sheep liquid oral

Targeted monitoring study for veterinary medicines in the environment 111
Appendix 9 Groundwater ranking forpasture scenariosCompound Animal type Treatment type
PEC = 0 µg l-1
amoxicillin cattle bolusamoxicillin sheep injectionamoxicillin pigs injectionamoxicillin pigs suspensionamoxicillin cattle injectionamoxicillin pigs feedapramycin sheep oralapramycin pigs injectionapramycin pigs oralcyromazine sheep pour ondoramectin sheep injectiondoramectin pigs injectiondoramectin cattle injectiondoramectin cattle pour onenrofloxacin pigs piglet doseenrofloxacin pigs injectionenrofloxacin cattle oralenrofloxacin cattle injectioneprinomectin cattle pour onfenbendazole sheep liquid oralfenbendazole pigs feed pelletsfenbendazole pigs powderfenbendazole pigs liquid oralfenbendazole cattle bolusfenbendazole horse liquid oralfenbendazole cattle powderfenbendazole cattle liquid oralfenbendazole cattle feed pelletsivermectin sheep injectionivermectin sheep liquid oralivermectin horse pasteivermectin pigs injectionivermectin cattle injectionivermectin cattle pour onlevamisole sheep injectionlevamisole sheep liquid orallevamisole cattle injectionlevamisole cattle liquid orallevamisole cattle pour onmoxidectin sheep injectionmoxidectin sheep liquid oralmoxidectin cattle injectionmoxidectin cattle pour onoxytetracycline pigs injectionoxytetracycline pigs solubleoxytetracycline sheep injectionoxytetracycline cattle soluble

112 Targeted monitoring study for veterinary medicines in the environment
Compound Animal type Treatment type
oxytetracycline cattle injectionoxytetracycline cattle bolusoxytetracycline cattle injectionoxytetracycline sheep injectionoxytetracycline horse topicaloxytetracycline cattle topicaloxytetracycline pigs feedstreptomycin sheep injectionsulfadiazine cattle bolussulfadiazine sheep injectionsulfadiazine pigs injectionsulfadiazine horse injectionsulfadiazine pigs suspensionsulfadiazine horse granulessulfadiazine cattle injectiontilmicosin sheep injectiontilmicosin cattle injectiontriclabendazole cattle liquid oraltriclabendazole sheep liquid oraltrimethoprim cattle bolustrimethoprim pigs injectiontrimethoprim horse pastetrimethoprim sheep injectiontrimethoprim cattle injectiontrimethoprim pigs suspensiontrimethoprim horse granulestrimethoprim pigs powdertylosin pigs injectiontylosin cattle injectiontylosin sheep injectiontylosin pigs soluble
Groundwater PEC = 0.1 µg/lapramycin pigs premixapramycin pigs powderapramycin cattle powderflorfenicol cattle injectionlincomycin pigs solublelincomycin pigs premixstreptomycin horse injectionstreptomycin cattle injectiontilmicosin pigs premixtylosin cattle solubletylosin pigs feed
Not rankedchlorhexidine cattle teat dipmorantel cattle bolusmorantel sheep liquid oralnitroxynil cattle injectionnitroxynil sheep injectionpoloxalene cattle injectionpoloxalene cattle premixprocaine penicillintiamulin pigs premixtiamulin pigs injection

Targeted monitoring study for veterinary medicines in the environment 113
Appendix 10 Terrestrial ranking forintensive treatment scenariosCompound Animal type Treatment type
RCR = 0moxidectin cattle injectionmoxidectin cattle pour ontriclabendazole cattle liquid oraltylosin poultry solubletylosin cattle injectiontylosin pigs solubletylosin cattle solubletylosin pigs injectiontylosin pigs feed additive
RCR = 0.01diclazuril poultry premixeprinomectin cattle pour onivermectin cattle injection
RCR = 0.1doramectin cattle injectiondoramectin cattle pour ondoramectin pigs injectionfenbendazole cattle liquid oralfenbendazole cattle feed pelletsfenbendazole cattle powderfenbendazole pigs feed pelletsfenbendazole pigs powderfenbendazole cattle bolusfenbendazole pigs liquid oralivermectin cattle pour onivermectin pigs injectionivermectin pigs premixlincomycin pigs solubleoxytetracycline cattle injectionoxytetracycline cattle solubleoxytetracycline cattle bolusoxytetracycline poultry solubletiamulin pigs premixtiamulin poultry solubletiamulin pigs injectiontrimethoprim cattle injectiontrimethoprim pigs injectiontrimethoprim pigs suspension
RCR = 1.0enrofloxacin pigs piglet doserenrofloxacin cattle oralenrofloxacin cattle injectionenrofloxacin pigs injectionenrofloxacin poultry solubleflorfenicol cattle injectionlincomycin pigs premixmonensin cattle premix

114 Targeted monitoring study for veterinary medicines in the environment
monensin poultry premixoxytetracycline cattle topicaloxytetracycline pigs injectionoxytetracycline pigs topicaloxytetracycline pigs solubleoxytetracycline pigs feed additivesulfadiazine cattle bolussulfadiazine cattle injectionsulfadiazine pigs injectionsulfadiazine pigs suspensionsulfadiazine poultry solublesulfadiazine pigs powdersulfadiazine poultry powdertilmicosin cattle injectiontilmicosin poultry solubletilmicosin pigs premixtrimethoprim poultry powdertrimethoprim pigs powdertrimethoprim poultry solubletrimethoprim cattle bolus
Not rankedamoxicillin cattle injectionamoxicillin pigs injectionamoxicillin pigs suspensionamoxicillin poultry powderamoxicillin pigs feed additiveamoxicillin cattle bolusamoxicillin cattle powderamprolium poultry premixchlorhexidine cattle teat dipclavulanic acid cattle injectionclavulanic acid cattle injectionclavulanic acid pigs injectiondecoquinate cattle premixlevamisole cattle injectionlevamisole cattle liquid orallevamisole cattle pour onmorantel cattle bolusmorantel cattle liquid oralnicarbazin poultry feed additivenitroxynil cattle injectionpoloxalene cattle drenchpoloxalene cattle premixprocaine penicillinsalinomycin poultry feed additive

Targeted monitoring study for veterinary medicines in the environment 115
Appendix 11 Aquatic ranking forintensive treatment scenariosCompound Animal type Treatment type
RCR = 0amoxicillin cattle injectionamoxicillin pigs injectionamoxicillin pigs suspensionamoxicillin poultry powderamoxicillin pigs feed additiveamoxicillin cattle bolusdiclazuril poultry premixenrofloxacin pigs piglet doserenrofloxacin cattle oralenrofloxacin cattle injectionenrofloxacin pigs injectionenrofloxacin poultry solublemonensin cattle premixmonensin poultry premixmoxidectin cattle injectionmoxidectin cattle pour onoxytetracycline cattle injectionoxytetracycline cattle solubleoxytetracycline cattle bolusoxytetracycline poultry solubleoxytetracycline cattle topicaloxytetracycline pigs topicaloxytetracycline pigs injectionoxytetracycline pigs solubleoxytetracycline pigs feed additivetilmicosin cattle injectiontilmicosin poultry solubletilmicosin pigs premixtriclabendazole cattle liquid oraltrimethoprim cattle injectiontrimethoprim pigs injectiontrimethoprim pigs suspensiontylosin poultry solubletylosin cattle injectiontylosin pigs solubletylosin cattle solubletylosin pigs injectiontylosin pigs feed additive
RCR = 0.01doramectin cattle injectionlincomycin pigs solubletrimethoprim poultry powdertrimethoprim pigs powdertrimethoprim poultry soluble
RCR = 0.1doramectin cattle pour ondoramectin pigs injection
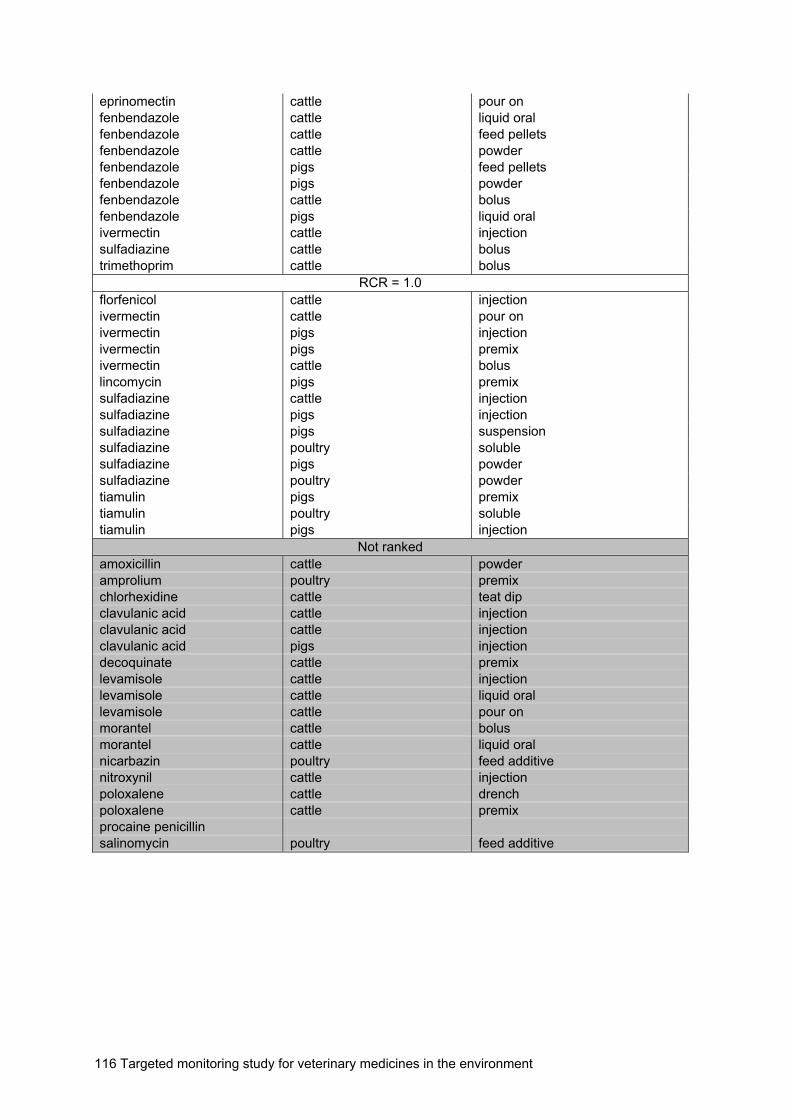
116 Targeted monitoring study for veterinary medicines in the environment
eprinomectin cattle pour onfenbendazole cattle liquid oralfenbendazole cattle feed pelletsfenbendazole cattle powderfenbendazole pigs feed pelletsfenbendazole pigs powderfenbendazole cattle bolusfenbendazole pigs liquid oralivermectin cattle injectionsulfadiazine cattle bolustrimethoprim cattle bolus
RCR = 1.0florfenicol cattle injectionivermectin cattle pour onivermectin pigs injectionivermectin pigs premixivermectin cattle boluslincomycin pigs premixsulfadiazine cattle injectionsulfadiazine pigs injectionsulfadiazine pigs suspensionsulfadiazine poultry solublesulfadiazine pigs powdersulfadiazine poultry powdertiamulin pigs premixtiamulin poultry solubletiamulin pigs injection
Not rankedamoxicillin cattle powderamprolium poultry premixchlorhexidine cattle teat dipclavulanic acid cattle injectionclavulanic acid cattle injectionclavulanic acid pigs injectiondecoquinate cattle premixlevamisole cattle injectionlevamisole cattle liquid orallevamisole cattle pour onmorantel cattle bolusmorantel cattle liquid oralnicarbazin poultry feed additivenitroxynil cattle injectionpoloxalene cattle drenchpoloxalene cattle premixprocaine penicillinsalinomycin poultry feed additive

Targeted monitoring study for veterinary medicines in the environment 117
Appendix 12 Groundwater rankingfor intensive treatment scenariosCompound Animal type Treatment type
PEC = 0 µg l-1
amoxicillin cattle injectionamoxicillin pigs injectionamoxicillin pigs suspensionamoxicillin poultry powderamoxicillin pigs feed additiveamoxicillin cattle boluschlorhexidine cattle teat dipdiclazuril poultry premixdoramectin cattle injectiondoramectin cattle pour ondoramectin pigs injectionenrofloxacin pigs piglet doserenrofloxacin cattle oralenrofloxacin cattle injectionenrofloxacin pigs injectionenrofloxacin poultry solubleeprinomectin cattle pour onfenbendazole cattle liquid oralfenbendazole cattle feed pelletsfenbendazole cattle powderfenbendazole pigs feed pelletsfenbendazole pigs powderfenbendazole cattle bolusfenbendazole pigs liquid oralivermectin cattle injectionivermectin cattle pour onivermectin pigs injectionivermectin pigs premixivermectin cattle boluslevamisole cattle injectionlevamisole cattle liquid orallevamisole cattle pour onmonensin cattle premixmonensin poultry premixmorantel cattle bolusmorantel cattle liquid oralmoxidectin cattle injectionmoxidectin cattle pour onoxytetracycline cattle injectionoxytetracycline cattle solubleoxytetracycline cattle bolusoxytetracycline poultry solubleoxytetracycline cattle topicaloxytetracycline pigs topicaloxytetracycline pigs injectionoxytetracycline pigs solubleoxytetracycline pigs feed additive

118 Targeted monitoring study for veterinary medicines in the environment
Compound Animal type Treatment type
tilmicosin cattle injectiontilmicosin poultry solubletilmicosin pigs premixtriclabendazole cattle liquid oraltrimethoprim cattle injectiontrimethoprim pigs injectiontrimethoprim pigs suspensiontrimethoprim poultry powdertrimethoprim pigs powdertrimethoprim poultry solubletrimethoprim cattle bolustylosin poultry solubletylosin cattle injectiontylosin pigs solubletylosin cattle solubletylosin pigs injectiontylosin pigs feed additive
Groundwater concentration = 0.1 µg/lflorfenicol cattle injectionlincomycin pigs solublelincomycin pigs premixsulfadiazine cattle bolussulfadiazine cattle injectionsulfadiazine pigs injectionsulfadiazine pigs suspensionsulfadiazine poultry solublesulfadiazine pigs powdersulfadiazine poultry powder
Not rankedamoxicillin cattle powderamprolium poultry premixclavulanic acid cattle injectionclavulanic acid cattle bolusclavulanic acid pigs injectiondecoquinate cattle premixnicarbazin poultry feed additivenitroxynil cattle injectionpoloxalene cattle drenchpoloxalene cattle premixprocaine penicillinsalinomycin poultry feed additivetiamulin pigs premixtiamulin poultry solubletiamulin pigs injection

Targeted monitoring study for veterinary medicines in the environment 119
Appendix 13 Soil characteristicsIndoor pigs Outdoor pigs Poultry
Dry matter content (%) 97.3 99.2 98.5Water content (%) 2.8 0.8 1.5600 µm to 2 mm 2.97 2.67 8.64212–600 µm 18.22 67.91 21.51106–212 µm 8.05 11.32 20.3163–106 µm 2.80 3.53 11.472–63 µm 21.20 8.01 18.65<2 µm 46.77 6.56 19.42pH in water (2 h) 6.8 7.3 7.3pH in water (24 h) 6.8 7.2 7.3pH in KCl (2 h) 5.8 6.6 6.7pH in KCl (24 h) 5.9 6.6 6.7CEC 16.8 8.0 15.3Organic carbon (%) 2.6 1.5 2.0

We are The Environment Agency. It's our job to look afteryour environment and make it a better place – for you, andfor future generations.
Your environment is the air you breathe, the water you drinkand the ground you walk on. Working with business,Government and society as a whole, we are making yourenvironment cleaner and healthier.
The Environment Agency. Out there, making yourenvironment a better place.
Published by:
Environment AgencyRio HouseWaterside Drive, Aztec WestAlmondsbury, Bristol BS32 4UDTel: 0870 8506506Email: [email protected]
© Environment Agency
All rights reserved. This document may be reproduced withprior permission of the Environment Agency.