Target Price: 5,822 Make-in-India, with size and scale...
21
Anand Rathi Share and Stock Brokers Limited (hereinafter “ARSSBL”) is a full-service brokerage and equities-research firm and the views expressed therein are solely of ARSSBL and not of the companies which have been covered in the Research Report. This report is intended for the sole use of the Recipient. Disclosures and analyst certifications are present in the Appendix. Anand Rathi Research India Equities India I Equities Key financials (YE Mar) FY18 FY19 FY20e FY21e FY22e Sales (`m) 28,416 29,845 48,765 61,434 75,345 Net profit (`m) 609 634 1,512 1,963 2,639 EPS (`) 53.8 55.9 133.5 173.3 232.9 PE (x) 61.0 43.1 26.6 20.5 15.3 EV / EBITDA (x) 32.8 20.9 15.8 12.6 10.0 PBV (x) 11.8 7.2 7.7 5.6 4.1 RoE (%) 23.8 18.3 33.4 31.6 31.1 RoCE (%) 33.9 26.7 37.3 35.5 36.6 Dividend yield (%) 0.1 0.1 0.1 0.1 0.1 Net debt/equity (x) 0.1 0.4 0.4 0.3 0.1 Source: Company Consumer Durables Initiating Coverage Nirav Vasa Research Analyst Surbhi Lodha Research Analyst Rating: Buy Target Price: `5,822 Share Price: `3,552 Relative price performance Source: Bloomberg DIXON Sensex 1,500 2,000 2,500 3,000 3,500 4,000 Dec-18 Jan-19 Feb-19 Mar-19 Apr-19 May-19 Jun-19 Jul-19 Aug-19 Sep-19 Oct-19 Nov-19 Dec-19 Key data DIXON IN / DIXO.BO 52-week high / low `3642 / 1560 Sensex / Nifty 41352 / 12165 3-m average volume $2m Market cap `41bn / $578.5m Shares outstanding 12m Shareholding pattern (%) Sep’19 Jun’19 Mar ’19 Promoters 38.9 38.9 38.9 - of which, Pledged - - - Free float 61.1 61.1 61.1 - Foreign institutions 7.7 7.2 6.0 - Domestic institutions 22.1 22.4 23.8 - Public 31.4 31.5 31.3 17 December 2019 Dixon Technologies (India) Make-in-India, with size and scale aiding import substitution; Buy Ideally placed to cater to mounting demand across multiple categories in the rapidly growing Indian consumer durables sector, Dixon’s scale and size give it an edge. It has the largest manufacturing plants in India for LED TVs, LED bulbs and washing machines. Among the top-five globally with manufacturing capabilities for LED bulbs, its export capabilities are on the threshold of exciting opportunities, aided possibly by one of its customers with global operations. Besides, its original design and manufacturing (ODM) solutions based on R&D across many product categories should help keep it in the forefront of innovation across product categories. No hindrances to aspirational demand; favourable GST rates in place. With robust aspirational demand in India, customs-duty structures being inverted to support Make-in-India, and GST rates rationalised, Dixon’s growth seems to be aligned with strategic steps. Further reduction in GST rates would eventually result in deeper penetration. Also, shortening replacement cycles across product categories would help to raise volumes. India emerging as credible alternative to China. With manufacturing operations in India ramping up, established domestic and global brands in India are looking at lowering imports (partially/fully) in a phased manner. This would help in adding clients and ramping up volumes in existing/forthcoming product categories. India also fits perfectly in the global supply chain of MNC giants, which are looking at reducing their manufacturing operations in China amid its trade war with the USA. Valuation and Outlook. We initiate coverage on Dixon Technologies, with a Buy recommendation and a target of `5,822 (25x FY22e EPS of `233) as we model 24% and 32% CAGRs over FY20-22 in respectively revenue and PAT, resulting in the RoCE expanding from 26% in FY19 to ~36% in FY21 and FY22.
Transcript of Target Price: 5,822 Make-in-India, with size and scale...
Anand Rathi Share and Stock Brokers Limited (hereinafter “ARSSBL”) is a full-service brokerage and equities-research firm and the views expressed therein are solely of ARSSBL and not of the companies which have been covered in the Research Report. This report is intended for the sole use of the Recipient. Disclosures and analyst certifications are present in the Appendix. Anand Rathi Research India Equities
India I Equities
Key financials (YE Mar) FY18 FY19 FY20e FY21e FY22e
Sales (`m) 28,416 29,845 48,765 61,434 75,345
Net profit (`m) 609 634 1,512 1,963 2,639
EPS (`) 53.8 55.9 133.5 173.3 232.9
PE (x) 61.0 43.1 26.6 20.5 15.3
EV / EBITDA (x) 32.8 20.9 15.8 12.6 10.0
PBV (x) 11.8 7.2 7.7 5.6 4.1
RoE (%) 23.8 18.3 33.4 31.6 31.1
RoCE (%) 33.9 26.7 37.3 35.5 36.6
Dividend yield (%) 0.1 0.1 0.1 0.1 0.1
Net debt/equity (x) 0.1 0.4 0.4 0.3 0.1
Source: Company
Consumer Durables
Initiating Coverage
Nirav VasaResearch Analyst
Surbhi Lodha Research Analyst
`
Rating: Buy Target Price: `5,822 Share Price: `3,552
Relative price performance
Source: Bloomberg
DIXON
Sensex
1,500
2,000
2,500
3,000
3,500
4,000
Dec
-18
Jan-
19
Feb-
19
Mar
-19
Apr-1
9
May
-19
Jun-
19
Jul-1
9
Aug-
19
Sep-
19
Oct
-19
Nov
-19
Dec
-19
Key data DIXON IN / DIXO.BO52-week high / low `3642 / 1560Sensex / Nifty 41352 / 121653-m average volume $2mMarket cap `41bn / $578.5mShares outstanding 12m
Shareholding pattern (%) Sep’19 Jun’19 Mar ’19
Promoters 38.9 38.9 38.9- of which, Pledged - - -Free float 61.1 61.1 61.1 - Foreign institutions 7.7 7.2 6.0 - Domestic institutions 22.1 22.4 23.8 - Public 31.4 31.5 31.3
17 December 2019
Dixon Technologies (India)
Make-in-India, with size and scale aiding import substitution; Buy
Ideally placed to cater to mounting demand across multiple categories in the rapidly growing Indian consumer durables sector, Dixon’s scale and size give it an edge. It has the largest manufacturing plants in India for LED TVs, LED bulbs and washing machines. Among the top-five globally with manufacturing capabilities for LED bulbs, its export capabilities are on the threshold of exciting opportunities, aided possibly by one of its customers with global operations. Besides, its original design and manufacturing (ODM) solutions based on R&D across many product categories should help keep it in the forefront of innovation across product categories.
No hindrances to aspirational demand; favourable GST rates in place. With robust aspirational demand in India, customs-duty structures being inverted to support Make-in-India, and GST rates rationalised, Dixon’s growth seems to be aligned with strategic steps. Further reduction in GST rates would eventually result in deeper penetration. Also, shortening replacement cycles across product categories would help to raise volumes.
India emerging as credible alternative to China. With manufacturing operations in India ramping up, established domestic and global brands in India are looking at lowering imports (partially/fully) in a phased manner. This would help in adding clients and ramping up volumes in existing/forthcoming product categories. India also fits perfectly in the global supply chain of MNC giants, which are looking at reducing their manufacturing operations in China amid its trade war with the USA.
Valuation and Outlook. We initiate coverage on Dixon Technologies, with a Buy recommendation and a target of `5,822 (25x FY22e EPS of `233) as we model 24% and 32% CAGRs over FY20-22 in respectively revenue and PAT, resulting in the RoCE expanding from 26% in FY19 to ~36% in FY21 and FY22.

17 December 2019 Dixon Technologies (India) – Make-in-India, with size and scale aiding import substitution; Buy
AnandRathi Research 2
Quick Glance – Financials and ValuationsFig 1 – Income statement (` m) Year-end: Mar FY18 FY19 FY20e FY21e FY22e
Net revenues 28,416 29,845 48,765 61,434 75,345 Growth (%) 15.7 5.0 63.4 26.0 22.6
Direct costs 24,870 26,093 42,669 53,693 65,776
SG&A 2,419 2,403 3,452 4,471 5,586 EBITDA 1,127 1,349 2,643 3,270 3,983 EBITDA margins (%) 4.0 4.5 5.4 5.3 5.3 - Depreciation 152 217 331 375 397 Other income 42 56 64 66 68 Interest expenses 135 250 360 343 136 PBT 882 938 2,016 2,618 3,518 Effective tax rate (%) 31.0 32.5 25.0 25.0 25.0 + Associates / (Minorities) - - - - -Net Income 609 634 1,512 1,963 2,639 Adjusted income 609 634 1,512 1,963 2,639 WANS 11 11 11 11 11 FDEPS (` / sh) 53.8 55.9 133.5 173.3 232.9 FDEPS growth (%) 16.5 4.0 138.7 29.8 34.4 Gross margins (%) 12.5 12.6 12.5 12.6 12.7
Fig 3 – Cash-flow statement (` m) Year-end: Mar FY18 FY19 FY20e FY21e FY22e
PBT (adj. for OI and int.) 975 1,132 2,312 2,895 3,586 + Non-cash items 152 217 331 375 397 Oper. prof. before WC 1,127 1,349 2,643 3,270 3,983 - Incr. / (decr.) in WC -235 -1,152 -1,586 -990 -1,088 Others incl. taxes -273 -305 -504 -654 -880 Operating cash-flow 618 -108 554 1,625 2,016 - Capex (tang. + intang.) -716 -864 -746 -775 -597 Free cash-flow -98 -971 -193 850 1,419 Acquisitions - Div. (incl. buyback & taxes) -23 -23 -28 -34 -34 + Equity raised 3 0 - - -+ Debt raised -23 954 639 -95 -1,151 - Fin investments -111 35 -4 - -- Misc. (CFI + CFF) 540 -69 -298 -284 -74 Net cash-flow 288 -74 115 437 159 Source: Company
Fig 5 – Price movement
Source: Bloomberg
Fig 2 – Balance sheet (` m) Year-end: Mar FY18 FY19 FY20e FY21e FY22e
Share capital 113 113 113 113 113 Net worth 3,150 3,782 5,260 7,183 9,781 Debt 406 1,361 1,999 1,904 753 Minority interest - - - - -DTL / (Assets) 41 160 165 165 165 Capital employed 3,597 6,887 7,425 9,252 10,699 Net tangible assets 1,788 2,362 2,762 3,162 3,362 Net intangible assets 36 47 50 50 50 Goodwill - - - - -CWIP (tang. & intang.) 125 188 200 200 200 Investments (strategic) 111 76 80 80 80 Investments (financial) - - - - -Current assets (ex cash) 7,153 11,884 16,791 21,056 25,738 Cash 441 367 482 919 1,079 Current liabilities 6,058 8,038 12,936 16,210 19,805 Working capital 1,095 3,847 3,855 4,846 5,933 Capital deployed 3,597 6,887 7,425 9,252 10,699 Contingent liabilities 22 21 - - -
Fig 4 – Ratio analysis Year-end: Mar FY18 FY19 FY20e FY21e FY22e
P/E (x) 61.0 43.1 26.6 20.5 15.3 EV / EBITDA (x) 32.8 20.9 15.8 12.6 10.0 EV / Sales (x) 1.3 0.9 0.9 0.7 0.5 P/B (x) 11.8 7.2 7.7 5.6 4.1 RoE (%) 23.8 18.3 33.4 31.6 31.1 RoCE (%) - after tax 33.9 26.7 37.3 35.5 36.6 ROIC 26.0 16.6 26.5 29.1 30.5 DPS (` / sh) 2.0 2.0 2.5 3.0 3.0 Dividend yield (%) 0.1 0.1 0.1 0.1 0.1 Dividend payout (%) - incl. DDT 3.7 3.6 1.9 1.7 1.3 Net debt / equity (x) 0.1 0.4 0.4 0.3 0.1 Receivables (days) 38 63 63 63 63 Inventory (days) 41 50 50 50 50 Payables (days) 66 90 90 90 90 CFO : PAT % 101.5 -17.0 36.6 82.8 76.4 Source: Company
Fig 6 – FY19 gross revenue mix
Source: Company
DIXON
0
500
1,000
1,500
2,000
2,500
3,000
3,500
4,000
4,500
Sep-
17
Nov
-17
Dec
-17
Jan-
18
Mar
-18
May
-18
Jun-
18
Jul-1
8
Sep-
18
Oct
-18
Dec
-18
Jan-
19
Mar
-19
Apr-1
9
Jun-
19
Jul-1
9
Sep-
19
Oct
-19
Dec
-19
(`)
Consumer Electronics
40%
Lighting Products31%
Home Appliances12%
Mobile Phones12%
Reverse Logistics1%
Security Systems4%
17 December 2019 Dixon Technologies (India) – Make-in-India, with size and scale aiding import substitution; Buy
Anand Rathi Research 3
Personifies “Make in India” Manufacturing size and scale able to cater to huge domestic market: Starting in 1994 with assembling colour television sets, Dixon has been expanding its product basket regularly. Scale and size have been primary drivers in it establishing its manufacturing footprint in India, giving it an edge over others.
With its manufacturing base set-up, it is able to (a) cater to 25% of the domestic television market, (b) supply up to 30% of the domestic washing-machine market, (c) meet up to 60% of the LED bulb market in India. Its addressable market for all these categories could be ~ `350bn, with potential for exports as well. This is now being negotiated and is expected to take off from CY20, supported by some of its customers which operate in many continents and are re-aligning their supply chain to market requirements.
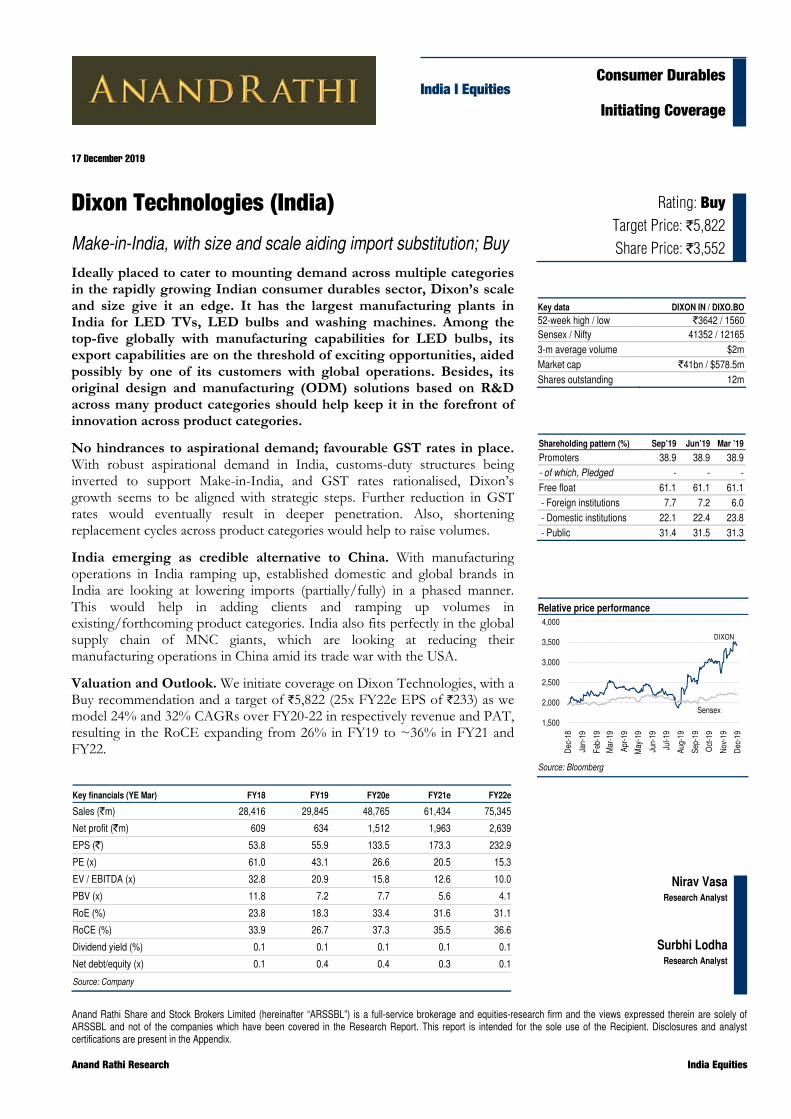
Fig 7 – Manufacturing footprint developed, all-India
Product Location Installed capacity (m/a) Comments
LED TVs Andhra Pradesh 3.6 Largest TV assembly plant in India
Washing machines Uttarakhand 1.2 Largest washing machine assembly plant in India
LED bulbs Noida 240 Largest bulb assembly plant in India
CCTV cameras Andhra Pradesh 8.4
Digital video recorders Andhra Pradesh 1.8
Source: Company
Fig 8 – Major brands in each product segment Product Major brands catered
LED TVs Xiaomi, Philips, Panasonic, Lloyd, Marquee, Koryo, BPL
Washing machines Lloyd, Samsung
LED bulbs Syska, Orient, Philips, Bajaj Electricals, Panasonic, Wipro, Ajanta, Polycab, Usha
Mobile phones Samsung, Xiaomi, Gionee, Panasonic, Micromax, Mobiistar, Intex
Source: Industry, Anand Rathi Research
Shift to ODM to offer customers value-added solutions: Apart from scale and size, Dixon has moved up the value chain. It is now capable of offering original-design manufacturing (ODM) solutions based on requirements of the Indian market.
It has offered clients (a) 38 models of LED television sets, (b) 6-7 variants of fully-automatic washing machines and up to 170 models of semi-automatic washing machines (the largest market in washing machines in India, 55% by volumes) and (c) more than 2,000 variants of 12-50W LED bulbs to all the major brands in India, barring Havells and Crompton, which have their own manufacturing plants located in India.
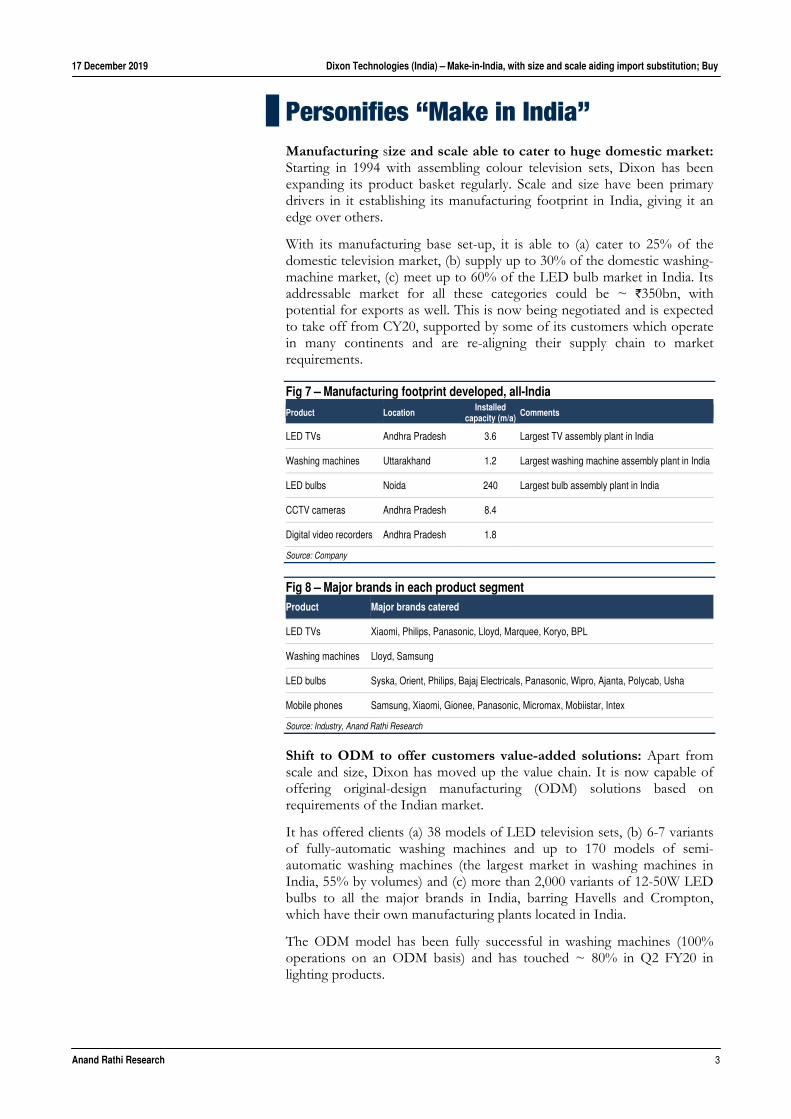
The ODM model has been fully successful in washing machines (100% operations on an ODM basis) and has touched ~ 80% in Q2 FY20 in lighting products.
17 December 2019 Dixon Technologies (India) – Make-in-India, with size and scale aiding import substitution; Buy
Anand Rathi Research 4
Fig 9 – ODM levels have doubled since FY19
Source: Company
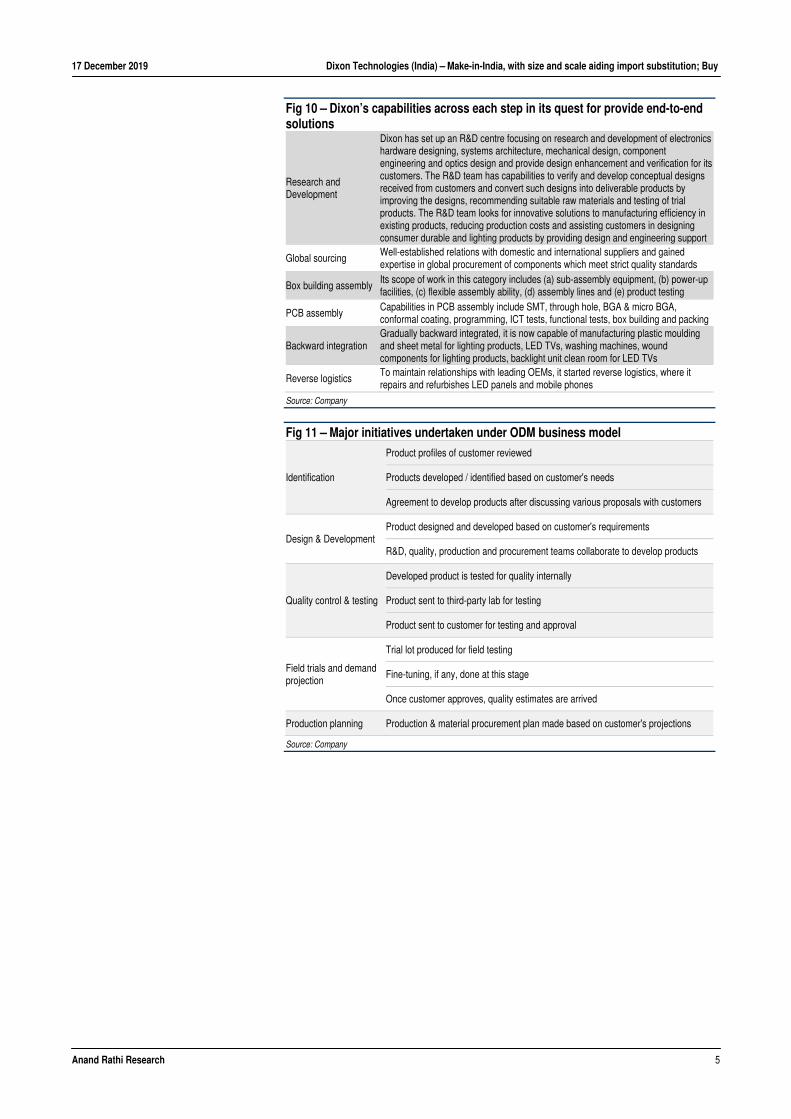
Ability to provide end-to-end solutions cost-effectively: As the focus is on ODM/OEM solutions, Dixon is well placed to provide end-to-end solutions to OEMs across the categories in which it operates. Major elements of end-to-end solution include research and development, global sourcing, PCB assembly, box-building assembly, backward integration and reverse logistics.
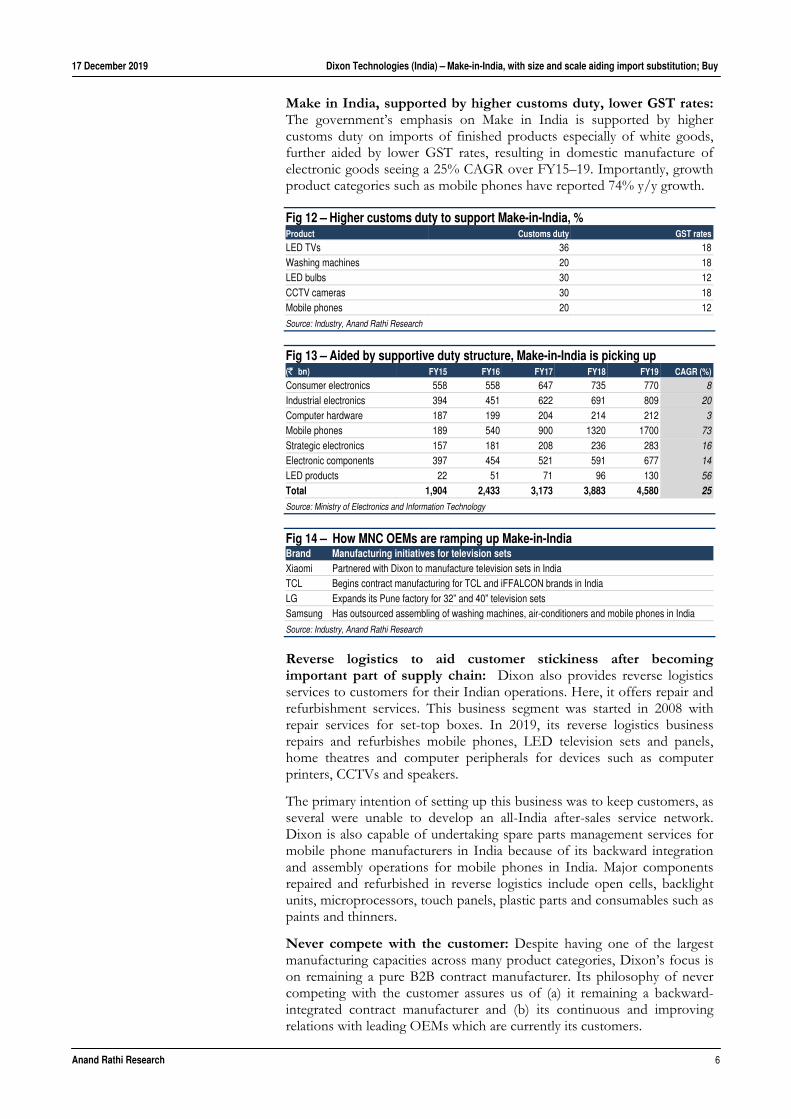
For ODM-based products, Dixon can provide end-to-end solutions starting from product profiling to product and material procurement based on customer’s projections. Its capabilities to provide OEM/ODM solutions cost-effectively are supported by backward integration and implementation of processes.
Dixon is well placed to deliver cost-effective solutions because of (a) in-house capability for plastic moulds and coil manufacturing, (b) experience in large scale operations, (c) backward-integrated manufacturing facilities, (d) global sourcing and processes, and e) availability of skilled and unskilled labour across manufacturing facilities.
Dixon has also implemented thorough pre-manufacturing checks and balances, which prevent unnecessary defects and ensure resources are not wasted. Because of these processes, it has received ISO 9001:2008 and ISO 14001:2004 certifications.
48
3640 37 34
65
81
8983 84
0
10
20
30
40
50
60
70
80
90
1QFY
18
2QFY
18
3QFY
18
4QFY
18
1QFY
19
2QFY
19
3QFY
19
4QFY
19
1QFY
20
2QFY
20
(%)
Lighting products
17 December 2019 Dixon Technologies (India) – Make-in-India, with size and scale aiding import substitution; Buy
Anand Rathi Research 5
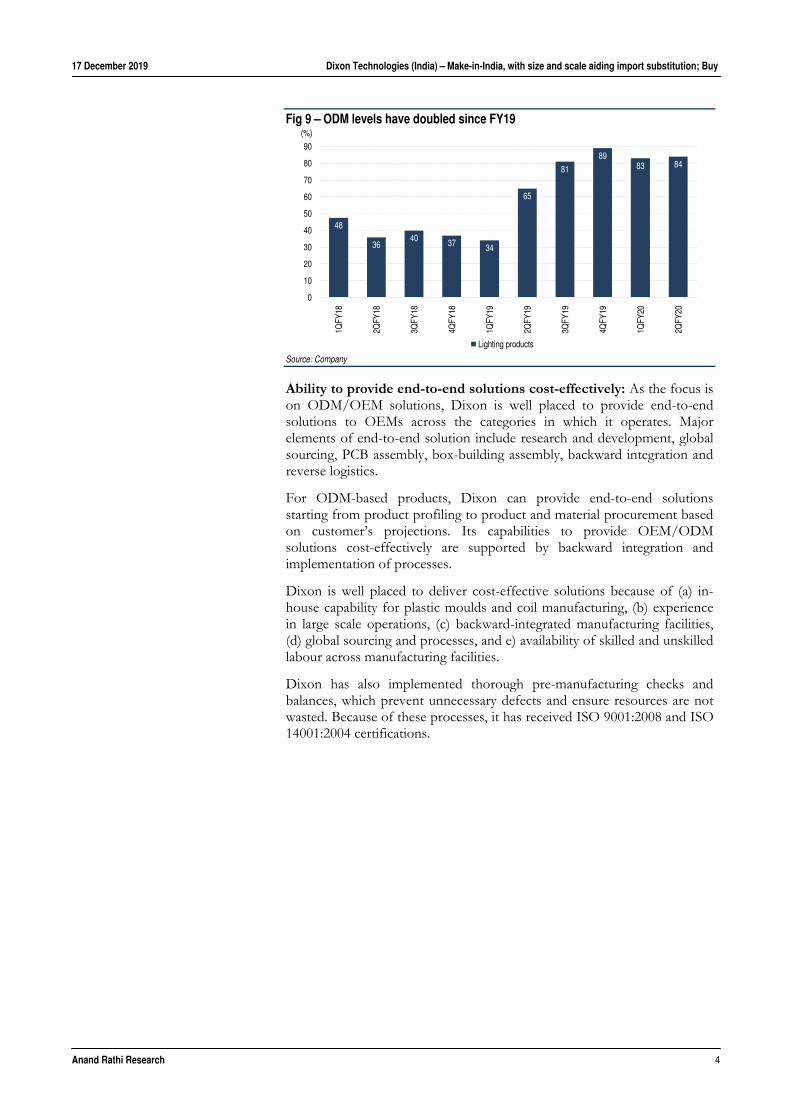
Fig 10 – Dixon’s capabilities across each step in its quest for provide end-to-end solutions
Research and Development
Dixon has set up an R&D centre focusing on research and development of electronics hardware designing, systems architecture, mechanical design, component engineering and optics design and provide design enhancement and verification for itscustomers. The R&D team has capabilities to verify and develop conceptual designs received from customers and convert such designs into deliverable products by improving the designs, recommending suitable raw materials and testing of trial products. The R&D team looks for innovative solutions to manufacturing efficiency in existing products, reducing production costs and assisting customers in designing consumer durable and lighting products by providing design and engineering support
Global sourcing Well-established relations with domestic and international suppliers and gained expertise in global procurement of components which meet strict quality standards
Box building assembly Its scope of work in this category includes (a) sub-assembly equipment, (b) power-up facilities, (c) flexible assembly ability, (d) assembly lines and (e) product testing
PCB assembly Capabilities in PCB assembly include SMT, through hole, BGA & micro BGA, conformal coating, programming, ICT tests, functional tests, box building and packing
Backward integration Gradually backward integrated, it is now capable of manufacturing plastic moulding and sheet metal for lighting products, LED TVs, washing machines, wound components for lighting products, backlight unit clean room for LED TVs
Reverse logistics To maintain relationships with leading OEMs, it started reverse logistics, where it repairs and refurbishes LED panels and mobile phones
Source: Company
Fig 11 – Major initiatives undertaken under ODM business model
Identification
Product profiles of customer reviewed
Products developed / identified based on customer's needs
Agreement to develop products after discussing various proposals with customers
Design & Development Product designed and developed based on customer's requirements
R&D, quality, production and procurement teams collaborate to develop products
Quality control & testing
Developed product is tested for quality internally
Product sent to third-party lab for testing
Product sent to customer for testing and approval
Field trials and demand projection
Trial lot produced for field testing
Fine-tuning, if any, done at this stage
Once customer approves, quality estimates are arrived
Production planning Production & material procurement plan made based on customer's projections
Source: Company
17 December 2019 Dixon Technologies (India) – Make-in-India, with size and scale aiding import substitution; Buy
Anand Rathi Research 6
Make in India, supported by higher customs duty, lower GST rates: The government’s emphasis on Make in India is supported by higher customs duty on imports of finished products especially of white goods, further aided by lower GST rates, resulting in domestic manufacture of electronic goods seeing a 25% CAGR over FY15–19. Importantly, growth product categories such as mobile phones have reported 74% y/y growth.
Fig 12 – Higher customs duty to support Make-in-India, % Product Customs duty GST rates
LED TVs 36 18Washing machines 20 18LED bulbs 30 12CCTV cameras 30 18Mobile phones 20 12
Source: Industry, Anand Rathi Research
Fig 13 – Aided by supportive duty structure, Make-in-India is picking up (` bn) FY15 FY16 FY17 FY18 FY19 CAGR (%)
Consumer electronics 558 558 647 735 770 8 Industrial electronics 394 451 622 691 809 20 Computer hardware 187 199 204 214 212 3 Mobile phones 189 540 900 1320 1700 73 Strategic electronics 157 181 208 236 283 16 Electronic components 397 454 521 591 677 14 LED products 22 51 71 96 130 56 Total 1,904 2,433 3,173 3,883 4,580 25 Source: Ministry of Electronics and Information Technology
Fig 14 – How MNC OEMs are ramping up Make-in-India Brand Manufacturing initiatives for television sets Xiaomi Partnered with Dixon to manufacture television sets in India TCL Begins contract manufacturing for TCL and iFFALCON brands in India LG Expands its Pune factory for 32” and 40” television sets Samsung Has outsourced assembling of washing machines, air-conditioners and mobile phones in India
Source: Industry, Anand Rathi Research
Reverse logistics to aid customer stickiness after becoming important part of supply chain: Dixon also provides reverse logistics services to customers for their Indian operations. Here, it offers repair and refurbishment services. This business segment was started in 2008 with repair services for set-top boxes. In 2019, its reverse logistics business repairs and refurbishes mobile phones, LED television sets and panels, home theatres and computer peripherals for devices such as computer printers, CCTVs and speakers.
The primary intention of setting up this business was to keep customers, as several were unable to develop an all-India after-sales service network. Dixon is also capable of undertaking spare parts management services for mobile phone manufacturers in India because of its backward integration and assembly operations for mobile phones in India. Major components repaired and refurbished in reverse logistics include open cells, backlight units, microprocessors, touch panels, plastic parts and consumables such as paints and thinners.
Never compete with the customer: Despite having one of the largest manufacturing capacities across many product categories, Dixon’s focus is on remaining a pure B2B contract manufacturer. Its philosophy of never competing with the customer assures us of (a) it remaining a backward-integrated contract manufacturer and (b) its continuous and improving relations with leading OEMs which are currently its customers.
17 December 2019 Dixon Technologies (India) – Make-in-India, with size and scale aiding import substitution; Buy
Anand Rathi Research 7
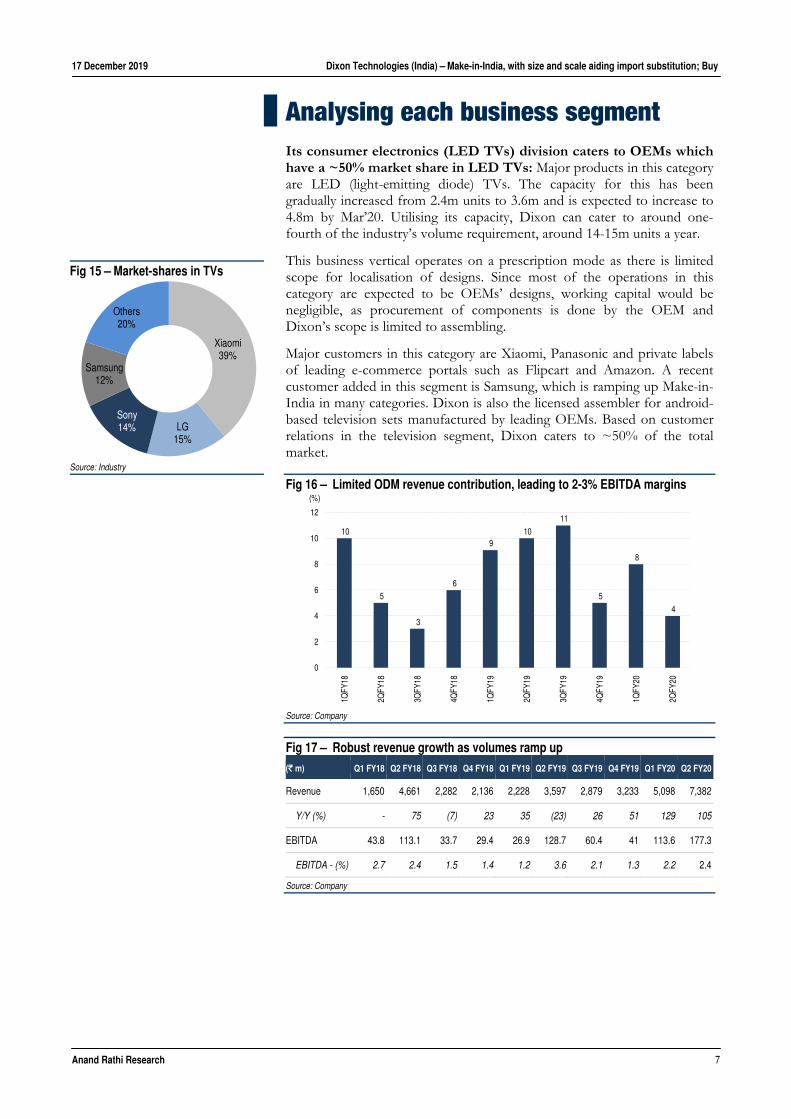
Analysing each business segment Its consumer electronics (LED TVs) division caters to OEMs which have a ~50% market share in LED TVs: Major products in this category are LED (light-emitting diode) TVs. The capacity for this has been gradually increased from 2.4m units to 3.6m and is expected to increase to 4.8m by Mar’20. Utilising its capacity, Dixon can cater to around one-fourth of the industry’s volume requirement, around 14-15m units a year.
This business vertical operates on a prescription mode as there is limited scope for localisation of designs. Since most of the operations in this category are expected to be OEMs’ designs, working capital would be negligible, as procurement of components is done by the OEM and Dixon’s scope is limited to assembling.
Major customers in this category are Xiaomi, Panasonic and private labels of leading e-commerce portals such as Flipcart and Amazon. A recent customer added in this segment is Samsung, which is ramping up Make-in-India in many categories. Dixon is also the licensed assembler for android-based television sets manufactured by leading OEMs. Based on customer relations in the television segment, Dixon caters to ~50% of the total market.
Fig 16 – Limited ODM revenue contribution, leading to 2-3% EBITDA margins
Source: Company
Fig 17 – Robust revenue growth as volumes ramp up (` m) Q1 FY18 Q2 FY18 Q3 FY18 Q4 FY18 Q1 FY19 Q2 FY19 Q3 FY19 Q4 FY19 Q1 FY20 Q2 FY20
Revenue 1,650 4,661 2,282 2,136 2,228 3,597 2,879 3,233 5,098 7,382
Y/Y (%) - 75 (7) 23 35 (23) 26 51 129 105
EBITDA 43.8 113.1 33.7 29.4 26.9 128.7 60.4 41 113.6 177.3
EBITDA - (%) 2.7 2.4 1.5 1.4 1.2 3.6 2.1 1.3 2.2 2.4
Source: Company
10
5
3
6
9 10
11
5
8
4
0
2
4
6
8
10
12
1QFY
18
2QFY
18
3QFY
18
4QFY
18
1QFY
19
2QFY
19
3QFY
19
4QFY
19
1QFY
20
2QFY
20
(%)
Fig 15 – Market-shares in TVs
Source: Industry
Xiaomi39%
LG 15%
Sony14%
Samsung12%
Others20%
17 December 2019 Dixon Technologies (India) – Make-in-India, with size and scale aiding import substitution; Buy
Anand Rathi Research 8
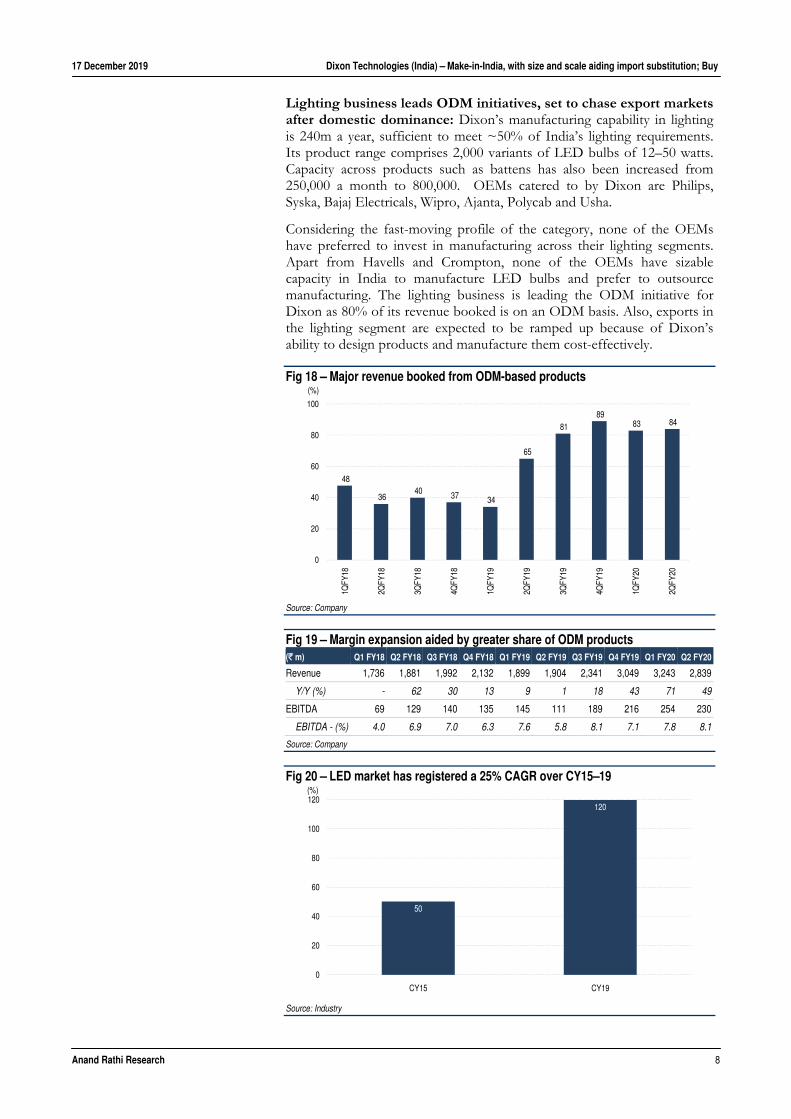
Lighting business leads ODM initiatives, set to chase export markets after domestic dominance: Dixon’s manufacturing capability in lighting is 240m a year, sufficient to meet ~50% of India’s lighting requirements. Its product range comprises 2,000 variants of LED bulbs of 12–50 watts. Capacity across products such as battens has also been increased from 250,000 a month to 800,000. OEMs catered to by Dixon are Philips, Syska, Bajaj Electricals, Wipro, Ajanta, Polycab and Usha.
Considering the fast-moving profile of the category, none of the OEMs have preferred to invest in manufacturing across their lighting segments. Apart from Havells and Crompton, none of the OEMs have sizable capacity in India to manufacture LED bulbs and prefer to outsource manufacturing. The lighting business is leading the ODM initiative for Dixon as 80% of its revenue booked is on an ODM basis. Also, exports in the lighting segment are expected to be ramped up because of Dixon’s ability to design products and manufacture them cost-effectively.
Fig 18 – Major revenue booked from ODM-based products
Source: Company
Fig 19 – Margin expansion aided by greater share of ODM products (` m) Q1 FY18 Q2 FY18 Q3 FY18 Q4 FY18 Q1 FY19 Q2 FY19 Q3 FY19 Q4 FY19 Q1 FY20 Q2 FY20
Revenue 1,736 1,881 1,992 2,132 1,899 1,904 2,341 3,049 3,243 2,839
Y/Y (%) - 62 30 13 9 1 18 43 71 49
EBITDA 69 129 140 135 145 111 189 216 254 230
EBITDA - (%) 4.0 6.9 7.0 6.3 7.6 5.8 8.1 7.1 7.8 8.1
Source: Company
Fig 20 – LED market has registered a 25% CAGR over CY15–19
Source: Industry
48
36 40 37 34
65
81 89
83 84
0
20
40
60
80
100
1QFY
18
2QFY
18
3QFY
18
4QFY
18
1QFY
19
2QFY
19
3QFY
19
4QFY
19
1QFY
20
2QFY
20
(%)
50
120
0
20
40
60
80
100
120
CY15 CY19
(%)

17 December 2019 Dixon Technologies (India) – Make-in-India, with size and scale aiding import substitution; Buy
Anand Rathi Research 9
OEMs’ preference for large contract-manufacturers for LEDs than for small ones is conducive to safety issues. According to an AC Nelson survey, 50% of the LEDs sold in India are unsafe and non-compliant. This can be attributed to the ~200 LED manufacturers in India, most small and medium enterprises. Increased tendering for LEDs by EESL over FY16–19 can be attributed to that. With EESL tendering for LEDs slowing down and OEMs preferring to outsource manufacturing to reputed manufacturers with a technological edge and balance sheet capabilities, the change is gradually working in Dixon’s favour.
Scaling up the value chain while operating completely on an ODM basis, customer addition to further support volume ramp-up in home appliances: Unlike other business segments, home-appliances comprises assembly of washing machines, and has consistently operated 100% on an ODM basis since Q1 FY18. Currently, Samsung, Panasonic, Godrej and Lloyd are the major customers in this segment.
Based on customer relations, Dixon caters to ~30% of the Indian washing-machine market. It has installed capacity for 1.2m units a year in this segment. It has the widest product range, from 6kg to 8.5kg with 140-odd models and plans to enter 10kg washing machines by early next year. Exports can also be a new growth lever in this category in coming years.
Fig 21 – Operates solely on ODM basis (` m) Q1 FY18 Q2 FY18 Q3 FY18 Q4 FY18 Q1 FY19 Q2 FY19 Q3 FY19 Q4 FY19 Q1 FY20 Q2 FY20
Revenue 394 581 698 810 857 1038 923 926 988 1391
Y/Y (%) - (3) 55 92 118 79 32 14 15 34
EBITDA 47 68 84 110 92 85 99 95 107 164
EBITDA - (%) 11.9 11.7 12.0 13.6 10.7 8.1 10.8 10.2 10.8 11.8
Source: Company
Fig 22 – Market-shares of leading OEMs in washing machines
Source: Industry
Samsung to drive growth in mobile phones; overall operations expected to be in an OEM mode: Dixon is one of the largest assembler of mobile phones in India, accounting for ~7-8% of India’s requirements. Major OEMs serviced in this segment are Panasonic, Micromax and Gionee. Samsung, which has a 25% market share in domestic mobile phones is the recent customer in this category and is expected to be a major customer from the medium-term perspective. Considering the limited scope of technological development for a contract manufacturer, this business is expected to operate on an OEM-based model, which should keep EBITDA margins in a tight range.
LG37%
Whirlpool16%
Samsung20%
Godrej10%
IFB8%
Others9%
17 December 2019 Dixon Technologies (India) – Make-in-India, with size and scale aiding import substitution; Buy
Anand Rathi Research 10
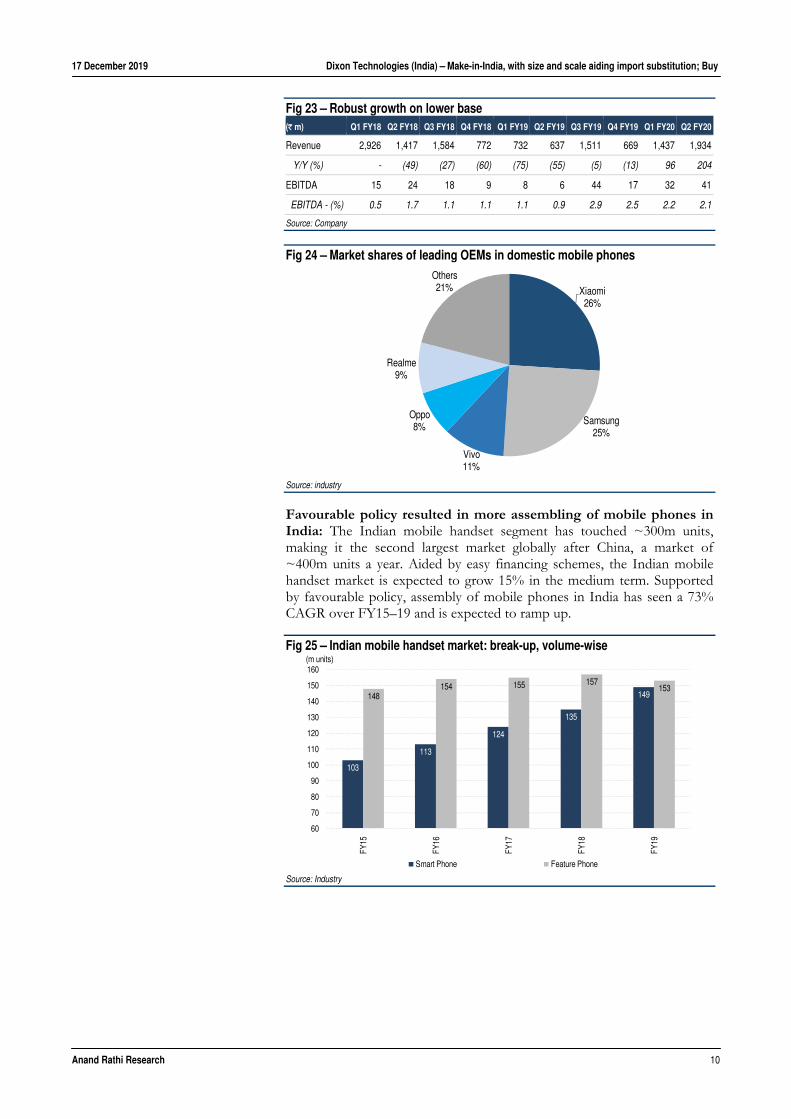
Fig 23 – Robust growth on lower base (` m) Q1 FY18 Q2 FY18 Q3 FY18 Q4 FY18 Q1 FY19 Q2 FY19 Q3 FY19 Q4 FY19 Q1 FY20 Q2 FY20
Revenue 2,926 1,417 1,584 772 732 637 1,511 669 1,437 1,934
Y/Y (%) - (49) (27) (60) (75) (55) (5) (13) 96 204
EBITDA 15 24 18 9 8 6 44 17 32 41
EBITDA - (%) 0.5 1.7 1.1 1.1 1.1 0.9 2.9 2.5 2.2 2.1
Source: Company
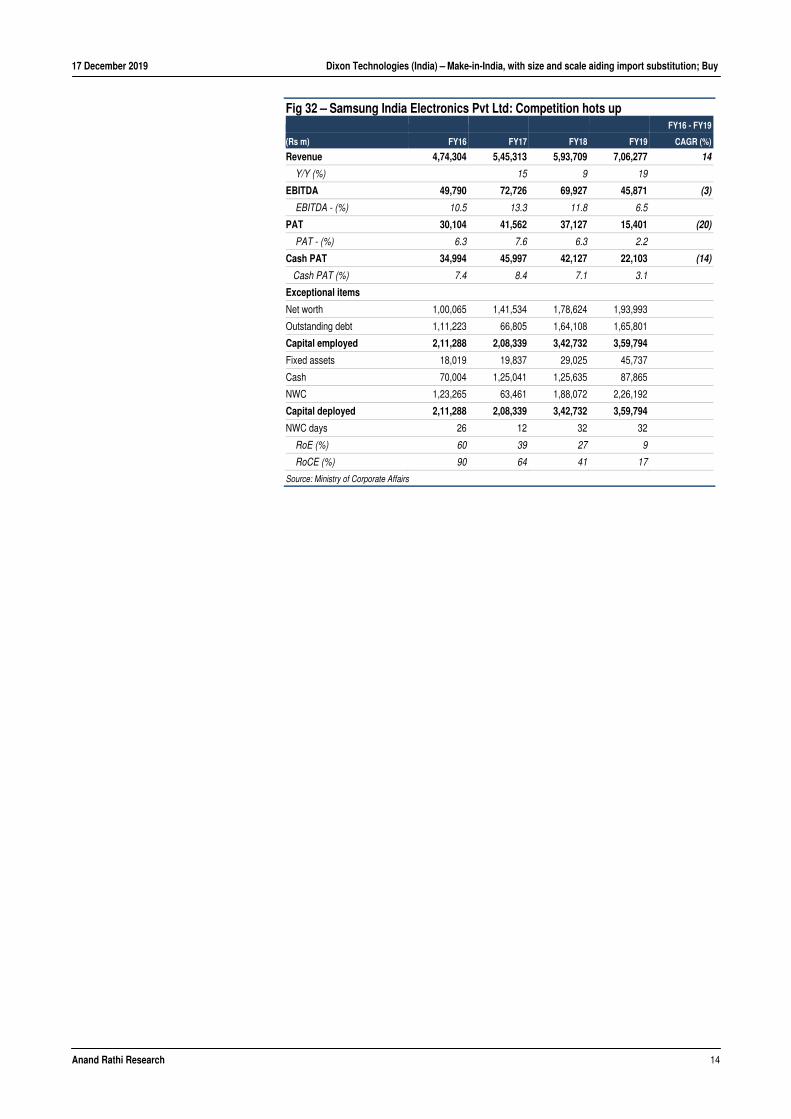
Fig 24 – Market shares of leading OEMs in domestic mobile phones
Source: industry
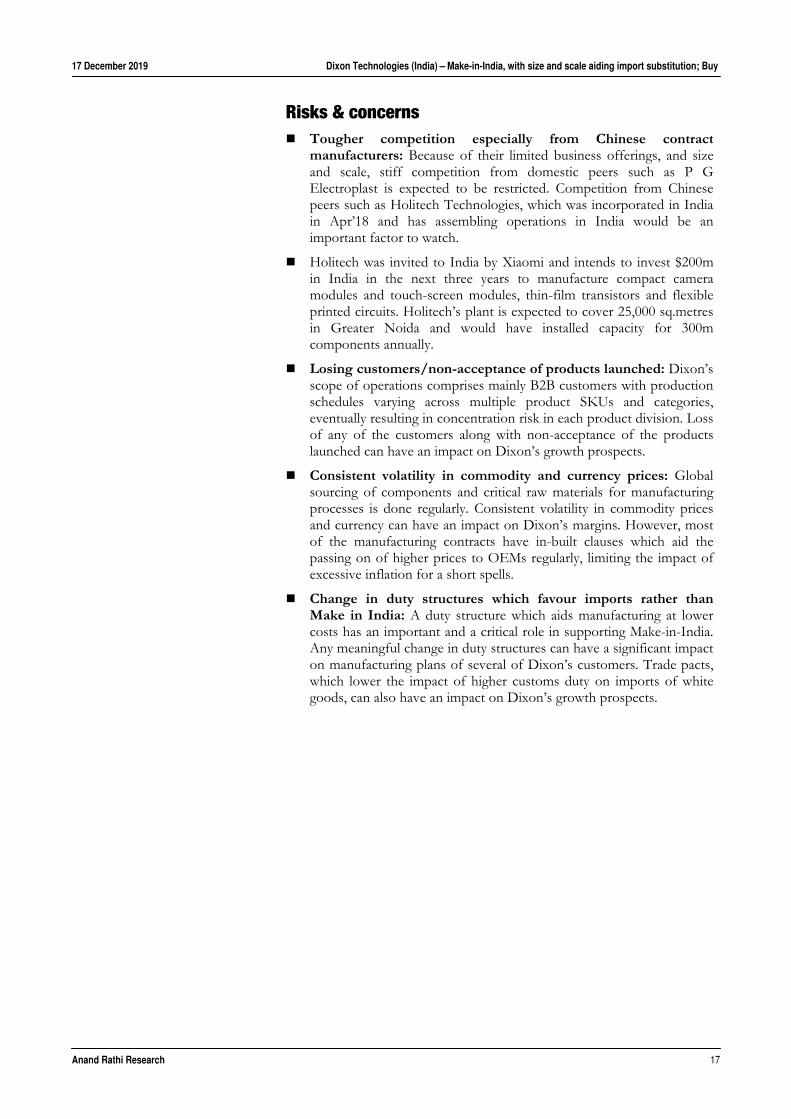
Favourable policy resulted in more assembling of mobile phones in India: The Indian mobile handset segment has touched ~300m units, making it the second largest market globally after China, a market of ~400m units a year. Aided by easy financing schemes, the Indian mobile handset market is expected to grow 15% in the medium term. Supported by favourable policy, assembly of mobile phones in India has seen a 73% CAGR over FY15–19 and is expected to ramp up.
Fig 25 – Indian mobile handset market: break-up, volume-wise
Source: Industry
Xiaomi26%
Samsung25%
Vivo11%
Oppo8%
Realme9%
Others21%
103
113
124
135
149148154 155 157
153
60
70
80
90
100
110
120
130
140
150
160
FY15
FY16
FY17
FY18
FY19
(m units)
Smart Phone Feature Phone

17 December 2019 Dixon Technologies (India) – Make-in-India, with size and scale aiding import substitution; Buy
Anand Rathi Research 11
Fig 26 – Systematic customs duty increase resulted in more assembling of mobile phones in India Year Customs duty (%) Initiatives undertaken
FY17 15 Applicable on (a) chargers / adapters (b) battery packs (c) wired handsets
FY18 15 Applicable on (a) mechanics (b) die-cut parts (c) microphones and receivers (d) keypads (e) USB cables
FY19 10 Applicable on (a) printed circuit-board assembling (b) camera module (c) connectors
FY20 10 Applicable on (a) display assembling (b) touch panels / cover-glass assembling (c) vibrators / ringers
Source: Ministry of Information Technology and Electronics
Fig 27 – Manufacture of mobile phones has seen a 73% CAGR between FY15-19
Source: Ministry of Information technology and electronics
Security surveillance segment to report high growth on lower base: Dixon has installed capacity to manufacture 600,000 cameras and 150,000 DVRs. Manufacturing operations are under a JV with AIL-Dixon Technologies Pvt. Ltd. Security systems are marketed under the trademark CP PLUS. The security surveillance segment is a business with high entry barriers, with competition from Zicom Electronic Security, Dahua Technology of China, Samsung, Sony, Vitron Infromatic Pvt. Ltd., Bosch, Honeywell, Panasonic, etc. Overall, CCTVs are expected to grow ~12% with demand drivers expected to be mainly from tier-II, -III and -IV towns.
Fig 28 – Favourably placed in a high-growth market (` m) Q4 FY18 Q1 FY19 Q2 FY19 Q3 FY19 Q4 FY19 Q1 FY20 Q2 FY20
Revenue 5 67 111 254 687 679 435
Y/Y (%) 911 292
EBITDA -4 -5 -1 1 16 20 11
EBITDA - (%) (3.4) (4.5) 1.2 (8.2) (35.7) (4.6) 18.8
Source: Company
189
540
900
1,320
1,700
0
200
400
600
800
1,000
1,200
1,400
1,600
1,800
FY15
FY16
FY17
FY18
FY19
(` bn)
Mobile phones

17 December 2019 Dixon Technologies (India) – Make-in-India, with size and scale aiding import substitution; Buy
Anand Rathi Research 12
Financials of OEMs catered Fig 29 – Xiaomi India Pvt Ltd: Infuses capital to strengthen Blitzkreig
CAGR (%)
(` m) FY15 FY16 FY17 FY18 FY19 FY16 - FY19
Mobile phones and accessories 9,346 82,556 2,24,179 3,14,506 223
IoT & lifestyle products 3,539 34,123
Spare-parts sales - 240 943 2,634
Services income 113 1,116 548 689 1,496 10
Other operating income - - - 123 265
Revenue 113 10,462 83,344 2,29,473 3,53,022 223
Y/Y (%) 9,171 697 175 54
EBITDA 19 (470) 1,903 3,409 (25,513) 279
EBITDA - (%) 16.7 (4.5) 2.3 1.5 (7.2)
PAT 12 (469) 1,639 2,932 (1,485) 47
PAT - (%) 10.7 (4.5) 2.0 1.3 (0.4)
Cash PAT 12 (467) 1,665 2,982 (1,313) 41
Cash PAT - (%) 10.7 (4.5) 2.0 1.3 (0.4)Exceptional items - Reward given by Xiaomi HK
22,274
Net worth 18 (451) 1,187 4,119 37,831
Outstanding debt - - - - 10,000
Capital employed 18 (451) 1,187 4,119 47,831
Fixed assets 1 19 88 513 618
Cash 39 547 15,875 19,646 7,751
NWC (21) (1,018) (14,776) (16,039) 39,462
Capital deployed 18 (451) 1,187 4,119 47,831
NWC days (68) (35) (65) (26) 41
RoE (%) - 217 445 111 (7)
RoCE (%) - 217 624 169 (8)
Source: Ministry of Corporate Affairs
Fig 30 – Panasonic India Pvt Ltd: Widening losses, a concern CAGR (%)
(` m) FY15 FY16 FY17 FY18 FY19 FY16 - FY19
Revenue 39,673 47,989 55,454 53,209 47,586 (0)
Y/Y (%) 21 16 (4) (11)
EBITDA (133) 210 1,336 (561) (3,566) (357)
EBITDA - (%) (0.3) 0.4 2.4 (1.1) (7.5)
PAT (960) (420) 722 (1,319) (4,596) 122
PAT - (%) (2.4) (0.9) 1.3 (2.5) (9.7)
Cash PAT (407) 188 1,315 (688) (3,906) (375)
Cash PAT - (%) (1.0) 0.4 2.4 (1.3) (8.2)
Exceptional items
Net worth 7,325 6,910 8,592 7,628 3,025
Outstanding debt 17 42 58 3,254 5,848
Capital employed 7,342 6,952 8,650 10,882 8,872
Fixed assets 3,803 3,608 3,622 4,331 4,117
Cash 1,552 1,413 2,458 533 481
NWC 1,986 1,931 2,571 6,018 4,275
Capital deployed 7,342 6,952 8,650 10,882 8,872
NWC days 18 15 17 41 33
RoE (%) - (6) 9 (16) (86)
RoCE (%) - (6) 9 (14) (47)
Source: Ministry of Corporate Affairs

17 December 2019 Dixon Technologies (India) – Make-in-India, with size and scale aiding import substitution; Buy
Anand Rathi Research 13
Fig 31 – Godrej & Boyce: Struggling to generate single-digit returns (` m) FY15 FY16 FY17 FY18 FY19 Y/Y (%)
% of total revenues
Appliances 35 36
Furniture 22 20
Electronics and Electricals 7 8
Storage & warehousing 6 6
Locks 6 6
Others 24 23
Actual revenue
Appliances 33,975 39,399 16
Furniture 21,523 22,578 5
Electronics and Electricals 6,534 8,642 32
Storage & warehousing 6,162 7,073 15
Locks 5,966 6,896 16
Others 23,806 25,927 9
Revenue (SL) 82,398.3 92,965.8 98,103.6 97,967.6 1,10,515.5
Y/Y (%) 13 6 (0) 13
EBITDA 5,654 6,634 6,609 7,746 7,395
EBITDA - (%) 6.9 7.1 6.7 7.9 6.7
PAT 1,985 3,631 (215) 2,320 2,293
PAT - (%) 2.4 3.9 (0.2) 2.4 2.1
Cash PAT 3,644 5,207 1,572 4,334 4,449
Cash PAT - (%) 4.4 5.6 1.6 4.4 4.0
Exceptional items - 775 (2,424) (359) -
Net worth 35,297 34,905 76,999 93,923 92,065
Outstanding debt 18,079 24,024 23,111 22,239 25,119
Capital employed 53,377 58,929 1,00,110 1,16,162 1,17,183
Fixed assets 17,799 20,746 25,318 27,977 31,914
Non-current investments 14,128 16,307 53,698 65,706 61,891
Cash 698 821 1,079 4,112 3,743
NWC 20,751 21,055 20,014 18,368 19,636
Capital deployed 53,377 58,929 1,00,110 1,16,162 1,17,183
NWC days 92 83 74 68 65
RoE (%) 11 10 (0) 3 2
RoCE (%) 10 7 1 3 3
Source: Ministry of Corporate Affairs
17 December 2019 Dixon Technologies (India) – Make-in-India, with size and scale aiding import substitution; Buy
Anand Rathi Research 14
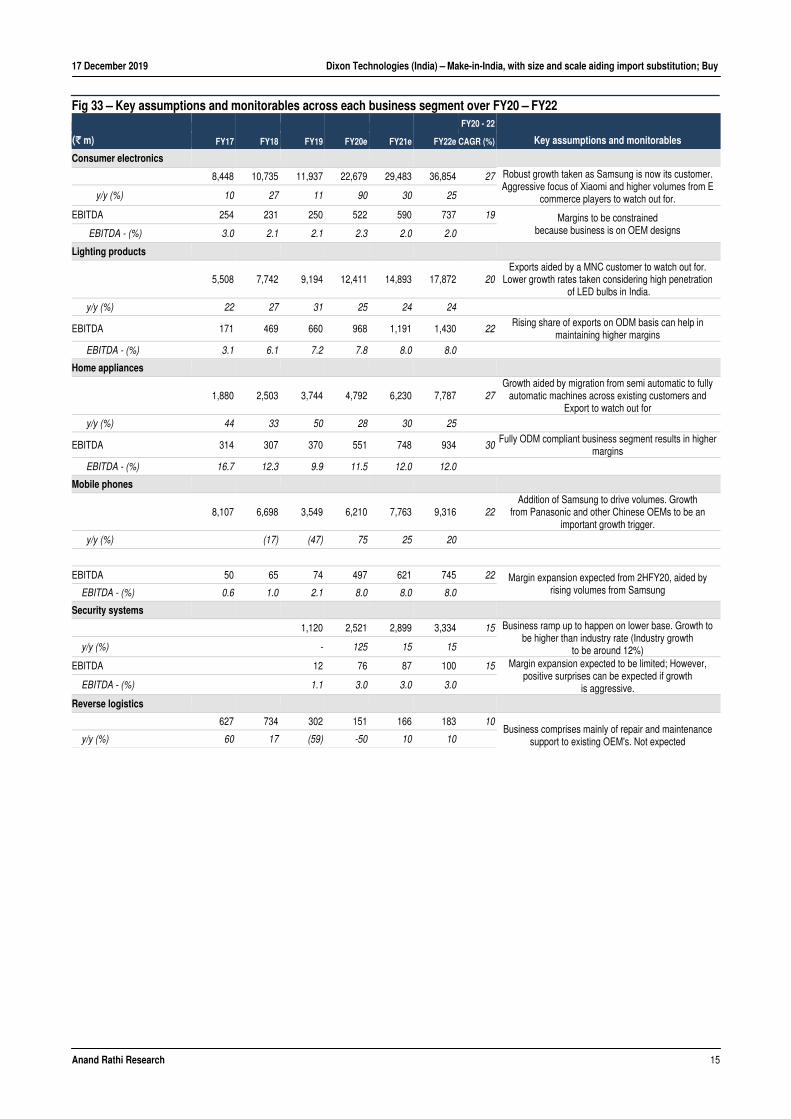
Fig 32 – Samsung India Electronics Pvt Ltd: Competition hots up FY16 - FY19
(Rs m) FY16 FY17 FY18 FY19 CAGR (%)
Revenue 4,74,304 5,45,313 5,93,709 7,06,277 14
Y/Y (%) 15 9 19
EBITDA 49,790 72,726 69,927 45,871 (3)
EBITDA - (%) 10.5 13.3 11.8 6.5
PAT 30,104 41,562 37,127 15,401 (20)
PAT - (%) 6.3 7.6 6.3 2.2
Cash PAT 34,994 45,997 42,127 22,103 (14)
Cash PAT (%) 7.4 8.4 7.1 3.1
Exceptional items
Net worth 1,00,065 1,41,534 1,78,624 1,93,993
Outstanding debt 1,11,223 66,805 1,64,108 1,65,801
Capital employed 2,11,288 2,08,339 3,42,732 3,59,794
Fixed assets 18,019 19,837 29,025 45,737
Cash 70,004 1,25,041 1,25,635 87,865
NWC 1,23,265 63,461 1,88,072 2,26,192
Capital deployed 2,11,288 2,08,339 3,42,732 3,59,794
NWC days 26 12 32 32
RoE (%) 60 39 27 9
RoCE (%) 90 64 41 17
Source: Ministry of Corporate Affairs
17 December 2019 Dixon Technologies (India) – Make-in-India, with size and scale aiding import substitution; Buy
Anand Rathi Research 15
Fig 33 – Key assumptions and monitorables across each business segment over FY20 – FY22 FY20 - 22
(` m) FY17 FY18 FY19 FY20e FY21e FY22e CAGR (%) Key assumptions and monitorables
Consumer electronics
8,448 10,735 11,937 22,679 29,483 36,854 27 Robust growth taken as Samsung is now its customer. Aggressive focus of Xiaomi and higher volumes from E
commerce players to watch out for. y/y (%) 10 27 11 90 30 25
EBITDA 254 231 250 522 590 737 19 Margins to be constrained because business is on OEM designs EBITDA - (%) 3.0 2.1 2.1 2.3 2.0 2.0
Lighting products
5,508 7,742 9,194 12,411 14,893 17,872 20
Exports aided by a MNC customer to watch out for. Lower growth rates taken considering high penetration
of LED bulbs in India.
y/y (%) 22 27 31 25 24 24
EBITDA 171 469 660 968 1,191 1,430 22Rising share of exports on ODM basis can help in
maintaining higher margins EBITDA - (%) 3.1 6.1 7.2 7.8 8.0 8.0
Home appliances
1,880 2,503 3,744 4,792 6,230 7,787 27
Growth aided by migration from semi automatic to fully automatic machines across existing customers and
Export to watch out for y/y (%) 44 33 50 28 30 25
EBITDA 314 307 370 551 748 934 30Fully ODM compliant business segment results in higher
margins
EBITDA - (%) 16.7 12.3 9.9 11.5 12.0 12.0
Mobile phones
8,107 6,698 3,549 6,210 7,763 9,316 22
Addition of Samsung to drive volumes. Growth from Panasonic and other Chinese OEMs to be an
important growth trigger. y/y (%) (17) (47) 75 25 20
EBITDA 50 65 74 497 621 745 22 Margin expansion expected from 2HFY20, aided by rising volumes from Samsung EBITDA - (%) 0.6 1.0 2.1 8.0 8.0 8.0
Security systems
1,120 2,521 2,899 3,334 15 Business ramp up to happen on lower base. Growth to be higher than industry rate (Industry growth
to be around 12%) y/y (%) - 125 15 15
EBITDA 12 76 87 100 15 Margin expansion expected to be limited; However, positive surprises can be expected if growth
is aggressive. EBITDA - (%) 1.1 3.0 3.0 3.0
Reverse logistics
627 734 302 151 166 183 10Business comprises mainly of repair and maintenance
support to existing OEM's. Not expected y/y (%) 60 17 (59) -50 10 10

17 December 2019 Dixon Technologies (India) – Make-in-India, with size and scale aiding import substitution; Buy
Anand Rathi Research 16
Valuations We initiate coverage on Dixon Technologies, with a Buy recommendation and a target of `5,822 (25x FY22e EPS of `233) as we model 24% and 32% CAGRs over FY20-FY22 in respectively revenue and PAT, resulting in the RoCE expanding from 26% in FY19 to ~36% in FY21 and FY22.
Key monitorables ahead would be Dixon’s ability to maintain relations with its OEMs and in securing new OEMs, especially MNC brands which do not have manufacturing facilities in India. Expansion across new product categories and the capital investments needed would also be important monitorables, as they can have an impact on return ratios.
The huge rise in competition from global contract manufacturers such as Foxcon and Holitech Technolgies is the key risk. However, OEMs’ preference to keep the vendor base diversified lowers this risk for Dixon.
Fig 34 – Return ratios to ramp up between FY20-22
Source: Company, Anand Rathi Research
Fig 35 – SD band
Source: Bloomberg
31
24
18
33 32 31
38
34
27
37 35
37
15
20
25
30
35
40
FY17
FY18
FY19
FY20
e
FY21
e
FY22
e
(%)
RoE RoCE
Mean
+1SD
+2SD
-1SD
-2SD-10.0
0.0
10.0
20.0
30.0
40.0
50.0
60.0
70.0
80.0
90.0
Sep-
17
Nov
-17
Dec
-17
Jan-
18
Mar
-18
May
-18
Jun-
18
Jul-1
8
Sep-
18
Oct
-18
Dec
-18
Jan-
19
Mar
-19
Apr-1
9
Jun-
19
Jul-1
9
Sep-
19
Oct
-19
Dec
-19
17 December 2019 Dixon Technologies (India) – Make-in-India, with size and scale aiding import substitution; Buy
Anand Rathi Research 17
Risks & concerns Tougher competition especially from Chinese contract
manufacturers: Because of their limited business offerings, and size and scale, stiff competition from domestic peers such as P G Electroplast is expected to be restricted. Competition from Chinese peers such as Holitech Technologies, which was incorporated in India in Apr’18 and has assembling operations in India would be an important factor to watch.
Holitech was invited to India by Xiaomi and intends to invest $200m in India in the next three years to manufacture compact camera modules and touch-screen modules, thin-film transistors and flexible printed circuits. Holitech’s plant is expected to cover 25,000 sq.metres in Greater Noida and would have installed capacity for 300m components annually.
Losing customers/non-acceptance of products launched: Dixon’s scope of operations comprises mainly B2B customers with production schedules varying across multiple product SKUs and categories, eventually resulting in concentration risk in each product division. Loss of any of the customers along with non-acceptance of the products launched can have an impact on Dixon’s growth prospects.
Consistent volatility in commodity and currency prices: Global sourcing of components and critical raw materials for manufacturing processes is done regularly. Consistent volatility in commodity prices and currency can have an impact on Dixon’s margins. However, most of the manufacturing contracts have in-built clauses which aid the passing on of higher prices to OEMs regularly, limiting the impact of excessive inflation for a short spells.
Change in duty structures which favour imports rather than Make in India: A duty structure which aids manufacturing at lower costs has an important and a critical role in supporting Make-in-India. Any meaningful change in duty structures can have a significant impact on manufacturing plans of several of Dixon’s customers. Trade pacts, which lower the impact of higher customs duty on imports of white goods, can also have an impact on Dixon’s growth prospects.
17 December 2019 Dixon Technologies (India) – Make-in-India, with size and scale aiding import substitution; Buy
Anand Rathi Research 18
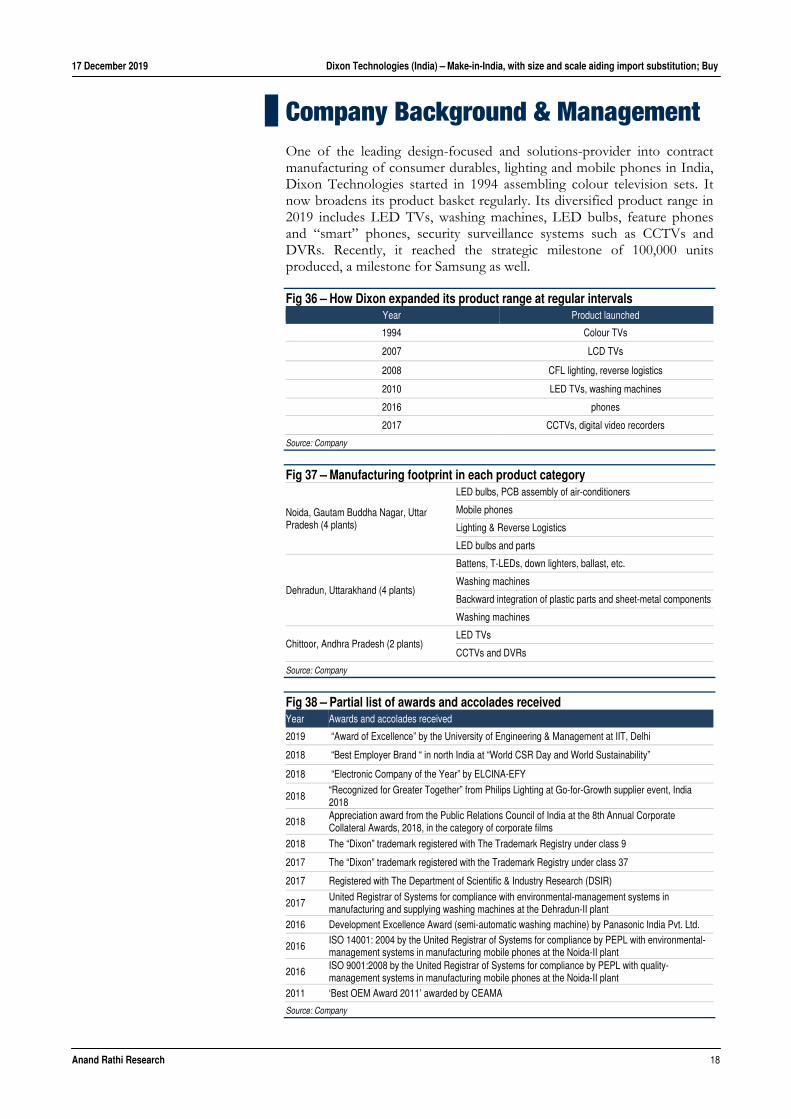
Company Background & Management One of the leading design-focused and solutions-provider into contract manufacturing of consumer durables, lighting and mobile phones in India, Dixon Technologies started in 1994 assembling colour television sets. It now broadens its product basket regularly. Its diversified product range in 2019 includes LED TVs, washing machines, LED bulbs, feature phones and “smart” phones, security surveillance systems such as CCTVs and DVRs. Recently, it reached the strategic milestone of 100,000 units produced, a milestone for Samsung as well.
Fig 36 – How Dixon expanded its product range at regular intervals Year Product launched
1994 Colour TVs
2007 LCD TVs
2008 CFL lighting, reverse logistics
2010 LED TVs, washing machines
2016 phones
2017 CCTVs, digital video recorders
Source: Company
Fig 37 – Manufacturing footprint in each product category
Noida, Gautam Buddha Nagar, Uttar Pradesh (4 plants)
LED bulbs, PCB assembly of air-conditioners
Mobile phones
Lighting & Reverse Logistics
LED bulbs and parts
Dehradun, Uttarakhand (4 plants)
Battens, T-LEDs, down lighters, ballast, etc.
Washing machines
Backward integration of plastic parts and sheet-metal components
Washing machines
Chittoor, Andhra Pradesh (2 plants) LED TVs
CCTVs and DVRs
Source: Company
Fig 38 – Partial list of awards and accolades received Year Awards and accolades received
2019 “Award of Excellence” by the University of Engineering & Management at IIT, Delhi
2018 “Best Employer Brand “ in north India at “World CSR Day and World Sustainability”
2018 “Electronic Company of the Year” by ELCINA-EFY
2018 “Recognized for Greater Together” from Philips Lighting at Go-for-Growth supplier event, India 2018
2018 Appreciation award from the Public Relations Council of India at the 8th Annual Corporate Collateral Awards, 2018, in the category of corporate films
2018 The “Dixon” trademark registered with The Trademark Registry under class 9
2017 The “Dixon” trademark registered with the Trademark Registry under class 37
2017 Registered with The Department of Scientific & Industry Research (DSIR)
2017 United Registrar of Systems for compliance with environmental-management systems in manufacturing and supplying washing machines at the Dehradun-II plant
2016 Development Excellence Award (semi-automatic washing machine) by Panasonic India Pvt. Ltd.
2016 ISO 14001: 2004 by the United Registrar of Systems for compliance by PEPL with environmental- management systems in manufacturing mobile phones at the Noida-II plant
2016 ISO 9001:2008 by the United Registrar of Systems for compliance by PEPL with quality- management systems in manufacturing mobile phones at the Noida-II plant
2011 ‘Best OEM Award 2011’ awarded by CEAMA
Source: Company
17 December 2019 Dixon Technologies (India) – Make-in-India, with size and scale aiding import substitution; Buy
Anand Rathi Research 19
Management team Executive Chairman Sunil Vachani with a degree from the American College in London has over two decades’ experience in EMS and was given the “Man of Electronics Award” by CEAMA in 2015, the “Outstanding Citizen Award 2012” by the Sindhi Chamber of Commerce and one of the “Top-100 people influencing EMS” in 2012 by VentureOutsource.com. He was chairman of The Electronics and Computer Software Export Promotion Council of India and co-chair of the CII ICTE Committee.
Managing Director Atull B Lall has a master’s in management studies from The Birla Institute of Technology and Science, Pilani, and has been associated with Dixon since inception. With more than 25 years’ experience in EMS, he has been a member of The Technical Evaluation Committee for Electronic Manufacturing Services under M-SIPS (Electronic Manufacturing Services-EMS) constituted by the DeitY and was a representative of ELCINA on The Committee for Reliability of Electronic and Electrical Components and Equipment (LITD. 02) of the BIS.
CFO Saurabh Gupta has more than 14 years’ experience in corporate finance, strategic planning and investor relations. Formerly employed with PVR, Unitech and Mckinsey, he has an MBA (Executive Programme) from MDI, Gurgaon. He is also an associate member of the ICSI and ICAI. He leads the finance and accounts team and is responsible for all activities pertaining to accounts, Treasury management and MIS. He heads the strategic-planning and investor-relations functions.
Non-executive independent director Manoj Maheshwari is a fellow of The Institute of Chartered Accountants of India and an associate of The Institute of Company Secretaries of India, with 29 years’ experience in finance, including M&A, capital expenditure and fund-raising (both debt and equity). He has, besides, a post-graduate diploma in business administration from The Symbiosis Centre for Distance Learning.
Non-executive independent director Poornima Shenoy is a serial entrepreneur, an industry veteran and the co-founder and CEO of a tech accelerator, The Gain. She is the founding president of The Indian Electronics and Semiconductor Association (IESA) and on its executive council. She is a TiE charter member.
Non-executive independent director Dr Manuji Zarabi has a Ph.D. from the Indian Institute of Science, Bangalore. For 26 years he was associated with Semiconductor Complex, a government of India enterprise and retired as CMD in Aug’05. He was member of the working group on development of R&D and IP in electronics, formed at DeitY.
Non-executive independent director Keng Tsung Kuo has over 30 years’ extensive experience in business and globalisation strategy, change management and leadership & management. He has a Master’s in Electrical Engineering from The National Taiwan University and an Executive MBA from the National Taiwan University. He is a committee member of the Asia-Pacific Industrial Cooperation and Chinese National Industry Federation. He also served as an adjunct professor at The National Taiwan University. At present, he is an “Advisor” to key institutions in Taiwan such as the Industry Development Bureau - MOEA, Hsinchu Science Park Bureau - MOST and the Taiwan-India Business Association.

Appendix Analyst Certification The views expressed in this Research Report accurately reflect the personal views of the analyst(s) about the subject securities or issuers and no part of the compensation of the research analyst(s) was, is, or will be directly or indirectly related to the specific recommendations or views expressed by the research analyst(s) in this report. The research analysts are bound by stringent internal regulations and also legal and statutory requirements of the Securities and Exchange Board of India (hereinafter “SEBI”) and the analysts’ compensation are completely delinked from all the other companies and/or entities of Anand Rathi, and have no bearing whatsoever on any recommendation that they have given in the Research Report. Anand Rathi Ratings Definitions
Analysts’ ratings and the corresponding expected returns take into account our definitions of Large Caps (>US$1bn) and Mid/Small Caps (<US$1bn) as described in the Ratings Table below:
Ratings Guide (12 months) Buy Hold Sell Large Caps (>US$1bn) >15% 5-15% <5% Mid/Small Caps (<US$1bn) >25% 5-25% <5% Research Disclaimer and Disclosure inter-alia as required under Securities and Exchange Board of India (Research Analysts) Regulations, 2014
Anand Rathi Share and Stock Brokers Ltd. (hereinafter refer as ARSSBL) (Research Entity) is a subsidiary of Anand Rathi Financial Services Ltd. ARSSBL is a corporate trading and clearing member of Bombay Stock Exchange Ltd, National Stock Exchange of India Ltd. (NSEIL), Multi Stock Exchange of India Ltd (MCX-SX) and also depository participant with National Securities Depository Ltd (NSDL) and Central Depository Services Ltd. ARSSBL is engaged in the business of Stock Broking, Depository Participant and Mutual Fund distributor.
The research analysts, strategists, or research associates principally responsible for the preparation of Anand Rathi research have received compensation based upon various factors, including quality of research, investor client feedback, stock picking, competitive factors and firm revenues.
General Disclaimer: This Research Report (hereinafter called “Report”) is meant solely for use by the recipient and is not for circulation. This Report does not constitute a personal recommendation or take into account the particular investment objectives, financial situations, or needs of individual clients. The recommendations, if any, made herein are expression of views and/or opinions and should not be deemed or construed to be neither advice for the purpose of purchase or sale of any security, derivatives or any other security through ARSSBL nor any solicitation or offering of any investment /trading opportunity on behalf of the issuer(s) of the respective security (ies) referred to herein. These information / opinions / views are not meant to serve as a professional investment guide for the readers. No action is solicited based upon the information provided herein. Recipients of this Report should rely on information/data arising out of their own investigations. Readers are advised to seek independent professional advice and arrive at an informed trading/investment decision before executing any trades or making any investments. This Report has been prepared on the basis of publicly available information, internally developed data and other sources believed by ARSSBL to be reliable. ARSSBL or its directors, employees, affiliates or representatives do not assume any responsibility for, or warrant the accuracy, completeness, adequacy and reliability of such information / opinions / views. While due care has been taken to ensure that the disclosures and opinions given are fair and reasonable, none of the directors, employees, affiliates or representatives of ARSSBL shall be liable for any direct, indirect, special, incidental, consequential, punitive or exemplary damages, including lost profits arising in any way whatsoever from the information / opinions / views contained in this Report. The price and value of the investments referred to in this Report and the income from them may go down as well as up, and investors may realize losses on any investments. Past performance is not a guide for future performance. ARSSBL does not provide tax advice to its clients, and all investors are strongly advised to consult with their tax advisers regarding taxation aspects of any potential investment.
Opinions expressed are our current opinions as of the date appearing on this Research only. We do not undertake to advise you as to any change of our views expressed in this Report. Research Report may differ between ARSSBL’s RAs and/ or ARSSBL’s associate companies on account of differences in research methodology, personal judgment and difference in time horizons for which recommendations are made. User should keep this risk in mind and not hold ARSSBL, its employees and associates responsible for any losses, damages of any type whatsoever.

ARSSBL and its associates or employees may; (a) from time to time, have long or short positions in, and buy or sell the investments in/ security of company (ies) mentioned herein or (b) be engaged in any other transaction involving such investments/ securities of company (ies) discussed herein or act as advisor or lender / borrower to such company (ies) these and other activities of ARSSBL and its associates or employees may not be construed as potential conflict of interest with respect to any recommendation and related information and opinions. Without limiting any of the foregoing, in no event shall ARSSBL and its associates or employees or any third party involved in, or related to computing or compiling the information have any liability for any damages of any kind.
Details of Associates of ARSSBL and Brief History of Disciplinary action by regulatory authorities & its associates are available on our website i.e. www.rathionline.com
Disclaimers in respect of jurisdiction: This report is not directed to, or intended for distribution to or use by, any person or entity who is a citizen or resident of or located in any locality, state, country or other jurisdiction where such distribution, publication, availability or use would be contrary to law or regulation or which would subject ARSSBL to any registration or licensing requirement within such jurisdiction(s). No action has been or will be taken by ARSSBL in any jurisdiction (other than India), where any action for such purpose(s) is required. Accordingly, this Report shall not be possessed, circulated and/or distributed in any such country or jurisdiction unless such action is in compliance with all applicable laws and regulations of such country or jurisdiction. ARSSBL requires such recipient to inform himself about and to observe any restrictions at his own expense, without any liability to ARSSBL. Any dispute arising out of this Report shall be subject to the exclusive jurisdiction of the Courts in India.
Statements on ownership and material conflicts of interest, compensation - ARSSBL and Associates
Answers to the Best of the knowledge and belief of ARSSBL/ its Associates/ Research Analyst who is preparing this report
Research analyst or research entity or his associate or his relative has any financial interest in the subject company and the nature of such financial interest. No
ARSSBL/its Associates/ Research Analyst/ his Relative have actual/beneficial ownership of one per cent or more securities of the subject company, at the end of the month immediately preceding the date of publication of the research report?
No
ARSSBL/its Associates/ Research Analyst/ his Relative have actual/beneficial ownership of one per cent or more securities of the subject company No
ARSSBL/its Associates/ Research Analyst/ his Relative have any other material conflict of interest at the time of publication of the research report? No
ARSSBL/its Associates/ Research Analyst/ his Relative have received any compensation from the subject company in the past twelve months No
ARSSBL/its Associates/ Research Analyst/ his Relative have managed or co-managed public offering of securities for the subject company in the past twelve months
No
ARSSBL/its Associates/ Research Analyst/ his Relative have received any compensation for investment banking or merchant banking or brokerage services from the subject company in the past twelve months
No
ARSSBL/its Associates/ Research Analyst/ his Relative have received any compensation for products or services other than investment banking or merchant banking or brokerage services from the subject company in the past twelve months
No
ARSSBL/its Associates/ Research Analyst/ his Relative have received any compensation or other benefits from the subject company or third party in connection with the research report
No
ARSSBL/its Associates/ Research Analyst/ his Relative have served as an officer, director or employee of the subject company. No
Other Disclosures pertaining to distribution of research in the United States of America
This research report is a product of ARSSBL, which is the employer of the research analyst(s) who has prepared the research report. The research analyst(s) preparing the research report is/are resident outside the United States (U.S.) and are not associated persons of any U.S. regulated broker-dealer and therefore the analyst(s) is/are not subject to supervision by a U.S. broker-dealer, and is/are not required to satisfy the regulatory licensing requirements of FINRA or required to otherwise comply with U.S. rules or regulations regarding, among other things, communications with a subject company, public appearances and trading securities held by a research analyst account.
This report is intended for distribution by ARSSBL only to "Major Institutional Investors" as defined by Rule 15a-6(b)(4) of the U.S. Securities and Exchange Act, 1934 (the Exchange Act) and interpretations thereof by U.S. Securities and Exchange Commission (SEC) in reliance on Rule 15a 6(a)(2). If the recipient of this report is not a Major Institutional Investor as specified above, then it should not act upon this report and return the same to the sender. Further, this report may not be copied, duplicated and/or transmitted onward to any U.S. person, which is not the Major Institutional Investor.
In reliance on the exemption from registration provided by Rule 15a-6 of the Exchange Act and interpretations thereof by the SEC in order to conduct certain business withMajor Institutional Investors, ARSSBL has entered into an agreement with a U.S. registered broker-dealer, Cabrera Capital Markets. ("Cabrera"). Transactions in securities discussed in this research report should be effected through Cabrera or another U.S. registered broker dealer.
1. ARSSBL or its Affiliates may or may not have been beneficial owners of the securities mentioned in this report.
2. ARSSBL or its affiliates may have or not managed or co-managed a public offering of the securities mentioned in the report in the past 12 months.
3. ARSSBL or its affiliates may have or not received compensation for investment banking services from the issuer of these securities in the past 12 months and do not expect to receive compensation for investment banking services from the issuer of these securities within the next three months.
4. However, one or more of ARSSBL or its Affiliates may, from time to time, have a long or short position in any of the securities mentioned herein and may buy or sell those securities or options thereon, either on their own account or on behalf of their clients.
5. As of the publication of this report, ARSSBL does not make a market in the subject securities.
6. ARSSBL or its Affiliates may or may not, to the extent permitted by law, act upon or use the above material or the conclusions stated above, or the research or analysis on which they are based before the material is published to recipients and from time to time, provide investment banking, investment management or other services for orsolicit to seek to obtain investment banking, or other securities business from, any entity referred to in this report.
© 2019. This report is strictly confidential and is being furnished to you solely for your information. All material presented in this report, unless specifically indicated otherwise, is under copyright to ARSSBL. None of the material, its content, or any copy of such material or content, may be altered in any way, transmitted, copied or reproduced (in whole or in part) or redistributed in any form to any other party, without the prior express written permission of ARSSBL. All trademarks, service marks and logos used in this report are trademarks or service marks or registered trademarks or service marks of ARSSBL or its affiliates, unless specifically mentioned otherwise.
Additional information on recommended securities/instruments is available on request.
ARSSBL registered address: Express Zone, A Wing, 9th Floor, Western Express Highway, Diagonally Opposite Oberoi Mall, Malad (E), Mumbai – 400097. Tel No: +91 22 6281 7000 | Fax No: +91 22 4001 3770 | CIN: U67120MH1991PLC064106.