
Target Industry Analysis Final - Shenandoah County, Virginia
20
Strategic Economic Development Plan Update Shenandoah County, Virginia Page 7-1 7 TARGET INDUSTRY ANALYSIS A. INTRODUCTION The primary purpose of the target industry analysis is to identify industry areas to focus recruitment and expansion efforts for Shenandoah County. This analysis can also be helpful in further defining appropriate land uses for redevelopment projects and the type of building best suited for these industries. While the target industry analysis itself combines metrics such as employment change, location quotient and local preference, the first step in this process is understanding what the county currently offers existing and new businesses by assessing quality of life and site selection metrics. The industries recommended in this chapter should not limit the County from targeting other businesses interested in the County. B. METHODOLOGY & DATA SOURCES The Target Industry Analysis section identified sectors that represent the best chance for Shenandoah County to use its limited economic development resources to have the greatest positive effect upon the local economy. These sectors were selected based upon a review of dozens of quantitative and qualitative factors. The analysis considered factors such as: • The county’s existing employment and growth trends (via Economic Modeling, Inc, aka “EMSI”) • Industry growth projections (EMSI) • Area land use, building inventory, and land availability (Loopnet and local assessors’ databases) • Highway and transit access • Real estate costs (including for employee housing) (via Zillow, Trulia, and others) • Local fit factors such as education attainment, workforce skills, and perceived safety (American Community Survey and others) • Conversations with local business leaders, real estate professionals, economic development officials, and the public • Previous studies and plans including the 2013 Shenandoah County Strategic Economic Development Plan, Region 8 Economic Growth & Diversification Plan (2016), and the Shenandoah Partnership Economic Development Strategy (2019 draft). C. QUALITY OF LIFE AND BUSINESS DEVELOPMENT ANALYSIS Most communities focus their target industry assessment on issues such as asset availability, existing/past business trends, and regional/statewide targeting. However, business relocation and expansion decisions are not made solely on economic and market-based issues. Quality of life metrics and business climate at a local, regional, and state level also play a role in site selection decision-making. This is particularly true for smaller (under 250 companies, where the corporate leadership oftentimes relocate with the business. The following section assesses the quality of life assets and constraints for Shenandoah County.
Transcript of Target Industry Analysis Final - Shenandoah County, Virginia
Strategic Economic Development Plan Update Shenandoah County, Virginia
Page 7-1
7 TARGET INDUSTRY ANALYSIS
A. INTRODUCTION The primary purpose of the target industry analysis is to identify industry areas to focus recruitment and expansion efforts for Shenandoah County. This analysis can also be helpful in further defining appropriate land uses for redevelopment projects and the type of building best suited for these industries. While the target industry analysis itself combines metrics such as employment change, location quotient and local preference, the first step in this process is understanding what the county currently offers existing and new businesses by assessing quality of life and site selection metrics. The industries recommended in this chapter should not limit the County from targeting other businesses interested in the County.
B. METHODOLOGY & DATA SOURCES The Target Industry Analysis section identified sectors that represent the best chance for Shenandoah County to use its limited economic development resources to have the greatest positive effect upon the local economy. These sectors were selected based upon a review of dozens of quantitative and qualitative factors. The analysis considered factors such as:
• The county’s existing employment and growth trends (via Economic Modeling, Inc, aka “EMSI”) • Industry growth projections (EMSI) • Area land use, building inventory, and land availability (Loopnet and local assessors’
databases) • Highway and transit access • Real estate costs (including for employee housing) (via Zillow, Trulia, and others) • Local fit factors such as education attainment, workforce skills, and perceived safety (American
Community Survey and others) • Conversations with local business leaders, real estate professionals, economic development
officials, and the public • Previous studies and plans including the 2013 Shenandoah County Strategic Economic
Development Plan, Region 8 Economic Growth & Diversification Plan (2016), and the Shenandoah Partnership Economic Development Strategy (2019 draft).
C. QUALITY OF LIFE AND BUSINESS DEVELOPMENT ANALYSIS Most communities focus their target industry assessment on issues such as asset availability, existing/past business trends, and regional/statewide targeting. However, business relocation and expansion decisions are not made solely on economic and market-based issues. Quality of life metrics and business climate at a local, regional, and state level also play a role in site selection decision-making. This is particularly true for smaller (under 250 companies, where the corporate leadership oftentimes relocate with the business. The following section assesses the quality of life assets and constraints for Shenandoah County.

Strategic Economic Development Plan Update Shenandoah County, Virginia
Page 7-2
1. Public Schools The primary and secondary public education system in Shenandoah County is within one school district of Shenandoah County Public Schools. RKG utilized the 2020 Best Public School ranking from a school rating website Niche.com to understand the relative quality of public schools in the County and in its surrounding region. Niche produced the ranking using the academic and student life data from the U.S. Department of Education along with test scores, college data, and ratings collected from Niche users. Factors considered by Niche.com include academics, culture and diversity, overall experience, teachers, clubs and activities, health and safety, resources and facilities, and sports. Niche.com assigned different multipliers or weights to these factors based on their importance to calculate the overall Niche rating for each school. It should be noted that this rating system is not meant to be definite nor exhaustive and the results are limited to the available data collected and utilized by Niche. In fact, Shenandoah County Public Schools noted late in this effort that the Niche data did not include the most recent school data for Shenandoah Schools. Appendix A of this report details the most recent school performance data collected and published by the Virginia Department of Education, Virginia School Quality Profile dataset. That said, the Niche.com data provide the perspective of looking at the relative performance of public education in the study area (Table 7-1).
Out of the 11 public schools within Shenandoah County, two of them are rated B and B+ respectively, and the remaining ones are rated C+ and below, except for two which are not rated by Niche (Massanutten Regional Governor's School and Triplett Tech). The school with the highest Niche grade (B+) is Stonewall Jackson High School located in Quicksburg along I-81 in Study Area 5. The school with the second highest rating (B) in the County according to Niche.com is Central High School located in Woodstock in Study Area 2. From an economic development perspective, the highly-scoring Stonewall Jackson High School will appeal to workers and business executives relocating to Study Area 5.
Table 7-1
Niche Scoring System Dynamics
Source: Niche.com, 2019

Strategic Economic Development Plan Update Shenandoah County, Virginia
Page 7-3
However, Study Area 2 currently has the highest concentration of housing development in the County. The lack of housing supply in Study Area 5 could create a mismatch between housing supply and demand (Table 7-2).
In comparison, two schools in Harrisonburg City, one school in Rockbridge County, two schools in Lexington City, and one school in Winchester City achieved A ratings. All other public schools in surrounding region (excluding Shenandoah County) received ratings between B+ and C-. Based on these ratings, public school quality in Shenandoah County falls within the average range within its region. The County should include improving public school quality into its economic development strategy to further increase the quality of life in the County if it wishes to attract high-skilled, highly-educated workers who most likely value the high quality of public schools for their children (Table 7-3).
2. Business Climate The business climate at a State level can also impact site selection decisions. To better understand how the Commonwealth of Virginia ranks in terms of business climate and how that might impact Shenandoah County, the Consultant analyzed the Assets and Opportunities Scorecard published and maintained by
Table 7-2
Public Schools by Niche Rating (Pre-K to High School)
Shenandoah County, VA
School Rating Location Study Area Grade
Stonewall Jackson High School B+ Quicksburg 5 9-12
Central High School B Woodstock 2 9-12
North Fork Middle School C+ Quicksburg 5 6-8
Signal Knob Middle School C+ Strasburg 1 6-8
Peter Muhlenberg Middle School C+ Woodstock 2 6-8
Ashby Lee Elementary School C Quicksburg 5 PK, K-5
Sandy Hook Elementary School C Strasburg 1 PK, K-5
Strasburg High School C Strasburg 1 9-12
W.W. Robinson Elementary School C- Woodstock 2 PK, K-5
Massanutten Regional Governor's School N/A Mt. Jackson 5 11-12
Triplett Tech N/A Mt. Jackson 5 9-12
Source: Niche.com, RKG Associates, Inc., 2019
Table 7-3
Number of Public Schools by Niche Rating (Pre-K to High School)
Shenandoah County, VA & Surrounding Region
Jurisdiction Total No. A A- B+ B B- C+ C C- D+ D D- No Rating
Shenandoah County, VA 11 0 0 1 1 0 3 3 1 0 0 0 2
Central Shenandoah Planning District Commission
Augusta County, VA 20 0 0 2 8 5 4 1 0 0 0 0 0
Staunton City, VA 8 0 0 2 1 0 1 1 0 0 0 0 3
Waynesboro City, VA 7 0 0 0 1 2 1 2 0 0 0 0 1
Rockingham County, VA 8 0 0 1 0 2 5 0 0 0 0 0 0
Harrisonburg City, VA 10 1 1 1 0 2 5 0 0 0 0 0 0
Rockbridge County, VA 6 0 1 1 3 1 0 0 0 0 0 0 0
Buena Vista City, VA 4 0 0 0 1 0 1 2 0 0 0 0 0
Lexington City, VA 5 1 1 1 1 1 0 0 0 0 0 0 0
Bath County, VA 3 0 0 1 1 1 0 0 0 0 0 0 0
Highland County, VA 2 0 0 0 1 1 0 0 0 0 0 0 0
Northern Shenandoah Valley Regional Commission
Clarke County, VA 4 0 0 1 0 0 2 1 0 0 0 0 0
Frederick County, VA N/A N/A N/A N/A N/A N/A N/A N/A N/A N/A N/A N/A N/A
Page County, VA 9 0 0 1 1 3 1 2 0 0 0 0 1
Warren County, VA 8 0 0 0 0 1 1 4 2 0 0 0 0
Winchester City, VA 7 0 1 0 0 4 2 0 0 0 0 0 0
Source: Niche.com, RKG Associates, Inc., 2019
Strategic Economic Development Plan Update Shenandoah County, Virginia
Page 7-4
ProspertyNow1. This scorecard ranks each state on a variety of metrics from resident characteristics and quality of life to existing business statistics. While Shenandoah County is not representative of Virginia in all aspects, the State provides the competitive context for future business recruitment efforts, particularly those targeting out-of-state businesses. For the purposes of this analysis, RKG Associates compared Virginia’s performance against its most competitive neighboring states: Maryland, North Carolina, and Tennessee. These states were chosen because they are the most common competitors for recruitment prospects interested in Virginia. The general scoring provided by ProsperityNow indicates that Virginia is competitive in certain areas, and less competitive in others. While this seems overly general, it reflects the fact that none of these states have a clear competitive advantage in business recruitment. On a national level, Virginia fares well in financial assets & income, education, businesses and jobs, but below average in homeownership, and health care. Within these categories, there are several individual metrics on which Virginia performed well and poorly. The higher the ranking (1st, 2nd, 3rd…), the better/more competitive Virginia is compared to other states. Conversely, low scores (48th, 49th, 50th…) show attributes where Virginia is less competitive. Those metrics that are relevant to the County’s economic development efforts are presented below (Table 7-4). Competitive State Assets As noted, Virginia scores highly in Financial Assets and Income categories compared to the rest of the nation. Virginia ranks 9th in the percentage of households with income below the poverty threshold. In the category of liquid asset poverty rate, Virginia ranks 8th nationally. The liquid asset poverty rate is the percentage of households without enough liquid assets to subsist at the poverty level for three months in absence of income. Having savings can help families remain financially stable during economic downturns or setbacks. With a low percentage of households below the poverty line, Virginia ranks 13th in households with saving accounts. Regionally, Virginia has higher rates of savings and credit scores compares to its neighbors. These numbers reflect a state that has many of the necessary habits of households looking to climb the economic ladder and can weather economic slowdowns. This displays a vibrant and strong economy that does not show signs of large inequalities. As mentioned above, Shenandoah County does not always reflect Virginia, but these numbers help provide a glimpse into how other parts of the broader region perform against key metrics. In the 21st century, a skilled and educated labor force has become one of the most important assets for any business. Virginia offers one of the nation’s highest college degree graduation rates (6th). Also, the state ranks high in high-school graduation rates at 20th. Additionally, Virginia ranks high in Math Proficiency (7th), which bodes well for the labor force as many of the growing sectors in U.S. economy are STEM based. Simply put, having a high school diploma and proficiency in math is the minimum requirement for job qualifications. Virginia’s focus on engaging primary and secondary education students through awareness and workforce programs has provided the community with a competitive advantage within many of its target industries. Though Maryland is the regional leader in education, Virginia outperforms both North Carolina and Tennessee in most education metrics. Virginia skilled workforce allows it to attract businesses from all over the country and world. From a businesses and jobs perspective, Virginia’s labor market typically outperforming most states. Virginia has a low unemployment rate (10th), coupled with a low underemployment rate (15th). Additionally, Virginia employers offer health insurance at the 8th highest rate in the country. Conversely, Virginia lags the rest of the nation in microenterprise ownership rates (36th) and business ownership by gender (27th) rate. From an economic development perspective, Virginia has an opportunity to capture a relatively untapped market by creating specific entrepreneurial development programs for small businesses, particularly minority and women owned businesses.
1https://scorecard.prosperitynow.org/

Strategic Economic Development Plan Update Shenandoah County, Virginia
Page 7-5
State Constraints While Virginia scores well on many qualities of life and job preparedness metrics, it is less competitive in homeownership and housing. Virginia ranks in the bottom half for affordability of homes (32nd), and housing cost burden for homeowners (27th). Additionally, the homeownership rate ranks at 23rd in the country. The rental housing market is also expensive, ranking 24th nationally in terms of housing cost burden for renters. These numbers show that it is difficult for households in Virginia to afford housing. As people look to relocate to new areas, housing and housing cost is often a major deciding factor. Shenandoah County should actively advertise its affordable housing market compared to other parts of Virginia. As noted earlier, Virginia scores poorly nationwide and amongst the competitive states for the provision of healthcare. Most notably, Virginia ranks 39th in the rate of uninsured low-income children, well below the regional competitors. Additionally, Virginia ranks 34th in the rate of uninsured people. These low insured rates are likely due to the nation’s 50th ranked employee share of premium. Having healthcare currently is one of the more important issues for workers. While there is uncertainty in the future of
Table 7-4
Assets & Opportunities Scorecard, 2019
Virginia and Comparsion Markets
Virginia Data Viginia Rank Maryland Rank
North Carolina
Rank Tennessee Rank US Average
FINANCIAL ASSETS & INCOME
Income Poverty Rate 10.2% 9 2 39 31 13.0%
Asset Poverty Rate 21.4% 3 2 15 16 25.3%
Liquid Asset Poverty Rate 36.6% 8 2 22 27 40.0%
Income Inequality 4.7x as high for top 20% 31 21 32 29 4.9x as high for top 20%
Unbanked Households 3% 10 4 26 41 6.5%
Underbanked Households 20.6% 39 36 25 41 18.7%
Households with Savings Accounts 78.5% 13 4 19 40 71.4%
Consumers with Prime Credit 54.1% 29 33 37 40 51.9%
Fell Behind on Bills 11.4% 11 20 13 39 13.2%
Access to Revolving Credit 76.4% 17 13 34 44 73.1%
Bankruptcy Rate (per 1,000 people) 2.6 11 38 13 39 2.3
BUSINESSES & JOBS
Microenterprise Ownership Rate 16.6% 36 15 22 15 18.2%
Business Ownership by Gender 1.3x as high for men 27 21 28 21 1.3x as high for men
Business Value by Gender 2.7x as high for men 47 45 40 32 3x as high for men
Unemployment Rate 3.1% 10 39 24 19 4%
Underemployment Rate 6.7% 15 36 25 20 7.8%
Low-Wage Jobs 21.80% 25 18 43 38 22.5%
Average Annual Pay $55,233 15 19 21 20 $55,390
Employers Offering Health Insurance 52.9% 8 5 42 11 46.9%
HOUSING & HOMEOWNERSHIP
Homeownership Rate 66.6% 23 21 32 31 63.9%
Affordability of Homes (value/income) 3.9x higher than median
income 32 33 22 23
3.6x higher than median
income
Housing Cost Burden - Renters 476.9% 24 40 22 15 49.5%
Housing Cost Burden - Homeowners 26.1% 27 32 20 16 27.5%
Delinquent Mortgage Loans 0.9% 19 44 29 36 1.3%
Foreclosure Rate 0.5% 9 37 18 15 1.1%
High-Cost Mortgage Loans 3.7% 13 22 26 30 7.6%
HEALTH CARE
Uninsured Rate 10.2% 34 17 42 39 10.2%
Uninsured Low-Income Children 8.4% 39 24 30 25 6.9%
Employer-Provided Insurance Coverage 63.4% 19 12 38 32 27.9%
Employee Share of Premium 34.1% 50 43 45 39 59.1%
Forgoing Doctor Visit Due to Cost 13.5% 31 10 42 39 13.5%
Poor to Fair Health Status 16.4% 20 14 36 43 18.4%
EDUCATION
Early Childhood Education Enrollment 48.1% 18 12 41 45 48.0%
Math Proficiency - 8th Grade 40.3% 7 29 24 35 34.3%
Reading Proficiency - 8th Grade 37.2% 20 18 33 37 36.1%
High School Graduation Rate 86.7% 20 12 22 8 84.1%
Four-Year College Degree 38.7% 6 50 25 40 32.0%
Disconnected Youth 8.9% 11 21 34 37 11.6%
Borrowers with Student Debt 21.6% 19 29 13 11 21.9%
Median Student Loan Debt $20,539 48 50 38 28 $18,366
Severely Delinquent Student Loan Debt 13.6% 19 25 32 42 15.2%
Source: PropsensityNow, U.S. Department of Labor, 2019

Strategic Economic Development Plan Update Shenandoah County, Virginia
Page 7-6
healthcare provision and how that will impact individuals and businesses, being unable to offer affordable healthcare is a competitive disadvantage for Virginia, and therefore Shenandoah County.
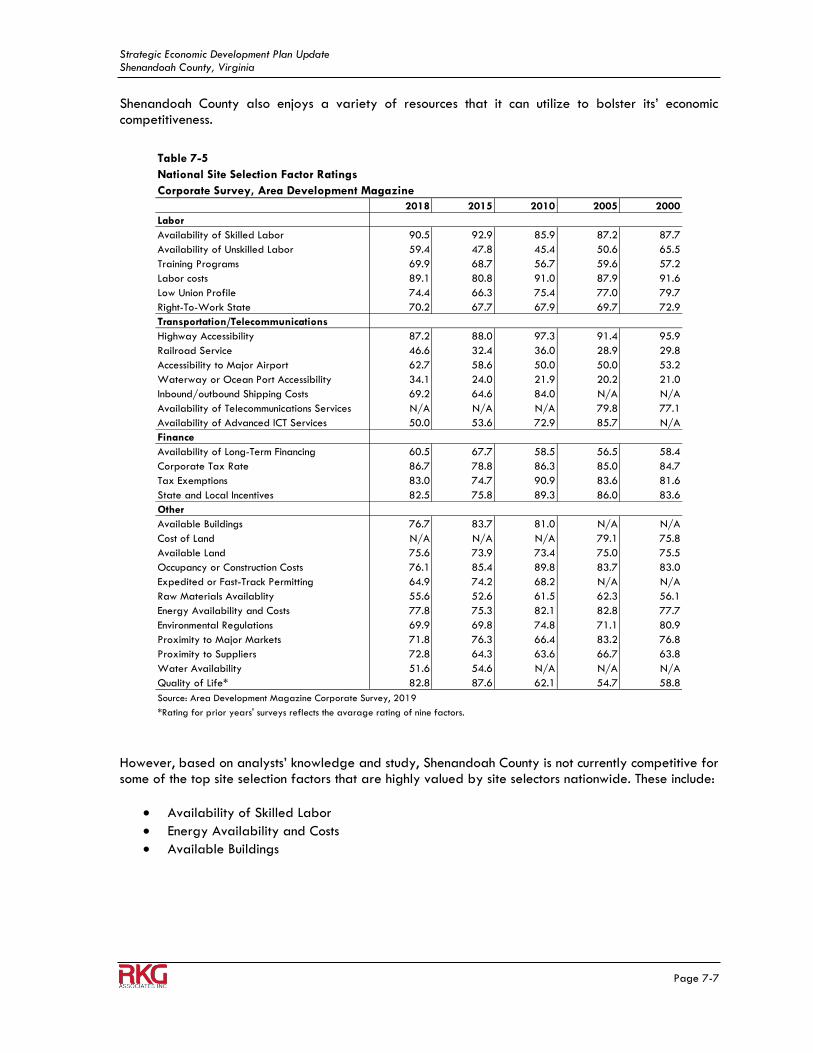
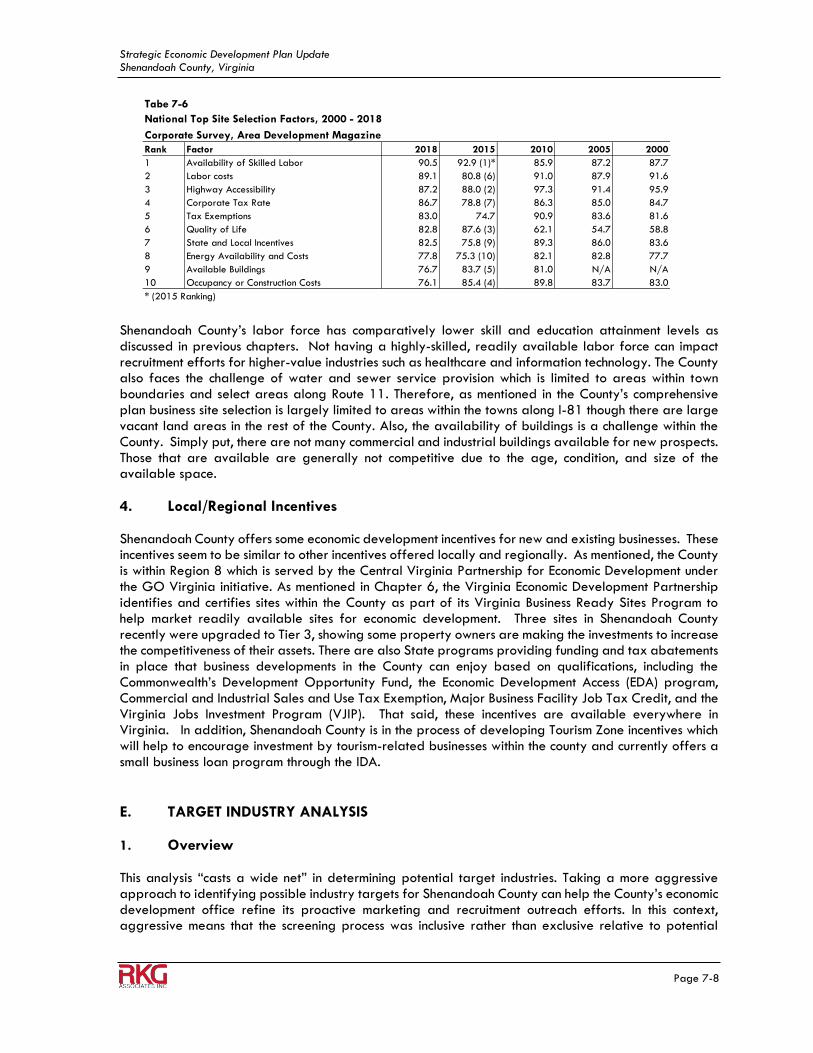
3. Site Selection The national publication Area Development Magazine annually surveys site selectors and companies across the country to understand the relative importance of a variety of factors ranging from quality of life to available labor when making site selection decisions for businesses on a national level. All figures are percentages and are the total of the “very important” and “important” ratings of the Area Development Corporate Survey. The results presented here are rounded to the nearest tenth of a percent. Table 7-5 shows all the factors and Table 7-6 shows the ten most important based on the 2018 survey results. The most important factor for national site selectors is Availability of Skilled Labor. Other top ten factors that are recognized as most important for site selection nationwide in 2018 include Labor costs, Highway Accessibility, Corporate Tax Rate, Tax Exemptions, Quality of Life, State and Local Incentives, Energy Availability and Costs, Available Buildings, and Occupancy or Construction Costs. Compared to 2000 and 2010, national site selectors are more concerned with several factors in 2018 including Availability of Skilled Labor, Corporate Tax Rate and Quality of Life. Several factors are seen more important over the past three years, including Labor costs, Corporate Tax Rate, Tax Exemptions, State and Local Incentives, and Energy Availability and Costs. This result indicates that a new trend of valuing higher labor quality, government/tax support and quality of life has been escalating over the past 18 years for business site selection throughout the U.S. At the state level, the magazine also ranked the Top State for Doing Business based on feedback from the annual survey and a variety of other factors that are similar to the site selection factors. In 2019, Virginia is ranked the 10th best state for doing business overall and is competitive among seven of the twelve individual categories identified by well-respected site/location consultants and specialists. These include:
Access to Capital & Project Funding (Virginia is ranked 9th)
Competitive Labor Environment (Virginia is ranked 9th)
Leading Workforce Development Programs (Virginia is ranked 7th)
Shovel-Ready Sites Program (Virginia is ranked 9th)
Cooperative & Responsive State Government (Virginia is ranked 7th)
Most Improved Economic Development Policies (Virginia is ranked 6th)
Speed of Permitting (Virginia is ranked 9th) This means that Virginia has many assets that can help make Shenandoah County more competitive in its economic development efforts. In addition, from the County’s perspective, Shenandoah County boasts a high quality of life including natural scenery and rich outdoor recreational resources; lower crime rates than more urban environments; comparatively affordable housing options and access to healthcare facilities. In addition, Shenandoah County has comparatively good transportation access via the state’s highway system that connects to adjacent capital and labor centers, including Washington D.C. The
County enjoys strong economic development support from Virginia and incentives from the local
community. Efforts such as Virginia Economic Development Partnership’s Virginia Business Ready Sites Program and Virginia Initiative for Growth and Opportunity in Each Region (GO Virginia). In short,
Strategic Economic Development Plan Update Shenandoah County, Virginia
Page 7-7
Shenandoah County also enjoys a variety of resources that it can utilize to bolster its’ economic competitiveness.
However, based on analysts’ knowledge and study, Shenandoah County is not currently competitive for some of the top site selection factors that are highly valued by site selectors nationwide. These include:
Availability of Skilled Labor
Energy Availability and Costs
Available Buildings
Table 7-5
National Site Selection Factor Ratings
Corporate Survey, Area Development Magazine
2018 2015 2010 2005 2000
Labor
Availability of Skilled Labor 90.5 92.9 85.9 87.2 87.7
Availability of Unskilled Labor 59.4 47.8 45.4 50.6 65.5
Training Programs 69.9 68.7 56.7 59.6 57.2
Labor costs 89.1 80.8 91.0 87.9 91.6
Low Union Profile 74.4 66.3 75.4 77.0 79.7
Right-To-Work State 70.2 67.7 67.9 69.7 72.9
Transportation/Telecommunications
Highway Accessibility 87.2 88.0 97.3 91.4 95.9
Railroad Service 46.6 32.4 36.0 28.9 29.8
Accessibility to Major Airport 62.7 58.6 50.0 50.0 53.2
Waterway or Ocean Port Accessibility 34.1 24.0 21.9 20.2 21.0
Inbound/outbound Shipping Costs 69.2 64.6 84.0 N/A N/A
Availability of Telecommunications Services N/A N/A N/A 79.8 77.1
Availability of Advanced ICT Services 50.0 53.6 72.9 85.7 N/A
Finance
Availability of Long-Term Financing 60.5 67.7 58.5 56.5 58.4
Corporate Tax Rate 86.7 78.8 86.3 85.0 84.7
Tax Exemptions 83.0 74.7 90.9 83.6 81.6
State and Local Incentives 82.5 75.8 89.3 86.0 83.6
Other
Available Buildings 76.7 83.7 81.0 N/A N/A
Cost of Land N/A N/A N/A 79.1 75.8
Available Land 75.6 73.9 73.4 75.0 75.5
Occupancy or Construction Costs 76.1 85.4 89.8 83.7 83.0
Expedited or Fast-Track Permitting 64.9 74.2 68.2 N/A N/A
Raw Materials Availablity 55.6 52.6 61.5 62.3 56.1
Energy Availability and Costs 77.8 75.3 82.1 82.8 77.7
Environmental Regulations 69.9 69.8 74.8 71.1 80.9
Proximity to Major Markets 71.8 76.3 66.4 83.2 76.8
Proximity to Suppliers 72.8 64.3 63.6 66.7 63.8
Water Availability 51.6 54.6 N/A N/A N/A
Quality of Life* 82.8 87.6 62.1 54.7 58.8
Source: Area Development Magazine Corporate Survey, 2019
*Rating for prior years' surveys reflects the avarage rating of nine factors.
Strategic Economic Development Plan Update Shenandoah County, Virginia
Page 7-8
Shenandoah County’s labor force has comparatively lower skill and education attainment levels as discussed in previous chapters. Not having a highly-skilled, readily available labor force can impact recruitment efforts for higher-value industries such as healthcare and information technology. The County also faces the challenge of water and sewer service provision which is limited to areas within town boundaries and select areas along Route 11. Therefore, as mentioned in the County’s comprehensive plan business site selection is largely limited to areas within the towns along I-81 though there are large vacant land areas in the rest of the County. Also, the availability of buildings is a challenge within the County. Simply put, there are not many commercial and industrial buildings available for new prospects. Those that are available are generally not competitive due to the age, condition, and size of the available space.
4. Local/Regional Incentives Shenandoah County offers some economic development incentives for new and existing businesses. These incentives seem to be similar to other incentives offered locally and regionally. As mentioned, the County is within Region 8 which is served by the Central Virginia Partnership for Economic Development under the GO Virginia initiative. As mentioned in Chapter 6, the Virginia Economic Development Partnership identifies and certifies sites within the County as part of its Virginia Business Ready Sites Program to help market readily available sites for economic development. Three sites in Shenandoah County recently were upgraded to Tier 3, showing some property owners are making the investments to increase the competitiveness of their assets. There are also State programs providing funding and tax abatements in place that business developments in the County can enjoy based on qualifications, including the Commonwealth’s Development Opportunity Fund, the Economic Development Access (EDA) program, Commercial and Industrial Sales and Use Tax Exemption, Major Business Facility Job Tax Credit, and the Virginia Jobs Investment Program (VJIP). That said, these incentives are available everywhere in Virginia. In addition, Shenandoah County is in the process of developing Tourism Zone incentives which will help to encourage investment by tourism-related businesses within the county and currently offers a small business loan program through the IDA.
E. TARGET INDUSTRY ANALYSIS
1. Overview
This analysis “casts a wide net” in determining potential target industries. Taking a more aggressive approach to identifying possible industry targets for Shenandoah County can help the County’s economic development office refine its proactive marketing and recruitment outreach efforts. In this context, aggressive means that the screening process was inclusive rather than exclusive relative to potential
Tabe 7-6
National Top Site Selection Factors, 2000 - 2018
Corporate Survey, Area Development Magazine
Rank Factor 2018 2015 2010 2005 2000
1 Availability of Skilled Labor 90.5 92.9 (1)* 85.9 87.2 87.7
2 Labor costs 89.1 80.8 (6) 91.0 87.9 91.6
3 Highway Accessibility 87.2 88.0 (2) 97.3 91.4 95.9
4 Corporate Tax Rate 86.7 78.8 (7) 86.3 85.0 84.7
5 Tax Exemptions 83.0 74.7 90.9 83.6 81.6
6 Quality of Life 82.8 87.6 (3) 62.1 54.7 58.8
7 State and Local Incentives 82.5 75.8 (9) 89.3 86.0 83.6
8 Energy Availability and Costs 77.8 75.3 (10) 82.1 82.8 77.7
9 Available Buildings 76.7 83.7 (5) 81.0 N/A N/A
10 Occupancy or Construction Costs 76.1 85.4 (4) 89.8 83.7 83.0
* (2015 Ranking)
Strategic Economic Development Plan Update Shenandoah County, Virginia
Page 7-9
opportunities that may appear marginal considering historical economic trends. Being inclusive at this phase ensures any potentially viable options can be tested before being eliminated. Furthermore, the target industry lists move beyond just static targets. They identify vertical (supply-chain) and horizontal (market) relationships within the primary target markets. By using this methodology Shenandoah County can apply a comprehensive approach to building upon existing industry clusters and developing new ones. This is particularly important when targeting industries that already have a relationship with an existing regional industry and/or business. The following section discusses the rationale used to describe how the above findings were incorporated into the industry screening process. Based on the assets and constraints summarized earlier, the Consultant initiated a review of primary and secondary source materials to identify a broad range of potential industries that appear to be either compatible with the county’s location/labor assets or marginally affected by known constraints. This process has several purposes when undertaken as part of an economic development strategy including:
Establishing a framework for matching Shenandoah County’s available “product” (land, utilities, intangibles, etc.) to potential markets;
Identifying a receptive “audience” for a focused marketing campaign;
Understanding the characteristics, size and long-term growth potential of compatible markets;
Establishing priorities for the allocation of marketing resources; and
Identifying prospect industries for further consideration.
2. Industry Screening Industry cluster analyses involve examining the economic relationships among commercial and industrial sectors. From the cluster analysis, RKG Associates identified those industries that may enjoy a competitive advantage within the greater Shenandoah region, but would also benefit from Shenandoah County’s strategic assets/location. The underlying assumption of the cluster analysis is that companies concentrate in areas where they enjoy some competitive advantage. These advantages, whether related to location, natural resources, vendor relationships or other factors, allow companies to compete more successfully. An industry cluster is a group of companies in industries that are related in one of three ways:
Buyers and Suppliers – the most common relationship
Competitors – producers of same or similar goods and service, usually firms in the same or similar industries
Shared Resources – companies that rely on the same location- specific resources such as labor and raw materials
Industry cluster analysis provides a method for determining local competitive advantage – which in turn is crucial in attracting investment, be it through attracting firms or expanding existing firms. The industry cluster analysis will rely on a statistical cluster identification process designed to incorporate and assimilate local (county), and regional economic data. The fundamental criteria analyzed in the process include:
Industry Growth – Industries with growth over the past four years (2010-2018) and those that are most likely to grow both locally and regionally.
Industry Size – Component industries of an industry cluster must have sufficient size in terms of total employment, number of establishments and total sales to justify their inclusion in the cluster.

Strategic Economic Development Plan Update Shenandoah County, Virginia
Page 7-10
Industry Concentration – RKG Associates examined current concentrations of each industry in Shenandoah County. Low concentrations of employment and establishments suggest that a given industry may not be well suited for a given region.
Local Fit – Local fit includes both quantitative analysis and considerable professional judgment, based on community characteristics, industry preferences, specific industry composition and location-based activity. Local infrastructure was analyzed including the presence of highways, utility costs, telecommunications service level, and the match of the region’s labor force profile with industry needs. Special attention was paid to target industries already identified by the Commonwealth of Virginia and/or the region.
Other Criteria – Includes skilled and professional workforce requirements by industry, tendency of given industries to concentrate in Shenandoah County, job training resources, and other quantitative and qualitative measures identified through this analysis.
Focusing development efforts on space that is suitable to businesses in these industry clusters will likely enhance the County’s chances for economic success. However, the industry targeting analysis was not restricted to only known industry clusters. A broad range of industry categories was analyzed from manufacturing, distribution and transportation, to high-end services. The result is a full range of options for Shenandoah County to consider and will be highlighted in the opportunity sites discussion in the Implementation Strategy when appropriate.
3. Largest Employment Sectors A common metric used to evaluate and understand a local economy is to look at the largest and fastest growing employment sectors within a region. Using EMSI data, RKG analyzed employment trends within both Shenandoah County and Virginia Region 8 between 2010 and 2018. Shenandoah County employment base grew by 3.7% (excluding public sector) from 2010 to 2018. That resulted in an increase of 586 new jobs during the study period (Table 7-7). The largest employment sector within the Shenandoah economy remained manufacturing which totals 22% (3,518 jobs) of all jobs within the county and experienced 9% growth since 2010. The health care sector, the second largest employment segment, grew over the study period from 1,320 jobs to 1,675 jobs, for a growth rate of 26.9%. Lower wage sectors such as retail saw declines in employment. Recent employment growth has clustered in specific sectors since 2010. Information technology grew by the highest rate. Most of the growth for this sector was
Table 7-7
Shenandoah County
Largest Employment Industry Sectors
Industry Sector
2018
Employment
2010-2018
% Growth
Shenandoah County Total 15,800 3.7%
Information 3,518 9.0%
Transportation and Warehousing 1,675 26.9%
Health Care and Social Assistance 1,665 -0.6%
Administrative Services 1,319 -9.3%
Other Services 952 -4.4%
Source: EMSI and RKG Associates, Inc., 2019
Table 7-8
Shenandoah County
Fastest Growth Sectors (more than 100 jobs)
Industry Sector
2010-2018
% Growth
Shenandoah County Total 3.7%
Information 38.8%
Transportation and Warehousing 26.9%
Health Care and Social Assistance 26.9%
Administrative Services 16.2%
Other Services 15.0%
Source: EMSI and RKG Associates, Inc., 2019
Table 7-9
Region 8 Industry Sectors
Fastest Growth Sectors (more than 1,000 jobs)
Industry Sector
2010-2018
% Growth
Region 8 Total 8.9%
Agriculture, Forestry, Fishing and Hunting 38.0%
Educational Services 36.3%
Transportation and Warehousing 31.6%
Management of Companies and Enterprises 30.6%
Professional, Scientific, and Technical Services 30.5%
Source: EMSI and RKG Associates, Inc., 2019

Strategic Economic Development Plan Update Shenandoah County, Virginia
Page 7-11
centralized in low-to-median waged information technology jobs. Also, transportation and warehousing saw dramatic increases likely due to Shenandoah’s central location to many population centers and quality infrastructure. The health care sector which grew by 355 jobs, follows a national trend of health care employment growing over this study period. At the regional level, total employment grew by 8.9% between 2010 and 2018. The growth came from agriculture and education services, which added 1,135 and 2,467 jobs, respectively. Additionally, high and median wage sectors such as transportation & warehousing, management of companies, and professional science & technology services experienced over 30% employment growth. Comparing Table 7-8 to Table 7-9, it is apparent that Shenandoah County has a different employment mix compared to the rest of the region. These results show that Shenandoah County has followed many of the national trends over the past eight years. Sectors such as Health Care, Transportation and Warehousing, and Information Technology all grew significantly between 2010 and 2018 nationally.
4. Wage Growth RKG Associates examined the health of the economy and the wealth created by its economic base based on changes in wage levels. RKG obtained the annual wage data by sector between 2010 and 2017 from U.S. Census Bureau’s Quarterly Workforce Indicators (QWI) and used it to identify the industry sectors that experienced the strongest growth of annual wages in the County since 2010. The analysts also looked at the wage growth between 2010 and 2017 for Shenandoah County and its surrounding region to evaluate the County’s economic performance within the region in terms of wealth creation.
a. Wage Growth by Sector Among all the 20 industry sectors within Shenandoah County, 16 sectors have experienced wage growth between 2010 and 2017 and four sectors have experienced declines. The average annual wage for all sectors in the County increased by 9.0% to $38,484 during those seven years. Several sectors that have more prominence in Shenandoah County and relevance to this study have seen a robust wage increase, such as Professional, Scientific, and Technical Services; Information; Manufacturing; Public Administration; Retail Trade; and Accommodations and Food Services (Table 7-9). However, the overall wage growth of 9.0% in the County is lagging the inflation rate of 12.4% (based on Consumer Price Index of 2010 and 2017 for all urban consumers) during the same period. This reveals that though the economic base in Shenandoah County economy has increased the wealth of County’s residents, the increase has not been substantial enough to out-pace inflationary increases in retail goods and services. Simply put, the buying power of the County’s residents has decreased slightly, and thus local quality of life is incrementally reduced because the local economic base is not strong enough to produce wealth gains that out-pace inflation. This results also suggests that the County should consider strategies for growing employment in sectors that have shown strong wage growth - such as Information and Professional, Scientific, and Technical Services. While difficult to achieve, strengthening the economic base in certain industry segments will bolster the overall wealth and yield economic benefits to the County and its residents. Additionally, for these sectors to grow in Shenandoah County it will require investment in education and workforce development programs from the County to be successful.

Strategic Economic Development Plan Update Shenandoah County, Virginia
Page 7-12
b. Wage Growth by Jurisdiction The analysts also analyzed the County’s wage growth in comparison to its surrounding region and the Commonwealth of Virginia as a whole. The wage level of Shenandoah County households roughly 35% below the Commonwealth of Virginia and 12% to 15% below the surrounding region (Table 7-10). However, it should be noted that the wage level in the County has been rising, but not as fast as the surrounding region such as the Central Shenandoah Planning District Commission and the Northern Shenandoah Valley Regional Commission (excluding Shenandoah County). Over the past 7-year period, the County has continued to lose ground against the region and the state. This result reinforces previous analyses showing that the County’s economic base is heavily weighted toward lower-skilled, lower-paying jobs.
Annual Wages by Sector, 2010-2017
Shenandoah County, Virginia
2010 2017 % Growth
All Fields $35,304 $38,484 9.0%
Accommodation and Food Services $14,040 $15,384 9.6%
Administrative and Support and Waste Management and Remediation Services $24,576 $31,176 26.9%
Agriculture, Forestry, Fishing and Hunting $31,620 $30,180 -4.6%
Arts, Entertainment, and Recreation $21,180 $18,828 -11.1%
Construction $33,768 $42,384 25.5%
Educational Services $38,964 $42,276 8.5%
Finance and Insurance $43,872 $60,396 37.7%
Health Care and Social Assistance $34,092 $34,824 2.1%
Information $47,988 $54,984 14.6%
Management of Companies and Enterprises $64,404 $65,508 1.7%
Manufacturing $38,820 $41,664 7.3%
Mining, Quarrying, and Oil and Gas Extraction N/A $54,648 N/A
Other Services (except Public Administration) $26,316 $27,000 2.6%
Professional, Scientific, and Technical Services $60,684 $80,532 32.7%
Public Administration $33,096 $37,836 14.3%
Real Estate and Rental and Leasing $18,744 $26,292 40.3%
Retail Trade $24,756 $28,500 15.1%
Transportation and Warehousing $40,752 $47,136 15.7%
Utilities $48,252 $64,680 34.0%
Wholesale Trade $78,288 $41,244 -47.3%
Annual Wages for Selected Sectors, 2010-2017
Shenandoah County, Virginia
2010 2017 % Growth
All Fields $35,304 $38,484 9.0%
Professional, Scientific, and Technical Services $60,684 $80,532 32.7%
Information $47,988 $54,984 14.6%
Manufacturing $38,820 $41,664 7.3%
Public Administration $33,096 $37,836 14.3%
Health Care and Social Assistance $34,092 $34,824 2.1%
Retail Trade $24,756 $28,500 15.1%
Accommodation and Food Services $14,040 $15,384 9.6%
Source: U.S. Bureau of Census Quarterly Workforce Indicators (QWI), RKG Associates, Inc., 2019
Table 7-10
Strategic Economic Development Plan Update Shenandoah County, Virginia
Page 7-13
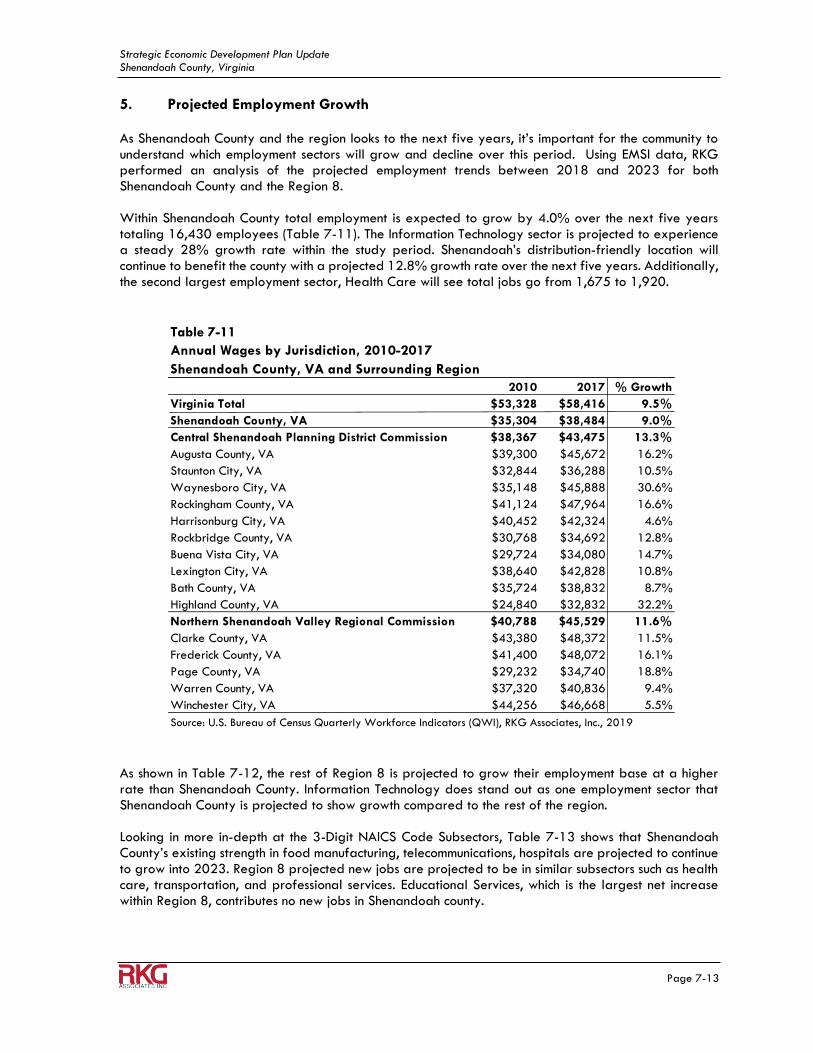
5. Projected Employment Growth As Shenandoah County and the region looks to the next five years, it’s important for the community to understand which employment sectors will grow and decline over this period. Using EMSI data, RKG performed an analysis of the projected employment trends between 2018 and 2023 for both Shenandoah County and the Region 8. Within Shenandoah County total employment is expected to grow by 4.0% over the next five years totaling 16,430 employees (Table 7-11). The Information Technology sector is projected to experience a steady 28% growth rate within the study period. Shenandoah’s distribution-friendly location will continue to benefit the county with a projected 12.8% growth rate over the next five years. Additionally, the second largest employment sector, Health Care will see total jobs go from 1,675 to 1,920.
As shown in Table 7-12, the rest of Region 8 is projected to grow their employment base at a higher rate than Shenandoah County. Information Technology does stand out as one employment sector that Shenandoah County is projected to show growth compared to the rest of the region. Looking in more in-depth at the 3-Digit NAICS Code Subsectors, Table 7-13 shows that Shenandoah County’s existing strength in food manufacturing, telecommunications, hospitals are projected to continue to grow into 2023. Region 8 projected new jobs are projected to be in similar subsectors such as health care, transportation, and professional services. Educational Services, which is the largest net increase within Region 8, contributes no new jobs in Shenandoah county.
Annual Wages by Jurisdiction, 2010-2017
Shenandoah County, VA and Surrounding Region
2010 2017 % Growth
Virginia Total $53,328 $58,416 9.5%
Shenandoah County, VA $35,304 $38,484 9.0%
Central Shenandoah Planning District Commission $38,367 $43,475 13.3%
Augusta County, VA $39,300 $45,672 16.2%
Staunton City, VA $32,844 $36,288 10.5%
Waynesboro City, VA $35,148 $45,888 30.6%
Rockingham County, VA $41,124 $47,964 16.6%
Harrisonburg City, VA $40,452 $42,324 4.6%
Rockbridge County, VA $30,768 $34,692 12.8%
Buena Vista City, VA $29,724 $34,080 14.7%
Lexington City, VA $38,640 $42,828 10.8%
Bath County, VA $35,724 $38,832 8.7%
Highland County, VA $24,840 $32,832 32.2%
Northern Shenandoah Valley Regional Commission $40,788 $45,529 11.6%
Clarke County, VA $43,380 $48,372 11.5%
Frederick County, VA $41,400 $48,072 16.1%
Page County, VA $29,232 $34,740 18.8%
Warren County, VA $37,320 $40,836 9.4%
Winchester City, VA $44,256 $46,668 5.5%
Source: U.S. Bureau of Census Quarterly Workforce Indicators (QWI), RKG Associates, Inc., 2019
Table 7-11

Strategic Economic Development Plan Update Shenandoah County, Virginia
Page 7-14
Shenandoah County should continue to gain a better understanding of the needs of these growth sectors to help facilitate their growth in the coming years. As the employment has grown since 2010, it is important that the County continues to invest time and effort to maintain a positive economic environment.
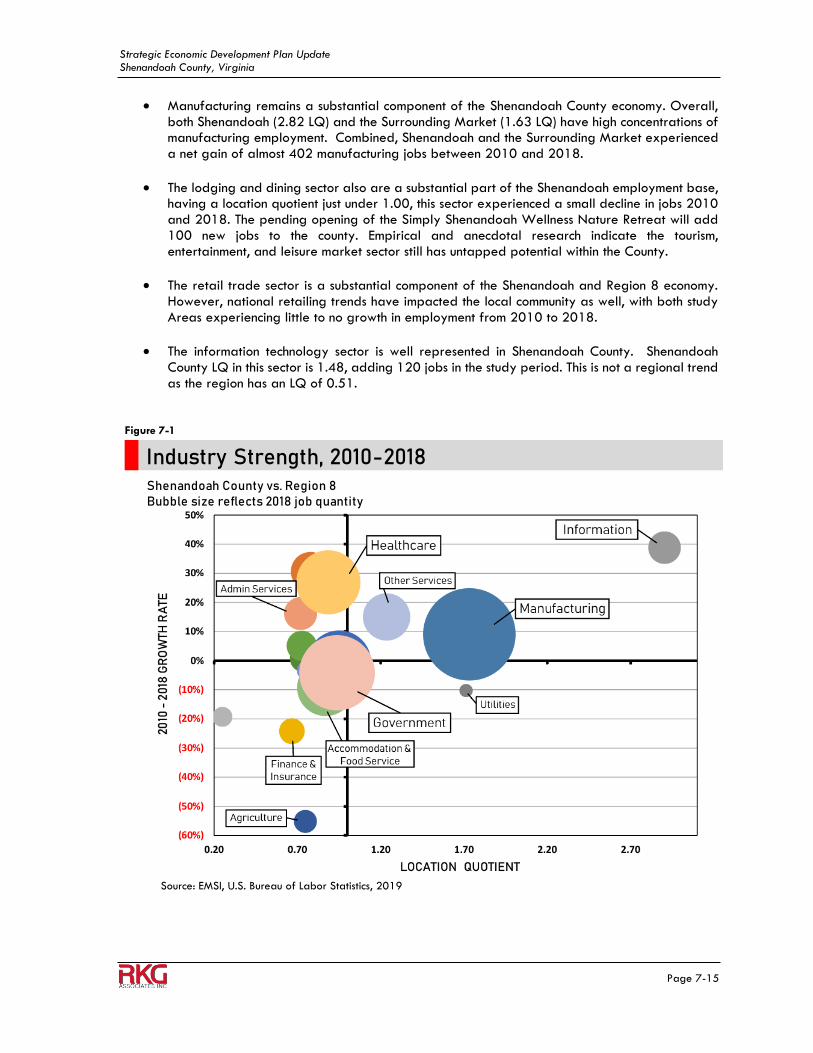
6. Industry Strength A relative measure of how a local economy is performing can be estimated by comparing employment growth for specific industry sectors to that of a larger economy. This measurement, which is represented as a ratio, is referred to as a Location Quotient (LQ). If the LQ is near 1.0, it indicates that the study area has a comparable proportion of its employment base in each sector to that of the larger area, which in this case, is the United States. If the ratio is less than 1.0, then the study area is under-performing in that industry sector relative to the country. Conversely, an LQ greater than 1.0 indicates a stronger performance by the study area overall. In this analysis, the LQ’s and their respective growth rates, were developed based on employment changes between 2010 and 2018, and the analysis was conducted for both Shenandoah and the eight-county Surrounding Market using information from the U.S. Census Bureau and EMSI.
The Location Quotients for Shenandoah County (Figure 7-1) and the Surrounding Market (Figure 7-2) are current as of 2018. The size of the bubbles in these figures represents total employment. Their position from left to right indicates their LQ for 2018, and their position from top to bottom indicates growth rate between 2010 and 2018. Not all sectors are visible in each of the figures. Those that represent relatively small components of the economy, those with very low or very high LQs or those that were positioned behind larger sectors within the figure have been included within the inset. Unclassified positions were not included in this analysis. Notable findings from the analysis of industry strength are as follows:
The healthcare industry has experienced significant growth in Shenandoah and the Surrounding Market (LQ of 0.24). In comparison, the Surrounding Market has an LQ of 0.95, approximately average compared to the rest of the nation.
Table 7-13
Table 7-12
Shenandoah County
Largest Projected Growth Sectors 2018-2023
Shenandoah
County
Rest of
Region 8
Total Job Growth 4.0% 8.9%
Information 28.0% -3.5%
Professional, Scientific, & Tech Services 22.8% 15.5%
Health Care & Social Assistance 14.6% 11.3%
Transporation & Warehousing 0.1% 7.5%
Other Services 9.0% 8.5%
Source: EMSI and RKG Associates, Inc., 2019
Strategic Economic Development Plan Update Shenandoah County, Virginia
Page 7-15
Manufacturing remains a substantial component of the Shenandoah County economy. Overall, both Shenandoah (2.82 LQ) and the Surrounding Market (1.63 LQ) have high concentrations of manufacturing employment. Combined, Shenandoah and the Surrounding Market experienced a net gain of almost 402 manufacturing jobs between 2010 and 2018.
The lodging and dining sector also are a substantial part of the Shenandoah employment base, having a location quotient just under 1.00, this sector experienced a small decline in jobs 2010 and 2018. The pending opening of the Simply Shenandoah Wellness Nature Retreat will add 100 new jobs to the county. Empirical and anecdotal research indicate the tourism, entertainment, and leisure market sector still has untapped potential within the County.
The retail trade sector is a substantial component of the Shenandoah and Region 8 economy. However, national retailing trends have impacted the local community as well, with both study Areas experiencing little to no growth in employment from 2010 to 2018.
The information technology sector is well represented in Shenandoah County. Shenandoah County LQ in this sector is 1.48, adding 120 jobs in the study period. This is not a regional trend as the region has an LQ of 0.51.
Industry Strength, 2010-2018Shenandoah County vs. Region 8 Bubble size reflects 2018 job quantity
Figure 7-1
Source: EMSI, U.S. Bureau of Labor Statistics, 2019

Strategic Economic Development Plan Update Shenandoah County, Virginia
Page 7-16
7. Analysis Findings and Recommended Actions The target industry analysis in this SEDP “cast a wide net” regarding the potential for different potential business sectors to spark economic development. In analyzing possible target industries beyond the area’s historical economy or previous efforts, the screening process ensured that any potentially-viable targets could be tested and analyzed before being eliminated in favor of more promising options. The following section provides analysis and justification of the five selected target industries for Shenandoah County to pursue over the next five years. They are:
Manufacturing & Production
IT & Communications
Hospitality & Tourism
Agribusiness
Healthcare As noted elsewhere in this SEDP, these business sectors are by no means the only ones that can or should grow in Shenandoah County in coming years. Instead, these represent the best chances for the Tourism and Economic Development Departments and its partners to use their limited economic development resources to have the greatest positive effect upon the local economy.
Figure 7-2
Source: EMSI, U.S. Bureau of Labor Statistics, 2019
Regional Industry Strength, 2010-2018Region 8 vs. United StatesBubble size reflects 2018 job quantity

Strategic Economic Development Plan Update Shenandoah County, Virginia
Page 7-17
Manufacturing & Production Shenandoah County, and all Region 8 communities, have large and active manufacturing sectors. Within the County, Manufacturing has a long-established, successful history almost rivaling the County’s Agricultural sector. In 2018, Manufacturing jobs constitute the largest number of private-sector jobs in Shenandoah County, increasing by 9.3% between 2010 and 2018 (exceeding regional and national trends). The Shenandoah County manufacturing sector is led by large employers like George’s Inc., Andros Foods NA, and Mercury Paper, Inc. Food manufacturing is particularly strong in Shenandoah County, with a projected increase of 100 jobs over the next five years. Taking a broader market look, the Manufacturing sector is projected to continue to grow domestically due to the national efforts to retain and grow the country’s production economy. From a local perspective, the growth prospect of food manufacturing is particularly bullish, as restaurant visits are projected to continue to rise in the near future. With the strong regional and national push to grow the “Farm-to-Table” concepts in dining, the County’s existing food manufacturing efforts and proximity to the Washington DC and Baltimore metropolitan areas can help the County continue to grow this sector. The value-add food processing (i.e. canning, meat processing) is a logical cross-industry strategy between manufacturing and the agricultural sector. In the short-term, the County may be most successful focusing on those industry sectors that do not rely on large labor force needs, as there is comparatively low immediately available labor force. There is an immediate opportunity for the County to explore ‘cottage producers,’ or (typically) home-based businesses that produce products (often foods or crafts) on a smaller scale. More strategically, the County—through Shenandoah County Public Schools and its relationships with regional post-secondary institutions—could build upon being a regional leader in manufacturing retention and recruitment through expanding coordinated workforce development programs, specifically in production-based jobs (i.e. CNC machinists). One of the potential limiting factors is available water and sewer infrastructure capacity. Simply put, certain manufacturing industry sectors are heavy water and sewer users. This is particularly true for food manufacturing. To this point, strategic relationships between the County, Towns, and the local authorities will be necessary as the County continues to expand its production-based economy. IT & Communication Shenandoah County is home to Shenandoah Telecommunications Co., or ShenTel, the primary telecommunications provider in the Shenandoah Valley and much of the I-81 corridor. ShenTel’s presence alone has created a high location quotient (2.8) for the County. This is borne out as the Region8 cluster of communities has a LQ below 1. Regardless, the County’s information and communication sector constitutes a small, but growing, component of the local marketplace. This is supported by the existing fiber optic and high-speed internet infrastructure throughout the County, particularly along I-81 and within the various municipalities.

Strategic Economic Development Plan Update Shenandoah County, Virginia
Page 7-18
While the information and communication sectors are projected to have a modest increase national due to the surge in mobile technology and the lack of transformative technological shifts in recent years, Shenandoah County is positioned to take advantage of some specific opportunities. Most notably, logistics technology (particularly in information collection, sharing, and communication) continues to evolve and is projected to grow into the near future. Given the County’s proximity to the region’s strong logistics and distribution sector as well as the recent Amazon 2.0 headquarters announcement for Northern Virginia, Shenandoah County can become a value location that ties the County’s existing cluster with these emerging opportunities. Other assets that can be marketed by the County are relative real estate costs, existing and potential workforce development programs through Lord Fairfax Community College and the public schools, and the relative high quality of life in Shenandoah County and the Valley as a whole. Having ShenTel in the County is a strategic asset, as the County has direct connection to decisionmakers on the availability potential for expansion of the existing infrastructure network. Hospitality & Tourism As discussed in Chapter 5 – Agriculture Analysis, the County has experienced a 1,000% increase in agri-tourism based revenue. In addition to Bryce Resort, the National Forest and Park Service assets, and the long-standing presence of the Cavern tourist attractions in the region, Shenandoah County and the entire Valley are experiencing growth in more experiential tourism activities. This is particularly evident through the growth of wineries, breweries, and distilleries. The Tourism and Economic Development Department already has begun creating multi-venue and cross-branded marketing packages bringing the existing assets together with restaurants and hospitality venues. Further expansion of both the beverage manufacturing sector and the coordinated tourism potential between the County’s/Region’s historic and natural destinations and the agritourism venues should be pursued. Beyond that opportunity, the County’s Tourism and Economic Development Department should continue to develop and promote the event and festival venues within the County. These events not only strengthen the quality of life for residents, they attract visitors from outside the region who spend money at local shops, restaurants and hotels. Multi-day events (i.e. bike weekends, ATV weekends, beverage tours, etc.) create substantially more revenue due to increased dining and hotel stays.
Strategic Economic Development Plan Update Shenandoah County, Virginia
Page 7-19
Agribusiness Chapter 5 details several opportunities for agribusiness within Shenandoah County. The County has a long and rich history of both animal and crop production. Creating the environment to support existing agriculture businesses while creating opportunities for future farmers and ranchers is a key component to the County’s economic development plan. From the perspective, creating an environment where both agricultural and non-agricultural economic development can occur is critical. The following narrative was pulled from Chapter 5.
Potential Rezoning Plan – One potential opportunity is to rezone agriculture land to forbid it to be developed into anything other than its current uses. This would reduce the demand for land and preserve agricultural land. It should be noted that this rezoning strategy would adversely impact immediate land value within the County.
Value-Add Facilities – The County should explore and diversify its value-add production facility offerings to expand its economic base. These facilities could include livestock (beef, goat, sheep swine) processing, milk (cheese, yogurt, ice cream, fluid milk), vegetable/fruit processing, commercial kitchens, and timber mills. These value-add facilities would provide investment and jobs into the County.
Agritourism – As consumers are have continued to put importance on experienced-based retail offering, agritourism has become a significant part of any agricultural community. Shenandoah County should continue to develop this type of tourism through promoting beverage manufacturing, seasonal attractions, and on-site hospitality.
Financial Incentives to Conservation – Increases the financial incentives for conservation up to the loss from market value would allow for farmers to maximize the value of their land through preservation. However, it would have financial impacts on the County, in terms of further reduced revenues and direct costs.
Business Assistance – Shenandoah should expand its business assistance offerings to allow to attract new business development within the County. This could include an entrepreneurship development program to help new agriculture entrepreneurs start their own businesses. Programs like these will become increasingly important as the average age of farmers within the County continues to rise.
Healthcare Shenandoah County healthcare and social assistance employment sector is the second-largest in the County (behind manufacturing) and one of the fastest growing (27%) since 2010. This trend follows regional and national growth as healthcare needs continue to expand as the Baby Boomer generation continues to enter their Golden Years. Further, the County’s strong growth in persons 65 years old and above contributes to this increase in healthcare employment locally. Local healthcare provision is largely driven by Shenandoah Memorial Hospital (SMH) located in Woodstock. However, there are several other smaller providers and specialty social assistance venues (i.e. the Skyline Terrace Nursing Home).

Strategic Economic Development Plan Update Shenandoah County, Virginia
Page 7-20
Given patient care follows demand and does not lead the market, healthcare and social assistance is more a secondary target industry. That said, there are opportunities for the County to pursue greater healthcare provision and ancillary industries that would benefit from being located near a regional hospital. In the short-term, the County should engage with SMH to understand the market and growth strategies (likely will require a strong non-disclosure agreement). Helping the hospital expand its services (either at the Woodstock campus or elsewhere in the County) can build new specialties that would benefit existing residents and increase the attractiveness of the community as a place to live. For example, the hospital no longer has a birthing center, which could deter young families from locating in the County. More strategically, there are several ancillary healthcare industries that could benefit from associating with the hospital and/or locating in a more cost-effective environment while serving the Northern Virginia market. Medical and diagnostics laboratories that service Northern Virginia healthcare businesses may have interest in a lower-cost environment.