Target Capital Structure: Dynamics, Determinants and Speed...
36
Target Capital Structure: Dynamics, Determinants and Speed of Adjustment Aderajew Shumet Tamirat † , Andres Trujillo-Barrera ‡ and Joost M.E. Pennings †,‡ Contribution presented at the XV EAAE Congress, “Towards Sustainable Agri-food Systems: Balancing Between Markets and Society” August 29 th – September 1 st , 2017 Parma, Italy Copyright 2017 by Aderajew Shumet Tamirat, Andres Trujillo-Barrera and Joost M.E. Pennings. All rights reserved. Readers may make verbatim copies of this document for non-commercial purposes by any means, provided that this copyright notice appears on all such copies. † Maastricht University, Department of Finance ‡ Wageningen University and Research, Marketing and Consumer Behavior Group †,‡ Maastricht University, Department of Finance and Department of Marketing
Transcript of Target Capital Structure: Dynamics, Determinants and Speed...
Target Capital Structure: Dynamics, Determinants and Speed of Adjustment
Aderajew Shumet Tamirat†, Andres Trujillo-Barrera
‡ and Joost M.E. Pennings
†,‡
Contribution presented at the XV EAAE Congress, “Towards Sustainable Agri-food
Systems: Balancing Between Markets and Society”
August 29th – September 1
st, 2017
Parma, Italy
Copyright 2017 by Aderajew Shumet Tamirat, Andres Trujillo-Barrera and Joost M.E. Pennings.
All rights reserved. Readers may make verbatim copies of this document for non-commercial
purposes by any means, provided that this copyright notice appears on all such copies.
† Maastricht University, Department of Finance
‡ Wageningen University and Research, Marketing and Consumer Behavior Group
†,‡ Maastricht University, Department of Finance and Department of Marketing
Abstract
The corporate finance literature has focused on explaining the determinants of firms target capital
structure and speed of adjustment using the well-established theories such as pecking order, signaling and
trade-off theories. However, less attention has been paid to understanding the financing behavior of farm
businesses using these theories.
Unlike corporate firms with professional management, farm businesses are different in a way that
family members participate in management, the owner is often the manager, the decision-making unit is
small, and farms heavily depend on government subsidies to stabilize income. These distinctive setting in
farm business may result in different patterns of capital structure decision-making. Hence, we evaluate
the application of corporate finance theories in the context of understanding the relationship between
target capital structure and profit in the farm business.
We use a dynamic partial adjustment model to examine the determinants of capital structure and
speed of adjustment, and detect capital structure theories with which the leverage ratio of farm business
would comply. Our sample comprises a panel of 1500 Dutch farms over the years 2001 to 2015.
We find strong evidence that farms prefer internal funds to external funds. Profit is negatively
related to leverage, supporting the pecking order theory, which has often been rejected for large firms.
Consistent with the signaling theory, we find that size is positively related to leverage. Farm asset
structure, growth, investment, and earnings volatility significantly determine the target capital structure.
An interesting finding is that farm leverage is highly persistent and that lagged leverage is the best
predictor of subsequent leverage ratios. Also, farms appear to have target leverage ratio and are reported
to adjust their leverage towards the optimal level. The speed of adjustment to the target capital ranges
from 8.6% to 63%, and varies by farm size and farm. This evidence further confirms the existence of
dynamics in the farm capital structure decision. This article provides insights to understanding the
dynamic nature of farm capital structure and the applicability of capital structure theories in the farm
business.
Keywords: Farm business, dynamic partial adjustment model, target capital structure, adjustment speed
1
Introduction
A question often asked is do firms set target capital and adjust to it regularly? The corporate
finance literature has focused on explaining the determinants of firms target capital structure and
speed of adjustment using the well-established theories such as pecking order, signaling and
trade-off theories. However, less attention has been paid to understanding the financing behavior
of farm businesses using these theories.
Unlike corporate firms with professional management, farm businesses are different in a
way that family members participate in management, the owner is often the manager, the
decision making unit is small in size, and farms heavily dependent on government subsidies to
stabilize income (Zhengfei, and Lansink, 2006). In addition, the seasonal nature of the
production (leading to mismatches in cash inflow and outflow), legal forms, and limited access
to equity markets, provides an interesting distinctive setting.
These distinctive setting in farm business may result in different patterns of capital
structure decision-making. Hence, we evaluate the application of corporate finance theories in
the context of understanding the relationship between target capital structure and profit in the
farm business.
How farm businesses manage their capital structure has important implications for their
performance (in terms of profit, financial risk, and survival), as well as the return and stability of
lenders and financial institutions. Measuring the speed of adjustment helps to understand the
overall responsiveness and flexibility of farms in adapting to changes in the farm financial and
production structure.
Examining whether the pecking order and signaling theories explain the financial
decision-making and capital structure of the farm business is also relevant. These theories have
been criticized for being complicated to apply in corporate finance setting as it relies on the

2
simplified assumption that a company has only two financing choices: debt and equity, the
choice and ratio decision between equity vs debt gets complicated due to the agency problem,
and the pecking order theory assumes that managers act in the interest of shareholders and the
latter are passive. Farm businesses seem immune to these criticisms (Barry, Katchova and Zhao,
2005) as there are only two financing options and the farm operator is most of the time the owner
and manager.
The main objective of this paper is to examine the determinants of target capital structure
and speed of adjustment of farms. Specifically, this paper aims to examine (1) whether the
pecking order, signaling, and trade-off theories explain the farm capital structure decision, (2) the
determinants of farm capital structure decision, (3) the adjustment speed towards the target
capital structure, if any.
According to the pecking order theory (Frank and Goyal, 2007), farms prefer internal
funds to external funds for capital expenditure. Profitable farms have more retained earnings than
a less profitable farm suggesting a negative relationship between profit and leverage. However
the signaling theory point out that this relationship can also be positive, as lenders are more
willing to lend to profitable farms. Hence, the causality between capital structure and profit
needs to be examined (Zhao et al., 2004).
To disentangle this causality concern, we employ a dynamic panel system general
method of moments (system-GMM) approach. It allows us to address the important but often
ignored methodological concern in capital structure studies: dynamic endogeneity. It also gives
reasonable results in the presence of endogeneity, serial correlation in error terms and dealing
with unbalanced panel data (Arellano and Bover, 1995). Based on capital structure theories and
previous literature, we include asset structure, farm size, growth (investment) opportunities and

3
risk level as determinants in the dynamic model. We also include the macro-economic
determinants (government debt to GDP, inflation and employment) of farm capital structure,
which has been given less attention in the literature.
The analyses are based on a unique longitudinal dataset collected for a panel of 1500
Dutch farms for the period 2001-2015. Contrary to previous studies that focus on a single farm
type, we take into account four farm types (dairy, livestock, field crop, and horticulture farms).
Hence, a larger segment of the farm sector can be analyzed.
Preliminary results show strong evidence of farms preference for internal funds over
external funds. Interestingly, we find profit to be negatively related to leverage, supporting the
pecking order theory, which has been often rejected for large and stock-listed firms
(Ampenberger et al., 2013). Consistent with the signaling theory, we find that size is positively
related to leverage. Farm asset structure, growth, investment, and risk significantly determine
farm capital structure.
Furthermore, the panel structure of our data allows us to examine the dynamic behavior
of the farm leverage ratio. We find that leverage is highly persistent and that lagged leverage is
the best predictor of subsequent leverage ratios. Finally, farms appear to have target leverage
ratio, and the speed of adjustment is slow and mostly dependent on the size and farm type. To
examine the robustness of our findings, we run the models by dividing the sample by farm size,
growth opportunities and sample period. The result shows that the impact of profit on leverage is
much higher and farms adjust to their target capital much quicker in the post financial crisis
periods.
We expect the results to provide new insights on the impact of farm characteristics and
macroeconomic factors on capital structure decision and target adjustment speed. For policy-
4
makers, the result gives better insight on the impacts of financial policies on farm viability. For
financial institutions, the results help better understand the farm capital decision-making process
for risk and profit evaluation. The results also confirm that not only farm specific characteristics,
but also macroeconomic factors need to be considered by farms while deciding the target
leverage. The findings should also spark discussion about the applicability of pecking order and
signaling theories in the farm business.
The paper is structured as follows. The next section provides a theoretical background
and conceptual framework. This is followed by a description of the variables, data used, and
methodology applied. Next, the results of the empirical analyses are presented and discussed.
The last section sets out the conclusion, limitations, and suggestions for further research.
Theoretical Background
Theoretical Review
The seminal paper by Modigliani and Miller (1958) is the basis for many capital structure
empirical researches. They contend that the value of a firm is independent of its financing
decisions under restrictive assumptions of perfect capital markets with no taxes, transactions
costs and arbitrage opportunities. Once these assumptions are relaxed, the question of what
determines firm capital structure becomes complex.
In such complex decision-making context, asymmetric information and adverse selection
emerged as major elements of capital structure theories in the corporate finance literature.
However, empirical tests of these theories are rare for the degree of asymmetric information and
the extent of agency problems along with other unobservable factors are difficult to capture with
models. Notwithstanding these restrictions, the pecking order theory of Myers (1984) and Myers
and Majluf (1984) and the signaling theory are the most widely cited models in the literature.
5
The pecking order theory roots back to Donaldson (1961). Myers and Majluf (1984)
revise the theory and endorse it as an alternative model to the tradeoff theory. According to the
pecking order theory, firms have three sources of funding: retained earnings, debt and equity
(Frank and Goyal, 2007). The theory states that firms will choose the cheapest source of funding
for investment. The theory predicts that the cost gap between internal and external funds
attributed to asymmetric information and agency costs makes firms prefer internal to external
financing. If firms require external funding, they will issue debt and convertible bonds before
issuing equity (Myers and Majluf, 1984). Hence, the pecking order theory suggests farms will
first rely on retained earnings to finance their investment needs. After using their retained
earnings exhaustively to invest in profitable projects, then farm owners prefer to use debt than
issuing equity. The theory thus implies a farm’s current leverage level and cash flow are
negatively related.
Ross (1977) introduces the signaling theory to the corporate finance literature based upon
the problems of the asymmetric information between firm managers and external parties such as
lenders and investors. The theory states that managers have better information about the firm and
a motive to transfer this knowledge to investors and lenders. The firms that want to send signals
that they have good prospects often increase their leverage, calling firm’s convertibles,
repurchase their outstanding stocks. Adding more debt to the firm’s capital structure also shows
a credible sign of expected high cash flow (Ross, 1977). According to the signaling theory, farms
tend to signal their good expectation about the investment through high leverage or accumulated
assets (Zhao et al., 2004). Based on these signals, then lenders will provide loans. Zhao et al.,
(2004) further argues that if leverage is taken as a signal for farm performance, high leverage
farms will exhibit higher investment in the same period. However, investments made in current
6
period may have no immediate effect in terms payoff implying a positive relationship between
farm’s current leverage and future cash flow.
Though abundant supportive evidence exists for the applicability of the pecking order
theory in corporate finance literature, researches explaining the financing behavior of farm
businesses using theories are scant. Not only are these studies scant, but the few studies that exist
often use a cross sectional data. It is appropriate to use a cross section data during periods of
stable financial condition in agriculture. However, we argue that optimal capital structure
decisions are a long term concept and have a long-run impact on the survival and success of
agricultural firms. As a result, empirical studies need to use a longitudinal research design.
Zhao, Barry, & Katchova (2004) and Zhao et al., (2008) are a few of the exceptions to the
above censure. In their papers, they test the applicability of the traditional theories of pecking
order, trade-off and signaling theories on farm business using cross sectional time series data
from the Illinois Farm Business Farm Management (FBFM). They find farm businesses not only
follow the pecking order theory, but also the signaling theory. They also show farm business
depend on their size and operation records as financing signals unlike corporate firms who can
choose high leverage as a signaling tool to facilitate investment.
In the literature, the signaling theory has been considered with the joint effect of
traditional theories of pecking order and trade-off so that together will better reflect the capital
structure effect. Barry, Katchova and Zhao (2004) consider these theories jointly to capture the
borrower’s capital structure decisions with the lender’s determination of borrower’s credit
capacity, thus encompassing both sides in the lender-borrower relationship. Zhao et al., (2008)
also develop a model for both conceptual and empirical implications of the pecking order, trade-
off, and signaling theories on farm business financing, investment, and expansion process. Other

7
evidence in the applicability of these traditional theories on farm business is, however, less
direct.
Hence, insights on the determinants of farm capital structure decisions and applicability
of these theories in explaining such decisions benefit farms, lenders, and policy analysts. It is
important for financial institutions to understand farm capital structure for risk and profit
evaluation. For policy makers, the result will give better insight on the impacts of financial
policies on farm viability.
Determinants of Capital Structure
The literature on the determinants of capital structure decisions of farm businesses is wide-
ranging and major factors, for example, include: farm profit, financing costs and amount of debt
(Zhao, Barry, and Katchova, 2008), asset structure, economies of scale, wealth, risk attitude and
adjustment costs (Barry et al., 2000), farm risk management strategies (Katchova, 2005), credit
constraints and government payments (Featherstone et al., 2005). Several studies examine the
role of farm specific factors in the capital structure decision. Based on the capital structure
theories and previous literature, we include farm profit, asset structure, farm size, growth
(investment) opportunities and risk level as farm specific determinants. In the following
paragraphs, we briefly describe the relationship we expect with farm’s capital structure and
explain how we operationalize each variable.
According to the pecking order theory, farms prefer internal funds over external funds for
capital expenditure (Jahanzeb, 2013). Farms prefer to finance new investment from retained
earnings and borrow from lenders (issue debt) only if retained earnings are not sufficient.
Profitable farms tend to have more retained earnings. Thus, we expect an inverse relationship
between farm profit and leverage. Less profitable farms will use more debt, since they lack

8
internal alternatives. On the other hand, the relationship can be positive, according to the
signaling theory, for lenders are more willing to lend to profitable farms. Hence, correct
inference of causality requires due attention. Farm profitability is measured as the ratio of farm
return and total assets (ROA).
We expect asset tangibility to be positively related to the farm’s leverage level. Due to
the high vulnerability of the agricultural sector to systematic market risks and natural risks,
lenders want farms with assets as collateral to back up their loans. Tangible fixed assets are
easily pledgeable and easier to liquidate in case of bankruptcy thereby reducing the cost of
financial distress The pecking order theory also supports the positive relationship between
tangibility and leverage as tangible farms are easily recognized to lenders and there will be less
information asymmetry. Whereas, farms with little collateral may depend on profit based
retained earnings for investment. Tangibility is measured as the ratio of fixed assets and total
assets.
Larger farms tend to be more diversified in their farm business and, as a result, the
probability of total failure is low. Size may also be an indicator of farm’s bargaining power.
Therefore, size is considered to be positively correlated to leverage. This relationship provides
support to the information asymmetry argument of Frank and Goyal (2009) that larger farms are
easily noticeable (lenders have information about them) and can get access to loans easily. We
use the natural logarithm of total assets (lnAsset) to measure farm size.
The signaling and the pecking order theories illustrate the relationship between a farm's
financial leverage and growth (investment) opportunity under asymmetric information.
According to the signaling theory, farms attempt to signal their good expectation about the
investment through high leverage or accumulated assets. Based on these signals, then lenders

9
will provide loans. When leverage is taken as signal, high leverage farms are expected to exhibit
higher investment in the same period. This mechanism will lead to a positive relationship
between growth opportunity and leverage. On the other hand, the pecking order theory suggests
that farms will first rely on retained earnings to finance their investment needs. After using their
retained earnings exhaustively to invest in profitable projects, then farm owners prefer to use
debt. This implies a negative relationship between farm growth opportunity and leverage. We
use the ratio of investment to total assets to measure farm growth (investment) opportunity.
Higher earnings variability increases the risk that farms may not be able to meet interest
and principal payment obligations. This implies a negative relationship between leverage and
income variability. However, the information asymmetry and adverse selection argument
underline that farms with high-income volatility and operational risk would also be the one to
apply for loans, thereby indicating a positive relationship between leverage and risk (volatility).
Following De Mey et al., (2015), we use the coefficient of variation of ROA (standard deviation
divide by mean) before interest as a measure farm risk (earnings volatility). Table 1 summarizes
determinates of target capital structure and expected results.
[Insert Table 1 about here]
Macro-economic factors: evidence exists on the impact of farm specific factor on capital
structure decisions. What is often ignored and less investigated is the possible implications of
macro-economic factors in the target farm capital structure decision making. A brief consult to th
literature reveals that inflation, government debt to GDP and employment level in the industry
has a significant impact on capital structure (Frank and Goyal, 2009). We include these variables
in our model.

10
Target Capital Structure and Speed of Adjustment
The trade-off theory postulates that the management of firms assesses the benefits and costs of
alternative leverage plans. Unlike the static trade-off theory that provides the solution of the
optimal capital structure for one period, the dynamic trade-off theory emphasizes the importance
of time, role of expectations and adjustment costs (Fischer, Heinkel and Zechner, 1989). This
fetches dynamism in the capital structure decisions of firms. According to the dynamic trade-off
theory of capital structure, firms make gradual adjustments towards optimal target capital
structure over time. Adjustment to the target would be instantaneous and minimal incentive
exists to do so if the cost of adjustment is zero (Flannery and Hankins, 2007).
Due to the presence of market imperfections such as transaction costs and information
asymmetry, firms may temporarily deviate from their optimal target leverage. This produces an
interesting question of the adjustment speed to target capital structure. Frank and Goyal (2007)
stipulate the framework of the target adjustment hypothesis. The framework point out that the
adjustment speed towards the target capital structure depends on the adjustment costs and the
costs of deviating from the target (Flannery and Hankins, 2007). A slower speed of adjustment is
expected when adjustment costs are high, and when the cost of deviating from the target is high,
a much faster adjustment speed is expected. Faulkender et al., (2012) noted that the incentive to
reduce leverage is greater than that of increasing the same, implying asymmetry in target
adjustment, i.e. firms would adjust faster downward that upward.
Fama and French (2002) estimate the target leverage adjustment and find that, on
average, firms tend to adjust to their target slowly. Contrary, Flannery and Rangan (2006) use an
instrumental variable approach and find that firms do target a long run capital structure. They
also report a much faster rate of adjustment that on average a typical firm reduces one-third of

11
the difference between the actual and long run target leverage in a year. They argue that the
slower rate reported by Fama and French is mainly attributed to the noise in the estimation
strategy of target leverage. Drobetz et al., (2014) find a speed of adjustment about 25% per year
supporting the economic relevance of the trade-off and pecking order theory.
The literature is still tuneless in terms of the measurement of yearly adjustment speed
rates. For farm business, whenever there are changes in the production structure, it either tie up
capital (when capacity increases) or free up capital (when capacity decreases). This results to a
shock in the farm target capital structure. Hence, measuring the sped of adjustment is important
to understand the overall agility of farms and flexibility to adapt to changing production and
finance structure. The measures are usually expressed in terms of the time needed to return to
the target capital structure after a shock (Zhao and Susmel, 2008).
Research Design
This section introduces the standard dynamic partial adjustment model, which will lead to the
econometric specification of the model used in this article. In addition, the nature of the data and
the descriptive statistics of the sample selected farm are provided.
Empirical Model (Dynamic Partial Adjustment Model)
The capital structure decision is expected to be driven by farm specific and macro-economic
factors. To account for these factors, we specify a dynamic capital structure model. Let the
target leverage of farm 𝑖 in period 𝑡, denoted as 𝐿𝐸𝑉∗it , be a function of farm specific and
macroeconomic capital structure determinants, labelled as Xit and Zt respectively, and write:
(1) LEV∗it = ∑ βjjm Xi,t + γmZt

12
The dynamic capital structure model set up implies that the target leverage may vary
across farms and over time. In frictionless economy, the observed leverage of farm 𝑖 at time 𝑡,
LEVit, should be the target leverage (LEVit = LEV∗it). Equation (2) below includes only farm
specific factors and the general model estimated is of the following linear form:
(2) LEVit = α + LEVit−1 + β1𝐴𝑆𝑇it + β2𝐹𝑆it + β3𝐹𝑃it + β4𝐹𝐺it + β5𝐹𝑅it + εit
LEVit is the leverage ratio of farm i at time t , LEVit−1 is a lagged leverage variable
included to construct a dynamic specification that allows for the possible effect of the AR
process and adjustment costs (Byoun, 2008), AST is asset structure, FS is farm size, FP is farm
profitability, FG is farm growth opportunity, FR is farm risk level, ε is the error term, which
consists of individual effect (μi) and disturbance (νit), β, and α are parameters to be estimated. In
equation (3), we add the macroeconomic factors as:
(3) LEVit=α+LEVit-1+β1ASTit+β2FSit+β3FPit+β4FGit+β5FRit+γ6GDPt+γ7Inft+γ8Emplt+ εit
Where, 𝐺𝐷𝑃 is government debt to GDP, 𝐼𝑛𝑓 is inflation and 𝐸𝑚𝑝𝑙 is employment level
in the industry. Others are the same to definitions of equation (2).
Equation (2) and (3) assumes a frictionless economy. In their seminal paper, however,
Titman and Wessels (1988) show that transaction costs are important determinants of capital
structure decision. Such costs tend to prevent firms from attaining target capital structure and
adjustment may occur gradually over time depending on the trade-off between not operating at
target leverage and the costs of adjustment towards to the target (Frank and Goyal, 2009 and
Byoun, 2008). This trade-off suggests that farms adjust their current leverage, LEVit with the
certain speed of adjustment, 𝜆𝑖𝑡 to attain the desired capital, 𝐿𝐸𝑉𝑖𝑡∗ as follows:
(4) LEVit−LEVit−1 = 𝜆𝑖𝑡(LEV∗it−LEVit−1)

13
The specification in equation (4) implies that farms take actions to close the gap between
the current leverage level (LEVit) and the level they wish to achieve (𝐿𝐸𝑉∗it). 𝜆𝑖𝑡 represents the
rate of convergence of LEVit to LEV∗it or is the magnitude of adjustments between two
subsequent periods. Hence, the change in leverage depends on the speed of adjustment 𝜆𝑖𝑡 , and
the distance between lagged leverage (LEVit−1) and the target leverage (LEV∗it).
The existence of adjustment costs is represented by the restriction that |𝜆𝑖𝑡| <1, which is
the condition that LEVit → LEV∗it as 𝑡 → ∞ . If 𝜆𝑖𝑡 is 1, it indicates an immediate and full
correction of deviations from the target farm leverage. If 𝜆𝑖𝑡 < 1, it implies that the farm does
not fully adjust from period 𝑡 − 1 to 𝑡 due to adjustment costs. If 𝜆𝑖𝑡 > 1, the farm adjusts more
than required and is still not at its target leverage level. Finally, if 𝜆𝑖𝑡 = 0, it shows absence of
adjustment (random leverage hypothesis). Since 𝜆𝑖𝑡 represents the degree of adjustment, it can be
seen as the speed of adjustment and higher values denoting a faster speed of adjustment.
It should be noted that the absence of adjustment costs and the aggregation effect, the
inferred relationship will suffer from specification error if the observed farm leverage is
regressed on the determinants of target capital structure alone (Heshmati, 2001). In order to
avoid a misspecification error, equation (4) can be written as,
(5) LEVit = (1 − 𝜆𝑖𝑡)LEVit−1 + λLEV∗it + εit
Where, εit is the error term and assumed to have zero mean and constant variance. In
addition, to endogenize the adjustment speed parameter, we assume that λit vary across farm and
time, and is a function of predetermined variables Xit . Omiting a constant term for the sake of
model tarcabilitry, we will have a linear model as:
(6) λit = θ1Xit

14
Rewriting equation (5) and substituting equation (1) results the following relationship for
farm leverage at time t, LEVit:
(7) LEVit = (1 − θ1Xit)LEVit−1 + θ1Xit(∑ βjjm Xit + γmZt) + εit
The target leverage is modeled as a linear combination of farm specific and
macroeconomics factors and other unobservable determinants. Including this relation of target
leverage and multiplying out equation (7), we obtain equation (8), which is the integrated partial
adjustment model and basis of our empirical investigation:
(8) LEVi,t = α + (1 − 𝜆𝑖𝑡)LEVi,t−1 + β1𝐴𝑆𝑇i,t + β2𝐹𝑆i,t + β3𝐹𝑃i,t + β4𝐹𝐺i,t + β5𝐹𝑅i,t + 𝛾6𝐺𝐷𝑃t
+ γ7𝐼𝑛𝑓t + γ8𝐸𝑚𝑝𝑙t + εi,t
In equation (8), the explanatory variable farm profit (FPit) is potentially endogenous.
According to the pecking-order theory, farms prefer internal funds to external funds for capital
expenditure. Profitable farms have more retained earnings suggesting a negative relationship
between profit and leverage. On the other hand, the relationship can be positive since lenders are
more willing to lend to profitable farms (Zhengfei and Lansink 2006).
Hence, estimating the parameters in the equation (8) using the standard OLS estimator
would lead to inconsistent and biased estimators for the error term may be correlated with the
lagged dependent variable. To ease this problem, we estimate a first difference Generalized
Method Of Moments (GMM), a dynamic panel data estimator suggested by Arellano and Bond
(1991), whereby the levels of the right-hand side (rhs) variables lagged twice or more constitute
valid instruments (Blundell and Bond , 1998).
The GMM estimator allows us to specify the endogenous variables and involves first
differencing that removes the time-invariant, farm-specific effects:
(9) LEVit−LEVit−1 = (1 − λ)(LEVit−1 − LEVit−2) + ∑ βi𝑗 (βit − βit−1) + +∑ γt𝑚 (γt −
γt−1) + εit−εit−1
15
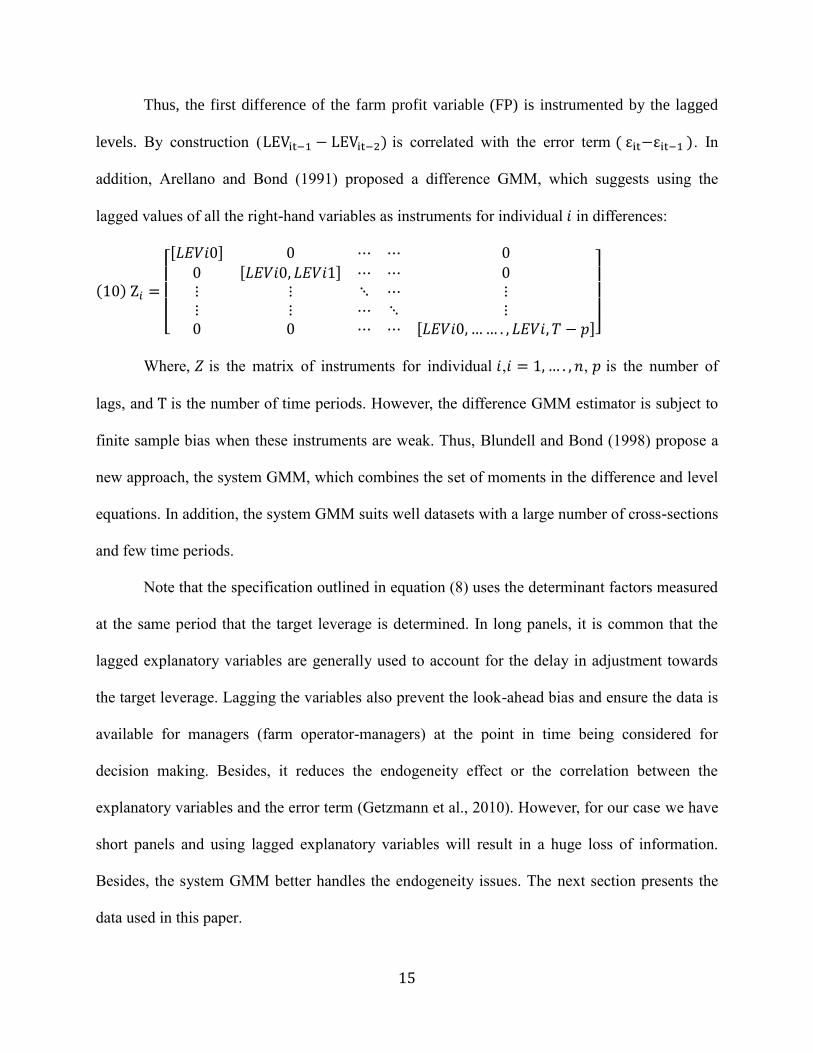
Thus, the first difference of the farm profit variable (FP) is instrumented by the lagged
levels. By construction (LEVit−1 − LEVit−2) is correlated with the error term ( εit−εit−1 ). In
addition, Arellano and Bond (1991) proposed a difference GMM, which suggests using the
lagged values of all the right-hand variables as instruments for individual 𝑖 in differences:
(10) Ζ𝑖 =
[ [𝐿𝐸𝑉𝑖0] 0 ⋯ ⋯ 0
0 [𝐿𝐸𝑉𝑖0, 𝐿𝐸𝑉𝑖1] ⋯ ⋯ 0⋮ ⋮ ⋱ ⋯ ⋮⋮ ⋮ ⋯ ⋱ ⋮0 0 ⋯ ⋯ [𝐿𝐸𝑉𝑖0,…… . , 𝐿𝐸𝑉𝑖, 𝑇 − 𝑝]]
Where, 𝑍 is the matrix of instruments for individual 𝑖,𝑖 = 1, … . , 𝑛, 𝑝 is the number of
lags, and T is the number of time periods. However, the difference GMM estimator is subject to
finite sample bias when these instruments are weak. Thus, Blundell and Bond (1998) propose a
new approach, the system GMM, which combines the set of moments in the difference and level
equations. In addition, the system GMM suits well datasets with a large number of cross-sections
and few time periods.
Note that the specification outlined in equation (8) uses the determinant factors measured
at the same period that the target leverage is determined. In long panels, it is common that the
lagged explanatory variables are generally used to account for the delay in adjustment towards
the target leverage. Lagging the variables also prevent the look-ahead bias and ensure the data is
available for managers (farm operator-managers) at the point in time being considered for
decision making. Besides, it reduces the endogeneity effect or the correlation between the
explanatory variables and the error term (Getzmann et al., 2010). However, for our case we have
short panels and using lagged explanatory variables will result in a huge loss of information.
Besides, the system GMM better handles the endogeneity issues. The next section presents the
data used in this paper.

16
Data
A high-quality data set, which includes consecutive observations for each farm for many years, is
required to examine the variability of farm leverage. In addition, the data must be based on
consistent accounting and economic measurement concepts. Obtaining this type of data set is
challenging. This paper has benefited from a unique longitudinal dataset of Dutch farms that
have been participating in the Farm Accountancy Data Network (FADN).
After the USA, the Netherlands is the second largest exporter of agricultural products (Ge
et al. 2013). The Dutch agriculture sector accounts for 2% of the country’s economy, 20% of the
country's total export value, and 2.5% of employment (Berkhout and van Bruchem 2015).
Furthermore, highly educated farmers, large-scale, capital-intensive farming, export orientation,
increasing input and output price volatility, and sustainable orientation characterize the Dutch
agriculture sector. Hence, the sector provides an interesting context for examining the
determinants and adjustment speed to target capital structure.
The Dutch FADN samples are randomly selected using disproportional stratified
sampling techniques from the farm census (Ge et al. 2013). Economic size and farm type are the
stratification criteria used to select farms. The data we use in this paper are unique in that they
constitute the sole source of farm-level, micro-economic data for more than ten years; the
samples are representative for 80% of the farms and more than 90% of production in the
Netherlands (Ge, et al., 2013) and allow separate estimation of farm types for comparison
purposes thanks to the harmonized data-collection procedure, i.e. the bookkeeping principles are
identical for all farm types. We obtain the data about the macroeconomic factors (inflation,
government debt to GDP, and employment in the industry) from the World Bank.

17
The panel is unbalanced and covers the period 2001 - 2015. To include a farm in the
analysis, we apply the following five criteria: firstly, continuous whole-farm data had to be
available from 2001-2015. Secondly, a farm must have debt, as farm target leverage and
adjustment will not occur without liabilities. Thirdly, given the problem with calculating the
coefficient of variation, farm observations with negative ROA are excluded. Fourthly, given the
lag structure of our model and calculation of business risk (earnings volatility) through a three-
year moving window, farms need to remain in the sample for at least four years. Finally, to
address outlier concerns, extreme values in the dataset are dealt with by dropping the top and
bottom 0.5% observations of the variable from the analysis. These criteria reduced the total
number of farms included in this study to 1,339 (89 percent of the original farms), reduce the
number of observations from 15,682 to 13,677. Table 2 shows the summary statistics of Dutch
farms.
[Insert Table 2 about here]
Average farm leverage ratio for all farms over the 2001–15 periods is 36.3%. It shows
variation by farm type. The average leverage for dairy farms, field crops, horticulture and
livestock are 27.4%, 25.7%, 45.7%, and 41.4% respectively, with horticulture being the largest.
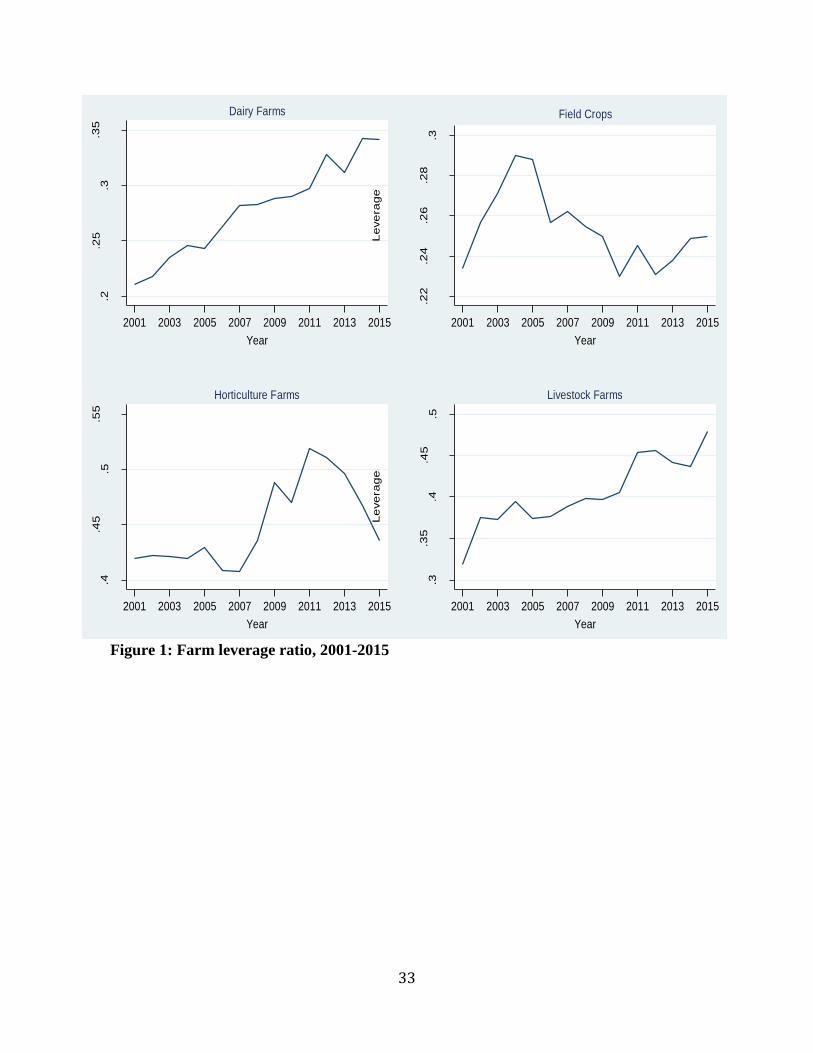
Farms on average earn a 2.53% profit. Figure 1 shows the variation in leverage over the years
across the four farm types.
[Insert Figure 1 about here]
From a general observation, the average leverage ratio does seem convey an increasing
pattern over the years for dairy and livestock farms. The increasing trend of farm borrowing by
the Dutch dairy farms suggests the heavy investment to oblige the obligatory manure processing
in 2014, and increase their scale ahead of the abolition of milk quotas on April 1, 2015. Farm
18
leverage ratio for horticulture farms reaches its peak in 2011 and 2012. This can be explained by
the fact that farms needed extra cash to cover higher energy bill, for cold spring weather in those
years. The next section presents the empirical results.
Empirical Results
Determinants of Target Capital Structure
Tables 3 and 4 show the estimation results of the system GMM based on equation (8). The
Sargan test, Wald test, and AR (2) second-order serial correlation test are presented to gauge the
overall model fit. The Sargan test of over identifying restrictions yields a p-value of 0.990 for
model 1(only farm specific factors) and 0.999 for model 2 (farm specific and macro-econ0mic
factors). This result confirms that the instruments used in the system GMM are valid. The results
of the Wald test are significant at the 1% level for all farm types, ensuring the significance of the
right-hand side variables. The hypothesis of no second-order autocorrelation of the disturbance
term is not rejected at the 5% significance level for both models in Table 3and 4 implying that
there is no serial correlation. The result also implies that the key identifying assumption required
for the GMM estimator is satisfied.
The results in Table 3 show a significant negative relationship between farm profit (FP)
and leverage in all the farm types but dairy farms. Our results confirm the existing evidence in
the literature on the determinants of target leverage. The inverse relationship is consistent with
Myers’ (1984) pecking order theory that internal funding is preferred to external funding. The
high profits earned by farms reduce the need for external finance. Similar result is reported by
Zhao, Katchova and Barry (2004). However, the estimates show that the relationship between
farm profit and leverage ratio is positive and significant for dairy farms. This result is consistent
19
with the signaling theory that the higher profitability of dairy farms sends a positive signal for
lends to provide more loans which, reduces financial constraints.
[Insert Table 3 about here]
There is a marked difference in the size of the coefficients of profitability implying a different
degree of economic significance of farm profit on the capital structure decision. The negative
coefficient, in absolute terms, is the largest for horticulture farms followed by livestock farms.
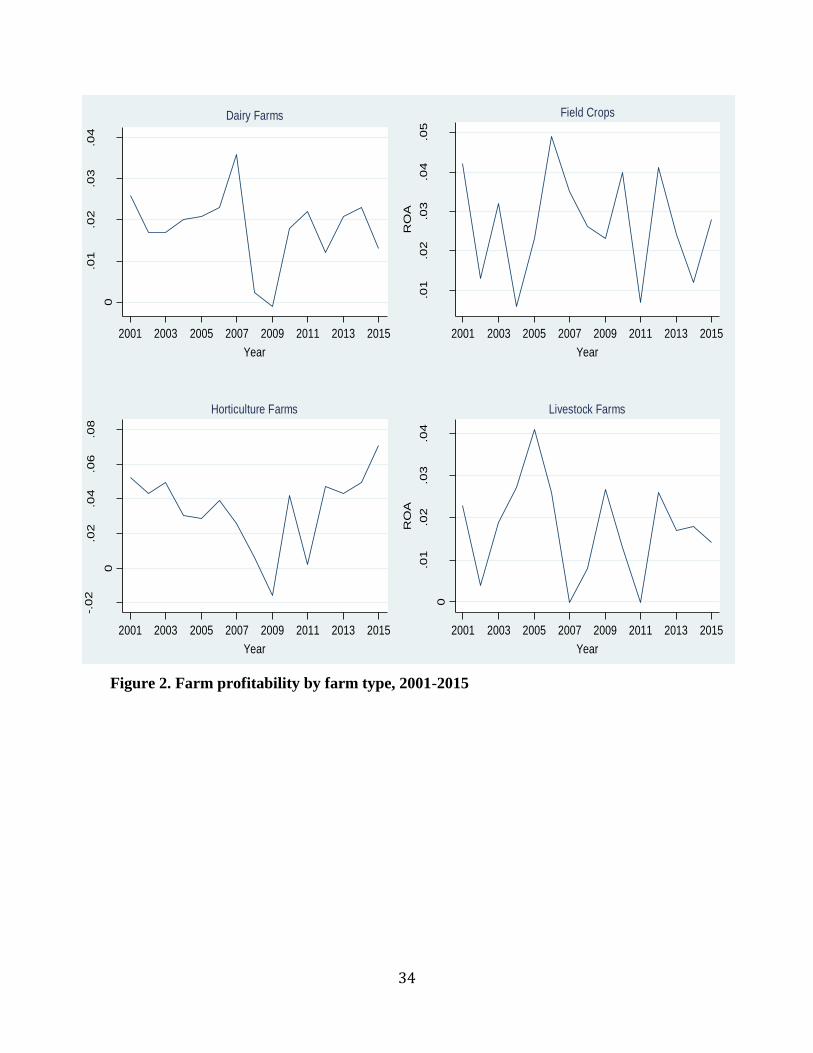
Figure 2 further confirms that compared to other farm types, horticulture farms exhibit a
relatively stable profit over the years and the profit level shows an increment after the years of
the financial crisis. This is largely attributed to the poor production in Southern Europe during
the summer months of the post finical crisis periods, for the price of fruits and vegetables largely
depends on what is produced elsewhere. The increment in profit level of the horticulture farms
asserts the economic significance of the profit variable on leverage ratio.
[Insert Figure 2 about here]
The estimated relationship between asset tangibility and leverage is significant and
positive for dairy farms. This is consistent with the signaling theory that tangible assets are more
valuable to creditors should farms go into liquidation. The result also supports the importance of
tangible assets as collateral for debt financing in agriculture business. However, the relationship
is negative and not significant for other farm types.
We find mixed results about the effects of farm size on leverage. The size of the farm
measured by total asset appears to be positively related to leverage in livestock farms. Larger
farms are known to be less exposed to bankruptcy risk and hence are likely to get more loans
from lenders (Frank and Goyal, 2007). The relationship seems to be significant and negative for

20
dairy farms. Hence, large livestock farms suffer less from asymmetric information and can
obtain more debt.
The conventional view that farms with high volatility of earnings should borrow less is
only supported for field crop farms. The significant and positive relation between earnings
volatility and leverage for horticulture farms is supported by the information asymmetry view
that farms with the highest income volatility and operational risk would always be the one to
apply for the loans.
The relationship between leverage and farm growth opportunity is significantly positive
for all farm types. Results are consistent with the signaling theory that farms attempt to signal
their good expectation about the investment through high leverage suggesting that farm with
high leverage will exhibit high investment in the same period (Jahanzeb, 2013 and Barry et al.,
2000). Table 4 shows the partial adjustment regression results of model 2, where macroeconomic
factors, in addition to farm specific factors, are included as determinants of the capital structure
decision.
[Insert Table 4 about here]
The coefficients of farm specific factors in model 1 and 2 show similar sign and
magnitude, suggesting similar influence on the capital structure decision. Compared to the farm
specific effects, the macro economic factors have a less significant effect on the capital structure
decision. The government debt to GDP has a significant and positive effect on leverage for
horticulture and a negative, but not significant relationship for dairy farms. We don’t suggest that
government debt to GDP is a core determinant (economic significance) since the coefficients
presented in Table 4 are very small. Mixed results are also found about the relationship between
inflation and farm leverage ratio. Lastly, we find a small but significant coefficient showing a
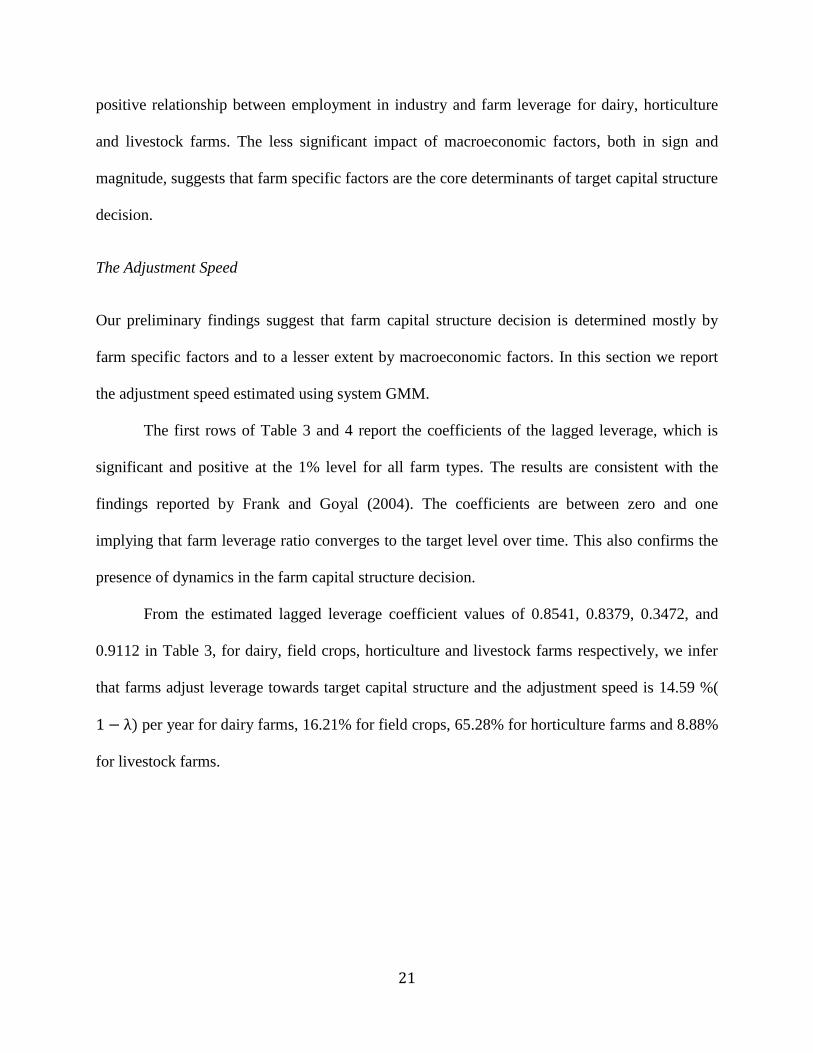
21
positive relationship between employment in industry and farm leverage for dairy, horticulture
and livestock farms. The less significant impact of macroeconomic factors, both in sign and
magnitude, suggests that farm specific factors are the core determinants of target capital structure
decision.
The Adjustment Speed
Our preliminary findings suggest that farm capital structure decision is determined mostly by
farm specific factors and to a lesser extent by macroeconomic factors. In this section we report
the adjustment speed estimated using system GMM.
The first rows of Table 3 and 4 report the coefficients of the lagged leverage, which is
significant and positive at the 1% level for all farm types. The results are consistent with the
findings reported by Frank and Goyal (2004). The coefficients are between zero and one
implying that farm leverage ratio converges to the target level over time. This also confirms the
presence of dynamics in the farm capital structure decision.
From the estimated lagged leverage coefficient values of 0.8541, 0.8379, 0.3472, and
0.9112 in Table 3, for dairy, field crops, horticulture and livestock farms respectively, we infer
that farms adjust leverage towards target capital structure and the adjustment speed is 14.59 %(
1 − λ) per year for dairy farms, 16.21% for field crops, 65.28% for horticulture farms and 8.88%
for livestock farms.

22
This speed of adjustments corresponds to a half-life of leverage shocks of about 4.4, 3.9, 0.65,
and 7.4 years respectively. Compared to findings reported by other studies, the adjustment speed
of Dutch farms is slow except for horticulture farms. For instance, studies from the US report
adjustment speed at around 25% (Frank and Goyal, 2004).
The slow adjustment to the target leverage is mainly attributed to the high adjustment
cost. Two factors might explain the high adjustment cost of Dutch farm business. First, for farm
business it is not easy to access loan and equity markets. There are only few financial institutions
in the Netherlands that specializes in agricultural financing. Second, since farm businesses are
small and medium in size, there is an adverse selection issues as a result of information
asymmetry, which makes it adjustments costly. The high adjustment speed by horticulture farms
could indicate the ease with which horticulture farms have been able to acquire financing
through debt and, hence, have lower adjustment cost. A closer look to Table 4 tells us that the
sign and magnitude of the estimated coefficients of model 2 are similar. This suggests that the
adjustment speed is not changed, given the effects of macroeconomic factors on the target capital
structure decision.
Half-life is the time the process needs to close the gap between the actual and target farm
leverage level by half (50%), after a one unit shock to the error term. Hence, half-life is
calculated as 𝑙𝑜𝑔 (0.5)/𝑙𝑜𝑔 ( 𝜆) (Faulkender et al., 2012). For example, the λ estimate in Table 3
for dairy farms is 0.8541, which means that a typical dairy farm closes about 14.59% (1 − λ) of
its gab between its current level of leverage and the target in one year. At this rate, it takes
approximately 4.4 years for the farm to close half of the gap between the current and target
leverage, or about 9 years for the average dairy farm to adjust to its target capital structure after
shock.
23
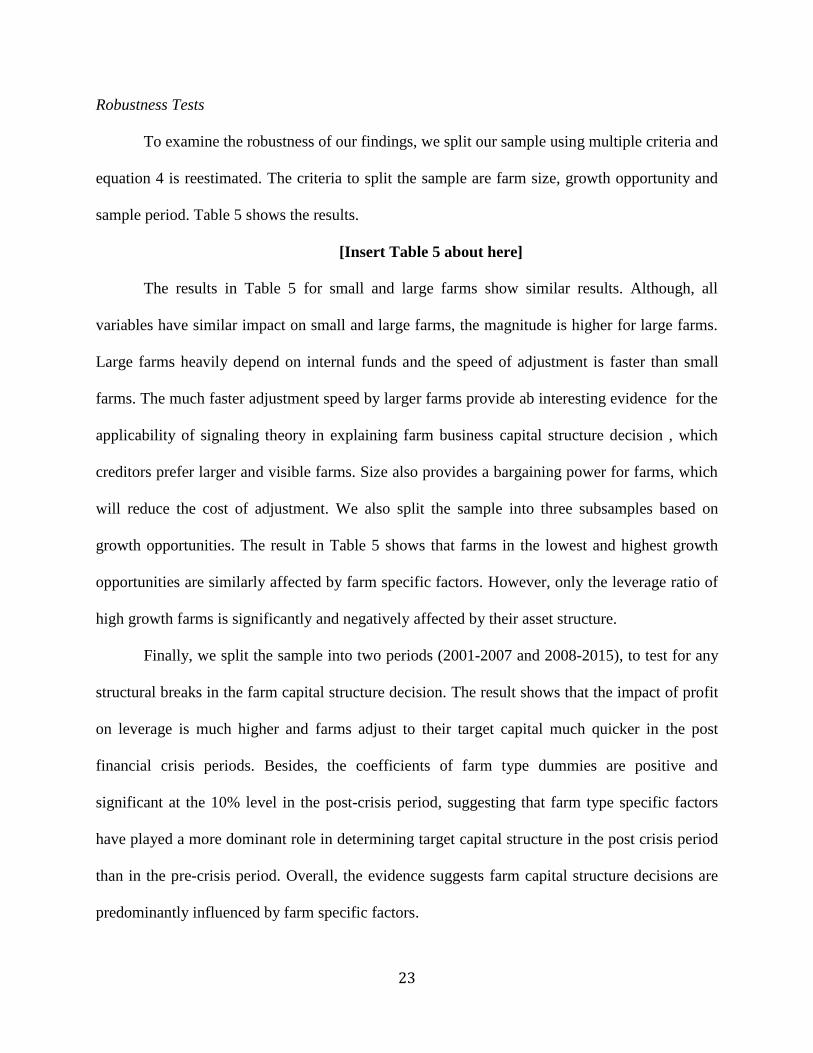
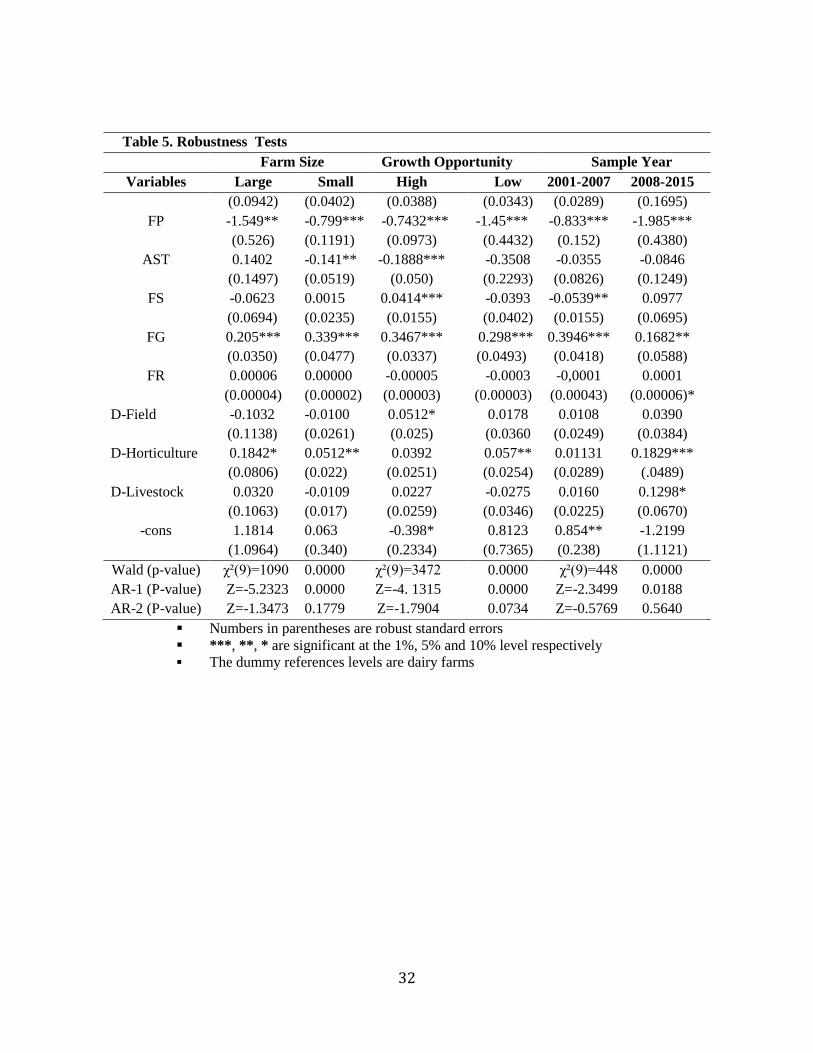
Robustness Tests
To examine the robustness of our findings, we split our sample using multiple criteria and
equation 4 is reestimated. The criteria to split the sample are farm size, growth opportunity and
sample period. Table 5 shows the results.
[Insert Table 5 about here]
The results in Table 5 for small and large farms show similar results. Although, all
variables have similar impact on small and large farms, the magnitude is higher for large farms.
Large farms heavily depend on internal funds and the speed of adjustment is faster than small
farms. The much faster adjustment speed by larger farms provide ab interesting evidence for the
applicability of signaling theory in explaining farm business capital structure decision , which
creditors prefer larger and visible farms. Size also provides a bargaining power for farms, which
will reduce the cost of adjustment. We also split the sample into three subsamples based on
growth opportunities. The result in Table 5 shows that farms in the lowest and highest growth
opportunities are similarly affected by farm specific factors. However, only the leverage ratio of
high growth farms is significantly and negatively affected by their asset structure.
Finally, we split the sample into two periods (2001-2007 and 2008-2015), to test for any
structural breaks in the farm capital structure decision. The result shows that the impact of profit
on leverage is much higher and farms adjust to their target capital much quicker in the post
financial crisis periods. Besides, the coefficients of farm type dummies are positive and
significant at the 10% level in the post-crisis period, suggesting that farm type specific factors
have played a more dominant role in determining target capital structure in the post crisis period
than in the pre-crisis period. Overall, the evidence suggests farm capital structure decisions are
predominantly influenced by farm specific factors.
24
Conclusion
In this article, we aim to examine the effects of farm-specific and macroeconomic factors in
determining the target capital structure and the speed of adjustment. We apply dynamic panel
system GMM estimation to a unique panel consisting of 1500 farms over fifteen years.
We find strong evidence of farms preference for internal funds over external funds.
Interestingly, we find profit to be negatively related to leverage, supporting the pecking order
theory. Consistent with the signaling theory, we find that size is positively related to leverage.
Farm asset structure, growth, investment, and risk significantly determine farm capital structure.
Although most of the variables identified in the literature affect the leverage of farms, the degree
and importance of these factors are farm type specific Though not strong, macroeconomic factors
also determine farm capital structure decision. Hence, the capital structure decision of a farm is
not only the product of its own specific characteristics, but partially also the macroeconomic
environment in which it operates.
It is worth noting that farm leverage is highly persistent and that lagged leverage is the
best predictor of subsequent leverage ratios. Also, farms appear to have target leverage ratio and
are reported to adjust their leverage towards the optimal level. The speed of adjustment to the
target capital is slow and varies on size and farm type. The speed of adjustment is relatively
faster for horticulture farms and relatively slower for livestock farms. This evidence further
confirms the existence of dynamics in the farm capital structure decision. This research provides
insights to understanding the dynamic nature of farm capital structure and the applicability of
capital structure theories in farm business (small and medium size context). Furthermore, the
results indicate that the pecking order and signaling theories explain, in part, the farm target
capital structure.

25
This paper has limitations that motivate further research. In spite of the fact that we use
high-quality, unique panel data, we rely merely on farm accounting dataset. Future research may
complement this with behavioral data on, for example, farm risk attitude and perception. Future
research can also test for the applicability of the other theories of capital structure to the farm
business and for its impact on farm performance (profitability, survival and viability).

26
Reference
Ampenberger, M., Schmid, T., Achleitner, A. K., & Kaserer, C. 2013. Capital Structure
Decisions in Family Firms: Empirical Evidence From a Bank Based Economy. Review
of Managerial Science, 7(3): 247-275.
Arellano, M and Bover O. 1995. Another Look at the Instrumental Variable Estimation of
Error-components Models. Journal of Econometric, 68(1): 29-51.
Barry, P.J., R.W. Bierlen, and N.L. Sotomayor. 2000. Financial Structure of Farm
Businesses Under Imperfect Capital Markets. American Journal of Agricultural
Economics, 82(4):920-933.
Berkhout, P., and C. Van Bruchem. 2015. Agricultural Economic Report 2015 of The
Netherlands: Summary. https://www.wur.nl/upload_mm/6/5/1/57e0a915-70f3-49d0-
adb2-5b24d17e112b_Summarry_AgriculturalEconomicReport2015.pdf.
Berger, A. N., & Bouwman, C. H. 2013. How Does Capital Affect Bank Performance
During Financial Crises? Journal of Financial Economics, 109(1): 146-176.
Blundell, R., and S. Bond. 1998. Initial Conditions and Moment Restrictions in Dynamic
Panel Data Models. Journal of Econometrics, 87(1):115-143.
Byoun, Soku. 2008. How and When Do Firms Adjust their Capital Structures Toward
Targets? The Journal of Finance, 63(6): 3069-3096.
De Mey, Y., Wauters, E., Schmid, D., Lips, M., Vancauteren, M., & Van Passel, S. 2015.
Farm Household Risk Balancing: Empirical Evidence from Switzerland. European
Review of Agricultural Economics, Jbv030.
Donaldson, Gordon, and Bertrand Fox. 2000. Corporate Debt Capacity: A Study of
Corporate Debt Policy and the Determination of Corporate Debt Capacity. Beard
Books.
Drobetz, W., Schilling, D.C. and Schröder, H., 2015. Heterogeneity in the Speed of Capital
Structure Adjustment across Countries and over the Business Cycle. European
Financial Management, 21(5):936-973.

27
Escalante, C.L., and P.J. Barry. 2003. Determinants of the Strength of Strategic Adjustments
In Farm Capital Structure. Journal of Agricultural and Applied Economic, 35(01):67-
78.
Fama, Eugene F., and Kenneth R. French. 2002. Testing Trade-Off and Pecking Order
Predictions about Dividends and Debt. Review of Financial Studies 15(1):1-33.
Faulkender, Michael, Mark J. Flannery, Kristine Watson Hankins, and Jason M. Smith.
2012. Cash Flows and Leverage Adjustments. Journal of Financial Economics,103
(3): 632-646.
Featherstone, A. M., Ibendahl, G. A., Randy Winter, J., & Spaulding, A. 2005. Farm
Financial Structure. Agricultural Finance Review, 65(2): 97-117.
Fischer, E.O., Heinkel, R. and Zechner, J., 1989. Dynamic Capital Structure Choice: Theory
and Tests. The Journal of Finance, 44(1):19-40.
Flannery, M.J. and Rangan, K.P., 2006. Partial Adjustment toward Target Capital
Structures. Journal of Financial Economics, 79(3):469-506.
Frank, M.Z. and Goyal, V.K. 2007. Trade-Off and Pecking Order Theories of
Debt. Handbook of Empirical Corporate Finance Vol. 2.
Frank, M.Z. and Goyal, V.K., 2004. The Effect of Market Conditions on Capital Structure
Adjustment. Finance Research Letters, 1(1):47-55.
Frank, M.Z. and Goyal, V.K., 2009. Capital Structure Decisions: Which Factors Are
Reliably Important? Financial Management, 38(1):1-37.
Ge, L., H. Van Der Veen, R. Van Der Meer, and H. Vrolijk. 2013. Sample of Dutch FADN.
LEI Wageningen UR. Available at http://edepot.wur.nl/364565
Getzmann, A., Lang, S. and Spremann, K., 2010. Determinants of the Target Capital
Structure and Adjustment Speed–Evidence From Asian Capital Markets. In European
Financial Management Symposium.
Heshmati, A., 2001. The Dynamics of Capital Structure: Evidence from Swedish Micro and
Small Firms. Research in Banking and Finance, 2(1):199-241.
28
Jahanzeb, A. 2013. Trade-Off Theory, Pecking Order Theory and Market Timing Theory: A
Comprehensive Review of Capital Structure Theories. Economics Bulletin, 33(1).
Katchova, A.L., 2005. Factors Affecting Farm Credit Use. Agricultural Finance Review,
65(2):17-29.
Modigliani, Franco, and Merton H. Miller. 1958. The Cost of Capital, Corporation Finance
and the Theory of Investment. The American Economic Review, 48(3):261-297.
Myers, Stewart C. 1984. The Capital Structure Puzzle. The Journal of Finance, 39(3): 574-
592.
Myers, Stewart C., and Nicholas S. Majluf. 1984. Corporate Financing and Investment
Decisions When Firms Have Information that Investors Do Not Have. Journal of
Financial Economics, 13 (2): 187-221.
Nurmet, M. 2011. Financial Structure of Agricultural Firms. Management Theories and
Studies for Rural Business and Infrastructure Development, 25(1):187-193.
Ross, Stephen A. 1977. The Determination of Financial Structure: The Incentive-Signaling
Approach. The Bell Journal of Economics, 8 (1): 23-40.
Titman, S. and Wessels, R., 1988. The Determinants of Capital Structure Choice. The
Journal of Finance, 43(1):1-19.
Zhao, J., Katchova, A.L. and Barry, P.J., 2004. Testing the Pecking Order Theory and the
Signaling Theory for Farm Businesses, Urbana, 51, 61801.
Zhengfei, G., and A.O. Lansink. 2006. The Source of Productivity Growth in Dutch
Agriculture: A Perspective from Finance. American Journal of Agricultural
Economic, 88(3):644-656.
Zhao, T. and Susmel, R., 2008. Testing The Trade-Off Theory of Capital Structure: A
Kalman Filter Approach.

29
Table 1. Determinants of Target Capital Structure
Determinant Pecking Order Theory Signaling Theory
1 Farm Profit (FP) - +
2 Asset structure (AST) + +
3 Farm size (FS) + +
4 Growth (Investment) - +
Opportunity (FG)
5 Risk (Volatility) (FR) - -
Table 2. Variables and Summary Statistics of Dutch Farms, 2001-2015
Variable Explanation Obs. Mean SD
Leverage Total Debt/Total Asset 15,682 0.363 0.289
Dairy Farms
4,101 0.274 0.163
Field Crops
2,695 0.253 0.204
Horticulture
5,136 0.457 0.375
Livestock
3,750 0.414 0.259
Asset Structure Fixed Asset/Total Asset 15,682 0.709 0.172
Farm Size Natural Log of Total Asset 15,682 14.567 0.847
Profit (ROA) Net Farm Income/Total Asset 15,682 0.0253 0.091
Growth Opportunity Total Investment/Total Asset 15,682 0.043 0.078
Earnings Volatility Coefficient of variation of
ROA 13,677 0.616 23.70

30
Table 3. Dynamic Panel Regression Results: Model 1
Variables Dairy Field Crops Horticulture Livestock
LEV t-1 0.8541*** 0.8379*** 0.3472*** 0.9112***
(0.020) (0.042) (0.135) (0.067)
FP 0.238** -0.501*** -1.972*** -0.827***
(0.119) (0.165) (0.528) (0.1059)
AST 0.0896*** -0.053 -0.0297 -0.0183
(0.016) (0.071) (0.210) (0.0475)
FS -0.0234** -0.0139 0.0875 0.0338*
(0.0122) (0.011) (0.0586) (0.0205)
FG 0.372*** 0.3551*** 0.0923* 0.404***
(0.042) (0.061) (0.0620) (0.0543)
FR 0.00001 -0.0001* 0.0001** -0.000076
(0.0002) (0.00005) (0.0007) (0.00057)
-cons 0.3188*** 0.2839 -0.8822 -0.4354
(0.174) (0.1776) (0.9946) (0.3022)
Wald χ²(6)=482.67***
Sargan Test χ²(151)=945.1 P-value=0.990
AR (1) Z=-7.4523 P-value=0.000
AR (2) z=-1.6229 P-value=0.105
Numbers in parentheses are robust standard errors
***, **, * are significant at the 1%, 5% and 10% level respectively

31
Numbers in parentheses are robust standard errors
***, **, * are significant at the 1%, 5% and 10% level respectively
Table 4. Dynamic Panel Data Estimation Results: Model 2
Variables Dairy Field Crops Horticulture Livestock
LEV t-1 0.8577*** 0.8354*** 0.3247*** 0.8881***
(0.0212) (0.0415) (0.123) (0.0706)
FP 0.309** -0.492*** -1.917*** -0.870***
(0.125) (0.165) (0.5108) (0.1096)
AST 0.091*** -0.053 -0.0303 -0.0268
(0.028) (0.072) (0.1988) (0.0532)
FS -0.0252* -0.0172 0.0891 0.0509*
(0.0131) (0.0141) (0.0565) (0.0250)
FG 0.374*** 0.3555*** 0.1099* 0.3810***
(0.0425) (0.0614) (0.0563) (0.0534)
FR 0.00002 -0.0001* 0.0001** -0.00008
(0.0003) (0.00005) (0.00008) (0.00006)
GDP -0.0002 0.00011 0.0047*** 0.005
(0.0002) (0.0003) (0.0011) (0.0003)
Inf -0.008*** -0.001 0.0028** 0.0196***
(0.0017) (0.002) (0.0037) (0.0029)
Empl 0.0131** 0.0021 0.0706*** 0.0333***
(0.046) (0.007) (0.0317)* (0.0102)
-cons 0.3115** 0.3273*** -1.3492 -0.8125**
(0.181) (0.2159) (0.9085) (0.3944)
Wald χ²(9)=459.31
S-Test χ²(151)=849.8 P-value= 0.9990
AR(1) Z=-7.6108 P-value= 0.0000
AR(2) z=-1.3314 P-value= 0.1831
32
Table 5. Robustness Tests
Farm Size Growth Opportunity Sample Year
Variables Large Small High Low 2001-2007 2008-2015
(0.0942) (0.0402) (0.0388) (0.0343) (0.0289) (0.1695)
FP -1.549** -0.799*** -0.7432*** -1.45*** -0.833*** -1.985***
(0.526) (0.1191) (0.0973) (0.4432) (0.152) (0.4380)
AST 0.1402 -0.141** -0.1888*** -0.3508 -0.0355 -0.0846
(0.1497) (0.0519) (0.050) (0.2293) (0.0826) (0.1249)
FS -0.0623 0.0015 0.0414*** -0.0393 -0.0539** 0.0977
(0.0694) (0.0235) (0.0155) (0.0402) (0.0155) (0.0695)
FG 0.205*** 0.339*** 0.3467*** 0.298*** 0.3946*** 0.1682**
(0.0350) (0.0477) (0.0337) (0.0493) (0.0418) (0.0588)
FR 0.00006 0.00000 -0.00005 -0.0003 -0,0001 0.0001
(0.00004) (0.00002) (0.00003) (0.00003) (0.00043) (0.00006)*
D-Field -0.1032 -0.0100 0.0512* 0.0178 0.0108 0.0390
(0.1138) (0.0261) (0.025) (0.0360 (0.0249) (0.0384)
D-Horticulture 0.1842*
(0.0806)
0.0512**
(0.022)
0.0392
(0.0251)
0.057**
(0.0254)
0.01131
(0.0289)
0.1829***
(.0489)
D-Livestock 0.0320
(0.1063)
-0.0109
(0.017)
0.0227
(0.0259)
-0.0275
(0.0346)
0.0160
(0.0225)
0.1298*
(0.0670)
-cons 1.1814 0.063 -0.398* 0.8123 0.854** -1.2199
(1.0964) (0.340) (0.2334) (0.7365) (0.238) (1.1121)
Wald (p-value) χ²(9)=1090 0.0000 χ²(9)=3472 0.0000 χ²(9)=448 0.0000
AR-1 (P-value) Z=-5.2323 0.0000 Z=-4. 1315 0.0000 Z=-2.3499 0.0188
AR-2 (P-value) Z=-1.3473 0.1779 Z=-1.7904 0.0734 Z=-0.5769 0.5640
Numbers in parentheses are robust standard errors
***, **, * are significant at the 1%, 5% and 10% level respectively
The dummy references levels are dairy farms
33
Figure 1: Farm leverage ratio, 2001-2015
.2.2
5.3
.35
Le
ve
rag
e
2001 2003 2005 2007 2009 2011 2013 2015
Year
Dairy Farms
.22
.24
.26
.28
.3
Le
ve
rag
e
2001 2003 2005 2007 2009 2011 2013 2015
Year
Field Crops.4
.45
.5.5
5
Le
ve
rag
e
2001 2003 2005 2007 2009 2011 2013 2015
Year
Horticulture Farms
.3.3
5.4
.45
.5
Le
ve
rag
e
2001 2003 2005 2007 2009 2011 2013 2015
Year
Livestock Farms
34
Figure 2. Farm profitability by farm type, 2001-2015
0
.01
.02
.03
.04
RO
A
2001 2003 2005 2007 2009 2011 2013 2015
Year
Dairy Farms
.01
.02
.03
.04
.05
RO
A
2001 2003 2005 2007 2009 2011 2013 2015
Year
Field Crops
-.0
2
0
.02
.04
.06
.08
RO
A
2001 2003 2005 2007 2009 2011 2013 2015
Year
Horticulture Farms
0
.01
.02
.03
.04
RO
A
2001 2003 2005 2007 2009 2011 2013 2015
Year
Livestock Farms