Tarbutton Road Interchange and I-20 Frontage Roads Tech... · Tarbutton Road Interchange and I-20...
52
Tarbutton Road Interchange and I-20 Frontage Roads Dr. N. Wasiuddin – Instructor Braden Smith – Project Manager Jared Taylor – Transportation Group John Harrison – Geotechnical Group Sarah Wells – Water Group Samantha Tatro – Structural Group Ryan Ross – Estimating and Planning Group
Transcript of Tarbutton Road Interchange and I-20 Frontage Roads Tech... · Tarbutton Road Interchange and I-20...

Tarbutton Road Interchange and I-20 Frontage Roads
Dr. N. Wasiuddin – Instructor
Braden Smith – Project Manager
Jared Taylor – Transportation Group
John Harrison – Geotechnical Group
Sarah Wells – Water Group
Samantha Tatro – Structural Group
Ryan Ross – Estimating and Planning Group

• Project Overview
• Timeline
• Current State
– Transportation
– Geotechnical
– Water
– Structural
– Estimating and Planning
• Questions

Working Period: September, 2012 – May, 2013
Objectives: Add “Exit 83” at Tarbutton Road
Construct a Wider Tarbutton Road Bridge
Relativeness: Under Review by LA DOTD
Preliminary Data:
Survey Data – Waggoner Engineering
Boring Logs – Copies Provided from DOTD Plans
Traffic Data – Copies Provided from DOTD Plans

September – Teams Formed and Project Defined October – Researching Manuals and Software November – Learning Software Packages December – Calculations and Modifying Procedures January – Design/Calculations February – Design/Calculations
Transportation
Structures
Water
Estimating and
Planning

Ruston
Jr. High
Misc. Businesses
Objectives • Improve I-20 Access
• Alignment for Tarbutton Interchange
• Pavement Design
• Traffic Design
• Minimize Project Cost

Geometric Design • Followed AASHTO: Geometric Design of
Highways and Streets
• AutoCad Civil3D – Main Software • Horizontal Alignment • Vertical Alignment • Pavement Cross-Sections • Intersections • Lane Widening

AutoCad Civil3D
• Received *.dwg file from Waggoner • Survey Data and Topographic Maps
Tarbutton Road Alignment • Multiple problem areas to avoid • Main Roadway and all entrance and exit ramps • Civil 3D uses Design Speed, minimum radius of curvature, and super elevation to govern curves • 45 mph design for Tarbutton • 35 mph design for ramps

Vertical Alignment • Tarbutton Road •East Bound Ramps •West Bound Ramps

Cut/Fill • Calculated from the corridor to the existing surface

Pavement Design AI Method • Initial AADT 3990 veh/day
• Asphalt Institute SW-1 Input:
• Vehicle Type Percentage • Truck Factors • Minor Arterial System
• Initial Year ESAL • Design Period ESAL • 6.6” HMA over 8” Aggregate Base

Pavement Analysis • Mechanistic approach
• Two main failure modes • Fatigue Cracking • Rutting
• Causes
• Tensile Strain • Compressive Strain
Fatigue Cracking
18 Kip ESAL
Rutting

Pavement Analysis • Kenpave
• Evaluates Durability and Life Expectancy • Based on Load Repetitions
• Repetitions Cause Pavement Failure • Rutting and Fatigue Cracking

Tasks
• Soil Investigation – Fall Quarter – Soil Sampling
– Soil Testing
– Soil Profile
• Pile Design – Winter Quarter – Ultimate Bearing Capacity
– Pile Grouping Design
• Slope Stability – Spring Quarter – Slope Stability

Field Sampling
• Disturbed soil sampling
• 1ft – 4ft
• Hand augers

Field Sampling
• Initially brown clayey soil.
• Transitioned into reddish sandy clay material around 3 ft depth.

Soil Tests
• Moisture Content
• Sieve Analysis
• Specific Gravity
• Plastic Limit
• Liquid Limit

Soil Testing
• Results correlated with information provided in boring logs.
• Provided hands on experience with collecting data and performing tests.

Soil Profile
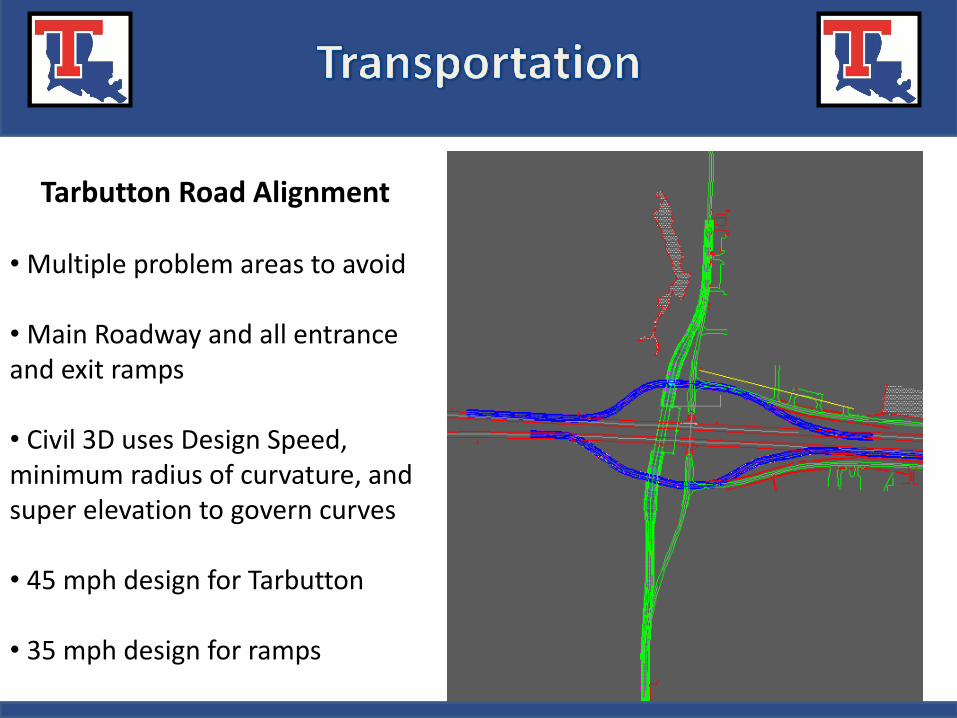
Bearing Capacities
• Bearing Capacities
– Driven - Software
– LA DOTD Pile Capacity Design Guide
• Piles are being placed in very dense gray clayey sand layer.

Pile Grouping
• 3 or 4 Columns
• 16 – (18” piles)
• Spacings 4.5ft center to center. Group dimensions are B= 10.5ft and Z= 37.5ft

Objectives • Calculate Runoff
• Ditch Analysis
• Existing Culvert Analysis

CATCHMENT 3 AREA = 28.627 ACRE
GRADE: 2% HYDRAULIC LENGTH: 2410FT
CATCHMENT 2 AREA = 11.485 ACRE
GRADE: 1% HYDRAULIC LENGTH: 1733FT
CATCHMENT 4 AREA = 15.443 ACRE
GRADE: 4% HYDRAULIC LENGTH: 1687FT
CATCHMENT 1 AREA = 11.577 ACRE
GRADE: 2% HYDRAULIC LENGTH: 1733FT

Introduction Existing Conditions Catchment Areas Analysis Conclusion
College of Engineering and Science

Introduction Existing Conditions Catchment Areas Analysis Conclusion
College of Engineering and Science
Project Classification
• Design type
• Rural – Open ditch facilities
Frequency
• 50 year storm
DRAINAGE CLASSIFICATION FREQUENCY
Interstates 50 years
Roadway Grade, Bridges, Cross Drains, or Side Drains under
important side roads 25 or 50 years
Side Drains under private drives & average conditions 5 years
Median Drains 10 years
Storm Drains and Inlets 10 years
Roadside Channel 5 years
Detour Road Structures 1 year minimum
Introduction Existing Conditions Catchment Areas Analysis Conclusion
College of Engineering and Science
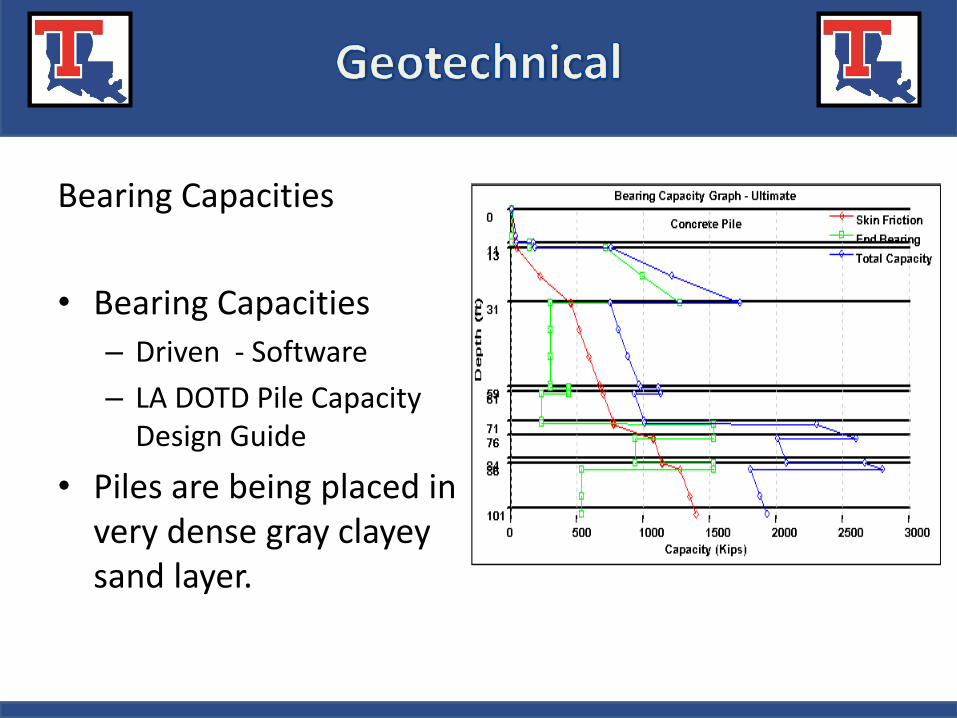
Rational Method
• Catchment Areas
• Rainfall Region
• Runoff Coefficient
• Time of Concentration
• Intensity
• Final Peak Runoff Data
Q= CiA Q= peak runoff rate (ft^3/sec)
C= runoff coefficient
i= average rainfall intensity at time of concentration
A= drainage area

Introduction Existing Conditions Catchment Areas Analysis Conclusion
Runoff Coefficient
• Hydraulics Manual
• Industrial Light Areas
Lincoln Parish
C = 0.50

Introduction Existing Conditions Catchment Areas Analysis Conclusion
Results of Runoff
Catchment Area (acre) Hydraulic Length (ft)
Slope Time of
Concentration (hr)
Intensity (in/hr)
Peak Runoff (ft3/sec)
1 11.6 1733 2% 1.04 0.234 1.363
2 11.5 1733 1% 1.19 0.215 1.243
3 28.6 2410 2% 1.18 0.216 3.114
4 15.4 1687 4% 0.89 0.255 1.986

Drainage
Side Ditch Cross Drain Culvert

Side Drainage Calculations
Side Drainage Calculations
• Hydraulic Radius
• Manning's Formula
• Critical Depth
If d dc then the flow is tranquil
If d dc then the flow is turbulent

Side Ditch Results
Side Ditch Flow Rate (ft^3/sec)
Slope (%)
Depth (ft)
Critical Depth (ft)
New Slope (%)
New Depth (ft)
1 1.363 3.12 0.179 0.285 0.112 0.439
2 1.243 3.12 0.17 0.269 0.112 0.42
3 3.114 2.37 0.304 0.4517 0.37 0.494
4 1.986 2.25 0.242 0.352 0.25 0.434

Design Approach
• Manual Calculations using Excel Spreadsheets
• Verifying design through use of softwares
• Two main softwares used: – QConBridge
– STAAD Pro

QConBridge
• Check maximum moment and shear • Manual calculations varied by less than 1%

STAAD Pro • Finite element analysis and design software
• Creates 3D model of bridge

Project Overview
• Bridge length: 300 ft. • 4 lanes

Side View
Span 1: Span 2: Span 3: Span 4: 50 ft. 80 ft. 80 ft. 90 ft.

• Maximum Span Length: 100 ft
Girder Selection:
AASHTO

Bridge Cross-Section • Girder spacing: 8ft. • Overhang spacing: 3ft. - 11in • Lane width: 12ft. • Shoulder width: 10 ft.- 8 in

Slab Design • Maximum Design Span: 6.667 ft

Slab Reinforcement

F- Shape (PL-2)

Initial Substructure Design

Resources

Calculating Estimate
• Unit Price * Quantity = Total Cost per Bid Item
• (7200 sy)*($38.43/sy) = $276,696.00

Construction Cost Estimate Summary Project Estimated Cost
Earthwork 3,001,674.15 Tarbutton Road 797,136.00 Interchange Ramps 1,217,707.00 Drainage 142,268.63 Bridge (Partial Estimate) 950,459.62 Traffic Engineering 80,204.68 Roadside Development 33,653.37
$ 6,223,103.45

Earthwork
• Roadway excavation
• Embankment
• Borrow
$3,001,674.15

Asphalt Pavement
• Superpave asphaltic concrete
• Class II Base Course (varying thicknesses)
$2,014,843.00

Drainage
• Storm drain pipe (18” RCP)
• Class A concrete
• Trenching
$142,268.63

Bridge Construction
• Class A & AA concrete
• Precast concrete test piles
• Reinforcing steel
• Expansion joint seal
$950,459.62
Traffic Engineering
• Traffic signals
• Signage
• Pavement markings
$80,204.68

Roadside Development
• Topsoil
• Seeding
$33,653.37

Questions