Tanzania Transport Infrastructure and Demand - … Transport Version 2.pdf · Tanzania Transport...
43
Tanzania Transport Infrastructure and Demand Version 2.0 © IT Transport 2012 Use of this material by permission from IT Transport only.
-
Upload
truongthien -
Category
Documents
-
view
218 -
download
1
Transcript of Tanzania Transport Infrastructure and Demand - … Transport Version 2.pdf · Tanzania Transport...

Tanzania Transport Infrastructure and Demand
Version 2.0
© IT Transport 2012 Use of this material by permission from IT Transport only.

Transport Infrastructure and Demand
2
Acronyms
JICA Japan International Cooperation Agency TAA Tanzania Airports Authority TANROADS Tanzania National Roads Agency TCAA Tanzanian Civil Aviation Authority TPA Tanzania Ports Authority

3
TableofContentsIntroduction ............................................................................................................................................................. 5
Infrastructure ........................................................................................................................................................... 6
Sector Overview .................................................................................................................................................. 6
Water Transport: Sea and Lakes ........................................................................................................................... 8
Road Transport .................................................................................................................................................. 10
Railways ............................................................................................................................................................ 20
Air Transport ..................................................................................................................................................... 22
Demand Analysis and Forecasts ............................................................................................................................. 26
Overview of Demand Sources ............................................................................................................................ 26
Port Traffic ........................................................................................................................................................ 30
Trunk Roads, Non-Trunk Roads, and Rail Transport .......................................................................................... 35
Air Transport ..................................................................................................................................................... 42

Transport Infrastructure and Demand
4
This page intentionally left blank.

5
Introduction The demand for transport in Tanzania is driven by both internal and external factors, and faces its own set of unpredictability, both in the short term and in the long term. The last comprehensive set of forecasts for demand, for example, dating back to 2001, significantly underestimated Tanzania’s economic growth rates. During the economic slowdown that affected most of the world, Tanzania has actually grown vigorously except for a dip at the onset of the global recession in 2008/9.
Transport systems are also intertwined with their own modal shifts. For example, the shift experienced in rail away towards road transport may not just be the outcome of much needed additional investments in rail infrastructure, but may also be caused by the improvement of road infrastructure, reflecting a global trend in all but the wealthiest countries.
In addition, while much attention has been given to the external demands created by the needs of Tanzania’s landlocked neighbors, internally Tanzania faces deep pockets of transport demand not yet met by infrastructure, including in more rural areas. By the same token, the urbanization is stressing urban traffic capacities. Though urbanization may be seen as a trend of the population away from the countryside to cities, this does not imply that meeting demand be focused on urban areas alone: rural areas my still have and even develop deep pockets of unmet demand that will not be eliminated through urbanization.
As demand and infrastructure are being discussed, it is important to keep in mind that the traffic/demand forecasts and infrastructure assessments are for the five year period between 2012/13 and 2017/18. Since most of the major infrastructure developments sought will most likely not come on line in this timeframe (except perhaps for road works), major shifts, such as a modal shift from roads back to rail, cannot really be expected. In addition, some facilities are already near or at their capacity limits, resulting in perhaps some unpredictable shifts until further investments can be made. The Port of Dar es Salaam provides a prime example: Its main competing port in Mombasa is now so much filled to capacity that ships are diverting to Dar es Salaam. However, Tanzania’s main port is also in need of investments to meet any rapid shifts in demand.
Though in the discussion that follows the infrastructure will be discussed by sector, the final demand analysis will attempt to look at transport as a whole system, interlinked both with internal and external economic drivers that may yet rapidly change again.

Transport Infrastructure and Demand
6
Infrastructure
Sector Overview Tanzania’s transport sector consists of
maritime transport centered around the port of Dar es Salaam, with additional smaller ports in Mtwara and Tanga,
lake transport in the three large lakes of Lake Victoria, Lake Tanganyika, and Lake Nyasa, rail transport as provided by two distinct rail lines (TRL and TAZARA), a road system comprised to trunk roads for Tanzania’s three main corridors and of regional, district, and urban
roads, a set of roughly 58 airports and above 300 airstrips, with three major international gateways, a pipeline connecting Tanzania with Zambia, used for crude oil imports, and two gas pipelines.
A comprehensive map of the transport system can be found in Map 1 on the opposite page.

Infrastructure
Map 1: Overview of Tanzania’s Transport Infrastructure.
Source: Map based on data obtained from TANROADS, PADECO/JICA, TAA, TCAA.

Transport Infrastructure and Demand
Water Transport: Sea and Lakes Tanzania has a long coastline of roughly 720 km on the Indian Ocean, and also borders on three “Great” lakes of Africa: Lake Victoria, Lake Nyasa, and Lake Tanganyika. Thus, water transport plays an important role in Tanzania’s overall economy through imports and exports, the relationship with the landlocked neighbors, and the sustainability of the populations living along the lake shores.
Ports, just as airports, are by necessity dependent on other modes. With Tanzania’s ports the modal interaction in the past has been both with rail and roads. However, with the aging of the railroad system traffic has increasingly been brought to the hinterland via roads, to the point where now only a very small fraction of freight moves by rail. This shift reflects not only the state of the railway system today, but also global trends as road networks expand and improve.
Tanzania’s main port in Dar es Salaam is the second largest in the region, competing with the port in Mombasa, Kenya. Both ports are at their capacity in some form or another, with traffic now at times diverting from Mombasa to Dar es Salaam, and ships often waiting in the outside anchorage area of Dar es Salaam for several days if not weeks before being berthed. Figure 1 shows Dar es Salaams freight tonnage by country, and Figure 2 show the annualized growth rates for the beneficiaries of the port between 2001 and 2010. More recent growth rates have been a somewhat more realistic, being 6.8% between 2005 and 2010 rather than 9.3% for the nine year period. This is due to the overstated growth between 2001 and 2009 brought on by the sudden increase in Zambia’s traffic between 2001 and 2004.
Map 2 shows Tanzania’s ocean and lake ports, with the associated transport infrastructure. The most essential trunk roads connecting the port of Dar es Salaam to Zambia, Rwanda, and Burundi are either fully paved or surface sealed. However, overloading beyond permitted axle load causes significant deterioration on these roads, prompting calls for renewed efforts in improve railroad connectivity. Dar es Salaam also connects to Zambia via a pipeline.
Since the natural port of Dar es Salaam has depth limitations, alternate locations are under consideration for a new port. Bagamoya is strategically located opposite of the island of Zanzibar, about 60 km north of Dar es Salaam city, and is one of the sites under consideration.
Lake transport plays two roles: Supporting the needs of those living along the shorelines of the three large lakes surrounding Tanzania, and also, to a lesser (and decreasing) extent, as a link for goods between Uganda and Congo DRC. The latter role has changed significantly with the decline of the railway leading to Lake Victoria. The shipments of goods destined for Uganda are more likely to go by road or rail through Kenya. As seen in the legend of Map 2, the tonnages of the lake ports are dwarfed by the tonnages of the ocean ports. Significant decline has been witnessed in lake tonnage due to the decline in railway service since 2004.
Figure 1: Cumulative freight tonnage (imports + exports) with origins & destinations for the port of Dar Es Salaam. Tanzania’s share is about two thirds, Zambia’s, Congo DRC’s, and Burundi’s share has been growing. (Unit: 1,000 metric tons)
Figure 2: Average annual growth rates for the port of Dar es Salaam, 2001-2010, by freight origin/destination. The overall annual growth is near 10%.
Data Source: Analyses on data provided by PADECO/JICA. Data Source: Analyses on data provided by
PADECO/JICA.
-
2,000
4,000
6,000
8,000
10,000
2001
2002
2003
2004
2005
2006
2007
2008
2009
2010
Tanzania
Zambia
DRC
Burundi
Rwanda
Malawi
Uganda-20.0%
-10.0%
0.0%
10.0%
20.0%
30.0%
Tanz
ania
Zam
bia
DRC
Buru
ndi
Rwan
daM
alaw
iUg
anda
Oth
ers
Tota
l
Traffic Growth Rates

Water Transport: Sea and Lakes
Map 2: Ocean Ports and Lake Ports In Tanzania
Source: Map based on data provided by PADECO/JICA.

Transport Infrastructure and Demand
10
Road Transport Road transport is the most ubiquitous form of Transport. Over 75% of goods are shipped via roads in Tanzania, and over 90% of passengers travel via roads.1 Roads in Tanzania are classified either as “trunk” roads that connect corridor routes (there are 42 trunk roads), regional roads, district roads, and urban roads. TANROADS, the Tanzanian roads agency, oversees the more than 12,000 km of trunk roads and over 21 km of regional roads, while local authorities are responsible for roughly 52,500 km of district, urban, and feeder roads.
East Africa has developed a system of corridor routes of which two essential ones, the Dar-es-Salaam to Zambia (“Dar-es-Salaam/TAZARA”) corridor (1,100 km total length2) and the Dar-es-Salaam to Rwanda/Burundi (“Central”) corridor (3,100 km total length), are in Tanzania. The Dar-es Salaam/TAZARA route is either surface sealed or completely paved, and is Tanzania’s busiest long-distance route.
Table 1 below provides a quick glance on the total number of kilometers in the system, and their surface type. The vast majority of roads in Tanzania are unpaved.
Table 1: Road ordinance paved versus unpaved. Less than 20% of roads are paved, and only a small number of non-trunk roads are paved.
Road Type Km Paved
km Unpaved Total %
Unpaved Trunk 5,537 6,660 12,197 54.6% Regional/Rural 847 20,451 21,298 96.0% Total 6,384 27,111 33,495 80.9%
Source: Analysis based on data provided by TANROADS and PADECO/JICA.
Map 3 on the opposite page shows the road infrastructure plotted against villages districts known as of the 2002 census. The emphasis of this map is to show the distribution of especially non-trunk roads against the population. There are pockets of denser village population, represented in areas such as around Morogoro (shown though an intensified density of grey lines) that are not yet served with much road connectivity.
The colors of the roads indicate surface type. But for a small minority the non-trunk roads are generally of soil surface. The main east-west corridors, and the corridor serving the north along the coast, are either paved or sealed.
1 PADECO/JICA, Comprehensive Transport and Trade System Development Master Plan in the United Republic of Tanzania Progress Report, December 2011, p.10. 2 EAC Transport Strategy and Regional Roads Sector Development Program -Final Part III - Roads Dev Program 2011-03-18., p.4

Road Transport
Map 3: Tanzania’s Road Network Compared to Population
Sources: Map based on data provided by the 2002 Census (Village data) and PADECO/JICA (roads data).

Transport Infrastructure and Demand
12
The road network and villages can be shown with their regional borders, and the growth rate for the region. The background colors of the regions show in Map 4 on the opposite page are graded along the growth rate of the region, with the lighter the color (red towards yellow) the higher the growth rate, and the darker the color (red towards grey and brown) the slower the growth. Growth rates are the geometric average annual growth rate between 2003 and 2006.
Again, Morogoro stands out, as does the border between Morogoro and Dodoma. In addition, the map shows that the better connected region around Mtwara has not yet shown much growth.

Road Transport
Map 4: Road Network and Regional Growth in GDP
Source: 2002 Census (Village data), PADECO.JICA (roads data)

Transport Infrastructure and Demand
Map 5 on the opposite page represents a mosaic of traffic counts between 2005 and 2011. These counts have been indexed to 1,000, and are then differentiated on the map by using different line thicknesses.
The busiest traffic region in the country is in Dar es Salaam. However, the traffic would completely skew the map if shown. By excluding Dar es Salaam the usage of the road system becomes clearer.
One of the key drivers for trunk road traffic is corridor traffic between the land locked neighbors and Tanzania. This is shown clearly by the traffic volumes in the trunk roads leaving from Dar es Salaam, Tanzania’s main port, to Zambia, and also to Rwanda and Burundi.
Another source of traffic is tourism – the Kilimanjaro area, close to Arusha and the surrounding attractions, also has high volume. In fact, the area around Arusha has the highest volume when Dar es Salaam is excluded – as high as over 15,000 vehicles in annualized average daily traffic.
This pales, however, in comparison to the traffic within Dar es Salaam, where many road segments handle over 30,000 motorized vehicles per day, going as high as 70,000 along New Bagamoyo Road. Figure 3 below shows the traffic counts superimposed on map of Dar es Salaam. The highest counts are on the arteries leading in and out of the city and down to the port.
In Figure 4 the other busiest roads of Tanzania are highlighted in the Kilimanjaro/Arusha region. Clearly a high amount of traffic comes down from the north (Kenya) to the Kilimanjaro area.
Figure 3: Dar es Salaam’s traffic. Figure 4: Traffic counts around Arusha
Notes: Maps not to scale. Traffic counts include data collected between 2005 and 2011. Indexed to 1000. Background maps © OpenStreetMap contributors, CC BY-SA. Counts based on data provided by TANROADS and PADECO/JICA.

Road Transport
Map 5: Tanzania’s Road Network with Traffic Counts
Source: Map based on data provided by TANROADS and PADECO/JICA.

Transport Infrastructure and Demand
16
The northern regions of Tanzania periodically suffer from deficits in food production, while some regions in the southwest consistently produce surpluses. Overall, Tanzania’s food production somewhat exceeds demand. In 2009/2010, Tanzania produced 10,722,679 tons of cereals and non-cereals, while requirements were calculated at 10,569,845 tons. Map 6 on the facing page shows the surplus and deficit regions. Beyond Dar es Salaam, Dodoma, Singida, and the regions in the North around Arusha and Kilimanjaro have repeatedly gone through shortages, while Rukva, Mbeya, and Iringa are surplus producers. Coast, the region adjacent to Dar es Salaam, is shown as a deficit for 2009/10, however, this varies from year to year, as Coast has also produced surpluses in the past.
Though food logistics are complicated in terms of the timing between harvest, processing, and consumption, the road infrastructure can play a constructive role in alleviating the shortages. The map shows that Dar es Salaam is already well connected with Iringa, however most of the other more direct connections to the center and the north are unpaved (either gravel or soil) trunk roads.

Road Transport
Map 6: Food Shortages and Surpluses for 2009/2010, with Road Network
Source: Map based on data provided by Ministry of Agricultural Food Security and Cooperatives, PADECO/JICA (roads data).

Transport Infrastructure and Demand
18
Tanzania offers a host of tourist attractions, including the islands of Zanzibar, Pemba, and Mafia, famous national parks such as the Serengeti, and Mount Kilimanjaro, Africa’s highest mountain.
Most tourists arrive either by air or by road. However, the connectivity within Tanzania is vital for the tourism industry. The Kilimanjaro International Airport is strategically placed for the Serengeti, the Ngorogoro Crater, and Mount Kilimanjaro. As previously shown in Figure 4, the road traffic in those well known tourist destinations is relatively high.
However, the other parks are more difficult to reach. For example, Ruaha National Park can only be accessed via unpaved roads, as well as many other of potential attractions. Further road investments, including in local district roads, need to be made to unlock the full potential of these attractions. The success of these types of investments can be seen in the northern attractions, served by paved or sealed roads.

Road Transport
Map 7: Tanzania’s Conservation Areas, Reserves, and Parks
Sources: World Database on Protected Areas (http://www.wdpa.org), PADECO/JICA (roads data).

Transport Infrastructure and Demand
20
Railways Tanzania has two railway systems: A northern/central line extends towards Kigoma and Mwanza on Lake Victoria and is run by Tanzania Railways Limited (“TRL”) with assets in the ownership of the Railways Assets Holding Company (“RAHCO”), and a southern route extends from Dar es Salaam into Zambia, operated by the Tanzania Zambia Railway Authority (“TAZARA”)
Both TRL and TAZARA are in dire need of investments to improve their infrastructure. The northern and central railway was built at the turn of the century, and is of 1,000 mm gauge, and is of roughly 2,700 km in length3. The railway suffers from repeated washouts and, just like TAZARA’s rail line, is short of serviceable locomotives. The railway links the port of Dar es Salaam to Mwanza on Lake Victoria, providing part of a multi-modal link over the lake to Uganda. TRL provides both passenger and freight services. Map 8 shows the two rail systems. The thickness of the lines have been adjusted to the maximum speed allowable at the given track segment, which can be seen as an indicator of the condition of the track. As of this writing of the report, there are no trains running along the line northwards close to the coast to Arusha4.
TAZARA is about 1,850 km in length and was built in the early 1970’s, using 1,067 mm gauge, running from Dar es Salaam to Kapiri Mposhi in Zambia, where it connects to Zambia Railways. There are both freight and passenger services. However, the railway is in significant financial difficulties, and scheduling integrity is compromised by the lack of operable locomotives.
The demand for rail in general declines as a road network expands, as has been the case with Tanzania. The advantage of rail over roads lies in fuel costs and the ability to carry large tonnages of bulk freight far distances. In addition, overloaded trucks cause accelerated road wear, making rail seem like the logical alternative from a policy point of view.
However, two factors play against the demand for rail: Unless a rail station is at the final destination or the original origin of what is being shipped, rail is inevitably multi-modal and requires goods to go through a modal shift (usually roads, or, as was the case in Mwanza, ferries). In addition, road transport allows for considerably more flexible scheduling of the beginning of a shipment, and for better information on the progress of the shipment.
Table 2: TRL freight and passenger figures. The drop between 2003 and 2010 is significant. Lack of working locomotives and recent track washouts have contributed to schedule integrity loss.
Table 3: TAZARA freight and passenger figures. Though TAZARA looks healthier, more recent news point at significant difficulties, including financial. There is also a shortage of working locomotives.
Traffic Type 2003 2010 Domestic Freight (tons) 997,567 161,424 Transit Freight 342,764 52,394 World Food Programme 95,382 7,212 Other Freight Tonnage 128,776 35,160 Total Freight 1,564,489 256,190 Passengers 683,681 290,046
Source: PADECO/JICA.
Traffic Type 2008-9 2010-11 Transit Freight (tons) 354,869 476,924 Local Freight 28,186 57,040 Total Freight 383,055 533,964 Passengers 996,548 786,759
Source: PADECO/JICA.
3 http://www.ifc.org/ifcext/spiwebsite1.nsf/0/42AFB999E010F2EE852576BA000E2A59 4 http://www.seat61.com/Zambia.htm#Tanzania%20Railways

Railways
Map 8: Tanzania’s Two Railway Systems
Source: Map based on data provided by PADECO/JICA.

Transport Infrastructure and Demand
22
Air Transport Tanzania has a set of 58 airports maintained by the Tanzanian Airports Authority (“TAA”), three additional important airports in the Mount Kilimanjaro area, on the island of Zanzibar, and the island of Pemba, and above 300 airstrips that go into use on an ad-hoc basis. Total passenger numbers for 2011 are estimated to be in excess of 4.2 million, and 42,200 tons of freight and mail.5 32.9% of the traffic is international.
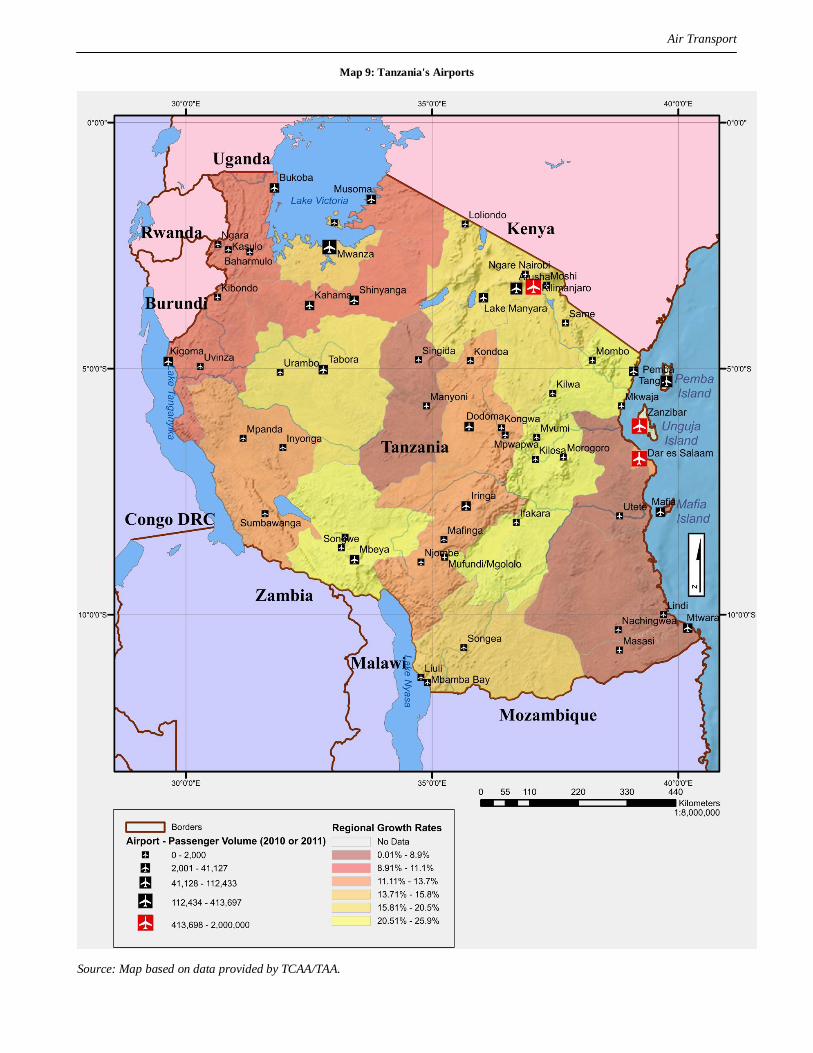
The drivers for international air transport are mainly business and tourism. Domestic air transport is driven by a variety of factors, including regional economic growth, visiting friends and family, and also tourism travel within Tanzania. Map 9 shows the distribution of airports throughout Tanzania, keyed to their passenger volume. The three dominant airports are Julius Nyerere International Airport in Dar es Salaam, the international airport in Zanzibar, and Kilimanjaro International Airport close to Arusha. Other busier airports include Mwanza and the airport in Arusha proper. In terms of freight, Dar es Salaam and Mwanza have 96.9% of the volume, with Dar es Salaam alone carrying the bulk at 23,9 thousand tons (89.2%)
5 TCAA. See Table 11 on page 38
Air Transport
Map 9: Tanzania's Airports
Source: Map based on data provided by TCAA/TAA.

Transport Infrastructure and Demand
24
Map 10 shows the long term growth rate of the airports in passenger traffic compared to the GDP growth rates of the regions they are located in. Since the growth rates of airports with very thing traffic vary significantly over time, only airports with more than 2,000 passengers annually are shown. The map shows a diversion of regional growth versus passenger traffic growth. For example, though the Tabora region is a higher growth region, the airport in Tabora showns a decline in traffic numbers. Notably also, airports in lower growth regions (Bukoba airport and Kahama) have shown stronger growth. Though one could argue the disparity is a result of poor infrastructure, both Bukoba and Tabora airports currently have unpaved runways, with Bukoba’s infrastructure even more wanting.6
6 Both airports will benefit from major runway improvements currently being financed by the World Bank.

Air Transport
Map 10: Passenger Growth at Tanzania's Airports
Source: Map based on data provided by TCAA/TAA.

Transport Infrastructure and Demand
Demand Analysis and Forecasts
Overview of Demand Sources Tanzania’s transport system can be seen as driven by five sources of demand:
Internal production by agriculture, mining, and industry Demand for goods within Tanzania Import and export by neighboring countries Tourism from abroad Business and family travel by Tanzanians within Tanzania and abroad
Not all of the sources of demand are readily measurable or distinguishable. In some cases, such as in the air transport sector, the overall system most likely is meeting demand, so traffic figures can be used to estimate current and future demand. In other cases, such in as local and regional roads, demand is very difficult to measure, and there may be significant pockets of unmet demand that are difficult to quantify. In addition, when a system is facing breakdown, either by operating at capacity or by operating so inefficiently that it becomes very difficult to use, it is again very difficult to actually measure demand. For example, the amount of unmet demand for the port of Dar es Salaam may be measurable by the waiting time for ships to berth, however, the amount of real demand for rail transport is now not really measurable.
Overall, Tanzania has grown faster than expected, and has weathered the global economic crisis rather well. In predicting demand, however, there are unexpected surprises that could alter the landscape within a few years. For example, new gas resources recently discovered off the coast of Tanzania may reshape the economy of the country.
Figure 5 shows Tanzania’s GDP over a period of 20 years, along with Tanzania’s neighbors, and Figure 6 shows the associated growth rates. Tanzania’s growth is in part due to the rise of the prices of mineral resources being exported, and most likely in reality approximates a more conservative slope. However, even if growth realistically has been more in the 7% range, the overall impact is significant compared to global figures.
Figure 5: Tanzania’s and neighbor’s GDP, in 2000 constant US$. Tanzania’s GDP figures may be a inflated due to the rise of commodity prices. However, Tanzania has indeed grown faster than expected.
Source: Analysis based on data from the World Bank Development Indicators.
-
5,000
10,000
15,000
20,000
25,000
1990
1991
1992
1993
1994
1995
1996
1997
1998
1999
2000
2001
2002
2003
2004
2005
2006
2007
2008
2009
2010
Tanzania
Kenya
Uganda
Rwanda
Burundi
Zambia
Congo DRC

Demand Analysis and Forecast
Figure 6: Average annual growth rates of Tanzania, its neighbors, the world, and high income countries, 1990 - 2010. The entire region, with the exception of post-conflict Burundi and Congo DRC, is performing better in terms of growth than the world or high income countries.
Source: Analysis based on data from the World Bank Development Indicators.
Tanzania’s demand for transport is not only affected by its own growth, but also by the growth in land-locked neighbors. The relationship with Zambia is long-standing, and Zambia’s growth at over 6% is going to affect the demand on Dar es Salaam’s port and the land-based transportation infrastructure. The same assumptions can be made for Burundi and Rwanda. As a post-conflict country, Burundi is rebuilding, which may show growth accelerating in the near future.
Table 4 on the next page organizes the drivers of demand for each mode by the way they are impacted by the local, the regional, or the world economy. Figure 7 shows Tanzania’s merchandise trade flows with the rest of the world.
-2.0%
0.0%
2.0%
4.0%
6.0%
8.0%
10.0%
12.0%
14.0%
16.0%
GDP Growth

Transport Infrastructure and Demand
28
Table 4: The effect of Tanzania’s internal economy, the region’s economy, and the work economy on modes of transport in Tanzania. In the case of demand for rail, the current state of both systems makes the measurement of demand difficult.
Mode Drivers of Demand
Notes Internal Economy
Regional Economy Global Factors
Air Transport
Attractions, and travel within Tanzania by Tanzanians are functions of the internal economy.
Somewhat dependent on the region. However, Dar es Salaam currently serves as a gateway, not a hub.
Very dependent on global factors. Tourism depends on the well being of outsiders
Easily measurable.
Ports - Seaside
Roughly 60% is for internal consumption, which is dependent on the internal economy.
40% of traffic is related to region, and therefore dependent on the regional economy.
Almost all traffic is dependent on the demand for exports on costs of imports
Other ports in the region (Mombasa in Kenya, Mozambique) affect the demand for Dar es Salaam both positively and negatively.
Ports – Lake
Majority of freight for internal consumption, therefore part of internal economy.
In the past there have been regional linkages in lake transport. These now seem to have broken down with the decline of TRL.
Difficult to predict revival without regaining rail transport or seeing modal shift of same traffic segments to roads..
Roads
Very affected by internal economy, especially non-trunk roads.
Trunk corridor roads very affected by regional economy.
Note: demand caused by mining and/or agricultural exports is related to global commodity prices.
Railways
Affected by demand for coal, passenger movements, elements of the local economy.
Affected by demand for exports and imports, which are elements of the regional economy
Almost all freight traffic is dependent on the demand for exports or costs of imports
Not much demand because of the current shape of the system, roads compete too well.
Pipeline N 100% on growth in Zambia

Demand Analysis and Forecast
Figure 7: Tanzania’s international merchandise trade flow, represented in percentage of total merchandise trade in current US dollars, 2010. Red arrows represent imports, black exports. Tanzania is a net importer. Most of the overseas trade can be expected to go through the port of Dar es Salaam. Transit flows are excluded.
Source: Map based on World Bank World Development Indicators data.

Transport Infrastructure and Demand
Port Traffic Tanzania has a coastline of roughly 720 km, and additional lake coastlines totaling 1,700 km7. Uganda, Rwanda, Burundi, the eastern portion of Congo DRC, Malawi, and Zambia all either are completely landlocked, or, is in the case of Congo DRC, are so large that in effect portions are truly landlocked. In addition, all of the above except for Rwanda share coastlines amongst the major lakes of Tanzania, Lake Victoria, Lake Tanganyika, and Lake Nyasa. This makes the demand for transport in the ports sector a complex topic, depending on external factors (the demand in neighboring countries), competing ports (mainly Mombasa), modal challenges (the development of roads and failure of rail), and domestic needs, including needs in remote and rural areas.
The port of Dar es Salaam has gone through rapid demand increases by the growth of import and exports related to Zambia. In more recent history, tonnage related to Tanzania’s combined consumption and production has slowed in growth to 6.8% for the last five years8, but the growth of land-locked country traffic has pushed traffic growth, even with the loss of Uganda, which is switching away to Mombasa. A new potential client coming on board for Tanzania’s port traffic is Zimbabwe. Barring external shocks, one could assume that demand for the port will grow at the current rate, if not higher, for the next five years, especially considering the congestion developing in Mombasa. Growth in demand, however, does not mean the Dar es Salaam will be able to serve this demand without additional infrastructure investments, as wait times outside the port are increasing again, and Dar es Salaam may be facing the same congestion threat as Mombasa. Figure 8 below compares the traffic and growth rates of Dar es Salaam and Mombasa. The steep decline of growth in Mombasa is most likely caused by congestion. Figure 9 below shows demonstrates the current (2010) distribution of freight assigned to Tanzania versus the landlocked neighbors.
Figure 8: Tonnages and growth rates for the ports of Dar es Salaam and Mombasa. The steep decline in Mombasa’s growth rate is commonly linked with the limit of the port’s capacity having been met. Dar es Salaam may face a similar threat if relief in capacity is not found quickly.
Source: Analysis on data provided by PADECO/JICA.
7 These measurements are conservative estimates, since various minor bays, especially along Lake Victoria, add significantly to the amount of land exposed to water. 8 The IMF projects Tanzania’s growth at 6.83% between 2009 and 2015. See Nathan Associates, Corridor Diagnostic Study of the Northern and Central Corridors of East Africa, Draft Action Plan, Volume 2: Technical Papers, B.Trade and Traffic Forecast, April 2011, p.22.
-5.0%
0.0%
5.0%
10.0%
15.0%
20.0%
-
2,000,000
4,000,000
6,000,000
8,000,000
10,000,000
12,000,000
14,000,000
16,000,000
18,000,000
20,000,000
2006 2007 2008 2009 2010
Dar es Slaam
Mombasa
Dar es Slaam Growth Rate
Mombasa Growth Rate

Demand Analysis and Forecast Figure 9: Portion of port traffic for Dar es Salaam related to transit movements in 2010. Tanzania’s own traffic is still the vast majority at above 60%, and is the largest portion of the demand.
Source: Analysis on data provided by PADECO/JICA.
With these assumptions, the demand for Dar es Salaam, using the 6.8% growth rate, would go from 9.5 million tons (estimated for 2011) to 19.9 million tons in 2018, as shown in Figure 10 below.

Transport Infrastructure and Demand
Figure 10: The port of Dar es Salaam forecast to 2018. Barring any significant changes, demand would double. (Unit: 1,000 metric tons)
Source: Author’s calculations.
Tanzania’s own portion of the usage of the port is declining as its growth stabilizes. In fact, the 5.5% growth rate between 2005 and 2010 for domestic-related imports and exports for the port is a reasonable estimation of continued growth, again barring any major external events9.
The two other main ports in Tanga and Mtwara have grown significantly recently, as shown in Figure 11 below. However, their volumes are still very low compared to Dar es Salaam, and therefore are subject to vary widely.
9 Tanzania’s economy may reshape itself with the recent findings of extensive gas reserves. However, at the writing of this report it is too early to assess the impact of these discoveries on transport demand and infrastructure.
0
5,000
10,000
15,000
20,000
25,000
2011 2012 2013 2014 2015 2016 2017 2018
Tanzania
Zambia
DRC
Burundi
Rwanda
Malawi
Uganda
Others
Figure 11: Growth rates at Tanga and Mtwara. Though both Mtwara and Tanga are growing, and will eventually play more important roles in Tanzania’s port system, their volumes are still very low, meaning small changes have a large impact on perceived growth.
Source: Analysis on data provided by PADECO/JICA.
-60.0%
-40.0%
-20.0%
0.0%
20.0%
40.0%
60.0%
-1,000,000
2,000,000 3,000,000
4,000,000 5,000,000
6,000,000 7,000,000
8,000,000 9,000,000
10,000,000
2006 2007 2008 2009 2010
Dar es Slaam
Tanga
Mtwara
Dar es Slaam Growth Rate
Tanga Growth Rate
Mtwara Growth Rate

Demand Analysis and Forecast
Lake traffic on Lake Victoria has been declining. As shown in Table 5, overall traffic has gone down by 10%, driven by the collapse of international traffic from Kenya and Uganda at Mwanza (see Figure 12 below) due to TRL’s decline. Most likely the technical and financial issues with TRL will not be completely resolved within the next five years, leaving service provision in this market depressed. However, though not measurable through these statistics, the travel demand on Lake Victoria remains high, due to relatively high population densities10.
Table 5: Domestic Freight traffic at Lake Victoria’s ports. The sample of two years is very small, and may reflect short term economic events. Mwanza’s growth rate over five or ten years is much higher. Mwanza handles nearly 70% of all domestic freight traffic.
Port or City Tons
Freight 2007/8
Tons Freight 2008/9
Portion of 2008/9 Traffic
Growth
Mwanza 505,891 445,643 78.0% -11.9% Bukoba 81,028 78,924 13.8% -2.6% Kemondo Bay 13,472 15,981 2.8% 18.6% Nansio 13,730 12,076 2.1% -12.0% Musoma 22,308 18,840 3.3% -15.5% Total 396,349 405,882 100.0% -10.2%
Source: Analysis on data provided by PADECO/JICA.
Figure 12: Freight traffic at Mwanza. Though domestic throughput has been rising, the port is in decline due to the loss of traffic from Kenya and Uganda. Since TRL’s stoppage of service over the lake, there has been a modal switch to trucks and rail in Kenya.
Source: Analysis on data provided by PADECO/JICA.
10 See PADECO/JICA, Comprehensive Transport and Trade System Development Master Plan in the Republic of Tanzania, Progress Report, December 2011, p. 3-54.
-
100,000
200,000
300,000
400,000
500,000
600,000
700,000
800,000
900,000
International
Domestic

Transport Infrastructure and Demand
34
A study conducted in 2009 by Marine Logistics Ltd. summarized demand for lake transport as shown in Table 6, with the implied annual growth rates and derived forecast for 2018.
Table 6: Tonnage and passenger demand forecast for lake transport in Tanzania. Marine Logistics Ltd. forecast’s implied growth rates are used to extend the 2015 forecast to 2018.
Trade Route 2015 2032 Implied
growth - Passengers
Implied growth - Freight
Implied Forecast for 2018
Passengers Cargo (tonnes) Passengers Cargo
(tonnes) Passengers Cargo
(tonnes) Lake Tanganyika Kigoma – Small Villages 45,000 18,000 305,000 125,000 11.9% 12.1% 63,078 25,339
Rumonge – Baraka 25,000 26,000 310,000 126,000 16.0% 9.7% 38,985 34,350 DRC – Small Villages 16,000 20,000 205,000 255,000 16.2% 16.2% 25,095 31,342
Lake Victoria Mwanza – Bukoba/Kemondo Bay
200,000 145,000 735,000 530,000 8.0% 7.9% 251,641 182,266
Mwanza - Nansio 395,000 20,000 75,000 1,445,000 -9.3% 28.6% 294,623 42,566
Source: Based on Marine Logistics Ltd, Integrated Transport Strategy – Lakes Tanganyika and Victoria, February 2009, p. 10.

Demand Analysis and Forecast
35
Trunk Roads, Non-Trunk Roads, and Rail Transport The demand for regional and district roads (non-trunk roads) is difficult to quantify. In Map 3 on page 11 it was shown that there are areas of clearly unmet demand, such as around Morogoro. In this case there are areas of settlement that simply are not being connected. Similar shortages can be found around Iringa, and perhaps along the upper shore of Lake Nyasa.
Though Tanzania is going through urbanization, the need for rural access is important, and has not been able to receive the needed development attention. The demand not only lies in the number of roads, but also in the type of surface and weather resistibility.
Rail and trunk road transport are discussed together because of their competition for similar traffic on the main corridors. Because of the decline of the two railways, a modal switch towards roads has ocurred, with very little goods (less than 2%) destined for or originating from the port of Dar es Salaam still traveling by rail. The implications are the that demand for transport along the two major trunk routes to Zambia and Rwanda/Burundi will increase with the growth of the port, barring major investments and operational changes at TAZARA and TRL.
The Corridor Diagnostic Study of the Northern and Central Corridors of East Africa of February, 2011 estimates in its base case growth rates of 11 percent between 2009 and 2015, and 7 percent from 2015 onwards to 2030 for overall corridor growth11. The base case is built on historical data up to 2009, and is split between road and rail, with the latter carrying 5.7% of overall traffic, and 23.7% of transit traffic. The Central Corridor from Dar es Salaam, according to their assumptions, is expected to grow at the rates shown in Table 7. Total tonnages would then be as in Table 8, and shown in Figure 13 . Part of the significant growth in the central corridor is Nathan Associate’s expectation that some traffic will shift from the northern corridor to the center.
The analysis assumes that rail grows to carry 47.6% of the transit tonnage, which today we know will not happen unless significant improvements are made to TRL, and the modal shift to roads is reversed. However, the tonnages shown by Nathan’s, if accepting these growth rates, would then represent the total demand on the central corridor. Since regional and domestic growth rates are presented, one may also assume that these rates apply to feeder roads for the central corridor.
Table 7: Growth rates assumed in Nathan Associate’s central corridor forecast. Nathan is assuming a tapering of growth after 2015.
Traffic Type
2009-2015
2015-2030
Transit 36.5% 8.8% Regional 13.5% 3.8% Domestic 13.7% 7.9% Total 16.1% 7.8%
Source: Calculated from data found in tables on p. 36 and 37 of corridor study.
11 Nathan Associates, Corridor Diagnostic Study of the Northern and Central Corridors of East Africa, Volume 2: Technical Papers, B:Trade and Traffic Forecast , February 6 2011, p. 35
Transport Infrastructure and Demand
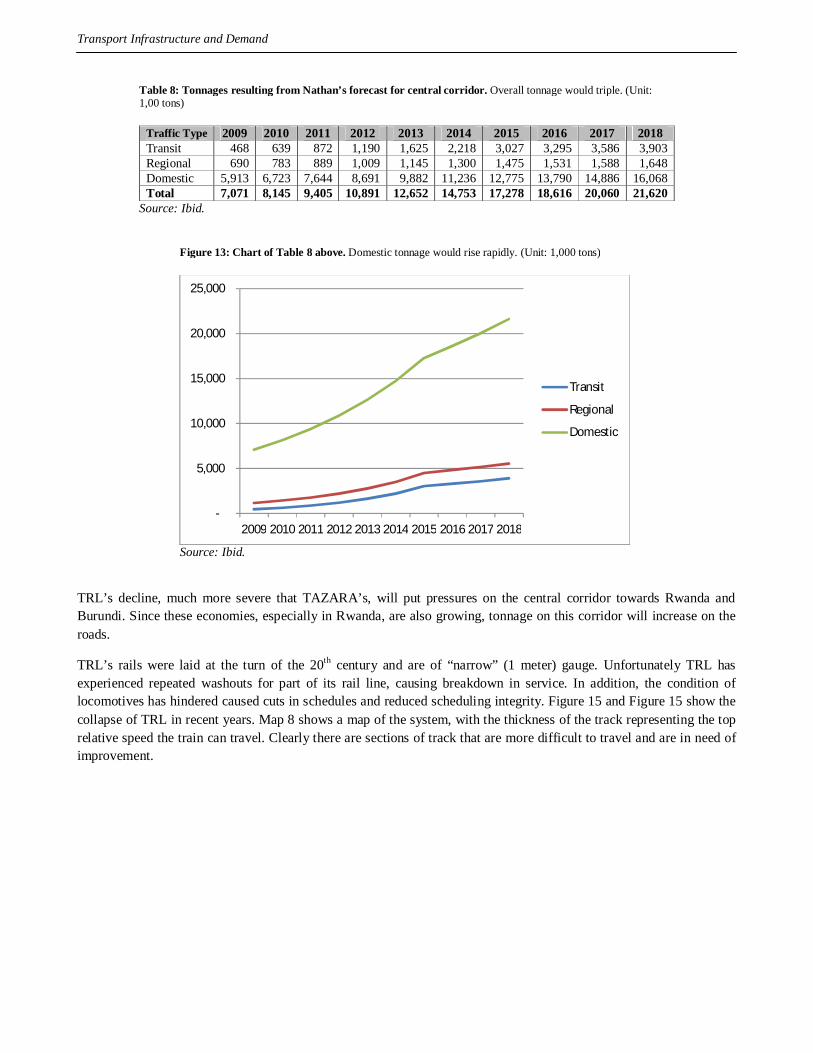
Table 8: Tonnages resulting from Nathan’s forecast for central corridor. Overall tonnage would triple. (Unit: 1,00 tons)
Traffic Type 2009 2010 2011 2012 2013 2014 2015 2016 2017 2018 Transit 468 639 872 1,190 1,625 2,218 3,027 3,295 3,586 3,903 Regional 690 783 889 1,009 1,145 1,300 1,475 1,531 1,588 1,648 Domestic 5,913 6,723 7,644 8,691 9,882 11,236 12,775 13,790 14,886 16,068 Total 7,071 8,145 9,405 10,891 12,652 14,753 17,278 18,616 20,060 21,620
Source: Ibid.
Figure 13: Chart of Table 8 above. Domestic tonnage would rise rapidly. (Unit: 1,000 tons)
Source: Ibid.
TRL’s decline, much more severe that TAZARA’s, will put pressures on the central corridor towards Rwanda and Burundi. Since these economies, especially in Rwanda, are also growing, tonnage on this corridor will increase on the roads.
TRL’s rails were laid at the turn of the 20th century and are of “narrow” (1 meter) gauge. Unfortunately TRL has experienced repeated washouts for part of its rail line, causing breakdown in service. In addition, the condition of locomotives has hindered caused cuts in schedules and reduced scheduling integrity. Figure 15 and Figure 15 show the collapse of TRL in recent years. Map 8 shows a map of the system, with the thickness of the track representing the top relative speed the train can travel. Clearly there are sections of track that are more difficult to travel and are in need of improvement.
-
5,000
10,000
15,000
20,000
25,000
2009 2010 2011 2012 2013 2014 2015 2016 2017 2018
Transit
Regional
Domestic

Demand Analysis and Forecast Figure 14: Freight and passenger numbers for TRL. The railway is in steep decline.
Source: Analysis on data provided by PADECO/JICA
Figure 15: TRL’s passenger and freight numbers indexed to 100 in 2003. The decline is significant.
Source: Analysis on data provided through PADECO, other sources.
The causes of the collapse are many fold. An attempted privatization failed, and much maintenance in infrastructure and rolling stock simply could not occur. This decreased frequency and reliability, to the point that a complete modal shift towards roads occurred.
Dar es Salaam’s largest regional client is landlocked Zambia, whose other port of access is Beira in Mozambique. The links between Zambia and Tanzania include a pipeline, the TAZARA railway system, and the southern corridor trunk route. The condition of the railway system and the improvement of the road network has shifted much of the port traffic to T1 - the trunk route Connecting Zambia with Dar-es-Slaam, and as shown in Map 5 on page 15 this is now Tanzania’s busiest long-distance road. Except for the port in Beira, Mozambique, there is virtually no competition for this market. One can reasonably assume that the growth for demand in port and road transport for this link will follow the growth rate of Zambia’s GDP at 6%. Given the financial difficulties TAZARA finds itself in, freight volumes
-
100,000
200,000
300,000
400,000
500,000
600,000
700,000
800,000
-
200,000
400,000
600,000
800,000
1,000,000
1,200,000
1,400,000
1,600,000
1,800,000
Pass
enge
rs
Frei
ght
Total Freight
Total Passengers
0
20
40
60
80
100
120
2001 2002 2003 2004 2005 2006 2007 2008
Freight Indexed to 100
Pax indexed to 100

Transport Infrastructure and Demand
38
going by rail in the near future, barring any significant investments between 2012 and 2018, will be declining further, in effect putting the entire land-based linkage on the roads system. Growth rates for the roads portion of the corridor has been estimated to be between 5% and 8% for the foreseeable future, according to several scenarios in the EAC Transport Strategy and Regional Roads Sector Development Program12. If the investment needs in railroad where met, the East African Railways Master Plan Study assumes growth rates in tonnage as shown in Table 9 and Table 10 below.13
Table 9: Growth rates in tonnage estimated for the TAZARA railway by the East African Railways Master Plan Study in 2009.
Scenario 2008-2010 2010-2015 2015-2020 High Growth 10.02% 8.80% 6.79% Base Case 8.94% 7.81% 6.09% Low Growth 8.00% 6.80% 5.40%
Source: Based on data found in the East African Railways Master Plan Final Report.
Table 10: Actual tonnage, in 1,000’s, forecast by the East African Railways Master Plan Study for TAZARA.
Scenario 2008 2010 2015 2,020 High Growth 594 719 1,096 1,522 Base Case 589 699 1,018 1,368 Low Growth 583 680 945 1,229
Source: East African Railways Master Plan Final Report.
TAZARA was built in the early 1970’s, also using a narrow, albeit slightly wider, gauge than the much older northern TRL train line. TAZARA’s tracks are considered in better shape, and though volumes of goods and passengers transported have fluctuated (see Figure 16), the railway has continued operating, and is owned jointly but the Tanzanian and Zambian Governments. The railway, however, now is in dire financial circumstances, which has negatively affected maintenance, especially locomotives, and is causing schedule integrity difficulties.
12 See EAC Transport Strategy and Regional Roads Sector Development Program - Final Part III - Roads Dev Program. There are several analysis of the roads system based on such criteria as level of service and road condition, in each case with a 5% and 8% growth rate. 13 CPCS, East African Railways Master Plan Study Final Report, p.52. Growth rates were calculated using data found in t table 9.1

Demand Analysis and Forecast Figure 16: TAZARA’s passenger and freight volumes. Traffic is difficult to predict, especially considering the financial condition of the rail line. (Note: No passenger traffic data available prior 2002/03, and no freight figures available for 2006/07).
Source: East African Railways Master Plan Study, Final Report, Annex A, p. A-21. The data seems to have originated from the World Bank.
0
200,000
400,000
600,000
800,000
1,000,000
1,200,000
-
100,000
200,000
300,000
400,000
500,000
600,000
700,000
Pass
enge
rs
Frei
ght
Total Freight
Total Passengers

Transport Infrastructure and Demand
40
Matching Sources of Growth to Infrastructure – The Case of Mining In previous sections two maps (Map 6 and Map 7) explored the road network vis a vis the food shortages, and vis a vis the existing but not yet fully developed parks.
Map 11 on the opposite page show known mineral and energy resources as of 2005. Additional ones have been found – the area around Mbeya has several gold prospects, and coal has been found further inland from the same region. In addition, very large natural gas reserves have been recently found off shore in area around the island of Mafia.
Growth in the mining sector can affect the demand for transport. Though the most valuable exports by weight (gold, diamonds, and other gemstones) are easy to transport and often even go by air, mining equipment and fuel relies on road transport. In addition, bulk resources such as coal benefit from direct extraction to consumption/export transport via rail. New developments in the coal mining sector will raise transport demand in the area of Lake Nyasa and by the smaller lake north of Lake Nyasa (Lake Rukva).

Demand Analysis and Forecast
Map 11: Precious Metals, Coal, and Other Mineable Resources in Tanzania, along with Transport Infrastructure.
Source: Map mostly based on information found in Ministry of Energy and Minerals, Tanzania: Opportunities for mineral resource development . 2005.

Transport Infrastructure and Demand
Air Transport The overall demand for air transport has behaved unexpectedly vigorous since the passenger dip caused by the global economic slowdown in 2008/9. Figure 17 below shows the most optimistic projection for JNIA made in late 2009, with what then appeared to be a 13% decline in traffic, and expected “V” recovery curve leading up to 13% over 2010 through 2014, and settling at a 9% growth rate. Though the long term growth rate may be too high, the actual growth rate experienced during the recovery showed to be much higher. Between 2010 and 2011 growth jumped to a staggering 18%, as shown in the red dotted line portraying an even sharper “V” than the originally anticipated blue “V” curve. The effect on overall passenger movements can be seen in the solid red line.
Figure 17: Tanzania air transport system traffic. The chart below shows projected passenger traffic and actual traffic, along with projected growth rates and actual growth rates. The “V” rebound curve had been anticipated in a prior study, however, the strength of the rebound after the 2008 hit from the global slowdown has been above expectations.
Source: Analysis based on data provided by TCAA, Bofinger 2009.
Air transport capacity in terms of flights and schedules adjusts fairly quickly to changes in demand, and can therefore be used as a reasonable estimate of demand. However, bottlenecks in airport infrastructure could still a source of unmet demand. For example, Bukoba airport is a minimal facility with a non-paved runway that receives over 25,000 passengers a year, serviced by small aircraft that can operate in minimal conditions. However, though within the next five years the airport will be completely rebuilt, and will thus experience show significant growth, this is still a small proportion of Tanzania’s overall are transport traffic. By the same token, the main airport terminals, especially Julius Nyerere International Airport in Dar es Salaam, are hitting their operational limits, which may cause unmet demand in the not too distant future. However, since these bottlenecks have not been met yet, the current demands in passenger volumes act as a reasonable baseline for future projections.
The Tanzanian Civil Aviation Authority (TCAA) provided its own forecast below, applying a growth rate of 8%. By 2018, the system is expected to reach over 7 million passengers with almost 300,000 aircraft movements.
-15.00%
-10.00%
-5.00%
0.00%
5.00%
10.00%
15.00%
20.00%
-
1,000,000
2,000,000
3,000,000
4,000,000
5,000,000
6,000,000 Actual Pax 2004 - 2008
Acutal Pax 2009 - 2011
Projected Pax 2009 - 2025
Projected Growth rate 2009 -2025
Actual Growth rate 2004 -2008
Actual Growth rate 2009 -2011

Demand Analysis and Forecast
Table 11: TCAA passenger figures for 2011 with forecast. Total passengers will most likely be above 7.1 million by 2018.
Traffic Movements
% growth
rate Traffic Forecast
Aircraft Movements 2011 2012 2013 2014 2015 2016 2017 2018 International 35,916 5.2 37,784 39,748 41,815 43,990 46,277 48,684 51,215
Domestic 174,025 5.2 183,074 192,594 202,609 213,145 224,228 235,888 248,154
Total 209,941 5.2 220,858 232,343 244,424 257,134 270,505 284,572 299,369
Passenger Traffic International 1,635,720 8 1,766,578 1,907,904 2,060,536 2,225,379 2,403,409 2,595,682 2,803,337
Domestic 2,535,477 8 2,738,315 2,957,380 3,193,971 3,449,488 3,725,448 4,023,483 4,345,362
Total 4,171,197 8 4,504,893 4,865,284 5,254,507 5,674,867 6,128,857 6,619,165 7,148,699
Cargo in tonnes International 39,871.7 4 41,466.6 43,125.2 44,850.2 46,644.2 48,510.0 50,450.4 52,468.4
Domestic 2,541.1 4 2,642.7 2,748.5 2,858.4 2,972.7 3,091.6 3,215.3 3,343.9
Total 42,412.8 4 44,109.3 45,873.7 47,708.6 49,617.0 51,601.6 53,665.7 55,812.3
Source: Table provided by TCAA.
Figure 18: Chart of Table 11 above, cumulative. Because domestic traffic has grown to a higher baseline in 2011, its future growth will be more pronounced.
Source: Based on table provided by TCAA.
0
1,000,000
2,000,000
3,000,000
4,000,000
5,000,000
6,000,000
7,000,000
8,000,000
2011 2012 2013 2014 2015 2016 2017 2018
International
Domestic