Marie Stopes Tanzania Increasing Access to Quality Reproductive Healthcare.

SANJOY SANYAL
TANZANIA ENERGY ACCESS MAPS:
Interactive Market Exploration Tool

PURPOSE
• To create a visualization tool for exploring energy access in Tanzania
• Locate off-grid market opportunities
• Data:
– Tanzania Energy Access
Situation (2016)• Household Electrification (regional data)
• Mobile Phone Ownership (Pay-As-You-Go Viability)
• Kerosene and Solar Lighting
– Energy Infrastructure
Locations• Transmission Lines
• Mini-Grids
– Census (2012):• Livestock Ownership
• Iron Sheet Roofing Economic Indicators
• Radio Ownership
• Household Electrification (district-level data

MINI-GRID SUPPLY EXPLORATION
Interactive interface for exploration of existing and proposed mini-grids
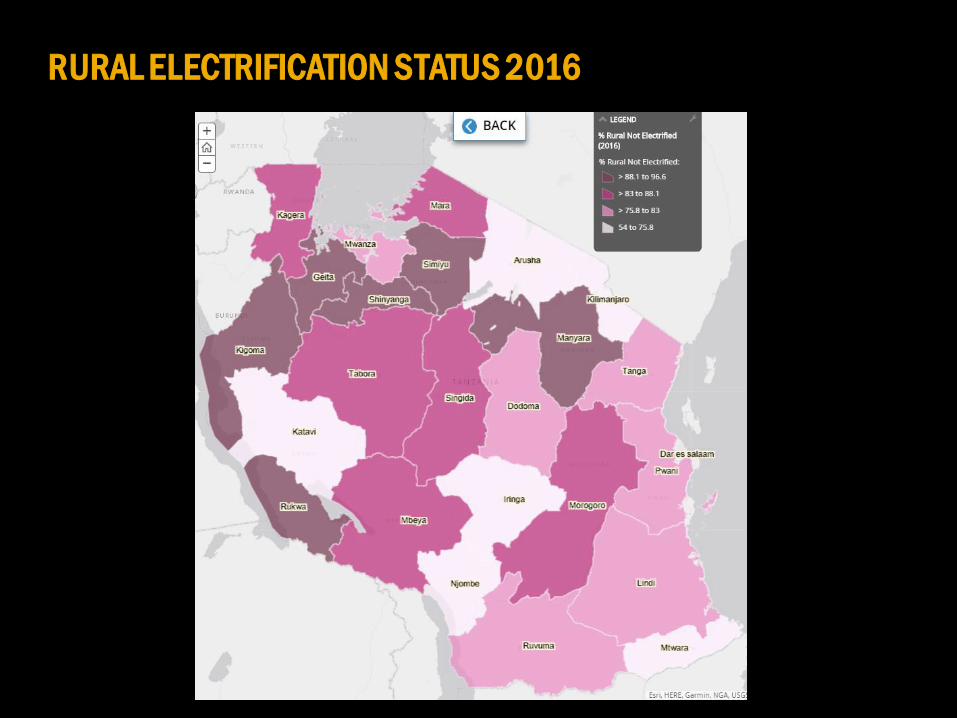
RURAL ELECTRIFICATION STATUS 2016

ELECTRICITY GAINS 2012-2016

SOLAR POWER
SUPPLY
National:
Grid: 74.9%
Solar: 24.7%
Other: 0.3%
Rural:
Grid: 34.5%
Solar: 64.8%
Other: 0.6%

Decrease in Kerosene Use
KEROSENE CONSUMPTION HAS DECREASED
Rechargeable Lights: 45%
Kerosene: 22.3%

ECONOMIC BUOYANCY
Regions Districts

SOCIOECONOMIC INDICATORS AND ENERGY
Radio Ownership
Region District
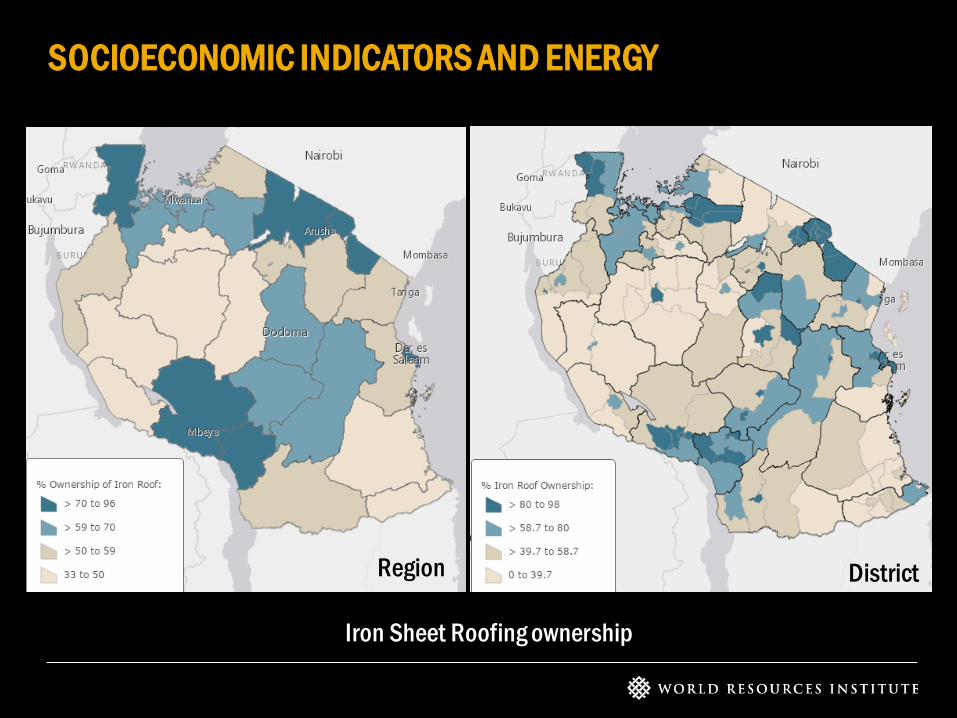
SOCIOECONOMIC INDICATORS AND ENERGY
Iron Sheet Roofing ownership
Region District
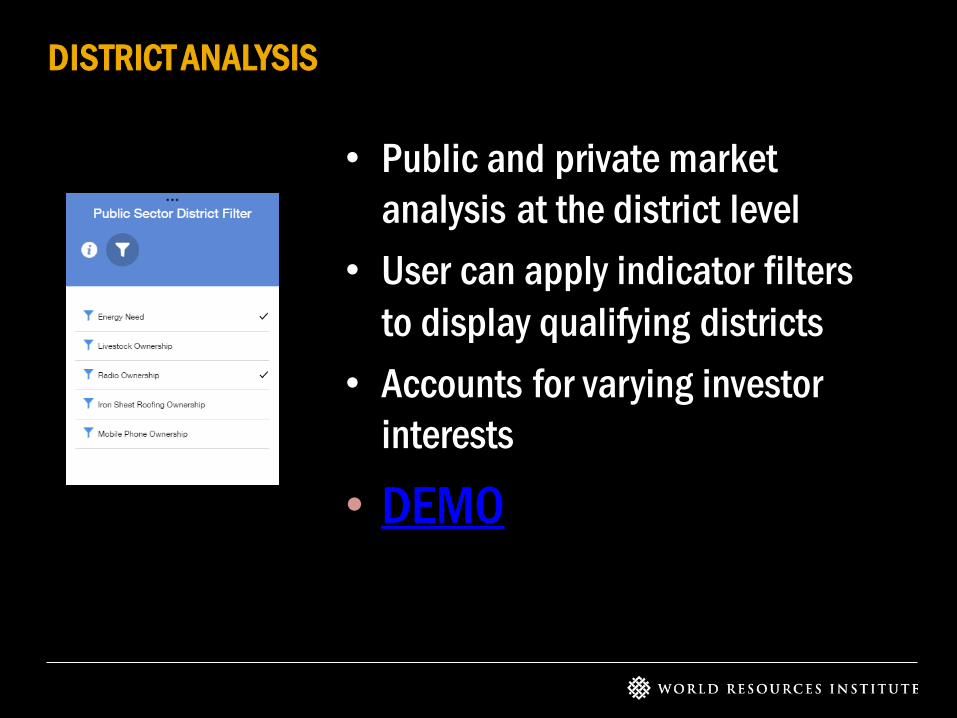
DISTRICT ANALYSIS
• Public and private market
analysis at the district level
• User can apply indicator filters
to display qualifying districts
• Accounts for varying investor
interests
• DEMO