TANF Reaching Few Poor Families - Center on Budget … Updated December 13, 2017 TANF Reaching Few...
19
1 Updated December 13, 2017 TANF Reaching Few Poor Families By Ife Floyd, LaDonna Pavetti, and Liz Schott The Temporary Assistance for Needy Families (TANF) block grant, created by the 1996 welfare law, is designed to provide a temporary safety net to poor families — primarily those with no other means to meet basic needs. But since the TANF block grant was created, its reach has declined dramatically. In 2016, for every 100 families in poverty, only 23 received cash assistance from TANF — down from 68 families when TANF was first enacted. This “TANF-to-poverty ratio” (TPR) reached its lowest point in 2014 and remained there in 2015 and 2016. President Trump and congressional Republicans have said that “welfare reform” is a priority for 2018, now that the tax cuts they are pushing to enact, which primarily benefit the wealthy and profitable corporations, threaten to drive up the deficit. 1 But the experience with TANF should not be a model for reform. There is strong evidence that TANF’s work requirements and block grant structure exacerbate, rather than reduce, poverty, and should not be extended to other programs. The federal government has a critical role in ensuring that low-income families have access to a minimum level of support to meet their basic needs. Block grants hand that responsibility over to states, which — with no national standards to hold them accountable for providing assistance to families in need — have acted in their own self-interest, not in the best interest of the most vulnerable members of society. State flexibility has allowed for wide variation among state TPRs, ranging from 4 in Louisiana to 66 in California (see Appendix Figure 1). In a growing number of states — now up to 15 — the ratio is 10 or less, meaning that for every 100 families living in poverty, 10 or fewer receive TANF cash assistance. In 2006, only two states had a ratio that low, and in 1996, none did. TANF’s limited reach means that families that hit upon hard times because they have lost a job, are fleeing a domestic violence situation, or face a health or mental health crisis have no access to cash assistance that can help them get back on their feet. Families need cash income to pay their rent and utilities, purchase personal care items such as laundry detergent, toothpaste, or toilet paper, and pay co-payments for their medication, among other needs. Lacking the financial resources to 1 Chye-Ching Huang, “GOP Budgets, Statements Make Plans Clear: Costly Tax Cuts for Wealthy Now, Program Cuts Later,” Center on Budget and Policy Priorities, December 5, 2017, https://www.cbpp.org/blog/gop-budgets- statements-make-plans-clear-costly-tax-cuts-for-wealthy-now-program-cuts-later. 820 First Street NE, Suite 510 Washington, DC 20002 Tel: 202-408-1080 Fax: 202-408-1056 [email protected] www.cbpp.org
Transcript of TANF Reaching Few Poor Families - Center on Budget … Updated December 13, 2017 TANF Reaching Few...

1
Updated December 13, 2017
TANF Reaching Few Poor Families By Ife Floyd, LaDonna Pavetti, and Liz Schott
The Temporary Assistance for Needy Families (TANF) block grant, created by the 1996 welfare
law, is designed to provide a temporary safety net to poor families — primarily those with no other means to meet basic needs. But since the TANF block grant was created, its reach has declined dramatically. In 2016, for every 100 families in poverty, only 23 received cash assistance from TANF — down from 68 families when TANF was first enacted. This “TANF-to-poverty ratio” (TPR) reached its lowest point in 2014 and remained there in 2015 and 2016.
President Trump and congressional Republicans have said that “welfare reform” is a priority for
2018, now that the tax cuts they are pushing to enact, which primarily benefit the wealthy and profitable corporations, threaten to drive up the deficit.1 But the experience with TANF should not be a model for reform. There is strong evidence that TANF’s work requirements and block grant structure exacerbate, rather than reduce, poverty, and should not be extended to other programs. The federal government has a critical role in ensuring that low-income families have access to a minimum level of support to meet their basic needs. Block grants hand that responsibility over to states, which — with no national standards to hold them accountable for providing assistance to families in need — have acted in their own self-interest, not in the best interest of the most vulnerable members of society.
State flexibility has allowed for wide variation among state TPRs, ranging from 4 in Louisiana to
66 in California (see Appendix Figure 1). In a growing number of states — now up to 15 — the ratio is 10 or less, meaning that for every 100 families living in poverty, 10 or fewer receive TANF cash assistance. In 2006, only two states had a ratio that low, and in 1996, none did.
TANF’s limited reach means that families that hit upon hard times because they have lost a job, are fleeing a domestic violence situation, or face a health or mental health crisis have no access to cash assistance that can help them get back on their feet. Families need cash income to pay their rent and utilities, purchase personal care items such as laundry detergent, toothpaste, or toilet paper, and pay co-payments for their medication, among other needs. Lacking the financial resources to
1 Chye-Ching Huang, “GOP Budgets, Statements Make Plans Clear: Costly Tax Cuts for Wealthy Now, Program Cuts Later,” Center on Budget and Policy Priorities, December 5, 2017, https://www.cbpp.org/blog/gop-budgets-statements-make-plans-clear-costly-tax-cuts-for-wealthy-now-program-cuts-later.
820 First Street NE, Suite 510 Washington, DC 20002
Tel: 202-408-1080 Fax: 202-408-1056
[email protected] www.cbpp.org

2
address these basic needs often puts families on a downward spiral, making it even harder to get back on their feet.
The decline in TANF as indicated by the TPR is a real loss of cash assistance to help families
make ends meet, since other anti-poverty programs cannot fulfill the role TANF is at least intended to fulfill. The Earned Income Tax Credit (EITC) is very effective at boosting working families’ overall income, but families cannot access the EITC throughout the year if a crisis occurs, and not all families are able to work or find work that would qualify them for the EITC. Other cash assistance programs like Unemployment Insurance (UI) and Supplemental Security Income (SSI) have eligibility standards that make them unavailable to a wider share of poor families who need cash.
Furthermore, there is a small but growing number of families living in extreme poverty, $2 per
person per day, in any given month. Researchers found the growth of families living in extreme poverty occurred among the groups most affected by welfare reform.2 TANF’s declining footprint as an available resource leaves many of these very poor families unaware of the program’s existence or believing they will not be accepted. While they may receive benefits under SNAP (formerly food stamps), that program does not provide the cash they need to pay rent or buy clothes for their children. What TANF means to deeply poor families cannot be replaced by the EITC, UI, SSI, or SNAP.
One of TANF’s four purposes, as laid out in the 1996 law, is assisting needy families so children
can be cared for in their own homes or the homes of relatives. Yet TANF’s block grant structure, combined with state actions that its flexibility permits, have limited families’ access to cash assistance. Unlike entitlement programs such as SNAP, which automatically respond when need rises, the TANF block grant did not expand to accommodate increased need during the Great Recession. In fact, several states cut their programs during the recession to help close budget shortfalls. More recently, some states have enacted extremely restrictive eligibility policies for ideological rather than fiscal reasons. Hundreds of thousands of families have lost benefits since 2006 (when TANF was last reauthorized) due to these changes.
The limited availability of TANF benefits has put poor families — and especially their children —
at risk of much greater hardship, with the potential for long-term negative consequences. Furthermore, TANF spends little to connect families to work, which could lessen their need for assistance.3 The end result is that TANF does less to lift families out of deep poverty (incomes below half of the poverty line) than its predecessor, Aid to Families with Dependent Children (AFDC), and the number of families living in extreme poverty (family incomes below $2 per person per day) has risen since 2000.
2 H. Luke Shaefer and Kathryn Edin, “Extreme Poverty in the United States, 1996 to 2011,” National Poverty Center Policy Brief #28, February 2012, http://npc.umich.edu/publications/policy_briefs/brief28/policybrief28.pdf. 3 Liz Schott and Ife Floyd, “How States Use Funds Under the TANF Block Grant,” CBPP, January 5, 2017, http://www.cbpp.org/research/family-income-support/how-states-use-funds-under-the-tanf-block-grant.

3
What Is the TANF-to-Poverty Ratio? We use the TANF-to-poverty ratio to examine changes over time in TANF’s role in helping poor families meet their basic needs. We calculate the ratio by dividing the number of TANF cash assistance cases by the number of families with children in poverty from the Census Bureau’s Current Population Survey (CPS). We use two-year averages for our state-level calculations to improve the reliability of the data. (See Appendix A for further details about our methodology.)
When this ratio falls, it means TANF is less responsive to need than in previous years. The TPR can fall because: (1) the number of families receiving cash assistance from TANF falls without a corresponding drop in the number of families living in poverty; or (2) the number of poor families rises without a corresponding increase in the number of families receiving TANF benefits.
The TPR has both strengths and limitations. Its strengths include: (1) it provides a measure of access to TANF benefits that is consistent over time and across states; and (2) it uses readily available data, making it transparent and relatively current. Two key limitations are: (1) it is less reliable in small states because of sample size limitations in the CPS; and (2) the underreporting of income from public benefit programs in the CPS has worsened over time, making the official poverty estimates less accurate than they once were.
The TANF participation rate, which the U.S. Department of Health and Human Services produces, provides an explicit measure of the share of eligible families receiving TANF benefits, however it generally lags two years behind the TPR and is not available at the state level. The TANF participation rate uses the Transfer Income Model’s (TRIM) microsimulations of the CPS data to adjust for underreporting and to identify eligible families more precisely. Though the TPR and the participation rates use different methodologies to measure access to TANF cash assistance, they produce quite similar results and they have had the same downward trajectory since before welfare reform.
Cash Assistance for Poor Families Largely Disappearing Over Time In 2016, for every 100 families in poverty, just 23 families received TANF cash assistance. This is
down from 68 families that received cash assistance for every 100 in poverty in 1996, when TANF was created. (See Figure 1.) Between 2015 and 2016, both poverty and caseloads declined, and the TPR remained unchanged from the previous year. In 2006, the last time TANF was reauthorized, 31 families received TANF for every 100 families in poverty.

4
FIGURE 1
During TANF’s early years, when the economy was strong and employment among never-married
mothers rose, TANF caseloads fell more than the number of poor families, causing the TPR to drop. More recently, the continued decline in the TPR reflects a decline in the caseload that has outpaced the decline in poverty. Nationwide, the number of families in poverty declined by 3 percent between 2006 and 2016, while the national TANF caseload fell by 28 percent (from 1.9 million families to fewer than 1.4 million). Between its post-recession peak in 2010, when close to 2 million families received TANF (see Appendix B, Table 2) and 2016, the TANF caseload fell by 31 percent.
TANF-to-Poverty Ratio Falling in Most States, Often Sharply
The national TANF-to-poverty ratio misses the extreme — and growing — variation among states. In 2016 the TPR ranged from 66 (in California) to 4 (in Louisiana). (See Figure 2.) (To improve the reliability of the state-level poverty data, we created two-year averages of the poverty numbers; we also transformed the caseload data into two-year averages to calculate the TPRs. The years cited here are for the latter of the two years.)4 The TPR fell in a majority of states between 2006 and 2016. A number of factors contributed to this decline including increases in the number of families living in poverty, the failure of state TANF programs to respond to increased need during and after the recession, and state policy and administrative changes that made TANF less
4 Because our state-level TPRs are based on two-year averages, the latest figures — which average data for 2015 and 2016 — may not reflect the full effects of some state actions between 2015 and 2016. Those effects will likely become clear after another year of data is available.
5
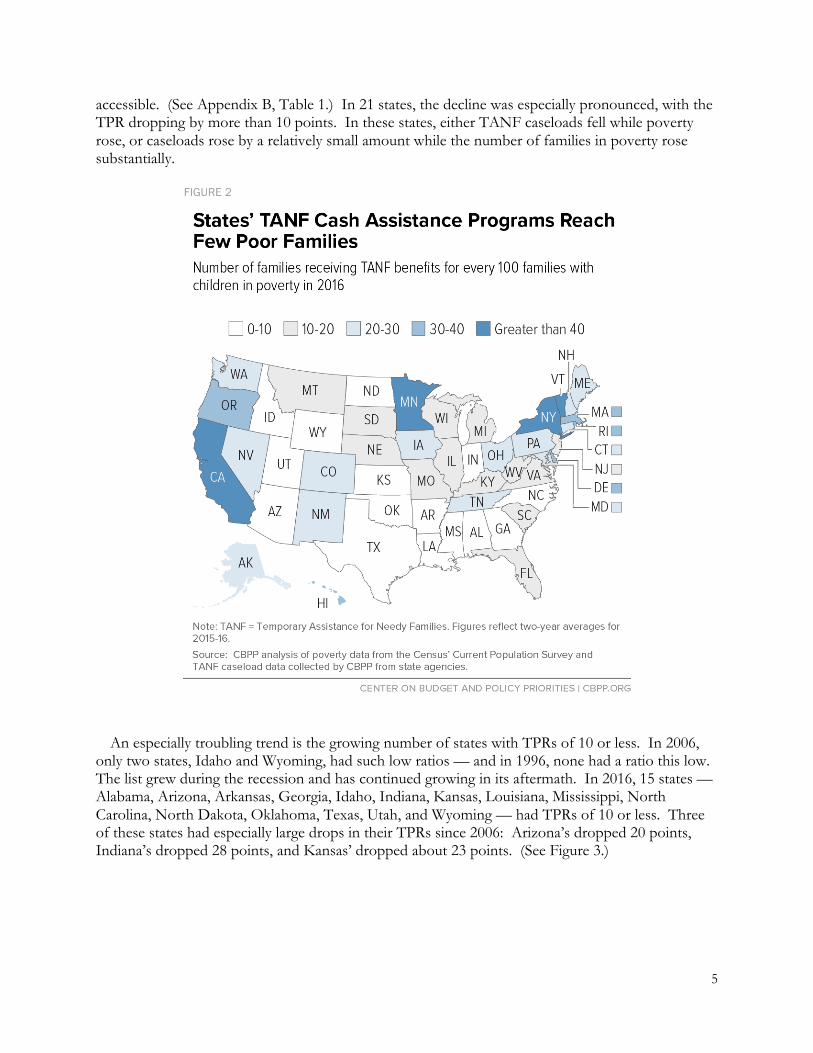
accessible. (See Appendix B, Table 1.) In 21 states, the decline was especially pronounced, with the TPR dropping by more than 10 points. In these states, either TANF caseloads fell while poverty rose, or caseloads rose by a relatively small amount while the number of families in poverty rose substantially.
FIGURE 2
An especially troubling trend is the growing number of states with TPRs of 10 or less. In 2006,
only two states, Idaho and Wyoming, had such low ratios — and in 1996, none had a ratio this low. The list grew during the recession and has continued growing in its aftermath. In 2016, 15 states — Alabama, Arizona, Arkansas, Georgia, Idaho, Indiana, Kansas, Louisiana, Mississippi, North Carolina, North Dakota, Oklahoma, Texas, Utah, and Wyoming — had TPRs of 10 or less. Three of these states had especially large drops in their TPRs since 2006: Arizona’s dropped 20 points, Indiana’s dropped 28 points, and Kansas’ dropped about 23 points. (See Figure 3.)

6
FIGURE 3
State Policy Changes Drive Big Declines Caseloads are lower in most states than they were when TANF was reauthorized in the Deficit
Reduction Act (DRA), which took effect in 2006.5 Some 33 states lost more than 20 percent of their caseload from 2006 to 2016. Caseloads fall for two reasons: the need for assistance goes down or states make changes that make the program less accessible. Both have occurred in recent years, but the biggest declines were in states with major policy changes. Some states shortened or otherwise changed their time limits, cutting off families that remained in need. Others made changes that made it harder for families to qualify for benefits, such as more stringent applicant requirements.
States made these changes for a range of reasons. The TANF-related DRA changes put pressure
on states to reduce caseloads, and caseloads began to fall in many states starting in 2006. In subsequent years, a number of states made TANF cuts because of budgetary shortfalls caused by the recession. At the same time, some states made changes to TANF programs for ideological reasons, leading to drops in caseloads. Examples illustrating the range of changes of this time period include the following:
5 As noted, this paper’s analysis of state TPR’s uses two-year averages of TANF caseload data so that the data are comparable to the two-year averages we use for state-level poverty data. Additionally, poverty data are not available on a monthly basis. In this section, because we focus only on monthly average TANF caseload trends, two-year averages are not needed.

7
• Michigan made several changes to its TANF program, including time limit changes starting
in 2007. In 2011, the state tightened its 48-month TANF time limit by eliminating certain exemptions or extensions and applied a time limit retroactively to many families who had been previously exempt. Michigan’s TANF caseload fell by 73 percent between 2006 and 2016 and its TPR fell from 40 in 2006 to 14 in 2016.
• Arizona cut benefits, shortened time limits, and imposed other eligibility restrictions starting in 2009 to help address its budget problems. These changes account for most of the three-quarters drop in Arizona’s TANF caseload between 2006 and 2016. The state’s TPR fell from 27 in 2006 to 6 in 2016. In 2015, Arizona enacted legislation shortening the time limit further, to 12 months, the shortest in the country. This year, the state amended the policy somewhat to allow for a 12-month extension for certain families. Even with the extension, the short time limit continues to contribute to TANF caseload and TPR declines.
• Washington State, responding to rising caseloads during the recession, cut benefits and tightened its time-limit policies in 2011. The state’s caseload fell by 45 percent between 2006 and 2016, and its TPR dropped from 63 in 2006 to 25 in 2016.
• Kansas reduced its 60-month time limit to 48 months in 2011 and further reduced it to 36 months in 2015 and to 24 months in 2016. Additionally, in 2011 the state established an applicant job search requirement and toughened sanctions; it also tightened other eligibility requirements. Kansas’ caseload fell by about 71 percent between 2006 and 2016. Its TPR fell from 32 in 2006 to 10 in 2016.
• Maine’s passage of a 60-month time limit and full-family sanctions in 2012 resulted in a 58 percent drop in caseloads between 2006 and 2016. The state’s TPR fell from 52 in 2006 to 22 in 2016.
• Missouri lawmakers shortened the time limit and imposed full-family sanctions in 2015. Between 2006 and 2016, the caseload fell by about 38 percent. The TPR dropped from 38 in 2006 to 19 in 2016.
• Over a similar time period as the state actions above, Indiana made administrative and procedural changes, including instituting job search requirements for applicants and toughening sanctions penalties. Between 2006 and 2016, Indiana’s caseload dropped by 82 percent. Its TPR dropped from 35 in 2006 to 7 in 2016.
States rarely track whether parents find work or how they fare after leaving TANF. However, a
recent study conducted by Washington State provides important insights that are consistent with other research on families that have lost TANF benefits due to time limits.6 The study found that families losing benefits due to the state’s time-limit changes were likelier than families leaving TANF for other reasons to have barriers that prevented them from entering the labor market and leaving
6 Some other research shows that those families reaching the TANF time limits have more barriers to employment than other families in the caseload. See Pamela Ovwigho et al., “The TANF Time Limit: Barriers & Outcomes among Families Reaching the Limit,” Family Welfare Research & Training Group, University of Maryland School of Social Work, November 2007, http://www.familywelfare.umaryland.edu/reports1/tl_barriers.pdf and Kristin Seefeldt and Sean Orzol, “Watching the Clock Tick: Factors Associated with TANF Accumulation,” National Poverty Center, May 2005, http://www.npc.umich.edu/publications/workingpaper04/paper9/04-09.pdf.

8
TANF on their own. For example, they were likelier to have significant mental and physical health issues: two-thirds of parents in that group had an indication of mental illness, 23 percent had a chronic illness, and 25 percent needed alcohol or drug treatment. Three years after losing TANF, fewer than half were employed, and they had higher rates of homelessness than families who left for other reasons. In spite of their high rates of health issues, these families had not received TANF extensions based on disability and few transitioned to SSI.7
Maine released a study this year claiming that families who left TANF due to the time limits increased employment and earnings and were overall faring better. However, our follow-up analysis of the Maine data found the report covers up the extent to which terminated families are not working. Two-thirds of parents were not working in the average quarter of the fourth year after the implementation of the time-limit policy. More than half of the group not working had no earnings over the whole study period. Also, average earnings of those studied were far below the poverty level.8
TANF Lifts Far Fewer Children out of Deep Poverty Than AFDC
Decreased access to TANF benefits has left the poorest families without resources needed to meet their basic needs. TANF’s predecessor, AFDC, played a significant role in reaching families, particularly those with children and those in deep poverty. TANF has failed to maintain that standard. TANF benefits are not sufficient to lift families out of poverty in any state,9 and TANF does far less than AFDC did to lift families out of deep poverty. While AFDC lifted more than 2.5 million children out of deep poverty in 1995, TANF lifted only 420,000 children out of deep poverty in 2014.10 (See Figure 4.) In 1995, only three states had more families living in deep poverty than receiving AFDC. By 2016, the vast majority of states had more families living in deep poverty than receiving TANF.
7 Deleena Patton et al., “TANF Caseload Decline: The Well-Being of Parents and Children Leaving WorkFirst in Washington State,” Washington State Department of Social and Health Services, Economic Services Administration, April 2015, https://www.dshs.wa.gov/sites/default/files/SESA/rda/documents/research-11-216_1.pdf. 8 Tazra Mitchell, “Research Note: Contrary to Maine Officials’ Claims, TANF Time Limit Leaves Most Families Without Work or Cash Assistance,” CBPP, August 15, 2017, https://www.cbpp.org/research/family-income-support/research-note-contrary-to-maine-officials-claims-tanf-time-limit. 9 Ife Floyd, “TANF Cash Benefits Have Fallen by More Than 20 Percent in Most States and Continue to Erode,” CBPP, updated October 13, 2016, http://www.cbpp.org/research/tanf-cash-benefits-have-fallen-by-more-than-20-percent-in-most-states-and-continue-to-erode. 10 CBPP analysis of data from Columbia University Population Research Center and U.S. Census Bureau. Corrections for underreported government assistance from Health and Human Services/Urban Institute Transfer Income Model (TRIM). Calculations use Supplemental Poverty Measure (SPM) and 2012 SPM poverty line adjusted for inflation.
In earlier editions of this paper, CBPP used a different methodology to calculate these figures. These new estimates use the SPM and the latest available data from the Health and Human Services/Urban Institute TRIM.

9
FIGURE 4
Under TANF, the poorest families have become worse off. In the decade after TANF’s creation,
average incomes fell by 18 percent among the poorest children in single-mother families, reflecting a large drop in the receipt of cash assistance. These families recouped some of these losses after 2005 due to expansions of SNAP, while their average income from TANF benefits continued to decline during the Great Recession. Still, between 2005 and 2012, these single-mother families lost further ground.11
Evidence shows that the drop in cash assistance receipt since welfare reform is one of the main
drivers of rising “extreme poverty,” a measure used by the World Bank of the number of households surviving on $2 or less per person per day. Researchers H. Luke Shaefer and Kathryn Edin find that the number of U.S. households living in extreme poverty in any given month more than doubled between 1996 and 2011, from 636,000 to 1.46 million; the number of children living in such households also doubled, from 1.4 million to 2.8 million. Shaefer and Edin find that these households are “concentrated among those groups who were most affected by welfare reform.” Even for TANF recipients, benefits are so low that they do little to lift a family out of deep poverty. In Mississippi and Tennessee, where benefits for a family of three are the lowest in the country, families whose income consists solely of TANF may still find themselves living in extreme poverty.
Two well-known poverty researchers, Greg J. Duncan and Katherine Magnuson, have shown that
poverty among young children not only slows them in school but also shrinks their earnings as adults. Welfare-to-work programs and other anti-poverty experiments “suggest that income plays a
11 Danilo Trisi and Arloc Sherman, “Incomes Fell for Poorest Children of Single Mothers in Welfare Law’s First Decade,” CBPP, August 11, 2016, http://www.cbpp.org/research/family-income-support/incomes-fell-for-poorest-children-of-single-mothers-in-welfare-laws.

10
causal role in boosting younger children’s achievement” in preschool and elementary school, they note. (TANF is often a critical source of income for the most vulnerable families with young children.) They also found that among families with incomes below $25,000, children whose families received a $3,000 annual income boost when the children were under age 6 earned 17 percent more as adults and worked 135 more hours per year after age 25 than otherwise-similar children whose families didn’t receive the income boost. This suggests that TANF policy changes that cut income, such as establishing harsher sanctions or shorter time limits or significantly reducing benefits, could harm young children now and into the future.12
TANF Reforms Needed to Support Work, Help Families Meet Basic Needs The TANF block grant, established 21 years ago, is overdue for reform.a TANF’s combination of nearly unfettered state flexibility, fixed block grant funding, narrowly defined work requirements, and time limits has created a system that provides a safety net to very few families in need (as the data in this paper show) and does little to prepare low-income parents for success in today’s labor market. Federal policymakers can begin to address these problems by adopting policy changes aimed at providing an effective safety net to poor families with children, creating effective work programs to help parents prepare for work, and ensuring that adequate resources are available to achieve these goals. Specifically, policymakers should:
• Hold states accountable for serving families in need. States focus on what they are incentivized to do. To expand TANF’s reach, Congress should remove incentives that encourage states not to assist families and create an accountability measure that focuses on serving families in need (such as the TANF-to-poverty ratio). States that fail to meet a specified standard could be required to spend additional resources on cash assistance or work activities.
• Hold states accountable for employment outcomes. The primary measure of TANF’s success should be whether families leave the program with employment and are on a path to earn enough to provide for their families, not simply whether they participate in a pre-defined set of activities that may or may not prepare them for employment and help them move out of poverty. The measure should capture employment and earnings outcomes and should align TANF with other workforce programs under the Workforce Innovation and Opportunity Act.
• Require states to spend a specified share of federal and state resources on TANF’s core purposes. TANF’s purposes are broad, which has provided states with the flexibility to spread TANF funds throughout their state budgets. To direct more TANF resources to the program’s core purposes — cash assistance, employment assistance, and work supports — Congress could require states to spend a specific share, for example 60 percent, of their state and federal TANF funds on these core purposes.
• Increase the TANF block grant to account for its decline in value, and index it to inflation in future years. The TANF block grant is worth about a third less than when it was created in 1996. Without additional funds, states are unlikely to spend additional resources to provide a cash safety net for more families. Any additional funds should be restricted to TANF’s core purposes — cash assistance, employment assistance, and work supports.
a For more details, see LaDonna Pavetti and Liz Schott, “TANF at 20: Time to Create a Program that Supports Work and Helps Families Meet Their Basic Needs,” CBPP, August 15, 2016, http://www.cbpp.org/research/family-income-support/tanf-at-20-time-to-create-a-program-that-supports-work-and-helps.
Conclusion
12 Greg J. Duncan and Katherine Magnuson, “The Long Reach of Early Childhood Poverty,” Pathways, Winter 2011, http://www.stanford.edu/group/scspi/_media/pdf/pathways/winter_2011/PathwaysWinter11_Duncan.pdf.

11
Conservative policymakers often cite TANF in praise of block grants with fixed federal funding and state flexibility. Yet an examination of state policies under TANF provides compelling evidence for why block-granting programs such as SNAP and Medicaid would be devastating for low-income families, and have long-term consequences for their children.
TANF provides a safety net for very few families and the number of families with access to the
program continues to decline. The lack of any minimum federal standards has allowed states to enact extremely restrictive eligibility policies, leaving the poorest families without the resources needed to meet their most basic needs through either employment or cash assistance. When states faced budget shortfalls, they took funds from the poorest families to help address those shortfalls. Moreover, the TANF block grant has not been increased since its inception and has lost more than a third of its value due to inflation. This should not be the fate of programs like SNAP and Medicaid, which millions of families rely on to meet their basic needs.

12
Appendix A
Methodology and Source Notes
TANF Caseload Data In this analysis, AFDC/TANF caseload data from January 1979 and August 2006 were collected
from the U.S. Department of Health and Human Services (HHS). Beginning in September 2006, this analysis uses caseload data collected directly from the states rather than the official data reported by HHS, as the state data more consistently reflect the number of families with children receiving cash assistance in each state over time.
These state data differ from the official HHS TANF data in two important ways. First, they
include cases from solely state-funded programs. In most instances, these families had been in state TANF programs but were shifted to a solely state-funded program on or after October 2006, when the Deficit Reduction Act of 2005 (DRA) took effect, because states anticipated these families would not be able to meet TANF work participation requirements and thus would lower the state’s work participation rate. These cases are not included in the data reported to HHS as no TANF or state maintenance-of-effort (MOE) funds are used. While these families are not counted in the HHS TANF caseload numbers, they generally are seen as part of the state’s cash assistance program and continue to receive the same or comparable benefits as when they were on TANF.
Second, unlike the HHS data, the state data exclude cases in worker supplement programs under
which states provide modest TANF- or MOE-funded cash payments to working families. States generally created these programs after the passage of the DRA. Because these supplements make additional families eligible (or make current recipients eligible for a longer period of time), they increase the TANF or MOE caseloads that states report to HHS. Often, states provide a very small cash grant to these families — as little as $8 to $10 per month. The main purpose of these small grants is to raise the percentage of TANF families who are meeting their work participation requirement, thereby helping states meet their work participation requirement.
Including solely state-funded programs and excluding worker supplement programs in the
caseload data used for our analysis allows us to have a more consistent trend of the number of families receiving cash assistance in each state over time.
Data on the Number of Families with Children in Poverty
The number of families with children in poverty was calculated using Current Population Survey (CPS) data and the official Census poverty thresholds. We counted related subfamilies and primary families in a single household as one family but counted and determined the poverty status of unrelated subfamilies separately. “Deep poverty” refers to families with incomes below half the poverty line, which in 2016 was about $12,000 for a family of four. Two years of CPS data were merged to improve reliability for state estimates. Ratio of Families on TANF to Families in Poverty
Ratios are calculated by dividing the number of TANF cases (based on administrative data from HHS or, since late 2006, data collected from states by CBPP) by the number of families with

13
children in poverty (CPS data). We use two-year averages for these calculations to improve reliability.
These ratios should not be interpreted as the percentage of families with children in poverty
served by TANF because the number of families on TANF is not a perfect subset of the number of families in poverty. A family above poverty could receive TANF benefits, for example — because some families may be poor in the months they receive TANF but have higher incomes for the rest of the year, or because states may encourage work by permitting partial TANF benefits to continue for certain families whose earnings put them slightly above the poverty line, or because in some households, large extended families may contain more than one eligible TANF case unit. For these reasons, it’s possible for a state to have more than 100 TANF families for every 100 families with children in poverty.
Using the Alabama ratio as an example, the data should be described as follows: In 1995, for
every 100 Alabama families with children in poverty, AFDC served 34 families. In 2016, 10 families participated in TANF for every 100 families with children in poverty.
In Alaska and Hawaii, the TANF-to-poverty ratio is above 100 in 1994-95 because the HHS
poverty guidelines used in determining program eligibility in these two states are significantly higher than the Census poverty thresholds used in determining the number of poor families. (This is not true for any of the other 48 states. HHS poverty thresholds are set higher in Alaska and Hawaii to allow for higher costs of living in these two states but do not vary elsewhere. The Census Bureau’s poverty thresholds do not vary for any state.)

14
Appendix B
TABLE 1
State TANF-to-Poverty Ratios Over Time
1994-
95 2005-
06 2010-
11 2011-
12 2012-
13
2013-
14
2014-
15
2015-
16
Ratio Change '05-06 to '15-
16
Alabama 34.3 17.1 17.8 16.5 13.6 11.8 11.4 10.2 -6.9
Alaska 128.1 32.3 27.3 28.6 29.6 28.9 30.4 26.8 -5.5
Arizona 54.9 27.1 13.4 10.1 9.1 7.6 6.6 6.2 -20.9
Arkansas 39.7 11.1 9.5 6.8 6.7 6.4 5.2 4.8 -6.3
California 96.8 66.4 61.0 60.3 65.0 64.7 64.6 65.5 -0.9
Colorado 72.1 17.8 14.7 17.4 20.6 20.0 19.9 26.3 8.5
Connecticut 86.4 48.3 35.3 33.0 30.0 31.4 29.9 23.5 -24.8
Delaware 102.1 45.4 34.1 29.6 28.8 32.7 39.0 37.9 -7.5
Florida 63.0 19.7 13.0 12.7 12.6 11.6 10.9 12.2 -7.5
Georgia 97.7 15.8 7.3 6.9 6.7 6.2 4.9 4.7 -11.1
Hawaii 113.1 70.9 43.7 44.9 50.5 50.0 40.2 38.1 -32.8
Idaho 31.7 8.0 4.4 4.5 5.4 7.5 7.3 7.1 -0.9
Illinois 88.3 17.1 13.3 16.5 17.8 17.2 17.7 15.8 -1.3
Indiana 51.6 34.9 15.0 10.5 8.8 7.6 6.6 7.2 -27.7
Iowa 75.5 40.1 36.0 33.1 27.5 26.8 27.3 21.9 -18.2
Kansas 54.4 32.3 19.5 16.5 14.5 12.6 9.8 10.3 -22.0
Kentucky 57.8 28.6 25.5 24.6 20.2 19.2 18.9 20.3 -8.3
Louisiana 49.3 10.2 7.2 6.7 5.7 4.1 3.6 4.2 -6
Maine 106.0 51.5 60.1 50.5 40.2 30.2 24.2 21.7 -29.8
Maryland 101.7 32.5 33.7 34.1 29.5 29.1 27.1 30.0 -2.5
Massachusetts 91.5 45.7 48.9 45.3 40.0 37.8 34.2 37.6 -8.1
Michigan 90.6 39.5 33.8 29.9 24.1 18.2 15.6 13.8 -25.7
Minnesota 89.4 51.3 44.3 41.7 38.3 39.6 49.3 56.5 5.2
Mississippi 50.3 14.3 12.0 12.6 11.1 9.8 8.2 6.7 -7.6
Missouri 82.1 37.5 29.2 29.3 27.6 27.8 29.3 18.9 -18.6
Montana 62.8 21.5 13.6 13.4 15.4 16.7 16.4 16.8 -4.7
Nebraska 62.2 51.5 29.4 22.1 20.2 19.2 17.3 19.9 -31.6
Nevada 59.0 19.6 19.7 18.9 16.6 16.5 18.0 22.2 2.6
New Hampshire 96.5 62.2 54.9 36.5 26.0 23.7 24.7 25.3 -36.9
New Jersey 106.8 41.8 26.2 26.7 27.7 23.2 20.3 19.7 -22.1
New Mexico 49.8 32.0 28.4 26.8 24.6 22.0 21.9 22.5 -9.5
New York 80.7 40.5 35.2 33.5 34.6 39.1 40.4 42.7 2.2
North Carolina 72.5 14.3 9.1 9.3 8.3 7.4 6.9 7.0 -7.3
North Dakota 48.4 23.0 16.1 14.9 13.0 12.9 10.1 8.1 -14.9
Ohio 88.6 32.7 31.9 30.7 29.2 25.6 22.1 22.4 -10.3

15
TABLE 1
State TANF-to-Poverty Ratios Over Time
1994-
95 2005-
06 2010-
11 2011-
12 2012-
13
2013-
14
2014-
15
2015-
16
Ratio Change '05-06 to '15-
16
Oklahoma 49.3 11.8 9.9 8.3 7.5 7.2 6.9 8.0 -3.8
Oregon 59.7 25.7 38.2 47.6 54.8 47.2 43.1 37.0 11.3
Pennsylvania 85.4 45.5 36.1 33.0 32.0 31.3 29.4 30.2 -15.3
Rhode Island 112.4 64.0 28.8 27.7 28.1 29.5 34.2 35.7 -28.3
South Carolina 42.0 20.9 14.7 13.4 13.4 12.4 11.4 11.5 -9.4
South Dakota 36.9 21.6 19.3 19.0 21.5 18.9 17.1 16.8 -4.8
Tennessee 77.0 50.7 36.4 32.9 28.0 24.8 24.7 23.2 -27.5
Texas 47.0 12.2 6.3 5.8 5.2 4.8 4.5 4.3 -7.9
Utah 65.2 20.7 13.4 10.7 8.8 8.9 9.1 9.3 -11.4
Vermont 104.8 78.7 47.6 50.1 67.8 78.4 54.2 47.1 -31.6
Virginia 73.2 31.4 29.2 27.7 26.6 25.4 22.5 19.2 -12.2
Washington 85.5 62.9 48.5 40.9 38.2 33.3 27.5 25.0 -37.9
West Virginia 68.5 27.0 23.0 23.1 20.4 18.3 17.5 16.5 -10.5
Wisconsin 96.0 22.9 24.4 22.8 24.4 25.8 23.7 19.8 -3.1
Wyoming 55.9 3.4 3.8 4.0 4.3 4.8 4.9 4.9 1.5 Note: The Census Bureau advised CBPP to use a different approach in calculating the 2013 poverty figures. CBPP revised the 2012-2013 and 2013-2014 TANF-to-poverty ratios to reflect these changes. Source: CBPP analysis of poverty data from the Current Population Survey and AFDC/TANF caseload data from Department of Health and Human Services and (since September 2006) caseload data collected by CBPP from state agencies

16
APPENDIX FIGURE 1

17
TABLE 2
National Single-Year TANF-to-Poverty Ratios
Number of families with
children in poverty Yearly average of number of families on AFDC/TANF Ratio
1995 6,231,237 4,733,665 76.0 1996 6,400,950 4,380,430 68.4 1997 6,139,036 3,689,968 60.1 1998 5,863,530 3,006,859 51.3 1999 5,423,801 2,539,155 46.8 2000 5,084,259 2,268,849 44.6 2001 5,310,009 2,162,291 40.7 2002 5,559,553 2,161,727 38.9 2003 5,961,941 2,157,688 36.2 2004 6,045,240 2,132,670 35.3 2005 5,905,536 2,042,382 34.6 2006 6,042,035 1,902,442 31.5 2007 6,040,484 1,766,025 29.2 2008 6,307,155 1,744,673 27.7 2009 6,873,910 1,883,981 27.4 2010 7,263,611 1,979,790 27.3 2011 7,373,605 1,963,241 26.6 2012 7,334,766 1,847,900 25.2 2013 6,940,399 1,748,042 25.5 2014 7,068,069 1,643,160 23.2 2015 6,477,753 1,502,219 23.2 2016 5,874,837 1,369,443 23.3
Note: The Census Bureau advised CBPP to use a different approach in calculating the 2013 poverty figures. CBPP revised the 2013 TANF-to-poverty ratio to reflect these changes. Source: CBPP analysis of poverty data from the Current Population Survey and AFDC/TANF caseload data from Department of Health and Human Services and (since September 2006) caseload data collected by CBPP from state agencies

18
TABLE 3
TANF Caseloads Over Time
2006 2010 2011 2012 2013 2014 2015 2016 Percent
Change ‘06-‘16
Alabama 19,358 22,363 23,359 21,285 19,365 16,388 13,083 10,849 -44.0%
Alaska 3,538 3,478 3,813 3,810 3,586 3,495 3,141 3,093 -12.6%
Arizona 38,634 28,492 17,886 17,729 16,177 13,322 11,087 9,160 -76.3%
Arkansas 8,161 7,462 7,052 6,461 5,844 4,946 3,895 3,127 -61.7%
California 480,132 575,090 592,630 571,440 558,364 555,605 520,000 478,637 -0.3%
Colorado 13,862 14,065 15,463 16,002 17,020 18,018 17,843 17,505 26.3%
Connecticut 21,365 19,181 18,302 17,312 16,757 16,612 14,951 13,306 -37.7%
Delaware 5,576 6,306 6,401 6,159 5,879 5,665 5,532 5,055 -9.3%
Florida 51,428 57,614 53,296 53,387 53,192 49,556 48,535 47,196 -8.2%
Georgia 29,338 20,387 19,614 18,582 17,351 14,698 13,157 12,552 -57.2%
Hawaii 9,310 9,628 10,176 10,380 9,715 8,818 7,531 6,322 -32.1%
Idaho 1,789 1,789 1,924 1,893 1,849 1,895 1,889 1,983 10.9%
Illinois 35,906 32,210 41,721 46,124 46,018 44,404 39,070 29,630 -17.5%
Indiana 43,668 34,984 24,709 15,735 12,203 10,140 8,885 7,997 -81.7%
Iowa 19,720 17,365 16,581 15,359 14,127 12,339 10,985 9,902 -49.8%
Kansas 16,639 13,914 13,284 9,590 7,462 6,319 5,676 5,144 -69.1%
Kentucky 32,470 30,483 30,851 30,444 30,256 27,813 24,490 22,621 -30.3%
Louisiana 11,266 11,013 10,781 9,135 7,165 5,767 5,491 5,781 -48.7%
Maine 11,979 14,716 14,583 11,755 8,713 7,082 5,968 5,037 -58.0%
Maryland 22,986 27,802 28,882 27,245 25,850 24,735 23,097 21,101 -8.2%
Massachusetts 46,686 50,673 51,717 52,193 49,661 43,554 37,119 32,483 -30.4%
Michigan 84,387 80,340 74,903 57,674 44,056 33,880 26,947 22,462 -73.4%
Minnesota 30,224 33,626 33,688 32,515 31,306 29,256 28,557 29,806 -1.4%
Mississippi 12,797 11,985 11,808 11,065 9,685 8,268 6,628 5,736 -55.2%
Missouri 43,777 41,999 42,232 40,191 36,385 30,964 27,225 15,815 -63.9%
Montana 3,642 3,707 3,410 3,160 3,129 3,046 2,981 3,296 -9.5%
Nebraska 12,473 8,732 8,080 7,244 6,908 6,205 5,845 5,964 -52.2%
Nevada 7,030 11,897 11,759 11,357 11,550 12,994 11,041 9,976 41.9%
New Hampshire 6,096 6,520 6,107 4,421 3,828 3,454 3,066 2,653 -56.5%
New Jersey 41,879 39,560 41,075 39,993 36,974 33,680 28,238 21,484 -48.7%
New Mexico 15,785 20,633 20,118 17,573 14,818 14,129 13,176 12,511 -20.7%
New York 171,662 158,081 161,104 160,109 160,136 154,041 152,297 146,353 -14.7%
North Carolina 29,631 25,143 23,794 22,623 20,622 18,807 16,545 16,377 -44.7%
North Dakota 2,669 1,876 1,687 1,536 1,328 1,190 1,096 1,047 -60.8%
Ohio 79,285 100,655 93,096 74,957 66,675 62,024 58,918 56,820 -28.3%
Oklahoma 10,092 9,635 9,066 8,658 7,670 7,206 7,262 7,191 -28.7%
Oregon 18,281 28,314 32,048 36,027 35,793 33,122 27,249 24,161 32.2%
Pennsylvania 94,577 86,080 86,382 82,721 77,199 74,766 70,576 62,800 -33.6%
Rhode Island 12,153 7,175 6,542 6,495 5,964 5,426 4,662 4,353 -64.2%

19
TABLE 3
TANF Caseloads Over Time
2006 2010 2011 2012 2013 2014 2015 2016 Percent
Change ‘06-‘16
South Carolina 17,637 20,513 19,049 15,829 14,488 12,729 11,875 10,988 -37.7%
South Dakota 2,852 3,212 3,232 3,211 3,121 3,054 2,994 3,030 6.2%
Tennessee 68,106 62,355 61,529 56,131 51,416 45,308 35,986 29,854 -56.2%
Texas 68,100 49,387 46,599 41,929 36,703 31,965 27,553 25,313 -62.8%
Utah 6,843 7,069 5,870 4,897 4,449 4,355 4,033 3,960 -42.1%
Vermont 4,757 5,751 5,989 6,312 6,332 5,760 4,858 4,274 -10.2%
Virginia 33,959 37,543 36,031 33,711 31,124 27,979 25,005 23,244 -31.6%
Washington 54,556 66,895 59,261 51,276 45,522 39,283 32,606 29,944 -45.1%
West Virginia 11,058 11,193 11,379 10,611 9,812 9,198 6,662 7,753 -29.9%
Wisconsin 18,149 23,710 26,731 25,324 26,484 25,947 21,502 17,954 -1.1%
Wyoming 304 353 345 360 411 386 384 486 59.7%
U.S. 1,902,442 1,979,893 1,963,324 1,847,761 1,747,820 1,643,194 1,502,056 1,369,443 -28.0% As noted, this paper’s analysis of state TPR’s uses two-year averages of TANF caseload data so that the data are comparable to the two-year averages we use for state-level poverty data. Additionally, poverty data are not available on a monthly basis. In this table, since we highlight only the monthly average caseload for each year, two-year averages are not needed. At the time of publishing this paper, Virginia did not have data available for December 2016. For that missing month of data, CBPP created an estimate of the caseload based on the data available from the Department of Health and Human Services. Thus, the annual monthly average of caseloads listed above for Virginia and the United States are estimates.