TAMIL NADU - Yes Bank · Tamil Nadu is the eleventh largest state in India with 32 districts...
48
A Socio-Economic Snapshot 2015 TAMIL NADU
Transcript of TAMIL NADU - Yes Bank · Tamil Nadu is the eleventh largest state in India with 32 districts...

A Socio-Economic Snapshot 2015TAMIL NADU


TITLE Tamil Nadu: A Socio-Economic Snapshot 2015
YEAR September, 2015
AUTHORS Strategic Government Advisory (SGA), YES BANK
COPYRIGHT No part of this publication may be reproduced in any form by photo, photoprint, microfilm or any other means without the written permission of YES BANK Ltd.
DISCLAIMER
This report is the publication of YES BANK Limited (“YES BANK”) and so YES BANK has editorial control over the content, including opinions, advice, statements, services, offers etc. that is represented in this report. However, YES BANK will not be liable for any loss or damage caused by the reader’s reliance on information obtained through this report. This report may contain third party contents and third-party resources. YES BANK takes no responsibility for third party content, advertisements or third party applications that are printed on or through this report, nor does it take any responsibility for the goods or services provided by its advertisers or for any error, omission, deletion, defect, theft or destruction or unauthorized access to, or alteration of, any user communication. Further, YES BANK does not assume any responsibility or liability for any loss or damage, including personal injury or death, resulting from use of this report or from any content for communications or materials available on this report. The contents are provided for your reference only.
The reader/ buyer understands that except for the information, products and services clearly identified as being supplied by YES BANK, it does not operate, control or endorse any information, products, or services appearing in the report in any way. All other information, products and services offered through the report are offered by third parties, which are not affiliated in any manner to YES BANK.
The reader/ buyer hereby disclaims and waives any right and/ or claim, they may have against YES BANK with respect to third party products and services.
All materials provided in the report is provided on “As is” basis and YES BANK makes no representation or warranty, express or implied, including, but not limited to, warranties of merchantability, fitness for a particular purpose, title or non – infringement. As to documents, content, graphics published in the report, YES BANK makes no representation or warranty that the contents of such documents, articles are free from error or suitable for any purpose; nor that the implementation of such contents will not infringe any third party patents, copyrights, trademarks or other rights.
In no event shall YES BANK or its content providers be liable for any damages whatsoever, whether direct, indirect, special, consequential and/or incidental, including without limitation, damages arising from loss of data or information, loss of profits, business interruption, or arising from the access and/or use or inability to access and/or use content and/or any service available in this report, even if YES BANK is advised of the possibility of such loss.Maps depicted in the report are graphical representation for general representation only.
CONTACTS
YES BANK Ltd.
Nikhil SahniSenior President Government Relationship Management & Strategic Government Advisory
Registered and Head Office
9th Floor, Nehru Centre, Dr. Annie Besant Road,Worli, Mumbai - 400 018
Tel : +91 22 6669 9000Fax : +91 22 2497 4088
Northern Regional Office48, Nyaya Marg, ChanakyapuriNew Delhi – 110 021
Tel : +91 11 6656 9000Email : [email protected] Website : www.yesbank.in


Rana Kapoor
Managing Director & CEO
FOREWORD
TAMIL NADU – The Land of Abundant Opportunities is the second largest state economy in India, contributing about 8.5% of the country’s Gross Domestic Product (GDP) in FY14. The state is one of the most “Urban” and “Industrialized” states and has emerged as the foremost manufacturing and technology hub. Leading companies in major sectors like Automobiles, Auto-components, Engineering, Textiles & Garments, Leather & Leather products, Chemicals & Plastics among others have chosen Tamil Nadu for their operation. Chennai, the “Detroit of India” has positioned itself as the economic hub for South India. The rate of growth of services sector in Tamil Nadu is also commendable with a contribution of 65% to the state economy. Tourism has been a key sector with Tamil Nadu achieving the numero uno status in both domestic & foreign tourist footfalls for 2014. This reflects the dynamic development of the state across sectors. In terms of infrastructure, Tamil Nadu has an excellent road and rail network, three major ports and 23 minor ports, and seven airports across the state ensuring excellent connectivity. The backbone to this focused development is highly responsive and efficient governance making Tamil Nadu an investment destination of choice. The Government of Tamil Nadu has framed numerous policies that promote industrial development. The Vision 2023 Tamil Nadu launched by Hon’ble Chief Minister Selvi J. Jayalalithaa envisages an investment of Rs 15,00,000 Crores by 2023, consolidating the state’s position as the ‘Number One’ state in the country. I congratulate the State Government for organizing the Tamil Nadu Global Investors Meet (TN GIM) 2015 which, I believe will significantly benefit the state and the country. I am sure the competitive policies of the state, coupled with efficient governance would form a strong foundation for investors to thrive. As a proud partner of TN GIM 2015, I am pleased to present the YES Bank Knowledge Report “Tamil Nadu – A Socio Economic Snapshot 2015” which highlights the socio-economic profile of Tamil Nadu, the current state of its infrastructure & resources and provides snapshots of certain key sectors in the state. The report spells out the competitive advantage enjoyed by the state and helps position it as one of the most preferred investment destinations in India. I am confident that the report will be a useful reference for the investor community and shall provide impetus to the growing economy in TAMIL NADU.
Thank You, Sincerely,

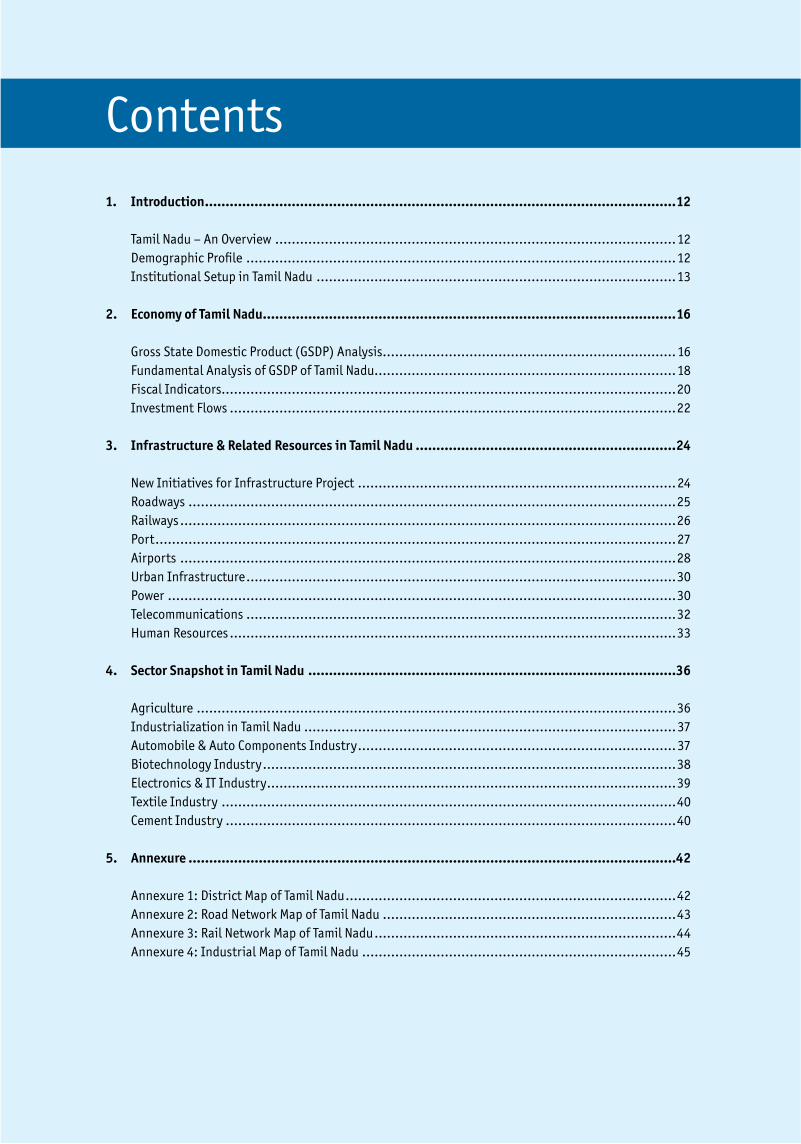
1. Introduction ..................................................................................................................12
Tamil Nadu – An Overview .................................................................................................12 Demographic Profile ........................................................................................................12 Institutional Setup in Tamil Nadu .......................................................................................13
2. Economy of Tamil Nadu....................................................................................................16
Gross State Domestic Product (GSDP) Analysis .......................................................................16 Fundamental Analysis of GSDP of Tamil Nadu.........................................................................18 Fiscal Indicators..............................................................................................................20 Investment Flows ............................................................................................................22 3. Infrastructure & Related Resources in Tamil Nadu ...............................................................24
New Initiatives for Infrastructure Project .............................................................................24 Roadways ......................................................................................................................25 Railways ........................................................................................................................26 Port ..............................................................................................................................27 Airports ........................................................................................................................28 Urban Infrastructure ........................................................................................................30 Power ...........................................................................................................................30 Telecommunications ........................................................................................................32 Human Resources ............................................................................................................33
4. Sector Snapshot in Tamil Nadu .........................................................................................36
Agriculture ....................................................................................................................36 Industrialization in Tamil Nadu ..........................................................................................37 Automobile & Auto Components Industry .............................................................................37 Biotechnology Industry ....................................................................................................38 Electronics & IT Industry ...................................................................................................39 Textile Industry ..............................................................................................................40 Cement Industry .............................................................................................................40
5. Annexure ......................................................................................................................42
Annexure 1: District Map of Tamil Nadu ................................................................................42 Annexure 2: Road Network Map of Tamil Nadu .......................................................................43 Annexure 3: Rail Network Map of Tamil Nadu .........................................................................44 Annexure 4: Industrial Map of Tamil Nadu ............................................................................45
Contents

List of FiguresFigure 1: District-wise population of Tamil Nadu in 2011 ............................................................ 13
Figure 2: Trends in GSDP of Tamil Nadu (Unit: INR Crore) ............................................................ 16
Figure 3: Trends in Contribution of Various Sectors to TN GSDP .................................................... 17
Figure 4: Trends in Growth Rates of Various Sectors of TN GSDP ................................................... 17
Figure 5: District-wise Distribution of GSDP for Tamil Nadu ......................................................... 18
Figure 6: Trends in Primary Sector output of Tamil Nadu (Units: INR Crore) .................................... 19
Figure 7: Trends in Industrial Sector output of Tamil Nadu .......................................................... 19
Figure 8: Trends in Industrial Sector output of Tamil Nadu .......................................................... 20
Figure 9: Revenue and Fiscal Deficit of Tamil Nadu as a Percentage of GSDP .................................... 22
Figure 10: Ranking of states in India based on Cumulative FDI inflows from .................................... 22 April 2000 to March 2015 (Units: INR Crore)
Figure 11: Classification of Road in Tamil Nadu for the year 2013-14 ............................................... 26
Figure 12: Break-up of National Highways in Tamil Nadu for the year 2013-14 .................................. 26
Figure 13: Trends in Traffic Handled at Major Ports in South India for the ....................................... 27 year 2009-10 to 2014-15 (Million Tonnes)
Figure 14: Share of Top 10 Indian Airports by Passenger Traffic in the year 2014-15........................... 28
Figure 15: Share of Top 10 Indian Airports by freight movement (in tons) in the year 2014-15 ............. 29
Figure 16: Trends in Total Passenger Traffic (million)at Chennai Airport for the ................................ 29 year 2011-12 to 2014-15
Figure 17: Trends in Total Freight Movement at Chennai Airport for the year 2008-09 to 2014-15 ......... 29
Figure 18: Break – up of installed power capacity in Tamil Nadu based on ....................................... 31 source of generation and the ownership
Figure 19: Category wise consumers of power as on March 2014 (in Lakh) ....................................... 31
Figure 20: Trends in Demand-Supply of Peak (MW) in Tamil Nadu for the year 2007-08 to 2014-15 ........ 31
Figure 21: Comparative Analysis of Tele-density in South India ..................................................... 33
Figure 22: Comparative Analysis of Literacy rate in Tamil Nadu ...................................................... 33
Figure 23: Incremental HR Availability for the period 2012-17 for ................................................. 34 Tamil Nadu (Units: Million Persons)
Figure 24: Trends of Industrialization in Tamil Nadu 2008-09 to 2012-13 ........................................ 37
Figure 25: IT Exports from Tamil Nadu (Units: INR Crore) ............................................................. 39
Figure 26: Cement Capacity and Production in Tamil Nadu (Units: Million Tonnes) ............................. 40

Table 1: Socio-Economic Profile of the State 12
Table 2: Institutional Profile of Tamil Nadu 13
Table 3: Fiscal Indicators of Tamil Nadu 21
Table 4: Proposed Investment for each sector as per Vision 2023 24
Table 5: Comparison of road length, road density and growth rate of road length of 25 various states in India
Table 6: Comparative Analysis of Rail Tracks among Southern States as on 2014 27
Table 7: Major Port-wise capacity utilization during 2014-15 (million tonnes) 28
Table 8: Peak Power demand & supply trend - South India and UT – 2011-12 to 2014-15. 32
Table 9: Comparative Analysis of Trends Aggregate Technical and Commercial (AT&C) 32 Losses - Southern India (%)
Table 10: Data on Cultivation Area And Production in Tamil Nadu 36
List of Tables


Introduction 01
12 | Tamil Nadu State Report, 2015
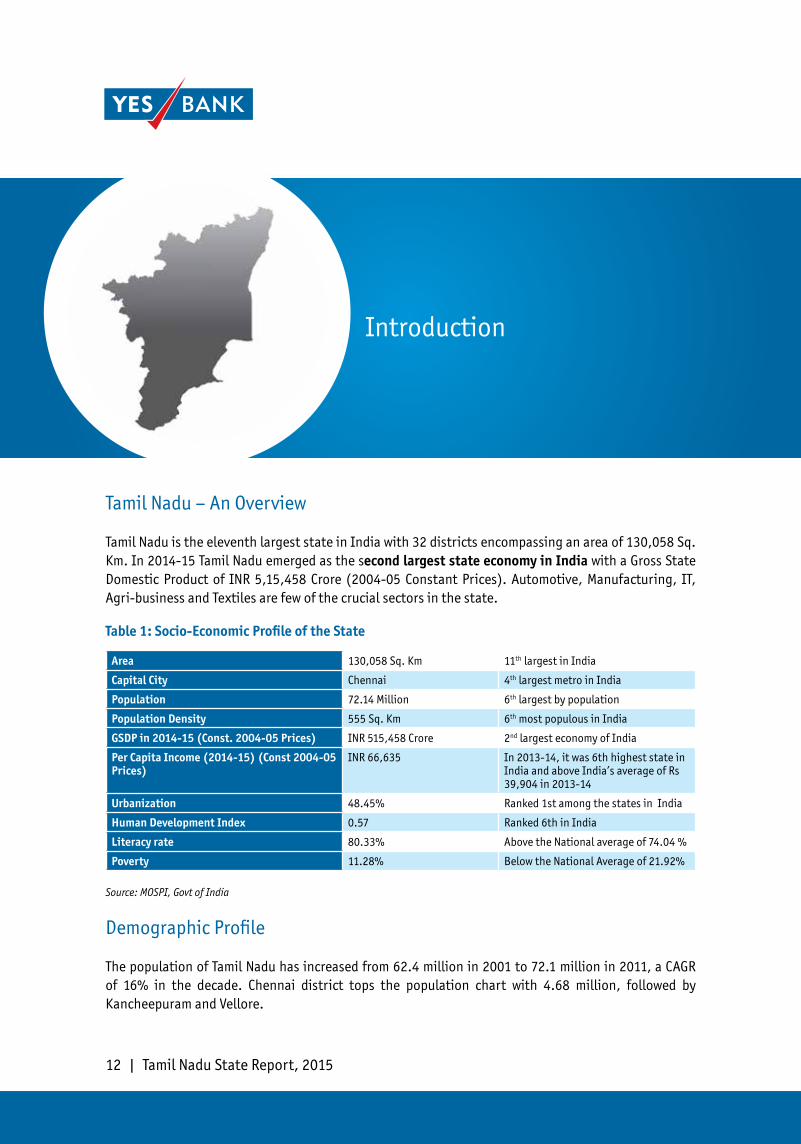
Tamil Nadu – An Overview
Tamil Nadu is the eleventh largest state in India with 32 districts encompassing an area of 130,058 Sq. Km. In 2014-15 Tamil Nadu emerged as the second largest state economy in India with a Gross State Domestic Product of INR 5,15,458 Crore (2004-05 Constant Prices). Automotive, Manufacturing, IT, Agri-business and Textiles are few of the crucial sectors in the state.
Demographic Profile
The population of Tamil Nadu has increased from 62.4 million in 2001 to 72.1 million in 2011, a CAGR of 16% in the decade. Chennai district tops the population chart with 4.68 million, followed by Kancheepuram and Vellore.
Source: MOSPI, Govt of India
Table 1: Socio-Economic Profile of the State
Area 130,058 Sq. Km 11th largest in India
Capital City Chennai 4th largest metro in India
Population 72.14 Million 6th largest by population
Population Density 555 Sq. Km 6th most populous in India
GSDP in 2014-15 (Const. 2004-05 Prices) INR 515,458 Crore 2nd largest economy of India
Per Capita Income (2014-15) (Const 2004-05 Prices)
INR 66,635 In 2013-14, it was 6th highest state in India and above India’s average of Rs 39,904 in 2013-14
Urbanization 48.45% Ranked 1st among the states in India
Human Development Index 0.57 Ranked 6th in India
Literacy rate 80.33% Above the National average of 74.04 %
Poverty 11.28% Below the National Average of 21.92%
Introduction

Tamil Nadu State Report, 2015 | 13
Institutional Setup in Tamil Nadu
Tamil Nadu has 39 Lok Sabha seats at the Parliament and 234 Legislative assembly constituencies. The Government of Tamil Nadu operates through 37 departments and 82 governmental agencies i.e. public service organizations, statutory corporations and co-operative societies. The institutional profile of the State is shown in the below table.
9 Urban Local Bodies: Tamil Nadu has 12 Corporations, 124 Municipalities and 528 Town Panchayats
9 Rural Local Bodies: Tamil Nadu has about 12,524 Village Panchayats and 385 Panchayat Unions.
Figure 1: District-wise population of Tamil Nadu in 2011
Table 2: Institutional Profile of Tamil Nadu
Source: Census Population, 2011, YES Bank Analysis
Source: Tamil Nadu State Profile, YES Bank Analysis
Districts 32
Revenue Divisions 79
Taluks 254
Firkas 1,177
Revenue Villages 16,710
Municipal Corporations 12
Municipalities 124
Panchayat Unions (Blocks) 385
Town Panchayats 528
Village Panchayats 12,524
Lok Sabha Constituencies 39
Assembly Constituencies 234
Dis
tric
ts
4,681,087
3,990,897
3,928,106
3,725,697
3,480,008
3,472,578
3,463,284
3,072,880
3,041,038
2,713,858
2,600,880
2,471,222
2,468,965
2,402,781
2,259,608
2,161,367
1,943,309
1,883,731
1,863,174
1,738,376
1,721,179
1,618,725
1,614,069
1,502,900
1,341,250
1,337,560
1,268,094
1,243,684
1,076,588
752,481
735,071
564,511
500,000 1,000,000 1,500,000 2,000,000 2,500,000 3,000,000 3,500,000 4,000,000 4,500,000 5,000,000
Population
Chennai
KancheepuramVellore
Thiruvallur
Salem
Coimbatore
VillupuramTirunelveli
Madurai
TrichyCuddalore
TirupurTiruvannamalai
ThanjavurErode
Dindugal
Virudunagar
Krishnagiri
KanyakumariThootukudi
Namakkal
Pudukottai
Nagapattinam
Dharmapuri
Sivagangai
RamanathapuramTiruvarur
Theni
Karur
Ariyalur
The NilgirirsPerambalur

Economy of Tamil Nadu 02

16 | Tamil Nadu State Report, 2015
Economy of Tamil Nadu
Gross State Domestic Product (GSDP) Analysis
9 Tamil Nadu was the second largest State Economy in India with a GSDP of Rs 5,15,458 Crore (2004-05 constant prices) in 2014-15, grown by over 7.2% over 2013-14 from INR 4,80,618 Crore. (Refer Figure 2)
9 Tamil Nadu has contributed an average of about 8.37% to India’s economy with a compounded annual growth rate (CAGR) of 8.94% for the period 2004-05 to 2014-15.
9 As of 2014-15 Agriculture & Allied Sector contributed about 7.1%, Industrial sector 28.0% and Services sector 64.8%, compared to 11.1%, 31.6% and 57.2% respectively in 2004-05.
9 The services sector has been forming the major sector contribution in the state throughout the year from 2004-05 to 2014-15 as shown in Figure 3.
Source: Ministry of Statistics and Program Implementation (MOSPI), Govt. of India; YES BANK Analysis
Figure 2: Trends in GSDP of Tamil Nadu (Unit: INR Crore)
219,003 249,567
287,530
305,157
321,793
356,632
403,416
433,238
447,944
480,618
515,458 13.96%
15.21%
6.13% 5.45%
10.83%
13.12%
7.39%
3.39%
7.29% 7.25%
-
100,000
200,000
300,000
400,000
500,000
600,000
0.00%
2.00%
4.00%
6.00%
8.00%
10.00%
12.00%
14.00%
16.00%
2004-05 2005-06 2006-07 2007-08 2008-09 2009-10 2010-11 2011-12 2012-13 2013-14 2014-15
GSDP in INR Crores Growth over previous period
Gro
wth
Rat
eA
t constan
t prices of (2
00
4-0
5)
Rs crores

Tamil Nadu State Report, 2015 | 17
13.26%
13.24%
-4.41%
-2.29%
6.35% 7.47% 9.95%
-11.10%
7.33%4.94%
14.08%
13.44%
3.86%
-2.06%
20.93%
15.32%
4.09% 2.12%
3.11% 3.64%
14.02%
16.57%
9.33%
10.56%
6.90%
12.80%
8.77%
6.05% 9.31% 9.16%
-15.00%
-10.00%
-5.00%
0.00%
5.00%
10.00%
15.00%
20.00%
25.00%
2004-05 2005-06 2006-07 2007-08 2008-09 2009-10 2010-11 2011-12 2012-13 2013-14 2014-15
Primary Secondary Tertiary
11.12%
11.06%
10.87%
9.79%
9.07%
8.70%
8.27%
8.46%
7.28%
7.28%
7.12%
31.65%
31.68%
31.20%
30.53%
28.35%
30.94%
31.54%
30.57%
30.19%
29.02%
28.04%
57.23%
57.26%
57.94%
59.68%
62.58%
60.36%
60.19%
60.96%
62.53%
63.70%
64.84%
0% 10% 20% 30% 40% 50% 60% 70% 80% 90% 100%
2004-05
2005-06
2006-07
2007-08
2008-09
2009-10
2010-11
2011-12
2012-13
2013-14
2014-15
Primary Sector Industrial Sector Services Sector
The regional distribution of GSDP (based on 2011 prices) depicts that the capital city Chennai, has the major share of state GSDP at over 18%.
9 The top 6 districts contributing about 51% to Tamil Nadu’s GSDP are Chennai (18.39%), Kancheepuram (9.3%), Thiruvallur (8.00%), Coimbatore (7.10%), Tiruppur (4.37%) and Tiruchirappalli (4.29%) as shown in Figure 5.
9 Of the 32 districts, contribution of 14 districts is below 2%, indicating the concentration of major economic activity in only a few districts of the state
9 Imbalanced growth triggers rural population to migrate to growing urban centers for livelihood opportunities.
Source: Ministry of Statistics and Program Implementation (MOSPI), Govt. of India; YES BANK Analysis
Figure 3: Trends in Contribution of Various Sectors to TN GSDP
Figure 4: Trends in Growth Rates of Various Sectors of TN GSDP
Source: Ministry of Statistics and Program Implementation (MOSPI), Govt. of India; YES BANK Analysis

18 | Tamil Nadu State Report, 2015
18.39%9.30%
8.00%7.10%
4.37%
4.29%
4.29%
3.90%
3.67%
2.87%
2.84%
2.68%
2.28%
2.18%
2.07%
2.02% 1.92%
1.79% 1.64%
1.56%
1.53%
1.45%
1.33%
1.33%
1.19%
1.04%
1.03%
1.01%
0.98%0.96%
0.56%0.43%
0.00% 2.00% 4.00% 6.00% 8.00% 10.00% 12.00% 14.00% 16.00% 18.00% 20.00%
ChennaiKancheepuram
ThiruvallurCoimbatore
TiruppurTiruchirappalli
VelloreSalem
MaduraiThanjavur
ErodeTirunelveli
KanniyakumariCuddaloreNamakkal
ViluppuramTiruvannnamalai
DindigulNagapattinamVirudhunagar
ThoothukudiPudukkottai
ThiruvarurKrishagiri
KarurTheni
NilgrisDharmapuri
RamanathapuramSivaganga
AriyalurPerambalur
Figure 5: District-wise Distribution of GSDP for Tamil Nadu
Source: NSDC Report on Tamil Nadu; Indicus Analytics Market Skyline of India (2011); YES BANK Analysis; the above figures are estimates
1 http://www.fisheries.tn.gov.in/marine-main.html
Fundamental Analysis of GSDP of Tamil Nadu
Primary Sector
9 The main constituents of the primary sector include agriculture, forestry & logging and fishing.
9 Agriculture contributes about 92% of the primary sector. TN is principally dependent on torrential rainfall for irrigation purposes.
9 Tamil Nadu is one of the key fishing coastlines in the Bay of Bengal and contributes about 10-12% of India’s marine fish production1 i.e. about 1-2% of TN’s GSDP.

Tamil Nadu State Report, 2015 | 19
2% 2%
2%
2%
2%
2%
1%
2%
2%
2% 2%
38% 41%
44%
42%
42%
49%
48%
47%
46%
47% 46%
25% 23% 22%
22%
23% 20%
19%
19%
19%
19% 19%
28% 29%
27%
30%
33%
28%
30%
32%
30%
30% 30%
7% 6% 5% 4% 1% 1% 1% 1% 3% 3% 3%
0%
10%
20%
30%
40%
50%
60%
70%
80%
90%
100%
2004-05 2005-06 2006-07 2007-08 2008-09 2009-10 2010-11 2011-12 2012-13 2013-14 2014-15
Mining & Quarrying Manufacturing - Registered Manufacturing - Unregistered Construction Electricity, Gas and Water supply
Source: Ministry of Statistics and Program Implementation (MOSPI), Govt. of India; YES BANK Analysis
Secondary Sector
9 The principal constituents of the secondary (industrial) sector include manufacturing, construction, electricity, gas & water supply and mining & quarrying.
9 Manufacturing constitutes about 60-65% of the Secondary sector. The manufacturing sector in Tamil Nadu consists principally of automotives, engineering products, cement and textiles.
9 Manufacturing GSDP in Tamil Nadu has increased more than twice in the past 10 years from INR 43,433 crore in 2004-05 to INR 94,073 crore in 2014-15, a CAGR of 8.04%.
Figure 6: Trends in Primary Sector output of Tamil Nadu (Units: INR Crore)
Figure 7: Trends in Industrial Sector output of Tamil Nadu
24,3
62
27,5
92
31,2
44
29
,867
29
,18
3
31
,03
6
33
,35
3
36
,672
32
,60
0
34
,98
8
36
,717
11.12% 11.06% 10.87%
9.79%
9.07%
8.70%
8.27%
8.46%
7.28%
7.28%
7.12%
0.00%
2.00%
4.00%
6.00%
8.00%
10.00%
12.00%
-
5,000
10,000
15,000
20,000
25,000
30,000
35,000
40,000
2004-05 2005-06 2006-07 2007-08 2008-09 2009-10 2010-11 2011-12 2012-13 2013-14 2014-15
Primary Sector Growth Rate
Source: Ministry of Statistics and Program Implementation (MOSPI), Planning Commission, Govt. of India; YES BANK Analysis

20 | Tamil Nadu State Report, 2015
Tertiary Sector
9 The principal constituents of the Services Sector include railways, storage, communication, trade, hotels and restaurants, banking & insurance, real estate, ownership & dwellings, business services, public administration and other services.
9 This sector has a strong CAGR of 10.31% from INR 1,25,329 Crore to INR 3,34,200 Crore in the period 2004-05 to 2014-15.
9 Tamil Nadu has 54 Notified SEZs2 in the state. 3rd highest in India. Karnataka (59) & Maharashtra (61).
Fiscal Indicators
Tamil Nadu has been successful in maintaining fiscal dynamics. Since 2005-06 TN has seen revenue surplus meeting the Fiscal Responsibility and Budget Management Act (FRBMA) targets. Tamil Nadu was one of the first states to enact this legislation even before the recommendation of the Finance Commission. Since 2005-06 TN revenue account has shown a surplus except in FY10 and FY11 mainly because of the world wide economic down turn. However, even in these two years the revenue deficit was less than 1% of the state’s GSDP. The table below depicts TN’s state finance from 2004-05 to 2015-16.
Figure 8: Trends in Industrial Sector output of Tamil Nadu
Source: Ministry of Statistics and Program Implementation (MOSPI), Planning Commission, Govt. of India; YES BANK Analysis
1.5%
1.4%
1.2%
1.3%
1.4%
1.4%
1.3%
1.0%
0.9%
0.9%
0.9%
10.8%
10.5%
10.0%
9.8%
9.5%
9.6%
9.3%
9.5%
9.2%
9.1%
8.7%
3.9%
4.1%
4.3%
4.4%
5.3% 6.2%
6.9%
6.8%
6.8%
6.7%
6.5%
29.8%
30.4%
31.4%
30.0%
28.1% 27.5%
27.6%
27.3%
26.5%
26.0%
25.6%
12.7%
13.0%
13.3%
14.3%
14.2% 13.7%
13.9%
14.1%
14.9%
15.4%
15.2%
18.3%
18.5%
18.5%
19.8%
20.3% 20.3%
19.8%
20.7%
22.1%
23.2%
24.8%
7.4%
6.7%
6.5%
6.0%
6.7% 6.3%
6.1%
5.7%
5.1%
4.9%
4.7%
15.6%
15.3%
14.7%
14.4%
14.4%
14.9%
15.1%
14.9%
14.4%
13.8%
13.6%
0% 10% 20% 30% 40% 50% 60% 70% 80% 90% 100%
2004-05
2005-06
2006-07
2007-08
2008-09
2009-10
2010-11
2011-12
2012-13
2013-14
2014-15
Railways Transport by other means
Storage Communication
Trade, Hotels and restaurants Banking & Insurance
Real estate, Ownership of dwellings and Business services Public Administration
Other services
2http://www.sezindia.nic.in/writereaddata/pdf/StatewiseDistribution-SEZ.pdf

Tamil Nadu State Report, 2015 | 21
Source: State Budget Documents of TN and CSO
Table 3: Fiscal Indicators of Tamil Nadu
Fiscal Indicators (Rs crores)
2004-05 2005-06 2006-07 2007-08 2008-09 2009-10 2010-11 2011-12 2012-13 2013-14 2014-15*
2015-16*
Own Tax Revenue
19,357 23,326 27,771 29,619 33,684 36,547 47,782 59,517 71,254 73,718 85,773 96,083
Own Non-Tax Revenue
2,208 2,601 3,423 3,304 5,712 5,027 4,651 5,684 6,554 9,343 8,867 9,071
State’s Own Revenue
21,565 25,927 31,194 32,923 39,396 41,574 52,433 65,201 77,808 83,061 94,640 105,154
Total Central Transfers
6,886 8,033 9,720 14,597 15,646 14,270 17,754 20,001 21,019 24,975 38,548 37,527
Share in Taxes and Duties
4,236 5,013 6,394 8,065 8,511 8,756 10,914 12,715 14,520 15,853 16,824 21,150
Grants 2,650 3,020 3,326 6,532 7,135 5,514 6,840 7,286 6,499 9,122 21,724 16,377
Total Revenue Receipts
28,452 33,960 40,913 47,521 55,042 55,844 70,188 85,202 98,828 108,036 133,188 142,681
Total Revenue Expenditure
29,155 32,009 38,265 42,975 53,590 59,375 72,916 83,838 97,067 109,825 136,725 147,297
Revenue Surplus/Deficit
(703) 1,951 2,648 4,546 1,452 (3,531) (2,728) 1,364 1,761 (1,789) (3,537) (4,616)
Fiscal Surplus/Deficit
(5,570) (2,251) (3,956) (3,686) (8,548) (11,807) (16,647) (17,274) (16,519) (21,643) (27,345) (31,829)
Capital Outlay
4,564 4,055 5,952 7,462 9,104 8,573 12,436 16,336 14,568 17,173 20,341 24,313
Outstanding 49,819 57,457 60,170 64,655 74,858 88,883 114,470 130,630 147,416 166,680 192,573 222,882
Liabilities
GSDP (current prices)
219,003 257,833 310,526 350,819 401,336 479,733 584,896 667,202 744,859 854,238 976,703 NA
Revenue Surplus/ (Deficit) as a % of GSDP
-0.32% 0.76% 0.85% 1.30% 0.36% -0.74% -0.47% 0.20% 0.24% -0.21% -0.36% NA
Fiscal Surplus/ (Deficit) as a % of GSDP
-2.54% -0.87% -1.27% -1.05% -2.13% -2.46% -2.85% -2.59% -2.22% -2.53% -2.80% NA

22 | Tamil Nadu State Report, 2015
Figure 10: Ranking of states in India based on Cumulative FDI inflows from April 2000 to March 2015 (Units: INR Crore)
Source: Department of Industrial Policy and Promotion, Government of India; YES BANK Analysis
Source: YES Bank Analysis
14,627
49,240
53,797
82,121
88,766
249,023
353,022
- 50,000 100,000 150,000 200,000 250,000 300,000 350,000 400,000
West Bengal
Andhra Pradesh
Gujarat
Karnataka
Tamil Nadu
New Delhi
Maharashtra
Figure 9: Revenue and Fiscal Deficit of Tamil Nadu as a Percentage of GSDP
-0.32%
0.76%
0.85%
1.30%
0.36%
-0.74% -0.47%
0.20%
0.24%
-0.21% -0.36%
-2.54%
-0.87% -1.27%
-1.05%
-2.13%
-2.46%
-2.85%
-2.59%
-2.22%
-2.53%
-2.80%-3.50%
-3.00%
-2.50%
-2.00%
-1.50%
-1.00%
-0.50%
0.00%
0.50%
1.00%
1.50%
2.00%
2004-05 2005-06 2006-07 2007-08 2008-09 2009-10 2010-11 2011-12 2012-13 2013-14* 2014-15*
Revenue Surplus/ (Deficit) as a % of GSDP Fiscal Surplus/ (Deficit) as a % of GSDP
Investment Flows
9 The total FDI from April 2000 to March 2015 in Tamil Nadu stands at INR 88,766 Crore in terms of Total Foreign Direct Investments (FDI). Third highest in India, after Maharashtra and New Delhi as shown in Figure 10, making it the most attractive investment destination in the state.

Tamil Nadu State Report, 2015 | 23
Infrastructure & Related Resources in Tamil Nadu
03

24 | Tamil Nadu State Report, 2015
Infrastructure & Related Resources in Tamil Nadu
New Initiatives for Infrastructure Project
With the recent budget announcement and new policy initiatives, it is evident that large scale infrastructure projects are proposed across sectors like highways, ports, airports & power among others. In order to identify the projects that will aid the economic development and make Tamil Nadu the most prosperous and progressive state in the country, the Vision Tamil Nadu 2023 document was launched in two phases – Phase 1 in March 2012 and Phase 2 in February 2014. The document outlined the outcomes that are targeted to be achieved by 2023 and has envisaged an investment of Rs.15,00,000 crore to be made over the next 10 years. The summary of the proposed investment for each sector is outlined below:
In order to develop the infrastructure project in a seamless, efficient and transparent manner, the State Government has constituted the Tamil Nadu Infrastructure Development Board (TNIDB) in 2013 under the Chairmanship of Hon. Chief Minister. This board acts as an institutional framework
Table 4: Proposed Investment for each sector as per Vision 2023
Source: Vision 2023 Phase 2
Energy 389,335
Transport 368,123
Industrial and Commercial infrastructure 171,285
Urban Infrastructure 263,350
Agriculture 121,400
Human development (Health & Education) 59,140
Sub-Total 13,72,633
General and Social infrastructure projects 75,000
Capital improvements to existing projects 52,367
Sub-Total 127,367
Grand Total 15,00,000

Tamil Nadu State Report, 2015 | 25
9 Out of the total 2.38 lakhs road length in Tamil Nadu, the Highway Department maintains 62,017 km. Other district roads form the major share in the classification of the roads (by Highway Dept) contributing 34,160 km (55% of the total road length of Tamil Nadu) for the year 2013-14. Major District Roads, State Highways & National Highway contribute 18%, 19% & 8%respectively.
9 Out of the total length of the National Highway, two lane and the four lane contributes 2637 km (53%) and 2246 km (46%) respectively.
Table 5: Comparison of road length, road density and growth rate of road length of various states in India
State Geographical Area
Road Length CAGR Road Density (Km / 100 sq.km)
2009 2010 2011 2012 2013
Tamil Nadu 1,30,058 188,037 190,055 192,339 230,200 238,004 6.07% 176.99
Andhra Pradesh* 2,75,045 232,280 235,678 238,001 256,448 261,657 3.02% 93.24
Karnataka 1,91,791 274,896 280,147 281,773 303,128 305,448 2.67% 158.05
Gujarat 1,96,024 153,521 155,614 156,188 163,149 165,640 1.92% 83.23
Maharashtra 3,07,713 399,416 406,660 410,521 396,685 589,625 10.23% 128.91
3http://morth.nic.in/showfile.asp?lid=11634http://mospi.nic.in/Mospi_New/upload/infra_stat_2014/Infra_stasti_valum_I_2014_12sep14.pdf
Source: Ministry of Road Transport &Highways (MORTH)*Erstwhile AP
for conceptualization, prioritisation, sanction and speedy implementation of critical infrastructure projects. This applies to the projects which are either implemented by the public procurement or public private partnership (PPP). TNIDB approves such projects projects which exeeds Rs 500 Crore through public procurement and Rs 10 Crore through PPP. This applies to 21 sectors and shall includes agriculture infrastructure, education related infrastructure, fisheries, health infrastructure, inland waterways, ports, power, roads, bridges, tourism and urban infrastructure.
The Government has also notified the Tamil Nadu Infrastructure Development Rules, 2012 Tamil Nadu Infrastructure Development Regulations 2013 and Tamil Nadu Transparency in Tenders (PPP Procurement) Rules, 2012 to facilitate project preparation, structuring, financing and efficient procurement. The Government has established the Tamil Nadu Infrastructure Development Fund (TNIDF) to financially support the design, development, working, administration and management of projects. The Government has also established the Project Preparation Fund (PPF) to conduct studies, hire experts / consultants, prepare feasibility studies, capacity building, undertake research and training, etc.
Roadways
The Total Road Length in Tamil Nadu as of 2013 is 238,004 Km3. CAGR of about 6.07% for the period 2009 to 2013 is the second highest next to Mahararshtra in progressive states in India. TN Road density4 (per 100 Sq Km of area) is 176.99 Kms as of 2013.

26 | Tamil Nadu State Report, 2015
1%
53%
46%
Single Lane Two Lane Four Lane
Figure 11: Classification of Road in Tamil Nadu for the year 2013-145
Figure 12: Break-up of National Highways in Tamil Nadu for the year 2013-14
Source: Policy Note on Highways & Minor Ports, 2014-15, Govt of TN
8%
19%
18%
55%
National Highways
State Highways
Major District Roads
Other District Roads
Source: Ministry of Road Transport and Highways, Govt. of India; YES BANK Analysis
9 The state Govt. has implemented the Comprehensive Road Infrastructure Development Program (CRIDP) based on the Comprehensive Road Improvement Policy 2005-06. The CRIDP covers major road development initiatives. For the year 2012-13 the Govt. of TN has allotted about INR 3,623 Crore for implementation of plan works and INR 1029.6 Crore for non-plan works.
9 State Government plans to enhance 2000 km of roads into six or eight lane expressways corridors between Chennai and major towns. It also plans to modernize State Highways covering 5,000 km of four lane highways and conversion of other State Highways and other Highways of 16,000 km length to two lane roads. The Chennai Peripheral Ring Road is major project envisioned by the Government.
Railways
9 The Southern Railway Network of the Indian Railways is headquartered in Chennai. The Total Rail track Length in Tamil Nadu as of March 2014 is 4848 Km6. The Southern Railway Network is divided into Six Divisions each headquartered at Madurai, Salem, Chennai, Tiruchirappalli, Thiruvanathapuram and Palakkad respectively. There are a total of 730 stations7.
9 The state could also study the feasibility of a dedicated rail freight corridor to boost the Manufacturing, Mining & Construction sectors. The proposed Chennai – Bengaluru industrial
5http://www.investingintamilnadu.com/files/whats_new_docs/Highways_and_Minor_Ports_Policy_Note_2014_15.pdf6http://www.indianrailways.gov.in/railwayboard/uploads/directorate/stat_econ/pdf/YEAR_BOOK_ENG_2011_12/5.pdf7http://www.sr.indianrailways.gov.in/uploads/files/1348131547111-VITAL%20STATISTICS.pdf

Tamil Nadu State Report, 2015 | 27
65.5
68.04
67
59
58.5
58
10.7
11.09
14.95
17.88
27.33
30.25
61.05
61.46
55.7
53.4
51.1 52.54
23.78
25.72
28.1
28.26
28.64
32.41
17.42 17.87
20.09
19.84
20.88
21.59
35.52 31.55
32.94
37.03 39.36 36.56
0
10
20
30
40
50
60
70
80
2009-10 2010-11 2011-12 2012-13 2013-14 2014-15
Vaizag Ennore Chennai Tuticorn Cochin New Mangalore Port Trust
Table 6: Comparative Analysis of Rail Tracks among Southern States as on 2014
Figure 13: Trends in Traffic Handled at Major Ports in South India for the year 2009-10 to 2014-15 (Million Tonnes)
Source: Indian Railways Statistics; YES BANK Analysis
Source: Ministry of Shipping, Govt. of India; YES BANK Analysis
corridor offers a tremendous opportunity for a dedicated freight corridor on the lines of DFC project between Mumbai & New Delhi.
9 Tamil Nadu tops the rail density (km of rail length / 1000 sq.km of area) among all the southern states.
Port
9 Tamil Nadu has 3 major ports namely Chennai, Ennore and Tutricorin, in addition to 24 minor ports of which 7 are government ports and 16 are captive ports8.
9 The present capacity of Chennai port is 86.04 Million Tonnes (MT). Comparatively, New Mangalore Port is 77.77 MT, Cochin is 49.66 MT and Visakhapatnam is 96.76 MT. Chennai is has a capacity utilization of 61.06%.
9 The capacity utilization of Ennore port is highest in 2014-15 among the major ports in South India
8http://www.tnmaritime.com/captive_ports.php
State Area(Sq. Km) Route Km Rail Density (Km/1000sq.km)
Andhra Pradesh 275,045 5,264 19.14
Tamil Nadu 130,058 3,943 30.32
Karnataka 191,791 3,090 16.11
Kerala 38,363 1,050 27.37

28 | Tamil Nadu State Report, 2015
29%
26%
10%
11%
8%
7%
4%
3%
3%
Delhi Mumbai Chennai
Bangalore Kolkata Hyderabad
Ahemdabad Goa Pune
Table 7: Major Port-wise capacity utilization during 2014-15 (million tonnes)
Figure 14: Share of Top 10 Indian Airports by Passenger Traffic in the year 2014-15
Source: Ministry of Shipping, Govt. of India; YES BANK Analysis
Source: Airports Authority of India; YES BANK Analysis
9 The container traffic is projected to grow from 39 million tonnes in 2012 to 188 million tonnes by the year 2023, while the coal traffic is projected to grow from 20 million tonnes in 2012 to 80 million tonnes by the year 2023.
9 The overall traffic growth is projected to grow at the rate of 13% from the present cargo volumes of 100 million tonnes thereby nearly quadrupling by the end of 2023.
Airports
9 Tamil Nadu has a total of seven airports which also includes three international airports at Chennai, Coimbatore and Tiruchirapalli and the other domestic airports include Madurai, Vellore, Salem and Tutcorin.
9 Chennai handles 4th highest traffic in India, in terms of total passenger (both domestic & international) and 3rd highest in total freight traffic (both domestic & international) Figure 14 & 15 shows the share of top 10 Indian airports in the year 2014-15 in terms of total passenger movement and total freight movement respectively9.
Port Capacity Traffic Capacity Utilization (%)
Chennai 86.04 52.54 61.06
Vishakapatanam 96.76 58.00 59.94
Tuticorin 44.55 32.41 72.75
New Mangalore 77.77 36.57 47.02
Ennore 37 30.25 81.76
Cochin 49.66 21.60 43.50
ALL PORTS 871.52 555.5 63.74
9pibmumbai.gov.in/scripts/detail.asp?releaseId=E20131S1

Tamil Nadu State Report, 2015 | 29
Figure 15: Share of Top 10 Indian Airports by freight movement (in tons) in the year 2014-15
Figure 16: Trends in Total Passenger Traffic (million)at Chennai Airport for the year 2011-12 to 2014-15
Figure 17: Trends in Total Freight Movement at Chennai Airport for the year 2008-09 to 2014-15
Source: Airports Authority of India; YES BANK Analysis
Source: Airports Authority of India; YES BANK Analysis
Source: Airports Authority of India; YES BANK Analysis
9 However, in 2013-14, Chennai ranked 3rd among all Indian airports for the total passenger movement.
9 The State Government proposes to improve the airport infrastructure making the proposed total investment of Rs 25,000 Crore. This include development of Greenfield airport at Sriperumbudur, expansion of Madurai and Coimbatore airport, development of airport facilities at Trichy and Thoothukudi and development of aerospace park at Vellore.
30%
30%
13%
12%
6%
4% 3% 0% 1%
Airport
Delhi
Mumbai
Chennai
Bangalore
Kolkata
Hyderabad
Ahemdabad
Goa
8.62 8.31 8.36 9.59
4.31 4.46
4.54 4.71
12.93
12.78
12.90 14.30
0.00
2.00
4.00
6.00
8.00
10.00
12.00
14.00
16.00
2011-12 2012-13 2013-14 2014-15
Traf
fic
in m
illi
on
s
Domestic
International
Total
84.7
78.8
71.7
81.4
272.5
237.1 220.4 222.5
357.2
315.9
292.1 303.9
0.0
50.0
100.0
150.0
200.0
250.0
300.0
350.0
400.0
2011-12 2012-13 2013-14 2014-15
Domestic
International
Total

30 | Tamil Nadu State Report, 2015
Urban Infrastructure
9 Tamil Nadu has about 48.45% of total population living in urbanized areas. The state accounts for 9.6% of India’s urban population.
9 The urban bodies of Tamil Nadu has about 12 city municipal corporations, 124 municipalities and 528 town panchayats.
9 The municipal corporations of Tamil Nadu include the cities such as Chennai, Vellore, Salem, Erode, Tirupur, Coimbatore, Tiruchirappalli, Thanjavur, Madurai, Dindigul, Tirunelveli and Thoothukudi.
9 All 12 Corporations had been shortlisted for the Smart Cities scheme.
9 Twenty-nine cities and towns with a population of over 1 lakh in Tamil Nadu, were likely to be included in the Atal Mission for Rejuvenation and Urban Transformation program10.
9 45 towns have been covered under the Jawaharlal Nehru National Urban Renewal Mission (JNNURM) and it includes the town panchayats that fall within Chennai Metropolitan Development Authority (CMDA) and urban agglomeration area of Madurai and Coimbatore.
9 As of August 2014, a total of 24 out of 65 sanctioned projects under UIG (Urban Infrastructure & Governance) of JNNURM were completed in the state. These projects were related to roads and flyovers, water supply and solid waste management11,12.
9 Similarly, as of March 2014, under the Urban Infrastructure Development Scheme for Small and Medium Towns (UIDSSMT) of JNNURM, 102 projects were completed out of 136 sanctioned projects allocated for 122 towns. These projects were for development of water supply, sewerage, storm drainage systems, solid waste management and road development in the state13.
9 Recently, World Bank has approved a $ 400-million loan for a sustainable urban development project (TNSUDP) to strengthen the financial and administrative capacity of urban local bodies (ULBs), benefitting over 20 lakh residents14.
9 Tamil Nadu Vision 2023 envisages an investment of Rs 2.63 lakhs Crore for urban infrastructure development. As per the vision document, it aims to provide 135 LPCD piped water supply across in all parts of Chennai Corporation and urban areas of the rest of the state.
Power 9 The total installed power capacity in Tamil Nadu is 22884 MW15,16 as of June 2015.
9 Coal and renewable energy form the bulk of the installed capacity with share of around 43% and 37% respectively
9 Private sector owns the bulk of the generation assets at 45% of the total installed capacity.
10http://www.thehindu.com/news/national/tamil-nadu/12-tamil-nadu-corporations-on-smart-city-list/article7353973.ece11http://jnnurm.nic.in/wp-content/uploads/2014/08/State-wise-details.pdf12http://jnnurm.nic.in/wp-content/uploads/2014/08/TN1.pdf13http://jnnurm.nic.in/wp-content/uploads/2014/05/APPROVED-PROJECTS-STATEWISE.pdf14http://www.thehindu.com/news/national/tamil-nadu/boost-to-urban-infrastructure-in-tamil-nadu-via-world-bank/article7064434.ece15http://www.cea.nic.in/reports/monthly/executive_rep/jun15.pdf 16http://www.cea.nic.in/new_website/reports/monthly/executivesummary/2015/exe_summary-05.pdf

Tamil Nadu State Report, 2015 | 31
Figure 18: Break – up of installed power capacity in Tamil Nadu based on source of generation and the ownership
Figure 19: Category wise consumers of power as on March 2014 (in Lakh)
Figure 20: Trends in Demand-Supply of Peak (MW) in Tamil Nadu for the year 2007-08 to 2014-15
Source: Central Electricity Authority; YES BANK Analysis
Source: Policy Note, 2014-15, Energy Department, Government of Tamil Nadu
Source: Central Electricity Authority; YES BANK Analysis
43%
4%
2%
4%
10%
37%
Power Coal Gas Diesel Nuclear Hydro MNRE
33%
45%
22%
State Private Central
68%
13%
2% 8%
5%
4%
Domestic
Commercial
Industries
Agriculture
Huts
Others
9 Power deficit has been a major issue historically for Tamil Nadu, however the state has witnessed significant improvement in the current year by drastic reduction in power deficit from 1,030 MW in 2013-14 to 209 MW in 2014-15.
2007-08 2008-09 2009-10 2010-11 2011-12 2012-13 2013-14 2014-15
Demand 10,334 9,799 11,125 11,728 12,813 12,736 13,522 13,707
Supply 8,690 9,211 9,813 10,436 10,566 11,053 12,492 13,498
Deficit -1,644 -588 -1,312 -1,292 -2,247 -1,683 -1,030 -209
-4,000-2,000
02,0004,0006,0008,000
10,00012,00014,00016,000
Pow
er i
n M
W
32 | Tamil Nadu State Report, 2015
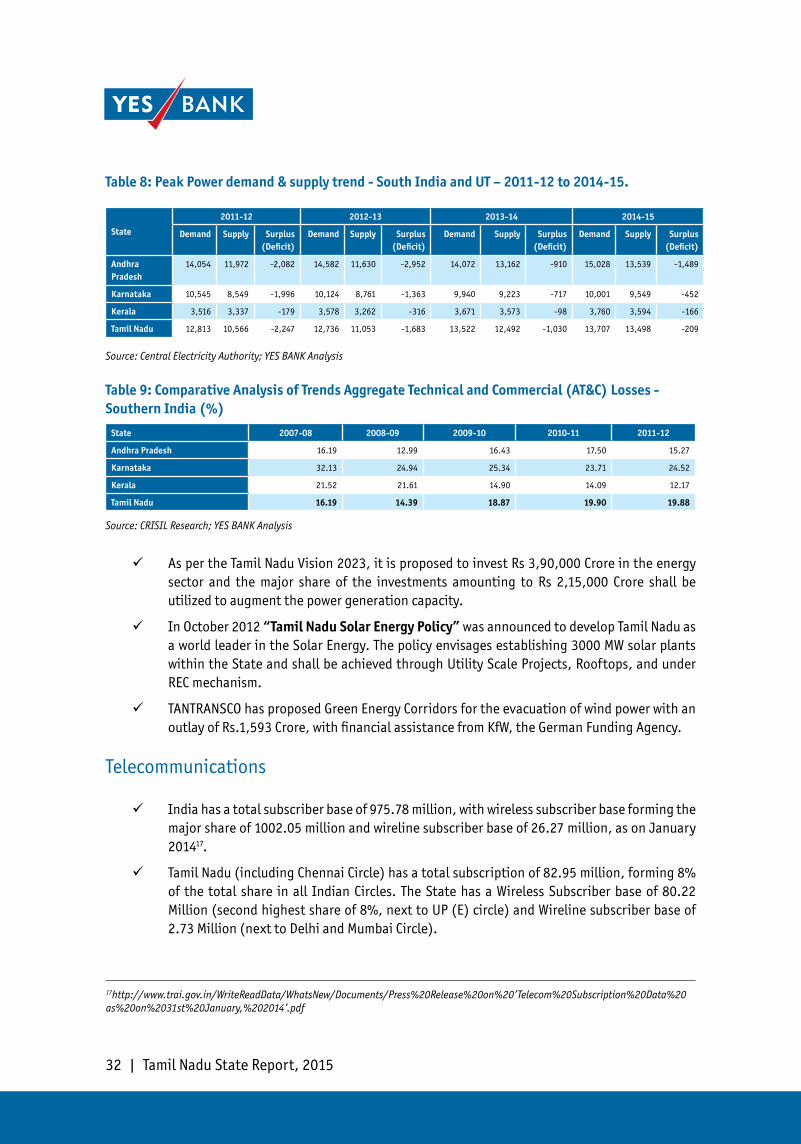
Table 8: Peak Power demand & supply trend - South India and UT – 2011-12 to 2014-15.
Table 9: Comparative Analysis of Trends Aggregate Technical and Commercial (AT&C) Losses - Southern India (%)
Source: Central Electricity Authority; YES BANK Analysis
Source: CRISIL Research; YES BANK Analysis
State
2011-12 2012-13 2013-14 2014-15
Demand Supply Surplus (Deficit)
Demand Supply Surplus (Deficit)
Demand Supply Surplus (Deficit)
Demand Supply Surplus (Deficit)
Andhra Pradesh
14,054 11,972 -2,082 14,582 11,630 -2,952 14,072 13,162 -910 15,028 13,539 -1,489
Karnataka 10,545 8,549 -1,996 10,124 8,761 -1,363 9,940 9,223 -717 10,001 9,549 -452
Kerala 3,516 3,337 -179 3,578 3,262 -316 3,671 3,573 -98 3,760 3,594 -166
Tamil Nadu 12,813 10,566 -2,247 12,736 11,053 -1,683 13,522 12,492 -1,030 13,707 13,498 -209
State 2007-08 2008-09 2009-10 2010-11 2011-12
Andhra Pradesh 16.19 12.99 16.43 17.50 15.27
Karnataka 32.13 24.94 25.34 23.71 24.52
Kerala 21.52 21.61 14.90 14.09 12.17
Tamil Nadu 16.19 14.39 18.87 19.90 19.88
9 As per the Tamil Nadu Vision 2023, it is proposed to invest Rs 3,90,000 Crore in the energy sector and the major share of the investments amounting to Rs 2,15,000 Crore shall be utilized to augment the power generation capacity.
9 In October 2012 “Tamil Nadu Solar Energy Policy” was announced to develop Tamil Nadu as a world leader in the Solar Energy. The policy envisages establishing 3000 MW solar plants within the State and shall be achieved through Utility Scale Projects, Rooftops, and under REC mechanism.
9 TANTRANSCO has proposed Green Energy Corridors for the evacuation of wind power with an outlay of Rs.1,593 Crore, with financial assistance from KfW, the German Funding Agency.
Telecommunications
9 India has a total subscriber base of 975.78 million, with wireless subscriber base forming the major share of 1002.05 million and wireline subscriber base of 26.27 million, as on January 201417.
9 Tamil Nadu (including Chennai Circle) has a total subscription of 82.95 million, forming 8% of the total share in all Indian Circles. The State has a Wireless Subscriber base of 80.22 Million (second highest share of 8%, next to UP (E) circle) and Wireline subscriber base of 2.73 Million (next to Delhi and Mumbai Circle).
17http://www.trai.gov.in/WriteReadData/WhatsNew/Documents/Press%20Release%20on%20’Telecom%20Subscription%20Data%20as%20on%2031st%20January,%202014’.pdf

Tamil Nadu State Report, 2015 | 33
Figure 21: Comparative Analysis of Tele-density in South India
Figure 22: Comparative Analysis of Literacy rate in Tamil Nadu
Source: TRAI Press Release No. 28/2015, dated 10th July 2015
9 Tele-Density (no of connections per 100 people) in Tamil Nadu is 116.95 – second highest in India, next to New Delhi and highest among Southern states, while the overall tele-density in India is 76.67.
Human Resources
9 As per 2011 census, Tamil Nadu ranks 14th with the overall literacy rate of 80.33%% having improved from 73.45% in 2001. The male & female literacy rates were 86.81% and 73.86% respectively
9 According to the National Skill Development Corporation the incremental Human Resource requirement for the period 2012-17 for Tamil Nadu was about 5.1 Million vis-à-vis availability of about 3.5 Million, indicating a skill gap of around 1.6 Million. Further a steep skill gap exists in the semi skilled and skilled category.
116.95
90.20
96.64
83.59
- 20.00 40.00 60.00 80.00 100.00 120.00 140.00
Tamil Nadu
Kerala
Karnataka
Andhra Pradesh
Tele-density (no. of connections per 100 people)
Teledensity
73.45%
82.42%
64.43%
80.33%
86.81%
73.86%
0.00% 10.00% 20.00% 30.00% 40.00% 50.00% 60.00% 70.00% 80.00% 90.00% 100.00%
Persons
Males
Females
Literacy Rate
2011 2001Source: Census.gov.in; YES BANK Analysis

34 | Tamil Nadu State Report, 2015
Figure 23: Incremental HR Availability for the period 2012-17 for Tamil Nadu (Units: Million Persons)
Source: National Skills Development Corporation; YES BANK Analysis
2179
258
1065
0 500 1000 1500 2000 2500
Unskilled
Semi-skilled
Skilled
Incremental Human Resource Availability

Tamil Nadu State Report, 2015 | 35
Sector Snapshot in Tamil Nadu 04

36 | Tamil Nadu State Report, 2015
Sector Snapshot in Tamil Nadu
Agriculture
9 Tamil Nadu contributes about 7% of the total sugar production in the country.
9 Agricultural production in 2012-1318 (FE) was impacted due to lower monsoons & Cyclone.
9 During 2014-2015, an amount of Rs.100 Crore will be set apart for further promoting farm mechanization.
9 Tamil Nadu Cotton Cultivation Mission will be launched in the State with an initial outlay of Rs. 50 Crore, to focus on higher productivity and production.
Table 10: Data on Cultivation Area And Production in Tamil Nadu
CropCultivation Area(L.ha) Production(L.MT)
2011-12 2012-13 2013-14 2014-15* 2011-12 2012-13 2013-14 2014-15*
Rice 19.04 14.93 17.26 18.30 74.59 40.50 71.15 79.14
Millets 6.38 6.42 9.33 9.71 23.24 13.42 32.73 41.58
Pulses 6.69 5.11 8.16 9.40 3.69 2.13 6.14 7.24
Total Food Grains
32.11 26.46 34.75 37.41 101.52 56.05 110.02 127.96
Oilseeds 4.49 3.90 4.08 4.19 11.14 8.16 9.61 9.73
Cottons (L.Bales)
1.35 1.33 1.51 1.87 3.82 2.55 4.17 6.28
Sugarcane (Cane)
3.46 3.48 3.13 2.63 385.76 340.14 324.54 244.63
Total 41.41 35.17 43.47 46.10 502.24 406.90 448.34 388.60
Source: Agriculture Policy Note & Performance Budget for 2015-16, 2014-15 & 2013-14* Fourth Advance Estimate
18http://cms.tn.gov.in/sites/default/files/documents/Agriculture.pdfhttp://www.tn.gov.in/documents/dept/2

Tamil Nadu State Report, 2015 | 37
Industrialization in Tamil Nadu
9 Tamil Nadu has created a forte in the field of fields of engineering, automobiles, textiles, leather, information technology, electronic hardware and hi-technology industries.
9 Tamil Nadu has always been a preferred destination for the investors due to a favorable business climate, excellent infrastructure for trade and investment, better law and order maintenance, industrial relations and healthy socio-economic reforms.
9 The State is now ranked first in the number of factories and in the number of workers employed in the factories sector. It is third in gross industrial output.
9 The industrial GSDP of Tamil Nadu grew at a CAGR of 7.63% from the year 2004-05 to 2014-15 (2004-05 constant prices).
9 In the period 2008-09 to 2012-13, the number of factories has increased by 49%, while the capital infusion has grown at the compounded annual growth rate (CAGR) of 17.63% and the value of output has grown at CAGR of 19.80%.
9 Coimbatore has the maximum number of industries registering about 4500 industries followed by Thiruvallur, while Kanchipuram tops the chart in terms of capital infusion investing about Rs 10,000 Crore
Automobile & Auto Components Industry
9 Tamil Nadu has more than 100 companies in the automotive and auto ancillary industry located within the state.
9 Chennai is one of the major auto hubs in India for production of LCVs and HCVs while Coimbatore and Erode is known for automotive body and frame building.
9 The State can boast of attracting seven automobile giants including Ford, Hyundai, Mitsubishi, Daimler, Renault and BMW. It has installed capacity to produce 13.80 Lakh cars and 3.50 Lakh commercial vehicles per year19.
19Tamil Nadu Automobile and Auto Components Policy 2014
Figure 24: Trends of Industrialization in Tamil Nadu 2008-09 to 2012-13
26,122
26,790
36,848
36,996
38,869
1,774,019
1,890,149
1,943,319
1,940,819
1,965,020
9,778,762 13,289,599 14,796,543 16,145,171
18,724,233
30,080,195
37,578,406
47,231,872
60,693,540
61,952,533
-
10,000,000
20,000,000
30,000,000
40,000,000
50,000,000
60,000,000
70,000,000
2008-09 2009-10 2010-11 2011-12 2012-13
No. of factories (nos) No.of employees (nos) Fixed Capital (Rs lakhs) Value of output (Rs lakhs)
Source: Results of Annual Survey of Industries, Central Statistical Organization; YES BANK Analysis

38 | Tamil Nadu State Report, 2015
9 Tamil Nadu has the largest auto components industry base and accounts for majority share contributing 35% of India’s auto components production.
9 The commissioning of three new large tyre manufacturing projects in addition to the existing tyre manufacturing facility has made the State particularly Chennai one of the largest hubs in the world for tyre manufacturing.
9 The auto industry is encouraged by excellent port logistics, abundant availability of skilled manpower, reliable auto infrastructure, excellent government base and cost effective manufacturing base.
9 The “Ultra Mega Auto Policy”, launched in 2007 encouraged ultra mega auto projects.
9 To further strengthen its position in the Auto & Auto Components industry, on 21st Feb 2014, the TN Government unveiled, “Tamil Nadu Automobile and Auto Components Policy, 2014”. It aims to generate 5 Lakh jobs and make Chennai one of the World’s top 5 auto clusters.
9 The Chennai Peripheral Road connect Mamallapuram with Ennore Port neighbouring Tiruvallur via Singaperumalkoil, Sriperumbudur, Tiruvallur, Thamaraipakkam, Periyapalayam and Puduvayal till Kattupalli is expected to further encourage the growth of this industry in the state.
9 Chennai Port is also proposing to develop Ro-Ro cum Multipurpose Berth and Multi-Level Car Parking at the port which is expected to boost and improve the car exports Automobile manufacturers such as Hyundai, Ashok Leyland, Nissan, and Ford are also likely to be benefitted with this augmented port infrastructure.
9 The State is also proposing the industrial corridor projects which shall be implemented by State Industries Promotion Corporation of Tamil Nadu (SIPCOT) thereby further benefitting the automobile and ancillary units. The key industrial corridor projects are Madurai-Thoothukudi Industrial Corridor and Chennai-Ranipet Industrial Corridor.
Biotechnology Industry
9 India is among the top 12 biotechnology destinations in the world and the Indian biotechnology sector is the second largest in Asia (after China).
9 Tamil Nadu is one of the first states to have launched a bio-technology policy to boost growth in this sector.
9 Tamil Nadu has established its first biotechnology (BT) incubation park, the TIDCO Centre for Life Sciences (TICEL) Biotechnology Park I in Chennai with technical collaboration from Cornell University, USA which became operational in November, 2004 and TICEL II is set for completion soon.
9 To reinforce its position in the BT sector & encourage new investments, the state has launched “Tamil Nadu Biotechnology Policy 2014” in Feb 2014. The broad objectives of the new Biotech Policy are:
o To take up the detailed inventory of the bio-resources in the State
Tamil Nadu State Report, 2015 | 39
o To attract R&D institutions and manufacturing firms to Tamil Nadu by developing high quality infrastructure with the required support services, providing special incentives to the biotech industry.
9 The Vision 2023 document has planned the development of eleven important and special signature projects for the development of world class institutions of research and knowledge in the Biotechnology sector.
Electronics & IT Industry
9 The Government of Tamil Nadu through Tamil Nadu Industrial Development Corporation (TIDCO) and State Industries Promotion Corporation (SIPCOT) has promoted numerous SEZs and Information Technology Parks in Tamil Nadu.
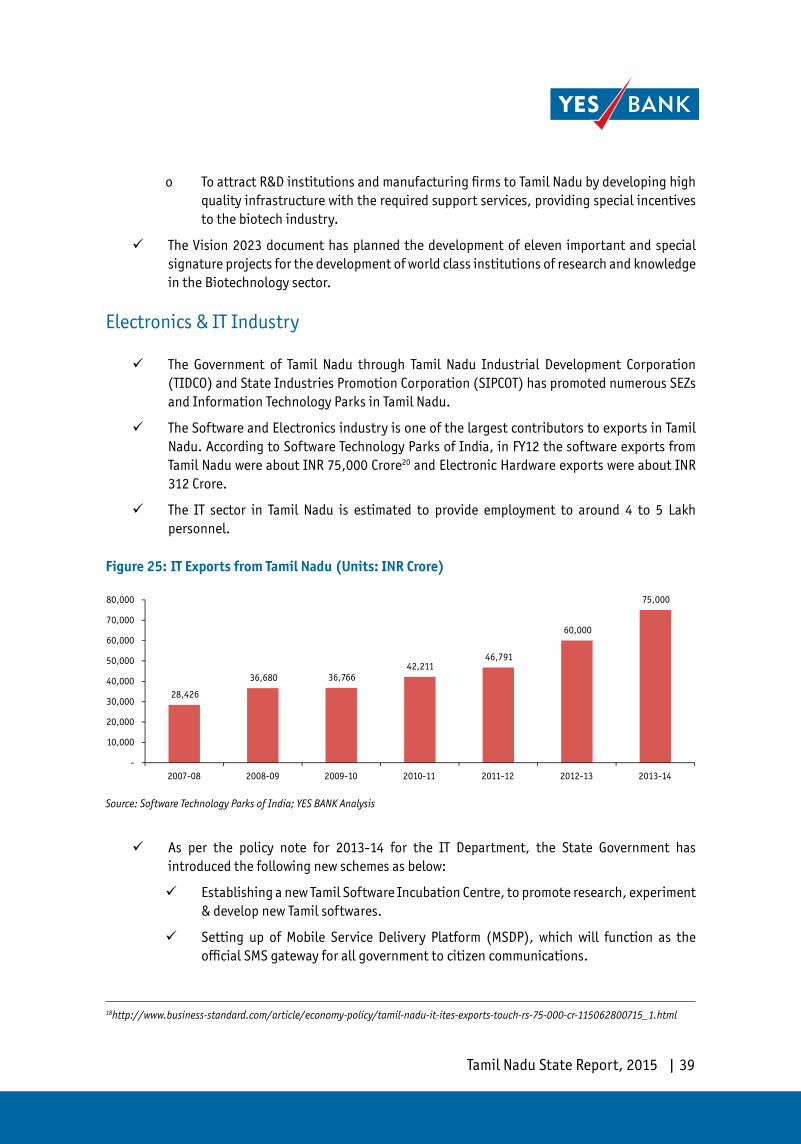
9 The Software and Electronics industry is one of the largest contributors to exports in Tamil Nadu. According to Software Technology Parks of India, in FY12 the software exports from Tamil Nadu were about INR 75,000 Crore20 and Electronic Hardware exports were about INR 312 Crore.
9 The IT sector in Tamil Nadu is estimated to provide employment to around 4 to 5 Lakh personnel.
9 As per the policy note for 2013-14 for the IT Department, the State Government has introduced the following new schemes as below:
9 Establishing a new Tamil Software Incubation Centre, to promote research, experiment & develop new Tamil softwares.
9 Setting up of Mobile Service Delivery Platform (MSDP), which will function as the official SMS gateway for all government to citizen communications.
Figure 25: IT Exports from Tamil Nadu (Units: INR Crore)
Source: Software Technology Parks of India; YES BANK Analysis
18http://www.business-standard.com/article/economy-policy/tamil-nadu-it-ites-exports-touch-rs-75-000-cr-115062800715_1.html
28,426
36,680 36,766 42,211
46,791
60,000
75,000
-
10,000
20,000
30,000
40,000
50,000
60,000
70,000
80,000
2007-08 2008-09 2009-10 2010-11 2011-12 2012-13 2013-14
40 | Tamil Nadu State Report, 2015
9 Setting up of Project Information Management System (PMIS), which will facilitate State level planning and reporting to the State and Centre.
9 The TN Vision 2023 (phase 2) proposes to develop Information Technology Investment Region (ITIR) in Chengalpattu, Thirukkalukundram, Kanchipuram and Sriperumbudur Talukas of Kanchipuram District. This project is proposed to be implemented by TIDCO and shall focus on investments in IT/ITES and electronics hardware manufacturing (EHM), which is expected to generate 10 Lakh employment in two phases.
Textile Industry
9 Coimbatore and Tirupur are the major textile centres in Tamil Nadu. Tirupur is known as ‘knitting city’.
9 Tamil Nadu is one of the top producers of Spun Yarn in the country accounting for about 35-40% of the overall production21 in India.
9 Of the total 2049 large and medium textile mills22 in India, 893 mills are in Tamil Nadu - 18 Cooperative Spinning Mills, 17 National Textile Corporation Mills and 23 Composite Mills.
9 The spinning capacity in Tamil Nadu is around 14.75 million spindles with a labor force of about 2.17 Lakh.
Cement Industry
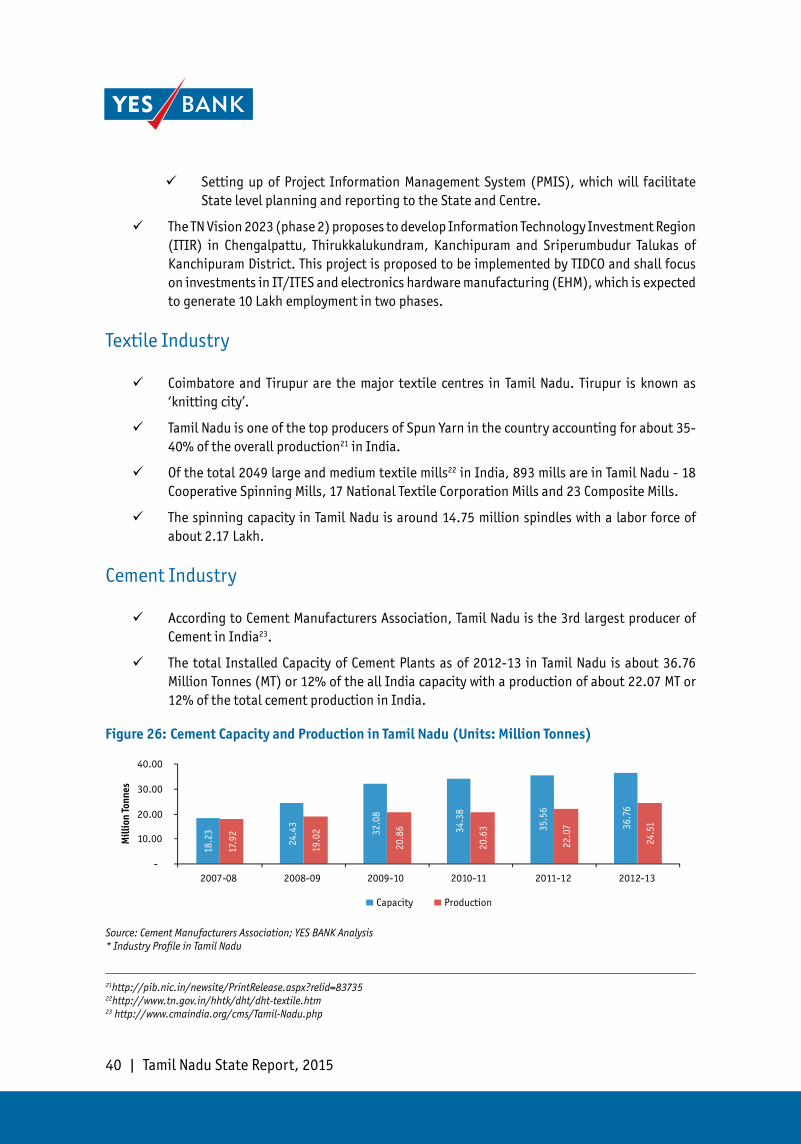
9 According to Cement Manufacturers Association, Tamil Nadu is the 3rd largest producer of Cement in India23.
9 The total Installed Capacity of Cement Plants as of 2012-13 in Tamil Nadu is about 36.76 Million Tonnes (MT) or 12% of the all India capacity with a production of about 22.07 MT or 12% of the total cement production in India.
21http://pib.nic.in/newsite/PrintRelease.aspx?relid=83735 22http://www.tn.gov.in/hhtk/dht/dht-textile.htm 23 http://www.cmaindia.org/cms/Tamil-Nadu.php
Figure 26: Cement Capacity and Production in Tamil Nadu (Units: Million Tonnes)
Source: Cement Manufacturers Association; YES BANK Analysis* Industry Profile in Tamil Nadu
18.2
3
24.4
3
32.
08
34.3
8
35.5
6
36.7
6
17.9
2
19.0
2
20.
86
20.6
3
22.0
7
24.5
1
-
10.00
20.00
30.00
40.00
2007-08 2008-09 2009-10 2010-11 2011-12 2012-13
Mil
lion
Ton
nes
Capacity Production

Tamil Nadu State Report, 2015 | 41
Annexure 05

42 | Tamil Nadu State Report, 2015
Annexure 1: District Map of Tamil Nadu
Source: MapsofIndia.com

Tamil Nadu State Report, 2015 | 43
Annexure 2: Road Network Map of Tamil Nadu
Source: MapsofIndia.com

44 | Tamil Nadu State Report, 2015
Annexure 3: Rail Network Map of Tamil Nadu
Source: MapsofIndia.com

Tamil Nadu State Report, 2015 | 45
Annexure 4: Industrial Map of Tamil Nadu
Source: MapsofIndia.com

NOTES