TAM S.A. - lan.com · TAM S.A. Condensed consolidated balance sheet (In thousands of Dollar) The...
76
TAM S.A. Condensed Consolidated Interim Financial Information at September 30, 2011 and report of independent accountants
Transcript of TAM S.A. - lan.com · TAM S.A. Condensed consolidated balance sheet (In thousands of Dollar) The...

TAM S.A. Condensed Consolidated Interim Financial Information at September 30, 2011 and report of independent accountants

Independent Auditor’s Report To the Board of Directors and Shareholders TAM S.A. We have audited the accompanying condensed consolidated interim financial information of TAM S.A. and its subsidiaries (the “Company”), which comprise the condensed consolidated interim balance sheet as at September 30, 2011 and the condensed consolidated interim statements of income, comprehensive income, changes in equity and cash flows for the quarter and nine- month period then ended.
Management’s responsibility for the consolidated financial statements
Management is responsible for the preparation and fair presentation of this condensed consolidates interim financial information in accordance with International Accounting Standard (IAS) 34 – “Interim Financial Reporting”, and for such internal control as management determines is necessary to enable the preparation of consolidated financial statements that are free from material misstatement, whether due to fraud or error.
Auditor’s responsibility
Our responsibility is to express an opinion on this condensed consolidated interim financial information based on our audit. We conducted our audit in accordance with International Standards on Auditing. Those standards require that we comply with ethical requirements and plan and perform the audit to obtain reasonable assurance about whether the financial information is free from material misstatement.
An audit involves performing procedures to obtain audit evidence about the amounts and disclosures in the financial statements. The procedures selected depend on the auditor’s judgment, including the assessment of the risks of material misstatement of the consolidated financial information, whether due to fraud or error. In making those risk assessments, the auditor considers internal control relevant to the entity’s preparation and fair presentation of the financial information in order to design audit procedures that are appropriate in the circumstances, but not for the purpose of expressing an opinion on the effectiveness of the entity’s internal control. An audit also includes evaluating the appropriateness of accounting policies used and the reasonableness of accounting estimates made by management, as well as evaluating the overall presentation of the financial statements.
We believe that the audit evidence we have obtained is sufficient and appropriate to provide a basis for our audit opinion.

Opinion
In our opinion, the referred condensed consolidated interim financial information is prepared in all material respects, in accordance with IAS 34 – “Interim Financial Reporting”. Other matters Condensed consolidated interim financial information for the quarter and nine-month period ended as at September 30, 2011 The condensed consolidated interim financial information for the quarter and nine-month period ended as at September 30, 2010, presented for comparative purposes was not audited. São Paulo, November 10, 2011 PricewaterhouseCoopers Carlos Alberto de Sousa
Auditores Independentes Contador CRC 1RJ056561/O-0 “S” SP CRC 2SP000160/O-5

TAM S.A. Condensed consolidated balance sheet (In thousands of Dollar)
The accompanying notes are an integral part of this condensed consolidated interim financial information.
F-4
Note September 30,
2011 December 31,
2010
Note September 30,
2011 December 31,
2010 Assets Liabilities Current Current
Cash and cash equivalents 7 277,741 607,502 Accounts payable 262,496 313,506 Financial assets at fair value through profit
and loss
749,024 844,855
Financial liabilities
14
1,005,977 943,520 Trade accounts receivable 8 1,060,932 934,330 Salaries and social charges 277,710 280,177 Inventories 118,516 119,289 Deferred income 15 890,108 1,081,011 Taxes recoverable 9 326,452 34,544 Taxes, charges and contributions 228,766 184,965 Income tax and social contribution
recoverable
11,057 Income tax and social contribution
payable
2,540 8,606 Prepaid expenses 67,141 97,700 Interest on own capital and dividends 466 91,401 Derivative financial instruments 10 14,796 5,939 Derivative financial instruments 10 46,672 12,348 Other receivables 46,311 48,754 Other current liabilities 17 87,760 81,419
2,660,913 2,703,970 2,802,495 2,996,953 Non-current Non-current
Restricted cash 32,927 59,000 Financial liabilities 14 3,839,234 3,473,081 Financial assets – Bank deposits 11 86,590 30,176 Derivative financial instruments 10 42,863 9,174 Deposits in guarantee 29,731 31,076 Deferred income 15 23,993 39,863 Deferred income tax and social
contribution
19
18,482
Provisions
18
132,944 122,597
Prepaid aircraft maintenance
293,075 246,253 Refinanced taxes payable under Fiscal
Recovery Program
16
229,508 250,075
Other non-current assets
14,083 12,360 Deferred income tax and social
contribution
19
89,689 Derivative financial instruments 10 3,612 3,942 Other non-current liabilities 17 219,671 142,523 Property, plant and equipment 12 4,919,659 5,228,574
Intangible assets 13 326,616 385,480 4,488,213 4,127,002 5,724,775 5,996,861 Total liabilities 7,290,708 7,123,955 Equity Share capital 20 442,133 492,073 Other reserves 21 846,008 961,482 Accumulated losses (231,589) 1,056,552 1,453,555 Non-controlling interest 38,428 123,321 Total equity 1,094,980 1,576,876 Total assets 8,385,688 8,700,831 Total liabilities and equity 8,385,688 8,700,831

TAM S.A. Condensed consolidated Statement of operations Three and nine months periods ended September 30, 2011 and 2010 (In thousand of Dollar)
The accompanying notes are an integral part of this condensed consolidated interim financial information. (*) See Note 3.
F-5
Quarter ended Nine months ended
Note September 30,
2011 September 30,
2010 September
30,2011 September 30,
2010
(Adjusted(*)) (Unaudited)
(Adjusted(*)) (Unaudited)
Revenue 22 2,029,401 1,679,535 5,766,943 4,582,587 Operating expenses 23 (1,691,111) (1,290,575) (5,352,789) (4,150,180)
Operating profit before movements in fair value of fuel derivatives 338,290 388,960 414,154 432,407
Movements in fair value of fuel derivatives (57,071) 7,278 (31,675) (18,734)
Operating profit 281,219 396,238 382,479 413,673 Finance income 25 339,097 372,726 992,144 856,467 Finance costs 25 (1,114,982) (118,522) (1,609,195) (790,389) Derivatives designated as cash flow hedge 25 (11,828) (11,828)
Profit / (loss) before income tax and social contribution (506,494) 650,442 (246,400) 479,751
Income tax and social contribution 19 (a) 135,910 (224,409) 15,857 (186,446)
Profit / (loss) for the period (370,584) 426,033 (230,543) 293,305 Attributable to
Equity shareholders of TAM S.A. (378,888) 419,192 (263,822) 282,055 Non-controlling interest 8,304 6,841 33,279 11,250
Earnings per share (common and preferred) – in US$ Basic 26 (2.43) 2.79 (1.69) 1.88 Diluted 26 (2.43) 2.78 (1.69) 1.87
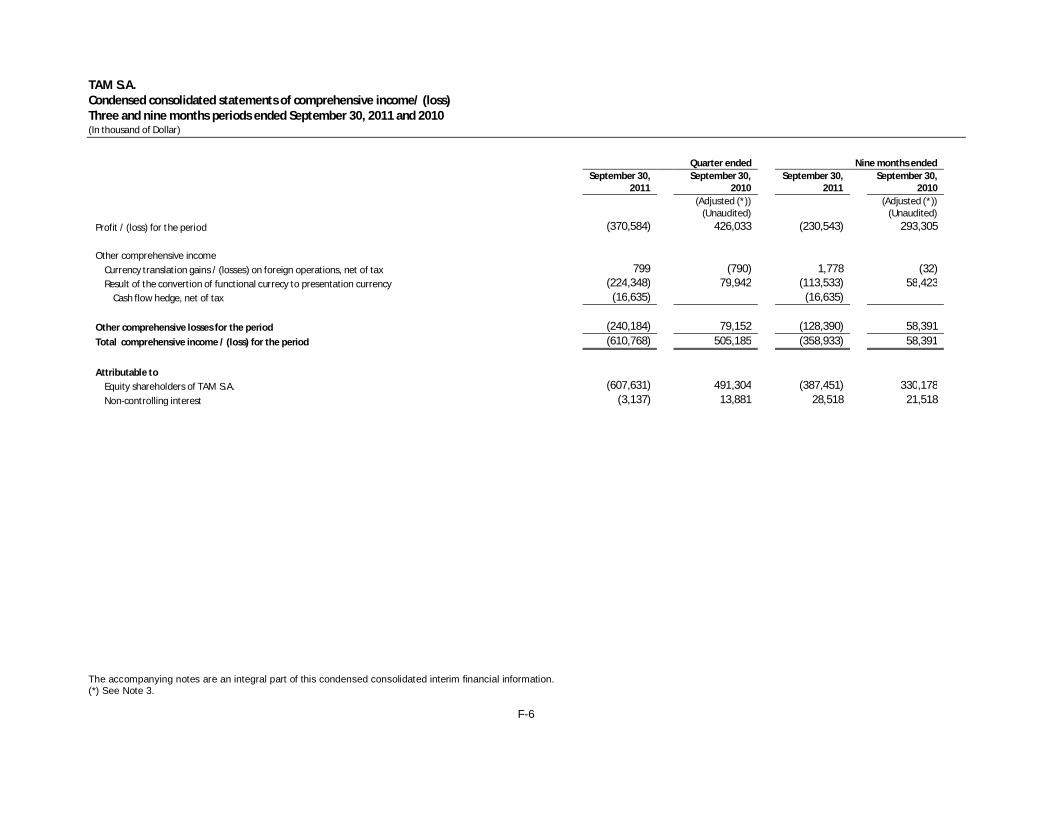
TAM S.A. Condensed consolidated statements of comprehensive income/ (loss) Three and nine months periods ended September 30, 2011 and 2010 (In thousand of Dollar)
The accompanying notes are an integral part of this condensed consolidated interim financial information. (*) See Note 3.
F-6
Quarter ended Nine months ended
September 30,
2011 September 30,
2010 September 30,
2011 September 30,
2010
(Adjusted (*))
(Unaudited) (Adjusted (*))
(Unaudited) Profit / (loss) for the period (370,584) 426,033 (230,543) 293,305 Other comprehensive income
Currency translation gains / (losses) on foreign operations, net of tax 799 (790) 1,778 (32) Result of the convertion of functional currecy to presentation currency (224,348) 79,942 (113,533) 58,423
Cash flow hedge, net of tax (16,635) (16,635) Other comprehensive losses for the period (240,184) 79,152 (128,390) 58,391 Total comprehensive income / (loss) for the period (610,768) 505,185 (358,933) 58,391 Attributable to
Equity shareholders of TAM S.A. (607,631) 491,304 (387,451) 330,178 Non-controlling interest (3,137) 13,881 28,518 21,518

TAM S.A. Condensed consolidated statement of changes in equity (unaudited) Nine month periods ended September 30 (In thousand of Dollar)
The accompanying notes are an integral part of this condensed consolidated interim financial information. F-7
Attributable to equity shareholders of TAM
Share capital Revaluation
reserve
Other reserves
(Note 20)
Retained earnings/
(Accumulated deficit) Total
Non-controlling interest Total
At January 1, 2010 - As originally presented 391,820 67,578 76,324 (248,595) 287,127 1,977 289,104 Changes of accounting practices – Note 3 (67,578) 280,481 248,595 461,498 461,498 At January 1, 2010 – Adjusted 391,820 356,805 748,625 1,977 750,602 Profit for the period 282,055 282,055 11,250 293,305 Other comprehensive income
Foreign exchange gain on foreign operations, net of tax
(32) (32) (32)
Result of conversion of functional currency to presentation currency
6,892 35,561 5,702 48,155 10,268 58,423 Total comprehensive income 6,892 35,529 287,757 330,178 21,518 351,696 Transactions with owners
Advance for future capital increase 82,551 82,551 82,551 Realization of deemed cost (5,119) 5,119
Dividends and interest on own capital to non-controlling interest of Multiplus S.A. and
Mercosur
(5,158) (5,158) Stock option plan 6,446 6,446 6,446 Treasury shares 2,818 (1,062) 1,756 1,756 Transfer to non-controlling shareholders: Effect on equity of the issuance and sale
of new shares of Multiplus S.A.
262,528 262,528 96,264 358,792 Total transactions with owners 349,224 4,057 353,281 91,106 444,387 At September 30, 2010 398,712 741,558 291,814 1,432,084 114,601 1,546,685

TAM S.A. Condensed consolidated statement of changes in equity (unaudited) Nine month periods ended September 30 (In thousand of Dollar)
The accompanying notes are an integral part of this condensed consolidated interim financial information. F-8
Attributable to equity shareholders of TAM
Share
capital Other
reserves (Note 21) Retained earnings /
(Accumulated deficit) Total Non-controlling
interest Total At January 1, 2011 492,073 961,482 1,453,555 123,321 1,576,876 Loss for the period (263,822) (263,822) 33,279 (230,543) Other comprehensive income / (loss)
Foreign exchange loss on foreign operations , net of tax
1,689 1,689 89 1,778
Result of conversion of functional currency to presentation currency
(49,940) (94,761) 31,555 (113,146) (387) (113,533)
Cash flow hedge, net of tax (12,172) (12,172) (4,463) (16,635) Total comprehensive income / (loss) (49,940) (105,244) (232,267) (387,451) 28,518 (358,933) Transactions with owners
Capital reduction of Multiplus - Cash paid to non-controlling interests
(101,394) (101,394)
Realization of deemed cost (678) 678 Dividends by TAM (18,972) (18,972) (18,972) Dividends of Multiplus paid to non-
controlling interests
(13,062) (13,062) Dividends of Mercosur paid to non-
controlling interests
(197) (197) Stock option plan 7,484 7,484 1,241 8,725 Sale of treasury shares 1,937 1,937 1,937
Total transactions with owners (10,229) 678 (9,551) (113,412) (122,963) At September 30, 2011 442,133 846,008 (231,589) 1,056,553 38,427 1,094,980

TAM S.A. Condensed consolidated statement of cash flows Nine months periods ended September 30 (In thousand of Dollar, unless otherwise indicated)
The accompanying notes are an integral part of this condensed consolidated interim financial information.
F-9
Nine months ended
Note September 30,
2011 September 30,
2010 (Unaudited) Cash flows generated from operating activities 27 274,935 381,072
Taxes paid (53,161) (15,248) Interest paid (164,518) (130,642)
Net cash generated by operating activities 57,256 235,182 Cash flows from investing activities
Capital reduction of Multiplus – Cash paid to non-controlling interests (101,394)
Investment in restricted cash 22,133 (16,634) Cash paid on acquisition of Pantanal, net of cash acquired (5,015) Proceeds from sale of property, plant and equipment (PPE) 1,656 13,056 Purchases of property, plant and equipment (53,081) (55,936) Purchases of assets of TAM Milor including TAM Brands (56,255) Purchases of intangible assets (29,790) (54,017) Deposits in guarantee
Reimbursements 4,935 10,453 Deposits made (4,089) (5,271)
Pre delivery payment Reimbursements 67,595 63,042 Payments (216,764) (74,160)
Net cash used in investing activities (308,799) (180,737) Cash flow from financing activities Sale of treasury shares 1,937 1,756 Net cash received in a public offering of shares of Multiplus 364,959 Cash proceeds from issuance of shares in connection with
acquisition of assets of TAM Milor 41,700 Dividends paid – TAM S.A. 20(e) (113,679) (130,096) Dividends and interest on capital paid to non-controlling
shareholders of Multiplus (13,414) (4,453) Dividends paid to non-controlling shareholders of Mercosur (197) (736) Short and long-term borrowings
Issuance 63,207 Payments (58,593) (80,703)
Debentures Payments (101,895) (95,251)
Senior notes Issuance 493,670
Capital element of finance leases (307,665) (221,110) Net cash used in financing activities (36,629) (123,934) Effect of conversion on cash and cash equivalents (41,589) 12,965 Net decrease in cash and cash equivalents (329,761) (56,524) Cash and cash equivalents at the beginning of the period 607,502 617,489 Cash and cash equivalents at the end of the period 277,741 560,965 Supplementary information on cash flows: Non cash investing and financing activities
Acquisition of aircraft under finance leases 281,413 459,135 Acquisition of assets of TAM Milor through issuance of
shares 40,841 Acquisition of other PPE under financial leases 56,026 Financing obtained for direct payment to suppliers 57,537

TAM S.A. Notes to the condensed consolidated interim financial information (In thousands of Dollar, unless otherwise indicated)
F-10
1. General information TAM S.A ("TAM" or the "Company") was incorporated on May 12, 1997, to invest in companies which carry out air transportation activities. The Company wholly owns TAM Linhas Aéreas S.A. ("TLA"), a company that operates in the transportation of passengers and cargo in Brazil and on international routes, and also owns 94.98% of Transportes Aéreos del Mercosur S.A. (TAM Airlines or Mercosur), an airline headquartered in Asunción, Paraguay, which operates in Paraguay, Argentina, Brazil, Chile, Uruguay and Bolivia. TAM is incorporated and domiciled in Brazil and its registered office is in Av. Jurandir, 856, Lote 4, 1st floor, São Paulo, SP. On July 15, 2005, the Company concluded a public offering of shares on the São Paulo Stock Exchange – BOVESPA. On March 10, 2006 the Company made an additional public offering – this time on the BM&F – Bolsa de Valores, Mercadorias e Futuros (BM&F Bovespa) and the New York Stock Exchange – NYSE (in the form of American Depositary Shares – ADS), which was concluded on April 6, 2006. The Company, through its subsidiary TLA, controls the companies TAM Capital Inc, (TAM Capital), TAM Capital Inc, 2 (TAM Capital 2), TAM Financial Services 1 Limited (TAM Financial 1), TAM Financial Services 2 Limited (TAM Financial 2) and as from May 2011 also TAM Capital Inc, 3 (TAM Capital 3) and Financial Services 3 Limited (TAM Financial 3 – was established in August 2011) all headquartered in the Cayman Islands, whose main activities involve aircraft acquisition and financing and issuance of debt. Debt issued by these wholly-owned companies is wholly and unconditionally guaranteed by TAM. TLA also controls the company TAM Viagens e Turismo Ltda. (TAM Viagens), whose corporate purpose is to carry out the activities of a travel and tourism agency, under the name TAM Viagens. The Company controls TP Participações Ltda. which on July 20, 2009, changed its name to TP Franchising Ltda. (TP Franchising) and modified its corporate purpose to the development of franchises. In the Extraordinary General Meeting (AGE) held on October 28, 2009, it was approved the change of the name of Q.X.S.P.E. Empreendimentos e Participações S.A. to Multiplus S.A. (Multiplus). Multiplus’s main activity is the development and management of customer loyalty programs. A public offering of shares of this subsidiary was concluded on February 5, 2010. Since March 15, 2010, the date on which its purchase was approved, the Company controls Pantanal Linhas Aéreas S.A. – “Pantanal”, which was the date ANAC – the National Agency of Civil Aviation approved the purchase. Pantanal is currently under bankruptcy protection. On July 13, 2010, TLA acquired TAM Milor which was the holder of the brand “TAM” and other related brands (TAM Brands) which are used by the Company, by TLA and other related companies. On March 1, 2011, the Company legally merged its subsidiary TAM Milor into the Company. On January 18, 2011, the Company published a significant event, informing that TAM and LAN Airlines S.A. had signed two agreements named Implementation Agreement and Exchange Offer Agreement, regulating the final terms and conditions for the association contemplated in the Memorandum of Understanding entered into on August 13, 2010. The agreements define the new structure that will be formed by the association of the two companies for formation of the Group LATAM Airlines S.A., as well as the form of corporate management that will coordinate this new structure. The operation agreed between the parties was approved by ANAC, Brazilian authority, and Tribunal de Defensa de la Libre Competencia (TDLC), Chile authority, on Mach 3, 2011 and September 21, 2011, respectively. On March 29, 2011, the Company and TRIP Linhas Aéreas S/A. (“TRIP”) signed a Term Sheet, with no binding effect, in order to identify possible opportunities for strengthening and expanding their businesses through the development of a strategic alliance complementary to the existing Codeshare Agreement. Pursuant to the Term Sheet signed, if and when binding documents are executed, and after meeting conditions precedents that may be mutually agreed (including the approval by the applicable authorities),

TAM S.A. Notes to the condensed consolidated interim financial information (In thousands of Dollar, unless otherwise indicated)
F-11
TAM may ultimately acquire a non-controlling interest in TRIP representing 31% of its total capital comprised by 25% of its voting capital and the remaining interest through non-voting preferred shares. On May 3, 2011, TLA incorporated TAM Capital 3 for the purpose of issuing US$ 500,000 8.375% senior guaranteed notes due 2021 as further described in Note 14.2, and TAM Financial 3, whose main activities are involved aircraft acquisition and financing. This condensed consolidated interim financial information, of TAM and its subsidiaries was approved by the Board of Executive Officers on November 9, 2011. 2. Basis of preparation and significant accounting policies The condensed consolidated interim financial information for the three and nine months ended September 30, 2011 and 2010 has been prepared in accordance with IAS 34 – Interim financial reporting.
The accounting policies applied in the preparation of this condensed consolidated interim financial information are consistent with those of the annual financial statements for the year ended December 31, 2010 and have been applied consistently, except that as described in Note 4 as from the quarter ended September 30, 2011 the Company applies cash flow hedge accounting with respect to certain transactions entered into by its subsidiary Multiplus. The consolidated interim financial information should be read in conjunction with the annual financial statements for the year ended December 31, 2010, which have been prepared in accordance with International Financial Reporting Standards (IFRS) issued by the International Accounting Standards Board (IASB). Presentation currency of the financial statements The annual financial statements for the year ended December 31, 2010 prepared in accordance with IFRS previously mentioned are presented using the Brazilian Real as presentation currency. The functional currency of TAM and its subsidiaries, except for TAM Airlines is the Brazilian Real. The functional currency of TAM Mercosur is the Guaraní. This condensed consolidated interim financial information is presented using the U.S. dollar as its presentation currency exclusively to meet a specific requirement related to Chilean regulatory process in the proposed merger between TAM and LAN Airlines S.A. The Company as required by Brazilian corporate legislation will continue to present its financial statements for legal and statutory purposes using Brazilian Real as presentation currency. The conversion of Brazilian real functional currency for U.S. dollars was made using the methodology described in IAS 21 - Effects of changes in exchange rates, summarized below: (I) the assets and liabilities were translated at the closing exchange rate prevailing on the balance sheet date, (Ii) the income statement accounts were converted using quarterly average exchange rates (Iii) in relation to equity balances at the end of each period for which IAS 21 does not establish a methodology for converting the Company opted to convert the closing exchange rate prevailing on the balance sheet date, and (Iv) other changes in equity were converted by quarterly average exchange rates except those that correspond to specific transactions with shareholders who were converted at the exchange rate of the date of the transaction

TAM S.A. Notes to the condensed consolidated interim financial information (In thousands of Dollar, unless otherwise indicated)
F-12
All resulting translation differences are recognized directly in equity in the cumulative translation adjustment, except for differences arising from the change in account balances of assets that are recognized in the respective account. For presentation purposes the changes of the balance sheet accounts are presented in the explanatory notes, and the values presented in the statement of cash flows are translated using average exchange rates quarterly. Hedge accounting cash flow In accordance with the detailed in Note 4 from the quarter ended September 30, 2011 the Company applies hedge accounting in connection with certain transactions of its subsidiary Multiplus. 2.1. Basis of consolidation and investments in subsidiaries
(a) Consolidated financial information
(i) Subsidiaries
The consolidated interim financial information includes the financial statements of TAM and its subsidiaries, including special purpose entities. Control is obtained when the Company has the power to govern the financial and operating policies, as a result of holding more than half of the voting rights. The existence and the effect of potential voting rights, currently exercisable or convertible, are taken into account to assess whether TAM controls another entity. Subsidiaries are fully consolidated as from the date when control is transferred to TAM and are no longer consolidated as from the date when such control ceases. The results of subsidiaries acquired during the year are included in the consolidated statements of operations and of comprehensive income/loss as from the actual acquisition date. The comprehensive/loss income balance is attributable to the Company’s owners and to non-controlling interests, even if results in a negative balance of these interests. When necessary, the financial statements of subsidiaries are adjusted to conform their accounting policies to those established by the Company. Intercompany transactions and balances and unrealized gains are eliminated. Unrealized losses are also eliminated, although they are considered as an indicator of impairment of the transferred asset.
(ii) Transactions and non-controlling interests
In the consolidated interim financial information, any changes in the Company’s interests in subsidiaries that do not result in loss of the Company’s control over subsidiaries are recorded as capital transactions. The account balances of the Company’s interests and non-controlling interests are adjusted to reflect changes in their interests in subsidiaries. The difference between the fair value of consideration paid or received is recorded directly in equity and attributed to the Company's owners. When the Company ceases to have control, any retained interest in the entity is remeasured to its fair value, and any change in the carrying amount is recognized in profit or loss. The fair value is the initial carrying amount for subsequent recognition of the retained interest in an associate, a joint venture or a financial asset. Also, any amounts previously recognized in other comprehensive income related to that entity are recorded as if TAM had directly disposed of the related assets or liabilities. This means that the amounts previously recognized in other comprehensive income are reclassified to profit or loss. Non-controlling interests represent the portion of profit or loss and of equity of subsidiaries that is not held by TAM, and is recorded in a separate line item in the consolidated balance sheet.

TAM S.A. Notes to the condensed consolidated interim financial information (In thousands of Dollar, unless otherwise indicated)
F-13
(iii) Companies included in the consolidated interim financial information
Ownership and voting power %
Reporting
date Ownership
September 30,
2011
December 31,
2010
September 30, 2010
(unaudited)
TLA 09.30.2011 Direct 100.00 100.00 100.00
TAM Viagens (i) 09.30.2011 Indirect 99.99 99.99 99.99
TAM Capital (i) 09.30.2011 Indirect 100.00 100.00 100.00
TAM Capital 2 (i) 09.30.2011 Indirect 100.00 100.00 100.00
TAM Capital 3 (i) 09.30.2011 Indirect 100.00
TAM Financial 1 (i) 09.30.2011 Indirect 100.00 100.00 100.00
TAM Financial 2 (i) 09.30.2011 Indirect 100.00 100.00 100.00
TAM Financial 3 (i) 09.30.2011 Indirect 100.00
Fundo Spitfire II (Fundo exclusivo) (ii) 09.30.2011 Indirect 100.00 100.00
100.00
TP Franchising 09.30.2011 Direct 100.00 100.00 100.00
Mercosur 08.31.2011 Direct 94.98 94.98 94.98
Multiplus 09.30.2011 Direct 73.17 73.17 73.17
Pantanal 09.30.2011 Direct 100.00 100.00 100.00
TAM Milor (iii) 09.30.2011 100.00
(i) TAM's investments are held indirectly through TLA. (ii) TAM's investment is held 27% directly, 42% through TLA and 31% through Multiplus, respectively. (iii) TAM Milor was acquired in July 2010. On March 1, 2011, the Company merged its subsidiary TAM Milor into the
Company. 2.2. New and revised standards and interpretations and amendments to existing standards and
interpretations
(a) The following accounting standard are mandatory for the year beginning in January 2011 and have been applied by TAM:
IFRIC 13 - "Customer Loyalty Programmes". The meaning of “fair value” is clarified in the context of
measurement of award credits in customer loyalty programmes effective January 1, 2011. The application of the clarified guidance did not result in any impact on the financial position and results of operations since the Company was measuring the fair value of its award credits.
IAS 34 ammendment effective January 1, 2011 provides guidance to illustrate how to apply
disclosure principles in IAS 34 and add disclosure requirements around:
a) The circumstances likely to affect fair value of financial instruments and their classification;
b) Transfers of financial instruments between different levels of the fair value hierarchy; c) Changes in classification of financial assets; and d) Changes in contingent liabilities and assets
The applicable additional disclosures are included in this interim financial information.
3. Adjustments applied retroactively to prior period interim financial information
In the annual financial statements for the year ended December 31, 2010, the Company changed its accounting policy related to revaluation of flight equipment at revalued amounts, in order that the consolidated profit and equity are equal to those presented in the parent company’s individual financial

TAM S.A. Notes to the condensed consolidated interim financial information (In thousands of Dollar, unless otherwise indicated)
F-14
statements since the Brazilian corporate law does not permit the revaluation of property, plant and equipment. The comparative information as of September 30, 2010 and for the quarter ended and the nine months ended September 30, 2010 presented herewith is being retroactively adjusted to reflect such change in accounting polices. The effects of the retroactive adjustments at January 1, 2010 and for the quarter and for the the nine months ended September 30, 2010 are as follows:
January 1, 2010
As
originally Retrospective
adjustment Adjusted Effects on equity Revaluation reserve 67,578 (67,578) Accumulated deficit and other reserves (172,271) 529,076 356,805 Total (104,693) 461,498 356,805
Quarter ended
September 30, 2010
(Unaudited)
As originally presented
Retrospective adjustment Adjusted
Effects on profit or loss Operating expenses (1,284,917) (5,658) (1,290,575) Profit before income tax and social
contribution
656,100 (5,658) 650,442 Income tax and social contribution (226,333) 1,924 (224,409) Profit for the period 429,767 (3,734) 426,033 Earnings per share - Basic 2.81 2.79 Earnings per share - Diluted 2.81 2.78 Effects on Statements of Comprehensive Income
Profit for the period 429,767 (3,734) 426,033
The only effect on all of the results is observed in the results for the period
TAM S.A. Notes to the condensed consolidated interim financial information (In thousands of Dollar, unless otherwise indicated)
F-15
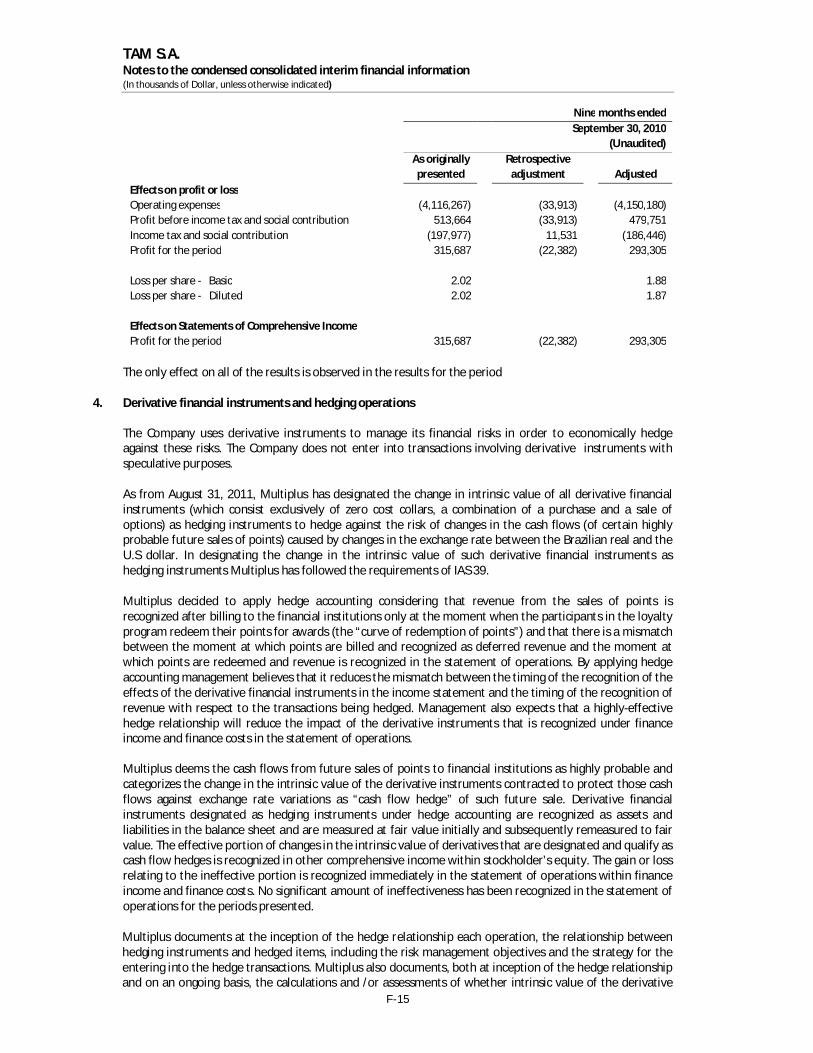
Nine months ended
September 30, 2010
(Unaudited)
As originally presented
Retrospective adjustment Adjusted
Effects on profit or loss Operating expenses (4,116,267) (33,913) (4,150,180) Profit before income tax and social contribution 513,664 (33,913) 479,751 Income tax and social contribution (197,977) 11,531 (186,446) Profit for the period 315,687 (22,382) 293,305 Loss per share - Basic 2.02 1.88 Loss per share - Diluted 2.02 1.87 Effects on Statements of Comprehensive Income Profit for the period 315,687 (22,382) 293,305
The only effect on all of the results is observed in the results for the period
4. Derivative financial instruments and hedging operations The Company uses derivative instruments to manage its financial risks in order to economically hedge against these risks. The Company does not enter into transactions involving derivative instruments with speculative purposes. As from August 31, 2011, Multiplus has designated the change in intrinsic value of all derivative financial instruments (which consist exclusively of zero cost collars, a combination of a purchase and a sale of options) as hedging instruments to hedge against the risk of changes in the cash flows (of certain highly probable future sales of points) caused by changes in the exchange rate between the Brazilian real and the U.S dollar. In designating the change in the intrinsic value of such derivative financial instruments as hedging instruments Multiplus has followed the requirements of IAS 39. Multiplus decided to apply hedge accounting considering that revenue from the sales of points is recognized after billing to the financial institutions only at the moment when the participants in the loyalty program redeem their points for awards (the “curve of redemption of points”) and that there is a mismatch between the moment at which points are billed and recognized as deferred revenue and the moment at which points are redeemed and revenue is recognized in the statement of operations. By applying hedge accounting management believes that it reduces the mismatch between the timing of the recognition of the effects of the derivative financial instruments in the income statement and the timing of the recognition of revenue with respect to the transactions being hedged. Management also expects that a highly-effective hedge relationship will reduce the impact of the derivative instruments that is recognized under finance income and finance costs in the statement of operations. Multiplus deems the cash flows from future sales of points to financial institutions as highly probable and categorizes the change in the intrinsic value of the derivative instruments contracted to protect those cash flows against exchange rate variations as “cash flow hedge” of such future sale. Derivative financial instruments designated as hedging instruments under hedge accounting are recognized as assets and liabilities in the balance sheet and are measured at fair value initially and subsequently remeasured to fair value. The effective portion of changes in the intrinsic value of derivatives that are designated and qualify as cash flow hedges is recognized in other comprehensive income within stockholder’s equity. The gain or loss relating to the ineffective portion is recognized immediately in the statement of operations within finance income and finance costs. No significant amount of ineffectiveness has been recognized in the statement of operations for the periods presented. Multiplus documents at the inception of the hedge relationship each operation, the relationship between hedging instruments and hedged items, including the risk management objectives and the strategy for the entering into the hedge transactions. Multiplus also documents, both at inception of the hedge relationship and on an ongoing basis, the calculations and /or assessments of whether intrinsic value of the derivative

TAM S.A. Notes to the condensed consolidated interim financial information (In thousands of Dollar, unless otherwise indicated)
F-16
instruments designated as hedging instruments are highly effective in offsetting the change in cash flows in Reais attributable to the change in the exchange rate between the Brazilian real and the U.S dollar of the highly probable future sales of points In “cash flow hedge”, Multiplus hedges the changes in future cash flows from sales attributable to changes in the exchange rate and recognizes all changes in the fair value of the derivative financial instruments. The change in fair value attributable to the effective portion of the hedge relationship is recognized in other comprehensive income within shareholder’s equity and the ineffective portion and the time value which is not part of the hedging relationship is recognized directly in the income statement. The effective portion originally recognized in shareholder’s equity in other comprehensive income, will only be released or recycled into the statement of operations when the hedged item affect the income statement (which is the moment when the points that were hedged are redeemed by the participants). However, when a hedged item expires or when a hedge operation no longer meets the criteria for hedge accounting, any cumulative gain or loss existing in stockholder’s equity, at the time, remains in stockholders´equity until the moment in which the forecasted transaction is ultimately recognized in income. Multiplus calculates the fair value of derivatives based on widely used statistical methods using series of techniques such as Black-Scholes-Merton (Garmann-Kohlhagen) to price options and discounted cash flow for swaps and forwards. The hedging instruments are considered to be effective when the variation in the cash flow of the hedging instruments offsets between 80% and 125% of the changes in the hedged transaction. The Company has not classified any derivative instrument in a “fair value hedge” or “net investment hedge” relationship. 5. Financial instruments
5.1 Financial risk management
TAM's activities expose it to a variety of financial risks: market risk (including currency risk, interest rate risk and price risk), credit risk and liquidity risk. The Company has a formal Risk Management Policy that defines the rules to be followed and authorizes the Treasury Department to enter into derivative transactions in order to reduce the impact that possible fluctuations in fuel prices and foreign exchange and interest rates may have on its cash flows. The management of risk is monitored by the Risk Committee that is, responsible for, among other matters:
Decide on any increase of the percentage level of protection based on strategic issues and monitor the comparison between the market and budgeted scenarios;
Manage and monitor the risk exposure;
Monitor compliance with the risk policy;
Decide on the exposure level of market risks;
Establish financial limits for all the institutions authorized to carry out derivative transactions; and
Monitor the performance of derivative transactions.
Derivatives are contracted in line with TAM's policies, considering liquidity, impact on cash flow and cost/benefit analysis of each position taken. The control over the use of derivatives includes ensuring that the rates in derivative contracts are compatible with market rates. The Company does not enter into transactions involving financial instruments, including derivative instruments, for speculative purposes.

TAM S.A. Notes to the condensed consolidated interim financial information (In thousands of Dollar, unless otherwise indicated)
F-17
5.1.1 Market risks The Company is exposed to market risks arising from its normal business activities. These market risks principally relate to changes in interest rates, exchange rates or aviation kerosene (QAV) and such variations can negatively affect its cash flows and future expenses. Market risk is the risk of a possible loss derived from variations in the prices of market prices (rates of exchange, interest rates, prices of commodities, or others) that may affect the Company’s cash flow or results. The Company entered into derivative contracts with the purpose of reducing the risks derived from variations in these factors. Policies and procedures have been implemented to evaluate these risks and to monitor the transactions with derivatives. The policies establish minimum and maximum levels of protection, and require that counterparties have investment grade credit rating as condition for entering into the transactions. (a) Risks relating to variations in the price of jet fuel One of the most important financial risks of airlines is the volatility of fuel price. The QAV price is linked to the variation of the oil price in the international market. The Company has entered into derivative transactions in order to economically hedge itself against this risk. TAM's Risk Committee has established policies for achieving this. The policy establishes to carry out derivative transactions covering a maximum level of 60% of the fuel consumption projected for the following 24 months and minimum level of 20% of the consumption projected for the first 12 months and 10% for the subsequent twelve months. Swaps, options, or a combination of these instruments, using market prices for crude oil, heating oil or jet fuel as the underlying, may be used to achieve TAM’s aims.
TAM protects itself against the volatility in its kerosene price by using derivatives based mainly on crude oil (West Texas Intermediate or "WTI"). The choice of this underlying item was based on studies that indicate that the hedge of QAV based on WTI is, historically, highly effective, in addition to the high liquidity of the financial instruments referenced in WTI. At September 30, 2011 all contracted financial instruments are over the counter. The Company enters into derivative transactions only with counterparties classified by the main risk rating agencies (Standard & Poors, Fitch and Moody’s) as at a minimum investment grade. As the consumed volume of kerosene is not fully protected through derivatives, increases in the price of kerosene are not fully offset by the derivatives. In the same way, decreases in the price of kerosene will have positive impact for the Company, since it will not be fully offset by changes in the fair value of the derivatives. The aviation fuel consumed in the periods ended September 30, 2011 and 2010 accounted for 33.8% and 34.0%, respectively, of the cost of services provided by the Company (Note 23 (b)). (a.1) Outstanding jet fuel derivatives: The following table presents the percentages of anticipated consumption covered for the next 12 months after each date and the average strike price for the transactions outstanding as of each of those dates:
September 30,
2011 December 31,
2010
% of coverage anticipated for the next 12 months 30% 25%
Average strike price for outstanding derivatives US$ 93.5/bbl US$ 87/bbl
Market price of WTI US$ 79.2/bbl US$ 89/bbl The following table presents both the notional amount and fair value of outstanding jet fuel derivatives as of each date broken down by maturity:

TAM S.A. Notes to the condensed consolidated interim financial information (In thousands of Dollar, unless otherwise indicated)
F-18
2011 2012 2013 2014 Total
At September 30, 2011 Notional amount – thousands of barrels 1,445 4,860 2,425 325 9,055 Fair value, net – US$ thousand (2,935) (23,777) (15,353) (435) (42,500) At December 31, 2010
Notional amount – thousands of barrels 3,985 2,710 150 6,845 Fair value, net – US$ thousand (5,876) (5,123) (109) (11,108)
(b) Exchange rate risk (b.1) TLA A significant portion of the operating costs and expenses, such as aircraft and engine maintenance services, aircraft lease payments and aircraft insurance, are denominated in U.S. dollars. The Company may enter into derivative contracts to protect against a possible appreciation or depreciation of the Real against the U.S. dollar. The notional amount and fair value of the foreign currency derivatives outstanding are presented below by year of maturity: 2012 At September 30, 2011
Notional amount – US$ 31,000 Fair value – US$ 78
At December 31, 2010
Notional amount – US$ 31,000 Fair value – US$ (533)
In view of the restructuing of derivatives made in the first quarter of 2009 and in the second quarter of 2010, one of the counterparties required a deposit denominated in dollars as collateral guarantee. As deposits in foreign currency are not permitted in Brazil, a foreign exchange collar was entered into with the amount of the deposit as notional and also provided as collateral. The collar transaction described above is the only foreign currency derivative outstanding at September 30, 2011 and December 31, 2010. (b.2) Multiplus The exchange rate risk consists of the risk of changes in the R$/US$ exchange rate that affects the selling price of points as part of the contracts where the price of the points are denominated in US$. These fluctuations may impact the cash flows and the sale price of points when measured in Reais.
The following table presents both the notional amount and fair value of outstanding derivatives as of each date broken down by maturity. The maturity date of the derivative is also the date on which the highly probable sale of points is expected to be billed. The highly probable sales of points are expected to be recognized in income after billed and management expects that they will be recognized in income on average in up to six months after billed.

TAM S.A. Notes to the condensed consolidated interim financial information (In thousands of Dollar, unless otherwise indicated)
F-19
2011 2012 2013 2014 Total At September 30, 2011
Notional amount – US$ 51,000 303,000 253,000 2,000 609,000 Fair value at date of
designation (August 31, 2011) – US$ 1,455 2,504 64 (46) 3,977
Fair value at September 30, 2011, net – US$ (1,398) (12,700) (14,329) (278) (28,705)
(c) Distribution of fair value by counterparty credit rating The distribution of fair value by counterparty credit rating and by type of risk being protected at September 30, 2011 and December 31, 2010 is presented below:

TAM S.A. Notes to the condensed consolidated interim financial information (In thousands of Dollar, unless otherwise indicated)
F-20
(i) Effects of derivatives on the balance sheet
September 30, 2011
December 31, 2010
Counterparties with external credit rating Standard&Poors, Moody´s or Fitch)
Trading place
TLA Multiplus Total TLA Multiplus Total
AAA* Over the counter (7,808) (14,725) (22,533) (14,008) (14,008) AA+, AA ou AA-* Over the counter (30,540) (13,980) (44,520) 2,203 2,203 A+, A ou A-* Over the counter (4,074) (4,074) 164 164 (42,422) (28,705) (71,127) (11,641) (11,641) Fuel derivative asset – WTI 16,309 16,309 9,881 9,881 Fuel derivative liability – WTI (58,809) (58,809) (20,989) (20,989) Fuel derivative, net – WTI (42,500) (42,500) (11,108) (11,108) Foreign exchange derivatives asset 78 2,021 2,099 Foreign exchange derivatives liability (30,726) (30,726) (533) (533) Foreign exchange derivatives, net 78 (28,705) (28,627) (533) (533) (42,422) (28,705) (71,127) (11,641) (11,641) Amounts outstandin in other comprehensive income Equity
Cash flow hedge (22,248) (22,248) Deferred income tax and social contribution 7,565 7,565
(14,683) (14,683)
(*) The ratings can be expressed both in the global scale or in local currency. Each agency has a slightly different way to present rating. The table above unifies the presentations in what we believe is the most well known rating international scale.

TAM S.A. Notes to the condensed consolidated interim financial information (In thousands of Dollar, unless otherwise indicated)
F-21
The Company monitors the concentration of financial instruments on a single counterparty. Internal policies require reporting of excessive concentrations to the Risk Committee. At September 30, 2011 there was two counterparties, with rating AAA and AA, that exceeded the limit established; however the Company believes this concentration of risk is acceptable. (ii) Effect of derivatives in the statement of operations
Until August 2011, all gains and losses resulting from changes in fair value of derivatives entered into by Multiplus (which where not designated for cash flow hedge) were recognized in the statement of operations in the same line on which the transaction being economically hedged is recorded which in the case of Multiplus is revenue. As further described above as from August 31, 2011, Multiplus designated the intrinsic value of all derivative as hedging instruments for hedge accounting purposes. For derivatives designated as hedging instruments the change in the intrinsic value is initially recorded in shareholder’s equity and released to income at the same time that the hedged transaction is recorded in income; upon release to income the amount originally recognized in equity is recorded in the line revenue. Also for derivatives designated as hedging instruments, the change in the time value of the derivatives is not part of the hedge relationship and this change is recognized immediately under finance income and finance cost.
September 30,
2011 Quarter Nine months
Operating income
Net gain – Change in fair value of derivatives settled through August 31, 2011
1,589 1,939
Net gain - Change in fair value of unsettled derivatives until August 31, 2011
2,750 4,513 4,339 6,452 Finance result
Financial cost – - Change in time value of derivative instruments designated for hedge accounting
(11,828) (11,828) (7,489) (5,376)
(d) Interest rate risk TAM’s earnings are affected by changes in interest rates due to the impact these changes have on interest expense from variable-rate debt instruments, variable-rate lease contracts, and on interest income generated from its cash and short-term investment balances. To minimize possible impacts from interest rate fluctuations, TAM has adopted a policy of diversification, alternating between contracting fixed and variable rates (such as the London Interbank Offered Rate “LIBOR” and CDI - Certificate of Deposit Intermediate). The Company does not have financial instruments to hedge its cash flows against fluctuations in interest rates. (e) Sensitivity analysis Presented below is a sensitivity analysis of the financial instruments that demonstrates the impact of changes in financial instruments on the result and equity of the Company by considering:
Increase and decrease of 10 percent in fuel prices, by keeping constant all the other variables;

TAM S.A. Notes to the condensed consolidated interim financial information (In thousands of Dollar, unless otherwise indicated)
F-22
Increase and decrease of 10 percent in R$/US$ exchange rate, with all other variables remaining
steady; and
Increase and decrease of one percentage point in interest rate, by keeping constant all the other variables.
(e.1) TLA
Fuel price:
A hypothetical 10% increase/decrease in the price of WTI would lead to an increase/decrease of approximately US$ 9,765 / US$ 83,125 (equivalent to R$ 18,108 / R$ 154,147 at September 30, 2011) in the fair value of WTI derivatives. This increase/ decrease would directly affect the Company’s net income. In terms of cash flows, however, these changes in WTI price would be more than offset by a decrease/increase in the Company’s kerosene-type jet fuel costs. The cash payments for settling the derivatives are due at their respective maturities, distributed from 2011 through 2014.
Exchange rate – U.S. Dollar:
If there was a 10% depreciation/appreciation of the Brazilian Reais against the U.S. dollar and all other variables remained constant, the financial result would have been affected by approximately US$ 418 million / US$ 418 million, mainly as a result of foreign exchange gains/losses on the translation of U.S. dollar denominated trade receivables and U.S. dollar denominated financial assets at fair value through profit or loss, and foreign exchange losses/gains on the translation of U.S. dollar-denominated borrowings and finance leases.
Interest rate – LIBOR and CDI:
A hypothetical 100 basis point increase in foreign market (LIBOR) interest rates in the quarter ended September 30, 2011 would increase its aircraft rental and interest expense over a one year period by approximately US$ 25,306.
If there was a hypothetical 100 basis point increase/ decrease in domestic market (CDI) interest rates in the quarter ended September 30, 2011 would increase/decrease loan and financing interest expenses over a one year period by approximately US$ 4,135.
(e.2) Multiplus
Exchange rate – U.S. Dollar (Derivatives):
If there was a 10% depreciation / appreciation of the Brazilian Reais against the U.S. dollar and all other variables remained constant, the financial result would have been affected by approximately US$ 11,646 / US$ 4,439, mainly as a result of the effect of the foreign exchange gain or losses on the time value of the derivatives which is recognized immediately in income.
5.1.2. Credit risk Credit risk refers to the risk that counterparty will not fulfill its contractual obligations, leading the Company to incur financial losses. Credit risk arises from the possibility of TAM not recovering amounts receivable from services provided to consumers and/or travel agencies, or from amounts held with financial institutions generated by financial investment operations. To reduce credit risk, TAM has adopted the practice of establishing credit limits and the permanent follow-up of its debtor balances (mainly from travel agencies).

TAM S.A. Notes to the condensed consolidated interim financial information (In thousands of Dollar, unless otherwise indicated)
F-23
TAM only deals with financial institution counterparties which have a credit rating of at least BBB or equivalent issued by S&P, Moody’s or Fitch. Each institution has a maximum limit for investments, as determined by the Company’s Risk Committee. Currently, management does not expect losses due to default of its counterparties and does not have any individually significant exposure to any counterparty.
5.1.3. Liquidity risk Prudent liquidity risk management implies maintaining sufficient cash and short-term investments, the availability of funding through an adequate amount of committed credit facilities and the ability to close out market positions. Excess cash is invested mainly through TAM’s exclusive investment funds. Each of these funds has a clear investment policy, with limits on concentration of risk in the underlying investments. The table below analyses TAM's financial liabilities into relevant maturity groupings based on the remaining period at the reporting date to the contractual maturity date. The amounts disclosed in the table are the contractual undiscounted cash flows and include interest, except for derivatives, for which the fair value is disclosed.

TAM S.A. Notes to the condensed consolidated interim financial information (In thousands of Dollar, unless otherwise indicated)
F-24
Less than one year
Between one and two years
Between three and five years
More than five years Total Effect of discounting Carrying value
Non-derivative financial liabilities At September 30, 2011
Finace lease obligations 423,263 495,759 963,281 1,219,127 3,101,430 (281,784) 2,819,646 Senior notes 90,471 121,963 271,416 1,393,947 1,877,797 (765,785) 1,112,012
Borrowings 471,652 28,530 2,030 3,355 505,567 (13,666) 491,901 Debentures 201,206 91,752 227,125 59,716 579,799 (158,147) 421,652 Refinanced taxes payable under Fiscal Recovery Program 27,515 49,749 94,466 401,381 573,111 (317,750) 255,361 Other (i) 540,207 540,207 540,207 At December 31, 2010 Finace lease obligations 410,519 767,853 684,621 1,389,732 3,252,725 (397,173) 2,855,552 Senior notes 65,239 98,572 98,572 743,533 1,005,916 (400,312) 605,604
Borrowings 370,619 4,980 1,320 4,338 381,257 (12,130) 369,127Debentures 251,426 203,509 175,704 142,247 772,886 (186,569) 586,317
Refinanced taxes payable under Fiscal Recovery Program 18,699 44,247 87,841 532,363 683,150 (419,179) 263,971 Other (i) 593,683 593,683 593,683
(i) The amount is recorded under: Accounts payable and Salaries and social charges.

TAM S.A. Notes to the condensed consolidated interim financial information (In thousands of Dollar, unless otherwise indicated)
F-25
Less than one year
Between one and two years
Total (equal carrying value)
Carrying value
Derivative financial liabilities At September 30, 2011
Fuel price risk (33,992) (24,817) (58,809) (58,809)Exchange rate risk (12,680) (18,046) (30,726) (30,726)
At December 31, 2010
Fuel price risk (11,815) (9,174) (20,989) (20,989)Exchange rate risk (533) (533) (533)
In the analysis of net current assets it should be noted that current liabilities include the balance of Deferred income which is composed by advanced ticket sales, deferred income with respect to TAM loyalty program and deferred gains on sale and leaseback amounting to US$ 890,108 (December 31, 2010 – US$ 1,081,011). 5.2. Fair value estimation and fair value hierarchy The Company discloses the fair value of financial instruments by level of the following fair value measurement hierarchy:
Level 1 - quoted prices (unadjusted) in active markets for identical assets or liabilities;
Level 2 - inputs other than quoted prices included within level 1 that are observable for the asset or liability, either directly (that is, as prices) or indirectly (that is, derived from prices), and
Level 3 - Inputs for the asset or liability that are not based on observable market data (that is, unobservable
inputs). None of the financial instruments carried at fair value by the Company of its subsidiaries fall into this category at September 30, 2011.
The table below presents the Company's financial instruments measured at fair value in the statement of financial position:

TAM S.A. Notes to the condensed consolidated interim financial information (In thousands of Dollar, unless otherwise indicated)
F-26
September 30,
2011 December 31,
2010 Level 1 Level 2 Total Level 1 Level 2 Total
Financial assets at fair value through profit or loss
Brazilian government securities (1) 487,288 487,288 487,646 487,646 Corporate securities (2) 76,735 76,735 178,504 178,504 Bank deposit certificates – CDB (3) 56,281 56,281 20,525 20,525 Other bank deposits (3) 128,720 128,720 158,180 158,180
487,288 261,736 749,024 487,646 357,209 844,855 Derivative financial assets
Fuel hedge – WTI (4) 16,309 16,309 9,881 9,881 Foreign exchange 2,099 2,099
18,408 18,408 9,881 9,881 Derivative financial liabilities
Fuel hedge – WTI (4) (58,809) (58,809) (20,989) (20,989) Foreign exchange derivatives (4) (30,726) (30,726) (533) (533)
(89,535) (89,535) (21,522) (21,522)
No transfer of assets or liabilities between the levels of the fair value hierarchy took place during the periods ended September 30, 2011 and 2010. The financial instruments recognized at fair value are determined as follows: Financial assets measured at fair value through profit and loss:
(1) Brazilian Government securities – Corresponds to highly liquid Brazilian government securities that have prices available and correspond to transactions in an active market.
(2) Corporate securities – Correspond, typically, to debt securities for which fair value has been
determined based upon actual transactions observed in organized markets (when available) or discounted cash flows using interest rates when actual transactions are not available.
(3) Certificates of deposit and other bank deposits - Fair value has been estimated by discounting
estimated cash flows using market interest rates as inputs.
(4) Derivative financial instruments not traded in an exchange, for example, over-the-counter derivatives. TAM estimates its fair value using a series of techniques such as Black&Scholes, Garman & Kohlhagen, Monte Carlo or even discounted cash flow models commonly used in the financial market, depending on the nature of the derivative. All models used are widely accepted in the market and reflect the contractual terms of the derivative. Those models do not contain a high level of subjectivity, since the methodologies used in the models do not require significant judgment, and all inputs to the model are readily observable from actively quoted markets.

TAM S.A. Notes to the condensed consolidated interim financial information (In thousands of Dollar, unless otherwise indicated)
F-27
5.3. Capital management
The objective of capital management is to ensure that TAM is able to continue as a going concern whilst delivering shareholder expectations of a strong capital basis as well as returning benefits to other stakeholders and optimizing the cost of capital. Capital is managed by means of a leverage ratio. The Company’s capital structure is made up of its net indebtedness, defined as the total of loans, debentures and lease agreements (finance and operating), net of cash and cash equivalents and other short-term financial assets, and of the capital that is defined as the total net equity of shareholders and net indebtedness. The Company is not subject to any externally imposed capital requirements. The leverage ratios are as follows:
September 30,
2011 December 31,
2010 Cash and cash equivalents (Note 7) (277,741) (607,502) Financial assets at fair value through profit and loss (Note 5.2) (749,024) (844,855) Borrowings (Note 14.3) 491,901 369,127 Debentures and senior notes 1,533,664 1,191,921 Operating lease commitments (Note 28) 713,178 672,607 Finance lease obligations (Note 14.1) 2,819,646 2,855,552 Net debt (1) 4,531,623 3,636,850 Total equity 1,094,980 1,576,876 Total capital (2) 5,626,603 5,213,726 Leverage ratio (1) / (2) 80.5% 69.8% The substancial increase in the leverage ratio results from the following main factors: i) reduction in equity resulting from loss for the period and distribution of dividends at the end of 2010; ii) increase in financial liabilities exposed to foreign exchange rate variation resulting from the devaluation of the real from R$ 1.6662 at December 31,2010 to R$ 1.8544 at September 30, 2011; iii) issuance US$ 500 million in Senior Notes and iv) reduction in cash and cash equivalents of approximately US$ 330 million. Management believes that the resources available to the Company are sufficient for its present requirements and will be sufficient to meet its anticipated requirements for capital investments, which are approved annually by the Board of Directors, and other cash requirements for the 2011 fiscal year.

TAM S.A. Notes to the condensed consolidated interim financial information (In thousands of Dollar, unless otherwise indicated)
F-28
6. Financial instruments by category September 30,
2011
Loans and
receivables
Financial assets at fair value through
profit and loss Derivatives Total Derivative financial instruments 18,408 18,408 Financial assets at fair value through profit
and loss
749,024 749,024 Trade accounts receivable 1,060,932 1,060,932 Financial assets - Bank deposits 86,590 86,590 Restricted cash 32,927 32,927 Cash and cash equivalents 277,741 277,741 Total 1,458,190 749,024 18,408 2,225,622
December 31,
2010
Loans and receivables
Financial assets at fair value through
profit and loss Derivatives Total Derivative financial instruments 9,881 9,881 Financial assets at fair value through profit
and loss
844,855 844,855 Accounts receivable 934,330 934,330 Financial assets - Bank deposits 30,176 30,176 Restricted cash 59,000 59,000 Cash and cash equivalents 607,502 607,502 Total 1,631,008 844,855 9,881 2,485,744
Liabilities, per balance sheet:
September 30,
2011
Liabilities measured
at amortized cost Derivatives Total
Finance lease obligations 2,819,646 2,819,646 Senior notes 1,112,012 1,112,012 Borrowings 491,901 491,901 Debentures 421,652 421,652 Derivative financial instruments 89,535 89,535 Accounts payable and other obligations, excluding
statutory liabilitites
540,206 540,206 Total 5,385,417 89,535 5,474,952

TAM S.A. Notes to the condensed consolidated interim financial information (In thousands of Dollar, unless otherwise indicated)
F-29
December 31,
2010
Liabilities measured at
amortized cost Derivatives Total
Finance lease obligations 2,855,552 2,855,552 Senior notes 605,604 605,604 Borrowings 369,127 369,127 Debentures 586,317 586,317 Derivative financial instruments 21,522 21,522 Accounts payable and other obligations, excluding
statutory liabilitites
593,683 593,683 Total 5,010,283 21,522 5,031,805
7. Cash and cash equivalents
September 30,
2011 December 31,
2010
Cash and bank accounts 65,904 167,615 Short-term deposits 211,837 439,887 Total 277,741 607,502
At September 30, 2011 and December 31, 2010 no amounts have been used as part of overdraft facilities.
8. Trade accounts receivable
(a) Breakdown of balances
September 30,
2011 December 31,
2010
Domestic International Total % Total % Credit cards 681,084 45,441 726,525 65,0 623,920 62.8 Travel agents 105,876 39,629 145,505 13,0 158,241 15.9 Partners – Loyalty Program – Multiplus
120,000 120,000 10,7 48,668 4.9
On current account 23,890 365 24,255 2,2 46,007 4.6 Cargo 3,773 25,117 28,890 2,6 32,241 3.2 Other 54,615 17,702 72,317 6,5 84,262 8.5 Total 989,238 128,254 1,117,492 100,0 993,339 100.0 Provision for
impairment
(37,615) (18,945) (56,560) (59,009) Total 951,623 109,309 1,060,932 934,330

TAM S.A. Notes to the condensed consolidated interim financial information (In thousands of Dollar, unless otherwise indicated)
F-30
Trade accounts receivable are maintained in the following currencies: September 30,
2011 December 31,
2010 Reais 989,238 869,539 US dollars 25,941 15,717 Euros 70,051 48,630 Pounds sterling 6,270 8,515 Other 25,992 50,938
1,117,492 993,339
(b) Aging list – Receivables by due date
Breakdown September 30,
2011 %
December 31,
2010 %
Not yet due 1,040,127 93.1 798,132 80.3 Overdue
Up to 60 days 18,644 1.8 60,987 6.2 From 61 to 90 days 2,674 0.2 36,861 3.7 From 91 to 180 days 2,571 0.2 15,023 1.5 From 181 to 360 days 970 0.1 11,712 1.2 Over 360 days 52,506 4.7 70,624 7.1
1,117,492 100.0 993,339 100.0
(c) Provision for impairment of trade receivables
September 30,
2011 December 31,
2010 Balance at the beginning of the year 59,009 46,180 Charge for the period 6,836 18,485 Amounts reversed (3,296) (7,734) Effect of conversion of functional currency to presentation currency (5,989) 2,078 Balance at the end of the period 56,560 59,009
The additions and recovery of accrued receivables were included in "Selling expenses" in the consolidated statements of operations. The maximum exposure to credit risk at the reporting date is the carrying value of each type of receivable mentioned above.

TAM S.A. Notes to the condensed consolidated interim financial information (In thousands of Dollar, unless otherwise indicated)
F-31
9. Taxes recoverable
September 30,
2011 December 31,
2010 State Value Added Tax (ICMS) 13,779 15,489 Taxes recoverable 12,542 10,040 Tax on Industrialized Products (PIS) and Social Security Financing
Contribution (COFINS) - (i)
276,492 3,338 Income tax (IRPJ) and social contribution on income (CSLL) 26,680 IRRF 4,476 12,998 Other 1,081 2,248 335,050 44,113 Provision for impairment - ICMS (8,598) (9,569) 326,452 34,544
(i) TLA finalized during the quarter ended September 30, 2011 the revision of the criteria used in determining PIS and COFINS credits initiated in the prior quarter. During the quarter ended September 30, 2011 US$ 260 million of PIS and COFINS credits were recognized (of wihich US$ 233 million as a reduction of Operating costs- Fuel, US$ 3 million as a reduction of Finance costs and US$ 24 million as a reduction of Operating costs-Take-off, landing and navigation aid charges) as result of the change in estimate with respect to international passenger revenue. Considering its assessement of the tax rules and the legal opinions from independent tax advisors the Company recognized the PIS and COFINS credit over purchases considering the relationship between revenue subject to the cumulative and to the non-cumulative regime. During the quarter ended June 30, 2011 TLA had already recognized a change in estimate related to PIS and COFINS credits corresponding to credits over purchases measured considering the relationship between revenue subject to the cumulative and to the non-cumulative regime and to taxes paid in excess in prior periods for the amount of US$ 108 million (of which US$ 89 million as reduction of Operating costs-Fuel and US$ 19 million as reduction of Finance costs. Management has finalized during this quarter such revision and no further amounts are expected to be recognized with respect to this matter in future periods.

TAM S.A. Notes to the condensed consolidated interim financial information (In thousands of Dollar, unless otherwise indicated)
F-32
10. Derivative Financial Instruments
September 30,
2011December 31,
2010 Assets West Texas Intermediate crude oil derivatives Seagulls 10,777 6,374 Collar 5,532 3,507 16,309 9,881 Foreign currency derivatives
Collar 2,099 18,408 9,881 Current (14,796) (5,939) Non-current 3,612 3,942 Liabilities West Texas Intermediate crude oil derivatives
Seagulls 20,032 20,460 Collar 38,777 529 58,809 20,989
Foreign currency derivatives Swaps 533 Collar 30,726
89,535 21,522
Current (46,672) (12,348) Non-current 42,863 9,174 The derivative financial instruments included above are described in Note 5. 11. Financial assets – Bank deposits
On September 30, 2011, the balance of bank deposits consists of financial notes issued by banks, totaled US$ 86,590 (December 31, 2010 – US$ 30,176) and all are denominated in Reais.

TAM S.A. Notes to the condensed consolidated interim financial statements (In thousands of Dollar, unless otherwise indicated)
F-33
12. Property, Plant and Equipment
Flight
equipment (i) Land and buildings
Computer equipment
Machinery and equipment
Construction in progress
Pre-delivery
payments (ii) Other (iii) Total
Cost 6,435,163 152,786 91,625 81,547 9,675 285,988 128,519 7,185,303 Accumulated depreciation
(1,753,583) (26,948) (72,581) (41,782) (61,835) (1,956,729)
Net book amount December 31, 2010
4,681,580 125,838 19,044 39,765 9,675 285,988 66,684 5,228,574
Rembursement of pre-
delivery payments (iv)
(67,595) (67,595)
Additions (iv) 375,115 2,010 10,767 2,936 2,212 216,764 5,670 615,474 Transfers 28,715 710 516 215 7,522 (21,364) (5,219) 11,095 (v) Disposals/write-offs (20,490) (10) (152) (2) (749) (21,403) Capitalized interest 6,556 6,556 Other Depreciation (266,337) (2,826) (7,812) (5,403) (8,450) (290,828)
Effect of conversion of functional currency to presentation currency
(491,442) (12,671) (2,280) (3,775) (2,419) (43,822) (5,805) (562,214)
Net book amount September 30, 2011
4,307,141 113,061 20,225 33,586 16,988 376,527 52,131 4,919,659
Cost 6,117,037 139,761 92,317 75,885 16,988 376,526 115,131 6,933,645 Accumulated depreciation
(1,809,896) (26,699) (72,091) (42,298) (63,002) (2,013,986)
Net book amount September 30, 2011
4,307,141 113,062 20,226 33,587 16,988 376,526 52,129 4,919,659

TAM S.A. Notes to the condensed consolidated interim financial statements (In thousands of Dollar, unless otherwise indicated)
F-34
(i) Includes aircraft, engines and spare parts. Aircraft includes aircraft leased under finance leases, in accordance with IAS 17. As of September 30, 2011 TAM has 82 aircraft under finance leases (12.31.2010 – 79 aircraft). During the nine months ended September 30, 2011, the subisidiary TLA received five aircraft classified as under an operating lease.
(ii) Amounts disbursed under the aircraft acquisition program are recorded as advances, since upon the
disbursement the form of lease agreement that will be used is not yet defined. The Company's past experience shows that the refund by manufacturers of prepaid amounts upon the delivery of aircraft acquired under leases is probable.
(iii) Basically furniture and vehicles. (iv) Transfers of pre-delivery payments occur when the aircraft are delivered and amounts are either
returned to TAM or capitalized within flight equipment as “Additions”.
(v) Transfers from items classified as intangible assets to property, plant and equipment. Properties and improvements of TLA are pledged as collateral for loans in the total amount of US$ 59,587 (12.31.2010 – US$ 66,318). Other than aircraft, there are no significant amounts of property, plant and equipment outside of Brazil. Aircraft are based in Brazil but fly both domestically and internationally. The depreciation expense is recorded in the consolidated statements of operations within operating expenses as follows:
Quarter ended Nine months ended
September 30,
2011 September 30,
2010 September 30,
2011 September 30,
2010 (Unaudited) (Unaudited) Cost of services rendered 74,884 78,781 238,558 234,618 Selling expenses 1,135 212 1,552 666 General and administrative expenses 19,255 15,008 50,718 36,164 95,274 94,001 290,828 271,448

TAM S.A. Notes to the condensed consolidated interim financial statements (In thousands of Dollar, unless otherwise indicated)
F-35
13. Intangible Assets
IT Projects (i) Softwares Other
intangibles License – Slots (ii)
Trademarks and patents Goodwill Total
Cost 195,537 35,224 28,618 74,977 101,015 22,964 458,335 Accumulated amortization (41,241) (31,614) (72,855) Net book amount 154,296 3,610 28,618 74,977 101,015 22,964 385,480 At September 30, 2011 17,049 12,155 586 29,790 Additions 90 90 Transfer (6,638) 6,679 (11,136) (11,095) (iii) Amortization (34,561) (7,047) (41,608) Result of conversion of functional currency to presentation currency (12,872) (1,525) (1,453) (7,609) (10,251) (2,331) (36,041) Net book amount 117,274 13,872 16,705 67,368 90,764 20,633 326,616 At September 30, 2011 Cost 184,777 48,470 16,705 67,368 90,764 20,633 428,717 Accumulated amortization (67,503) (34,598) (102,101) Net book amount 117,274 13,872 16,705 67,368 90,764 20,633 326,616

TAM S.A. Notes to the condensed consolidated interim financial statements (In thousands of Dollar, unless otherwise indicated)
F-36
(i) IT projects in progress and computer software are recorded at cost less accumulated amortization and impairment. Expenditure for development of projects and software, including the costs of materials, third-parties’ worked hours and other direct costs, are recognized when it is probable that they will be successful, taking into account their commercial and technological feasibility, and only when their cost can be reliably measured. Such expenses are amortized on the straight-line method over the period of the expected benefits. The anticipated amortization period is five years, depending on the useful life of each project.
(ii) Upon the acquisiton of Pantanal in March 2010, management has identified as a separable
intangible the airport operation rights. The fair value was estimated at US$ 67,368 and the asset is considered to have an indefinite useful life.
(iii) Transfers from items classified as intangible assets to property, plant and equipment.
The amortization expense is recorded in the consolidated statements of operations within operating expenses as follows:
Quarter ended Nine months ended
September 30,
2011 September 30,
2010 September 30,
2011 September 30,
2010 (Unaudited) (Unaudited) Cost of services rendered 14,619 5,930 34,130 19,648 Selling expenses 172 16 223 94 General and administrative 3,509 1,130 7,255 2,993 18,300 7,076 41,608 22,735

TAM S.A. Notes to the condensed consolidated interim financial statements (In thousands of Dollar, unless otherwise indicated)
F-37
14. Financial liabilities The carrying value of financial liabilities, all of which are measured at amortized cost, and their corresponding fair values are shown in the following table: Fair value Carrying value
September
30, 2011 December 31,
2010 September 30,
2011 December 31,
2010 Current
Finance lease obligations 366,262 340,547 366,262 340,547 Senior notes 24,523 15,290 25,937 14,614 Borrowings 430,688 348,891 459,624 360,330 Debentures 157,836 239,830 154,154 228,029
979,309 944,558 1,005,977 943,520
Non-current
Finance lease obligations 2,453,384 2,515,007 2,453,384 2,515,006 Senior notes 1,033,849 618,345 1,086,075 590,990 Borrowings 31,742 8,517 32,277 8,797 Debentures 286,487 376,829 267,498 358,288
3,805,462 3,518,698 3,839,234 3,473,081
14.1 Finance lease obligations
Monthly payments expiring September 30,
2011December 31,
2010
Local currency IT equipment 2012 16,459 12,760 Foreign currency – US$
Aircraft 2022 2,682,150 2,758,444Engines 2017 118,594 81,984Machinery and equipment 2012 2,443 2,364
2,819,646 2,855,552 Current (366,262) (340,547) Non-current 2,453,384 2,515,005
TAM has provided letters of guarantee and deposits in guarantee with respect to finance leases. The minimum payments under finance leases are classified:

TAM S.A. Notes to the condensed consolidated interim financial statements (In thousands of Dollar, unless otherwise indicated)
F-38
September 30,
2011December 31,
2010 No later than one year 423,263 410,519Later than one year and no later than five years 1,459,040 1,452,474Later than five years 1,219,127 1,389,732Effect of discounting (281,784) (397,173) 2,819,646 2,855,552 At September 30, 2011, the Company through its subsidiaries TLA and Mercosur, has 82 aircraft (12.31.2010 – 79 aircraft) under finance leases.
14.2 Senior notes
September 30, 2011
December 31, 2010
TAM Capital, Inc. (i) 305,750 299,712 TAM Capital 2, Inc. (ii) 299,267 305,892 TAM Capital 3, Inc. (iii) 506,995 1,112,012 605,604 Current (25,937) (14,614) Non-current 1,086,075 590,990
(i) On April 25, 2007, TAM Capital Inc. concluded the offering of 3,000 senior notes, with a nominal value of US$ 100 thousand each, in the total amount of US$ 300 million, incurring debt issuance costs of US$ 6.8 million, carrying interest at 7.375% p.a. (resulting in an effective interest rate of 7.70%). Interest is payable semiannually and with principal payable in a bullet payment, in 2017. The notes were issued outside Brazil under an exemption from registration with the Brazilian CVM. The Company registered the notes with the United States Securities and Exchange Commission (“SEC”) on October 30, 2007. (ii) On October 22, 2009, TAM Capital 2 Inc. concluded the offering of 3,000 senior notes, with nominal value of US$ 100 thousand each, in the total amount of US$ 300 million, carrying interest at 9.5% p.a. (resulting in an effective interest rate of 9.75%). The notes were issued outside Brazil under an exemption from registration with the Brazilian CVM and with the SEC. TAM Capital 2 has the option to early redeem the Senior Notes at any time prior to January 29, 2015. In the event of early prepayment, a redemption price must be paid. Management has concluded that the redemption price compensates the lender for loss of interest and, as such the redemption option is considered clearly and closely related to the Senior Notes.
(iii) On June 3, 2011, TAM Capital 3 Inc. concluded the offering of 5,000 senior notes, with nominal value of US$ 100 thousand each, in the total amount of US$ 500 million, incurring debt issuance costs of US$ 6.4 million, carrying interest at 8.375% p.a. (resulting in an effective interest rate of 8.570% p.a.) payable semi-annually from December 2011 with the principal payable in full on June 2021. The notes were issued outside Brazil under an exemption from registration with the Brazilian CVM and with the SEC. TAM Capital 3 has the

TAM S.A. Notes to the condensed consolidated interim financial statements (In thousands of Dollar, unless otherwise indicated)
F-39
option to early redeem the senior notes at any time prior to June 3, 2016. In the event of early prepayment, a redemption price must be paid. Management has concluded that the redemption price compensates the lender for loss of interest and, as such the redemption option is considered clearly and closely related to the Senior Notes.

TAM S.A. Notes to the condensed consolidated interim financial statements (In thousands of Dollar, unless otherwise indicated)
F-40
14.3. Borrowings
(a) Balance composition
Guarantees Interest rate (effective rates for 2011 and 2010)
Payment terms and year of last payment
September 30, 2011
December 31,2010
Local currency
FINEM – Sub credit A (i) Mortgage of assets and accounts
receivable TJLP + 4.5% p.a. (10.5% p,a. and 10.8%p.a.) Monthly until
November, 2011 1,343 8,225
FINEM –Sub credit B (ii) Mortgage of assets and accounts
receivable Basket of currencies BNDES + 3.0% p.a.
(12.2% p.a. and 10.5% p.a.) Monthly until 2012 380 1,216Others Monthly until 2013 1,258 2,184
Foreign currency 2,981 11,625
FINIMP (iii)
Promissory notes from a minimum of US$ 1,111 thousand to a maximum at US$ 18,707 thousand
LIBOR +2.15% p.a. to 5.7% p.a. (4.3% p.a. and 5.3% p.a.)
Annually until June, 2012
378,009 304,233
International Finance Corporation – IFC (Working capital) (iv)
Deposits in guarantee US$ 2,500 thousand
6 months LIBOR + 3% p.a. (3.4% p.a. and 6.6%p.a.) Half-yearly until 2012
2,877 4,364
Leasing renegotiation (v) Letter of guarantee Fixed installments of US$ 55 thousand Monthly until 2022 5,093 5,354
Financing – Pre-delivery payment (vi) Unconditional guarantee
Monthly LIBOR + 0.6% p.a. (0.3% p.a and 2.6% p.a)
Second semester 2011 101,519 41,201
Other (vii) 1,422 2,350
488,920 357,502 491,901 369,127 Current (459,624) (360,330) Non-current 32,277 8,797FINIMP – Import Financing, FINEM – Government agency financing for machinery and equipment, TJLP – Long term interest rate and CDI – Interbank deposit rate.

TAM S.A. Notes of the interim financial statements (In thousands of Dollar, unless otherwise indicated)
F-41
Non-current maturities are as follows:
Year September 30,
2011 December 31,
2011 2012 27,324 3,6162013 690 6412014 467 4182015 443 444After 2015 3,353 3,678 32,277 8,797
(b) Description of the loans and financings:
(i) Loan obtained in order to finance the investment plan of 2004 and 2005 focused on expanding the
São Carlos technology center, the acquisition of equipment and materials made in Brazil, the development of software technical and managerial training and environmental projects.
(ii) TAM signed financing agreements for the acquisition of machines and equipment. The transaction
was entered into in 2006, with Itaú Unibanco. (iii) TAM obtained loans of the FINIMP-type, to finance imports of aircraft parts. Among currently
active transactions, loans from banks Safra, Banco do Brasil and Itaú BBA have maturities through June 2012.
(iv) On December 16, 2005, TLA entered into a loan agreement with the International Finance
Corporation (IFC) to finance up to US$ 33 million of PDP (pre-delivery payment) for Airbus aircraft.
(v) Debt resulting from, renegotiation of a contact for airplanes and parts TAM and Fokker Aircraft BV entered into in June 25, 1982.
(vi) TLA and TAM Financial 3, entered in 2011, into a loan agreement of loan with Natixis and Crédit
Agricole to finance up to US$ 100.0 million of PDP (pre-delivery payment) with respect to Airbus aircraft.
(vii) Contract for acquisition of IT equipment software and related services.

TAM S.A. Notes of the interim financial statements (In thousands of Dollar, unless otherwise indicated)
F-42
14.4 Debentures
September 30, 2011
December 31, 2010
TAM S.A. (i) 91,577 208,739 TAM Linhas Aéreas S.A. (ii) 330,075 377,578 421,652 586,317 Current (154,154) (228,029) Non-current 267,498 358,288
Non-current maturities are as follows:
Year September 30,
2011 December 31,
2010 2012 58,872 2013 53,375 59,349 2014 53,485 60,017 2015 53,485 60,017 After 2015 107,153 120,033 267,498 358,288
(i) TAM S.A. On July 7, 2006 the Board of Directors approved the issuance for public distribution of simple, nonconvertible and unsecured debentures, with no preference but with a guarantee provided by the subsidiary TLA. On August 1, 2006, TAM S.A. concluded the offering of 50,000 simple debentures in a single series, with a nominal value of R$ 10 each, totaling an amount of R$ 500,000, incurring debt issue costs of US$ 870. The debentures expire in six (6) years. Principal is repayable in 3 annual payments, the first installment was paid on August 1, 2010. Interest is payable on a semiannual basis, at a rate equivalent to 104.5% of the CDI (effective interest rate at the date of issuance of 15.38%) calculated and published by CETIP (the custodian and liquidation agent). At September 30, 2011 the effective interest rate was 12.00% (12.31.2010 – 10.19%). The debenture indenture provides for the compliance with certain covenants based on financial ratios calculated based on Brazilian accounting practices in effect up to 2007. With the application of the new accounting practices defined by IFRS, especially the one that requires the recognition in the Company's financial statements of finance lease agreements, the coverage ratio of the company's debt has increased. It should be noted that at December 31, 2010 this ratio has exceeded the limit agreed. As a result the debentures were subject to be declared matured early although this was not automatic and it required to be approved at a General Meeting of debenture holders.
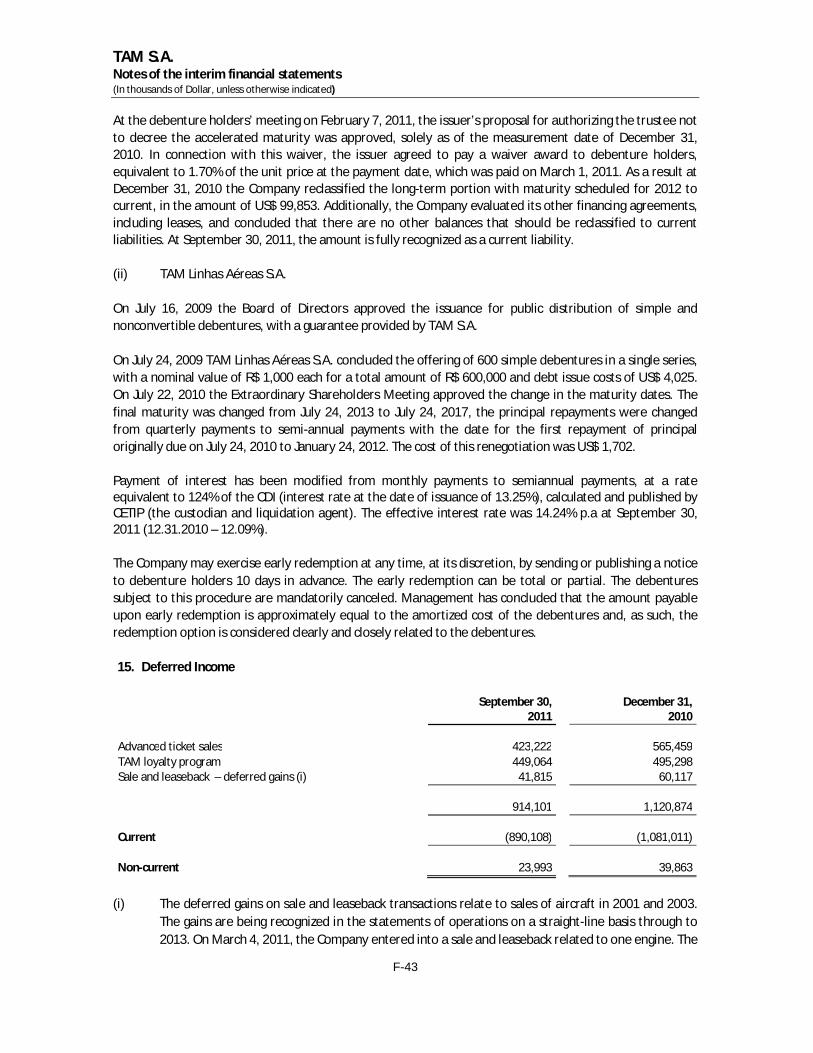
TAM S.A. Notes of the interim financial statements (In thousands of Dollar, unless otherwise indicated)
F-43
At the debenture holders’ meeting on February 7, 2011, the issuer’s proposal for authorizing the trustee not to decree the accelerated maturity was approved, solely as of the measurement date of December 31, 2010. In connection with this waiver, the issuer agreed to pay a waiver award to debenture holders, equivalent to 1.70% of the unit price at the payment date, which was paid on March 1, 2011. As a result at December 31, 2010 the Company reclassified the long-term portion with maturity scheduled for 2012 to current, in the amount of US$ 99,853. Additionally, the Company evaluated its other financing agreements, including leases, and concluded that there are no other balances that should be reclassified to current liabilities. At September 30, 2011, the amount is fully recognized as a current liability.
(ii) TAM Linhas Aéreas S.A. On July 16, 2009 the Board of Directors approved the issuance for public distribution of simple and nonconvertible debentures, with a guarantee provided by TAM S.A. On July 24, 2009 TAM Linhas Aéreas S.A. concluded the offering of 600 simple debentures in a single series, with a nominal value of R$ 1,000 each for a total amount of R$ 600,000 and debt issue costs of US$ 4,025. On July 22, 2010 the Extraordinary Shareholders Meeting approved the change in the maturity dates. The final maturity was changed from July 24, 2013 to July 24, 2017, the principal repayments were changed from quarterly payments to semi-annual payments with the date for the first repayment of principal originally due on July 24, 2010 to January 24, 2012. The cost of this renegotiation was US$ 1,702. Payment of interest has been modified from monthly payments to semiannual payments, at a rate equivalent to 124% of the CDI (interest rate at the date of issuance of 13.25%), calculated and published by CETIP (the custodian and liquidation agent). The effective interest rate was 14.24% p.a at September 30, 2011 (12.31.2010 – 12.09%). The Company may exercise early redemption at any time, at its discretion, by sending or publishing a notice to debenture holders 10 days in advance. The early redemption can be total or partial. The debentures subject to this procedure are mandatorily canceled. Management has concluded that the amount payable upon early redemption is approximately equal to the amortized cost of the debentures and, as such, the redemption option is considered clearly and closely related to the debentures. 15. Deferred Income
September 30,
2011 December 31,
2010 Advanced ticket sales 423,222 565,459 TAM loyalty program 449,064 495,298 Sale and leaseback – deferred gains (i) 41,815 60,117 914,101 1,120,874 Current (890,108) (1,081,011) Non-current 23,993 39,863
(i) The deferred gains on sale and leaseback transactions relate to sales of aircraft in 2001 and 2003.
The gains are being recognized in the statements of operations on a straight-line basis through to 2013. On March 4, 2011, the Company entered into a sale and leaseback related to one engine. The

TAM S.A. Notes of the interim financial statements (In thousands of Dollar, unless otherwise indicated)
F-44
gain from this transaction was US$ 2,706 and is being amortized on a straight-line basis through to 2015.
16. Refinanced taxes payable under Fiscal Recovery Program (REFIS)
In November 2009, TLA and Pantanal applied to the Fiscal Recovery Programa (REFIS), established by Law n° 11,941/09 and Provisional Measure, n° 449/2009. REFIS has the purpose of allowing to settle tax debt through a special mechanism for paying and refinancing tax and social security liabilities. The general conditions of the effects to applying to REFIS are summarized below:
Payment will be made in 180 monthly installments depending on the nature of the debt; Reduction of penalties and interest; Obligation to make the monthly payments and not become overdue more than three months;
and Withdraw all lawsuits the participant has initiated with respect to the taxes included in REFIS. If
thouse commitments are not honored the Company will be excluded from the REFIS and a new tax debt will be determined based on the amounts originally due.
During the six months ended June 30, 2011 the tax authorities concluded the final processing of the REFIS application and the total amounts of the debt under REFIS consists of the following:
Original amount Penalties Interest Fees Total
Cofins (i) 104,493 3,961 72,207 180,661 Pis (i) 20,115 1,469 21,873 43,457 Refinanced taxes payable under
Fiscal Recovery Program from Pantanal (ii)
10,901 1,031 13,417 1,670 27,019 Other 8,345 431 3,296 12,072 143,854 6,892 110,793 1,670 263,209 (i) Refers to the increase in the tax base of the PIS tax and the increase in the contribution and basis of calculation of COFINS tax, established by Law n° 9,718/98. In accordance with the requirements of the REFIS the Company has already filed a dismissal of the lawsuits it had begun challenging the unconstitutionality of such increases. (ii) Refers to the remaining balance of previous tax refinancing program of Pantanal with respect to years 2000 to 2006 As a result of the final processing of the debt by the tax authorities on June 30, 2011, the total amount of the debt corresponds to a single tax debt irrespective of the tax or contribution that had originally generated the tax liability. The status of the total amount due is as follows:

TAM S.A. Notes of the interim financial statements (In thousands of Dollar, unless otherwise indicated)
F-45
September 30,
2011 Consolidated debt 237,180 Consolidated debt adjusment 6,315 Index 21,207 Payments made (9,342) Balance at September 30, 2011 255,360 Currrent (*) (25,852) Non-current 229,508 (*) The amount is recorded under “Taxes, charges and contributuion” in current liabilities. The total consolidated debt under REFIS classified as non-current has the following maturities:
Year US$
2012 6,282 2013 19,588 2014 18,822 2015 18,822 2016 18,822 2017 18,822 2018 18,822 2019 18,822 2020 18,822 2021 18,822 2022 18,822 2023 18,822 2024 15,418
Total 229,508
17. Other Liabilities
September 30,
2011 December 31,
2010 Reorganization of Fokker 100 Fleet (i) 31 8,318 Maintenance provision – “Power by the hour” 262,258 151,563 Other liabilities 45,142 64,061 307,431 223,942 Current (87,760) (81,419) Non-current 219,671 142,523
(i) Pursuant to the agreement to return the Fokker 100 fleet, on December 19, 2003 TLA cancelled 19

TAM S.A. Notes of the interim financial statements (In thousands of Dollar, unless otherwise indicated)
F-46
lease agreements then outstanding, of which ten were finance leases and nine were operating leases. As a result, TLA agreed to pay a contractual rescission penalty in 30 consecutive quarterly installments, between April 2004 and July 2011 for an original amount of US$ 32,170. This amount was recognized in the statement of operations in the year ended December 31, 2003. The Company issued letters of guarantee as Security. TLA also renegotiated the rescheduled overdue installments for an original amount of US$ 26,747.
18. Provisions
(a) Changes in the reserve for contingencies Management of the Company and its subsidiaries recorded provisions for contingencies in all cases where loss by the Company is deemed probable based on advice provided by the Company’s internal and external legal counsel. As at September 30, 2011 the amount of provisions and the corresponding judicial deposits recognized were as follows:
December 31, 2010
Additional Provisions (Deposits) Payments
Financial charges
Result of conversion
of functional currency to
presentation currency
September 30, 2011
Airline staff fund (i) 104,565 15,961 7,232 (13,392) 114,366 Labor contingencies 12,562 1,917 (150) (1,540) 12,789 Civil litigation 51,777 3,976 (5,832) 49,921 Other tax contingencies
28,886 9,203 546 (4,084) 34,551
Total 197,790 31,057 (150) 7,778 (24,848) 211,627 (-)Judicial deposits (75,193) (12,440) 11 8,939 (78,683) Total 122,597 18,617 (139) 7,778 (15,909) 132,944
(i) Corresponds to the collection of 2.5% on the monthly payroll for private social welfare and
professional training entities. TLA management, based on the opinion of its external legal counsel, is contesting the constitutionality of this collection, and the non-payment is supported by a judicial order.
(b) Possible contingencies
The Company and its subsidiaries are also parties to tax, labor and civil lawsuits, involving risks of loss that management, based on the assessment made by its legal counsel, classified as possible and, therefore, no provision a was required. The estimated amounts are as follows:

TAM S.A. Notes of the interim financial statements (In thousands of Dollar, unless otherwise indicated)
F-47
September 30,
2011 December 31,
2010 Tax contingencies ICMS (State Value Added Tax) 222,862 230,089 IRPJ and CSLL (Income taxes) 81,860 81,752
Special customs regime for temporary 55,352 61,574 Others (i) 572,186 80,438 932,260 453,853 Civil litigation 29,025 18,552 Labor contingencies 203,812 189,944 1,165,097 662,349 (i) The increase relates to the following tax assessments: (a) Administrative process (n. 10314.720023/2011-15) resulting from a tax asessment through which
the tax inspector requires payment of Tax on Industrialized Products (Imposto sobre Produto Industrializado - IPI) on import of aircrafts from April 2006 through February 2009. The tax authorities claim that IPI exemption depends on certain requirements being met including proving that the entity is in full compliance with its tax obligations a requirement allegedly not met by TAM considering that for certain periods the following certicates allegedly were not presented: Compliance Certificate of FGTS, Joint Certificate of Tax Debts and of Federal Outstanding Debits (either a certificate indicating non-existence of debt - negative - or a certificate indicating debts but with same effects of a negative certificate) in certain periods.
(b) Administrative processes (AI 10314.720018/2011-75) resulting from a tax asessment through
which the tax inspector requires payment of Tax on Industrialized Products (Imposto sobre Produto Industrializado - IPI), payment of IPI on imports and COFINS on imports on the import of spare parts for aircrafts to be used for repais, checks and maintenance of aircrafts from June 2006 through July 2010. The tax authorities claim that IPI exemption and taxation at zero rate for IPI and COFINS on imports depends on certain requirements being met including proving that the entity is in full compliance with its tax obligations a requirement allegedly not met by TAM considering that for certain periods the following certicates allegedly were not presented: Compliance Certificate of FGTS, Joint Certificate of Tax Debts and of Federal Outstanding Debits (either a certificate indicating non-existence of debt - negative - or a certificate indicating debts but with same effects of a negative certificate) in certain periods.
Those assesments amounted to US$ 441,797 of which US$ 415,580 corresponds to IPI on aircrafts. TAM has presented defense to the processes and tax advisors estimate that the probability of sucess is possible in both cases. 19. Deferred Income Tax and Social Contribution Deferred income tax and social contribution assets and liabilities are offset when there is a legal right of offsetting tax credits against taxes payable and provided that they refer to the same tax authority. The movement in deferred income tax and social contribution assets and liabilities during the period ended September 30, 2011, without taking into consideration the offsetting of balances within the same tax jurisdiction, is as follows:

TAM S.A. Notes of the interim financial statements (In thousands of Dollar, unless otherwise indicated)
F-48
Deferred income tax and social contribution asset
December 31, 2010
Charged/(credited) to the statements of
operations
Result of conversion of functional
currency to presentation
currency
June 30, 2011
Charged/(credited) to the statements of
operations
Result of conversion of functional
currency to presentation
currency
September 30, 2011
Income tax loss carry forwards 37,383 6,475 2,793 46,651 (5,817) (6,692) 34,142 Social contribution carry forwards 13,533 3,719 1,065 18,317 (2,837) (2,563) 12,917 Temporary differences: Provision for derivatives loss / gains
3,659 (7,485) (472)
(4,298) 31,519 (3,037)
24,184 Provision for contingencies 56,421 10,319 4,263 71,003 2,422 (11,515) 61,910 Allowance for losses on
inventories and receivables accounts
23,506 (149) 1,539
24,896 265 (3,969)
21,192 Deferred income from sale
leaseback transaction
16,992 (2,410) 1,060
15,642 (1,717) (2,272)
11,653 TAM loyalty program 39,616 (30,657) 1,219 10,178 (4,328) (1,100) 4,750 Finance leases (259,804) (37,681) (18,486) (315,971) 158,791 31,246 (125,934)
Other 29,285 (12,630) 1,029 17,684 4,087 (3,279) 18,492
Sub-total
(39,409) (70,499) (5,990)
(115,898) 182,385 (3,181)
63,306 Property, plant and equipment (27,316) 283 (1,830) (28,863) 121 4,551 (24,191)
Sub-total
(66,725) (70,216) (7,820)
(144,761) 182,506 1,370
39,115 Deferred income tax and social
contribution liability on intangible assets on acquisition of Pantanal
(22,964) 1,022 (2,568)
(24,510) 3,877
(20,633)
Total deferred income tax and social contribution
(89,689) (69,194) (10,388)
(169,271) 182,506 5,247
18,482

TAM S.A. Notes of the interim financial statements (In thousands of Dollar, unless otherwise indicated)
(*) See Note 3 F-49
December 31,
2010September 30,
2011 Deferred income tax and social contribution expected to be recovered
within 12 months - Net (39,439) 37,596Deferred income tax and social contribution expected to be recovered
within more than 12 months – Net (50,250) (19,114) (89,689) 18,482 Deferred tax assets resulting from income tax and social contribution losses and temporary differences are recognized to the extent that the realization of the related tax benefit through the future taxable profits is probable. Tax loss carryforwards in Brazil do not expire. At September 30, 2011, there were unrecognized deferred tax assets relating to the tax losses of foreign subsidiaries in the amount of US$ 77,765 (12.31.2010 – US$ 39,721). (a) Income tax and social contribution expense Quarter ended Nine months ended
September 30,
2011 September 30,
2010 September 30,
2011 September 30,
2010 (Adjusted (*)) (Adjusted (*)) (Unaudited) (Unaudited)Current tax (46,596) (26,179) (97,455) (33,819)Deferred tax 182,506 (198,230) 113,312 (152,627) 135,910 (224,409) 15,857 (186,446) The tax on TAM's profit before taxes differs from the theoretical amount that would arise using the tax rate applicable to TAM, TLA and its Brazilian subsidiaries as follows:

TAM S.A. Notes of the interim financial statements (In thousands of Dollar, unless otherwise indicated)
(*) See Note 3 F-50
Quarter ended Nine months ended
September 30,
2011 September 30,
2010 September 30,
2011 September 30,
2010 (Adjusted(*)) (Adjusted(*)) (Unaudited) (Unaudited) Profit / (loss) before income tax and
social contribution
(506,494) 650,442 (246,400) 479,751 Tax calculated at Brazilian tax rates applicable to profits
34% 34% 34% 34%
Taxes calculated at statutory rates 172,208 (221,150) 83,776 (163,115) Tax effects of permanent (additions)
deductions:
Non deductible expenses (9,492) (3,847) (18,892) (12,361) Tax credit on interest paid on own
capital
790 5,511 Unrecognized deferred tax assets
on tax losses
(2,674) (727) (13,567) (1,553) Unrecognized tax deferred tax
assets on profits earned abroad
(26,498) (168) (32,390) (11,461) Share-based compensation 6,672 (79) 4,536 (2,974) Other (4,306) 772 (7,606) (493)
Income tax and social contribution
tax charge (credit)
135,910 (224,409) 15,857 (186,446)
Effective rate % 26.8 34.5 6.4 38.8
The years from 2005 to 2010 are open to review by Brazilian tax authorities. (b) Transitional Tax Regime - RTT
The Transitional Tax Regime has been established by Law 11638/07 in order to maintain the same tax rules for determining taxable income irrespective of any changes introduced to accounting practices adopted in Brazil.
20. Share Capital
(a) Authorized capital At September 30, 2011 the authorized capital was R$ 1,200,000 (12.31.2010 – R$ 1,200,000) and can be increased by means of the issuance of common and preferred shares, as resolved by the Board of Directors. On October 7, 2011, the Company, in compliance to the Instructions of the Brazilian Securities and Exchanges Commission (“CVM”) numbers 358/02 and 10/80, the Company announced that the Board of Director, in meeting held on September 30, 2011, authorized the share buyback program of preferred shares of the Company, under the following conditions:
Purpose: acquisition of preferred shares issued by the Company to be maintained in treasury and subsequently cancelled or sold without reduction in capital stock.
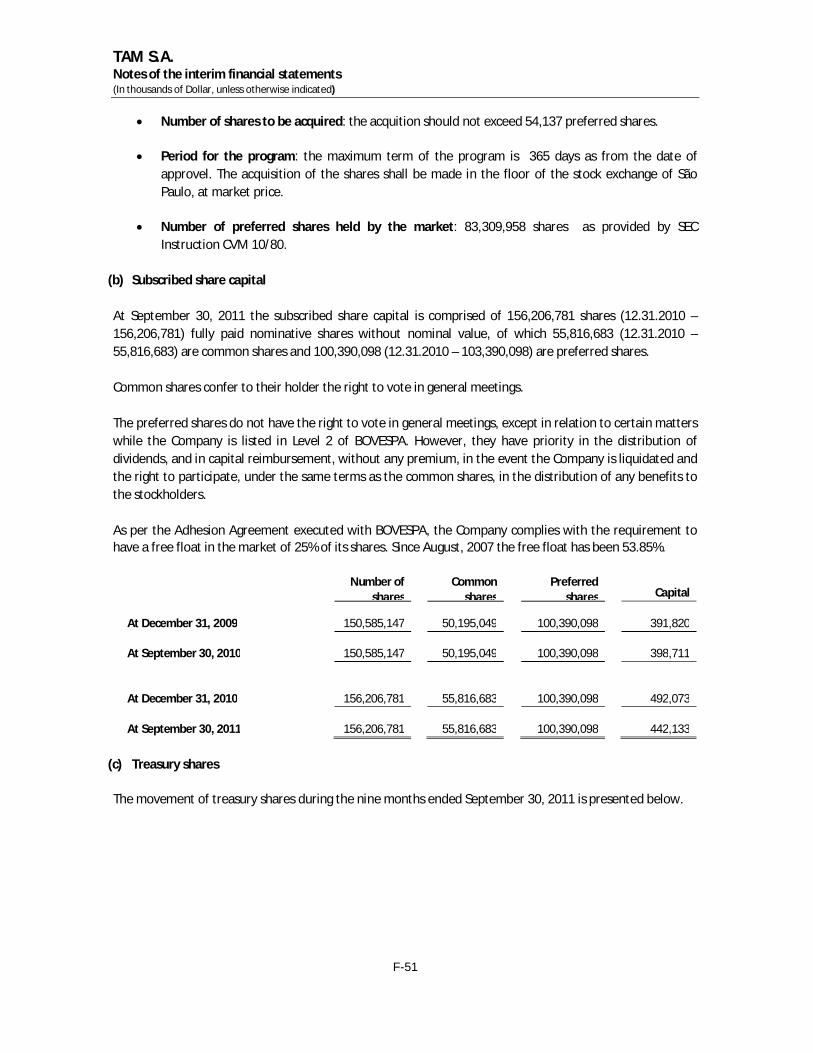
TAM S.A. Notes of the interim financial statements (In thousands of Dollar, unless otherwise indicated)
F-51
Number of shares to be acquired: the acquition should not exceed 54,137 preferred shares.
Period for the program: the maximum term of the program is 365 days as from the date of approvel. The acquisition of the shares shall be made in the floor of the stock exchange of São Paulo, at market price.
Number of preferred shares held by the market: 83,309,958 shares as provided by SEC Instruction CVM 10/80.
(b) Subscribed share capital At September 30, 2011 the subscribed share capital is comprised of 156,206,781 shares (12.31.2010 – 156,206,781) fully paid nominative shares without nominal value, of which 55,816,683 (12.31.2010 – 55,816,683) are common shares and 100,390,098 (12.31.2010 – 103,390,098) are preferred shares. Common shares confer to their holder the right to vote in general meetings. The preferred shares do not have the right to vote in general meetings, except in relation to certain matters while the Company is listed in Level 2 of BOVESPA. However, they have priority in the distribution of dividends, and in capital reimbursement, without any premium, in the event the Company is liquidated and the right to participate, under the same terms as the common shares, in the distribution of any benefits to the stockholders. As per the Adhesion Agreement executed with BOVESPA, the Company complies with the requirement to have a free float in the market of 25% of its shares. Since August, 2007 the free float has been 53.85%.
Number of
shares Common
shares Preferred
shares Capital At December 31, 2009 150,585,147 50,195,049 100,390,098 391,820 At September 30, 2010 150,585,147 50,195,049 100,390,098 398,711 At December 31, 2010 156,206,781 55,816,683 100,390,098 492,073 At September 30, 2011 156,206,781 55,816,683 100,390,098 442,133
(c) Treasury shares The movement of treasury shares during the nine months ended September 30, 2011 is presented below.

TAM S.A. Notes of the interim financial statements (In thousands of Dollar, unless otherwise indicated)
F-52
Quantity of shares Thousand of US$
Average price per share - American
dollars At December 31, 2010 212,580 (3,606) 17.00 Resale of treasury shares (170,567) 2,896 17.00 Result of conversion of functional currency to presentation currency 70 At September 30, 2011 42,013 (640) 17.00
During the nine months ended September 30, 2011, 170,567 shares held in treasury were sold to beneficiaries of the stock option plan. The shares sold relate to the executive compensation plan approved at the Extraordinary General Meeting (AGE) of May 16, 2005. The market value of shares based on the closing quote in the São Paulo stock exchange at September 30, 2011, is US$ 15.64 (12.31.2010 – US$ 23.49). (d) Reduction of capital of Multiplus On March 18, 2011, Multiplus approved a capital reduction from US$ 414,106 to US$ 55,246, resulting in a reduction of US$ 358,859, equivalent to US$ 2.22 per share without the cancellation of any shares and without any change in the percentage of interest held by the shareholders of Multipls. The distribution process to was finalized on June 22, 2011 when cash was distributed to shareholder. Out of the total cash distribution TAM received US$ 257,465 and the non-controlling shareholder received US$ 101,394. (e) Payment of dividends On April 2011, the Company paid dividends corresponding to the balance of retained earnings at the end of 2010 totalling the amount of US$ 113.679. 21. Other reserves
September 30,
2011 December 31,
2010
Share Premium 40,415 44,980 Treasury shares (640) (3,606) Stock option plan 34,441 31,009 Legal reserve 43,683 48,617 Profit retention 422,127 488,889 Cummulative translation adjustment (7,854) (10,361) Cash flow hedge reserve (10,744) Deemed cost reserve 60,821 68,402 Transfer from non-controlling interest 263,759 293,551 846,008 961,481

TAM S.A. Notes of the interim financial statements (In thousands of Dollar, unless otherwise indicated)
F-53
22. Revenue
TAM had no major customers which represented more than 10% of revenue in any of the periods presented. The Company utilizes its gross revenue information by type of service rendered and by region, as follows:

TAM S.A. Notes of the interim financial statements (In thousands of Dollar, unless otherwise indicated)
F-54
(a) By type of service rendered
Quarter ended Nine months ended
September
30, 2011
%
September
30, 2010 %
Period – Variation
(%) September
30, 2011
%
September 30,
2010 %
Period – Variation
(%) (Unaudited) (Unaudited)
Domestic Passenger 954,184 45.1 837,636 48.6 13.9 2,782,714 46.3 2,409,984 50.8 15.5 Cargo 85,903 4.1 73,352 4.3 17.1 244,386 4.1 208,451 4.4 17.2 1,040,087 49.2 910,988 52.9 14.2 3,027,100 50.4 2,618,435 55.2 15.6
International Passenger 626,774 29.6 516,283 30.0 21.4 1,685,698 28.0 1,377,822 29.0 22.3 Cargo 94,109 4.4 84,481 4.9 11.4 274,620 4.6 250,396 5.3 9.7 720,883 34.1 600,764 34.9 20.0 1,960,318 32.6 1,628,218 34.3 20.4
Other Loyalty Program (TAM)
12,078
0.6
60,807 3.5 (80.1) 122,283
2.0
195,901 4.1 (37.6)
Loyalty Program (Multiplus)
180,932
8.6
110,560 6.4 63.7 483,668
8.1
149,169 3.1 224.2
Travel and tourism agencies
12,126
0.6
8,189 0.5 48.1 34,011
0.6
23,448 0.5 45.0
Others (includes expired tickets)
149,033
7.0
31,497 1.8 373.2 378,620
6.3
132,768 2.8 185.2
354,169 16.7 211,053 12.3 67.8 1,018,582 17.0 501,286 10.5 103.2
Total gross 2,115,139 100.0 1,722,805 100.0 22.8 6,006,000 100.0 4,747,939 100.0 26.5
Sales taxes and other deductions
(85,738)
(43,270) (239,057)
(165,352)
Revenue 2,029,401 1,679,535 5,766,943 4,582,587

TAM S.A. Notes of the interim financial statements (In thousands of Dollar, unless otherwise indicated)
F-55
(b) By geographic location of the Company’s destinations
Quarter ended Nine months ended
September
30, 2011 % September
30, 2010 % Variation
(%) September
30, 2011 % September
30, 2010 % Variation
(%) (Unaudited) (Unaudited) Brazil 1,394,256 65.9 1,443,710 83.8 (3.4) 4,045,681 67.4 4,036,366 85.0 0.2 Europe 352,778 16.7 144,716 8.4 143.8 940,326 15.7 350,370 7.4 168.4 North America 249,700 11.8 89,586 5.2 178.7 666,972 11.1 249,876 5.3 166.9 South America (excluding Brazil) 118,405 5.6 44,793 2.6 164.3 353,021 5.8 111,327 2.3 217.1 Total gross 2,115,139 100.0 1,722,805 100.0 22.8 6,006,000 100.0 4,747,939 100.0 27.0 Sales taxes and other
deductions (85,738) (43,270) (239,057) (165,352) Revenue 2,029,401 1,679,535 5,766,943 4,582,587

TAM S.A. Notes of the interim financial statements (In thousands of Dollar, unless otherwise indicated)
F-56
(c) Seasonality
The following table presents our revenue in the first, second and third quarter of 2011 and 2010 as a percentage of annual revenue for the year ended December 31, 2010.
% of 2010 net revenue
2011 2010 (Unaudited)
First quarter 26.7 22.9
Second quarter 26.8 23.0
Third quarter 29.2 28.8

TAM S.A. Notes of the interim financial statements (In thousands of Dollar, unless otherwise indicated)
F-57
23. Costs and operating expenses by nature (a) Quarter ended September 30:
2011
Cost of services
rendered Sales General and
administrative Total % Personnel 341,725 29,251 36,227 407,203 24.1 Director’s fees 312 312 0.0 Fuel 497,857 497,857 29.4 Depreciation and amortization 89,503 1,307 22,764 113,574 6.7 Maintenance and repairs (excluding personnel) 89,747 89,747 5.3 Aircraft insurance 7,274 7,274 0.4 Take-off, landing and navigation aid charges 112,142 112,142 6.6 Leasing of aircraft, engines and equipment under operating leases 64,911 1,589 2,742 69,242 4.1 Third party services 32,737 44,424 50,809 127,970 7.6 Marketing and related expenses 121,387 121,387 8.2 Other 47,075 59,809 37,519 144,403 7.6 1,282,971 257,767 150,373 1,691,111 100.0

TAM S.A. Notes of the interim financial statements (In thousands of Dollar, unless otherwise indicated)
F-58
2010
Cost of services
rendered Sales General and
administrative Total % (Adjusted )(Unaudited) Personnel 264,513 38,346 25,873 328,732 25.5 Director’s fees 1,092 1,092 0.0 Fuel 500,132 500,132 38.8 Depreciation and amortization 84,711 228 16,138 101,077 7.8 Maintenance and repairs (excluding personnel) 75,908 75,908 5.9 Aircraft insurance 7,478 7,478 0.6 Take-off, landing and navigation aid charges 85,934 85,934 6.7 Leasing of aircraft, engines and equipment under operating leases 63,419 1,263 2,594 67,276 5.2 Third party services 24,641 36,447 49,536 110,624 8.6 Marketing and related expenses 132,345 132,345 10.3 Reversal of additional tariff (208,515) (208,515) (16.2) Other 64,113 15,886 8,494 88,493 6.8 1,170,849 224,515 (104,789) 1,290,575 100.0

TAM S.A. Notes of the interim financial statements (In thousands of Dollar, unless otherwise indicated)
F-59
(b) Nine months ended September 30: 2011
Cost of services
rendered Sales General and
administrative Total % Personnel 1,016,983 103,368 110,639 1,230,990 23.0 Director’s fees 783 783 0.0 Fuel 1,811,924 1,811,924 33.9 Depreciation and amortization 272,688 1,775 57,974 332,437 6.2 Maintenance and repairs (excluding personnel) 281,851 281,851 5.3 Aircraft insurance 22,368 22,368 0.4 Take-off, landing and navigation aid charges 307,779 307,779 5.7 Leasing of aircraft, engines and equipment under operating leases 184,688 4,518 9,437 198,643 3.7 Third party services 93,802 139,130 147,956 380,888 7.1 Marketing and related expenses 414,104 414,104 7.8 Other 178,304 104,532 88,186 371,022 6.9 4,170,387 767,427 414,975 5,352,789 100.0

TAM S.A. Notes of the interim financial statements (In thousands of Dollar, unless otherwise indicated)
F-60
2010
Cost of services
rendered Sales General and
administrative Total % (Adjusted)(Unaudited) Personnel 754,680 92,665 76,294 923,639 22.3 Director’s fees 3,432 3,432 0.1 Fuel 1,414,093 1,414,093 34.1 Depreciation and amortization 254,336 691 39,156 294,183 7.1 Maintenance and repairs (excluding personnel) 257,544 257,544 6.2 Aircraft insurance 22,128 22,128 0.5 Take-off, landing and navigation aid charges 245,412 245,412 5.9 Leasing of aircraft, engines and equipment under operating leases 190,884 3,771 6,585 201,240 4.8 Third party services 66,694 107,920 152,212 326,826 7.9 Marketing and related expenses 376,142 376,142 9.1 Reversal of additional tariff (208,515) (208,515) (5.0) Other 150,374 72,057 71,626 294,057 7.2 3,356,850 653,246 140,789 4,150,180 100.0

TAM S.A. Notes of the interim financial statements (In thousands of Dollar, unless otherwise indicated)
F-61
24. Employee Benefits Personnel costs (presented under Personnel and Director fees in Note 23) are composed of the following amounts:
Quarter ended Nine months ended
September 30,
2011 September 30,
2010 September 30,
2011 September 30,
2010 (Unaudited) (Unaudited)Salaries and bonuses 319,855 262,448 1,009,828 761,670 Defined contribution pension plan 5,131 3,942 15,210 11,098 Share based payment 2,445 235 8,725 6,450 Taxes and social contributions 80,084 63,199 198,010 147,853 407,515 329,824 1,231,773 927,071 24.1 Share-based payment (a) TAM Linhas Aéreas The Extraordinary Stockholders’ Meeting held on October 4, 2010 authorized that the Board of Directors may grant stock options to employees up to 3% of outstanding shares. These transactions can be summarized as follows:
Number of stock
options outstanding Weighted average
exercise price - US$ At January 1, 2010 1,667,440 21.20 Granted 1,051,467 13.71Exercised (165,868) 8.23Forfeited
(343,924) 22.67 At September 30, 2010 2,209,115 67.65 At January 1, 2011 2,209,115 22.27Exercised (170,567)Forfeited
(167,930) 12.33 34.12At September 30, 2011 1,870,618 Under the terms of the Plan, the options granted are divided into three equal amounts and employees may exercise one third of their options after three, four and five years, respectively, if still employed by the Company at that time. The options have a contractual term of seven years. The options contain a "service condition" as vesting and exercisability of the options depends only on the rendering of a defined period of services by the employee. Dismissed employees have the obligation to satisfy certain conditions in order to maintain their options rights. The options are valued using the Black-Scholes option pricing model. The following table shows details of the various option grants, together with

TAM S.A. Notes of the interim financial statements (In thousands of Dollar, unless otherwise indicated)
F-62
the variables used in valuing the options granted:

TAM S.A. Notes of the interim financial statements (In thousands of Dollar, unless otherwise indicated)
F-63
1st grant 2nd grant 3rd grant 4th grant1st special
grant 2nd special
Grant (ii)3rd special
grant4th special
grant
Total or weigthed
average Date 12/28/2005 11/30/2006 12/14/2007 05/28/2010 09/27/2007 02/29/2008 04/01/2010 11/03/2010Number of options granted 715,255 239,750 780,311 591,463 230,000 11,595 230,000 230,000Exercise price at grant date – US$ 6.13 20.07 22.09 13.77 20.84 17.96 14.26 12.12Risk free interest rate - % 17.93% 13.13% 10.95% 9.38% 10.82% 10.82% 8.34% 10.69%Average term 5.5 5.5 5.5 5.5 4.5 4.5 4.5 4.5Expected dividend yield - % 0.00% 0.32% 0.58% 0.55% 0.58% 0.56% 0.55% 0.55%Share price volatility - % 34.24% 41.29% 42.30% 51.47% 40.48% 43.66% 51.32% 52.14%Market share price – US$ 19.16 28.15 24.52 13.33 27.21 21.08 17.58 24.75Fair value at grant date – US$ 16.88 18.97 13.97 7.44 15.36 11.48 10.41 17.66 Number of options outstanding (i) 96,151 142,743 455,751 485,973 230,000 230,000 230,000 1,870,618Number of options exercisable (i) 96,151 96,728 118,296 230,000 541,175Exercise price (adjusted by IGP-M) (i) 10.87 31.95 27.24 15.16 27.15 11.75 12.25Remaining average term (i) 0.00 0.60 1.70 4.14 0.00 2.98 3.64 (i) At September 30, 2011. (ii) Special grant forfeited. Share price volatility is determined based on historical share price volatility of the company's quoted shares.

TAM S.A. Notes of the interim financial statements (In thousands of Dollar, unless otherwise indicated)
F-64
(b) Multiplus The Extraordinary Stockholders’ Meeting held on October 4, 2010 authorized that the Board of Directors may grant stock options to employees up to 3% of outstanding shares. These transactions can be summarized as follows:
Number of stock options outstanding
Weighted average exercise price - US$
At December 31, 2009 Options granted 1,660,759 10.33 At December 31, 2010 1,660,759 10.67 Forfeited (6,196) 18.22 At September 30, 2011 1,654,563 8.02
Under the plan, options assigned for regular grants are divided into three equal parts and employees can exercise one third of their options of two, three and four years, respectively if they are still employed by the Company at that time. The contractual life of the options is seven years afer the grant of option. The 1st extraordinary grant was divided into two equal parts that can be exercised as follows: half of the options after three years, and another half after four years. The 2nd extraordinary grant was also divided into two equal parts that can be exercised after one year and two years, respectively. The options contain a "service condition" as vesting and exercisability of the options depends only on the rendering of a defined period of services by the employee. Dismissed employees have the obligation to satisfy certain conditions in order to maintain their options rights. In the first semester, the Company fixed the exercise price of R$ 20.00 (twenty reais) per share, for the extraordinary grant related to the hiring of the current Chief Executive Officer of Multiplus and on June 30, 2011 approved the reduction in the exercise price by R$ 3.72 (three reais and seventy-two cents per share), due to the reduction of the Company’s capital. The modification of the options granted as result of the reduction in the exercise price resulted in additional compensation. Considering that no options were vested as of June 30, 2011 the additional compensation will be recognized prospectively through the vestion period of the options. The options are valued using the Black-Scholes option pricing model. The following table shows details of the various option grants, together with the variables used in valuing the options granted. The exercise price is adjusted by the IGP-M (General Price Index), from the award grant date up to the exercise date:

TAM S.A. Notes of the interim financial statements (In thousands of Dollar, unless otherwise indicated)
F-65
(b.1) Assumptions used to estimate the fair value of the options at the original grant date:
1st grant 2nd grant
1st extraordinary
grantª
2nd extraordinary
grantª
Total or weighted
average Date 10/04/2010 11/08/2010 10/04/2010 10/04/2010 Number of options granted 98,391 36,799 1,370,999 154,570 1,660,759Exercise price at grant date –US$ 16.19 18.69 9.48 16.19 Risk free interest rate - % 10.16 10.16 10.16 10.16 Average term 5.0 5.0 5.25 4.25 Expected dividend yield - % 0.67 0.57 0.67 0.67 Share price volatility - % 30.25 31.21 30.25 30.25 Market share price - US$ 15.93 18.69 15.93 15.93 Fair value at grant date – US$ 6.86 8.33 10.02 6.24 (b.2) Considering the modification in the exercise price, the following assumptions were used to measure the additional compensation:
1st grant 2nd grant
1st extraordinary
grantª
2nd extraordinary
grantª
Total or weighted
average Date 06/30/2011 06/30/2011 06/30/2011 06/30/2011 Number of options granted 92,195 36,799 1,370,999 154,570 1,654,563Exercise price at grant date – US$ 15.12 17.83 7.87 12.81 Risk free interest rate - % 12.15 12.15 12.15 12.15 Average term 4.63 4.67 4.88 3.50 Expected dividend yield - % 2.60 2.60 2.60 2.60 Share price volatility - % 33.79 33.79 33.79 33.79 Market share price - US$ 17.42 17.42 17.42 17.42 Fair value immediately before
modification– US$ 6.94 6.12 9.97 6.06 Fair value immediately after
modification– US$ 7.80 6.86 11.11 8.11 Incremental fair value 0.85 0.74 1.15 2.05 (b.3) Other information at September 30, 2011
1st grant 2nd grant
1st extraordinary
grantª
2nd extraordinary
grantª
Total or weighted
average 09/30/2011 09/30/2011 09/30/2011 09/30/2011 Number of options outstanding (i) 92,195 36,799 1,370,999 154,570 1,654,563Number of options exercisable (i) 23.61 27.83 12.28 20.00 Remaining average term (i) 4.50 4.54 4.75 3.25 (i) At September 30, 2011.
Share price volatility is determined based on historical share price volatility of Multiplus quoted shares.

TAM S.A. Notes of the interim financial statements (In thousands of Dollar, unless otherwise indicated)
F-66
25. Net Finance Result Quarter ended Nine months ended
September 30,
2011 September 30,
2010 September
30, 2011 September
30, 2010 Finance income (Unaudited) (Unaudited)
Interest income from financial investments
30,653 21,127 78,862 55,703 Exchange gains 303,138 247,369 880,477 691,291 Other 5,306 104,230 32,805 109,473
339,097 372,726 992,144 856,467 Finance expenses
Exchange losses (1,038,846) (50,220) (1,377,102) (593,993) Interest expense (i) (71,605) (62,144) (213,399) (76,815) Other (4,531) (6,158) (18,694) (119,581)
(1,114,982) (118,522) (1,609,195) (790,389) Derivatives designated as hedge (11,828) (11,828) (1,126,810) (118,522) (1,621,023) (790,389) Finance result, net (787,713) 254,204 (628,879) 66,078 (i) The average monthly rate for capitalized interest at September 30, 2011 was 0.37% (06.30.2010 – 0.04 %). The exchange gain recognized at September 30, 2011 with respect to finance lease liabilities amounted US$ 318,746 (09.30.2010 – net expense US$ 87,070), while interest expense on those finance lease liabilities amounted to US$ 45,711 (09.30.2010 – US$ 49,267). 26. Earnings per share
(a) Basic Basic earnings per share is calculated by dividing the profit attributable to equity holders of the company by the weighted average number of shares (common and preferred) issued and outstanding during the year excluding shares purchased by the Company and held as treasury shares.

TAM S.A. Notes of the interim financial statements (In thousands of Dollar, unless otherwise indicated)
(*) See note 3. F-67
Quarter ended Nine months ended
September 30,
2011 September 30,
2010 September 30,
2011 September 30,
2010 (Adjusted(*)) (Adjusted(*)) (Unaudited) (Unaudited)Profit / (loss) attributable to equity holders of the company (378,888) 419,192 (263,822) 282,055 Weighted average number of shares issued (in thousands) 156,207 150,585 156,207 150,585Weighted average treasury shares (in thousands) (106) (263) (109) (263) Weighted average number of shares outstanding (in thousands) 156,101 150,322 156,098 150,322 Basic earnings / (loss) per share (Reais per share) (2.43) 2.79 (1.69) 1.88 (b) Diluted Diluted earnings per share is calculated by adjusting the weighted average number of shares outstanding to assume conversion of all dilutive potential shares. The company has only one category of dilutive potential ordinary shares: stock options.
Quarter ended Nine months ended
September 30,
2011 September 30,
2010 September 30,
2011 September 30,
2010 (Adjusted(*)) (Adjusted(*)) (Unaudited) (Unaudited)Profit / (loss) attributable to equity holders of the company (378,888) 419,192 (263,822) 282,055 Weighted average number of shares outstanding (in thousands) 156,101 150,322 156,098 150,322Adjustments for share options (in thousands) 291 291 Weighted average number of shares for diluted earnings per share calculation (in
thousands) 156,101 150,613 156,098 150,613
Diluted earnings / (loss) per share (Reais per share) (2.43) (2.78) (1.69) 1.87

TAM S.A. Notes of the interim financial statements (In thousands of Dollar, unless otherwise indicated)
(*) See Note 3 F-68
27. Cash generated from operations
Nine months ended
September 30,
2011 September 30,
2010 (Adjusted(*)) (Unaudited)Profit / (loss) for the period (230,543) 293,305Adjustments for
Deferred income tax and social contribution (113,312) 152,627Depreciation and amortization (Note 32 (b)) 332,437 294,183 Loss on disposal of property, plant and equipment (see below) 19,747 24,304Foreign exchange losses/(gains) and interest expense 724,774 58,029Other provisions 90,159 89,322Provision for contingencies 18,425 34,259Reversal of provision of contingency (334,852)Stock options plan 8,725 6,446
Changes in working capital
Financial assets measurement at fair value through profit and loss (54,705) (144,878)Inventories (12,302) 12,234 Accounts receivable (248,597) (309,118)Taxes recoverable (325,943) (19,974)Prepaid expenses 23,175 732Prepaid aircraft maintenance (81,247) 6,387Other receivables (6,056) 33,386Accounts payable (22,492) (27,423)Salaries and social charges (5,707) 69,241Taxes, charges and contributions 112,122 84,168Deferred income (106,178) 94,095Other liabilities 118,525 26,764Derivative financial instruments 44,580 (62,165)Payment of REFIS (10,652)
Cash generated from operations 274,935 381,072 In the cash flow statement, proceeds from sale of property, plant and equipment and intangible comprise:
Nine months ended
September 30,
2011 September 30,
2010 (Unaudited)Net book amount – property, plant and equipment 21,403 37,360Loss on disposal of property, plant and equipment (19,747) (24,304) Proceeds from disposal of property, plant and equipment 1,656 13,056

TAM S.A. Notes of the ínterim financial statements - Unaudited (In thousands of Dollar, unless otherwise indicated)
F-69
28. Commitments and contingencies (a) Operating lease commitments TLA has obligations arising under operating lease contracts. The amounts of these commitments are not recorded in the financial statements. TLA has obligations arising from 71 aircraft under operating leases (12.31.2010 – 69 aircraft). These agreements have an average term of 97 months and are denominated in U.S. dollars with interest rates based on LIBOR. The lease expense, recognized in the consolidated statement of operations in "Cost of services rendered", for period ended September 30, 2011 was US$ 172,290 (September 30, 2010 – US$ 207,629.
For most of the transactions, TAM has given letters of guarantee or deposits as a guarantee.
In addition, to meet the payment conditions established by contract, promissory notes guaranteed by Company were issued, totaling US$ 1,779 at September 30, 2011 (12.31.2010 – US$ 12,623). Future aggregate payments denominated in US dollars under these contracts are as follows:
Monthly payments
maturing in September 30,
2011 December 31,
2010 In foreign currency – US$ Aircraft 2024 698,450 656,288 Engines 2021 14,728 16,319 Total 713,178 672,607
Operating lease obligations fall due as follows:
Year September 30,
2011 December 31,
2010 No later than one year 210,270 209,131 Later than one year and no later than five years 389,748 421,442 Later than five years 113,160 42,034 713,178 672,607
(b) Commitments for future aircraft leases
(i) Airbus In 2005, the Company executed an amendment to an existing contract with Airbus for the firm order of 20 Airbus A320, the remaining nine of which are to be delivered in 2010, with an option for an additional 20 of the same aircraft family (including A319, A320 and A321). In 2006, the Company finalized a contract to acquire a further 37 Airbus aircraft (31 aircraft narrow body aircraft family A320 and six A330 aircraft), with the option for an additional 20, to be delivered in 2012 and 2013. On June 28, 2007, the Company also executed a Memorandum of Understanding for the purchase of 22 Airbus A350XWB models 800 and 900, with ten more options, for delivery between 2013 and 2018. Additionally, TLA confirmed the exercise of four options for Airbus A330, the four of which were already delivered in 2010 and 2011, related to the agreement signed at the end of 2006. TAM also confirmed the twenty options that had been postponed from 2005 to 2006 anticipated delivery before the end of 2014.

TAM S.A. Notes of the interim financial statements (In thousands of Dollar, unless otherwise indicated)
F-70
On June 8, 2010, TLA, announced the order of additional 20 brand-new Airbus A320 family aircraft and five A350-900, thus increasing the total number of orders for Airbus aircraft to 176 – including 134 aircraft of A320 family, 15 A330-200 and 27 A350 WXB. The objective of this order is to meet the plan of fleet already disclosed by the Company in the year 2009. In respect of the 20 orders from A320 family (A319, A320 and A321), ten shall be delivered in 2014 and the remaining ten in 2015. (ii) Boeing In 2006, the Company ordered four Boeing 777-300ERs with options for four aircraft, which were converted to firm orders in 2007. Upon receipt of the four aircraft in 2008, the Company has signed an amendment to an existing contract for two more aircraft and has six firm orders outstanding contracted with Boeing for this type of aircraft, of which four are expected to be delivered in 2012 and two in 2013.
(iii) Fleet renewal and expansion
On February 28, 2011, the Company announced the order of 32 aircraft from the Airbus A320 family and two Boeing 777-300ER aircraft to prepare the Company to meet the expected growing demand for air travel. The combined value of these new orders, based on list prices, is approximately US$ 3.2 billion. Of the 32 aircraft ordered from Airbus , 22 are new model A320neo and ten are from the A320 Family. The aircraft are scheduled to be delivered between 2016 and 2018. The two Boeing 777-300ERs are expected to be delivered in 2014. This order of two more aircraft brings the total number of aircraft ordered from the U.S. manufacturer to eight, including four aircraft to be delivered in 2012 and the two in 2013. Once all the aircraft are delivered, we will have 12 Boeing aircraft in our fleet. (c) Insurance
TAM maintains adequate insurance for risks which are expected to cover any liabilities generated by the accident on July 17, 2007, of an Airbus A320 aircraft, considering the agreements already made with and paid to the victims’ families by the insurance company. As of September 30, 2011, 193 (12.31.2010 – 192) compensation payments have been paid to families of the victims and others are under negotiation with the Company’s insurance firm. Management understands that the insurance coverage of these liabilities is adequate to cover all related costs. The Company believes that it will not incur additional or unexpected expenses outside the scope of the insurance agreement which would be TAM’s direct responsibility. (d) Contingent liabilities Contingencies for which it is probable that TAM will be required to make payments are provided for and are discussed in Note 18.

TAM S.A. Notes of the interim financial statements (In thousands of Dollar, unless otherwise indicated)
F-71
(e) Contingent assets
(i) ICMS On December 17, 2001 the Federal Supreme Court ruled that domestic and international air passenger transportation revenue, as well as international air cargo transportation revenue was no longer subject to ICMS.
However, based on this ruling, ICMS taxation on domestic air cargo transportation revenue is still due. At September 30, 2011, the provision maintained by the Company totaled US$ 1,870 (12.31.2010 – US$ 2,614), recorded in “Taxes, charges and contributions”.
We consider payments of ICMS made between 1989 and 1994 to be amounts paid in error because we believe it was unconstitutional to charge ICMS on air navigation services. TAM Linhas Aéreas has filed claims against various states in Brazil to claim the amounts paid in error. Rulings on these claims are pending. Our policy is to only adjust the value of these claims for inflation at the time that payment is recorded in our financial statements. (ii) Indemnification for losses on regulated fares We are plaintiffs in an action filed against the Brazilian government in 1993 seeking damages for breaking-up of the economic-financial equilibrium of an air transport concession agreement as a result of having to freeze our prices from 1988 to September 1993 in order to maintain operations with the prices set by the Brazilian government during that period. The process is currently being heard before the Federal Regional Court and we are awaiting judgment on appeals we have lodged requesting clarification of the initial decision (which we challenged). The estimated value of the action is based on a calculation made by an expert witness of the court. This sum is subject to interest accruing from September 1993 and inflation since November 1994. Based on the opinion of our legal advisors and recent rulings handed down by the Supreme Court of Justice in favor of airlines in similar cases (specifically, actions filed by Transbrasil and Varig) we believe that our chance of success is probable. We have not recognized these amounts as receivable in these financial statements and will only do so when the decision is made final. (iii) Additional airport tariffs (“ATAERO”) In 2001 TLA filed a legal action requesting preliminary measures challenging the legality of the additional rate of 50% on airpor tariffs established by Law 7,920/89. The Company has been paying those amount monthly at September 30,2011 totalling US$ 563,079 (December 31, 2010 – US$ 551,250) and no asset has been recognized with respect to this matter.
29. Segment reporting
The Company has two operating and reportable segments: Aviation operations and Loyalty Program operations (“Multiplus”). Operating segments are reported in a manner consistent with the internal reporting provided to the chief operating decision maker (“CODM”).

TAM S.A. Notes of the ínterim financial statements - Unaudited (In thousands of Dollar, unless otherwise indicated)
(1) Operating Expenses includes equity pick up of TLA in the amount of US$ 376,697 recognized in the Aviation segment. F-72
Total assets
Aviation Loyalty Program
(Multiplus) Total reported –
Segment information Eliminations Consolidated
September 30, 2011 9,826,691 615,285 10,441,976 (2,056,288) 8,385,688
December 31, 2010 10,733,646 862,979 11,596,625 (2,895,794) 8,700,831
(a) Quarter ended at September 30, 2011 and 2010
September 30,
2011
Aviation Loyalty Program
(Multiplus)
Total reported – Segment
information Eliminations
(1) Consolidated Revenue 2,053,665 196,542 2,250,207 (220,806) 2,029,401 Operating expenses (2,139,060) (149,554) (2,288,614) 597,503 (1,691,111) Operating profit / (loss) before
movements in fair value of fuel derivatives
(85,395) 46,988 (38,407) 376,697 338,290 Movements in fair value of fuel
derivatives
(57,071) (57,071) (57,071) Operating profit / (loss) (142,466) 46,988 (137,802) 376,697 281,219 Finance income 326,068 13,029 339,097 339,097 Finance expense (1,114,967) (15) (1,114,982) (1,114,982) Derivatives designated as hedge (11,828) (11,828) (11,828) Profit / (loss) before income tax
and social contribution
(931,365) 48,174 (883,191) 376,697 (506,494) Income tax and social contribution 152,711 (16,800) 135,911 135,910 Profit / (loss) for the period (778,664) 31,374 (747,280) 376,697 (370,584)

TAM S.A. Notes of the interim financial statements (In thousands of Dollar, unless otherwise indicated)
(*) See note 3. (2) Operating Expenses includes equity pick up of TLA in the amount of US$ 424,020 recognized in the Aviation segment.
F-73
September 30, 2010
(Unaudited)
Aviation Loyalty Program
(Multiplus)
Total reported – Segment
information Eliminations
(2) Consolidated (Adjusted (*)) Revenue 1,694,310 74,339 1,768,649 (89,114) 1,679,535 Operating expenses (908,444) (47,225) (955,669) (334,906) (1,290,575) Operating profit / (loss) before
movements in fair value of fuel derivatives
785,866 27,114 812,980 (424,020) 388,960 Movements in fair value of fuel
derivatives
7,278 7,278 7,278 Operating profit / (loss) 793,144 27,114 820,258 (424,020) 396,238 Finance income 365,750 6,976 372,726 372,726 Finance expense (118,497) (25) (118,522) (118,522) Profit / (loss) before income tax
and social contribution
1,040,397 34,065 1,074,462 (424,020) 650,442 Income tax and social contribution (215,799) (8,633) (224,432) (224,409) Profit / (loss) for the period 824,598 25,432 850,030 (424,020) 426,033

TAM S.A. Notes of the ínterim financial statements - Unaudited (In thousands of Dollar, unless otherwise indicated)
(3) Operating Expenses includes equity pick up of TLA in the amount of US$ 249,011 recognized in the Aviation segment. F-74
(b) Nine months ended September 30, 2011 and 2010
September 30,
2011
Aviation Loyalty Program
(Multiplus)
Total reported – Segment
information Eliminations
(3) Consolidated Revenue 5,827,177 520,256 6,347,433 (580,490) 5,766,943 Operating expenses (5,815,729) (366,561) (6,182,290) 829,501 (5,352,789) Operating profit / (loss) before
movements in fair value of fuel derivatives
(11,448) 153,695 165,143 249,011 414,154 Movements in fair value of fuel
derivatives
(31,675) (31,675) (31,675) Operating profit / (loss) (20,227) 153,695 133,468 249,011 382,479 Finance income 942,371 49,774 992,145 992,145 Finance expense (1,608,730) (465) (1,609,195) (1,609,195) Derivatives designated as hedge (11,828) (11,828) (11,828) Profit / (loss) before income tax
and social contribution
(686,587) 191,176 (495,411) 249,011 (246,400) Income tax and social
contribution
82,294 (66,437) 15,857 15,857 Profit / (loss) for the period (604,293) 124,739 (479,554) 249,011 (230,543)

TAM S.A. Notes of the ínterim financial statements - Unaudited (In thousands of Dollar, unless otherwise indicated)
(*) See note 3. (4) Operating Expenses includes equity pick up of TLA in the amount of US$ 283,861 recognized in the Aviation segment.
F-75
September 30, 2010
(Unaudited)
Aviation Loyalty Program
(Multiplus)
Total reported – Segment
information Eliminations
(4) Consolidated (Adjusted (*)) Revenue 4,640,065 149,156 4,789,221 (206,634) 4,582,587 Cost and operating expenses (3,974,378) (98,575) (4,072,953) (77,227) (4,150,180) Operating profit / (loss) before
movements in fair value of fuel derivatives
665,687 50,581 716,268 (283,861) 432,407 Movements in fair value of fuel
derivatives
(18,734) (18,734) (18,734) Operating profit / (loss) 646,953 50,581 697,534 (283,861) 413,673 Finance income 847,129 9,338 856,467 856,467 Finance expense (790,333) (56) (790,389) (790,389) Profit / (loss) before income tax
and social contribution
703,749 59,863 763,612 (283,861) 479,751 Income tax and social
contribution
(169,073) (17,373) (186,446) (186,446) Profit / (loss) for the period 534,676 42,490 577,166 (283,861) 293,305

TAM S.A. Notes of the ínterim financial statements - Unaudited (In thousands of Dollar, unless otherwise indicated)
F-76
31. Events occurring after the reporting period
Material fact – joint venture between Multiplus and Groupe Aeroplan On November 7, 2011, Multiplus, a subsidiary controlled by TAM, into a binding partnership agreement (Joint Venture Agreement) with Groupe Aeroplan (“Aimia”) a Canadian public company and a global leader in loyalty marketing, to create a new loyalty marketing services company in Brazil, and each of Multiplus and Aimia will own 50% (fifty percent) of the shares/quotas of the New Company. The joint venture will focus on the design, development, management and providing to third parties consulting services and data analytics for loyalty and incentive programs. The Joint Venture will not develop coalition programs similar to the one operated by Multiplus and therefore will not affect Multiplus’s main activity.