Tallinn University of Technology - Nordic Forest Research SNS · 2017-07-24 · Tallinn University...
196
Tallinn University of Technology Proceedings of the 6 th meeting of the NORDIC-BALTIC NETWORK IN WOOD MATERIAL SCIENCE AND ENGINEERING (WSE) October 21–22, 2010 Tallinn, Estonia Edited by Pille Meier
Transcript of Tallinn University of Technology - Nordic Forest Research SNS · 2017-07-24 · Tallinn University...

Tallinn University of Technology
Proceedings of the 6th meeting of the NORDIC-BALTIC NETWORK IN WOOD
MATERIAL SCIENCE AND ENGINEERING (WSE)
October 21–22, 2010 Tallinn, Estonia
Edited by Pille Meier

Title Proceedings of the 6th meeting of the Nordic-Baltic Network In Wood Material Science And Engineering (WSE) October 21–22, 2010 Tallinn, Estonia Editor Pille Meier Publisher Tallinn University of Technology Press, Tallinn, Estonia Cover photo Viivi Ahonen Cover design Ann Gornischeff Copyright: Tallinn University of Technology, 2010 ISBN 978-9949-23-033-4 Published with support from SNS – The Nordic Forest Research Cooperation Committee

3
PREFACE The Nordic-Baltic Network in Wood Material Science and Engineering (WSE) was established in 2004 by Nordic Forest Research Cooperation Committee (SNS). The field of the network, wood science and engineering, covers wood-water relations, wood durability, wood modification, wood mechanics, wood composites, engineered wood products, eco-efficient wood based products, wood engineering, building, and use of machines and constructions. The first five meetings were organized by network partners in different countries. 2005 – Norwegian Forest and Landscape Institute (Norway) 2006 – Royal Institute of Technology, KTH and Swedish National Testing and Research Institute, SP (Sweden) 2007 – University of Helsinki, Department of Forest Resource Management (Finland) 2008 – Latvian State Institute of Wood Chemistry (Latvia) 2009 – University of Copenhagen, Forest & Landscape Denmark (Denmark) During the past six years the network has constantly been growing, resulting in attracting 70 researchers from twelve countries in 2010. The present publication contains 21 papers and 11 abstracts. The Chair of Woodworking and International Relations Office at the Tallinn University of Technology have the honour to host the meeting in 2010. We would like to thank all the speakers for their contribution and the SNS for financial support to make this event possible. Tallinn, October 2010 Pille Meier

4
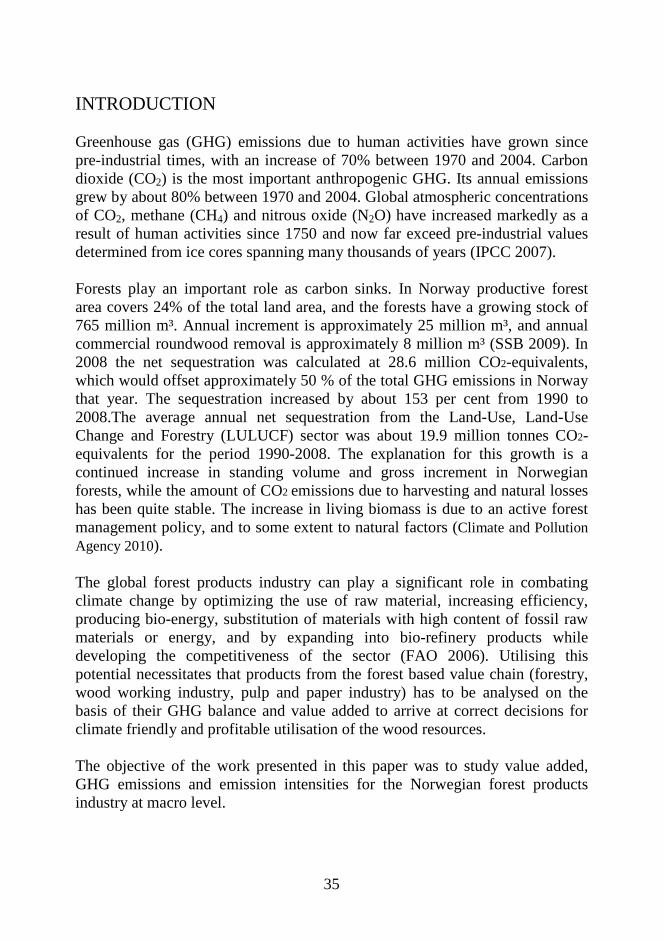
CONTENTS Towards Structural Wood Plastic Composites: Technical Innovations Gardner, D. J.; Han, Y. ........................................................................................ 7 Heat Treatments of Wood to Improve Decay Resistance Rowell, R. M. ...................................................................................................... 23 Norwegian Forest Products Industry – Impact on Climate and Value Added Flæte, P. O. ........................................................................................................ 34 Latvia Forest Sector for the Accumulated Information and the Available Data Assessment Tunkele, S.; Mārciņš, J....................................................................................... 44 Numerical Modelling of the Time-Dependent Mechanical Behaviour of Softwood Engelund, E. T. ................................................................................................... 52 Experimental and Numerical Investigation of Plywood Sandwich Panels with Corrugate Core Labans, E.; Kalnins, K.; Zudrags, K. ................................................................. 61 Structural Round Timber of Scots Pine from Southern Norway Vestøl, G. I.; Høibø, O. ...................................................................................... 70 Variation of Scots Pine Permeability in Northern Europe Zimmer, K.; Larnøy, E.; Høibø, O. .................................................................... 78 Treatability Variation of Scots Pine Heartwood from Northern Europe Behr, G.; Larnøy, E.; Bues, C.-T. ...................................................................... 86 Investigation of Elasticity and Strength Properties of Scots Pine Wood Using Ultrasound and Acoustic Methods Sveikataite, D.; Miseikyte, S.; Baltrusaitis, A. ................................................... 93 High Capacity Timber Sawing Based on Accurate Log Scaling Gjerdrum, P.; Hamar, B. ................................................................................. 101

5
Prediction Models for Density in Stems of Picea Abies (L.) Karst. and Pinus Sylvestris L. in Southern Norway Hundhausen, U.; Høibø, O. A. ......................................................................... 108 The Future of Moisture Determination Fernández Cano, V.; Hultnäs, M. .................................................................... 118 Variation in Strength Properties of Scots Pine Wood after Two Different Heat Treatments Rikala, J.; Havimo, M.; Sipi, M. ...................................................................... 126 The Synergistic Effects between Chitosan and Different Wood Protection Agents Witt, B.; Treu, A. .............................................................................................. 133 Adhesion Studies of Scots Pine-Polypropylene Bond Using ABES Segerholm, B. K.; Wålinder, M. E. P.; Holmberg, D....................................... 142 The Behaviour of Heat Treated Wooden Cladding Exposed to Extreme Climate Changes Sidorova, E.; Morén, T..................................................................................... 147 Why Consumers Avoid Using Wood as Flooring Material Vahtikari, K.; Silvo, J.; Mauno, A. ................................................................... 155 Modified Wood – Excellent Raw Material for Production of Granular Activated Carbon Rizhikovs, J.; Zandersons, J. ............................................................................ 162 The Use of Formic Acid for Extraction of Arsenic and Chromium from Impregnated Wood Kapaca, E.; Spince, B.; Zandersons, J............................................................. 170 Quantification of 4 Dark Colored Mould Fungi by Real Time PCR Larnøy, E.; Hiietala, A. M.; Gobakken, L. ....................................................... 177 Studies of Steam Exploded Fibres Tupciauskas, R.; Belkova, L.; Gravitis, J. ........................................................ 185 Dendrolight Panels Produced from Aspen Wood Iejavs, J.; Spulle, U. ......................................................................................... 186

6
Influence of Cellulose Content on Rheological and Mechanical Properties of Poly(lactic) Acid/Cellulose and LDPE/Cellulose Composites Šumigin, D.; Tarasova, E.; Meier, P. .............................................................. 187 Cost-Effective Analysis of Scots Pine Stilbenes Harju, A.; Venäläinen, M.; Partanen, J.; Jääskeläinen, A.-S.; Hatakka, R.; Kivioja, A.; Tapanila, T.; Tanner, J.; Kilpeläinen, P. ..................................... 188 Impact of Temperature and Grain Angle on the Velocity of Sound in Modified Oak Wood Zaleckis, E.; Ukvalbergienė, K. ....................................................................... 189 Alternative Wood Preservative Systems in a Combined Impregnation Process (CIP) Liibert, L.; Treu, A.; Meier, P. ......................................................................... 190 How does Sample Position Affect the Leachability of Wood Preservatives Kängsepp, K.; Larnøy, E.; Meier, P. ............................................................... 191 Effect of Birch Veneer Processing Factors on Adhesive Bond Strength Development Piirlaid, M.; Rohumaa, A.; Matsi, M.; Hughes, M.; Meier, P. ........................ 192 Assessing the Potential of Furan Polymer-Based Resin Development in Bonded Veneer Processing Factors on Adhesive Bond Strength Matsi,M.; Rohumaa, A.; Piirlaid, M.; Hughes, M.; Meier, P. ......................... 193 Analytical Control of the Process of Preparing Lignocellulose for Obtaining Levoglucosan Pazhe, A.; Puke, M.; Zandersons, J. ................................................................ 194 Influence of Temperature on Lignin Coagulation with Aluminum Cloride in Wastewater Treatment Brovkina, J.; Shulga, G.; Ozolins, J................................................................. 195

7
TOWARDS STRUCTURAL WOOD PLASTIC COMPOSITES: TECHNICAL INNOVATIONS
Gardner, D. J.1 & Han, Y.2
ABSTRACT Wood plastic composites (WPCs) are an important segment of the forest products industry. Applications of WPCs are typically for nonstructural applications and the market has been dominated by rail and decking products in North America while in Europe, emphasis has been on automotive applications. In China and other parts of Asia, the WPC market is experiencing considerable growth and a wider variety of product offerings. There is a great desire to create truly structural WPCs that can be used in infrastructure applications. What constitutes a structural WPC is a subject of debate, but in many instances the objective of research is to increase the mechanical properties of the composite, including stiffness or modulus of elasticity, reducing creep and brittleness. In this presentation, we will discuss research progress in the creation of structural WPCs including: manufacture of structural WPC components, synthetic fiber reinforced hybrid WPCs, cross-linked WPCs, the use of engineering plastics to manufacture WPCs and the creation of structural WPC foams. Demonstration applications of structural WPCs will also be shown and discussed. Key words: wood plastic composites, mechanical properties, structural, reinforced
1 Professor of Wood Science and Technology, School of Forest Resources, University of Maine, 231 AEWC Building, Orono, ME 04469, USA, Tel: 207-581-2846, Fax 207-581-2074, E-mail: [email protected] 2 Wood Plastic Composites Specialist, AEWC Advanced Structures and Composites Center, University of Maine, 104 AEWC Building, Orono, ME 04469, USA, Tel: 207-581-2115, Fax 207-581-2074, E-mail: [email protected]

8
INTRODUCTION Traditional Structural Wood Products For structural applications, wood-based materials should be evaluated according to sorting criteria that are generally guided by stress-grading methods and the philosophy of how properties for engineering designs are derived. For example, lumber in the United States is graded by the derived properties and then used in one of two design formats: (a) the load and resistance factor design (LRFD), which is based on a reference strength at the lower 5th percentile 5-min stress (AF&PA [current edition]), or (b) the allowable stress design (ASD), which is based on a design stress at the lower 5th percentile 10-year stress (Kretschmann 2005). The design of standards is to be associated with basic design properties such as flexural modulus, stress in tension, compression, shear, and extreme fiber stress in flexural mode. Wood products for structural applications include glue laminated timber (glulam), parallel strand lumber (PSL), laminated strand lumber (LSL), wood I-joists, laminated veneer lumber (LVL), and engineered wood trusses. These wood products have been designed using engineering principles to sustain various external and internal stresses of tensile, compressive, shear or flexural modes. The engineering design of wood products overcomes the heterogeneity of solid wood, which arises from the existence of knots or grain variation in the anatomical structure and defects arising from processing, such as splits, cracks, or warp. Even if the heterogeneity of wood products is addressed for improved properties, other drawbacks can exist: photo-degradation and photo-oxidative degradation, biological decomposition, and thermal degradation. Composites have been suggested as a substitute for wood products but can not replace wood because of the comparative low cost of wood products. Since wood plastic composites (WPCs) were introduced in the 1980’s, they have been evaluated for structural applications because WPCs have many benefits for exterior applications because of their superiority to solid wood products in exterior durability. Wood Plastic Composites Since the first WPC products were introduced in the 1980’s, the market size has increased up to $1,565 million within 3 decades. That increase represents the potential of WPCs as a construction material. The initial market breakthrough for WPCs began in the US in the decking and railing market in the middle of the past decade. These WPC home construction products were attractive to

9
consumers because of their low maintenance even though WPC prices were higher than the alternative competitor – pressure treated lumber. In terms of market share, the rate of WPC increase, compared to other deck board products, rose from 2% in 1997 to 8% in 2000, and exceeded over 20% in 2005 (Smith 2002 and Morton 2005). In 2006, the total market size of WPCs in North America reached $1,425 million, which mainly included decking/railing, window, transportation, and other markets (Yangling 2007). The array of WPC products has continuously expanded to roofing, molding or trim, doors, fencing, and landscaping materials. More recently over the past several years due to the global recession, the WPC market has remained relatively stagnant. In Europe, indoor applications including relatively inexpensive furniture moldings and trim products have been developed for consumers attracted to the flexibility and the variety of shapes and configurations possible with WPCs. The total market size of WPCs in Europe in 2005 was estimated to be $100 million, which is estimated to increase up to $380 million by 2010 (Green 2003 and Nash 2005). Even though the decking market in Europe is relatively small, the annual growth rate (AGR) has ranged around 12 to 14% during the five years prior to the global recession. In 2007, it was estimated that the growth rate would be over 10% for the next 5 years (Eder 2007). The high growth rate of decking indicates potential for an expanded market for WPCs which had a market share in Europe of only 6.1% in 2007. In Asia, the major WPC markets have been in Japan, South Korea, and China since the 1990’s. The Japanese WPC market which began in the 1990’s increased to $300 million by 2005 (Green 2003). Today, about 30 manufacturers produce WPCs for various applications from garden furniture, small garden structures, and balcony floors to indoor floors and outdoor decks. The Korean market which began in 2006 is increasing rapidly since the supply of tropical woods is not stable and customers’ concern for the environment is growing. China’s WPC industry is making strides, growing 15 to 30% per year and, by some estimates in 2007, Chinese production soon could overtake European production. It was estimated by the Chinese WPC Council that the Chinese WPC market ranged from 75,000 to 150,000 metric tons (Toloken 2007). An early WPC product in China was pallets ,which now comprises 70% of the total WPC market (Song, 2005). It is expected that the WPC market in China will sharply increase because of environmental issues, dramatic increases in the construction materials market, and the decreasing availability of natural resources in China.

10
It should be noted that the major WPC quality desired by Asian customers is not durability of WPCs but the wood-like appearance even if it contains almost 50% synthetic petroleum polymers. So, the manufacturers of WPCs in Japan and South Korea have focused on the surface treatment combinations of embossing and mechanical processing for producing a realistic wood appearance. WPC products are expanding in market size and dispersion as new applications of WPCs are being developed and adopted according to local market situations and local customers’ cultural backgrounds. Mechanical Properties for Structural Applications Structural wood products have been categorized for their uses according to stress grades that can be used for engineering design. One example is the American Softwood Lumber Standard PS 20 published by the U.S. Department of Commerce. The standard designates reference design values for timbers categorized by product type: sawn lumber, non-North American sawn lumber, structural glued laminated timber, and applications: decking or structures. The reference design values are compared to other wood composites in Figure 1, showing the differences in mechanical properties. It should, however, be noted that the flexural modulus of elasticity or stiffness is not the only mechanical property value to be considered in designing structures. The flexural modulus of elasticity comparison simply shows significant gaps in the properties, which should be reduced by novel processing methods and formulation in wood plastic composites.

11
Figure 1. Comparison of flexural modulus of various wooden materials for structural applications
Wood-1: Alaska Cedar / Wood-2: Aspen / Wood-3: Douglas Fir-South (AF&PA 2005) GL: Glued laminated timber / 1.3 or 1.7: Stress grade / E: edgewise / F: flat-wise
(AF&PA 2005) PW: Plywood / OSB: Oriented Strand Board / OPB: Particleboard (Falk, etc. 1999) COM-01: Polyester thermosetting composite with hemp fiber (15% vol.) (Dhakal, etc.
2006) E-WPC: Engineering wood plastic composite made of SMA, developed by Univ. of
Maine (Han, 2009) PE-WPC-1: PE-based wood plastic composite, a commercial decking board by Trex,
Inc PP-WPC-2: PP-based wood plastic composite, a commercial decking board by Correct
Deck, Inc. PP-WPC-3: PP-based wood plastic composite, a commercial decking board by
Timbertech, Inc. PP-WPC-4: PP-based wood plastic composite, a pilot product of sheet pile by UMaine
(Han 2009)

12
MANUFACTURE OF STRUCTURAL WPC COMPONENTS Z-Section Sheet Pile A seawall, also known as a bulkhead or retaining wall, is a structure built to reduce the effects of strong waves and to defend costal land from erosion. Traditionally, seawalls are made of steel, timber or concrete construction. Composite materials, however, have been recently introduced for their ease of installation/maintenance in dry processing, low cost, and environmentally-friendly materials. A WPC seawall system has been developed and patented for its unique hollow structure that can give greater stiffness and stability under various external stresses (Figure 2). The moment of inertia, one of the most important properties for structural applications, of the novel WPC system shows up to 22,900 cm4 which is higher than 19,900 cm4 of a commercial polyvinyl chloride system or 16,200 cm4 of a steel system categorized for light duty applications. The mean flexural stiffness EI of the WPC seawall is 8.07 X 10⁴ kip-in2/ft (Alvarez-Valencia 2009), where it can be categorized between very light duty and light duty defined by the US Army Corps of Engineers (Dutta and Vaidya 2003).
WPC Glulam and Box Beam It is a reasonable approach for the production of structural members from WPCs to laminate WPC decking boards with customized adhesives to design larger dimensioned products since the dimensional limits on the extrusion process should be considered. The AEWC Advanced Structures and Composites Center, University of Maine, Orono, Maine, USA has produced
Figure 2. WPC sheet pile system for seawall applications

13
glu-laminated WPCs and a box beam for structural applications (Figures 3 and 7). The flexural moduli were 3.0 GPa and 12.6 GPa for the box beam and glued laminated WPC, respectively. For successful lamination, surface treatments were required to improve the inert and non-polar interfaces between polyolefin matrices. Several treatments were studied and it was found that corona treatment, using an oxidation mechanism created by cold-air plasma was superior to other treatment methods (Oporto 2009). The shear strength was significantly increased after the surface treatment (Figure 4).
Figure 3. WPC box beam and glued laminated WPC for structural applications
Figure 4. Shear strength of surface treated WPC reinforced with continuous glass fibers (The treatment was cold plasma with air)

14
Synthetic Fiber Reinforced Hybrid WPCs Using an extrusion process for composites limits the applications since the dimensions of the extrudate, especially width, can be limited for sheet or panel products. In the T-shape extrusion die for sheets or panels, it’s difficult for polymer melts with comparatively high viscosities to evenly flow through all the wide channels during the extrusion process. In some cases, multiple extruders are required to produce wide panel products. A slow output rate of panel products is another negative consideration in extrusion. The University of Maine has developed a prototype of panel products made of WPC using a double belt press processing that can reinforce WPC panels with an addition of reinforcing layers, such as fiberglass embedded polypropylene sheets in a sandwich formation. The width of panels was about 1.3 m which was the maximum of the pilot-machine system, which can be scaled-up to larger sizes (Figure 5). The mechanical properties of the reinforced WPC panels are listed in Table 1, which shows promising potential of the WPC products for structural applications. Table 1. Mechanical properties of WPC panels developed by the University of Maine Properties WPC panel Reinforced WPC panel*
Flexural Modulus, GPa 2.33 8.10 Strength, MPa 40.07 169.78
Tensile Modulus, GPa 3.52 5.56 Strength, MPa 20.31 77.42
CTE** in machine direction 4.13 X 10⁻⁷ 3.30 X 10⁻⁷
* WPC panel reinforced with two outer layers ** Coefficient of thermal expansion

15
Cross-Linked WPCs To increase the stiffness of WPC-based polyolefin polymers, a cross-linking process has been examined using silane cross-linking. The silane cross-linked high density polyethylene wood composites were stored at high humidity and high temperature to increase the degree of cross-linking (Bengtsson 2006). The toughness was significantly increased but the stiffness did not change. In another study of cross-linked WPCs, a silane compound was used as a coupling agent to improve the interfacial properties between wood fillers and HDPE and another silane compound was applied as the cross-linking agent of the polymer matrix (Han 2007). The combined silane compounds did not have any incompatibility issues since they are similar chemical structures. It was found that both mechanical properties of stiffness and strength were significantly improved. Wood flour acts as a solid structure networked with the cross-linked polymer matrix. Mechanical stresses can be internally transferred into the wood particle, a relatively stiff component of the composite, from the cross-linked polymer matrix. It is believed that a loading of wood filler treated with a coupling agent could interact with the polymer matrix in the cross-linking mechanism, resulting in an enhancement of the close contact and physical linkages between two different materials. The flexural modulus of cross-linked
Figure 5. WPC panel products developed by the University of Maine

16
HDPE wood composite was around 470,000 psi which is two times higher than those of HDPE WPC’s in the current market (Han, 2009). WPCs from Engineering Plastics To upgrade the stiffness of WPCs, the selection of the polymer matrix is one of the major concerns. Polyethylene terephthalate (PET), polyamide (PA, nylon), and acrylonitrile butadiene styrene (ABS) are typical engineering plastics with superior mechanical and thermal properties. The melting or plasticizing temperatures, however, range from 230°C to 270°C which is enough to cause serious thermal degradation of the wood. Several strategies have been used to overcome this thermal degradation. Two extruders were combined to minimize the retention time for wood exposure to high processing temperatures. One extruder feeds melted polymer into a twin screw extruder designed for efficient and rapid mixing to compound the polymer melt and cold wood flour. The retention time of wood to be exposed to very hot polymer melt was controlled at less than 4 minutes residence time. In this process, the severe thermal degradation could be avoided and nylon-wood composites could be produced. Another method of using engineering plastics in WPCs is viscosity modification of the pure engineering plastics. Several viscosity modifiers, which have low viscosity or special functional groups, were tested to examine the effect of decreased viscosity. Moreover, various polymer blends were tested as well to observe the changes in rheological properties. This study is now in progress and the results will be published in the near future. Creation of Structural WPC Foams Foaming WPCs can be achieved by using physical or chemical blowing agents that create cavities inside the polymer matrix. Unlike the general foaming process in unfilled thermoplastics, WPCs are typically highly-filled thermoplastic composites, placing restrictions on foaming properties since wood fillers can negatively impact the foaming mechanism. Considerations and cautions concerning this issue have been well addressed, where appropriate amounts of blowing agent, minimization of gas diffusion to atmosphere, suppression of cell coalescence and cell collapse are controlled (Park 2004). High filler content causes foaming instability since the cells created exist in an open system, resulting in cell coalescence and collapse. Moreover, the cell sizes are various because of the variety of particle sizes. High filler content can lead to cell coalescence in the worst case and relatively weaker strength in several mechanical properties. Even though it is well known that there is a decrease in strength for foamed plastics, the strength decrease in WPCs is greater than with

17
other thermoplastics. Researchers have focused on development of physical blowing agents using a phase of super critical fluids that can be dissolved into polymer melts under high temperature and pressure (Rizvi 2003 and Matuana 1995). The solubility of physical blowing agents helps distribute the cells evenly and limits the cell size so that significant mechanical deterioration can be avoided. Foamed styrene-wood plastic composites (FSWPC) have been produced at the AEWC Advanced Structures and Composites Center using reactive extrusion (Han 2008), which is shown in Figure 6. The blowing agents are created by the chemical reactions during the extrusion process and efficiently dissolved into the polymer melt where the dissolution occurs in the mixing zone of the barrel next to the venting zone so that there is a minimum loss of blowing agents through venting. The blowing agent exists in the form of super critical fluid (SCF) under high pressure and high temperature, which enables foaming cells locally initiated and grown into certain size levels. For SCF creation and maintenance, the extrusion system should be developed for appropriate pressure levels with a foaming die. According to a pilot-scale study, the FSWPC shows excellent mechanical properties and low specific gravity (Figure 7). If it is converted to relative modulus that is derived from the value of modulus divided by the sample’s specific gravity, the stiffness of FSWPC can be comparative to a minimum design value of general structural timbers (about 6.7 GPa or 9.6X10⁵ psi).
Figure 6. The product dimensions of foamed styrene-wood composites
developed by the University of Maine AEWC Center

18
Demonstration Projects As new WPC technologies are developed by academic, government and industrial laboratories, it is important to showcase these new products to the public in attractive and useful applications. Washington State University has demonstrated some of the WPC technologies developed for the Office of Naval Research at several naval facilities across the U.S. The University of Maine has demonstrated slip resistant decking developed for the US Coast Guard in facilities in New Haven, CT and Owls Head, ME (Figure 8). A WPC and hybrid composite demonstration pier was built for the U.S. Coast Guard in Jonesport, ME. The demonstration pier featured WPC-FRP hybrid laminated and box beams, WPC railings and decking, conventional wood glulam beams,
Figure 7. Flexural modulus of foamed styrene-WPC compared to other polymers. HDPE: high density polyethylene PE-WPC: polyethylene-based wood plastic composites E-PS: engineering polystyrene PP: polypropylene PA66: polyamide 66 FSWPC-01: foamed styrene-WPC with the specific gravity of 0.8 FSWPC-02: foamed styrene-WPC with the specific gravity of 1.0

19
and FRP glass reinforced concrete composite pilings. These demonstration projects are important steps toward diffusing novel WPC technologies into the commercial marketplace.
CONCLUSIONS The manufacture of structural wood plastic composites is possible using a variety of manufacturing options. Material-level formulation opportunities exist through a variety of means including: thermoplastic matrix cross-linking to increase WPC stiffness properties, reaction extrusion to create novel foamed WPCs, and WPC formulations based on engineering thermoplastic matrices. Adhesive bonding can be used to create larger WPC sections as well as bonding synthetic fiber composites to the WPCs to enhance strength and stiffness properties. Extrusion of structural shapes such as a hollow z-section sheet piling offers opportunities for novel structural WPC products. Demonstration projects utilizing structural WPC materials are important for creating excitement among
Figure 8. WPC hybrid composites demonstrated by the U.S. Coast Guard in Jonesport, Maine, USA

20
potential commercial producers and applicators of such technologies in the marketplace. REFERENCES
Alvarez-Valencia, D. 2009. Structural performance of wood plastic composite sheet piling. Masters thesis. University of Maine, Orono, Maine, USA. May 2009. American Forest & Paper Association. 2005. Design values for wood construction in Supplement National Design Specification. American Wood Council. 2005. Bengtsson, M, and Oksman, K. 2006. Profile extrusion and mechanical properties of crosslinked wood-thermoplastic composites. Polymer Composites 2006: 184-194. Dhakal, H.N., Zhang, Z.Y., and Richardson, M.O.W. 2006. Effect of water absorption on the mechanical properties of hemp fiber reinforced unsaturated polyester composites. Composites Science and Technology (2006), doi:10.1016/j.compscitech.2006.06.019 Dutta, P.K., and Vaida, U. 2003. A study of the long-term applications of vinyl sheet piles. Report # ERDC/CRREL LR-03-19, US Army Corps of Engineers, Engineer Research and Development Center. August, 2003. Eder, A. 2007. Wood plastic composite – An European market overview. In: Proceedings, 1st international symposium of wood-plastic composite in China: Development and prospect; 2007 November; Yangling, China. Wood-plastic composite council of CPPIA. Falk, R., Vos, D., and Cramer, S.M. 1999. The comparative performance of woodfiber-plastic and wood-based panels. In: Proceedings, 5th International Conference on Woodfiber-Plastic Composites, 19995 May; Madison, Wisconsin, USA. Forest Products Society. Green, E., 2003. Time to re-focus. In: Proceedings, WPC Viable Opportunities in Europe; 2003 September; Vienna, Austria. Applied Market Information Ltd.

21
Han, Y., Gardner, D.J., and C. H. West. 2007. Study of cross-linked HDPE-Wood plastic composite by reactive extrusion. Technical project report 08-16, Advanced Engineered Wood Composite Center, University of Maine. Han, Y., Gardner, D.J., and C. H. West. 2008. Investigation of foamed styrene wood composites by reactive extrusion, Technical project report 08-27, Advanced Engineered Wood Composite Center, University of Maine. Han, Y., Gardner, D.J. 2009. New technologies and market applications for WPCs. In: Proceedings, Wood-plastic and Natural Fiber Composites 2009; 2009 October, Baltimore, Maryland, USA. Principia Partners. Han. Y., and Gardner, D.J. 2009. Foamed Styrene-Based WPC using Physical Blowing Agent Created during Reactive Extrusion. In: Proceedings, 10th International Conference on Woodfiber-Plastic Composites, 2009 May; Madison, Wisconsin, USA. Forest Products Society. Kretschmann, D.E. 2010. Ch. 7 Stress grades and design properties for lumber, In: Wood Handbook, Wood as an Engineering Material, Forest Products Lab. General Technical Report FPL-GTR-190, USDA Forest Service, Forest Products Laboratory, Madison, WI. Matuana, L., Park, C.B., and Balatinecz, J.J. 1995. Charaterization of microcellular PVC/Wood-fiber composites. In: Proceedings, ANTEC 1995; 1995 July, Chicago, Illinois, USA. Society of Plastics Engineers. Morton, J. 2005. WPCs-Putting innovation of faster track. In: Proceedings, 8th International Conference on Woodfiber-Plastic Composites, 2005 May; Madison, Wisconsin, USA. Forest Products Society. Nash, J. 2005 The outstanding growth in WPC in context. In: Proceedings, In: Proceedings, WPC Viable Opportunities in Europe; 2003 September; Vienna, Austria. Applied Market Information Ltd. Oporto, G.S., Gardner, D.J., Bernhardt, G., and Neivandt, D.J. 2009. Forced Air Plasma Treatment (FAPT) of Hybrid Wood Plastic Composite (WPC)–Fiber Reinforced Plastic (FRP) Surfaces. Composite Interfaces. 16:847-867

22
Park, C. 2004. Handbook of polymeric foams and foam technology Ch.14 Wood flour composite foams, Cincinnati, OH, USA: Hanser Gardner Publications. Rizvi, G.M., Park, C.B., Lin, W.S., Guo, G., and Pop-lliev R. 2003. Expansion mechanisms of plastic/wood-flour composite foams with moisture, dissolved gaseous volatiles and undissolved gas bubbles. Polymer Engineering. 43(7): 1347-1360. Smith, P.M., 2002. Residential Decking & Railing, In: Proceedings, Progress in WPC; 2002 May, Toronto, Canada, May 23-24, 2002. Song, W., 2005. Woodfiber and natural fiber plastic composites in China: Opportunities and obstacles. In: Proceedings, 2nd Wood Fiber Polymer Composites Symposium Applications and Perspectives, 2005 March; Bordeaux, France. Center Technique Du Bois Et De L’ameublement (CTBA). Toloken, S., 2007. China’s plastic-wood composites industry advancing. Plastics News-Internet edition, www.plasticsnews.com, 2007, November. Yangling, X. 2007. Evolution of the North American wood plastic composite industry. In: Proceedings, 1st international symposium of wood-plastic composite in China: Development and prospect; 2007 November; Yangling, China. Wood-plastic composite council of CPPIA.

23
HEAT TREATMENTS OF WOOD TO IMPROVE DECAY RESISTANCE
Roger M. Rowell1
ABSTRACT
Heating wood to improve performance dates back many thousands of years. This method results in increased decay resistance and improved dimensional stability to different degrees depending on the process used. Reductions in hygroscopicity, increased dimensional stability and decay resistance of heat treated wood depend on decomposition of a large portion of the hemicelluloses in the wood cell wall. In theory, these hemicelluloses are converted to small organic molecules, water and volatile furan-type intermediates. There is a strong connection between reducing the wood moisture content and decay resistance. As dimensional stability increases and hygroscopicity decreases, resistance to decay increases. A reduction in swelling over 40% results in no weight loss in a brown-rot decay test. However, strength properties are reduced in heat treated wood as a result of the degradation of the cell wall matrix due to the degradation of the hemicellulose polymer. Keywords: heat treated wood, brown-rot fungus, equilibrium moisture content, weight loss, strength loss.
INTRODUCDTION
With an increased awareness of the fragility of our environment and the need for durability in wood products, new technologies have been developed to increase the service life of wood materials without the use of toxic chemicals. Issues of sustainability, carbon sequestration and performance converge in this search for environmentally friendly methods of wood preservation. Heat treatments of wood has been studied for many years and are now commercial (Rowell 2005). This method results in increased decay resistance and improved dimensional stability to different degrees depending on the process used. Strength properties of the wood is also affected.
1 Professor Emeritus, University of Wisconsin, Madison, WI, USA and Guest Professor, EcoBuild, Stockholm, Sweden, email [email protected].

24
PROCESSES
Heating wood to improve performance dates back many thousands of years (Stamm 1964). The Kalvträsk wooden ski was bent using heat by the Saami and used in northern Sweden over 5200 years ago (Åström 1993, Insulander 1999). From hieroglyphic pictures of furniture in Egypt between 2500 and 3000 BC, there are chairs made using heat bent wood members (Rivers and Umney 2005). The Egyptians also bent wood for bows using hot water around 1900 BC as shown on tomb paintings (Ostergard 1987). In the 11th century, the Viking shipbuilders also bent wood using heat for parts of the ship (Olsen and Crumlin-Pedersen 1967). In the Norwegian stave churches, large beams were bent using heat and joined (Bugge 1953, Holan 1990). Finally, the wooden cask makers knew how to heat-bend wood 2000 years ago (Twede 2005). A picture of a wooden cask is shown on the wall of a 2690 BC Egyptian tomb (Kirby 1971). Wooden casks were also made by the Romans to store wine (Twede 2005). In the early part of the 20th century it was found that drying wood at high temperature increased dimensional stability and a reduction in hygroscopicity (Tiemann 1915, Stamm and Hansen 1937). Later, it was found that heating wood in molten metal at temperatures between 140 and 320 °C reduced swelling in Sitka spruce by 60% and also increased resistance to microbiological attack (Stamm et al. 1946). They also found that the increase in stability and durability also increases brittleness and loss in some strength properties including impact toughness, modulus of rupture and work to failure. The treatments usually cause a darkening of the wood and the wood has a tendency to crack and split. Burmester studied the effect of temperature, pressure and moisture on wood properties (1973). He found that the optimum conditions for pine were 160 °C, 20-30% moisture and 0.7 MPa pressure. He reported high dimensional stability and resistance to brown-rot fungi attack and minimal loss of strength. He named his process as FWD (Feuchte-Wärme-Druck). More recently, Norimoto et al. (1993) and Ito et al. (1998) heated wet wood to improve dimensional stability. Inoue et al. (1993) heated wet wood to fix compression set in wood. Several names have been given to the various heat treated products and treatments for wood. Including Staypak and Stabwood in the United States (using dry wood); Lignostone and Lignofol from Germany (using dry wood),

25
Jicwood and Jablo from the UK, Thermowood in Finland (using water vapour), Plato in The Netherlands (using water), Perdure from Canada (using steam), Oil Heat Treated (OHT) from Germany (using oil) and New Option Wood/Retification in France (using nitrogen) (Hill 2006).
CHEMISTRY
There are a variety of thermal modification processes that have been developed. The results of the process depend on several variables including time and temperature, treatment atmosphere, wood species, moisture content, wood dimensions and the use of a catalyst (Stamm 1956, Millett and Gerhards 1972). Temperature and time of treatment are the most critical elements and treatments done in air result in oxidation reactions not leading to the desired properties of the treated wood. Wood degrades faster when heated in either steam or water as compared to dry conditions (MacLean 1951, 1953, Millett and Gerhards 1972, Hillis 1975). Stamm (1956) showed that wood heated in the presence of oxygen degraded more rapidly that wood heated in an oxygen-free atmosphere. As the treatment time increases, embrittlement of the wood increases (Yao and Taylor 1979, Edlund 2004). Generally, weight loss occurs to a higher extent in hardwoods as compared to softwoods which may be due to the higher content of acetyl groups in hardwoods releasing more acetic acid during heat treatment contributing to the acid hydrolysis (MacLean 1951, 1953, Millett and Gerhards 1972, Hillis 1975). As the wood is heated, the first weight loss is due to the loss of water, followed by a variety of chemistries that produce degradation products and volatile gasses (Shafizadeh and Chin 1977). As the temperature increases, wood cell wall polymers start to degrade. Pyrolysis of the hemicelluloses takes place about 270°C followed closely by cellulose. Lignin is much more stable to high temperature (Stamm 1956). In the early stages of degradation, 83% of the weight loss is water (Mitchell et al. 1953). The hemicellulose polymers are the first to degrade followed by cellulose resulting in the formation of furans such as furfural and hydoxymethyl furfural (Figure 1). The hemicelluloses and cellulose are also degraded to internal ethers and other rearrangement products. The optimum amount of water that can be lost is three molecules of water from two anhydroglucose units or 16.7 percent of the carbohydrate polymers or 12 percent of the wood (Stamm and Baechler 1960). Table 1 shows the weight loss resulting from heating wood at different temperatures in the presence of moisture. As the temperature increases, so does the weight loss.

26
Figure 1: Formation of hydroxymethyl furfural from hexoses and furfural from
pentoses as a result of heat treatments of wood.
Table 1: Weight loss due to heating wood *
Heating Temperature (°C) Time (hrs) Weight Loss (%) 120 2 2-3 120 10 5 180 10 10-12 190 2 4-7 190 12 5-10 200 10 10-17 220 1 6-7 235 4 25 240 0.5 7
* Data taken from several sources Table 2 shows the sugar analysis before and after treating aspen with high pressure steam (220°C) for 8 minutes. The data shows that in the very early stages of weight loss, the hemicellulose polymers are breaking down and cellulose remains unchanged. Over half of the arabinan and rhamnans are lost during this initial heating.

27
Table 2: Sugar analysis of aspen before and after heating at 220 °C for 8 minutes.
Wt Loss %
Total Carbohydrate
%
Arabian %
Galactan %
Rhamnan %
Glucan %
Xylan %
Mannan %
0 61.8 0.56 0.68 0.30 42.4 16.3 1.6 2.2 59.2 0.20 0.58 0.14 42.2 14.6 1.5
MOISTURE AND DIMENSIONAL STABILITY
Because of the loss of hygroscopic hemicellulose polymers during heat treatment, the equilibrium moisture content (EMC) is reduced. Dimensional stability of heat treated wood was first thought to be due to a cross-linking of cellulose chains (Stamm and Hansen 1937). The furan intermediates that form (Figure 1) from the decomposition of the hemicelluloses have poor hygroscopicity and have little effect on the EMC.
Table 3: Reduction in EMC as a result of heating wood.
Wood species Conditions Reduction in EMC (%)
Reference
Pinus pinaster 190 °C 8-24 hrs
50 Esteves et al. 2006
Pinus sylvestris 220 °C 1-3 hrs
50 Thermowood handbook 2003
Eucalyptus globulus
190 °C 2-24 hrs
50 Esteves et al. 2006
Pinus sylvestris Plato process 50-60 Tjeerdsma 2006 Table 3 shows a summary of recent results on EMC resulting from heat treatments from various authors. In most cases, a 50% reduction in EMC is observed. In most examples given, the process was done in a vapor atmosphere between 190 and 220°C with a relative humidity of 35 to 65%. Table 4 shows the reduction in swelling of wood that has been heat treated.

28
Table 4: Dimensional stability of various woods as a result of heat treatment.
Wood species Conditions ASE (%)
Reference
Pinus pinaster 170 °C WL1 2% 50 Esteves et al. 2006 Eucalyptus
globulus 190 °C WL 2% 77 Esteves et al. 2006
Eucalyptus globulus
200 °C WL 10% 60 Esteves et al. 2006
Pinus sylvestris 220 °C 40 Rapp and Sailer 2001 1WL = Weight loss, ASE = antishrink efficiency
DECAY RESISTANCE
As dimensional stability increases and hygroscopicity decreases in heat treated wood, resistance to decay also increases (Stamm et al. 1946, Stamm and Bacchler 1960, Hillis 1984). Table 5 shows the data of Stamm et al. 1946). A reduction in swelling over 40% results in no weight loss in the decay test. Similar results were obtained when the test fungus was Lenzites trabea 517 (Stamm and Bacchler 1960).
Table 5: Relationship between reduced swelling and decay resistance of white pine using Trametes serialis fungus. (Stamm et al. 1946)
Reduction in swelling (%) Weight loss due to decay (%) 30-33 12 33-38 4.5
40 or more 0 Table 6 shows fungal resistance of two types of heat treated wood (Rapp and Sailer 2001). Pine (Pinus sylvestris) and spruce (Picea abies) were heated in oil or air at three different temperatures and the treated blocks were tested for decay for 19 weeks in the EN 113 (1996) decay test using Coniophora puteana fungus. The data shows that heating in oil is more effective in reducing attack by fungi than heating in air. This may be due to the presence of the oil in the samples.

29
Table6: Fungal resistance of pine and spruce heated in oil or ai*r.
Oil Heated Air Heated Pine Spruce Pine Spruce
Temperature (°C)
Wt loss (%)
Wt loss (%)
Wt loss (%)
Wt loss (%)
Control 40 48 180 13 15 25.0 31.2 200 1.9 13.1 15.8 26.7 220 2.0 0.0 11.0 5.5
*Data taken from several sources Welzbacher and Rapp compared different types of industrially heat treated products using several different fungi in laboratory tests and in different field and compost conditions. Table 7 shows the weight loss during an EN 113 test using three different fungi. The heat treatment in oil was the most effective but it is not known the effect of the oil in the decay test (Welzbacher and Rapp 2007).
Table 7: Weight loss (%) of different woods and different heat-treating processes1 due to attack by Poria placenta, Coriolus versicolor and Coniophora puteana.
Material P. placenta C. versicolor C. puteana Pine (control) 31.0 5.1 47.5
Douglas fir (control) 14.0 2.6 27.4 Oak (ontrol) 0.8 14.3 3.9
Plato (Heat Treated) 10.0 6.8 3.7 Premium (Heat
Treated) 16.0 9.0 1.9
NOW (Heat Treated) 13.3 7.8 12.2 OHT (Heat Treated) 7.4 5.6 3.4
1 Plato = Heat treated (The Netherlands), Premium = Heat treated (Finland), NOW = New Option Wood, OHT = Oil-heated wood. Resistance to decay in heat-treated wood is probably due to the loss of hemicellulose polymers in the cell wall and the reduction in cell wall moisture content as a result (Ibach and Rowell 2000). As was shown

30
earlier, the most weight loss in the heating process, the more durable the heat-treated wood.
STRENGTH
Stamm et al. (1946) were the first to report a lost of mechanical properties as a result of heat treatments of wood. They heated wood at 320°C for one minute or 150°C for a week and found a 17 percent reduction in modulus of rupture (MOR) when heated in molten metal and 50 percent when heated in air. Under the same conditions, there was less loss in modulus of elasticity (MOE). Mitchell (1988) found that losses in strength properties were much less when wood was heated dry as opposed to wet, with a greater loss in MOR than in MOE. Rusche (1973) found that strength losses were related to rate and extent of mass loss when heating beech and pine in the presence and absence of air at temperatures ranging from 100 to 200°C. Losses in maximum strength and work to maximum load were greater for compression than for tension loads. Loss in MOE was only significant when the mass loss was greater than 8 to 10% and was the same for both species.
Rapp and Sailer (2001) heated pine and spruce at 180 to 220°C for various times in air and in oil and determined MOR and MOE in a three point bending test. The highest MOE was 11,000 N/mm2 in oil heating and little loss in MOE in both air and oil heating. MOR, however, decreased 30% in oil heating and impact bending strength decreased and the wood became brittle. Oil-heated wood lost about 50% and air-heating lost over 70% of the impact strength compared to controls. Table 8 gives a summary of other data on strength changes in heat-treated wood. In all cases, there was only a small decrease in MOE but major changes in MOR depending on temperature, time and atmosphere.
Table 8: Change in MOR as a result of heat treatment of various woods.
Species Treatment MOR (%)
Reference
Betula pendula Vapor, 200°C -43 Johansson and Moren 2005
Beech Vapor 200°C -50 Yidiz et al. 2006 Pinus sylvestris OHT 220°C -30 Rapp and Sailer 2001 Pinus pinaster O2 180-200°C -6 - 25 Esteves et al. 2006

31
CONCLUSIONS
Heating wood under different conditions is a method to increase decay resistance. Reductions in hygroscopicity, increased dimensional stability and decay resistance depend on decomposition of a large portion of the hemicelluloses in the wood cell wall. Strength properties are reduced in heat treated wood as a result of the degradation of the cell wall matrix associated with the hemicellulose polymer degradation. The critical sugar in the hemicelluloses that may be the trigger for fungal attack is arabinose as it is the only sugar in a less stable five-member ring as compared to sugars in a stable six-membered ring.
REFERENCES
Burmester, V.A. (1973). Effect of heat-pressure treatments of semi-dry wood on its dimensional stability. Holz als Roh und Werkstoff, 31(6):237-243.
Bugge, A. (1953). Norwegian stave churches. Dreyers Forlag, Oslo. Edlund, M.-L. (2004). Durability of some alternatives to preservative treated
wood. International Research Group on Wood Preservation. Doc. No. IRG/WP 04-30353.
Esteves, B., Domingos, I. and Pereira, H. (2006). Variation of dimensional stability and durability of eucalypt wood by heat treatment. Proceedings of ECOWOOD 2006, 2nd International Conference on Environmentally Compatible Forest Products, Oporto, Portugal, 20-22.
European Community for Standardization. (1996). EN-113 Wood preservatives – Determination of toxic values of wood preservatives against wood destroying Basidiomycetes cultures on agar medium.
Hill, C.A.S. (2006). Wood Modification: Chemical, Thermal and Other Processes. John Wiley & Sons, Chichester, England, 239 pp.
Hillis, W.E. (1975). The role of wood characteristics in high temperature drying. Journal of the Institute of Wood Science 7(2):60-67.
Hillis, W.E. (1984). High temperature and chemical effects on wood durability. Wood Science Technology. 18:281-293.
Holan, J. (1990). Norwegian wood: A tradition of building. Rizzoli International Publications, Inc., New York, ISBN 0-8478-0954-4.
Ibach, R.E. and Rowell R.M. (2000). Improvements in decay resistance based on moisture exclusion. Molecular Crystals and Liquid Crystals, 353, 23-33.
Inoue, M., Norimoto, M., Tanahashi, M., and Rowell, R.M. (1993). Steam or heat fixation of compressed wood. Wood and Fiber Science, 25(3): 224-235.

32
Insulander, R. (1999). Reconstruction of the saami bow: A comparison between findings in Sweden, Norway and Finland. Fornvanen, 94(2):73-87.
Ito, Y., Tanahashi, M., Shigematsu, M. and Shinoda, Y. (1998). Compressive-molding of wood by high pressure-steam treatment: Part 2. Mechanism of permanent fixation. Holzforschung, 52(2):217-221.
Johansson, D. and Moren, T. (2005). The potential of colour measurement for strength prediction of thermally treated wood. Holz als Roh- und Werkstoff, 64:104-110.
Kilby, K. (1971). The cooper and his trade. John Baker Ltd., London, ISBN 0-212-98399-7.
MacLean, J.D. (1951). Rate of disintegration of wood under different heating conditions. American Wood Preservers’ Association Proceedings, 47:155-168.
MacLean, J.D. (1953). Effect of steaming on the strength of wood. American Wood Preservers’Association Proceedings, 49:88-112.
Millett, M.A. and Gerhards, C.C. (1972). Accelerated aging: residual weight and flexural properties of wood heated in air at 115 °C to 175 °C. Wood Science, 4(4):193-201.
Mitchell, P.H. (1988). Irreversible property changes of small loblolly pine specimens heated in air, nitrogen, or oxygen. Wood and Fiber Science, 20(3):320-355.
Mitchell, R.L., Seborg, R.M. and Millett, M.A. (1953). Effect of heat on the properties and chemical composition of Douglas-fir wood and its major components. Journal of the Forest Products Research Society, 3(4):38-42.
Norimoto, M., Ota, C., Akitsu, H., and Yamada, T. (1993). Permanent fixation of bending deformation in wood by heat treatment. Wood Research, 79:23-33.
Olsen, O. and Crumlin-Pedersen, O. (1967). A report of the final underwater excavation in 1959 and the salvaging operation in 1962. Acta Archaeologicas, 38:73-174.
Ostergard, D.E. (1987). Bent wood and metal furniture 1850-1946. The American Federation of Arts, New York, ISBN 0-295-96409-X.
Rapp, A.O. and Sailer, M. (2001.) Oil heat treatment of wood in Germany – State of the art. Environmental Optimization of Wood Protection. Cost Action E22. In: Proceedings of Special Seminar, Antibes, France.
Rivers, S. and Umney, N. (2005). Conservation of furniture. Elsevier, Butterworth-Heinemann, Oxford, ISBN 0-7506-09583.
Rowell, R.M., (2005). Handbook of Wood Chemistry and Wood Composites, Taylor and Francis, Boca Raton, FL, 487 pp.

33
Rusche, V.H. (1973). Thermal degradation of wood at temperatures up to 200 °C – Part I: Strength properties of dried wood after heat treatment. Roh- und Werkstoff, 31:273-281.
Shafizadeh, F. and Chin, P.P.S. (1977). Thermal degradation of wood. In: Wood Technology: Chemical Aspects, I.S. Goldstein (Ed.), ACS Symposium Series 43: 57-81.
Stamm, A.J. (1956). Thermal degradation of wood and cellulose. Industrial and Engineering Chemistry, 48(3):413-417.
Stamm, A.J., (1964). Wood and cellulose science. Ronald Press, New York, NY.
Stamm, A.J. and Baechler. R.H. (1960). Decay resistance and dimensional stability of five modified woods. Forest Products Journal, 10: 22-26.
Stamm, A.J., Burr, H.K. and Kline, A.A. (1946). Staybwood. Heat stabilized wood. Industrial and Engineering Chemistry, 38(6): 630-634.
Stamm, A.J. and Hansen, L.A. (1937). Minimizing wood shrinkage and swelling. Effect of heating in various gasses. Industrial and Engineering Chemistry, 29(7):831-833.
Tiemann, H.D. (1915). The effect of different methods of drying on the strength of wood. Lumber World Review, 28(7): 19-20.
Thermowood handbook (2003). Finnish thermowood association, c/o Wood Focus Oy, P.O. Box 284, Snellmaninkatu 13, Helsinki, Finland, FIN-00171.
Tjeerdsma, B.F. (2006). Heat treatment of wood – thermal modification. SHR Timber Research, Wageningen, The Netherlands.
Twede, D. (2005). The cask age: The technology and history of wooden barrels. Packing Technology and Science, 18(5):253-264.
Welzbacher, C.R. and Rapp, A. (2007). Durability of thermally modified timber from industrial-scale processes in different use classes: Results from laboratory and field tests. Wood Material Science and Engineering, 2:4-14.
Yao, J. and Taylor, F. (1979). Effect of high-temperature drying on the strength of southern pine dimension lumber. Forest Products Journal, 29(8):49-51.
Yidiz, S, Gezer, E.D. and Yildiz, U.C. (2006). Mechanical and chemical behavior of spruce wood modified by heat. Building and Environment, 41:1762-1766.
Åström, K. (1993). The ski from Kalvträsk. Västerbotten, 74(3):129-131.

34
NORWEGIAN FOREST PRODUCTS INDUSTRY – IMPACT ON
CLIMATE AND VALUE ADDED
Flæte, P.O.1
ABSTRACT
Forests play an important role as carbon sinks. Productive forest area covers 24% of the total land area in Norway and the forests have a growing stock of 784 million m³. Annual increment is approximately 25 million m³, and annual commercial roundwood removal is approximately 8 million m³. In 2005 the net sequestration was calculated at 28.6 million tonnes of CO2, which would offset 50% of the total greenhouse gas (GHG) emissions in Norway that year. The forest products industry can play a significant role in combating climate change by optimising the use of raw material, increasing efficiency, producing bioenergy, substitution of materials with high content of fossil raw materials or energy, and by expanding into bio-refinery products while developing the competitiveness of the sector. Utilising this potential necessitates that the entire forest based value chain has to be analysed. Products have to be assessed both on the basis of their GHG balance and value added to arrive at correct decisions for climate friendly and profitable utilisation of the wood resources. This paper presents results from an ongoing research project analysing material flows, GHG-balance and value added in the Norwegian forest products industry. The paper reports value added, GHG emissions and emission intensities for the Norwegian forest products industry at macro level. The project is the first phase of a larger research program covering the entire Norwegian forest based value chains. Key words: Greenhouse gas emissions, value added, emission intensity, life cycle assessment, forest products.
1 Senior researcher, Norsk Treteknisk Institutt, P.O. Box 113 Blindern, NO-0314 Oslo, Norway, Tel: +47 95136270, Fax: +47 22604291, E-mail: [email protected]
35
INTRODUCTION
Greenhouse gas (GHG) emissions due to human activities have grown since pre-industrial times, with an increase of 70% between 1970 and 2004. Carbon dioxide (CO2) is the most important anthropogenic GHG. Its annual emissions grew by about 80% between 1970 and 2004. Global atmospheric concentrations of CO2, methane (CH4) and nitrous oxide (N2O) have increased markedly as a result of human activities since 1750 and now far exceed pre-industrial values determined from ice cores spanning many thousands of years (IPCC 2007). Forests play an important role as carbon sinks. In Norway productive forest area covers 24% of the total land area, and the forests have a growing stock of 765 million m³. Annual increment is approximately 25 million m³, and annual commercial roundwood removal is approximately 8 million m³ (SSB 2009). In 2008 the net sequestration was calculated at 28.6 million CO2-equivalents, which would offset approximately 50 % of the total GHG emissions in Norway that year. The sequestration increased by about 153 per cent from 1990 to 2008.The average annual net sequestration from the Land-Use, Land-Use Change and Forestry (LULUCF) sector was about 19.9 million tonnes CO2-equivalents for the period 1990-2008. The explanation for this growth is a continued increase in standing volume and gross increment in Norwegian forests, while the amount of CO2 emissions due to harvesting and natural losses has been quite stable. The increase in living biomass is due to an active forest management policy, and to some extent to natural factors (Climate and Pollution Agency 2010). The global forest products industry can play a significant role in combating climate change by optimizing the use of raw material, increasing efficiency, producing bio-energy, substitution of materials with high content of fossil raw materials or energy, and by expanding into bio-refinery products while developing the competitiveness of the sector (FAO 2006). Utilising this potential necessitates that products from the forest based value chain (forestry, wood working industry, pulp and paper industry) has to be analysed on the basis of their GHG balance and value added to arrive at correct decisions for climate friendly and profitable utilisation of the wood resources. The objective of the work presented in this paper was to study value added, GHG emissions and emission intensities for the Norwegian forest products industry at macro level.

36
MATERIAL AND METHODS This report is based on data from Statistics Norway. Data are mainly collected from Statistics Norway´s main subjects: 01 Natural resources and the environment, 09 National accounts and external trade, and 10 Industrial activities (http://www.ssb.no/english/subjects/). The results are grouped on forestry and logging, wood and wood products, and pulp, paper and paper products. Value added Gross domestic product (GDP) is an indicator for total value added in a country, and also an expression for gross income generated from domestic production. GDP is measured in market prices, and is defined and compiled from three different main approaches: the production approach (I), the expenditure approach (II) and the income approach (III). (I) = Output (basic price) - Intermediate consumption (purchaser price) + Taxes on products - Subsidies on products = Output (producer price) - Intermediate consumption (purchaser price) + Taxes on imports + VAT + Customs duties = Total value added (basic price) + Taxes on products - Subsidies on products = Total value added (producer price) + Taxes on imports + VAT + Customs duties (II) = Final consumption expenditure + Gross fixed capital formation + Changes in inventories + Exports - Imports = Final uses - Imports = Final domestic uses + Exports - Imports (III) = Compensation of employees + Operating surplus + Consumption of fixed capital + Taxes on production - Subsidies on production Value added and gross income generated from domestic production in an industry or sector (or in total for all industries/sectors), is derived and defined as output less intermediate consumption. Value added is published in basic prices. Basic price is amount receivable by the producer from the purchaser for a unit of a good or service produced as output minus any tax payable to government, and plus any subsidy receivable from government, on that unit as a consequence of its production or sale.

37
GHG emissions Figures for GHG emissions are based on the Norwegian emission inventory. The Norwegian emission inventory is a joint undertaking between the Climate and Pollution Agency and Statistics Norway. Statistics Norway is responsible for the collection and development of activity data, and emission figures are derived from models operated by Statistics Norway. The Climate and Pollution Agency is responsible for the emission factors, for providing data from specific industries and sources and for considering the quality, and assuring necessary updating, of emissions models like e.g. the road traffic model and calculation of methane emissions from landfills. Emission data are used for a range of national applications and for international reporting. The Climate and Pollution Agency is responsible for the Norwegian reporting to United Nations Framework Convention on Climate Change (UNFCCC) and to United Nations Economic Commission for Europe (UNECE). Greenhouse gas (GHG) emissions are measured in CO2-equivalents. In the environmental accounts, the following GHG emission components are included: Carbon dioxide (CO2), nitrous oxide (N2O), methane (CH4), PFCs (perfluorocarbons), HFCs (hydrofluorocarbons) and SF6 (sulphur hexafluoride). The total emission of greenhouse gases is estimated by adding the emissions of all greenhouse gas components converted to CO2 equivalents. The emission of greenhouse gases is weighted in relation to their heating potential with a global warming potential (GWP) value. The GWP value of a gas is defined as the accumulated influence on greenhouse effect from one tonne of emission of the gas compared to one tonne of emission of CO2 over a given time period. The emission of greenhouse gases is weighted together to CO2 equivalents by the GWP values. The GWP for the different gases used in the Norwegian emission model are: CO2 = 1, CH4 = 21, N2O = 310, etc. The Norwegian emission model uses approximately 130 industries (economic sectors). Emission intensity Emissions per unit of GDP are often used as a sustainable development indicator. In this paper emission intensities were calculated as the ratio of the GHG emissions from an economic activity over the value added created by that same

38
activity. To analyse the development over time value added was expressed in constant 2000 prices. The unit used for the GHG emission intensity here is tonnes of GHG emissions per million NOK (in 2000 prices). RESULTS In 2008 the turnover in the forest products industry (forestry, woodworking industry, pulp and paper industry) in Norway was 47.9 billion NOK (5.5 % of the total turnover in Norwegian industry). 4 100 persons were employed in forestry, 16 047 in the wood working industry, and 5 234 in the pulp and paper industry in 2008. In 1952 32 400 were employed in forestry, 31 700 in the wood working industry, and 21 500 in the pulp and paper industry Value added Value added for the forest products industry increased from 2.718 billion NOK in 1970 to 17.695 billion NOK in 2007. Estimated value added (real value) for the Norwegian forest products industry for the years 1970-2007 is shown in Fig 1. Although the value added has increased significantly, the forest products industry´s share of the Norwegian gross domestic product (GDP) has been reduced during this period (Fig 2.).

39
Fig. 1. Real value added (base year: 2000) in the Norwegian forest products industry (1970-2007).
Fig. 2. Value added in the Norwegian forest products industry in percent of GDP (1970-2007). GHG emissions The total GHG emissions for Norway except international air transport and ocean transport were 49,7 mill tonnes CO2-equivalents in 1990 and 53,7 mill tonnes CO2-equivalents in 2008. GHG emissions from the Norwegian forest

40
products industry for the years 1990-2008 are shown in Fig 3. Fig 4 shows the forest products industry´s share of the total Norwegian GHG emissions from 1990 to 2008.
Fig 3. GHG emissions from the Norwegian forest products industry (1990-2008).
Fig 4. GHG emissions from the Norwegian forest products industry in percent of total Norwegian GHG emissions (1990-2008).

41
Emission intensity Fig 5 shows GHG emission intensities for the Norwegian forest products industry for the years 1990-2008. Forestry had the lowest emission intensity and pulp and paper industry the largest. However, Fig 5 shows that the emission intensity in the pulp and paper industry has been considerably reduced in recent years.
Fig. 5. Emission intensity in the Norwegian forest products industry calculated as tonnes CO2-equivalents per mill NOK value added (1990-2008). DISCUSSION The calculated GHG emissions are partly based on energy statistics and activity data, and on reported figures from single plants, implying that several sources of error can occur. However, the results show very clearly that GHG emission intensity in the Norwegian forest products industry has been significantly reduced during the last 10 years. Another important characteristic is that the largest reductions have been achieved in the pulp and paper industry. Regarding the forest products industry´s impact on climate it should be emphasised that this paper only focus on GHG emissions from industry. To give a more complete picture the carbon stock change in forest biomass and

42
harvested wood products should be included, and the effect of using wood for energy and products instead of alternative products should be accounted. Combustion of fossil fuels is the main reason for the increased levels of CO2 in the atmosphere and wood can substitute several energy and GHG intensive products. However, such an approach requires detailed and disaggregated studies to enable comparisons of different products. The top-down approach based on aggregated economic and environmental data lacks the level of details needed to distinguish the GHG balance and value added by specific processes within an industrial sector. Life Cycle Assessment (LCA) is an objective method to evaluate the environmental burdens associated with a product, process or activity by identifying and quantifying energy and material uses and releases to the environment, and to evaluate and implement opportunities to influence environmental improvements. The method assesses the entire life cycle (cradle to grave) of the product, process or activities, encompassing extracting and processing material; manufacturing, transporting and distribution; use, reuse and maintenance; recycling and final disposal. Life Cycle Inventories (LCI) is part of sustainable practices to aid choice of product, product improvements, and carbon sequestration policies. LCI data can be merged into scientific databases to enable a complete LCA of a system (product). LCI essentially measures all inputs and outputs for every stage through a cradle-to-grave assessment. LCA aggregates the data into key environmental risk indices like global warming potential. By comparing different products and manufacturing processes, LCA makes clear the trade-offs between one product and another. The 14000 series of the ISO Standards (ISO 2006) provides an internationally accepted framework for LCA. Important issues, like system boundaries, definition of realistic life cycles, allocation of multiple inputs and outputs etc, have to be sorted out in the initial phase of the project. In order to be able to calculate value added at product level, a more detailed method than used in traditional analyses on firm or sector level has to be adapted. Sathre & Gustavsson (2009) developed a process-based methodology and performed bottom-up analysis based on the material and energy balances of specific industrial processes. By this approach it is possible to focus on the value added by particular industrial transformations, and to compare the value

43
added by individual processes. Moreover, using this approach one can analyse innovative industrial processes for which technological process data are available, but are not yet established on a commercial scale and thus lack market data needed for macroeconomic analysis. REFERENCES Climate and Pollution Agency 2010. National Inventory Report 2010. Greenhouse Gas Emissions 1990-2008, TA2639/2010, Oslo: 319 pp. IPCC 2007. Climate Change 2007: The Physical Science Basis. Contribution of Working Group I to the Fourth Assessment Report. Intergovernmental Panel on Climate Change. ISO 2006. Environmental Management Systems. International Organization for Standardization. Sandmo, T. 2010. The Norwegian Emission Inventory 2010. Documentation of methodologies for estimating emissions of greenhouse gases and long-range transboundary air pollutants. Statistics Norway. Documents 21/2010: 236 pp. Sathre, R. & Gustavsson. L. 2009. Process-based analysis of added value in forest product industries. Forest Policy and Economics 11: 65-75. Statistics Norway 2010. www.ssb.no

44
LATVIA FOREST SECTOR FOR THE ACCUMULATED
INFORMATION AND THE AVAILABLE DATA ASSESSMENT
Sigita Tunkele1, Jānis Mārciņš2
ABSTRACT
European forest industry contributes a complex value added chain, including forestry, processing sector of timber industry and further development sector of timber. Each sector is being collected, processed and stored the specific data, which is necessary to collect in the single data system for all forest industry. This data system would allow to understand and to analyze the economic contribution of each sector. European Union (EU) member states is should seek to harmonize the forest industry data system, it is, to establish a single economic value of forests and consistently linked the forest balance with wooden land, timber, forestry economic activities in the cash flow accounts and wood supply / use in the natural and monetary values. In EU is the data system of forest industry, but each European country is necessary assess its suitability and to adapted to situation which is in the country. Is necessary to introduce and develop harmonized the forest industry data system in Latvia then is necessary make the current situation evaluation, including a stored information analysis of forest industry, identify all institutions and organizations which deal with forest industry data collection, processing and analysis. Additional is necessary to analyze a regulatory environment which to assess this data suitability and compliance in the forest industry as well the key problems and failures. Key words: data analysis, forest sector, Latvia
1 PhD student, in the program “Forest economics and policy”, Latvia university of Agriculture in Latvia, Dobeles iela 41, Jelgava, LV-3001, Latvia, Phone: +371 63010605, Fax: +371 63010609, E-mail: [email protected] 2 Leading researcher, Department of Woodworking, Latvia university of Agriculture, Dobeles iela 41, Jelgava, LV-3001, LV-3001, Phone +371 63029184, Fax: + 371 63029184. E-mail: [email protected]

45
INTRODUCTION
According with European framework for integrated environmental and forest economic accounting for forests (abbreviation – IEEAF) – European Commission, Eurostat, European union member states should strive on harmonize forest resource accounting system, through a single forests economic value determination on the national account system. IEEAF objective is to consistently to link a forest balance with wooden land, wood resources, forestry economic activities of cash flow accounts and wood supply/use of economy the physical and monetary values in the framework (The European Framework…, 2010). At the moment various Latvian institutions and organizations engaged in the collection of data on the forest sector, where the one of the most important is the Ministry of Agriculture (abbreviation - MA) and the Central Statistical Bureau (abbreviation - CSB). At the same time is the other institutions dealing with various data collection, what can attributable to the forest sector in accordance with institutions responsible of delegation, as also after their initiative, mostly non-governmental in case. In parallel, many institutions deal with the publicly available of Ministry of Agriculture or Central Statistical Bureau data interpretation, as also deal with in addition calculation to conducting.
Forest industry description The forest industry composed of forestry, timber industry and wood thermal and chemical processing industry. The forest sector combines forest resources and based on the very diverse productions, trades and consumption in the single system whose elements are interrelated. The forest products includes the key raw materials (a round wood, pulpwood, wood chips and wood technology) and the primary processing of wood products (a sawn wood, wood based panels and energy products (a pellets and briquettes), as also the further development of timber products (a carpentry and joinery products and furniture) (1.pielikums…, 2010). Forestry supplied in the forest obtained goods and services directly to the consumption market or raw materials for further processing. The forest products may be of material (wood as raw material, mushrooms, berries, etc.), non-material (forest biodiversity, recreation facilities and other services) and the cumulative value (carbon attraction) (1.pielikums..., 2010). The wood resource extraction has been divided in roughly two equal parts between the state and private forest owners. After forest statistical inventory data (April 1, 2009) 47% of the total forest areas is the state forest and 53% - the others forests including the private forests (Meža…, 2009). The last 70

46
years, the forest area in Latvia has more or less doubled, while the volume of wood has increased to 630 million m3 after forest inventory statistical data (Meža…, 2009). The wood resource volumes in Latvian forests each year remains quite stable position – between 10 and 11 million m3 of wood each year. In 2009, according to State Forest Service data, the felling output was 10.73 million m3. 7.73 million m3 of wood was obtained from state forests, and 3.00 million m3 – from other forests, including from private forests (Projekts…, 2009, Fig. 1).
Fig. 1. Wood resource extraction dynamics, million m3
Forest industry information flow The forest industry is complexity, what incorporating not only a wide range of production activities and a range of services, institutions and administrative bodies, but also in other sector activities aspects and an influence to forest industry. The forest industry linkage with other industries is referred to as forest industry cluster (Forest…, 2010, Fig.2.).
Fig.2. Forest industry cluster in Latvia
FOREST AND WOOD
PRODUCTS

47
Since the forest sector has a different processes and activities complex, which complicates the information tracking in the single system. World practice shows that where there are several sectors or actors then are often set up in the large variety data processing and storage methods and systems that make harder traced the common material flow. In the forest industry material flow, starting from the forestry and logging to finished product trades, is the risk not enumerated the all information in one system - for example, the industry with high added value, because less information about it (G.Niblaeus, 2009,Fig.3.)
Fig. 3. Information accumulated with traceability
MATERIAL AND METHODS
One of the research methods is the survey. It is a survey of people using special forms, where are given questions. The study target group is the Latvia`s forest institutions, organizations. In the study were included in all institutions dealing with information collection, storage, processing and analysis about the forest industry. The planned sample size was 40 respondents, where include 20 respondents what to batch the information regularly and 20 respondents what to batch the information irregular about forest industry in Latvia. Achieved sample size was 40 respondents. To identify each of the identified institution within the accumulated data, was developed a common template, under which each institution was conducted the accumulated data analysis. A template consists of three sections: 1. General Information - includes information on institutions, data storage
functions and regulatory framework for forest sector data storage.
Information accumulated without traceability
Loss of
Harvesting Trasnport Reception Sawing Sorting Cut

48
2. Accumulated data characterization - the sector where the accumulated data, used for data classification;
3. Data groups description: 3.1. Background information - data group name, physical or monetary
value, data sources, data collection frequency, a data group publication date and data group description.
3.2. Data collection methods - information acquisition method, format, number of involved human resources, IT systems and other information;
3.3. Data processing methods - methods, deadlines, format, data analysis / modeling techniques, the number of human resources, IT systems and other information;
3.4. Data storage techniques - techniques of data collected in the further use, the data received at other institutions, number of human resources, IT systems used and other information;
3.5. Weaknesses / essential problems of the data collection, processing and analysis;
3.6. Assessment about of the data reliability level. Obtained compilation of results was used the SWOT analysis method. In business practice competitiveness assessment and development of appropriate strategies are used the SWOT analysis method based on the following elements: internal strengths, internal weaknesses, external opportunities and external threats (4). From SWOT matric is apparent 4 possible strategies (Table 1).
Table 1. SWOT analysis
Strengths Weaknesses Opportunities SO – full use a force to
benefit from opportunities. WO – reduce the weakness to take advantage from opportunities.
Threats ST – use and increase the strength to cope with threat.
WT – the business to tighten, liquidation or merger.

49
RESULTS AND DISCUSSION
First, the SWOT analysis is to choose the factors that reflect the forest industry within the strengths and weaknesses and identify opportunities and threats affecting it from outside (Table 2).
Table 2. Forest sector information chain SWOT analysis in Latvia Strengths Weaknesses Between public authorities the flow of
information regulates the interdepartmental agreement, clearly identifying the data group, the time and responsibility. CSB data collection, processing and
accumulation uses methods and strong data algorithms what is the proven in long-term. Certain important issues have been settled
with local legislation. Ministry of Agriculture, Forest
Department employees the long-term experience of forest industry in the data processing and storage. International and EU institutions of
regular involve in the forest sector data collection and processing methods for improvement.
There are no single regulatory frameworks, which clearly tell the responsibilities over the forest sector data collection, processing and accumulation. Available statistical data are stored in the
forest sector about various time periods. CSB statistical data available to other
institutions are with relatively large time lag, especially the data for the previous year. Not always being tested respondents
reported data validity. Data on the various sectors are presented
in various formats with different units then in the single accounts can`t be effectively combined. In some cases the data are not stocked in
the required format and volume. Joint information system lack in the
forest-based data processing. The accumulated data fragmentation.
Opportunities Threats Determined forest policy linking with
Latvian forest sector accounts model after IEEAF guidelines and use it in policy planning. Legislative framework to clearly define
responsibilities for data collection, processing and storage in the forest sector. Latvian forest sector accounts system
model to take into account both the EU and Latvian internal needs. Possible to use CSP methodology data
collection, processing and storage. Use of foreign experience, creating a
Latvian forest sector account system.
National policy changes in the forestry or static data collection, processing and storage. Insufficient financial resources for all
relevant forest sector data collection, processing and storage. Lack of human resources in the forest
sector data collection, processing and storage. Obtaining information from private
forest owners can`t be adjusted with local legislation. Common definitions and of international
wording absence and other threats.

50
CONCLUSIONS AND RECOMMENDATIONS
The main conclusions from current situation assessment are: 1. At the moment various Latvian institutions and organizations engaged in the collection of data on the forest sector, where the one of the most important is the Ministry of Agriculture (abbreviation - MA) and the Central Statistical Bureau (abbreviation - CSB), but there are other institution that deal with it in accordance with institutions responsible of delegation. In parallel, many institutions deal with the publicly available of MA or CSB data interpretation, as also deal with in addition calculation to conducting. 2. Since the forest sector has a different processes and activities complex, which complicates the information tracking in the single system. In the forest industry information flow, starting from the forestry and logging to finished product trades, is the risk not enumerated the all information in one system - for example, the industry with high added value, because less information about it. 3. Latvian is no single legislative act which establishing a single forest data storage arrangements and the responsible institutions. The current moment each institution out the forest sector data collection, based directly on the relevant institutions determinative regulatory framework - in separately cases based to the law, the government issued rules, or to the specific institution rules. 4. In some cases, traders and non-governmental organizations dealing with primary data collection, but it is usually based on a voluntary basis, and surveys do not cover the entire population, including information, based on non-governmental organization member’s data. 5. Data on the various sectors are presented in different formats, using different units, so that could arise are problems effectively combine in a single forest sector account system model. 6. In some cases, the institutions collect the data in other format or insufficient volume. 7. The during the data collection and by each respondent's obtained data logical and mathematical control, it should be noted that institutions rely on the integrity of respondent, by failing the obtained data the validity control. Recommendations 1. It would be useful to develop a single information system for forest sector data gathering, thereby promoting uniform the principles and methodologies application of data collection, processing or storage. 2. It is necessary legislative framework to clearly define responsibilities for data collection, processing and storage in the forest sector.

51
REFERENCES 1.pielikums “Meža un saistīto nozaru attīstības pamatnostādņu informatīvai
daļai” (Annex No. 1 “Forest and based industries development of guidelines for the informative part”). [Internet site]. Ministry of Agriculture. Available at: http://www.zm.gov.lv/doc_upl/Pielikums_1.pdf [Cited 1 Jul 2010]. (in Latvian).
Forest and Wood Product Research and Development Institute, Projekts “Latvijas kontu modelis un tā pamatojums, 1.ziņojums” (project “The developed Latvian economic Forest Accounts model, 1st report”), 2010, Latvia, Jelgava, p. 30 – 32, (in Latvian).
G.Niblaeus: presentation “Industrial breakthrough of new methods and technologies in the wood industry”, 2009.
Meža platības (Forest area). 2009. [Internet side]. Ministry of Agriculture. Availabel at: http://www.zm.gov.lv/doc_upl/Meza_nozare_katalogs_LV.pdf [Cited 16 Mar 2010]. (in Latvian).
Projekts “Meža nozares ekonomiskās situācijas monitorings” (project “Forest sector economic situation monitoring”). 2009. [Internet side]. Forest and Wood Product Research and Development Institute. Available at: http://www.llu.lv/?mi=81&op=true [Cited 2 Mar 2010]. (in Latvian).
The European Framework for Integrated Environmental and Economic Accounting for Forests – IEEAF. 2002. [Internet site]. European Communities. Available at: http://unstats.un.org/unsd/EconStatKB/Attachment49.aspx [Cited 22 Jun 2010]. (in Latvian).

52
NUMERICAL MODELLING OF THE TIME-DEPENDENT
MECHANICAL BEHAVIOUR OF SOFTWOOD
Engelund, E. T. 1
When using wood as a structural material it is important to consider its time-dependent mechanical behaviour and to predict this behaviour for decades ahead. For this purpose, several rheological mathematical models, spanning from fairly simple to very complex ones, have been developed over the years. Often these models assume contributions from elastic, viscoelastic and viscous processes acting within the material. However, the physical interpretation of the input parameters is often difficult. This is because these models are mathematical tools which typically are not related to the physical mechanisms causing the observed mechanical behaviour. In this study, the mechanical behaviour of softwood tracheids is described using numerical modelling. The basic composition and orientation of the tracheid constituents is incorporated by establishing a local coordinate system aligned with the microfibrils of the dominant S2 layer. Composite theory for laminar structures is used to generate the elastic properties in the local coordinate system based on literature values for the properties of the chemical constituents. Time-dependent behaviour is thought to be a result of sliding between the microfibrils. This assumption is incorporated in the numerical model by only allowing non-elastic behaviour in shear deformation modes in the local coordinate system. The rate of shearing is described by deformation kinetics. The results indicate that time-dependent behaviour such as creep and relaxation originates from simple physical processes. However, the interaction between the sliding of the microfibrils on the microscale (local coordinate system) and the orientation of the microfibrils in the tracheid becomes complex on the macroscale. An example of the simplicity of the current numerical model is that no viscoelastic property is assigned on the microscale; only elastic and viscous properties. Nonetheless, the mechanical behaviour on the macroscale is 1 Industrial PhD student, Danish Technological Institute, Wood Technology, Gregersenvej 4, DK-2630 Taastrup, Denmark, Tel: +45 72 20 23 55, Fax: +45 72 20 20 19, E-mail: [email protected]

53
viscoelastic, i.e. the time-dependent macroscopic behaviour is to some extent reversible. Key words: Creep, relaxation, numerical modelling, deformation kinetics.
INTRODUCTION The use of wood as a structural material requires knowledge about its rheological behaviour. Due to the desired longevity of our buildings, engineers should be able to predict the behaviour for decades ahead. Several rheological mathematical models have therefore been developed over the years (Morlier and Palka 1994). Many of these models assume contributions from elastic, viscoelastic and viscous processes acting within the material. However, these methods often fail in linking the mathematical description with the physical processes behind the observed mechanical behaviour (Hunt 1997). Therefore, the physical interpretation of the input parameters is difficult (Gril et al. 2004; Hunt 1997). In this study the time-dependent mechanical behaviour of softwood tracheids is described by numerical modelling. The aim is to construct a model based on realistic physical mechanisms and generally accepted physical theories.
Tracheid structure and time-dependent mechanical behaviour The key component in terms of load bearing in a softwood tracheid is the cellulose microfibril. This is a highly ordered aggregate of aligned cellulose chains embedded in a matrix of the amorphous wood polymers; hemicelluloses and lignin. The majority of microfibrils are found in the S2 layer of the tracheid wall which constitutes about 80 % of the entire tracheid wall (Brändström 2001). The microfibrils have a helical orientation in the tracheid with a specific inclination relative to the longitudinal axis of the tracheid. This inclination is termed the microfibril angle (MFA) and typically has a value around 3-15° (Barnett and Bonham 2004) for normal softwood tissue. The MFA is closely related to the mechanical behaviour of tracheids, and it affects both the elastic (Persson 2000) and time-dependent mechanical response (Gril et al. 2004; Kojima and Yamamoto 2004) of softwood. The latter is commonly seen as increasing deformation of wood under constant load and is termed creep. Another example is relaxation where the required applied load to maintain a constant deformation is decreasing with time. The causal mechanism for this time-dependent mechanical behaviour has been attributed to sliding between the

54
microfibrils (Balashov et al. 1957; Lotfy et al. 1972; Olsson and Salmen 2001). Only secondary chemical bonds such as hydrogen bonds exist between the microfibrils, and the rate of sliding is therefore controlled by the rate of breaking, moving and re-forming of these bonds (Bonfield et al. 1996).
Mathematical description of the mechanical behaviour The elastic behaviour of softwood can be described by calculating the properties of the tracheid wall using composite theory for laminar structures based on properties of the chemical constituents (Berg and Gradin 1999; Marklund and Varna 2009). In such calculations the orientation of the microfibrils, i.e. the MFA, has to be taken into consideration. This can be done by constructing a local coordinate system that follows the orientation of the microfibrils as seen in Fig. 1 whereas the global coordinate system is oriented along the longitudinal axis of the tracheid. The inclination of the local system in relation to the global system is simply the MFA of the tracheid.
Figure 1: Global and local coordinate system for a single tracheid. The local coordinate system is oriented along the microfibrils in the S2 layer. The sliding of the microfibrils on the molecular level results in shearing on the microscopic level. The basic assumption in this study is therefore that only shearing along the microfibrils exhibits time-dependent behaviour. Since the sliding is controlled by the breaking, moving, and re-bonding of hydrogen bonds, the general equation of deformation kinetics can be used to describe the process. Deformation kinetics are based on the theory of kinetics of chemical reactions derived by Eyring (Krausz and Eyring 1975). The basic principle is that molecules or segments of molecules can only move from their current position if they attain a certain energy level. The process of movement is in deformation kinetics theory termed flow and is a purely viscous process. Fig. 2 illustrates a

55
symmetrical potential energy barrier, where the required energy for flow is termed the activation energy.
Figure 2: Symmetrical energy barrier for a flow process. The height of the energy barrier is the activation energy. When a load is applied, the barrier gets asymmetrical and flow in the direction of the load is favoured. In a stress free state, a certain percentage of the molecules or segments has the required energy and are free to move due to the thermally induced molecular motions. However, if the energy barrier is symmetrical, there is an equal probability of bonds moving forwards as well as backwards. Only if a force is applied, the barrier becomes asymmetrical and flow in the direction of the force is favoured. The asymmetry of the energy barrier upon load application is related to the magnitude of the load, and thus higher load level will favour faster flow rate. In this study, time-dependent behaviour is only allowed in shearing modes in the local system seen in Fig. 1, whereas all other deformation modes are given elastic properties described by Hooke’s law. Thus, on a microscopic level of the tracheid, shearing deformation gives rise to elastic and viscous behaviour. On the other hand, deformation in the normal directions in the local coordinate system will only result in elastic behaviour. The incorporating of time-dependent behaviour in shearing modes can be described by a summation of the elastic and viscous contributions as seen in (1).
(1)
where ε is the shear strain, t is time, G is the shear modulus, and σ is the shear stress. The parameters Vh and Vm are volumes swept by the sliding motion and the volume of the moving segment itself, respectively, k is Boltzmann’s constant, h is Plancks’s constant, and T is the absolute temperature. The

56
activation energy is incorporated in the free energy of activation, ΔG‡. The first term on the right-hand side in (1) is the elastic contribution described by Hooke’s law whereas the second term is the viscous contribution described by deformation kinetics. Under isothermal conditions, (1) can be simplified to the following form
(2)
MATERIALS AND METHODS The numerical modelling in this study is performed using commercially available numerical software. The theory and methods described here can be applied to any such software capable of handling user-defined partial differential equations. In order to simulate the time-dependent behaviour of tracheids without having too many degrees of freedom, only a length section of 250 µm of a single tracheid is modelled. This is given a nearly quadratic cross section with rounded corners. The wall thickness is set to 2 µm. This is in accordance with typical values of S2 layer thicknesses in the earlywood of Norway spruce tracheids (Fengel and Stoll 1973). The width is set to 40 µm (Fengel and Stoll 1973). The cell wall properties of the tracheid are assigned in the local coordinate system. This is done by using composite theory for laminar structures based on the elastic properties of cellulose, hemicelluloses and lignin. Such structure resembles the stiff and oriented microfibrils embedded in a softer matrix of hemicelluloses and lignin. The input parameters for the viscous behaviour in shearing are taken from the literature (Krausz and Eyring 1975; Bonfield et al. 1996). However, the kinetic parameter A in (2) is varied in order to investigate the effect of moisture on the time-dependent behaviour. Only A is varied since it is assumed that the activation free energy in (1) will be the parameter most affected by the moisture in the cell wall.
RESULTS In Fig. 3 the experimental results by Lotfy et al. (1972) are shown along with results from the numerical model. Both the MFA and the kinetic parameter A are varied, where A0 is the value of A calculated based on literature sources

57
(Krausz and Eyring 1975; Bonfield et al. 1996). In order to simulate the experimental results, the applied load has been tuned to yield equal initial (elastic) strains independent of MFA.
Figure 3: Creep of Sitka spruce at 23 °C and 50 %RH in tension at two different load levels. Experimental data are taken from Lotfy et al. (1972). Experimental results for the relaxation of Norway spruce tissue is shown in Fig. 4 (left) along with results from the numerical model. Again, the MFA and the kinetic parameter A have been varied. However, due to the higher moisture content in the Norway spruce of Fig. 4 compared to the Sitka spruce of Fig. 3, the value of A is also higher.
Figure 4: Relaxation of saturated Norway spruce tissue at room temperature (left) and macroscopic viscoelasticity of numerical model (right). Experimental data for relaxation are taken from Eder et al. (2006). In Fig. 4 (right) the macroscopic apparent viscoelasticity of the numerically modelled tracheid is illustrated for two different tracheid types; one with similar

58
geometry as previously described (resembling an earlywood, EW, fibre) and one with a twice as large wall thickness but half as large diameter (resembling a latewood, LW, fibre). Furthermore, two different MFAs have been selected and the applied load tuned to yield equal elastic strains.
DISCUSSION The results from the numerical modelling indicate that it is possible to describe the experimental results based on simple, yet realistic assumptions regarding the causal mechanism behind time-dependent mechanical behaviour. The fitting of the model to both creep and relaxation histories in Fig. 3 and Fig. 4 (left) shows this trend. However, more accurate experimental results of creep and relaxation of fibres and tissues with known MFA are needed in order to evaluate the input parameters of the model. A somewhat surprising result of the present numerical model is that it is capable of simulating apparent viscoelastic behaviour on the macroscale, even though only elastic and viscous behaviour are permitted on a microscale. This can be seen in Fig. 4 (right) which illustrates the time-dependent behaviour for a load history with constant load for 33 minutes followed by an equal amount of time without load. The fact that only elastic and viscous contributions are needed to describe macroscale apparent viscoelasticity supports the hypothesis regarding the deformation mechanisms of wood. The hypothesis is that the elastic contribution is a result of straining of the covalent and hydrogen bonds, whereas the sliding of microfibrils, controlled by the breaking and re-forming of intermolecular hydrogen bonds, gives rise to the time-dependent behaviour. No additional viscoelastic contribution, which would be difficult to give a physical interpretation, is needed to explain and describe macroscale mechanical behaviour. Hence, the strength of the present numerical model is that, while based on assumptions regarding the deformation mechanisms of wood which are physically realistic, it is capable of imitating the time-dependent mechanical behaviour of softwood.
CONCLUSION The basic assumption in this study is that time-dependent mechanical behaviour originates from the sliding of microfibrils past each other. By describing this sliding by deformation kinetics and considering the orientation of microfibrils in the tracheid, it was possible to describe experimental results of both creep

59
and relaxation histories. Despite the numerical model only incorporated elastic and viscous behaviour on the microscale, the model exhibited macroscale apparent viscoelastic behaviour. The results indicate that time-dependent behaviour originates from simple physical processes that can be described using general physical theories. However, further experimental results are needed to evaluate the input parameters of the current model.
REFERENCES Balashov, V., Preston, R.D., Ripley, G.W., Spark, L.C. (1957) Structure and mechanical properties of vegetable fibres 1: the influence of strain on the orientation of cellulose microfibrils in sisal leaf fibre. Proceedings of the Royal Society of London Series B-Biological Sciences. 146:460-468. Barnett, J.R., Bonham, V.A. (2004) Cellulose microfibril angle in the cell wall of wood fibres. Biological Reviews. 79:461-472. Berg, J.E., Gradin, P.A. (1999) A micromechanical model of the deterioration of a wood fibre. Journal of Pulp and Paper Science. 25:66-71. Bonfield, P.W., Mundy, J., Robson, D.J., Dinwoodie, J.M. (1996) The modelling of time-dependant deformation in wood using chemical kinetics. Wood Science and Technology. 30:105-115. Brändström, J. (2001) Micro- and ultrastructural aspects of Norway spruce tracheids: A review. Iawa Journal. 22:333-353. Eder, M., Burgert, I., Stanzl-Tschegg, S. (2006) Relaxation experiments on wood fibres and tissues. Proceedings of the Third International Conference of the European Society of Wood Mechanics Vol. 1, 141-147. Fengel, D., Stoll, M. (1973) Variation of cell cross area, thickness of cell-wall and of wall layers of sprucewood tracheids within an annual ring. Holzforschung. 27:1-7. Gril, J., Hunt, D., Thibaut, B. (2004) Using wood creep data to discuss the contribution of cell-wall reinforcing material. Comptes Rendus Biologies. 327:881-888. Hunt, D.G. (1997) Dimensional changes and creep of spruce, and consequent model requirements. Wood Science and Technology. 31:3-16. Krausz, A.S., Eyring, H. Deformation kinetics. Wiley, New York, 1975. Kojima, Y., Yamamoto, H. (2004) Effect of microfibril angle on the longitudinal tensile creep behavior of wood. Journal of Wood Science. 50:301-306. Lotfy, M., El-osta, M., Wellwood, R.W. (1972) Short-term creep as related to microfibril angle. Wood and Fiber Science. 4:26-32.

60
Marklund, E., Varna, J. (2009) Modeling the effect of helical fiber structure on wood fiber composite elastic properties. Applied Composite Materials. 16:245-262. Morlier, P., Palka, L.C. (1994) Basic knowledge. In Creep in timber structures (Morlier, P., ed.), Rilem Report 8, E & FN Spon, New York, pp. 9-42. Olsson, A.M., Salmen, L. (2001) Molecular mechanisms involved in creep phenomena of paper. Journal of Applied Polymer Science. 79:1590-1595. Persson, K. (2000) Micromechanical modelling of wood and fibre properties. PhD thesis, Lund University, Lund, Sweden.

61
EXPERIMENTAL AND NUMERICAL INVESTIGATION OF
PLYWOOD SANDWICH PANELS WITH CORRUGATE CORE
Labans, E.1 Kalnins, K.2
& Zudrags K.3
ABSTRACT
Considering that plywood is a layered cross-ply unidirectional fiber reinforced composite the development of innovative structural solutions require complex experimental and numerical investigation. Currently numerical simulations based on finite element method (FEM) are set as industry standard for composite industry like aerospace. Meanwhile the wood structures traditionally has been analyzed with simple analytical assumptions and approved with extensive experimental testing. Such an assumption restricts the variety of structural applications and imposes restrains on structural weight savings. On contrary comprehensive analysis by FEM can deliver tailored plywood structural solutions non dependant on neither geometrical nor loading configuration. To elaborate reliable FEM analyses, precise determining of mechanical properties of separate veneer ply is required both in longitudinal and circumferential directions. A significant scatter of wood mechanical properties obtained from cross ply specimen tests has been reported in the literature. Evidently for a single layer mechanical properties are more affected by micro cracks appearing after peeling process thus testing assessment is crucial. Roughly three hundred unidirectional specimens have been tested in longitudinal and transverse directions to elaborate the confidence bounds of mechanical properties. These properties served as input variables for simulation of corrugate core sandwich panel by FEM commercial code ANSYS. Bending test configuration according to EN789 has been elaborated for plywood sandwich panel with corrugate core and manufactured by AS “Latvijas 1 M.sc. student. Institute of Materials and Structures, Riga Technical University, LV-1658, Kalku st. 1, Tel: +371 67089164, Fax: +31767089254, E-mail: [email protected] 2 Dr.sc.ing. Leading researcher, Institute of Materials and Structures, Riga Technical University, LV-1658, Kalku st. 1, Tel: +371 67089164, E-mail: [email protected] 3 Dr.sc.ing. Seniour certification engineer, AS “Latvijas Finieris”, LV-1004, Bauskas st. 59, Tel: + 371 67067207, Fax: + 371 67067326. E-mail: [email protected]

62
Finieris”. Robustness verification of numerical results versus bending tests according to EN789 for plywood panels confirmed numerical sensitivity towards introduced mechanical properties. The conclusion has been drawn to narrow down the confidence bounds for mechanical properties to be used to design plywood sandwich panels. Key words: Plywood, wood based panels, corrugate core sandwich structures
INTRODUCTION
Rational exploration of wood resources and environment protection becomes the topic of the day, thus highlighting the need to develop and to establish fabrication of new type wood products, which allows utilizing the wood more economically reducing the waste products. As example, plywood sandwich panels with mechanically transformed plywood sheet - corrugated core - may become that type of solution. Main benefits of such innovation are high specific bending stiffness and considerable wood saving, comparing with traditional plywood. There has been longstanding research associated with the production hardware and methods for manufacturing 3-dimension corrugated plywood as described in US patents Nr. 4816103 (1989) and 5948198 (1999). However those methods are not flexible to establish mass production of these sandwich panels, moreover further research of plywood behavior under different loading conditions using numerical and experimental methods, are needed to satisfy the user requirements. To simulate behavior and to optimize the complicated multilayer material structure the finite element method commercial code ANSYS has been utilized. FEM analysis with commercial codes has been considered as reliable tool by aerospace industry to replace physical experiments in development process. Elaboration of parametrical model in development process allows us to save time in design optimization and for elaboration of design guidelines to tailor the costumer requirements. Considering that plywood are modeled as multilayer material consisting of veneers composed in several layers with different orientation of fibers, material properties also are set separately for every layer not for all structure in general. However mechanical properties given for separate veneer in literature sources often are not consequent or vary in different sources, for example Wood Handbook (1999) or Eurocode 5 (1995). The aim of this research is to determine veneer mechanical properties for small size specimens and use these

63
values as input data for numerical optimization of sandwich panel with corrugate core.
MATERIALS AND METHODS
Veneer single layer specimens To determine veneer mechanical properties, series of tension tests were performed for small size veneer specimens. As there is no industrial need for single layer veneer specimen tests the testing specimens has been produced according multilayer composite materials testing standard ASTM D3039. Assuming the geometrical characteristics as the specimen length L=300 mm, the width B=20 mm, 25 mm and 30 mm. The thickness of specimens T1 for 1, 2 or 3 plies, vary from 1.46 to 4.03 mm. According to ASTM D3039, both ends of the specimen have been glued into cover plates with length L1 from specimen ends. Cover plates produced from one veneer ply and glued athwart to specimen fibers direction. Tension tests were performed on universal testing machine INSTRON 8802 and INSTRON 8872 (for specimens with perpendicular fibers direction). The distance between the grips L2 has been assumed constantly 100 mm and tested with loading speed of 1mm/min until failure. In total 220 specimens where tested with longitudinal wood fiber orientation where 120 specimens had width of 20 mm, 60 specimens had width 25 mm and 40 specimens had width 30 mm. Besides 50 specimens with perpendicular orientation of the fibers and width 20 mm has been tested.
Plywood sandwich panels. Plywood sandwich panel with corrugated core has been manufactured from 5-ply plywood sheet surfaces and 4-ply corrugated plywood core (Fig. 1). Corrugated core provide outstanding mechanical properties of the structure (modulus of elasticity, bending stiffness), in panel’s longitudinal direction.

64
Fig. 1. Sandwich plywood panel with corrugated core; to the left: sandwich panel in 4-point bending test set-up on INSTRON 8802. Panels have been loaded in 4-point bending set up according to EN 798 (2004) standard. Deflections of the panels were measured with three deflectometers. Relative deformations of the structure were measured using strain-gauges (produced by HBM) glued on both outer surfaces of the panel and also on corrugated core surface. Geometrical properties of tested sandwich panels are provided in Table 1.
Table 1. Geometrical properties of plywood sandwich panels with corrugate core
Pane
l no
men
clat
ure
Pane
l wid
th, [
mm
]
Pane
l thi
ckne
ss,
[mm
]
Pane
l len
gth,
[mm
]
Wav
e w
idth
, [m
m]
Wav
e th
ickn
ess,
[mm
]
Wav
e pl
y co
unt Panel surface thickness and ply layout
Upp
er
surf
ace,
[m
m]
Low
er
surf
ace,
[m
m]
Upp
er
surf
ace
Low
er
surf
ace
Panel 1 330 32.3 1200 82 5.6 4 6.5 6.5 /-/-/ /-/-/
Panel 2 330 31.7 1200 82 5.6 4 6.5 6.5 /-/-/ /-/-/
Panel 3 325 31.5 120 82 5.6 4 6.5 6.5 /-/-/ /-/-/ / fibers direction parallel to panel’s longitudinal direction - fibers direction perpendicular to panel’s longitudinal direction

65
Finite element modeling For computer simulation of bending tests was used FEM commercial code ANSYS v.11. Parametrical model of panel was created with variable cross section parameters and bending mode options. V-core plywood sandwich has been modeled according the EN 789 set up by using ANSYS 4-node shell element SHELL 181. It was assumed that each ply has thickness of 1.35 mm. Moreover stacking sequence has been modeled assuming that each layer is perpendicular to the upper and lower one, thus the plywood always consists of an odd number of plies. (Kalnins et al.2009). Corrugated core of sandwich panel in numerical model were simplified to straight lines, connected to the outer surface under specific angle. Core roundups are required by manufacturing process, however including roundups in numerical model are not reasonable (Fig.2).
Fig. 2. Natural cross-section of sandwich panel (left); Cross-section modeled in ANSYS code (right); dashed line – offset plane for element thickness.
RESULTS AND DISCUSSIONS
Material properties By performing specimens tension tests modulus of elasticity and breaking tensile stress and also maximal and minimal values of these properties has been estimated. For specimens with wood fiber orientation parallel to specimen longitudinal direction, values of elasticity’s modulus are shown in Table 2. Average value of modulus of elasticity is 14.81 GPa. For specimens with fiber orientation perpendicular longitudinal direction, average modulus of elasticity is 0.5GPa. It has been achieved that the greatest modulus of elasticity are for 1-ply specimen impregnated with glue and produced under the pressure. By increasing thickness of the specimen, the modulus of elasticity decreases until average value of 13.26 GPa. It could be explained by wood defects appearing in thicker specimen’s cross-section. Similar tendency to decrease modulus of

66
elasticity gives the increasing width of specimens from 20 mm to 30mm. Most robust results from all specimens have specimens made from 2 unidirectional veneers – difference between modulus of elasticity for specimens with 20 mm and 30 mm width vary only 3.5 %. For other specimens results difference between specimens with various width from 5-15 %.
Table 2. Modulus of elasticity for specimens with parallel orientation of fibers [GPa]
Type of specimen
Specimen width, mm 20 25 30
Laminated Avg. 16.96 Max - Min max.17.51 min.16.49
1 ply (compressed)
15.97 15.66 14.54 max. 17.06 min. 14.58 max.17.53 min.14.77 max.14.86 min.14.32
1 ply 15.19 14.61 13.99
max.16.32 min.13.68 max.15.10 min.14.04 max.14.96 min.12.21
2 ply 14.36 14.22 13.95 max.15.60 min.13.17 max.14.63 min.13.86 max.14.37 min.13.73
3 ply 13.26 13.39 11.99 max.13.21 min.12.45 max.13.55 min.13.18 max.12.22 min.11.65
Average breaking tensile stress for specimens with fibers orientation parallel to specimen longitudinal direction is 125 MPa (maximal value 149 MPa, minimum 104 MPa). Breaking stress has tendency to increase with specimen width, difference between specimens with 20 mm and 30 mm thickness about 10 %.
Sandwich panels tests Plywood sandwich tests (according EN 789 (2004)) has been performed recording determined deflection of the panels and outer fibers relative deformation (Fig. 3). Using obtained results panel’s modulus of elasticity and bending stiffness has been calculated (Tab. 3). Conventional plywood panels with similar constructive thickness – Panel 4 and Panel 5 has been compared with the sandwich one.

67
0
1
2
3
4
5
6
7
0 5 10 15 20 25t,mm
P,K
N
Panel 1 Panel 2 Panel 3 R8 R9
0
1
2
3
4
5
6
7
0 1000 2000 3000 4000ε,μm/m
P,kN
Panel 1 Panel 2 Panel 3
Fig. 3. Load and deflection/relative fiber deformation curves for panels bending tests
Table 3. Mechanical properties of plywood sandwich panels with corrugate core
Pane
l no
men
clat
ure
Pane
l w
idth
, [m
m]
Pane
l thi
ckne
ss,
[mm
]
Cro
ss se
ctio
n a
rea,
(A),
[cm
^2]
Mom
ent o
f in
ertia
,(I) [
cm^4
Mod
ulus
of
elas
ticity
, (E)
, [G
Pa]
Ben
ding
st
iffne
ss,(E
*I),
[KN
m^2
] (E
*I)/A
, [K
Nm
^2]
(E*I
)/A,
rela
tivel
y to
P
anel
4, %
Panel 1 330 32.3 61.9 73.6 10.1 7.49 0.12 133.1 Panel 2 330 31.7 61.9 73.6 10.0 7.37 0.12 132.9 Panel 3 325 31.5 61.9 73.6 9.7 7.16 0.12 132.6 Panel 4 300 27.9 83.7 54.8 11.5 6.58 0.08 100 The Panel 4 has been added to the Table 3. to illustrate the advantage of wood economy by applying sandwich panels. Panel 4 is a plywood panel with traditional ply layout, which is taken as reference point (100 %) to compare bending stiffness and consumed material volume relation between standard plywood and sandwich panels. Higher relation means higher bending stiffness value over the consumed wood volume. From acquired data we can conclude that plywood sandwich panels (Panel 1, 2, 3) have better results than traditional plywood average by 33 %. It can be explained by relatively small area of cross-section comparing to the panel with full cross-section. Slightly higher thickness of sandwich panels (production factor) affected results also.

68
FEM analysis Using FEM commercial code ANSYS v.11. were performed virtual bending tests for sandwich panels with corrugate core. Panel’s deflection and outer fibers relative deformations were acquired. Results comparisons with experimental data are demonstrated in Figure 5. For numerical calculations were used average value of elastic modulus acquired by testing of small size veneer specimens – 16 GPa in fibers longitudinal directional and 0.5 GPa in perpendicular direction. As one can see in Figure 4. results acquired using FEM analysis are very close to experimental values of panels deflections. Values of relative deformation of outer fibers are 10% lower than experimental, its mean some bearing reserve of material remains.
Fig. 4. Load and deflection/relative fiber deformation curves for panels bending tests and ANSYS virtual bending tests results.
CONCLUSIONS Performing tension tests for small size veneer specimens were determined material mechanical properties, which are suitable as input data for plywood sandwich panel’s numerical calculations. Calculation model created with ANSYS v.11. computer program are suitable for performing 4-point bending tests for plywood sandwich panels with corrugated core, precision of the such calculations can be expected from 5-15%, comparing with experimental results. More detailed robustness analysis should be performed in order to increase numerical and physical discreapancy.
0
1
2
3
4
5
6
7
0 5 10 15 20 25
P,K
N
t,mm
Panel 1 Panel 2 Panel 3 ANSYS
0
1
2
3
4
5
6
7
0 1000 2000 3000 4000
P,kN
ε,μm/m
Panel 1 Panel 2 Panel 3 ANSYS

69
REFERENCES ASTM D3039 / D3039M - 08 Standard Test Method for Tensile Properties of Polymer Matrix Composite Materials
EN 789:2004. Timber structures. Test methods. Determination of mechanical properties .of wood based panels. European Committee for Standardization (CEN), .Brussels, Belgium
Kalnins K., Jekabsons G., Zudrags K., Beitlers R. „Metamodels in optimisation of .plywood sandwich panelis”. Shell Structures: Theory and Applications, Vol. 2, .Pietraszkiewicz W. and Kreja I. (eds.), CRC press /Taylor & Francis Group, .London, UK, (2009) pp. 291-294
USA patent 4816103. 1989. Process for manufacturing corrugated plywood composites
USA patent 5948198. 1999. Method of producing a corrugated construction unit
Wood Handbook: Wood as an engineering material. Specialty treatments. General .Technical Report 113. U.S. Department of Agriculture, Forest Service, Forest Products Laboratory, Madison, WI. Chapter 4, 4-6, (1999).

70
STRUCTURAL ROUND TIMBER OF SCOTS PINE FROM
SOUTHERN NORWAY
Vestøl, G. I.1 & Høibø, O. 2
ABSTRACT
Finding new applications of Scots pine that does not fulfil the requirements of sawlogs is an important issue in some parts of Norway where Scots pine comprises a substantial part of the timber production. One proposal is to increase the use of round Scots pine timber in structural frameworks, and a project has been carried out to provide data on mechanical properties, and to establish a basis for strength grading. Density, modulus of elasticity (MOE) and bending strength were tested on 533 logs with diameter from 75 mm to 250 mm. The logs were sampled from 150 trees from 10 sites in southern Norway. The results showed high values of bending strength even for logs with poor visual quality. According to EN338, the whole sample was classified to strength class C35, but there were large differences between sites. Overall, MOE was the limiting property. Visual characteristics explained some of the variation in both MOE and bending strength, but significant parts of the residual variance were due to site. This means that visual strength grading would have to be conservative in order to be valid across sites. Models of bending strength with MOE as independent were more accurate, and not different between sites. It showed a better potential for machine grading based on measuring MOE alone or in combination with visual grading.
1 Associate Professor, Norwegian University of Life Sciences, Department of Ecology and Natural Resource Management, P.O. Box 5003, NO-1432 Ås, Norway, Tel: +47 64 96 57 36, Fax: +47 64 96 58 01, E-mail: [email protected] 2 Associate Professor, Norwegian University of Life Sciences, Department of Ecology and Natural Resource Management, P.O. Box 5003, NO-1432 Ås, Norway, Tel: +47 64 96 57 43, Fax: +47 64 96 58 01, E-mail: [email protected]

71
Some of the variation in MOE and bending strength could be explained by stand- and tree variables, showing a potential for a coarse sorting in the forest by using simple stand- and tree-variables. Combined with measuring MOE, this can be a good basis for strength grading of structural round timber. Key words: Bending strength, density, modulus of elasticity, round timber, Scots pine.
INTRODUCTION
Scots pine (Pinus sylvestris (L.) is the second most important species in Norway, and it comprises a significant part of the timber production in many areas. Finding new applications for low qualities has been emphasized since these obtain low prizes in the timber market, particularly in areas that are far from industries that utilize Scots pine pulpwood as raw material. One proposal that has been raised is to use round Scots pine timber in structural frameworks. It is known from old buildings that slender round timber of quite poor visual quality has been used as load-carrying members. Round timber can be expected to be stronger and stiffer than sawn timber because of the surface continuity of wood fibres. In sawn timber the fibres around knots are cut and discontinuous, leading to stress concentrations and fracture initiation (Wolfe 2000). This effect may be particularly important in timber with low quality where the fibre deviations due to knots are severe. Wolfe and Moseley (2000) stated that round timber bending strength is not highly correlated with visual characteristics such as knots or spiral grain, but is well correlated with bending stiffness. Another reason why round timber is stronger and stiffer than sawn timber is the radial variation in wood properties. Both density and fibre length increase with number of growth rings from pith (Atmer and Thörnqvist 1982). This transition takes place in the first growth ring from the pith forming ‘juvenile wood’ as opposed to ‘mature wood’ farther from the pith. Mature wood is denser, stiffer and stronger than juvenile wood. Retaining this sheath of mature wood around the juvenile-wood core provides a bending element with strength and stiffness having higher mean value and lower variability than sawn timber (Wolfe & Murphy 2005). In order to enable use of round Scots pine timber in structural framework, it is necessary to have documentation of strength and stiffness properties. Such documentation is available from a European study that analyzed round timber

72
from first thinnings of different species (Ranta-Maunus 1999, Boren and Barnard 2000), including Scots pine from Finland and Great Britain. Since it is based on timber from first thinning, the values cannot be applied to older Scots pine in Norway without further investigations. It was decided to perform a study of the bending properties of round Scots pine timber from southern Norway. The aim of the study was 1) to provide documentation of density, stiffness, and bending properties, and 2) to evaluate different methods of strength grading of round timber. This paper presents a summary of the main results that have been published in two previous papers (Høibø and Vestøl 2010, Vestøl & Høibø 2010). Some new models are developed to compare the main result from the two papers, particularly the random effect of site.
MATERIAL AND METHODS The material consisted of 533 logs from 150 Scots pine trees sampled from 10 locations in southern Norway. The locations were chosen from three counties where Scots pine constitutes a substantial part of the timber production. The sites were chosen to represent the variation in growth conditions within each county and included poor sites close to the timberline and both poor and fertile sites located at lower altitudes. The site indices, defined as dominant height at 40 years age (H40), ranged from 6 m to 14 m. Distribution of diameter at breast height was recorded at each site, and trees with breast height diameter between 15 cm and 30 cm were assigned to one of five diameter-classes, 15–18 cm, 18–21 cm, 21–24 cm, 24–27 cm or 27–30 cm. Three trees were sampled randomly within each diameter-class, and measurements of diameter at breast height, crown height, crown length, and tree height was performed before the trees were crosscut into logs with length depending on the small end diameter. Minimum small end diameter was 75 mm. The logs were debarked and air-dried during summer before being conditioned in a laboratory with temperature 20˚C and 65% relative humidity. The physical properties measured on the logs before testing were tapering, maximum knot diameter, maximum knot sum and grain angle. Knot properties and grain angle were measured at the central part of the logs. Annual ring width and proportion of compression wood were measured at the small end of the logs. In accordance with criteria for visual strength grading proposed by Boren and Barnard (2000) 288 of the 533 logs were accepted for strength class C24, and of these only 93 were accepted for strength class C30. Taper was the most

73
frequent cause of rejection. Ignoring taper, 364 logs were accepted for strength class C24, and of these 275 logs were accepted for strength class C30. Bending strength and modulus of elasticity (MOE) were measured in four-point-bending as described by the voluntary product standard VPS-SRT-1 (Ranta-Maunus 1999). The testing corresponds to testing of bending strength and local MOE in EN 14251 (2004a) that describes test methods for structural round timber. The calculations were performed to adjust the measured values to EN 14251 (Vestøl and Høibø 2010). Moisture content and density were measured from samples taken close to the failure point. In accordance with EN 384 (2004b) density was decreased by 0.5% for every percentage point for which the moisture content was higher than 12%. MOE and bending strength were increased by 2% for every percentage point for which the moisture content was higher than 12%, and bending strength was also adjusted to 150 mm dimension by using the correction factor given in EN 384 (2004b). MOE and bending strength were described as linear mixed models treating each site as a random effect.
Y = µ + f (A,B,C...) + Si + εij f(A,B,C…) = covariate function Si = random effect of site (i = 1–10) εij = residual (j = 1 – 533)
The models were first estimated with covariate function based on wood properties that can be used in visual grading, i.e. maximum knot diameter, relative knot diameter, knot sum, relative knot sum, taper, grain angle, compression wood and annual ring width. Then the bending strength model was estimated using MOE as the only covariate, and then by using both MOE and visible wood properties as covariates. These models estimated the potential for machine grading based on measuring MOE alone and in combination with visual grading. Finally the models were estimated using tree- and stand variables alone or, in case of bending strength, combined with MOE. These models estimated the potential for pre sorting in the forest.

74
RESULTS
Corrected mean values and fifth percentiles of density and bending properties are presented in Table 1. Following EN 384 (2004b), characteristic values were calculated based on fifth percentiles of density and uncorrected bending strength and mean MOE for logs with nominal dimension between 75 mm and 200 mm. Characteristic density was 420 kg/m3, characteristic bending strength was 40.0 N/mm2 and characteristic MOE was 13915 N/mm2. Corresponding strength class according to EN 338 (2003) was C35 due to MOE, while density and bending strength were sufficient for C40. Table 1. Moisture content, density, and bending properties of round Scots pine timber. Density and MOE are corrected to 12% moisture content, and bending strength is corrected to 12% moisture content and 150 mm dimension
Nominal dimension N
Moisture content
(%)
Density ρ12 [kg/m3]
Bending strength fm [N/mm2]
MOE Em [N/mm2]
Mean ρ05 Mean f05 Mean E05 75 mm 73 15.7 474 416 56.6 40.3 13945 8919 100 mm 85 16.1 480 419 58.9 41.6 11082 6952 125 mm 92 16.1 484 418 62.1 40.3 12898 8788 150 mm 90 16.7 506 441 70.5 48.5 15537 9814 175 mm 83 17.2 502 421 67.7 44.1 14275 8256 200 mm 54 17.3 513 445 71.1 46.5 15033 9890 225 mm 33 17.6 509 422 73.1 35.8 15367 8059 250 mm 23 18.2 511 425 71.3 47.0 15372 10465 All 533 16.6 494 424 65.1 42.9 13888 8313 Note: Abridgement from Vestøl and Høibø 2010. Models describing bending strength are presented in Table 2. Model 1.1 describes bending strength based on a covariate function of visual timber characteristics. It explains 52.9% of the variation, and a significant part of the unexplained variance is due to site. Model 1.2, which describes bending strength as a function of MOE, explains 69.5% of the variation, and only a minor proportion of the unexplained variance is related to site. By combining MOE with visual characteristics (Model 1.3), 78.0% of the variance is explained, and only a minor part of the unexplained variance is due to site.

75
Table 2. Models describing bending strength variations. Model Covariates 1.1 Tapering, maximum knot diameter, relative knot sum, grain angle, annual ring width 1.2 MOE 1.3 Maximum knot diameter, relative knot sum, grain angle, MOE 1.4 Breast height diameter, tree height, relative log height 1.5 Breast height diameter, tree height, relative log height, MOE Decomposition of bending strength variation according to models
Source of variation Variance [(N/mm2) 2]
Model 1.1 Model 1.2 Model 1.3 Model 1.4 Model 1.5 Covariate function 109.0 143.1 160.6 140.4 163.5 Random effect of site 28.2 2.6 3.6 1.2 1.5 Residual variation 68.7 60.2 41.7 64.3 40.9 Total 205.9 205.9 205.9 205.9 205.9 The covariate function in model 1.4 describes bending strength based on forest and tree measurements. It explains 68.2% of the variance, and only a minor proportion of the unexplained variance is due to site. By combining forest and tree measurements with MOE (Model 1.5), the explained variance increases to 79.4%, and only a minor part of the unexplained variance is due to site. Models describing MOE are presented in Table 3. Model 2.1 describes MOE based on a covariate function of visual timber characteristics. It explains 35.0% of the variance, and a significant part of the unexplained variance is due to site. Model 2.2, which describes MOE with a covariate function based on forest and tree measurements, explains 50.2% of the variance, and the random effect is of minor importance compared to model 2.1. The residual variances of the two models are similar (Table 3.) Table 3. Models describing MOE variations. Model Covariates 2.1 Tapering, maximum knot diameter, relative knot sum, grain angle, annual ring
width 2.2 Breast height diameter, site index (H40), relative log height Decomposition of bending strength variation according to models
Source of variation
Model 2.1 Model 2.2 Variance
[(N/mm2) 2] % Variance
[(N/mm2) 2] % Covariate function 4174423 35.0 5996095 50.2 Random effect of site 2196722 18.4 320155 2.7 Residual variation 5559645 46.6 5614540 47.1 Total 11930790 100 11930790 100

76
DISCUSSION The results show high values of bending strength even for logs with poor visual quality. However, since Model 1.1, describing bending strength from visual timber characteristics, had significant effect of site, rules for visual grading have to be conservative in order to be valid across sites. This corresponds to the results obtained by Green et al (2004), who concluded that it is questionable whether visual grading adequately assesses the potential of round timber for structural uses. It is contrary to the results of Boren and Barnard (2000), who found that the same grading rules could be used in Finland and Great Britain. Models 1.2 and 1.3 show that bending strength can be more accurately predicted by MOE than by visual characteristics. By including MOE, there is also a much smaller effect of site, meaning that the models can be used across sites. Another argument for using MOE is that this property is limiting the strength class, and therefore should be given priority in strength grading. Using forest and tree variables can add valuable information about bending strength and MOE. These variables explain both bending strength and MOE more accurately than visual log characteristics do. The models (Models 1. 4 and 2.2) also have much smaller random effects of sites compared to the models for visual grading (Models 1.1 and 2.1). This means that parts of the site effects are explained by stand and tree variables, and the covariate models better describe the potential for round timber across sites. The most accurate prediction of bending strength was obtained by combining forest and tree measurements with MOE (Model 1.5). Forest and tree measurements also gave the best prediction of MOE (Model 2.2). A good basis for strength grading of round timber could be a coarse sorting in the forest combined with measuring MOE.
REFERENCES
Anonymous 2003. Structural timber – Strength classes. European Standard EN 338: 2003. - 2004a. Structural round timber – Test methods. European standard EN 14251: 2004. - 2004b. Structural timber – Determination of characteristic values of mechanical properties and density. European Standard EN 384: 2004. Atmer, B. & Thörnqvist, T. 1982. The properties of tracheids in spruce (Picea abies Karst.) and pine (Pinus sylvestris L.). (Report No. 134). Uppsala: The

77
Swedish University of Agricultural Sciences, Department of Forest Products. (In Swedish with English summary.) Boren, H. & Barnard, G. 2000. Analysis of the strength and stiffness properties for small diameter round Scots pine timber tested in bending and compression parallel to the grain. Paperi Ja Puu - Paper and Timber, 82(1), 48-56. Green, D. W., Gorman, T. M., Evans, J. W. & Murphy, J. F. 2004. Improved grading system for structural logs for log homes. Forest Products Journal, 54(9), 52-62. Høibø, O. & Vestøl, G.I. 2010. Modelling the variation in modulus of elasticity and modulus of rupture of Scots pine round timber. Canadian Journal of Forest Research 40(4):668-678. Ranta-Maunus, A. (Ed.) 1999. Round small-diameter timber for construction. Final report of project FAIR CT 95-0091. (VTT Publications No. 383). Espoo: VTT, Technical Research Centre of Finland. Vestøl, G.I. & Høibø, O. 2010. Bending strength and modulus of elasticity of Pinus sylvestris round timber from southern Norway. Scandinavian Journal of Forest Research 25(2):185-195. Wolfe, R. 2000. Research challenges for structural use of small-diameter round timbers. Forest Products Journal, 50(2), 21-29. - & Moseley, C. (2000). Small-diameter log evaluation for value-added structural applications. Forest Products Journal, 50(10), 48-58. - & Murphy, J. (2005). Strength of small-diameter round and tapered bending members. Forest Products Journal, 55(3), 50-55.

78
VARIATION OF SCOTS PINE PERMEABILITY IN
NORTHERN EUROPE
Zimmer, K.1, Larnøy, E.2
, Høibø, O.1
ABSTRACT
Scots pine (Pinus sylvestris) sapwood is per definition (EN-350-2) easy to treat. Combined with its good availability on the European markets, it is a construction and building material in demand. However, partially large differences in penetration are reported from industry and research. To keep a reliable product quality, impregnation processes are aligned to the material most difficult to treat. Hence, it is crucial to know about the factors inhibiting the fluid flow into the material. Scots pine samples from a wide geographic distribution, 25 different sites in 6 different countries in northern Europe, have been collected and impregnated with an aqueous monomer furfuryl alcohol solution. From each of the respective sites logs of 1.3 meter in length were collected from nine trees belonging to three different breast height diameter classes. Three trees from each dominance class were chosen randomly. The log was drawn from the felled stem in a height of 1.2 meters with exact marked north/south exposition. Sapwood slabs, orientated in the cardinal directions, underwent a drying procedure at 40°C for 48 h and small clear samples of 20 x 20 x 50 mm were prepared from this material. A large variation of the ratio of filling was found for the material tested. Diameter as well as sample origin seem to influence the materials permeability. Key words: Geographic origin, permeability, RoF, Scots pine sapwood
1 PhD student, Norwegian University of Life Sciences, Department of Ecology and Natural Resource Management; Pb. 5003, 1432 Ås, Norway Tel: +47 46210175, E-mail: [email protected] 2 Researcher, Norwegian forest and Landscape Institute, Pb. 115, 1431 Ås

79
INTRODUCTION
Scots pine (Pinus sylvestris) is a coniferous tree easily available in the northern European area due to its large natural distribution and cultivation (Grosser, 1977). Additionally its heartwood combines desirable mechanical properties with a sufficient natural durability which makes it a common material for constructing purposes as well in- and outdoors. Its sapwood consists of a wooden matrix with nearly the same mechanical properties even though the durability is poor (classified 5) according to the EU standard EN 350-2. EN 350-2 though categorizes it to be easy to impregnate for extended durability. Industry and lately research however found themselves confronted with large variations in liquid uptake and the materials permeability when exposing the wood to impregnation processes (Lebow et al. 2006, Larnøy et al. 2008, Lande et al. 2010). Recent studies found differences of more than 80% in permeability after impregnating small wooden samples in the same batch in a mild treatment schedule. A variation was found from only slightly impregnated material to samples close to a full impregnation (Lande et al. 2010). There is still lack of a full explanation for this variation. Studies conducted at the Norwegian Forest and Landscape Institute found sample origin, macro anatomical and chemical properties to be contributors to impregnation results (Larnøy et al. 2008, Lande et al. 2010, Zimmer et al. 2009). These tests though, were performed on a rather small geographical range. For quality assurances of the material impregnated, process adjustments have to be aligned to the material least permeable as the preservative treatment standard of the Nordic Wood Preservative council requires a full sapwood penetration (NWPC Document no. 3 1998). Hence, gaining the knowledge about differences within the wooden material inhibiting fluid flow during impregnation is not only of scientific interest but also of economic significance. To be able to better predict the permeability of the Scots pine material given, trees from a large geographical range with a wide variation in properties were collected in this study.
MATERIAL AND METHODS
Wood material collection
In total 225 Scots pine trees were collected from 6 different countries in northern Europe (table 1).

80
Table 1: Summary of data for different trees in the study
Norway Sweden Finland Estonia Lithuania Scotland overall Number of sites 9 6 5 2 1 2 25
Number of trees 81 54 45 18 9 18 225
latitude min 57°37N 57°37N 60°01N 58°36N 55°44N 57°32N 57°32N max 66°52N 66°15N 65°05N 58°36N 57°38N 66°52N longitude min 5°19E 12°50E 23°02E 26°45E 21°07E 3°41W 3°41W max 15°17E 21°02E 28°57E 26°47E 4°17W 28°57E altitude min 50 20 50 50 20 20 20 max 560 275 100 60 20 60 560 site min 1.4 6.7 7.8 7.2 8.2 11.6 1.4 index max 15.6 16.7 20.1 13.9 15.4 17.1 17.1 (H40) mean 8.7 12.01 13.16 14.31 13.78 14.44 11.99 tree age min 72 77 75 85 98 88 72 max 182 141 209 124 118 98 209 mean 138.56 108.67 111.47 107.12 110.78 90.11 113.26 diameter min 13.5 16 19.5 14.5 17 18.4 13.5 max 41 33 30 29 39 42.1 42.1 mean 25.83 23.48 25.03 23.06 25.22 30.53 26.48 height min 8.1 13.3 15.5 13.6 13.8 17 8.1 max 24 23.8 26.3 28.5 24.6 24.5 28.5 mean 16.02 18.71 19.87 22.03 19.92 20.19 18.93 25 stands were chosen where nine trees were harvested. Per site a circular area with an area of 500-1000 m² depending on stand density with at least 30 Scots pine trees was selected and the diameter of each tree over 10 cm in thickness was measured. Those trees were separated into three diameter classes: small, intermediate and dominant, with diameters including dependent on site properties. From each of the diameter classes 3 trees were chosen randomly to harvest giving a total of 9 trees per stand. Height of the selected trees was measured and the northern exposition marked. A 1.3 m log was sampled from 1.2 m tree height upwards. A 10 cm disk was cut off from the bottom part of the log and stored in the freezer at -20 °C. The sapwood was cut off from the logs in slaps according to cardinal directions always including a little heartwood area to assure full sapwood utilization.

81
Drying
All sapwood slabs underwent a drying procedure where they were in the oven for 48 hours at 40°C. Exact temperatures and times were recorded.
Sample preparation
On each of the northern slabs the area with annual rings perpendicular to the cutting edge was marked and a 2.5 cm wide stick with bark was produced. Depending on the radial sapwood width, as many sticks (20 x 20 mm) as possible were cut from the raw stick including bark. Three clear wood samples per layer were selected in a size of 20 x 20 x 50 mm and conditioned in a climatic room to a moisture content of 13.9%. Before impregnation weight and dimensions of the samples at 13.9% MC were recorded. The cross sections were sealed twice with a two component sealer (Dreisol–2K–Aussen–Schutzlack) to assure penetration only from the lateral surfaces.
Impregnation
All samples were exposed to the same impregnation schedule, where they were placed in an aqueous Furfuryl alcohol (FA) solution in an autoclave. The experimental impregnation mix was received from the Kebony ASA furfurylation plant and consisted of approximately 69% water, 28% FA and 3% additives. The samples were exposed to a vacuum of 0.004 MPa for 5 min followed by an air pressure of 0.8 MPa for 10 min. Finally, the samples were cured for about 19 hours at 105°C. These process times are too short to achieve a full treatment. Thus, a large variation in penetration was intentionally expected.
Data analysis
To analyse the penetration, the weight percent gain (WPG) of the sample was calculated as well as the ratio of filling (RoF) (Eq. 1, 2). The WPG is a value comparing the weight after the impregnation with the one before. Hence, this value is density dependent. When using the ratio of filling, the actually filled volume of the sample gets related to the void volume, which theoretically could be filled (Lande et al. 2010). This leads to a value independent from density but describing the permeability of the individual sample.

82
Vvoid = V12% – Vcellwall – Vwater + Vswell Equation 1 RoF = Vuptake / Vvoid × 100 [%] Equation 2 Vvoid: Void volume in wood V12 %: Volume of the sample at 12 % MC Vcellwall: Volume of the cell wall material Vwater: Volume of water at 12 % MC Vswell: Potential increase in volume due to swelling Vuptake: Volume of the treating liquid For the statistical data analysis the JMP version 8.0 software (2009) from SAS Institute Inc. (Cary, North Carolina) was used.
RESULTS AND DISCUSSION Studying the permeability of Scots pine sapwood a large variation as well in tree properties (table 1) as in sample properties is apparent (table 2). One can find a large variation in within the trees within the countries and sample properties and the mean values within the countries differ a lot. Sample densities (at 13.9% MC) were found in a total range from 0.39 g/cm³ to 0.72 g/cm³. According to the prior large variation in properties, the measured permeability measured in the RoF value diversifies from 5.67 % to 85.43 % in single samples. Comparing the mean values of the countries, the difference is still 23.9 % when studying the minimum mean RoF found in Norway and the maximum mean RoF calculated for Scottish samples (table 2). Table 2: Summary of data for the samples in the study Norway Sweden Finland Estonia Lithuania Scotland overall Number of samples
321 209 185 69 44 122 950.00
density min 0.39 0.45 0.48 0.53 0.56 0.51 0.39 13.90% max 0.68 0.71 0.71 0.72 0.71 0.72 0.72 [ g/cm³] mean 0.54 0.59 0.6 0.61 0.63 0.62 0.58 uptake min 11.32 19.98 11.26 20.41 35.17 30.67 11.32 [%] max 138.28 84.52 99.41 106.53 94.27 116.55 138.28 mean 54.07 47.03 52.98 48.43 56.37 72.14 55.22 WPG min 4.52 5.53 7.19 8.01 9.6 4.75 4.52 [%] max 27.75 14.86 22.89 20.08 18.49 24.35 27.75 mean 11.36 10.31 12.19 12.28 12.53 15.17 12.17 RoF min 5.67 12.47 9.4 16.51 30.39 27.32 5.67 [%] max 82.55 59.26 85.1 80.19 68.9 85.43 85.43 mean 35.8 36.22 40.19 39.56 48.45 59.7 41.64

83
Figure 1 displays the variation of the RoF over latitude. In this figure, the diamond’s cross line shows the group mean and the vertical span of each diamond represents the 95% confidence interval for the respective group.
Figure 1: Range of the ratio of filling along the latitude Considering the mean values, a slight slope can be seen with increasing latitude in a way that the mean permeability of the samples decreases with its origin northwards. However, latitudinal origin cannot be taken into account to be the only and main contributing factor to permeability and impregnation performance when dealing with a large variation of properties itself. Former studies showed on a smaller geographical range the origin in north south axis to be a large contributor on permeability by changing inner tree properties going north or southwards (Lande et al. 2010, Larnøy et al. 2008, Zimmer et al. 2009).
0
10
20
30
40
50
60
70
80
90
100
latitude
All PairsTukey-Kramer0.05

84
Figure 2: Ratio of filling correlated to the diameter For a correlation of RoF with diameter (figure 2) a coherency seems to be apparent where the permeability of samples from larger diameter trees tends to be increased to those cut from small diameter trees. Hence through the changes caused by an increased diameter, the material structure seems to change in a way to make the tissue more permeable, without influencing density properties of the samples itself. Other anatomical properties as for example the latewood proportion (Koljo, 1953, Buro and Buro 1959), presence, aspiration state and amount of pits connecting the cells (Buro and Buro, 1959, Liese and Bauch, 1966, Stamm, 1946) and the increased age of the cambium initials could be influencing the permeability and were assumed to be contributing factors to permeability before. Those have to be investigated in the future.
CONCLUSIONS
The RoF is a good value explaining the permeability as it displays a wider range as the WPG without containing the influencing factor of density in its calculation. A wide range of the RoF was found for the samples investigated from 5.67 % to 85.43 % in single samples.

85
Origin as well as structural properties seem to influence the permeability of the wood material. To be able to give a reliable prediction of the samples permeability, further analysis of the current data as well as a more specific analysis of macroanatomical, microscopical and chemical properties of the material used in this study is necessary.
REFERENCES
Buro, A, Buro, E-A, (1959): Beitrag zur Kenntnis der Eindringwege für Flüssigkeiten in Kiefernholz. Holzforschung, 13(3), 71-77 EN 350-2 (1994): Durability of wood and wood-based products. Natural durability of solid wood. Guide to natural durability and treatability of selected wood species of importance in Europe. European Norm Grosser, D (1977): Die Hölzer Mitteleuropas – Ein mikroskopischer Lehratlas. Springer-Verlag, Berlin Heideklberg New York Koljo, B, (1953): Die Abhängigkeit der Tränkmittelaufnahme des Holzes von verschiedenen Faktoren unter besonderer Berücksichtigung von Kiefer und Fichte. Holz als Roh- und Werkstoff, 11(8), 303-311 Larnøy E, Lande S, Vestøl G (2008): Variations of furfuryl alcohol and Wolmanit CX-8 treatability of pine sapwood within and between trees. The International Research Group on Wood Protection Document NO IRG/WP/08-40421 Lebow, S, Hatfield, C, Halverson, S, (2006): Effect of source, drying method, and treatment schedule on treatability of red pine. American Wood Preservers’ Association, 102, 39-43 Liese, W, Bauch, J, (1966): On anatomical causes of the refractory behavior of spruce and Douglas Fir. J. Inst. Wood Sci. 19, 3-14 Nordic Wood Preservation Council (1998): Nordic requirements for quality control and marking of pressure treated timber. Part 1: Pine and other permeable softwoods. NWPC Document 3 Zimmer, K , Larnøy, E, Koch, G (2009): Wood properties influencing the penetration of Scots pine (Pinus sylvestris) sapwood with the wood modification agent Furfuryl alcohol. The International Research Group on Wood Protection Document NO IRG/WP 09-40470

86
TREATABILITY VARIATION OF SCOTS PINE HEARTWOOD
FROM NORTHERN EUROPE
Behr, G.1, Larnøy, E.2, Bues, C.-T.3
ABSTRACT
Scots pine (Pinus sylvestris) and especially its heartwood is one of the most common construction materials for general outer use e.g. windows or facades in northern Europe. It is considered being durability class 3 and is according to EN 350-2 'not treatable'. Reports from industry and researchers indicate that the heartwood treatability is not uniform. It is still unclear what causes these differences. To increase its durability by means of impregnation would be a contribution to extend the use of both a natural and native material. The understanding of a potential pattern analog to latitudinal/longitudinal origin or other forest or wood properties could help to improve the impregnation by better material selection. Scots pine samples from 25 different sites in 6 countries in northern Europe have been collected throughout autumn and winter 2009/2010. A circle of varying size containing approximately 30 trees was set up in a representative site of each stand. All diameters were measured and arranged in three classes. Three trees of each class were chosen randomly. Only the middle and upper diameter classes were used for studying heartwood permeability. The small diameter class had insufficient heartwood width to be processed. Samples of 20 x 20 x 50 mm were cut and conditioned in a climate chamber. The samples were impregnated with a water-soluble monomer furfuryl alcohol solution in a standard pressure/vacuum process. Results showed a generally low permeability but a few samples had an unexpected high ration of filling. Further on, the samples with the highest and
1 Georg Behr, Master student, Department of Forest Science, Dresden University of Technology, GER 01069 Dresden, Erlweinstr. 4, Tel.: +49 172 98 50 445 email: [email protected] 2 Erik Larnøy, Head of Section of Wood Technology, Norwegian Forest and Landscape Institute, Postboks 115, 1431 Ås Tel.:+47 6494 8000 email: erik.larnø[email protected] 3 1 Claus-Thomas Bues, Professor, Department of Wood Use, Dresden University of Technology, GER Postfach 1117, 01735 Tharandt, Tel.:+49 35203 38 31315 email: [email protected]

87
lowest treatability will undergo anatomical and chemical tests to explain these properties. Key words: furfuryl alcohol, heartwood, impregnation, permeability, Scots pine
INTRODUCTION Scots Pine (Pinus sylvestris) heartwood is one of the most traditional and common construction materials for general inner and outer use in northern Europe. It has a wide geographical distribution, a good availability and it is cheap compared to other materials. It is considered being durability class 3 and is 'not treatable' according to EN 350-2. Reports from industry and researchers indicate that the heartwood treatability is not uniform. It is still unclear what causes these differences. To increase its durability by means of impregnation would be a contribution to extend the use of both a natural and native material. The understanding of a potential pattern analog to latitudinal/longitudinal origin or other forest or wood properties could help to improve the impregnation by better material selection. There is an ecological and economical need to improve the use of the resource wood and especially domestic species such as Scots pine by broadening its use without increasing the impact on nature. Initial aim of the sample collection throughout northern Europe was to study the variation of Scots pine sapwood permeability. It is highly interesting to see if the heartwood would react in similar patterns or if it would behave differently. The idea was brought up by Holger Militz in a discussion with the authors.
MATERIAL AND METHODS
Material collection To achieve a wide geographical distribution Scots pine samples from 25 different sites were collected in the following six countries in northern Europe: Norway, Sweden, Finland, Estonia, Lithuania and Scotland during autumn and winter 2009/2010. In total 225 logs were collected by Katrin Zimmer and the author. Examinations are done by the PhD student Katrin Zimmer regarding sapwood permeability and concerning heartwood properties by the authors.

88
Table 1: site properties by country
latitude longitude altitude diameter tree height age site
index [ m] [cm] [ m] (H40) Norway min 59°32' 5°19' E 50 18.5 11.8 85 4.1 max 66°52' 15°17' E 560 41.0 22.2 180 13.0 mean 28.8 16.7 143 8.6 Sweden min 57°38' 12°50' E 20 19.5 13.5 81 7.3 max 66°15' 21°02' E 275 33.0 23.8 141 16.7 mean 26.1 19.5 111 12.1 Finland min 60°01' 23°03' E 50 23.0 15.5 75 8.0 max 65°05' 28°57' E 100 31.0 26.3 209 20.1 mean 27.0 20.5 115 13.2 Estonia min 58°36' 26.45' E 50 21.5 15.6 85 9.4 max 58°36' 26°47' E 60 29.0 28.5 124 19.4 mean 25.4 21.8 105 14.2 Lithuania min 55°44' 21°07' E 20 27.0 19.7 98 12.3 max 55°44' 21°07' E 20 39.0 24.6 118 15.4 mean 34.0 22.2 114 13.8 Scotland min 57°32' 3°41' W 20 25.5 17.4 88 11.8 max 57°38' 4°17' W 60 42.1 24.5 98 17.1 mean 33.9 20.8 92 14.4 The sample trees were chosen in a circle of varying size containing at least 30 Scots pine trees in a representative site of each stand. All diameters were measured and arranged in three classes. Three trees of each class were chosen randomly. Their heights were measured and north direction and breast height marked. Site indices were considered being low to middle but had a wide spread from 4-20 [H40= height of tree at age 40]. Only the middle and upper diameter classes were used. The small diameter class had insufficient heartwood width to be processed.
Sample Preparation The stem parts from 1.2 m - 2.5 m height were taken to the Norwegian Forest and Landscape Institute in Ås, Norway. A disc at the lower end (primary breast height: 1.3 m) was cut off for annualring analysis (tree age, heartwood and sapwood age and distribution). On a stationary saw the sap and heartwood were separated. One 2.5 cm wide radial stick per heartwood beam was cut, reaching

89
from pith to the heartwood-sapwood border. To avoid juvenile wood, the first sample-stick has a 2 cm distance to the pith. Depending on the heartwood diameter, one, two or three sticks (2.5 x 2.5 cm) were cut. After planning, the sticks with straight annual rings measured 20 x 20 mm and were 1m long. Five Samples of 50 mm length were cut from each stick and conditioned in a climate chamber to 13.8 % moisture content. Three samples were used for the impregnation, two will be used for further chemical an anatomical analysis. They were weighed at equilibrium moisture content and measured in all three directions to specify their volume. The three impregnation samples were sealed twice with a two component (Dreisol-2K-Aussen-Schutzlack) paint at both axial ends to eliminate longitudinal penetration.
Impregnation The used treatment agent is an experimental impregnation mix consisting of approximately 69% water, 28% furfuryl alcohol and 3% additives provided by the Kebony ASA furfurylation plant. A pressure/vacuum process using 0.004 MPa for 20 minutes and 0.8 MPa for one hour was applied. The specimens were weighed directly after the surface was wiped clean of excess liquid. The time delay of weighing was recorded from the first to the last sample and uptake figures were corrected with a linear regression (Zimmer & Treu, 2010, unpublished). The curing at 120 °C took 19 hours. The oven was switched off and the samples were slowly cooled for 15 hours. They were weighed again to determine their post treatment mass.
Data analysis Data collection and preparation was done by the use of Microsoft’s Excel 2003. For the statistical data analysis the JMP version 8.0 software (2009) from SAS Institute Inc. (Cary, North Carolina) was used. The following equations were used to calculate the ratio of filling (RoF): Vvoid = V12% – Vcellwall – Vwater + Vswell Equation 1 RoF = Vuptake / Vvoid × 100 [%] Equation 2 Vvoid: Void volume in wood V12 %: Volume of the sample at 12 % MC

90
Vcellwall: Volume of the cell wall material Vwater: Volume of water at 12 % MC Vswell: Potential increase in volume due to swelling Vuptake: Volume of the treating liquid
RESULTS AND CONCLUSION
A large variation in heartwood permeability was found; The heartwood permeability varies highly; the RoF varies from mere 5 % to almost 70 %. But 50 % of the samples’ RoF lies between only 8.7 % and 12.7 % and 80 % lie between 7.7 % and 16.6 %. The mean value is 12.1 % and the median is 10.4 % (figure 1).
Figure 1: total RoF distribution showing mean confid diamond, median and 50 % and 80 % interval borders The heartwood treatability does not seem to be influenced significantly by site properties or tree characteristics. The RoF of some single specimens was above average, but appears in very different diameter classes and latitudes (figure 2 and 3). The only exceptions to this are the upper diameter classes which tend to have a higher RoF than the smaller diameters (figure 3).

91
Figure 2: RoF by latitude showing means/Anova and comparison of all pairs using Tukey-Kramer HSD
Figure 3: RoF by grouped diameters showing means/Anova and comparison of all pairs using Tukey-Kramer HSD. Each group represents a two centimetre wide class: group 20 stretches from 18.1 to 20.0cm; group 22 from 20.1 to 22.0. In average the RoF values are very similar, except for the Scottish samples, which tend to have a much higher RoF. Scotland’s average is 20.9 % whereas all other countries’ average is between 10.3 and 12.5 % (Table 2).

92
Table 2: sample properties by country
Norway Sweden Finland Estonia Lithuania Scotland density min 0.40 min 0.45 min 0.43 min 0.52 min 0.59 min 0.44 (13.8%) max 0.65 max 0.68 max 0.62 max 0.67 max 0.67 max 0.60 [g/cm³] mean 0.52 mean 0.54 mean 0.52 mean 0.57 mean 0.61 mean 0.53 RoF min 6.6 min 7.2 min 6.7 min 8.6 min 5.8 min 9.7 [%] max 27.9 max 25.7 max 17.1 max 13.0 max 26.5 max 50.1 mean 12.5 mean 12.0 mean 10.3 mean 10.5 mean 12.0 mean 20.9 The overall average RoF of all samples is 13 %, maximum RoF is 50.1 % and minimum RoF is 5.8 %. The average density (13.8 %) is 0.55 g/cm3, maximum density (13.8 %) is 0.68 g/cm3 and minimum density (13.8 %) is 0.40 g/cm3. The present impregnation trail was the first test in a series to examine the heartwood permeability. It showed the distribution of all the sample’s RoF (figure 1). Up to now the statistical analysis does not answer the question why the RoF distribution is like that. Further research is needed to fully understand the materials performance. Extractives and resin content have not yet been studied, but are known to have a major influence on the heartwood treatability performance.
REFERENCES Militz, H. (2009). Personal communication. Treu, A., Rieche, H., Militz, H. (2008): Spruce and pine heartwood treatment by means of microwave radiation. The International Research Group on Wood Protection Document NO IRG/WP 08-40411 Wang, J. Z., DeGroot, R. (1996): Treatability and Durability of Heartwood. United States Department of Agriculture, Forest Service Zimmer, K., Larnøy, E., Koch, G. (2009): Wood properties influencing the penetration of Scots pine (Pinus sylvestris) sapwood with the wood modification agent Furfuryl alcohol. The International Research Group on Wood Protection Document NO IRG/WP 09-40470

93
INVESTIGATION OF ELASTICITY AND STRENGTH
PROPERTIES OF SCOTS PINE WOOD USING ULTRASOUND AND ACOUSTIC METHODS
Sveikataite, D.1, Miseikyte, S.2 & Baltrusaitis, A.3
ABSTRACT
In order to determine dynamic modulus of elasticity and strength classification of Lithuanian grown Scots pine, comparative a research was made using two non- destructive devices: “Timber Grader MTG” and ultrasonic elasticity and strength meter, developed at Kaunas University of Technology. Pine timber specimens of primary sizes 1011 × 95 × 45 mm, 1011 × 145 × 45 mm and 1011 × 170 × 45 mm were tested. Modulus of elasticity (MOE), natural frequency (NF), time of flight and strength classes was determined. Modulus of elasticity, gained with the ultrasound tester, showed better correlations with density then the ones, measured with the device “Timber Grader MTG”. Moreover, MOE from “Timber Grader MTG” were higher on about 10 % for specimens with width of 95 mm, 8 % for width of 145 mm and 12 % for width of 170 mm then the ones from ultrasound tester for the same specimens’ width. Nevertheless, the correlations between MOE, measured with these two non-destructive methods, are sufficient and fluctuating from 0.46 to 0.69. Key words: wood, non-destructive methods, time of flight, modulus of elasticity, strength.
INTRODUCTION Wood is a shifting natural resource and because of it is used very widely. In purpose to use appropriately all kinds of wood it is necessary to evaluate its elastic and strength qualities, assess strength class, humidity, number of defects 1 Master student, Department of Mechanical Wood Technology, Kaunas University of Technology, Studentų 56, LT-51424 Kaunas, Lithuania, E-mail: [email protected] 2 PhD student, Department of Mechanical Wood Technology, Kaunas University of Technology, Studentų 56, LT-51424 Kaunas, Lithuania, E-mail: 3 Head of Wood Technology Department, Faculty of Design and Technologies, Kaunas University of Technology, Studentų 56, LT-51424 Kaunas , Lithuania, Tel: +370 37 300230 / 353863, Fax: +370 37 353863, E-mail: [email protected]

94
and etc. Those qualities strongly influence possibilities of wood applications and use. In industry wood can be assorted into strength classes by examining it visually. However, in this case, quality and output depends on the experience of a worker [1].The other important weakness of this method is evaluation of visible external defects and not evaluating influence of internal invisible defects. Because of those reasons non-destructive research methods, when wood is explored by using specific devices, are being used more widely. These methods are new enough and there are a lot of research done in order to identify reliability and possibilities of such devices. One of the most widely used non-destructive wood research method is determination of elastic wood qualities by using devices which operation principle is sustained by acoustic wave spread in wood. “Timber Grader MTG” works using such principle. It is patented as a manual wood strength measurement system [2]. Researches were done in order to evaluate the potential of this device. During those researches non-destructive methods’ (Timber Grader MTG, Metriguard and Long Span) errors, compared to wood strength which was made after performing 4 points flexure test, were determined [3]. Received results showed that the best correlation between dynamic modulus of elasticity and static strength while flexing were received using the device “Timber Grader MTG”. There are more research done in pursue to determine accuracy and reliability of non-destructive wood research methods. Both, conifer and leafy wood was used for those researches. In all cases, good correlations were determined between static strength modulus and dynamic modulus of elasticity, which was received by using the device “Timber Grader MTG”. The other widely used non-destructive wood research method is sustained by the spread of ultrasound in wood. Using this method the research is done not only with wood elements [6], but also with glued timber [7] and “standing” wood [8] that means that the quality of the wood is examined while the tree is not cut yet. Reliable results were received in all cases while determining wood’s mechanic qualities in the case of dried and non-dried wood. Researches done using the device “Timber Grader MTG” and ultrasound elasticity and strength meter, developed in Kaunas University of Technology, are presented in this article. The purpose of this research was to compare two different non-destructive methods’ stiffness-strength modulus and their inter-relations.
MATERIAL AND METHODS
For this research Lithuania - grown pine wood (e.g., Pinus Sylvestris) specimens cut from the model logs delivered from seven Forest Directorates

95
(Mažeikiai, Kretinga, Jurbarkas, Dubrava, Druskininkai, Anykščiai, Švenčionėliai) were used. The diameter of the timbers ranged from 158 mm to 355 mm. Central boards from three diameter-related sawing patterns were later cut into specimens with the sizes: 1011 × 95 ×45 mm, 1011 ×145 ×45 mm and 1011 × 170 × 45 mm. Average specimen density was – 521 kg/m3, moisture content – 11 %. Dynamic modulus of elasticity an strength class was determined for all specimens using the device „Timber Grader MTG” (Fig.1, a). MOE evaluation principle is based on acoustic wave spread in wood, assessing specimens density and moisture content [2]. „Timber Grader MTG” grades wood assortment into strength classes according to the EN 338 standard “Structural wood. Strength classes”. [9].
a b Fig. 1. Devices used in the research: a – „Timber Grader MTG“; b - ultrasound elasticity and strength meter. After that the, specimens were tested using ultrasound elasticity and strength meter (Fig. 1, b). The work principle of this device is based on the ultrasound wave spread in wood while measuring Lamb wave spread time between transceiver and receiver fixed at 380 mm distance. Each specimen was measured on four planes- scanning 10 times each plane lengthwise at every 60 mm. Dynamic modulus of elasticity for sequent positions was calculated using the following formula [10]:
2υρ ⋅=dl
MOE , Eq. 1
here: MOEdl – topical dynamic modulus of elasticity, N/mm2; ρ – density of the wood, kg/m3; υ – ultrasound speed, m/s, calculated υ = 2×lu×f or υ = 2×lu/T; f – frequency of acoustic wave, Hz; lu – distance between transceiver and receiver, m; T – time of flight, s.
96
Specimen apparent dynamic modulus of elasticity is calculated:
ndlMOEdMOE /∑= , Eq. 2
here: n –number of measurements on single specimen. According to calculated modulus of elasticity, strength classes were determined with reference to standard EN 338 “Structural wood. Strength classes” [11].
RESULTS AND DISCUSSION Graphic dependences comparing used two testing methods are given on Fig. 2-4. Also, there is graphically performed the devices „Timber Grader MTG” ultrasound elasticity and strength meter elasticity variation when vary frequency rate and density of the specimens (Fig. 5, 6). All results’ statistical evaluation was done and correlation rates were determined. Different width specimens’ module of elasticity and density dependence when for measurement using „Timber Grader MTG” and ultrasound elasticity and strength meter is performed in the figure 2.
Fig. 2 Dynamic modulus of elasticity dependence on wood density (ultrasound and acoustic waves).
R 2 = 0.3751 (MTG, width 95mm) R 2 = 0.2642 (MTG, width 145 mm)
R 2
6000 7000 8000 9000
10000 11000 12000 13000 14000 15000 16000 17000 18000 19000
390 410 430 450 470 490 510 530 550 570 590 610 630 650 670 690 710 730 Density ρ, kg/m3
Dyn
amic
mod
ulus
of e
last
icity
E, M
Pa
MTG, width 145mm MTG, width 170mm Ultrasound, width 95mm Ultrasound, width 145mm Ultrasound, width 170mm Linear (MTG, width 95mm) Linear (MTG, width 145mm) Linear (MTG, width 170mm) Linear (ultrasound, width 95mm) Linear (ultrasound, width 145mm) Linear (ultrasound, width 170mm)
= 0.2407 (ultrasound, width 170 mm) = 0.5151 (ultrasound, width 95 mm) R 2
R = 0.5699 (ultrasound, width 145 mm) 2 = 0.2241 (MTG, width 170 mm) R 2
MTG, width 95mm

97
As it is seen from the picture, dynamic modulus of elasticity, as well as static, is directly proportional for density because received correlation rates are positive. However, when measuring specimens with ultrasound elasticity and strength meter, correlation between those measurements is better than when measuring with the device „Timber Grader MTG”. In the first case the best correlation is among 145 mm width specimens and the worst is among 170 mm specimens. However, when using the device „Timber Grader MTG” correlation is poor and connection between module of elasticity and density is weak. After performing statistic evaluation of results it is received that 75mm width specimens’ modulus of elasticity evaluated by using „Timber Grader MTG” is moderately 10 % higher than the one measured with ultrasound elasticity and strength meter when the density is the same. When the width of the specimen is 145 mm the module of elasticity is 8 %, and when the width is 170 – 12 %. Dynamic modules’ of elasticity connection is given in Fig. 3.
Fig. 3 Dynamic modulus of elasticity correlation (three-width specimen). It is seen from the picture 3 that there is a good internecine relation between dynamic modulus of elasticity which were measured using two different methods. Modulus of elasticity correlate best when the width of the specimens is 95mm, the worst correlation is at 145 mm. Despite this, after statistic analysis was done it was noticed that the lowest difference of modulus of elasticity was received for 145 mm width specimens. It is almost 8 %. Meanwhile, this difference for 95 mm width specimens is almost 10 % and for 170 mm specimens – almost 12 %. In all cases higher modulus of elasticity is received by using the device „Timber Grader MTG”.
R 2 = 0.6921 (width 95 mm) R 2 = 0.4565 (width 145 mm) R 2 = 0.6086 (width 170 mm)
7000 8000
9000
10000
11000
12000
13000 14000
7000 8000 9000 10000 11000 12000 13000 14000 15000 16000 17000 18000 19000 Modulus of elasticity EMTG, MPa
Mod
ulus
of e
last
icity
Eul
tras
ound
, MPa
Width 95 mm Width 145 mm Width 170 mm Linear (Width 95 mm) Linear (Width 145 mm) Linear (Width 170 mm)

98
Distribution of rates, measured in two different non-destructive methods is given in Fig. 4.
Fig. 4 Internecine relation of frequency rates (specimens of three widths) It is seen from the figure 4 that there is average strength correlation between determined wood own range rates. The rates correlate best when the width of the specimens is 170 mm and the worst correlation is at 145 mm. After statistic analysis was done it was noticed that the rates measured with „Timber Grader MTG” are higher at 8 % when the width of the specimens is 95 mm and at 7 % when the width is 170 mm compared to the rates measured with ultrasound meter. Modulus’ of elasticity variation tendencies when the wood density and own range rates vary while measuring with „Timber Grader MTG” were calculated. It was found that 95 mm width specimens’ modulus of elasticity measured with “Timber Grader MTG” increases when the density of the wood and frequency rate increases. Modulus of elasticity in this case can be calculated using the following function:
,7.96.228.23497 fMTGMOE ++−= ρ Eq. 3
here: MOEMTG – „Timber Grader MTG” is used to measure dynamic modulus of elasticity, N/mm2; ρ – density of the wood, kg/m3; f – frequency, Hz. Correlation of those values is strong because good correlation coefficient is received. (R = 0.993). Strong correlation (R = 0.986) between modulus of elasticity, density of wood and frequency rate is received when examining the
R 2 = 0.4634 (width 95 mm) R 2 = 0.2471 (width 145 mm) R 2 = 0.5133 (width 170 mm)
1750 1800 1850 1900 1950 2000 2050 2100 2150 2200 2250 2300 2350
1900 1950 2000 2050 2100 2150 2200 2250 2300 2350 2400 2450 2500 2550 2600 2650 2700 2750 2800 2850 Frequency fMTG, Hz
Width 95mm Width 145mm Width 170mm Linear (width 95mm) Linear (width 145mm) Linear (width 170mm) Fr
eque
ncy
f Ultr
asou
nd, H
z

99
specimens of 145 mm width. Function describing those values is: fMTGMOE 1.92.213.21279 ++−= ρ . When the width of the specimens is
170 mm strong correlation is also received (R = 0.991). Modulus of elasticity can be described by the following function:
fMTGMOE 6.90.208.21826 ++−= ρ .
Fig. 5 Pine wood specimens’ distribution into strength classes („Timber Grader MTG” and ultrasound elasticity and strength meter) As it is seen from the picture using both non-destructive methods the biggest number of specimens got to C24 strength class. Higher percentage of the specimens measured with ultrasound got to the group C18, and the ones measured with acoustic method got to the group C30. Because of this, Lithuanian pine wood correspond European Union raised requirements for structural wood and can compete with the same type wood of other countries.
CONCLUSIONS 1. Higher dynamic modulus of elasticity (MOE) is received when exploring wood using acoustic method rather than when exploring with ultrasound. MOE spread depends form measurement elements (in this case the width), density of the wood and resonant rate. 2. Correlation between MOE, examined with „Timber Grader MTG” and MOE, examined with ultrasound elasticity and strength meter is good, so we can make a conclusion that those means can quickly and reliably measure elastic wood qualities and relate them with strength by bringing them into strength classes.
0.45 6.36 11.36
24.55
40.45
17.27
2.27 10.45
61.36
25.45
0 10 20 30 40 50 60 70
C18 C24 C30 C35 C40 Timber Grader MTG amount, % Ultrasound amount, %

100
3. Dynamic modulus of elasticity functions expressed through the wood frequency rate and density are of a similar character when the wood is examined by both non-destructive methods. Those three values have very strong correlations. 4. The biggest percentage of the pine specimens got to the C24 strength class. Wood of such strength qualities is widely used in construction industry and can be used for bearing structures.
REFERENCES 1. Miseikyte, S., Baltrusaitis, A., Kudakas, L. The investigation of Strength and Stiffness properties of the pine. Product design and technology, 2008: conference materials, Kaunas University of Technology, Kaunas : Technology. 2008: pp. 224-228. 2. www.brookhuis.com/en/products/timber_grader_mtg/the_timber_grader_mtg.php 3. Miseikytė, S., Baltrusaitis, A., Kudakas, L. Strength and stiffness properties of the Lithuanian grown Scots pine (Pinus sylvestris): comparison of various testing methods. Proceedings of the 4th meeting of the Nordic Baltic Network in Wood Material Science & Engineering (WSE), November 13-14, 2008, Latvian State Institute of Wood Chemistry, Riga, Latvia. 2008: pp. 101-107. 4. Ravenshorst, G.J.P., van de Kuilen, J.W.G. ir CNR – Ivalsa. An innovative species independent strength grading model. 2006. 5. Krzosek, S., Grzeskiewicz, M. ir Bacher, M. Mechanical properties of Polish – grown Pinus Silvestris L. structural sawn timber. The Netherlands, Conference COST E53, 2008: pp. 253 – 260. 6. Jean-Luc, S., Yann, B. Timber grading machine using multivariate parameters based on ultrasonic and density measurement. 1st COST E 53 Conference – Quality Control for Wood and Wood products, Faculty of Wood Technology, Warsaw University of Life Sciences, Poland, October 15th – 17th, 2007: pp. 167 – 173. 7. Aicher, S., Dill-Langer, G. ir Ringger, Th. Non-destructive detection of longitudinal cracks in glulam beams. Otto-Graft-Journal, Vol. 13, 2002: pp. 165 – 182. 8. Dzbenski, W., Wiktorski, T. Ultrasonic evaluation of mechanical properties of wood in standing trees. 1st COST E 53 Conference – Quality Control for Wood and Wood products, Faculty of Wood Technology, Warsaw University of Life Sciences, Poland, October 15th – 17th, 2007: pp. 21 – 26. 9. Ing. Rozema, P. Timber Grader MTG.- Brookhuis Micro-Eletronics BV, The Netherlands, 2007. 10. Unterwieser, H., Schickhofer, G. Pre-grading of sawn timber in green condition. 1st COST E 53 Conference – Quality Control for Wood and Wood products, Faculty of Wood Technology, Warsaw University of Life Sciences, Poland, October 15th – 17th, 2007: pp. 161 – 166. 11. LST EN 338: 2004. Structural wood. Strength classes.

101
HIGH CAPACITY TIMBER SAWING BASED ON ACCURATE
LOG SCALING
Gjerdrum, P.1 & Hamar, B.2
ABSTRACT
Commercial timber sawing is always done in trade-off between yield and capacity, between cost of raw material and of production. Accurate knowledge of the dimensions for every single log is needed for successful breakdown. Traditionally, mills sawing to customers' order, i.e. timber lots of given dimension and quality, start the breakdown process by scaling and sorting unbarked logs. However, accuracy can be greatly improved if scaled after barking. Scaling barked logs to adapt sawing pattern to each log inevitably slows down production speed, and also produces a variety of sawn boards besides the ordered one. The goal of the project described in this paper was to optimise the yield while maintaining high capacity and sawing to order. A modern, medium-sized sawmill producing ca. 60 000 m3 spruce timber annually was about to renew the sawlog intake. A two-stage log scaling/sorting and sawing twin mini-series was concluded. The first stage is the traditional sorting of unbarked logs. In the new intake, when the order is to be produced, logs are debarked before a second scaling with a 3D scanner based on laser beams reflected from the smooth and bright log surface. Logs are directed to either of two log decks, or buffers, each of ca. 25 logs, and sawn in twin mini-series alternating between the two. Sorting criteria might be purely diameter, log length, quality prediction generated from log geometry, or a combination. The sawn timber yield was increased by up to 3 000 m3 annually, corresponding to the contribution margin improved by 3 mill. NOK or more. Production speed is increased by ca. 4%, but producing two orders simultaneously increases planning complexity, requiring additional training for involved personnel. It can be concluded that the chosen set-up: Two-stage log sorting with accurate
1 Senior scientist, Wood Technology Section, Norwegian Forest and Landscape Institute, Box 115, N-1431 Ås, Tlf. +47 6494 8000, Fax. +47 6494 8001, E-adr. [email protected] 2 Production Manager, Moelven Numedal AS, N-3620 Flesberg, Tlf. +47 3229 5000 E-adr. [email protected]

102
scaling in the final sorting and sawing twin orders in alternating twin mini-series, has proved successful with respect to sawn timber recovery and production capacity. Key words: log scaling, dual mini-series, production capacity, twin orders.
INTRODUCTION
In mature industries like sawmilling, profit margins are generally rather small, but, fortunately, also quite consistent. Any sawmill will have to improve the efficiency year by year, and only the most competent companies will survive.
Cost of raw material and of operating and depreciating the sawmill is crucial for the overall profit. Increasing the yield of sawn timber from available sawlogs and fine-tuning production routines to improve the production speed will always be part of a sawmill's struggle to advance profitability.
Scandinavian sawmills operate in two different modes: Either sawing unsorted logs, producing all falling dimensions and qualities. Customers' orders will subsequently be sorted out of the available stock of sawn timber. The other group does even the primary breakdown according to the customer's order, termed "sawing to order". These mills need a substantial stock of sawlogs, sorted into lots possibly homogeneous in dimension and quality. As most sawmills prefer to keep the logs unbarked in the stock, sorting accuracy is negatively influenced by variation in bark thickness and bark damages; this inaccuracy causes yield losses during breakdown. Consequently, such lots are termed "rough-sorted". Assuming independent factors, the resulting accuracy in scaling sawlog diameter can be estimated from Eq. 1 (Gjerdrum & Høibø 2000):
22222uracyScannerAccOvalityBarkDamageessBarkThicknBarkmetreUnderSortingDia sssss +++= Eq. 1
In modern scanners, the 95 % confidence interval for sorting diameter under bark was estimated to approximately ±8 mm for unbarked spruce and ± 4 mm for barked logs.
A typical set-up for "sawing to order" mills is to do keep a stock of unbarked logs. When the breakdown process is to be started, logs pass through the "log in-take": Logs are singulated, turned to small-end first, debarked and scaled, usually in a 3D log scanner, to control the immediate in-feed to the saw. This second and more accurate scaling might be used to increase the yield by adjusting the saw to an individual breakdown pattern for each log. However, the

103
adjustment takes a certain amount of time, leading to reduced production capacity and increased cost.
The idea of the work presented here was to analyse the profitability of dividing the rough-sorted lot into two, thicker and thinner, by accurate sorting after barking; these logs to be accumulated in two independent log decks (buffers) and subsequently sawn in alternating dual mini-series.
MATERIAL AND METHODS
A major Norwegian sawmill was about to rebuild the "log in-take". Several options were available, and following initial analyses, the mill decided on an additional 3D log scanner based on laser beams reflected from the smooth and bright log surface immediately after debarking, and two independent log decks (Fig. 1). Each deck is fed based on observations made by this scanner on the barked logs (Fig. 2), either pure dimension or predicted timber quality or a combination. Dual orders are produced, alternating between the decks, each in a preset sawing pattern. The mini-series is some 20-30 logs. In this way, production losses caused by changing the sawing pattern are kept low. Rebuilding the log in-take took place during the summer 2009. A number of observations have been done to evaluate the investment; in this report we have focused on yield and capacity.
Fig. 1. Barked logs sorted to the twin log decks.

104
Statistical reports for 226 production orders have been recorded and analysed, representing 40 800 m3 sawlogs before and 41 100 m3 logs after the investment, for a total of 81 900 m3 or nearly 404 000 logs. Only lots sorted according to diameter were included. Log and yield characteristics, order information and production description were recorded and analysed statistically. The information is collected from various sources along the primary breakdown chain, mostly automatically generated. It should be considered that no such observation is perfectly correct and that cut-off between orders might be inaccurate; however, all figures have been screened and assessed, and only sensible datasets were kept.
Average yield depend most notably on the small end diameter; consequently, average yield per diameter class for all different sawing patterns were calculated. Next, analytic-empirical regression models for main and total yield, respectively, were established for the before and after investment observations. Details for model estimation are given in Gjerdrum (2007). Available log supply has averaged to 120 000 m3 annually (equivalent to ca. 60 000 m3 sawn timber annually), exclusively Norway spruce. To have a possibly plain and straightforward differential calculation before-after, most input values were kept unchanged, e.g. diameter classes and sawn timber prices. However, the mix of sawing pattern has certainly changed due to the ever-changing dynamics in customers' preferences. Sawn timber prices were set to 1 400 and 1 000 NOK (ca. 175 and 125 EUR, with exchange rate 1:8) for main yield and sideboards, respectively; all prices net FOB per m3.
Fig. 2. Even if not perfect, scaling accuracy is greatly improved after
barking – whether scaled by calliper or in a 3D scanner

105
RESULTS AND DISCUSSION
Sawn timber yield The yield increase has been verified in two different ways. First, the average outcome from each of the 20 applied diameter classes were compared (Fig. 3). A substantial improvement is readily seen, both for main yield and sideboards. The additional gain in sawn timber, weighted by log volume in each class, adds up to 1 681 m3 main yield and 1 386 m3 sideboards, total 3 067 m3.
Fig. 3. Main yield and total yield both increased considerably from before
(H06-H08) to after (H09-S10) the investment The "peaks and downs" in the main yield graph (left part of Fig. 3) can be explained in this way: Most volume is asked for 100 and 150 mm wide centre boards. The highest yield is achieved when sawing a quadratic pattern, and then these two widths correspond to ca. 15 and 22 cm diameter – exactly where the highest yield can be found. For other diameters, either non-quadratic main yield or over-sized logs are frequently used, and consequently lower recovery. However, as can be seen from the smother curve in the right part of Fig. 3, most of the loss is regained as sideboards. The gain corresponds to 3.0 mill. NOK annually.
Second, recovered yield were calculated applying the analytical-empirical regression model (Gjerdrum 2007), with separate models estimated for before and after investment periods, respectively. The yield was calculated for a number of typical sawing patterns (Table 1.) and scaled to annual volume.

106
Additional yield estimated this way is 2 348 m3 total sawn timber (1 020 m3 and 1 328 m3 for centre and side boards, respectively), corresponding to increased revenue 2.1 mill. NOK. As the increased volume is produced from an unchanged sawlog input, the added value equals the added revenue.
Table 1. Summary of results from before-and-after results calculated by the regression models for typical orders and scaled to annual volume
Log Additional Gross AddedDiam, no. of Typical volume yield revenue revenue
cm logs saw pattern m3 m3 NOK NOK13 1000 2 * 38 * 100 95.6 1.5 66 189 1 24014 1000 2 * 50 * 100 108.8 0.2 79 027 50017 1000 2 * 50 * 125 148.4 4.3 113 020 3 92320 1000 2 * 50 * 150 196.6 6.8 149 575 5 77921 1000 2 * 63 * 150 216.9 9.2 177 150 8 02424 1000 2 * (38+44) * 150 283.1 5.7 228 786 5 63126 500 2 * (38+44) * 175 162.9 4.4 134 805 4 18029 500 4 * 44 * 200 186.0 3.8 156 659 3 71532 500 4 * 50 * 200 225.5 -0.5 181 005 -31037 500 4 * 50 * 225 270.2 1.7 210 072 1 025
Sum 1894.1 37.1 1 496 290 33 706Additional raw material and production cost 0.0 0Additional contribution margin
- for chosen lots 37.1 1496289.5 33 706
- scaled to annual volume 120 000 2 348 2 135 4972.3 %
Other effects of the investment
The breakdown capacity has undoubtedly increased, as has been experience in a number of – mostly minor – challenges that need consideration and adjustment to obtain a smooth production flow. It is well known, that when capacity is increased in one part of a production line, new bottlenecks will emerge in other locations, so this was no big surprise. At the time of reporting, the overall weekly capacity has increased ca. 4%, the joint effect of straight sawing with fixed pattern for the mini-series and reduced down-time for the new section of the sawmill.
The most serious bottleneck now is kiln capacity, due to changed situation for production assumption. At the time of deciding the new log in-take, the assumption was to produce an unchanged volume of sawn timber, consequently reducing sawlog input and production time. After experiencing higher demand

107
for sawn timber and the successful operation of the new equipment, however, this was changed to producing at full capacity the same weekly hours as before, considerably increasing the weekly sawn volume – and running into a kiln bottleneck. At the time of writing, the solution for this has not been decided.
Also, labour cost and maintenance have been reduced. However, some additional cost to fine-tune all new equipment must be accepted.
Reduced cost for higher capacity has been estimated to 0.4 mill. NOK and reduced labour cost to 0.35 mill. NOK annually. Thus, sum calculated additional contribution margin adds up to 2.9 to 3.7 mill NOK per year.
CONCLUSIONS The idea of the work presented here was to analyse the profitability of dividing the rough-sorted lot into two, thicker and thinner, by accurate sorting after barking; these logs to be accumulated in two independent log decks (buffers, Fig. 1) and subsequently sawn in alternating dual mini-series. It can be concluded that the chosen set-up has proved successful with respect to
o sawn timber recovery, and o production capacity.
Corresponding to these improvements and reduced need for labour and maintenance, the contribution margin increased 3 mill NOK or more annually. Acknowledgements. The support from Moelven Numedal AS and from the Norwegian Research Council is greatly acknowledged.
REFERENCES Gjerdrum, P. & Høibø, O. 2000. Diametersortering gjøres best etter barking. Skogindustri 10: 20-22 (in Norwegian)
Gjerdrum, P. 2007. A combined analytic-empiric approach for modelling sawn timber yield. In Modelling the Wood Chain: Forestry - Wood Industry – Wood Product Markets, proceedings from the COST E44 conference in Helsinki 17th-19th 2007. ISBN 9789080656536, p 49-58
108
PREDICTION MODELS FOR DENSITY IN STEMS OF PICEA
ABIES (L.) KARST. AND PINUS SYLVESTRIS L. IN SOUTHERN NORWAY
Hundhausen U.1 and Høibø O. A.2
1Norsk Treteknisk Institutt (Norwegian Institute of Wood Technology). P.O. Box 113 Blindern. 0314 Oslo. Norway. E-mail: [email protected]; phone: ++47 97657599; fax: ++47 22604291 2Department of Ecology and Natural Resource Management. Norwegian University of Life Sciences. P.O. Box 5003. NO-1432Ås. Norway
ABSTRACT
Random coefficient mixed models were developed to predict vertical and horizontal density variations in stems of Scots pine and Norway spruce. Modeling and validation were based on investigations of 132 spruce and 60 pine trees in southern Norway. Density was measured on discs and small clearwood samples that were taken from 4 different tree heights (stump, 25%, 50%, and 75%). In pine, the common vertical trend in disc density increased with approx. 100 kg m-3 from the stump to the top; the level of this trend, however, varied strongly among trees. The horizontal density trend was less clear than the vertical one and considerably differed between pine trees. Within trees, it was strongly dependent on the tree height position. The most accurate model for density in pine included the following explanatory variables: the ratio of tree height to diameter at breast height, diameter of stem disc with bark, bark volume on disc, and ring width. Validation on independent material gave R2 of 0.45 for density of clearwood samples. In spruce, the vertical difference of density was low as compared to pine. The average disc density was approx. 15 kg m-3 higher at 75% tree height than at the stump. In vertical direction, density varied considerably between spruce trees. Silviscan measurements revealed that density rapidly decreased by approx. 100 kg m-3 within the first 5 annual rings. Differences between the average densities of clearwood samples were not statistically significant at any tree height level. The most accurate model gave an R2 of 31% in the validation procedure. The model included sample position, site index, diameter at breast height, and bark volume as input variables. Key words: density, random coefficient mixed models, wood quality prediction

109
INTRODUCTION
Wood density has a great importance for manufacturing processes and quality of forest-based products, which has aroused a growing scientific interest to create models for predicting density in recent years (Duchesne et al. 1997; Kellomäki et al. 1999; Lindström 2000; Wilhelmsson et al. 2002; Repola 2006; Mäkinen et al. 2007; Ikonen et al. 2008; Steffenrem et al. 2009). In the sawmilling industry, only few factories have density measurement systems for green boards although technology is available in form of weighing methods or X-ray technology. Such equipment, however, needs some kind of moisture content approximations either through inline measurements or quality control of drying batches. This implies that the use of this equipment at an early stage in the process gives poor density estimates due to the strongly varying moisture content in logs and green boards (Brännström 2005). A prediction of density will consequently improve the saw milling process in terms of both grade yield and production efficiency. The simplest systems for a saw mill could be to predict density from the dimension of the boards and the position in the cross section. (Steiner and Øvrum 2010). More advanced prediction models could include forest data like stand variables, tree variables, and what log in the tree the logs come from (Duchesne et al. 1997; Bergstedt and Olesen 2000; Lindström 2000; Wilhelmsson et al. 2002; Mäkinen et al. 2007). The present study has the objective to extend the knowledge on density variation in Norway spruce (Picea abies (L.) Karst.) and Scots pine (Pinus sylvestris L). In this context, linear mixed models were developed based on investigations of 132 spruce and 60 pine trees in southern Norway to predict horizontal and vertical density variations in stems. The investigations are part of the project “Wood quality predicting systems as a tool for differentiation and sorting of wood raw material” (Norwegian Research Council, project no. 178330) that aims to create better utilisation of Norwegian forest resources.
MATERIAL AND METHODS
Material
The sampling procedure included stratification with regard to stands, tree status, and sample extraction within the stem. The spruce material came from 22 stands (12 natural regenerated and 10 planted) and the Scots pine material from 10 stands (all natural regenerated) in southern Norway. For each stand, twenty-four trees were randomly chosen in an area of approx. 500 m2. The tree

110
diameter was measured at breast height (DBH, ~1.3 m above ground). The trees were grouped into tree diameter classes based on the diameter. One tree per diameter class was randomly sampled, resulting in 2 suppressed, 2 co-dominant, and 2 dominant tree per stand. Eleven site variables, 26 exterior tree variables, and 28 variables describing wood properties were recorded. Site indexes (SIT) were calculated for each tree, based on tree height and age and the H40 functions for Scots pine and Norway spruce (Tveite and Braastad 1981). The site index of each stand (SI) was derived from the SIT of the dominant trees. Discs with a thickness of 30-50 mm were taken at 4 different heights of each tree (H1 = stump, H2 = 25%, H3 = 50%, H4 = 75%). Small clearwood samples with a dimension of 20 x 20 mm (radial x tangential) were taken along an axis from pith (R1) to bark (Rn) from the west face of the discs (H1-H4). The basic density of the clearwood samples was determined according to Skanorm 4 (Kučera 1992) in order to map the density variation in radial and vertical direction along the stems. In addition to the clearwood samples, a pith-to-bark bar was sawn from the west face of discs of 30 pine and 30 spruce trees. Samples were free of knots and obvious compression wood. The mean density and width of each annual ring was measured with the SilviScan-system (Evans 1997) at Innventia (formerly STFI-Packforsk) in Sweden and The Commonwealth Scientific and Industrial Research Organisation in Australia.
Models for density in spruce and pine stems
The variation in density was modeled, by linear mixed models, using the individual tree as a random effect. The random and fixed effects were assessed by using the Restricted Maximum Likelihood (REML) estimation of the software JMP (Version 7.0.0. SAS Institute Inc.) in compliance with Littell et al. (2006). The random elements were assumed to follow a normal distribution. The models were stepwise developed on the dataset of 13 spruce stands and 6 pine stands. Initially, the horizontal and vertical profile of density in the stem was described with the radial position (R) and vertical position (H) of the clearwood samples. The variable ln (H+1) was used instead of ln (H) to avoid a zero value when H=1. Random effects for the intercept and the R-elements were tested by log-likelihood ratio tests (χ2; p ≥ 0.05). After modeling the vertical and radial density variation in stems, fixed effects were gradually added according to their type and the effort, which is necessary

111
to measure them: Step I=site variables, Step II=Step I and exterior tree variables, and Step III=Steps I and II and interior tree variables. The variables were rejected at the 5% level. The Coefficient of Determination (R2) and the Root Mean Square Error (RMSE) were computed based on both random and fixed effects. This is equivalent to a situation in which each tree is individually fit. Subsequently, R2 and RMSE values also were calculated from residuals of the random coefficient mixed model outputs, where only the fixed effects were included. The models were validated based on independent datasets from 9 spruce stands and 4 pine stands. The intercept and the slope of the linear regression between predicted and measured values were constrained to 0 and 1, respectively, to include the model bias and to enable valid comparisons to be made between the model step and the validation. R2 and RMSE were calculated from the residuals from these regressions.
RESULTS
In pine, the common vertical trend in disc density increased with approx. 100 kg m-3 from the stump to the top (Fig. 1a); the level of this trend, however, varied strongly among trees. The vertical stem position solely explained 95% (random and fixed effects) in modeling and 69% (only fixed effects) in validation, respectively, of the density variation on disc level. The horizontal density trend was less clear than the vertical one and differed considerably between trees. Within trees, density profiles strongly depend on the height position in the tree. At stump and 25% tree height, density increased by approx. 30 kg m-3 within the first radial 75 mm from pith; afterwards, it decreased slightly towards the bark. In comparison, density showed very little radial variation in upper parts of the pine stems. The radial position became insignificant in models that included both the radial and the vertical stem position as independent variables. The most accurate model for density in pine (Table 1, model IIIa P) included as explanatory variables the ratio of tree height (TH) to diameter at breast height (DBH), diameter of stem disc with bark (DDB), bark volume on disc (BVB), and ring width (RW). A similar model including an estimation of RW with diameter of disc without bark (DD) and ring number (RN) gave lower R2 (Table 1, model IIIb P). Validation on independent material gave R2 of 0.45 (Table 2, model IIIa P) and 0.36 (Table 2, model IIIb P) for density of clearwood samples, respectively. For spruce, the vertical variation in density was low compared to what was found for pine. The average disc density was approx. 15 kg m-3 higher at 75% tree height than at the stump. The vertical profiles varied considerably between

112
the trees, and several trees showed no increase or even a negative trend in density towards the top of the stem. Silviscan measurements revealed that density rapidly decreased by approx. 100 kg m-3 within the first 5 annual rings. In the following, density slightly decreased by further 20 kg m-3. A radial trend was however scarcely seen in the comparison of densities of clearwood samples. Differences between the average densities of clearwood samples (R-positions) were not statistically significant at any tree height level (Tukey HSD test, p = 0.05). The most accurate model gave an R2 of 31% in the validation procedure. The model included sample position, site index, diameter at breast height, and bark volume as input variables (Table 2, model II S). The use of inner tree variables, such as ring width (RWD) or ring number (RN), did not result in more accurate predictions (Table 2, model III S).
a
0
25
50
75
100
Tree
heigh
t [%]
0 25 50 75 100 125 150Distance from pith [mm]
Basic density [kg/m³]
<= 360
<= 370
<= 380
<= 390
<= 400
<= 410
<= 420
<= 430
<= 440
<= 450
<= 460
<= 470
<= 480
> 480
b
0
25
50
75
100
Tre
e h
eig
ht [
%]
25 50 75 100 125 150Distance from pith [mm]
Contour Plot for Basic density [kg/m³]
Basic density [kg/m³]
<= 360
<= 370
<= 380
<= 390
<= 400
<= 410
<= 420
<= 430
<= 440
<= 450
<= 460
<= 470
<= 480
> 480
Fig. 1: Mean density variation in stems of Scots pine (a) and Norway spruce (b) derived from basic density measurements on clearwood samples. Each stem position is represented with n ≥ 10.

113
Table 1: Models for density with variance components and summary statistics for the comparison of modelled and measured values of density. Only models with significant variance-component estimates and significant parameter estimates of fixed effects are presented.
Variance components and summary statistics
Variance components Step (model no.)
Source I P II P IIIa P IIIb P I S II S III S
Tree 825.89 746.48 666.83 745.12 453.05 344.62 444.72
H * tree 164.84 145.46 101.87
R * tree 144.98 146.69 148.05
ln (H+1) * tree 38.96
Residual 904.25 1046.13 914.83 1033.61 1243.58 469.23 471.07
Summary statistics. including fixed and random effects
R2adj 0.79 0.75 0.78 0.75 0.71 0.72 0.72
RMSE [°] 30.07 32.34 30.25 32.15 21.90 21.66 21.70
Summary statistics. including fixed effects
R2adj 0.38 0.53 0.57 0.52 0.09 0.18 0.15
RMSE [°] 46.93 42.28 40.37 42.77 34.48 32.76 33.27
Models without random effects
I P 548.22 – 24.92 * ln (H+1) + 5.23* H40
II P 302.27 - 5.83 * H40 + 113.81 * TH/DBH + 0.26 * DDB + 4.1 BVD
III Pa 273 + 89.29 * TH/DBH + 0.26 * DDB + 3.87 BVD – 18.85 * RW
IV Pb 350 + 0.22 * DDB + 4.54 BVD – 28.75 * (0.5 * DD/RN)
I S 392.27 + 7.24 * H + 5.09 * R - 2.83 * H40
II S 390.72 + 4.07 * H +5.95 * R – 2.49 * H40 – 0.12 * DBH + 3.42 * BVD
III S 409.07 + 9.31 * H + 5.93 * R – 0.11 * DBH – 22.30 * RWD
Table 2: Validation statistics on models for pine (P) and spruce (S).
Model Fixed-effects R2 RMSE [°]
I P ln (H +1), H40 0.36 47.70
II P H40, TH/DBH, DDB, BVD 0.40 46.83
IIIa P TH/DBH, DDB, BVD, RW 0.45 45.59
IIIb P TH/DBH, DDB, BVD, DD, RN 0.36 50.80 I S H, R, H40 0.23 34.84
II S H, R, H40, DBH, BVD 0.31 32.93
III S H, R, H40, DBH, RWD 0.23 34.20

114
DISCUSSION
The results reveal that the density of a wood piece from a pine log can be quite accurately predicted just by using the information on the vertical origin of the piece (Table 1 and 2, model I P). The addition of information about site index of the stand, tree height, diameter of breast height, and bark volume at specific height increased the R2 values with 4 % (Table 2, model II P). Such variables are available though the forest inventories and can also be derived from the information a harvester measures during processing the tree. When using information about ring widths, R2 increased to 45% (Table 2, model IIIa P). It has been frequently reported that density is closely related to ring width and cambial age (Johansson 1993; Pape 1999; Molteberg and Høibø 2007; Jyske et al. 2008). Such variables are difficult to obtain in industrial processes. The challenge therefore is to create models with easily recordable variables (Wilhelmsson et al. 2002). This implies that variables, which are difficult to measure, must be explained by subjacent models, as it is seen at the models developed in the Indisputable Key project (Sixth Framework Programme, project no. 34732). The application of an expression for ring width with stem diameter and ring number (Wilhelmsson et al. 2002) reduced R2 by 9% (IIIb P). Ring number must however be estimated by another sub-model. An alternative to sub-models is to use automated measurement for inner log properties, such as the BoardMaster-EndSpy of the company FinScan. Although the measurement algorithms of such scanning systems are still debated, the current development suggests that these systems will become state-of-the-art in industrial processes (Brüchert et al. 2008). The vertical and horizontal trends for density in spruce comply with findings reported in most earlier studies (Nylinder and Hägglund 1954; Foslie and Moen 1968; Frimpong-Mensah 1987; Høibø 1991; Kučera 1994; Lindström 1996; Vestøl et al. 2001; Raiskila et al. 2006). The models for density in spruce trees gave poor estimations for density (models I-III S). This can probably be ascribed to the low in-tree and between-tree variation of density in the dataset, which is based on forest stands in southern Norway. Wilhelmson (2002), for example, developed a model explaining approx. 50% of the density variation in spruce, which was based on 252 trees coming from stands throughout Sweden. Steiner and Øvrum (2010) carried out a case-study in a sawmill on the effect of pre-sorting of spruce boards with a dimension of 50 x 200 mm on density. The average density of inner boards, i.e., boards closer to the pith, was 18 kg m3 greater than that of outer boards, which results in a theoretical reduction of drying time by approx. 10%. However, the low variation in vertical and especially in radial direction of spruce trees suggests that pre-sorting of spruce

115
boards is of limited value. Further research is going on to investigate the applicability of pre-sorting and prediction models in industrial processes.
SUMMARY AND CONCLUSIONS
- the vertical position accounts for most of the density variation in stems of pine
- the density variation in vertical direction of spruce stems is much lower than in pine stems
- the radial position is of little importance for density prediction for both pine and spruce
- the most accurate prediction model for density in pine stems explained 45%
- the most accurate prediction model for density in spruce stems explained 31%
- all necessary input information for the models are obtainable from forest inventories, harvester measurements, and scanner technologies for industrial application
REFERENCES
Bergstedt, A. & Olesen, P.O. 2000. Models for Predicting Dry Matter Content of Norway spruce. Scandinavian Journal of Forest Research 15(6):633 - 644
Brüchert, F., Baumgartner, R. & Sauter, U.H. 2008. Ring width detection for industrial purposes - use of CT and discrete scanning technology on fresh roundwood. Conference COST E53, Delft, The Netherlands
Brännström, M. 2005. Establishing a model for the dry density of heartwood of Norway spruce by parameters industrially measurable on green logs. Master's thesis. Luleå University of Technology
Duchesne, I., Wilhelmsson, L. & Spangberg, K. 1997. Effects of in-forest sorting of Norway spruce (Picea abies) and Scots pine (Pinus sylvestris) on wood and fibre properties. Can J For Res-Rev Can Rech For 27(5):790-795

116
Evans, R. 1997. Rapid scanning of microfibril angle in increment cores bv x-ray diffractometry. In: Butterfield BG (ed). Microfibril in wood: Proc. of the IAWA/IUFRO Inter. Workshop on the significance of microfibril angle to wood quality University of Canterbury Press, Westport, New Zealand, p. 116-139
Foslie, M. & Moen, K. 1968. Norsk granvirkes styrkeegenskaper. 1. Bøyestyrke, elastisitetsmodul og strekkstyrke målt på 3"x8" og 2"x4" [Strength properties of Norwegian Spruce. 1. Bending strength, modulus of elasticity and tensile strength tested on the structural sizes 3"x8" og 2"x4"]. Oslo: NTI. Report nr Meddelelse nr. 33 [In Norwegian with English summary]. 40 p
Frimpong-Mensah, K. 1987. Fibre length and basic density variation in the wood of Norway spruce (Piceas abies (L.) Karst.) from northern Norway. Ås: Norsk institutt for skogforskning. 25 p
Høibø, O.A. 1991. The quality of wood of Norway spruce (Picea abies (L.) Karst) planted with different spacing. Doctoral. Agricultural University of Norway. Ås, Norway [In Norwegian with English summary]
Ikonen, V.-P., Peltola, H., Wilhelmsson, L., Kilpeläinen, A., Väisänen, H., Nuutinen, T. & Kellomäki, S. 2008. Modelling the distribution of wood properties along the stems of Scots pine (Pinus sylvestris L.) and Norway spruce (Picea abies (L.) Karst.) as affected by silvicultural management Forest Ecology and Management 256(6):1356-1371
Johansson, K. 1993. Influence of initial spacing and tree class on the basic density of Norway spruce. Scandinavian Journal of Forest Research 8(1):18-27
Jyske, T., Mäkinen, H. & Saranpää, P. 2008. Wood density within Norway spruce stems. Silva Fennica 42(3):435-455
Kellomäki, S., Ikonen, V.-P., Peltola, H. & Kolström, T. 1999. Modelling the structural growth of Scots pine with implications for wood quality. Ecological modelling 122:117-134
Kučera, B. 1992. SKANORM 4: Determination of density for physical and mechanical tests. Norwegian Forest Research Institute, Department of Forestry, Agricultural University of Norway
- 1994. A hypothesis relating to annual height increment to juvenile wood formation in Norway spruce. Wood and Fiber Science 26(1):152-167
Lindström, H. 1996. Basic density in Norway spruce, Part III. Development from pith outwards. Wood and Fiber Science 28(4):391-405
- 2000. Intra-tree models of basic density in Norway spruce as an input to simulation software. Silva Fennica 34(4):411-421
Littell, R. 2006. SAS for mixed models. SAS Publishing, p. 814

117
Molteberg, D. & Høibø, A. 2007. Modelling of wood density and fibre dimensions in mature Norway spruce. Canadian Journal of Forest Research 37(8):1373-1389
Mäkinen, H., Jaakkola, T., Piispanen, R. & Saranpaa, P. 2007. Predicting wood and tracheid properties of Norway spruce. Forest Ecology and Management 241(1-3):175-188
Nylinder, P. & Hägglund, E. 1954. The influence of stand and tree properties on yield and quality of sulphite pulp of Swedish spruce (Picea excelsa). Report Forest Research Institute of Sweden 44(11)
Pape, R. 1999. Influence of thinning and tree diameter class on the development of basic density and annual ring width in Picea abies. Scandinavian Journal of Forest Research 14(1):27-37
Raiskila, S., Saranpaa, P., Fagerstedt, K., Laakso, T., Loija, M., Mahlberg, R., Paajanen, L. & Ritschkoff, A.C. 2006. Growth rate and wood properties of Norway spruce cutting clones on different sites. Silva Fennica 40(2):247-256
Repola, J. 2006. Models for Vertical Wood Density of Scots Pine, Norway Spruce and Birch Stems, and Their Application to Determine Average Wood Density. Silva Fennica 40(4):673-685
Steffenrem, A., Kvaalen, H., Høibø, O., Edvardsen, Ø.M. & Skrøppa, T. 2009. Genetic variation of wood quality traits and relationships with growth in Picea abies. Scandinavian Journal of Forest Research 24(1)
Steiner, Y. & Øvrum, A. 2010. Pre-sorting for density in drying batches of Norway spruce. The final conference of COST Action E53 - The future of quality control for wood & wood products,
Tveite, B. & Braastad, H. 1981. Bonitering for gran, furu og bjørk. Norsk Skogbruk 27(4):17-22
Vestøl, G.I., Høibø, O., Slotnæs, T. & Værnes, K. 2001. Egenskaper til trelast med store dimensjoner fra grov gran på Vestlandet. Ås: Norsk institutt for skogforskning. Report nr 1/2001. 27 s. p
Wilhelmsson, L., Arlinger, J., Spångberg, K., Lundqvist, S.O., Grahn, T., Hedenberg, O. & Olsson, L. 2002. Models for predicting wood properties in stems of Picea abies and Pinus sylvestris in Sweden. Scandinavian Journal of Forest Research 17(4):330-350

118
THE FUTURE OF MOISTURE DETERMINATION
Fernández Cano, V. 1 & Hultnäs, M.2
ABSTRACT
The gravimetric method that is used today to determine the moisture content in wood is very tedious. The results are received after 24 hours, and it can be quite hard to use the achieved information in industrial processes. We have tested a new method based on X-ray to determine the moisture content in wood. It is a fast method ≈ 1 min/measurement, and in difference to many other techniques. Results achieved with this method on wood chips (Scots pine, Norway spruce and birch) have shown good agreement with the gravimetric method that has been used as a reference method. Standard deviation has been low, around 0.4-0.9 percentage points for repeatable measurements on the same sample. Key words: Moisture content, Norway spruce, determination of moisture content, dry matter content.
INTRODUCTION To know the moisture content (mc) in wood is needed in many different situations. The knowledge of mc helps for example to control chip impregnation and refiner control in the pulp industry. Besides, mc determination can also be of interest for energy plants and board-mills; because by monitoring the mc in the flow of wood chips to the process, some parameters can be adjusted to optimize the process. Furthermore, in parts of the world (for example, Sweden and Germany) the compensation between sellers and buyers of wood chips are based on the dry weight of the fibers. 1 Master student, Department of Forest Products, Swedish University of Agricultural Sciences, Box 7008, 75007 Uppsala, Sweden, Tel: +46 18 67 24 88, Fax: +46 18 67 34 90, E-mail: [email protected] 2 PhD student, Department of Forest Products, Swedish University of Agricultural Sciences, Box 7008, 75007 Uppsala, Sweden, Tel: +46 18 67 24 88, Fax: +46 18 67 34 90, E-mail: [email protected]

119
The gravimetric method used nowadays is considered to be accurate, but it requires time (24 hours per sample) and is rather laborious. Over the years many studies have been conducted to try to find other techniques that could replace the gravimetric method (1,2,3,4,5,6,7,8,9,10,11,). The results of the struggle have been poor. However, during recent years, dual energy X-ray absorptiometry (DXA) has shown good results when it comes to determine the mc in wood chips. A few studies have been made with this technique and have shown very good results (12,13). Other benefits with the technique are that it is fast, about one minute per measurement, and non-destructive. This paper gives a summary of results achieved so far with the DXA technique for studies done on pine and spruce. It also presents new findings, with measurements done on birch. This article is the result of the collaboration between the department of Forest Products at the Swedish University of Agricultural Sciences, who has performed the studies and the evaluation, and Mantex AB, who has developed the technique.
MATERIAL AND METHODS The wood chips used in these studies came from sawmills and pulp-mills in Sweden and are typically used for pulp production. The species used have been Norway spruce (Picea abies (L.) Karst.), Scots pine (Pinus sylvestris L.) and birch (Betula spp.). The device used in these studies was developed by Mantex AB and uses the DXA technique to determine the mc. The device uses X-ray radiation of two different wavelengths; the sample is placed in the device and scanned twice, one scan for each energy level. The sample is then attenuating some of the energies that are sent through. The quotient between the energies provides information about the composition of the material. Since every substance has a specific attenuation of X-ray energies, the device could be calibrated against samples of wood chips with known mc; the attenuation of each measurement is compared to earlier measurements of samples with known mc, and the mc in the measured sample could be determined (12,13). The chips were measured both raw, and dried to different mc levels in order to achieve a broad range of mc. The different materials have been measured, first

120
by the Mantex method (non-destructive), and afterwards the reference mc was determined by the gravimetric method. This procedure was performed according to the Swedish Standard SS 187170 (14). Table 1 shows the number of samples used, number of measurements per sample and the mc range achieved for each of the studies. Table 1. Overview of the studies performed, mc range is achieved with the gravimetric method (12, 13)
Parameter Scots pine Norway spruce Birch No. of Samples 70 35 10
No. Measurements per Sample 10 10 4 MC Range (%) 8 - 57 18 - 61 12 – 39
In order to calculate the average standard deviation for repeatable measurements on the same sample, Eq. 1 was used (15);
% (1) Where: m is the number of samples n is the number of measurements of sample j xi is the i:th measured moisture value of sample j
is the mean of all the measurements of sample j. The denominator, Eq. 2, is the total number of degrees of freedom (df) for the estimate of standard deviation formed by combining all the data. It is the sum of the degrees of freedom dfj of the measurements of the samples (15):
(2)

121
RESULTS Summary part
In order to evaluate the correlation between the Mantex method and the gravimetric method, a regression analysis of each material was performed. These are shown in figures 1-3 (12,13).
Norway spruce
Figure 1. Correlation between the Mantex method and the gravimetric method for Norway spruce. (12).
Scots pine
y = 0,8154x + 10,554R2 = 0,9769
0
10
20
30
40
50
60
0 10 20 30 40 50 60
%MC gravimetric method
%M
C M
ante
x m
etho
d
Predicted bands (95%)
Confidence bands (95%)
Pine measurements
Regression line
Figure 2. Correlation between the Mantex method and the gravimetric method for Scots pine. (13).

122
New findings
Birch
Figure 3. Correlation between the Mantex method and the gravimetric method for birch. In table 2, the parameters of the regression analysis are shown for the different tree species. It also displays the standard deviation (SD) for repeatable measurements on the same sample and the standard error of estimate (SEE). The R2 shows how well the data fits to the model. Table 2. Summary of the results achieved for the different materials
Parameter Scots pine Norway spruce Birch Slope 0.82 1.14 1.04
Intercept 10.55 -0.05 -0.83 R2 0.98 0.98 0.99
SEE (%) 2.01 1.83 1.17 SD (%) 0.45 0.53 0.88
DISCUSSION
The DXA technique has shown excellent consensus with the gravimetric method for spruce chips, with [a] low number for the SEE (1.83%). Also the SD showed satisfactory low numbers (0.53%), which indicates that the same

123
result, would be achieved for several measurements on the same sample. These results have earlier been discussed by Hultnäs et al. (12). The pine study that is presented shows an even lower SD (0.45%) but a little bit higher SEE (2.01%). The aim of that study was to see if the calibration model that was used for spruce, could also be used for pine. The difference on slope and intercept indicates that a separate calibration model for pine is needed. First tests have been done with a calibration model that is developed for pine, and the first preliminary results indicate that slope and intercept become much better and maintaining the SEE at the same level as it is in the spruce study. The lower SD achieved in this study could be related to the fact that wood chips from sawmills were used in this study, while in the previous mentioned study chips from round wood were used. Sawmill chips consist mainly of sapwood this due to the processing in the saw mills, meanwhile chips of round wood consist of both sapwood and heartwood and are therefore more heterogeneous, in it chemical composition. Since the absorption of the X-ray energies takes place in the atoms, the result of measurements will be dependent on how big chemical variation can be found in the measured sample, a more heterogeneous material will lead to a higher SD (13). The study of birch is not as robust as the ones performed for spruce and pine, due to the limited amount of samples that has been measured for birch (10 samples, while it has been 35 samples measured for spruce and 70 samples for pine) and the smaller mc range achieved in the study. Still, the DXA technique has shown excellent consensus with the gravimetric method for birch chips. The results are at very low levels with a SEE of 1.17% and a SD that is 0.88%. The SD is a little bit higher than the ones obtained in the studies of pine and spruce but, is still well below 1%, which must be seen as fully acceptable results. The most likely explanation for this higher SD is the low amount of measurements per sample performed in comparison to the spruce and pine studies.

124
CONCLUSIONS The studies show that for the three species it is possible to accurately and precisely determine the mc to a certain extent. It seems that the difference in chemical composition between the tree species creates a need to develop different calibration models for the Mantex method.
REFERENCES 1. Nyström, Jenny. Dahlquist, Erik. Methods for determination of moisture
content in woodchips for power plants-a review. Fuel 83 2004 773-779.
2. Thygesen, Lisbeth G. Indirect methods for determination of dry matter content and basic density of pulp wood. The Royal Veterinary and agricultural University, Department of Economics and Natural Resources Unit of Forestry. Copenhagen. 1994.
3. Persson, Rickard. Moisture content determination using gamma-ray attenuation. Tekniska Högskolan i Luleå. Master Thesis 1994:156 E.
4. Eriksson, Lars Njurell, Ehleskog Richard. Fukthaltsmätning av bioränsle. Anläggningsteknik 773. Värmeforsk. 2002.
5. Nordell, Anders. Vikterlöf, Karl Johan. Mätning av fukt i biobränslen med dubbelenergiröntgen. Värmeforsk A6-614. 2000.
6. Dissing, Erik. Nylinder Mats. On-line determination of the fractional water content of chips by the use of dichromatic photon absoptiometry. Final report, Part 1. Procejt No 1160541, Studsvik Report. Studsvik/Nr-81/25 National Swedish Board for Energy Source Development. 1981.
7. Thygesen, Lisbeth. Near Infrared Spectroscopy and Pulse Nuclear Magnetic Resonance for Assessment of Dry Matter Content and Basic Density of Pulp Wood. The Royal Veterinary and agricultural University, Department of Economics and Natural Resources Unit of Forestry. Copenhagen.1996.
8. Dahlquist, Erik, Axrup, Lars, Nyström, Jenny, Thorin, Eva, Paz de la, Ana. Automatisk fukthaltsmätning på biobränslen med NIR samt radiofrekvent spektroskopi. Fukthaltsprogrammet 936. Värmeforsk. 2005.

125
9. Berg, Magnus, Karlsson, Mikael, Tryzell, Robert, Wiklund, Sven Erik. Automatisk fukthaltsbestämmning av biobränslen med NIR-metoden. Fukthaltsprogrammet 935. Värmeforsk. 2005.
10. Blomkqvist, Hans. Bruch Hans, Nylinder, Mats. Radarteknik för mätning av torrhalt i sågspån. Rapport nr 176. Sveriges Lantbruksuniversitet, Institutionen för virkeslära. 1986.
11. Lundgren, Nils. Modelling Microwave Measurements in Wood. Luleå University of Technology, Skellefteå Campus, Division of Wood Science and Technology. Licentiate Thesis. 2005.
12. Hultnäs, Mikael. Kullenberg, Ragnar. Persson, Erik. Nylinder, Mats. Determination of moisture content in spruce wood chips by dual energy X-ray absorptiometry. International Mechanical Pulping Conference, Proceedings 2009.
13. Fernández Cano, Víctor. 2009. Determination of moisture content in pine wood chips with dual energy X-ray absorptiometry. Bachelor thesis. The Swedish University of the Agricultural Sciences. Faculty of Forest Sciences. Department of Forest Products in Uppsala. ISSN: 1654-1367 : 43
14. Swedish Standard. 1997. Biobränslen och torv—Bestämning av total
fukthalt (Biofuels and peat—Determination of total moisture content) SS 187170. SIS.
15. Glüer CC, Blake G, Lu Y, Blunt BA, Jergas M, Genant HK. 1995. Accurate assessment of precision errors: how to measure the reproducibility of bone densitometry techniques. Osteoporosis Int. 1995; 5(4): 262-70.

126
VARIATION IN STRENGTH PROPERTIES OF SCOTS PINE
WOOD AFTER TWO DIFFERENT HEAT TREATMENTS
Rikala, J.1, Havimo, M.2 & Sipi, M.3
ABSTRACT
Investigations to improve the durability and dimensional stability of wood using heat treatment have been carried out since the early 20th century. Despite quite a long history of research work, industrial scale manufacturing of heat treated wood is still in its beginnings in Finland. To better control the properties of heat treated wood, two classes – Thermo-S and Thermo-D – were introduced in 2003. Thermo-S (190 ºC, classified as moderately durable according to EN 113) is recommended for indoor objects, e.g., fixtures and furniture, whereas Thermo-D (212 ºC, classified as durable according to EN 113) is suitable for outdoor purposes, e.g., claddings, environmental structures and garden furniture. The aim of the study was to find out how uniform industrially produced heat treated wood is considering wood strength. Scots pine planks after Thermo-S and Thermo-D treatments were provided by a significant Finnish manufacturer. The planks were first machined to sample pieces for two loading tests: static bending (ISO 3133) and compression (ISO 3132). Before testing the strength with Lloyd Instruments EZ50 device, wood density and average ring width were determined. About 100 samples per treatment were measured. Untreated pine wood was used as a reference material. The data was analysed with statistical methods. Bending strength was about 15% higher in Thermo-S than in Thermo-D treatment, whereas the average compression strength was slightly higher for
1 University Lecturer, Department of Forest Sciences, University of Helsinki, P.O. Box 27, FI-00014 University of Helsinki, Tel: +358 9 19158167, Fax: +358 9 19158159, E-mail: [email protected] 2 Researcher, Department of Forest Sciences, University of Helsinki, P.O. Box 27, FI-00014 University of Helsinki, Tel: +358 9 19158183, Fax: +358 9 19158159, E-mail: [email protected] 3 Professor, Department of Forest Sciences, University of Helsinki, P.O. Box 27, FI-00014 University of Helsinki, Tel: +358 9 19158179, Fax: +358 9 19158159, E-mail: [email protected]

127
Thermo-D samples. Strength properties increased linearly with increasing wood density. Variation in the strength properties was large due to large variation in growth rate and wood density. Key words: Scots pine, heat treatment, strength properties
INTRODUCTION
Investigations to improve the durability and dimensional stability of wood using heat treatment have been carried out since the early 20th century. Despite quite a long history of research work, industrial scale manufacturing of heat treated wood is still in its beginnings in Finland. To better control the properties of heat treated wood, two classes – Thermo-S and Thermo-D – were introduced in 2003. Thermo-S (190 ºC, classified as moderately durable according to EN 113) is recommended for indoor objects, e.g., fixtures and furniture, whereas Thermo-D (212 ºC, classified as durable according to EN 113) is suitable for outdoor purposes, e.g., claddings, environmental structures and garden furniture. Heat treated wood is not recommended for uses with permanent ground contact (ThermoWood® Handbook 2003). Heat treatment increases wood durability, especially against rot. The disadvantage is the deteriorated mechanical properties, although mild treatments may even improve certain mechanical properties (Esteves and Pereira 2009). For example, experiments with Norway spruce show that the modulus of rupture (MOR) can be half smaller in the treated samples compared to untreated (Borrega and Kärenlampi 2008). The deterioration of properties heavily depends on mass loss of wood in the treatment. Mechanical properties of wood depend on density and properties of cell wall (Gibson and Ashby 1997), whereas the properties of cell wall depend, among other things, on the moisture content. Under fibre saturation point, the strength and stiffness of wood usually increase as the moisture content decreases. On the other hand, the heat treatment changes the ability of cell wall to absorb moisture: in a given air moisture content, heat treated wood absorbs markedly less water than untreated wood (Esteves and Pereira 2009). This also affects the mechanical properties of wood. It has been shown that the MOR of heat treated wood can be larger than MOR of untreated wood, when compared in the same ambient moisture content (Borrega and Kärenlampi 2008). Wood density varies considerably within tree species, and therefore also the mechanical properties have a large variation. Variation in properties is problematic from the end-use point of view, and preferably the raw material should be as homogenous as possible. Two interesting questions are raised in

128
this study: how large is the variation in strength properties in commercial heat treated wood, and does the heat treatment increase variation in mechanical properties? The first question interests end-users, when they choose material to their applications, whereas the second question interests manufacturers, who also would like to have means to reduce variation in their products.
MATERIAL AND METHODS
The study material was provided by a big Finnish manufacturer pruducing heat treated wood. The planks (32 x 100 mm in size) represented the classes Thermo-S and Thermo-D, and were originally produced for terrace deckings. The planks were first sawn and planed into test pieces for static bending 20 x 20 x 300 mm in size (ISO 3133). The distance between the centres of the supports was 240 mm. After performing the bending tests, pieces of 20 x 20 x 30 mm were sawn from sound parts of the specimens for compression tests (ISO 3132). Set-ups of the tests are illustrated in Fig. 1. Furthermore, the following characteristics were determined. Average ring width (growth rate), mm – Distance between the furthermost visible (whole) rings devided by the number of rings. Average ring width was measured from one cross-cutting in every piece. Wood density, kg/m3 – Mass of sample devided by volume of sample. Wood density was determined from every piece. Moisture content (MC), % – Mass of water in sample devided by oven-dry mass of sample. MC was determined from every 10th piece. In order to have some reference, Thermo-S and Thermo-D treated wood was compared to untreated pine wood. Characteristics of these three groups are presented in Table 1.
Fig. 1. Set-up for static bending (left) and compression (right) tests. (Photos: Juha Rikala)

129
Table 1. Characteristics of the study material. Mean values of the properties with standard deviation in parentheses are given.
Study material No. of samples Ring width, mm Wood density, kg/m3 MC, %
Thermo-S 96 3.2 (1.7) 407.0 (24.7) 4.7 (0.2)
Thermo-D 113 3.0 (1.1) 419.6 (38.8) 4.4 (0.4)
Control 100 1.3 (0.5) 514.3 (24.2) 8.4 (0.2) The differences in strength between Thermo-S and Thermo-D treatments were analysed with statistical methods.
RESULTS AND DISCUSSION
Average compression and bending strengths were lower in the heat treated wood than in the control samples as could be expected (Table 2). The differences in bending strength between Thermo-S and Thermo-D were moderate: Thermo-D samples were 15% weaker than those of Thermo-S. These results are in line with literature, which indicates that high temperature treatment results in lower strength (e.g., ThermoWood® Handbook 2003). The compression test results differed drastically from bending test results. High temperature treatment resulted in stronger wood than low temperature treatment (see Table 2). The difference is small, but two-tailed paired t-test reveals that it is statistically significant (p = 0.047). Increase in compression strength after heat treatment has been observed also in previous studies with Scots pine (Boonstra et al. 2007). It is assumed that the cross-linking of lignin increases in heat treatment, which in turn causes stiffening of the molecular matrix and increase in compression strength. Table 2. Results from the bending and compression tests. Mean values of the properties with standard deviation in the parentheses are given.
Treatment Bending strength, MPa Compression strength, MPa Wood density, kg/m3
Thermo-S 77.4 (13.8) 48.2 (6.0) 407.0 (24.7)
Thermo-D 65.9 (15.3) 50.0 (6.8) 419.6 (38.8)
Control 109.4 (9.7) 57.8 (4.8) 514.3 (24.2)

130
Figure 2 shows the breaking strength in bending as a function of density, fitted with linear regression equations. The strength linearly depends on density in both treatments and in the control samples. The treatments have not changed the dependency into non-linear form. The situation is similar for compression strength (Fig. 3). The variation in strength properties was larger in heat treated than in untreated samples, and larger in samples treated in higher temperature than in those of lower temperature. However, the density variations cause problems in the comparisons, since the standard deviation of density was 1.6 times higher for Thermo-D treated samples than for Thermo-S treated samples (see Table 2). The variation in wood density may explain most of the observed variation in the strength properties.
20
25
30
35
40
45
50
55
60
65
70
300 350 400 450 500 550 600
Brea
king
stre
ngth
, MPa
Wood density, kg/m3
S-typeD-typeControl
Fig. 2. Breaking strength of samples in bending. Fitted trendlines are presented.

131
0
20
40
60
80
100
120
140
160
300 350 400 450 500 550 600
Bre
akin
g st
reng
th, M
Pa
Wood density, kg/m3
S-typeD-typeControl
Fig. 3. Breaking strength of samples in compression. Fitted trendlines are presented. Higher average wood density of Thermo-D was against expectations and earlier findings, particularly when the raw material for the heat treated wood can be assumed to be similar: the average ring width (growth rate) of Thermo-D was close to that of Thermo-S samples. On the contrary, the reference material used in this study (control) was more or less first-class wood with more homogenous properties. The next step will be testing of better comparable wood material, i.e., wood to be heat treated at the mill. Altogether, the heat treated wood material showed a large variation in properties. For example, the average ring width in the samples varied from 1 to 7 mm.
CONCLUSIONS
The results showed that variation in the strength properties of Thermo-D was somewhat higher than in Thermo-S. However, higher variation of wood density in Thermo-D hindered reliable comparisons, and it could not be concluded that higher temperature would directly increase variation in the strength properties.

132
This study indicates that wood material used for heat treatment is quite heterogenous in properties. Even though it fulfils certain quality requirements regarding, for example, knottiness, it still contains a large variation in growth rate and wood density. This study raises further questions to be considered: Does the heterogeneity of raw material cause problems in end-use applications? If yes, should we then apply more strict quality requirements (e.g., including growth rate) for certain uses?
REFERENCES
Boonstra, M.J., Acker, J., Tjeerdsma, P.F. & Kegel, E. 2007. Strength
properties of thermally modified softwoods and its relation to polymeric structural wood constituents. Annals of Forest Science 64(7): 679–690.
Borrega, M. & Kärenlampi, P.P. 2008. Mechanical behavior of heat-treated spruce (Picea abies) wood at constant moisture content and ambient humidity. Holz Als Roh-Und Werkstoff 66(1): 63–69.
EN 113. 1997. Wood preservatives. Test method for determining the protective effectiveness against wood destroying basidiomycetes. Determination of the toxic values. 28 p.
Esteves, B.M. & Pereira, H.M. 2009. Wood modification by heat treatment: A Review. Bioresources 4(1): 370–404.
Gibson, L.J. & Ashby, M.F. 1999. Cellular solids – Structure and properties. Cambridge, Cambridge University Press. Second edition. 532 p.
ISO 3132. 1975. Wood – Testing in compression perpendicular to grain. 2 p. ISO 3133. 1975. Wood – Determination of ultimate strength in static bending.
2 p. ThermoWood® Handbook. 2003. International Thermowood Association.
Available at: http://www.thermowood.fi/data.php/200312/795460200312311156_tw_handbook.pdf. [Cited 17.8.2010]

133
THE SYNERGISTIC EFFECTS BETWEEN CHITOSAN AND
DIFFERENT WOOD PROTECTION AGENTS
Witt, B.1 & Treu, A.2
ABSTRACT Legislation restricted the continued use of chromate copper arsenate (CCA) preservatives and creosote. Hence, wood protection agents using different fixation systems were brought forward or were developed as well as new environmental friendly solutions were investigated. Earlier investigations attributed an antimicrobial effect to chitosan. Chitosan is a derivative of the natural amino polysaccharide chitin and it is produced from the exoskeleton of crustacean. For a reliable wood protection a concentration of 5% chitosan is needed, which raises the cost of the end product. Previous studies display synergistic effects between chitosan and different wood protection agents. The current work investigates the amount of chitosan and wood protection agent needed in order to gain synergistic effects. Furthermore, the influence of the quality of chitosan on the synergistic effect is evaluated. Wooden samples treated with the various chitosan-wood-preservative-combinations were leached according to EN 84. After leaching, the samples were exposed to Coniophora puteana in a modified EN 113 test for eight weeks. An anti-fungal effect could be seen for the leached chitosan products. However, none of the chitosan treated wood samples reached a mass loss below 3%. Mixing chitosan with the wood protection agent boron, copper or the wood presevatie Scanimp leads to different results between the combinations. Low amounts of chitosan and Scanimp showed an improved protection compared to Scanimp alone. Synergistic effects between boron-chitosan- and copper-chitosan combinations could not be detected. Keywords: chitosan, boron, copper, Scanimp, leaching test, fungal decay test 1 Master student, Department of Wood Science and Technology, University of Hamburg, Tel: +47 482 37 293, E-mail: [email protected] 2 Scientist, Department of Wood Technology, Norwegian Forest and Landscape Institute, Post box 115, 1431 Ås, Tel: +47 64 94 90 29, E-mail: [email protected]

134
INTRODUCTION
Wood is one of the major construction materials for buildings and furniture. One of its biggest advantages is its high strength combined with low density and certain elasticity. As a biodegradable material it can be degraded by bacteria, fungi, insects and marine borers in addition to the degradation by weathering and UV light. The major decay of wood in buildings is caused by fungi due to high wood moisture content, the basis of fungi infestation. There are many possibilities to protect non durable wood species or those of insufficient durability. They reach from constructive wood protection, chemical treatments to wood modification. In many cases constructive wood protection is neither sufficient, nor feasible. Chemical wood modification (e.g. acetylation and furfurylation) and heat treatment of wood have not replaced wood preservative treatments. At present they are only used for special applications due to their high costs and partly missing documentation of long term durability. Therefore chemical wood protection is still necessary. During the last twenty five years regulations have been introduced regarding the use of chromium, arsenate, pentachlorophenol and creosote for wood protection in several countries. The drawback of the new copper organic preservatives is a ten times higher leaching rate than chromated copper arsenate (CCA). Copper can not be degraded in nature like organic compounds and is toxic to water living organisms (about 0.1mg/l). Therefore, the disposal of wood with copper-based preservative will still be difficult and expensive (Eikenes 2005). Hence, the development of wood protection agents focuses on more environmental friendly applications. A promising environmental friendly fungicide agent could be chitosan. Chitosan is a fully or partly N-acetylated derivate of chitin, a 14 linked heterogeneous polymer consisting of glucosamine (2-amino-2-deoxy-D-β-Glucan) and N-acetyl glucosamine units (2-acetamido-2-deoxy-D-β-Glucan) (Stössel and Leuba 1984; Roberts 1992; Kumar 2000). When it comes to fixation , chitosan is leaching out to that extent that sufficient protection against fungal decay is not guaranteed (Alfredsen et al., 2004; Raiser et al., 2008). To keep a reliable performance and the enhancement of wood properties chitosan has been combined with wood preservation agents like boron, copper and the commercial wood preservative “Scanimp”. Several synergistic effects occurred. Boron combined with chitosan increased the fixation of chitosan, whereas chitosan and Copper give a good protection against the white-rot fungus Trametes versicolor. Low concentrations of Scanimp and chitosan provide sufficient protection against wood destroying fungi (Raiser et al., 2008).

135
MATERIAL AND METHODS Chitosan solutions Four commercial chitosan products varying in molar mass, degree of deacetylation and purity, were dissolved in deionised water to a concentration of 5% (w/v) (table 1). With acetic acid to a pH range between 5 to 5.5. To reduce high viscosity after dissolving a 4% (w/v) aqueous solution of potassium nitrite solution was added. The ph value of each solution was determined with Mettler Toledo FG2/EL2 ph Meter using two-point calibration. Combined solutions The chitosan solutions were combined with the different protection agent in aqueous solution with two various concentrations apart in a decadic step as it could be seen in table 2.
Table 1: Characterisation and composition of the different chitosan products and used wood preservation/-agents
Chitosan products Composition/characterization
wood preservation and wood preservation agent
Composition/characterization
Kitoflokk
Chitosan produced from crabs, free flowing powder - average degree of deacetylation: 0.80 (L), 0.91(M) - ash content [%]: < 3 (L), 3.04 (M) - molar mass [Dalton]: 16 K - company: Norwegian Chitosan Ltd.
Scanimp
liquid, based on: -20-50%dipropylenglycoltyl-eter -2,5-10% propiconazol, -2,5-10% 1-metoksy-2-propanol -2,5-10% 3-iodo-2-propynyl- butylcarbanate -pH-value: 3,96
Kitonor
Chitosan made of crabs, free flowing powder - average degree of deacetylation: 0.90 (L),1.00 (M) - ash content [%]: < 2(L), 0.81(M) - molar mass [Dalton]: 41 K - company: Norwegian Chitosan Ltd.
copper (II) chloride dihydrate
solid, CuCl2 2 H2O CAS-number 10125-13-0
Multimar
Chitosan made of lobster, free flowing powder - average degree of deacetylation: 0.83(M) - ash content [%]: 0.42(M) - molar mass [Dalton]:14 K - company: Mutlimar As
boric acid solid, H3BO3 CAS-number 10043-35-3

136
Table 2. Chitosan solutions mixed with Scanimp and two wood preservation agents in two different concentrations
Diff
eren
t woo
d pr
otec
tion
agen
ts a
nd th
eir s
ubst
antia
ls
chitosan soltion Kitoflokk [c] 5.08% Kitonor [c] 5.10% Multimar [c] 4.90%
pH-value
[c] of the substances in the solution
pH-value
[c] of the substances in the solution
pH-value
[c] of the substances in the solution
Scanimp 4.97 Kitoflokk 2.54% Scanimp 1:2 5.04 Kitonor 2.55%
Scanimp 1:2 5.20 Multimar 2.45% Scanimp 1:2
Scanimp (1:10) 4.94 Kitoflokk 2.54%
Scanimp 1:20 5.18 Kitonor 2.55% Scanimp 1:20 4.94
Multimar 2.45% Scanimp 1:20
boric acid [c] 1% (w/v)
4.98 Kitoflokk 2.54% boric acid 0.5% 5.16
Kitonor 2.55% boric acid 0.5%
5.37 Multimar 2.45% boric acid 0.5%
boric acid [c] 0.1% (w/v)
5.00 Kitoflokk 2.54% boric acid 0.05% 5.16
Kitonor 2.55% boric acid 0.05%
5.38 Multimar 2.45% boric acid 0.05%
CuCl2 [c] 0.52% (w/v)
4.78 Kitoflokk 2.54% CuCl2 0.26% 4.91 Kitonor 2.55%
CuCl2 0.26% 4.91
Multimar 2.45% CuCl2 0.26%
CuCl2 [c] 0.052% (w/v)
5.01 Kitoflokk 2.54% CuCl2 0.026% 5.06 Kitonor 2.55%
CuCl2 0.026% 5.27
Multimar 2.45% CuCl2 0.026%
Impregnation and retention of the solution in wood samples Scots pine (Pinus sylvestris L.) sapwood was used with dimension of 10 x 5 x 30 mm3. For each treatment eight wood samples were selected randomly and dried at 103°C for 24h to record the initial dry weight. Afterwards the samples were conditioned chamber at 21°C and 65% relative humidity. The conditioned weight was taken before impregnation. Placing the samples in the solutions, 4 kPa vacuum for 20 min was applied, followed by a 0.9 MPa pressure of 60 min. For drying the samples were stored in the conditioning chamber as it is mentioned above. The calculation of the retention was based on the recorded weights and was calculated as follows:

137
( )V
Cretention
∗−= condimp WW
[kg/m3] (Equation 1)
Wimp = weight after impregnation Wcond = conditioned weight V = Volumen of the sample C [%] = concentration of the substances Leaching of impregnated wood samples Before leaching the samples according to EN 84 (1997) the constant conditioned weight of all samples was taken. The test vessels were place in a vacuum desiccator and vacuum of 4 kPa was established for 20 min. The test specimens maintained for 2 hours, before the water was changed the first time. During the remaining 13 days the water was changed 9 times. Decay test The fungi test was carried out according to Bravory (1996), a shortened version of EN113. For recording the dry weights the samples were dried at 60°C vacuum (40mbar) for 48 hours. The samples were sterilized by gamma irradiation of 25 kGy at the Norwegian Institute for Energy Technology. Each of the eight wood samples for the respective treatment were placed in a petri dishes (diameter 9 cm, height 2 cm) containing 20 ml 4% (w/v) malt agar together with one untreated control sample. To separate the samples from direct contact with the media a plastic mesh was used. Five replicates were inoculated with Coniophora puteana (Schumach.), a brown rot fungus. Other three were treated without fungus as correction values for calculation of mass loss. Calculations of decay (mass loss) and water content after decay were performed as described in EN113. The incubation time was eight weeks at 22°C and 65% relative humidity.
RESULTS AND DISCUSSION Decay test The decay varies in the leached wood samples impregnated with the three different chitosan solutions: Kitoflokk, Kitonor and Multimar. Only the treatment with Multimar shows significantly lower mass loss compared to other chitosan treatments and virulence. The mass loss (ML) of Kitoflokk and

138
Kitonor impregnated samples was over 20%. However, Multimar had a mean mass loss of 14%. Mean retention of the chitosan solutions was similar. The finding of Raiser et. al. (2008) shows that Multimar impregnated samples have even higher mass loss (21.7%) by using the same condition. Exposed to the fungus Trametes versicolor the same mass loss obtained. Comparison to unleached samples shows that chitosan has got a insufficient fixation (Alfredsen et al., 2004; Raiser, et al., 2008). The mean mass loss for samples impregnated with different chitosans combined with the wood preservative Scanimp in different proportions ranges between 0% and 1.52%. Further dilution of Scanimp mixed with Kitoflokk increases the mass loss from 0% (Kitoflokk mixed with Scanimp 1:2) to 17.83% (figure 2). Varying the Scanimp concentration in decadic steps in the mixtures mixed with Multimar and Kitonor no significant difference is observable in the mean mass loss. Also the use of different chitosans causes no significant effect. Comparing samples impregnated with chitosan solutions mixed with Scanimp 1:2 with them impregnated with undiluted Scanimp (ML= 1.60%) a significant decrease in mass loss appeared between the mixtures with Multimar (ML= 0%) and Kitoflokk (ML= 0%), but not between Kitonor (ML= 0.26%). This may lead to the assumption that the average molar mass of chitosans (table 1) has an influence on the synergistic effect. Raiser et. al. (2008) is showing the same results for higher concentrated Kitoflokk and less amount of Scanimp (1:4). Comparing Scanimp 1:20 impregnated samples to those treatments with chitosan solutions mixed with the same Scanimp amount (1:2) no significant effect is observable. Leached samples impregnated with the various chitosan- boron- combinations are showing no significant difference in decay amongst each other and to their controls. A comparison between unleached Kitonor- boron- combinations to boron impregnated samples with the same boron concentration are showing no difference in decay. The theory that the negatively charged [B(OH)]4- ion interacting with cationic compounds of chitosan is not fulfilled. The same observation as for leached and unleached samples impregnated with chitosan solutions mixed with Boron can be seen by the mixtures with copper (II) chloride dehydrates. No synergistic effect appears between them.

139
Figure 1-4. Mean mass loss of wooden samples impregnated with Chitosan and their combinations to a wood preservative and wood preservative agents. Fig.1. Mean mass loss of samples impregnated with different chitosan products. Fig.2. Mean mass loss of samples impregnated with various chitosan products combined with “Scanimp” in two different concentrations. Fig.3. Mean mass loss of samples impregnated with various chitosan products combined with Boron in two different concentrations. Fig.4. Mean mass loss of samples impregnated with various chitosan products combined with CuCl2 in two different concentrations.
Figure 1 Figure 2
Figure 3 Figure 4

140
CONCLUSION
Mixing chitosan with different wood protection agents shows various synergistic effects: - Efficiency of the commercial wood protection agent “Scanimp” increases
with addition of chitosan. Good results were obtained using low molecular weight chitosan together with Scanimp. The mean mass loss decreased compared to samples impregnated with Scanimp alone. Mixing Scanimp with higher molecular weight chitosan shows no difference.
- A synergistic effect between CuCl2-chitosan- and borates-chitosan-combinations does not occur.
ACKNOWLEDGEMENTS
The authors would like to thank Sigrun Kolstad for her help with the tests and Monika Fongen and Eva Grodås for their help with analytical work..
REFERENCES Alfredsen, et al. (2004). "Screening of Chitosan Against Wood-deteriorating Fungi." Scandinavien Journal of Forest Research 19(5): 4-13. Eikenes, M. (2005). Chitosan - A potential wood protecting agent and developement of related quantitative analytical methods. Dept. of Chemistry, Biotechnology and Food Science. Ås, Norwegian University of Life scince. Doctor: 120. Kumar, M. N. V. R. (2000). "A review of Chitin and Chitosan applications." Reactive and Functional Polymers 46(1): 1-27. Roberts, G. (1992). Chitin Chemistry, Macmillan, London,: 352f.

141
Stössel, P. and J. L. Leuba (1984). "Effect of chitosan, chitin, and some aminosugars on growth of various soilborne phytopathogenetic fungi." Journal of Phytopathology 111 (1): 82-90. Raiser, E., Larnøy, E. , Militz, H. (2008): Anti fungal effectiveness of some new environmental friendly wood protection agents contra traditional agents- a screening test. Proc. Ecowood: 137-148.

142
ADHESION STUDIES OF SCOTS PINE-POLYPROPYLENE
BOND USING ABES
Segerholm, B.K.1, Wålinder, M.E.P.2 & Holmberg, D.3
ABSTRACT
Injection moulded wood plastic composites (WPCs) are generally built up by wood in the shape of fibres or flour, mixed together with a thermoplastic matrix and a coupling agent. The most common coupling agent is different types of maleic anhydrides (MA). It is still not known to what extent the MA works as a chemical coupling agent or as a dispersing agent in the WPC, of which both functions would help to improve the mechanical properties of the WPC. The objective of this study was to solely evaluate adhesion between a wood surface and a matrix material with and without MA, by using an automatic bond evaluating system (ABES). The ABES allows a wood-plastic compression at desired temperature and cooling, as well as mechanical testing the formed bond in a closed loop. Sapwood and heartwood veneer specimens of Scots Pine (Pinus sylvestris L.) were melt bonded together with a sheet of either pure polypropylene or polypropylene with a high content of MA placed between the veneers. In addition to the ABES bond-strength tests, after the tests the fracture surfaces were evaluated. Results indicate large differences in bond strength between specimens with and without MA. Key words: Wood, polypropylene, maleic anhydride, MAPP, Adhesion.
1 PhD student, KTH, Royal institute of Technology, Building Materials, SE-100 44 Stockholm SWEDEN, and SP Technical Research Institute of Sweden, EcoBuild, Box 5609, SE-114 86 Stockholm, SWEDEN, Tel: +46 10 5166259, E-mail: [email protected] 2 PhD, SP Technical Research Institute of Sweden, EcoBuild, Box 5609, SE-114 86 Stockholm, SWEDEN, and KTH, Royal Institute of Technology, Building Materials, SE-100 44 Stockholm SWEDEN, Tel: +46 10 5166223, E-mail: [email protected] 3 BSc., SP Technical Research Institute of Sweden, Wood technology, Box 5609, SE-114 86 Stockholm, SWEDEN

143
INTRODUCTION
The common way of evaluating the efficacy of a coupling agent incorporated in a wood plastic composite (WPC) is to measure changes in mechanical properties and examination of the fracture surface of the tested WPC specimen. An alternative to such procedures, and perhaps also more efficient means to evaluate wood-thermoplastic bonding mechanisms, would be to make a screening of promising coupling agent candidates prior to the making of the WPC. Recently, a new type of experimental equipment has been developed for evaluation of the strength development of wood-adhesives bonds while curing (Humphrey 1993, Humphrey 2005, Wescott et al. 2007). The equipment is named automated bond evaluating system (ABES) and has the potential to shortening the times in tailoring new and improving existing thermoset wood adhesives (Humphrey 1993, Humphrey 2005, Wescott et al. 2007). The objective of this study was to use the ABES equipment for evaluating the efficiency of using maleic anhydride as a coupling agent in the forming of a wood-polypropylene bond.
MATERIALS AND METHODS
The materials were cross cut veneers of Scots pine with a thickness of 0.7 mm. Heart- and sap-wood areas were punched out into 120 x 20 mm2 specimens in the longitudinal direction of the wood. The thermoplastic used was thin films of a commercial polypropylene (PP) and a commercial maleic anhydride polypropylene (MAPP). The automated bond evaluating system (ABES) used consists of heated press plates, forced air cooling plates as well as a system for mechanically testing the joint, see Fig 1. The plates, grips and the tensile test stage is controlled by 7 bar air pressure and it is possible to program the whole gluing cycle.

144
Figure 1: Overview of the ABES, 1) Press plates, 2) Forced air cooling plates, 3) Guidance pins, 4) Grips for mechanical testing. Single-lap shear specimens were produced placing the punched out wood veneers in the ABES, with an overlap of ca 4.5 mm and the thermoplastic film was placed between the veneers. The melting time was set to 20s for both types of bonds. The melting temperature was 195 °C for the specimens with PP and 165 °C for the specimens with MAPP. After pressing the specimens were cooled for 2 minutes in forced air and removed from the ABES and stored in a climate of approximately 65 % relative humidity (RH) and 25 °C. All specimens were then mechanically tested in the tensile test stage of the ABES and the shear strength of the bonds was calculated.
RESULTS AND DISCUSSION
The results show large differences between the two thermoplastic systems, see a summary of shear strength values presented in Table 1. The joints between
2 4 3
1 1
2 4
4
3

145
wood and MAPP showed 50% higher shear strength values compared with the wood-PP joints. There was, however, no significant difference between the heartwood-plastic and the sapwood-plastic joints, i.e. irrespectively if MAPP or PP was used. The fracture surface of the wood-MAPP samples showed a high proportion of wood fracture, especially in the case of sapwood, whereas the wood-PP samples showed a high proportion of thermoplastic matrix fracture, see examples of overview photos of fracture surfaces in Fig 2. The pronounced wood fracture failure type for the wood-MAPP samples indicates that the wood-plastic interface (or the interphase) is stronger than the shear strength of the wood component. It is nevertheless important to also take the edge effects into account, which will influence the mechanical performance of the components.
Table 1. Shear strength of the tested combinations. PP MAPP Sapwood 3.4 (0.2) 5.1 (1.1) Heartwood 3.7 (0.5) 5.4 (0.6)
Figure 2: Fracture surfaces from some of the tested specimens, from left to right, MAPP-sapwood, PP-sapwood, MAPP-heartwood and PP-heartwood respectively. There were large differences in melt viscosity between the PP and the MAPP. The MAPP had much lower viscosity which would improve the mechanical entanglement in the wood, which makes it difficult to draw conclusions whether the higher mechanical data is a source of better chemical coupling or if it is because of deeper penetration and more mechanical entanglement, but we believe there is probably a combination of both effects.

146
In order to develop the ABES to a more reliable evaluation approach of the wood-thermoplastic adhesion efficiency, it is suggested to use thermoplastic materials with more similar melt properties. Influences of earlywood or latewood, method of surface preparation, extractives would also be interesting fields to explore with this method.
ACKNOWLEDGEMENT
Financial support from EcoBuild Institute Excellence Centre established by VINNOVA, The Knowledge Foundation and the Swedish Foundation for Strategic Research, as well as financing of the ABES equipment from Stiftelsen Nils och Dorthi Troëdssons forskningsfond are greatly acknowledged.
REFERENCES
Humphrey, P.E. 1993. A device to test adhesive bonds. U.S. Patent 5,170,028 (and other patents). U.S. Patent Office, Washington, DC. Humphrey, P.E. 2005 in Wood Adhesives 2005 Proceedings, 2006, Forest Products Society, Madison, Wisconsin, pp 311-316. Wescott, J.M., Birkeland, M.J., Traska, A.E., Frihart, C.R. & Dally, B.N. 2007. New method for rapid testing of bond strength for wood adhesives. In proceedings of the 30th Annual meeting of The Adhesion Society Inc. Tampa Bay, Florida, pp 219-221.

147
THE BEHAVIOUR OF HEAT TREATED WOODEN CLADDING
EXPOSED TO EXTREME CLIMATE CHANGES
Sidorova, E.1 Morén, T.2
ABSTRACT
The heat treated (HT) ThermoD and oil heat treated (OHT) samples were prepared for the test. ThermoD samples were prepared by treating wood with superheated steam and saturated steam. Oil heat treated samples were heat treated in oil under 180ºC and cooled directly in clean oil at the room temperature. During cooling the samples absorbed some oil. Untreated samples of pine, spruce and aspen were prepared as the reference samples. The material was tested for 5 cycles. Each cycle contained: soaking in water for 24 hours, direct freezing for 6 days and direct warming for 30 minutes. The tested species were pine, spruce and aspen. Water absorption depended on type of species and treatment. Pine had higher water absorption but after oil heat treatment had the lowest water absorption due to high oil contain. Spruce and aspen had approximately the same water absorption. Heat treatment reduced water absorption as it was expected. Samples degraded in colour more or less and some started to crack. Almost all untreated and ThermoD treated pine samples cracked. Spruce had the highest visible change of the colour after the test. Aspen showed the best results because the colour did not change significantly and the material did not crack. Oil heat treated samples of pine lost some oil after the test Key words: heat treatment, oil treatment, heat treated wood 1 MSc, PhD student, SP Wood Technology, Drottning Kristinas väg 67, Stockholm, Sweden, Tel.: +46 10 516 62 16, E-mail: [email protected] 2 Professor, Division of Wood Physics, Luleå University of Technology, Skellefteå, Sweden, Tel.: +46 910 58 53 04, E-mail: [email protected]

148
INTRODUCTION The Swedish climate is characterized by changes in temperature during the year: from freezing in winter to warm weather in summer. The climate is rich in precipitation especially in spring and autumn periods. The winters are becoming milder due to the global warming. Thus rainy weather can occur after freezing during winter and autumn. [6] The temperature drops have a negative impact on the lifetime of the materials exposed outside, for instance wooden cladding. Many efforts are done in order to improve the life span of the wooden cladding. It is important to choose better specie and technology to produce durable material. It is evident that the cladding should preserve better appearance and structure for many years. To investigate the long-term properties of the cladding, the 5 weeks experiment was performed. During the experimental the extreme climate changing conditions were created. The aim of the study was to investigate the climate change resistance of heat treated wood.
MATERIAL AND METHODS The steam heat treated ThermoD (HT), oil heat treated (OHT) and untreated reference (R) samples of pine, spruce and aspen were prepared for testing. Steam heat treated samples (HT) were prepared according to the ThermoD technology of ThermoWood: the samples were treated under superheated and saturated steam under 212°C. Oil heat treatment (OHT) was performed during one hour in the hot oil with temperature 180°C with the direct cooling in the bath with clean new oil for one hour. During cooling samples absorbed some oil. 16 samples, dimensions 10x120x300 mm, of each species and treatment method were tested for the extreme climate changes. The material was tested for 5 cycles. Each cycle contained: soaking in water for 24 hours, direct freezing for 6 days and direct warming for 30 minutes. Soaking in water was performed in a big vessel for 24 hours at the room temperature. The samples were submerged under water and pressed by the

149
weight. In the first cycle the water absorption (W) of samples was calculated in percentage (Eq. 1)
(1) W = (Mw – Md)/Md x 100% Md – mass before soaking, Mw – mass after soaking.
Freezing was performed for 6 days at -28ºC. Warming was performed with the help of the patio infrared lamp. The samples were warmed until their surface reached +40°C; it took 30 minutes for every sample.
RESULTS AND DISCUSSION Soaking and water absorption Results of the water absorption during soaking in the first cycle are displayed in the table 1. Water absorption of untreated samples had higher values than water absorption of treated samples, because heat treatment reduced absorption of water. [2] Table 1: Water absorption of samples (W – water absorption, St D – standard deviation) Treatment Specie W, % St D, %
HT* Spruce 16,3 3,1 Pine 28,2 7,7
Aspen 18,1 2,8 R** Spruce 30,8 3,1
Pine 36,8 1,7 Aspen 27,7 4,1
OHT*** Pine 12,0 2,4 Spruce 28,7 5,9 Aspen 19,7 3,2
*HT – steam heat treated at 212ºC (ThermoD), **R – untreated (reference), ***OHT – oil heat treated at 180ºC

150
Among R wood samples aspen had lower water absorption. Aspen is diffuse-porous hardwood with small vessels which can prevent high water absorption; density of aspen is higher than density of spruce and pine. [4,7] Because of high standard deviations, it is possible to conclude that HT spruce had approximately the same water absorption as HT aspen. HT pine had the highest water absorption among other HT samples, also R pine samples show higher water absorption compare to other R samples. Even though pine and spruce belong to softwoods, they have essential distinctions on anatomical level. There is difference in connections between longitudinal tracheids and horizontal parenchyma cells in rays of pine and spruce. Looking at the radial view it can be seen that pine has a large pit (fenestriform pit) and thin membrane between adjacent cells. Spruce has a number of small piceoid or cupressoid pits in the membrane (Fig. 1). [8]
Figure 1: Interconnecting pits between ray parenchyma and vertical tracheids in pine and spruce, earlywood and latewood [8]
Water absorption of OHT spruce was higher than absorption of ThermoD spruce, because oil heat treatment was performed at 180°C (not like ThermoD which has treatment temperature 212°C for softwoods) and higher treatment temperature reduced water absorption [2]. OHT aspen absorbed less water than other OHT species, but also absorbed more compare to HT aspen. Interesting values were achieved for OHT pine. Water absorption of OHT pine was much lower than absorption of spruce and aspen; water absorption of OHT pine was also lower than water absorption of HT pine. It can be explained by the fact that pine absorbs much oil (75% and higher) in the process of oil heat treatment with cooling in the oil bath [9]. Thus there is not much space remaining for the water inside the sample.

151
Results after 5 cycles of testing HT pine practically did not change colour after cycling. Cracks appeared on pine samples (Fig. 2). This can be explained by high water absorption during soaking. HT spruce became darker and greyish, but there was no cracking on the samples. HT aspen became a bit greyish but the colour change was not significant. No cracks were observed on HT aspen samples.
Figure 2: Cracks on ThermoD pine after cycling OHT pine became a bit darker, but there were no cracks like in HT pine. It can be explained by the fact that OHT pine had low water absorption, since pine absorbed much oil during heat treatment process. At the same time oil started to come out on the surface of OHT pine during warming of the samples (Fig. 3). OHT spruce degraded in colour, but there was no oil on the surface of samples during warming. OHT aspen also became a bit darker, but visible colour change for aspen was less than for pine and spruce. Aspen degraded less of all three species and spruce had the highest degradation of colour.
Figure 3: Oil on the surface of OHT pine after warming

152
Untreated (R) pine, spruce and aspen degraded in colour. The colour degradation was more visible on untreated samples than on HT or OHT samples. Pine and spruce got big bluish spots on the surface. Pine also got cracks. Aspen became darker, but no spots were visible. Interesting visual changes occurred on R spruce after experimental. The material not only degraded in colour, but also the stripes perpendicular to the board length appeared (Fig. 4). It is possible to suggest that they were the stains from the stickers that are used in the drying process. The function of the stickers is to separate the levels of the timber and to enable the moist air and heat circulate into stacks of wooden boards for proper drying. The sticker marks can be remaining even after the planing process. They can be not visible after drying but can appear after heat treatment process. [3] So the process of cycling designed as in this paper could probably cause the visual appearance of the sticker stains on the surface of the samples.
Figure 4: R spruce (up – before cycling; down – after cycling)
CONCLUSIONS Water absorption of untreated wood had the highest values as it was expected. Pine had higher water absorption than spruce and aspen in the case of untreated wood and wood treated according to ThermoD. Oil heat treated pine had lowest water absorption compare to oil heat treated spruce and aspen and even ThermoD wood because pine absorbed much of oil during treatment process. Oil heat treated pine had oil on the surface after warming process.

153
Low water absorption is an advantage for oil heat treated pine, but unfortunately the oil which was leaving pine during cycling would cause the increase of water absorption. Thus it is important to develop coating or impregnation which will prevent the loss of oil from the timber. All the samples degraded in colour. Aspen had the lowest colour degradation. Spruce had highest colour degradation. Thus it is important to protect colour not only from UV radiation but also from changing climate conditions. Untreated and ThermoD pine had cracks after cycling. The absence of cracks on the oil heat treated pine can be explained by low water absorption. Cracking of the material showed that it is very weak to resist the changeable climate conditions. The weak colour resistance is the drawback for heat treated wood. Necessary coatings or impregnations should be used for the HT timber. The cycling process described in this paper probably can cause the visual appearance of the sticker stains. More investigation has to be done on this topic. Comparing all three species, aspen showed the best results, because it did not cracked and its colour degradation was the lowest. References 1. Dinwoodie, J.M. 1989. Wood nature’s cellular, Polymeric fibre-composite, Chapter 3, Density and appearance in wood 2. Finnish Thermowood Association 2003 ThermoWood® Handbook. ThermoWood: Homepage, http://www.thermowood.fi/, [Cited 1 Mar 2008] 3. Güner, Ö. 2009. Master’s Thesis. Evaluation of wood and aluminium stickers and their stains on heat treated spruce boards – Influence on quality and cost. Luleå University of Technology 4. Mackes, K.H. & Lynch, D.L. 2001 Aspen forest products. USDA Forest Service Proceedings RMRS-P-18 5. Merela, M., Serša, I. & Oven, P. 2006. Research of anatomy and moisture distribution in beech and oak wood by 3D MR imaging technique. In:

154
Proceedings of the 5th IUFRO Symposium “Wood structure and properties ’06”. 3-6 September, Sliač – Sielnica, Slovakia 6. Regeringskansliet 2009. Swedish Government Official Reports SOU 2007:60. Final report on from the Swedish Commission on climate and vulnerability, Sweden facing climate change – threads and opportunities. Homepage, http://www.regeringen.se/, [Cited 20 Jun 2009] 7. Rowell, R. 1984. The chemistry of solid wood. American Chemical Society, Washington, USA. 8. Sehlstedt-Persson, M., Johansson, D. & Morén, T. 2006. Effect of heat treatment on the microstructure of pine, spruce and birch and the influence on capillary absorption. In: Proceedings of The 5th International IUFRO Symposium Wood Structure and Properties. 3-4 September, Sliač - Sielnica, Slovakia 9. Sidorova, E. 2008. Oil heat treatment of wood. Proceedings of the 4th meeting of the Nordic Baltic Network in Wood Material Science & engineering, 13-14 November, Riga, Latvia

155
WHY CONSUMERS AVOID USING WOOD AS FLOORING MATERIAL
Vahtikari, K.1, Silvo, J.2, & Mauno, A.3
ABSTRACT
Even though wooden floorings have been used in Finland for centuries both in residences and in civic buildings, material characteristics of wood are nowadays often unrecognized when interior materials are selected. In many building and designing cases people avoid wood without specifying their reasons. The important question that needs to be answered is why wooden floorings are not chosen. To better understand the reasons behind the diverse positive and negative attitudes towards wooden floorings, consumers in Finland were interviewed. In the interviews the consumers were asked to tell what kind of floorings they appreciate and would choose to their homes. Key words: wood, floorings, consumers
INTRODUCTION Even though wooden floorings have been used in Finland for centuries both in residences and in civic buildings, material characteristics of wood are nowadays
1 PhD student, Department of Forest Products Technology, Aalto University School of Science and Technology, P.O.Box 16400, FI-00076 Aalto, Finland, Tel: +358 50 560 8598, E-mail: [email protected] 2 PhD student, Department of Forest Products Technology, Aalto University School of Science and Technology, P.O.Box 16400, FI-00076 Aalto, Finland, Tel: +358 50 562 4875, E-mail: [email protected] 3 PhD student, Department of Forest Products Technology, Aalto University School of Science and Technology, P.O.Box 16400, FI-00076 Aalto, Finland, Tel: +358 50 567 7979, E-mail: [email protected]

156
often unrecognized when interior materials are selected. In many building and designing cases people avoid wood without specifying their reasons. Few materials can compete with wood in versatility; just in Finland there are naturally more than 20 wood species (Vepsä 2000). As building material wood has a good moisture buffering efficiency compared with bricks, cellular concrete and gypsum plaster (Padfield 1998). Wood has also shown antibacterial properties that could be used in product development (Ak et al. 1994, Schönwälder et al. 2002 & Milling et al. 2005). Both professionals and consumers, consider materials from their own, varying perspectives. This perspective consists of the knowledge and the experiences the person has of different materials. To better understand the reasons behind the diverse positive and negative attitudes towards wooden floorings, consumers in Finland were interviewed. The key findings from the interviews are discussed in relation to the studies where the material selection process of professionals like architects and designers have been described (Paloheimo 2009, Nisonen 2010). The purpose of this study is to answer to the question why people avoid using wooden floorings. In this study wooden floorings include both solid wood floors and different kind of parquets.
CONSUMERS’ ATTITUDES TO FLOORINGS
70 consumers in Finland were interviewed briefly in order to find out what kind of flooring they appreciate and would choose to their homes. They were also asked to give reasons for their choices. The interviews were done as a part of the M.Sc. level course Marketing Wood Products in 2009 and the results have been published only partly earlier. 36 men and 34 women from southern Finland were interviewed. Their age varied between 17 and 69 years. The age group of 17-34 years was the biggest, including 32 interviewees. The age group of 35-49 had 15 interviewees and the age group of 50-69 23 interviewees. Men and women were evenly represented in the different age groups. Approximately half of the interviewees (37 persons) lived in apartments, 20% lived in row houses and the rest in one-family-houses. The clear majority of the youngest age group (80%) lived in apartments. 60% of the oldest age group lived in one-family-houses. Only 14 of the 70 interviewees

157
said that they had some previous experience concerning flooring materials through education, work etc. This means that the results show quite well the thoughts of an average consumer. The interviewees were asked to choose flooring material for their own kitchen, bedroom and living room. They were also asked to give reasons for their opinions. The results are shown in Fig. 1 where it can be seen that almost all chose wood to their living room and bedroom but almost none chose wood to their kitchen. At least 75 % of the 17-34 years old and of the 50-69 years old chose wood to their living room and bedroom. The 35-49 years old preferred laminate more often than the other age groups, only 60 % of them chose wood.
Flooring material choice for the kitchen
Wood
Laminate
Cheramic tiles
Plastics
Carpet
Other
Flooring material choice for the bedroom
Wood
Laminate
Cheramic tiles
Plastics
Carpet
Other Flooring material choice for the living room
Wood
Laminate
Cheramic tiles
Plastics
Carpet
Other Figure 1. Preferred flooring material for the kitchen, the bedroom and the living room (70 people were interviewed in Finland). When the interviewees described wooden floorings, words like stylish, looks good, expensive, needs maintenance, warm, natural and pleasant came up. When they were asked specifically about the cleaning, it came up that wooden floorings are considered hard to maintain and hard to clean. Interviewees were asked to rank the given flooring materials according to the easiness of cleaning. Half of the interviewees thought that wooden flooring was the hardest one to clean. Plastics and ceramic tiles were considered the easiest ones to clean, both materials collected one third of the answers. These results are presented in Fig. 2.

158
Easiest flooring material to clean
Parquet
Laminate
Ceramic tiles
Plastics
Hardest flooring material to clean
Parquet
Laminate
Ceramic tiles
Plastics
Figure 2. The flooring materials divided according to the easiness and hardness to be cleaned (70 people were interviewed in Finland). The interviewees were also asked to rank the same given flooring materials according to the price-quality ratio. Both parquet and laminate collected one third of the answers when the best price-quality ratio was asked. Plastic again was considered as the material with the poorest price-quality ratio. Over half of the answers shared this opinion. The results are shown in Fig. 3.
Best price-quality ratio
Parquet
Laminate
Ceramic tiles
Plastics
Poorest price-quality ratio
Parquet
Laminate
Ceramic tiles
Plastics
Figure 3. The flooring materials divided into the best and into the poorest according to the price-quality ratio (70 people were interviewed in Finland). To find out how environmentally friendly wood is considered, the interviewees were asked how they would rate the flooring materials considering the friendliness to the environment. Wood was chosen in 75 % of the cases as the first choice as can be seen in Fig. 4.
Friendliness to the environment
Parquet
Laminate
Ceramic tiles
Plastics
Figure 4. The most environmentally friendly flooring materials (70 people were interviewed in Finland).

159
DISCUSSION AND CONCLUSIONS The interviews show that wood is a wanted material to bedrooms and living rooms, but not to kitchens. When asked why other material than wood was chosen to kitchens, the answer was usually “they are easy to clean”. This proves that in people’s mind the cleanability of wooden floorings is considered as a problem. The customers used a very wide scale of words to describe wood as flooring material. The terms were mostly positive such as warm and natural, but also negative words such as expensive and hard to maintain were mentioned. When these answers are compared to what the professionals answered when architects and designers were interviewed (Vahtikari & al. 2009), it can be noted that similar issues came up. When architects were interviewed they told that along with the existing building regulations the most important criteria to choose wood are aesthetics and the natural feeling of wood. According to the designers, price reliability and maintenance intervals are emphasized among builders. How to change the image of wood as problematic material is a difficult question. In any case it should be answered, if any progress in the use of wood in interiors is wanted. Several flooring materials, excluding wood, have been studied from the cleanability point of view (Kuisma 2004, Määttä 2007). Cleanability and maintenance are important factors, when materials are selected and research in this area is needed also concerning wooden floorings. In the real life the price may influence the decision making more than what came up in this interview. Especially parquet is considered as an expensive material. On the other hand the price-quality ratio of wooden floorings was considered good. Some of the things that people consider as wood material’s weaknesses, for example the patina it gets, could on the other hand be turned to strengths for wood. Wood is natural material and consumers love the feeling of wood, how it looks like and how it positively influences the atmosphere. Marks of living can be seen on it after a certain while, but it can also be re-treated and thus modernized or reconstructed when needed. A positive thing is that wooden floorings were considered friendlier to the environment than other flooring materials. People are more and more conscious of the environmenttal aspects of their choices. In the future material properties

160
like re-usability and durability may become significant factors when people choose flooring materials, which will be advantageous for wood. This paper shows that people avoid using wooden floorings because they assume that wood is difficult to maintain and to clean. There is a need for further research in this area. The results of the research should be brought near to the consumers, not only discussed among the researches and scientists. Acknowledgements The Finnish Cultural Foundation and Modern Wooden Town Graduate School have funded this work.
REFERENCES
Ak, N.O., Cliver, D.O. & Kaspari, C.W. 1994. Cutting boards of plastic and wood contaminated experimentally with bacteria. J Food Prot. 57(1):16-22. Kuisma, R. 2004. Tutkimusmenetelmien kehittäminen kulutus- ja puhdistuvuustutkimuksiin muovipintaisille lattiamateriaaleille. Licentiate’s thesis. MMTEK series 18. Department of Agricultural Engineering and Household Technology. University of Helsinki, Finland. Milling, A., Kehr, R., Wulf, A. & Smalla, K. 2005. Survival of bacteria on wood and plastic particles: Depedence on wood species and environmental conditions. Holzforschung, 59(1):72-81. Määttä, J. 2007. Modifications of surface materials and their effects on cleanability as studied by radiochemical methods (dissertation). MMTEK series 26. Department of Agrotechnology, University of Helsinki, Finland. Nisonen, V. 2010. Tammen ja männyn sisustuskäyttöön vaikuttavat tekijät. Master’s Thesis. Department of Forest Products Technology, Aalto University School of Science and Technology, Finland. Padfield, T. 1998. The role of absorbent building materials in moderating changes of relative humidity. Ph.D. Thesis. The Technical University of Denmark.

161
Paloheimo, J. 2009. Multifunctional properties of wood adding value in potential interior applications. Master’s Thesis. Department of Forest Products Technology, Helsinki University of Technology, Finland. Schönwälder A., Kehr R., Wulf A. & Smalla K. 2002. Wooden boards affecting the survival of bacteria? Holz als Roh- und Werkstoff, 60(4):249-257. Vahtikari, K., Silvo, J. & Vainio-Kaila, T. 2010. Are wooden floorings difficult to maintain? Conference Proceedings of WCTE 2010 – World Conference on Timber Engineering. June 20-24, 2010 Riva del Garda, Italy. Volume III. 8 p. Available only on the conference CD. Vepsä, M. 2000. Puiden äärillä. In: Paloheimo (editor): Metsä ja puu I – Elävä puu. Helsinki University of Technology, Chair of Wood Construction and Rakennustieto Oy. Helsinki. P. 160-180.

162
MODIFIED WOOD – EXCELLENT RAW MATERIAL FOR
PRODUCTION OF GRANULAR ACTIVATED CARBON
Rizhikovs, J.1 & Zandersons, J.2
ABSTRACT
Activated carbon can be prepared from a variety of raw materials. The most frequently used precursors for activated carbons are wood and its residues, nut shells, fruit stones and agriculture residues. A raw material with a high bulk density and a low content of volatiles such as nut shells and fruit stones is appropriate to produce mechanically strong granular activated carbon with a high adsorption capacity. In North Europe, however, these raw materials are either non-available or available in insufficient amounts. Therefore, it is proposed in this study to obtain mechanically strong granular activated carbon by physical activation with superheated steam under a self-generated atmosphere from hydrothermally treated and pelletized grey alder (Alnus incana (L.) Moench) wood. The influence of the moisture content before pelletization in the range 4-12 wt% on the mechanical properties and the developed porous structure of the obtained carbons was studied. The mechanical and surface properties of activated carbons depend on the combined effect of the conditions employed. If microporous high density sorbents are necessary, the pelletization with the moisture content 6-10 wt% is preferable. Key words: Lignocellulosic sources, hydrothermal treatment, pelletization, carbonization, activated carbon.
1 PhD student, researcher in Department of Technological Research, Latvian State Institute of Wood Chemistry, 27 Dzerbenes Str., LV-1006 Riga, Latvia, Tel: +371 6 7551552, Fax: +371 6 7550635, E-mail: [email protected] 2 Dr. sc. ing., senior researcher in Department of Technological Research, Latvian State Institute of Wood Chemistry, 27 Dzerbenes Str., LV-1006 Riga, Latvia, Tel: +371 6 7551552, Fax: +371 6 7550635, E-mail: [email protected]

163
INTRODUCTION
Biomass is currently a promising renewable and potentially neutral raw material in relation to global warming. Activated carbon has a big volume fraction of very small pores, which results in a large specific surface area. Typical activated carbons have surface areas from 600 to 1200 m2/g prepared from a variety of raw materials. The most frequently used precursors for activated carbons are wood and its residues (Amaya et al., 2007), nut shells, fruit stones and agriculture residues (Gergova et al., 1994). Raw materials with a high bulk density and a low content of volatiles are more appreciative for production of granular activated carbon. Therefore nut shells and fruit stones could be ideal precursors to produce mechanically strong granular activated carbon with a high adsorption capacity. In North Europe these raw materials are either non-available or available in insufficient amounts. Our recent work showed that treatment of grey alder (Alnus Incana (L.) Moench) wood with saturated steam at 180 oC resulted in significant yield of water soluble substances, which improve the pelletizing ability of the obtained MW (Rizhikovs et al., 2008). Due to the high content of hemicelluloses, grey alder wood is a promising raw material for hydrothermal modification under pressure for further pelletization. The hydrothermal treatment process is also called autohydrolysis, because the reaction is catalyzed by the hydronium ions from the autionization of the water and acetic acid released from hemicelluloses by the cleavage of acetyl side chains, and the weak acidic environment created thereby is sufficient to promote the hydrolysis of the rest of hemicelluloses. As a result, free sugars are reactive and can be decomposed under heat into furfural and other decomposition products, which can be further transformed into a polymeric substance to provide a bounding and bulking effect on the obtained lignocellulosic material by the application of heat and pressure in a pelleting operation, resulting in composite products with a good mechanical strength and an excellent dimensional stability (Cheng, 1989). Water acts as both a binding agent and a lubricant, it helps in developing Van der Waals’ forces by increasing the area of contact between the particles. Several studies have shown that the strength and durability of densified materials increases with increasing moisture content until an optimum is reached, and good quality wood pellets can be produced with initial moisture contents of 6-12 wt% (Li and Liu, 2000). For modified wood, however, the optimal moisture must be determined to obtain dense and mechanically strong pellets. It is very important to retain the mechanical properties of the pellets also after carbonization and activation. Therefore, the effect of the moisture
164
content before pelletization on the adsorption and mechanical properties of steam activated carbon was investigated.
MATERIAL AND METHODS The technology for the production of granular activated carbon from modified wood consists of the following steps:
• Drying of wood chips; • Hydrothermal pretreatment of chipped grey alder wood; • Milling of dry modified wood chips; • Pelletizing of modified wood; • Carbonization and activation of pelletized modified wood.
Sample preparation
Freshly cut grey alder wood chips (3 to 6 cm), after drying at room temperature to the moisture content 10-15% on the wet mass basis, were used for modification. Five variants of the initial moisture content before pelletization (4, 6, 8, 10 and 12 % w.b.) were prepared to study the impact of water on the mechanical properties of modified wood pellets, carbonized pellets and granular activated carbon. The initial moisture content necessary for the experiments was achieved, mixing the modified wood with the fractional composition below 2 mm with the calculated water amount and holding in an air-tight vessel at room temperature for 48-72 h.
Modification (hydrothermal treatment)
GA wood chips were hydrothermally treated in a 370 l laboratory plant (WTT A/S) slowly raising the temperature up to 180oC in a saturated steam atmosphere and holding for 2 hours under these conditions. Dry MW chips were milled in a cutting mill SM 100 (Retsch GmbH & Co) to pass the sieve of 2.00 mm.
Pelletization
Flat die type pelletizator (Amandus Kahl GmbH) was employed for pelletization of dry and milled modified wood with the fractional composition ≤

165
2 mm. Material was pressed through a flat die with holes of diameter 6 mm by pan grinder rollers, formed into endless strands, and then cut to the desired particle length by means of knives. The temperature on the die was about 100-110oC.
Mechanical properties of pellets
The mechanical properties of carbonized and non-carbonized pellets were determined using a pellet Hardness tester (Amandus Kahl GmbH) with the measuring range up to 1000 N, where the hardness is the maximum crushing load at least 10 mm long pellet can withstand before cracking or breaking.
Carbonization and activation
Carbonization was carried out in an electrically heated 1 l laboratory scale retort. 250 g of MW 2 pellets or coconut shells (control) were heated up to desired carbonization temperature (600 oC) at a heating rate of 2 oC/min, controlled by electronic temperature regulator. About 35 g of crushed and sieved granules (1-3 mm) of the carbonized pellets or coconut shells (control) were inserted in a stationary retort equipped with a steam-superheating coil. The retort was placed in the furnace and heated up to the temperature 850 oC at a rate of 20 oC/min. The superheated steam (1.17 g/min, heated-up to 850 oC), was introduced into the retort for 90 min to ensure the chosen oxidizing agent/charcoal ratio (3:1).
Characterization of the activated carbons
Abrasion number of the obtained GAC was determined using a wet attrition test as described by (Toles et al., 2000). Parameters of porous structure of the samples were determined using a Sorptometer KELVIN-1040/1042 (Costech Microanalytical). Gas volume (N2), adsorbed on the surface of AC at the temperature of liquid nitrogen (77 K), was measured. Prior to gas adsorption measurements, the GAC samples were degassed at 250 oC in a vacuum for at least 300 min to remove adsorbed water vapor. pore size distribution, micropore volume, Brunauer-Emmett-Teller (BET) apparent surface area and total pore volume were determined from the adsorption/desorption isotherms of the adsorbed gas volume by the Barret, Joyner and Halenda method (Gregg and Sing, 1982).

166
RESULTS AND DISCUSSION
Pelletization of modified grey alder wood To obtain high density granular activated carbon it is very important to have precursors with high enough physicomechanical properties, which will retain also after carbonization and activation. High-quality pellets from modified grey alder wood can be made with initial moisture contents of 6-10% w.b., and water contents above or below this range would lead to lower quality pellets (Table 1).
Table 1: Impact of the moisture content of raw modified wood before pelletization on the properties of pellets
Moisture content [%] 4 6 8 10 12 Yield [%] 88.1 92.9 92.3 92.2 88.4 Bulk density [g/cm3] 0.75 0.76 0.74 0.74 0.73 Apparent density [g/cm3] 1.33 1.36 1.35 1.36 1.37 Hardness [kgf] 52±8 58±8 57±4 54±8 46±6 The positive influence of the optimum moisture content remains also after carbonization and activation, because the target product is that comply with aim to obtain mechanically strong GAC.
Carbonization and activation of modified grey alder wood pellets The obtained modified wood pellets were carbonized for further activation. Dense and mechanically strong carbonized pellets with bulk density 0.6 g/cm3 can be obtained, if the initial moisture content is 6-10 wt% before pelletization. (Table 2).

167
Table 2: Impact of the moisture content of raw modified wood before pelletization on the properties of carbonized pellets and GAC
Moisture content [%] 4 6 8 10 12 Carbonization (600oC, 2oC/min) Ash content [%] 3.02 2.15 2.65 2.35 2.2 Bulk density [g/cm3] 0.57 0.61 0.60 0.60 0.60 Apparent density [g/cm3] 1.16 1.16 1.16 1.14 1.11 Hardness [kgf] 18± 4 22± 4 23± 3 20± 3 16± 4 Activation (850oC, 90 min, steam and charcoal ratio 3:1) Ash content [%] 6.29 4.43 5.31 4.45 4.35 Bulk density [g/cm3] 0.40 0.44 0.44 0.46 0.44 Yield [% o. d. MW] 18.1 20.3 20.2 20.9 20.8 Attrition [%] 6.8 5.3 6.0 4.3 4.9 The carbonized granulated material retains its physical and mechanical properties after superheated steam activation. The yield of derived activated carbon is 20-21% (d.b. modified wood), the ash content is comparatively low 4.3-5.3%, which meets the requirements of most standards for the gas cleaning granular activated carbon. Comparative activation results of the carbonized modified wood pellets and coconut shell charcoal, activated at 850oC for 90 min and the steam-charcoal ratio 3:1, can be seen in Table 3.
Table 3: Properties of granular activated carbon obtained from modified wood pellets and coconut shells
Quality indicators Modified wood pellets Coconut shells BET surface [m2/g] 1338 1390 Total pore volume [mm3/g] 880 686 Micropore volume [mm3/g] 398 500 Attrition [%] 4.3 4.8 Bulk density [g/cm3] 0.46 0.48 Dense and mechanically strong microporous granular activated carbon was prepared by superheated steam treatment. The porous structure characteristics were close to those of the coconut shell activated carbon: BET surface 1338 and

168
1390 m2/g, total pore volume 880 and 686 mm3/g, and micropore volume 398 and 500 mg/g, respectively. Also bulk density and attrition number, namely, 0.46 g/cm3 and 4.3% is close to that of the granular activated carbon obtained from coconut shells, namely, 0.48 g/cm3 and 4.8% (Table 3). So, these carbon materials would be promising products from renewable biomass.
CONCLUSIONS
The best results obtained, if the relative moisture content is 6–10 % w.b.. The porous structure characteristics were close to those of the coconut shell activated carbon. By environmentally friendly modification of soft structure deciduous wood that is out of high grade demand, it is possible to produce an effective sorbent for industry - for purification of gaseous emissions.
REFERENCES
Amaya A., Medero N., Tancredi N., Silva H., Deiana C. (2007). Activated carbon briquettes from biomass materials. Bioresource Technology, 98(8), 1635–1641. Cheng S.K. (1989). European Patent, Composite products from lignocellulosic materials, EP 0161766 B1, 18.10.89. Gergova K., Petrov N., Eser S. (1994). Adsorption properties and microstructure of activated carbons produced from agricultural by-products by steam pyrolysis. Carbon, 32(4), 693–702. Gregg S.J., Sing K.S. (1982). Adsorption surface area and porosity. Academic Press: London, New York, p. 303. Li Y., Liu H. (2000). High-pressure densification of wood residues to form an upgraded fuel. Biomass and Bioenergy, 19(3), 177–186. Rizhikovs J., Dobele G., Zandersons J., Tardenaka A., Spince B. (2009). Improvement of the plasticity of grey alder wood and its granulating ability by hydrothermal treatment and upgrading of granulation techniques. In:
169
Proceedings of the 17th European Biomass Conference & Exhibition. Hamburg. Germany, 1583–1588. Toles C.A., Marshall W.E., Wartelle L.H., McAloon A. (2000). Steam- or carbon dioxide-activated carbons from almond shells: physical, chemical and adsorptive properties and estimated cost of production. Bioresource Technology, 75(3), 197–203.
ACKNOWLEDGEMENT
This work has been supported by the European Community’s Seventh Framework Program (FP7/2007-2013). Under grant No 203459 “WOOD-NET” (www.kki.lv).

170
THE USE OF FORMIC ACID FOR EXTRACTION OF ARSENIC
AND CHROMIUM FROM IMPREGNATED WOOD
Kapaca, E.1, Spince, B.2, Zandersons, J.3
ABSTRACT
In the second part of the last century, a very popular method for the protection of wood was impregnation with preservatives, which contained arsenic (as insecticide and fungicide) and chromium (as an arsenic fixating compound, which also provides UV light resistance). After 20-50 years of use, wood becomes old and needs to be replaced; therefore, an essential problem is how to recycle or utilize this impregnated waste wood.
The present research provides information about the extraction of arsenic and chromium from the chips of impregnated waste wood, performed by using formic acid solutions with different concentrations (0.5, 1.0, 1.5, 2.0 and 2.5 M). The content of arsenic and chromium in the impregnated wood, extraction and washing solutions and in the wood after extraction was determined. The content of arsenic was determined by UV-visible spectrophotometry using silver diethyldithiocarbamate, and the content of chromium was determined by UV-visible spectrophotometry using diphenylcarbazide and flame atomic absorption spectrophotometry. The impregnated waste wood before extraction contained 912 ± 22 mg/kg of chromium and 520 ± 14 mg/kg of arsenic. Applying the extraction method, the best result was for arsenic, because after the extraction with 2.5 M formic acid, waste wood contained only 1 % of arsenic from the initial one. The waste wood after extraction with 2.5 M formic acid still contained 16 % of chromium from the initial one, which means that the residual content of chromium is well bonded with wood components. 1 Bachelor, Latvian State Institute of Wood Chemistry, 27 Dzerbenes Str., Riga, LV-1006, Latvia, Fax: +371 6 7550635, E-mail: [email protected] 2 Researcher, Latvian State Institute of Wood Chemistry, 27 Dzerbenes Str., Riga, LV-1006, Latvia, Fax: +371 6 7550635, E-mail: [email protected] 3 Leading Researcher, Latvian State Institute of Wood Chemistry, 27 Dzerbenes Str., Riga, LV-1006, Latvia, Fax: +371 6 7550635, E-mail: [email protected]

171
Key words: Impregnated waste wood, formic acid, extraction, arsenic, chromium.
INTRODUCTION
Wood is one of the most important materials in construction and buildings; therefore, it is vital to protect it from insects, fungi and weather effects such as humidity and radiation. For that reason, wood is treated with preservatives that may be oil-soluble (for example, creosotes (tar-oils of a special boiling range), pentachlorophenol) or waterborne salts (for example, chromated copper arsenate (CCA), ammoniacal copper quats (ACQ), chromated zinc chloride (CZC), chromated copper borate (CCB)). In Latvia, the wood impregnated with preservatives containing arsenic and chromium had been used mainly for electricity and telephone communication poles. Those remained useful for 20 to 50 years and then needed to be replaced. Therefore, the main problem is to develop a method that removes the toxic and carcinogenic compounds from waste wood. There are some methods how to remove biocides from impregnated waste wood, such as chemical extraction using acid solutions (acetic acid, sulphuric acid and hydrogen peroxide, oxalic acid, citric acid, hydrochloric acid), biodegradation with microorganisms, thermal destruction. However, in this research, extraction with formic acid solutions was used. When chemical components are separated from the impregnated waste wood, it is possible to use it for chemical or thermochemical recycling.
MATERIAL AND METHODS
Extraction of impregnated waste wood For research, waste wood chips (length 1-3 mm), impregnated with preservatives containing arsenic and chromium, were used. The chemicals from the wood chips were extracted with 0.5, 1.0, 1.5, 2.0 and 2.5 M formic acid solutions. Approximately 30 g of wood chips and 400 mL of formic acid were used for extraction (3 h, temperature 80 oC). After extraction, wood chips were washed with 300 mL of deionized water (1 h, temperature 80 oC). With each concentration of formic acid, the wood chips were extracted and washed twice.

172
The content of arsenic and chromium in the impregnated waste wood chips was determined before and after extraction, and in the extraction and washing solutions.
Determination of arsenic content
The content of arsenic was determined by UV-visible spectrophotometry. 0.5-2.5 mL of the prepared sample solutions was weighted and transferred to a generator bottle. 10 mL of H2O, 5.0 mL of diluted HCl, 5 mL of KI solution, and 4 drops of SnCl2 solution were added to the prepared sample solutions, which were allowed to stand for ≥ 45 min. A cotton wool wad saturated with lead nitrate was placed in a sulphide absorption tube. 3 mm diameter solid glass beads were placed in the trap over a small glass wool pad until ¼ full, and 3.0 mL of silver diethyldithiocarbamate solution was added in a chloroform-morpholine mixture (v/v 100:1). 4.0 g of Zn was added to the generator bottle, attached immediately, and allowed to react for 30 min. The generator bottle was disconnected from the aspirator assembly. The trap with three 2 mL portions of the chloroform-morpholine mixture (v/v 100:1) was washed and aspirated into the 25 mL volumetric flask. Absorbance was measured at 520 nm. For determination, an UV/VIS spectrophotometer Lambda 25 „Perkin Elmer” was used, bandwidth - 1 nm, path length of the cuvette - 1 cm [1, 3].
Determination of chromium content In the extraction and washing solutions, the content of chromium was determined by UV-visible spectrophotometry using diphenylcarbazide solution. 0.5-2.5 mL of the prepared sample solutions was weighted and transferred to a volumetric flask. 0.5 mL of 0.2 M sodium periodate and 5.0 mL of deionized water were added and heated at 45 oC for 1 h. 5.0 mL of a 5 % glucose solution was added and allowed to stand for 20 min. 0.25 mL of concentrated phosphoric acid and 1.0 mL of the diphenylcarbazide solution were added. Absorbance was measured at 540 nm. For determination, an UV/VIS spectrophotometer Lambda 25 „Perkin Elmer”, bandwidth 1 nm, path length of the cuvette 1 cm was used [2, 4, 6]. In the impregnated waste wood chips, before and after extraction, chromium was determined by a flame atomic absorption spectrophotometer „Shimadzu

173
AA 6300”. A chromium hollow cathode lamp was used as a radiation source at 357.9 nm. Before determining the chromium content, 0.5 g of wood chips was mineralized with 10 mL of concentrated nitric acid in a microwave “MarsXpress” for 15 min, temperature 200 oC [5].
RESULTS AND DISCUSSION Before extraction, impregnated waste wood chips contained 520 ± 14 mg/kg of arsenic and 912 ± 22 mg/kg of chromium.
Extracted content of arsenic
The greatest amount of arsenic was removed at the first extraction, 24 % with 0.5 M formic acid and 64 % extracting with 2.5 M formic acid (Fig. 1). Comparing the content of arsenic in the first and second extractions, together with the washing solutions, the major part was in the first extraction and washing solutions, namely, from 38 % with 0.5 M formic acid to 90 % with 2.5 M formic acid, but in the second extraction with washing solutions, only approximately 10 % was extracted, comparing with the case of the impregnated waste wood before extraction.
0
10
20
30
40
50
60
70
0,5 1,0 1,5 2,0 2,5
Concentration of formic acid, M
Con
tent
of a
rsen
ic, %
1. extraction solution1. washing solution2. extraction solution2. washing solution
Figure 1. Content of arsenic extracted from impregnated waste wood. Increasing the concentration of formic acid from 0.5 M to 2.5 M, the total content of the removed arsenic changed from 51 % to 99 % from the initial one.

174
Extracted content of chromium The greatest amount of chromium was removed at the first extraction – extracting 17 % with 0.5 M formic acid and extracting 56 % with 2.5 M formic acid (Fig. 2). Comparing the content of chromium in the first and second extractions together with the washing solutions, the major part was in the first extraction and washing solutions, namely, from 27 % with 0.5 M formic acid to 73 % with 2.5 M formic acid, but was only approximately 10 % in the second extraction with washing solutions, comparing with the case of the impregnated waste wood before extraction.
0
10
20
30
40
50
60
0,5 1,0 1,5 2,0 2,5
Concentration of formic acid, M
Con
tent
of c
hrom
ium
, %
1. extraction solution1. washing solution2. extraction solution2. washing solution
Figure 2. Content of chromium extracted from impregnated waste wood. Increasing the concentration of formic acid from 0.5 M to 2.5 M, the total content of the removed chromium changed from 37 % to 84 % from the initial one.

175
0100200300400500600700800900
1000
0,0 0,5 1,0 1,5 2,0 2,5
Concentration of formic acid, M
Con
tent
of e
lem
ents
, mg/
kg
ChromiumArsenic
Figure 3. Content of arsenic and chromium in the impregnated waste wood after extraction with formic acid. The most effective removal was for arsenic after the extraction with 2.5 M formic acid, 4.88 ± 0.09 mg/kg of arsenic remained in the waste wood (the value that classifies the impregnated wood as a hazardous waste is 2.00 mg/kg) (Fig. 3). However, a great amount of chromium was also removed; after extraction with 2.5 M formic acid, 144 ± 2 mg/kg of chromium remained in the waste wood (the value that classifies the impregnated wood as a hazardous waste is 30 mg/kg).
CONCLUSIONS The best results were for the extraction of arsenic: 2.5 M formic acid
extracted 99% of the total arsenic content from the impregnated waste wood.
Chromium was well bonded to the components of wood, and after
extraction with 2.5 M formic acid, 16 % of the total chromium content remained in the wood.

176
Increasing the concentration of formic acid from 0.5 M to 1.5 M, the content of the extracted chromium and arsenic increased very fast, but continuing to increase the concentration of formic acid to 2.5 M, the content of the extracted elements increased quite slowly.
After the extraction with 2.5 M formic acid, the content of arsenic in the
waste impregnated wood exceeded the value, which classifies waste wood as hazardous by 2.4 times and 4.8 times for chromium.
REFERENCES 1. Aggeit, J., April, A. C. 1976. Determination of arsenic (III) and total arsenic
by the silver diethyldithiocarbamate method. Analyst 101: 912-918. 2. Cruz, F. G., Katz, S. A., Milacic, R. 1995. Determination of hexavalent
chromium in CCA-treated building timbers. Journal of Environmental Science and Health 30(2): 299-306.
3. Guo, X., Fujino, Y., Kaneko, S. 2001. Arsenic contamination of groundwater and prevalence of arsenical dermatosis in the Hetao plain area, Inner Mongolia, China. Molecular and Cellular Biochemistry 222(1-2): 137-140.
4. Herrmann, S. M. 1994. Testing the water for chromium. The Journal of Chemical Education 71(4): 323-324.
5. Maria, M. F., Hossu, A. M., Negrea, P., Iovi, A. 2009. GFAAS method determination of total chromium in urine. Ovidius University Annals of Chemistry 20: 80-82.
6. Wrobel, K., Lopez-de-Alba, P. L., Lopez-Martinez, L. 1997. Enhanced spectrophotometric determination of chromium (VI) with diphenylcarbazide using internal standard and derivative spectrophotometry. Talanta 44(11): 2129-2136.

177
QUANTIFICATION OF 4 DARK COLORED MOULD FUNGI
BY REAL TIME PCR
Larnøy, E.1
, Hietala, A.M.1 & Gobakken, L. R.1
ABSTRACT
Coated wooden claddings in building facades are widely used in the Scandinavian countries, and are often preferred to other materials. Wood experience an increasing competition from other materials that are less labor intensive at the construction site and materials with less demand for maintenance thru service life, and makes further development of wooden claddings essential. Growth of discoloring moulds on exposed coated wooden claddings is mainly of aesthetic concern, and is especially disfiguring for light-colored surfaces. Growth of surface fungi often initiates repeated cleaning and shorter maintenance intervals, which in turn increase the total cost of ownership for wooden claddings. Cost and effort of ownership is often an important factor considered when choosing a product, and the traditionally good market situation for wooden claddings is therefore threatened. The development of real-time PCR (polymerase chain reaction) and taxon-specific primers has provided new possibilities for specific detection and quantification of fungi in their natural substrates. In qPCR (quantitative real-time PCR), the accumulation of the PCR product is detected for each amplification cycle. An efficient and reproducible sampling and extraction of DNA is required for a high-throughput qPCR based quantification of discoloring fungi. The authors have now adjusted DNA isolation protocols and optimized real-time PCR assays for species specific detection of fungi frequently found on painted surfaces (Aureobasidium pullulans, Alternaria alternata, Cladosporium cladosporides, Ulocladium atrum). Key words: Dark colored mould fungi, real time PCR 1 Researcher, Norwegian forest and landscape institute

178
INTRODUCTION Coated wooden claddings are traditionally widely used in Norway, and are still often preferred to other cladding materials. The increasing competition from other materials that has less input of labour at the construction site and less demands for maintenance is increasing, making further development of wooden claddings essential. On wood and wood-based products in outdoor exposed constructions, disfigurement by mould fungi is one of the main challenges and the most evident treat to the aesthetical service life of the application (Gobakken 2009). Discolouration by fungi is mainly of aesthetic concern, and is especially disfiguring for light-coloured surfaces. Growth of surface fungi often initiates repeated cleaning and shorter maintenance intervals, which in turn increases the total cost of ownership for wooden claddings. Cost and effort of ownership is often an important factor considered when choosing a product, and the traditionally good market situation for wooden claddings is threatened. If the conditions are optimal for fungal growth, fungal colonization is inevitable. The four most important factors for fungal growth are: moisture, temperature, oxygen and nutrients (Ayerst 1969, Adan 1994, Bravery 1985, Carlile et al. 2002, Deacon 2006, Hudson 1986) (Figure 1). The requirements are often different for spore germination and fungal growth (colonization) (Deacon 2006, Hudson 1986). The degree of mould growth on the surface of coated wood is a measure of the substrates susceptibility to mould infestation and is a way of rating the substrates according to quality, treatment, time, climatic factors, workmanship, design etc. Assessing mould growth coverage aesthetically implies that there is a need for quantification to allow objective numeric validation without considerable subjective appraisal. Visual assessment is the traditional and most common way to measure mould growth coverage on the surface of coated wood. Several standards used for this purpose describes a rating scale often from 0-3 or 0-5 where 0 is no growth and 3 or 5 are heavily infested or fully covered. The objectivity of using visual assessment is often questioned (Bardage 2004, Sexton et al. 1993, Van den Bulcke et al. 2006, Van den Bulcke et al. 2005) and there is an interest for finding additional or alternative methods for more objective assessment. Digital image processing has been used by several scientists for assessing mould growth on coated wood with good results (Van den Bulcke et al. 2005, Van den Bulcke et al. 2006, Bardage 1996, Graystone 2002, Terziev 1997, Bardage 1998). DNA-based and spectroscopic techniques are used in several fields of research for qualitative and quantitative identification, and have also been introduced in the field of wood protection and wood durability (Siebert 1995, Alfredsen et al. 2007, Alfredsen et al. 2008, Holme and Jelle 2006, Diem et al. 1999).

179
The development of DNA-based real-time PCR (polymerase chain reaction) and taxon-specific primers has provided new possibilities for specific detection and quantification of fungi in their natural substrates (Hietala et al. 2003). In qPCR (quantitative real-time PCR), the accumulation of the PCR product is detected for each amplification cycle. These highly sensitive techniques have already been applied to quantify plant pathogens in a number of cases (Mumford et al. 2000; Weller et al. 2000; Hietala et al. 2003) and in wood materials (Eikenes et al. 2005). For sensitive and target specific monitoring of phytopathogenic microbes in and on their natural substrates, polymerase chain reaction (PCR) based techniques can be used. Real-time PCR is a promising PCR method for quantifying DNA. The measurements are performed during the exponential phase of the reaction, when PCR efficiency is not influenced by limiting reagents, small differences in reaction components, or cycling conditions. The incorporation of probes increases the specificity relative to traditional PCR and allows the monitoring of several DNA targets in the same reaction tube (multiplex real-time PCR). As a result, real-time PCR has been increasingly used for the quantification of infectious agents. The development of DNA-based real-time PCR and taxon-specific primers has provided new possibilities for specific detection and quantification of fungi in their natural substrates (Hietala et al. 2003). These highly sensitive techniques have already been applied to quantify plant pathogens in a number of cases (Mumford et al. 2000, Weller et al. 2000, Hietala et al. 2003) and in wood materials (Alfredsen et al. 2008, Eikenes et al. 2005). More knowledge of discolouring fungi on surface treated wood is of commercial interest, both with regard to objective evaluation methods and with regard to early prediction of coating performance and increased aesthetic service life. In this study the development of Q-PCR as an objective tool for qualitative and quantitative identification and evaluation of early colonization by discolouring fungi on painted surfaces, in the paint matrix and in the wood was investigated. A sampling technique is under construction and the extraction steps are presently being optimised for Aureobasidium pullulans Cladosporium cladosporiodes, Ulocladium atrum and Alternaria alternata.
MATERIAL AND METHODS DNA isolation To obtain DNA from the four included test fungi, strains representing each were grown aseptically on cellophane-coated malt extract agar plates for 5-7 days. The peeled mycelium was manually ground with a pestle in a liquid nitrogen

180
chilled mortar. The ground powder was stored at -20°C until further processing. For DNA isolation, a 20-mg-aliquot of pulverized mycelium was processed by using the standard protocol #8 (Isolation of DNA from mouse tail) of Easy-DNATM Kit (Invitrogen, Carlsbad, CA, USA). Total DNA was then quantified using micro-volume spectrophotometer NanoDrop 2000 (Thermo Scientific, Wilmington, DE, USA) and a dilution series containing 100, 10, 1, 0.1, 0.01 and 0.001 ng DNA in a volume of 3 µl was prepared as a standard curve for real-time PCR.
qPCR The prepared DNA standard curve samples of Aureobasidium pullulans, Cladosporium cladosporioides, Ulocladium atrum and Alternaria alternata were quantified by using primer/probe sets available in public domain (http://www.epa.gov/microbes/moldtech.htm) and targeting the ITS rDNA gene cluster. All primer and probe concentrations were optimized as recommended by Applied Biosystems (Anonymous 2002). For A. pullulans the ApullF1/R1 forward and reverse primers and ApullP1 probe was employed with 300 nM primer and 100 nM probe concentration. For C. cladosporioides the Cclad1F1/R1 forward and reverse primers and CcladP1 probe was used with 300 nM primer and 150 nM probe concentration. For profiling U. atrum, the forward and reverse primers UatrmF2/R2 and probe UloP1 with 300 nM forward primer concentration, 900 nM reverse primer concentration and 150 nM probe concentration were employed. A. alternata was profiled with 300 nM of forward (AaltrF1) and reverse (AaltrR1) primer and 250 nM probe (AaltrP1) assay. All the probes were TaqMan probes labelled with the reporter dye VIC at 5’ end and with the quencher dye, 6-carboxy-tetramethylrhodamine (TAMRA) at the 3’ end. The primers and probes were ordered from ABI PRISM Primers and TaqMan Probes Synthesis Service. Each 25-µl-PCR reaction for standard curve samples was performed in TaqMan Universal mix by using a 3-µl-volume of the DNA solution as template. Standard PCR cycling parameters, according to ABI Prism 7700 (Applied Biosystems) instrument, were used.
Standard curves Standard curves for the profiled four fungi were constructed based on the relationship of Ct values and known fungal DNA concentrations: the Ct values were plotted against DNA amounts, and regression equations were calculated for the quantification of DNA pools by interpolation in unknown samples.

181
Aureobasidium standard curve
y = -1.4536Ln(x) + 21.193R2 = 0.9996
15
20
25
30
35
0.001 0.01 0.1 1 10
DNA amount (ng)
Ct v
alue
Alternaria standard curve
y = -1.8188Ln(x) + 25.809R2 = 0.9984
20
25
30
35
40
0.001 0.01 0.1 1 10DNA amount (ng)
Ct v
alue
Cladosporium standard curve
y = -1.4439Ln(x) + 19.924R2 = 0.9998
15
20
25
30
35
0.001 0.01 0.1 1 10DNA amount (ng)
Ct v
alue
Ulocladium standard curve
y = -1.5031Ln(x) + 21.923R2 = 0.9999
15
20
25
30
35
0.001 0.01 0.1 1 10
DNA amount (ng)
Ct v
alue
RESULTS
For all the monitored fungi, the real-time PCR assays detected the target DNA in a linear fashion in the range 10 - 0.001ng whereas 100 ng exceeded the linear detection range of the assays (Fig. 1).
Figure 1. Standard curves for the profiled four fungi constructed based on the relationship of Ct values (Ct, cycle threshold, the PCR cycle at which the reporter fluorescence exceeds that of the background) and known fungal DNA concentrations. Note that 100 ng was above the linear detection limit of all the four assays and this data point is not included in the panels.
DISCUSSION
An efficient and reproducible sampling and extraction of DNA is important to achieve qPCR based quantification of discolouring fungi. The authors have tested multiple commercial DNA isolation kits for the four subjected mould fungi and most of them produce very low DNA yields, below 0.25 ng DNA per mg mycelia, and are thus clearly not suitable for this purpose. The melanized and thick cell-wall of the mould fungi is obviously a major obstacle for DNA extraction. In contrast, the now employed mouse tail protocol involving an extended protease treatment at
182
60° is obviously very efficient in extracting DNA from these fungi, the kit yielding 5-40 ng DNA per mg from the mycelia of the tested fungi. In addition to high yield, the DNA solution is free of inhibitors to DNA polymerase and thus this kit is very promising for profiling growth of mould fungi.
As the next step to further optimize DNA extraction for profiling mould fungi, we will test adding of an exogenous reference DNA to each sample upon DNA isolation. It is known that DNA extraction efficiency can vary from sample to sample and between different substrates. Adding a standard amount of reference DNA to experimental samples prior to DNA isolation and normalization of the target DNA yield according to the reference DNA yield has been shown as an effective strategy to control stochastic variation in DNA extractability, since the impact of matrix properties on DNA recovery is similar between all DNA pools present in a system, (Hietala et al. 2009; Pilgård et al. 2010). When the DNA extraction method is optimized, a field test evaluation will be performed on coated wooden claddings that have been exposed outdoors.
Studies of host/decay fungi interaction in living trees show that many fungi have adapted tolerance to phytotoxic host defence compounds such as phenols (Hietala et al. 2009). Increased understanding of the mode of action of various wood coatings and the flexibility present within the various species of microfungi that spoil wood in service is needed for further development and process parameter optimisation of wood protection systems. Since the real-time PCR methodology only acquires very small samples, separate assessment can be executed on the surface, in the paint matrix and in the interface between paint and wood. This will provide detailed information about the colonization progress of mould fungi, knowledge that will be of assist in further modification and development of wood protectants.
CONCLUSIONS It can be concluded from these experiments that with this new protocol, a new tool has been developed for the quantification of Aureobasidium pullulans, Cladosporium cladosporioides, Ulocladium atrum and Alternaria alternata.

183
ACKNOWLEDGEMENTS The authors would sincerely like to thank Sigrun Kolstad for her precise qPCR work. Additionally the authors would like to thank the Norwegian research council for funding the “Enhanced service life for coated wooden facades” project
REFERENCES Adan, O.C.G. (1994). On the fungal defacement of interior finishes. PhD Thesis, Eindhoven University of Technology, Eidenhoven, The Netherlands, 223 pp.
Alfredsen, G., Hietala, A., M., Fossdal, C., G. & Solheim, H. (2007) Molecular methods as a tool within the field of wood protection - available methods and new possibilities. The International Research Group on Wood Preservation, Doc. No.IRG/WP 07-20361.
Alfredsen, G., Pilgård, A. & Hietala, A., M. (2008) A step towards a better understanding of fungal colonization of modified wood - QRT-PCR studies. The International Research Group on Wood Preservation, Doc. No. IRG/WP 08-10653.
Anonymous 2002. TaqMan Universal PCR mastermix. Protocol. Applied Biosystems, Foster City, CA.
Ayerst, G. (1969). Effects of moisture and temperature on growth and spore germination in some fungi. Journal of Stored Products Research, 5: 127-141.
Bardage, S., L. (1996) Colonisation of painted wood by Aureobasidium pullulans – analysis of features and conseguences for failure in service. The International Research Group on Wood Preservation, Doc. No. IRG/WP 96-10144.
Bardage, S. L. (1998) Susceptibility of painted wood to Aureobasidium pullulans: fungal stain and growth patterns. Holz als Roh- und Werkstoff, 56, 359-364.
Bardage, S. L. (2004) Assessment of mould growth. COST E18 - Symposium on
Measurement Methods. 16-17 February. Copenhagen.
Bravery, A.F. (1985). Mould and it controls, Information Paper 11/85, Building Research Establishment, Garston, UK
Carlile, M.J., Watkinson, S.C.& Gooday, G.W. (2002). The fungi. Academic Press, London, UK. Deacon, J.W. (2006). Fungal biology. Blackwell Publishing Ltd., Oxford, UK, 371 pp. Diem, M., Boydston-White, S. & Chiriboga, L. (1999) Infrared Spectroscopy of Cells and Tissues: Shining Light onto a novel Subject. Appl. Spectrosc., 53, 148A-161A.
Eikenes, M., Hietala, A., M., Fossdal, C., G. & Solheim, H. (2005) Comparison of quantitative real-time PCR, chitin and ergosterol assays for monitoring colonization of Trametes versicolor in birch wood. Holzforschung, 59, 568-573.
Gobakken, Lone R. 2009. Surface mould growth on painted and unpainted wood; – influencing factors, modelling and aesthetic service life. Philosophiae Doctor (PhD) Thesis 2009: 32. Dept.

184
of Ecology and Natural Resource Management, Norwegian University of Life Sciences, Ås Norway. ISBN: 978-82-575-0900-2.
Graystone, J. (2002) Quantification of fungal growth using image analysis. COST E18 –High performance wood coatings. Seminar on Bio-deterioration of wood, coating and substrate. 4-5 April. Lisbon
Holme, J. & Jelle, B., P. (2006) Infrared Spectroscopy as a tool for measurements of moulds. NBI Note 84. Report from the R&D programme “Climate 2000”. Norwegian Building Research Institute, Trondheim, Norway.
Hietala A. M., Eikenes, M., Kvaalen, H., Solheim, H. & Fossdal, C. G. (2003) Multiplex Real-Time PCR for Monitoring Heterobasidion annosum Colonization in Norway Spruce Clones That Differ in Disease Resistance. Appl. Environ. Microbiol., 69, 4413-4420.
Hietala, A.M., Nagy, N. E., Steffenrem, A., Fossdal, C. G., Kvaalen, H., Solheim, H. (2009) Spatial patterns in hyphal growth and wood degradation within Norway spruce stems colonized by the pathogenic white-rot fungus Heterobasidion parviporum. Applied and Environmental Microbiology 75: 4069-4078.
Hudson, H.J. (1986). Fungal biology. Edward Arnold Ltd., London, UK, 298 pp.
Mumford R., (2000) Detection of Potato mop top virus and Tobacco rattle virus using a multiplex real-time fluorescent reverse-transcription polymerase chain reaction assay. Phytopathology, 90, 448-453.
Pilgård, A., Alfredsen, G., Hietala, A.M. (2010) Quantification of fungal colonization in modified wood – qPCR as a tool for studies on Trametes versicolor. Holzforschung 64: 645-651.
Sexton, C., M., Maristany, A., G., Brunner, C., C. & Morrell, J., J. (1993) Using image analysis to rate wood stain trials. The International Research Group on Wood Preservation, Doc. No. IRG/WP 93-10034.
Siebert, F. (1995) Infrared spectroscopy applied to biochemical and biological problems.Methods in enzymology 246, 501-526.
Terziev, N. (1997) Fungal discoloration of kiln- and air-dried Scots pine lumber in aboveground testing and its assessment by digital image processing. Forest Products Journal, 47, 43-46.
Van Den Bulcke, J., Van Acker, J. & Stevens, M. (2005) Image processing as a tool for assessment and analysis of blue stain discoloration of coated wood. International Biodeterioration & Biodegradation, 56, 178-187.
Van Den Bulcke, J., Van Acker, J. & Stevens, M. (2006) Assessment of blue-stain resistance according to the EN 152 and a reverse test method using visual and computeraided techniques. International Biodeterioration & Biodegradation, 57, 229-238.
Weller, S. A., Elphinstone, J. G., Smith, N. C., Boonham, N. & Stead, D. E. (2000) Detection of Ralstonia solanacearum Strains with a Quantitative, Multiplex, Real- Time, Fluorogenic PCR (TaqMan) Assay. Appl. Environ. Microbiol., 66, 2853-2858.

185
STUDIES OF STEAM EXPLODED FIBRES
Tupciauskas, R.1, Belkova, L.2 & Gravitis, J.3
A steam explosion treatment was applied to convert grey alder chips to fibrous material. Two vessels of the steam explosion unit were used to receive the exploded fibres. The obtained fibres were pressed to self-binding fibreboard. Structural changes of the chips after the steam explosion were studied by scanning electron microscopy (SEM, Vega TS 5136). Fibre analyzer (L&W) was used to detect changes in measurements of the exploded fibres from the both vessels. Influence on a supermolecular structure of the exploded grey alder fibres polymer components was detected by thermo gravimeter (TGA/SDTA851) and differential scanning calorimeter (DSC822). The studies were necessary to characterise the exploded fibres that were used for the obtaining of the self binding fibreboard.
The images of SEM showed the liberated lignin from the cell wall on the fibres surfaces. The lignin on the fibres surfaces was observed as globular segregated domains, as well as coated by the hemicelluloses film. These natural polymers generated at the steam explosion treatment works as binder during a hot pressing of the fibreboard.
The fibres analysis showed that the smallest particles generally were collected at the second vessel during steam explosion treatment, while the largest particles mostly were collected on the first vessel of the steam explosion unit. This means that the vessels of the steam explosion unit work as fractionation system.
The thermal gravimetric and differential scanning calorimetric curves analyses showed that mass loss of the studied samples was about 25 % and 55 % at the temperature of 300 °C and 360 °C, respectively.
Key words: steam explosion, grey alder fibres, structural changes, thermal properties, fibres measurements.
1 PhD student, Department of Wood Processing, Latvia University of Agriculture, Dobeles 41, Jelgava, LV-3001, Latvia, Tel: +371 26346383, E-mail: [email protected] 2 Researcher, Dr.chem., Latvian State Institute of Wood Chemistry, Dzerbenes 27, Riga, LV 1006, Latvia, Tel: Tel: +371 67551314, Fax: +371 67550635, e-mail: [email protected] 3 Professor, Latvian State Institute of Wood Chemistry, Dzerbenes 27, Riga, LV 1006, Latvia, Tel: Tel: +371 67553137, Fax: +371 67550635, e-mail: [email protected]

186
DENDROLIGHT PANELS PRODUCED FROM ASPEN WOOD
Iejavs, J.1, Spulle, U.2
Last years the reduced weight cell panel with the trade mark of Dendrolight has obtained the wide world identification due both opening new factory in Austria and intention to open a factory of reduced weight cell panel in Latvia. Up to now Dendrolight type cell panels have been produced from the internal layer of spruce solid timber and plywood, solid timber, particleboard or the external layers of other material. The density of panels of this type is reduced by sawing grooves into the internal boards of the solid timber. As a result of it the internal layer obtains cell structure. The research on the reduced weight cell panel made of aspen (Populus tremula L.) wood has been initiated. The reduced weight cell panel of different types has wide application in furniture industry, internal cladding, door production, transport manufacturing industry and construction panel production as well. The essential importance of the research is to make out the usage possibilities of aspen wood which is a common broad-leaved tree in Latvia as an alternative material for spruce in production of the reduced weight cell panel. The aim of the research: to investigate the physical and mechanical properties of aspen cell panel covered by aspen and plywood. In the production of Dendrolight type panel from aspen wood the following raw materials were used: finger jointed aspen half-finished product - for aspen internal layer producing; finger jointed aspen half-finished product and three - layer birch plywood for external layer producing. There were used adhesives of two types for internal and external layer gluing: polyurethane adhesive DANA PU 2116 and polyvinyl acetate adhesive DANAFIX 447. The test of the newly obtained aspen panel was carried out in accordance with the current test standards for panel and timber tests. The following panel parameters were determined: moisture content (LVS EN 322), density (LVS EN 323), swelling in thickness after immersion in water (LVS EN 312), tensile strength (LVS EN 319), three-point bending strength and modulus of elasticity (LVS EN 310), four-point bending strength (LVS EN 408 p.13).
Relevant conclusions: Dendrolight type panels produced from aspen wood obtain the average density of 325 kg m-3 (external layer of aspen wood) and 358 kg m-3 (external layer of plywood). There are 2 % thickness swelling of aspen cell panels after 24 hour immersion in water, identical as spruce cell panels, with spruce external layer. There are good correlation between three-point bending strength and modulus of elasticity. With good results aspen wood can be used in reduces weight cell panel production.
Key words: dendrolight, aspen, panel. 1 PhD student, Department of Wood Processing, Forest Faculty, Latvia Univesity of Agriculture, LV-3001, Latvia, Jelgava, Dobeles iela 41, Tel: +371 29847056, Fax: +371 63010609, E-mail: [email protected] 2 Asoc. Prof., Department of Wood Processing, Forest Faculty, Latvia Univesity of Agriculture, LV-3001, Latvia, Jelgava, Dobeles iela 41, Tel: +371 29548959, Fax: +371 63029184 , E-mail: [email protected]

187
INFLUENCE OF CELLULOSE CONTENT ON RHEOLOGICAL AND MECHANICAL PROPERTIES OF POLY(LACTIC)
ACID/CELLULOSE AND LDPE/CELLULOSE COMPOSITES
Šumigin, D.1
, Tarasova, E.2, Meier, P.3
Landfills around the world are full of plastics and packaging materials, some of which may take decades or longer to completely break down. Plastics made from biodegradable polymers are much better for the environment compared to petroleum based/synthetic composites, because they break down substantially faster.
In recent years, the uses of natural fibres as the fillers for biodegradable/synthetic polymers have been increased. Cellulose is one of the prospective fillers to different polymers due to its reduced weight, relatively good stiffness and strength along with a low cost and ease of disposal.
In our work we prepared the cellulosic composites on the base of natural poly(lactic) acid (PLA) and synthetic low-density polyethylene (LDPE). The studied composite materials were manufactured with a twin-screw extruder. The extruded compound was compression moulded to test samples. The weight content of cellulose in PLA/cellulose and LDPE/cellulose composites was varied.
Effect of a small addition of cellulose on the rheological and tensile properties was studied. Tensile tests showed that the incorporation of cellulose into PLA or LDPE matrix lead to stiffer but slightly more brittle and weaker materials, since Young’s modulus increases and tensile strength and elongation at break decrease a little. Mechanical results are in agreement with rheological behaviour: the composites exhibit an improvement in the storage and loss moduli of composites compared with matrix polymers. The composite viscosity increases with cellulose content in the same manner as loss and storage moduli.
The processing and material properties of PLA/cellulose composites were compared with those of LDPE/cellulose composites.
Key words: cellulose, poly(lactic) acid, biocomposites.
1 PhD student, Faculty of Chemical and Materials Technology, Tallinn University of Technology, 19086 Tallinn, Tel: +372 55 528 154, E-mail: [email protected] 2 Senior Research Scientist, Faculty of Chemical and Materials Technology, Tallinn University of Technology, 19086 Tallinn, Tel: +372 620 2904, E-mail: [email protected] 3 Associate professor, Faculty of Chemical and Materials Technology, Tallinn University of Technology, 19086 Tallinn, Tel: +372 6202910, Fax: +3726202020, E-mail: [email protected]

188
COST-EFFECTIVE ANALYSIS OF SCOTS PINE STILBENES Harju, A. 1, Venäläinen, M.1, Partanen, J.1, Jääskeläinen, A.-S.2, Hatakka, R.2, Kivioja,
A.2, Tapanila, T.3
, Tanner, J. 3 & Kilpeläinen, P.3
Extractives of bark, heartwood, knots and wounded xylem provide defense for living trees. In Scots pine (Pinus sylvestris L.) heartwood the most important groups of defensive extractives are stilbenes, which consist of pinosylvin and its etherified derivatives. These extractives also make the timber naturally durable against biodegradation caused by fungi and bacteria. Heartwood timber with high stilbene content could serve well in applications where decay resistance is needed. Due to high among-tree variation in stilbene concentration, grading of heartwood timber is needed. The target of our study is to develop and test a fast and nondestructive methodology (UV resonance Raman spectroscopy) to measure the stilbene concentration from solid wood substrate. The methodology could be applied, besides as a research tool, also in practice for example to evaluate the amount and quality of the natural heartwood resources, to grading of timber to produce higher value wood products, and in selecting trees for tree improvement.
Scots pine material originates from progeny tests of Metla (Finnish Forest Research Institute). The method of the chemical (GC-MS) analyses have been fine-tuned and performed in Metla’s Laboratory, and the optical (UVRRaman) analyses at the Aalto University.
Key words: Heartwood, extractives, gas chromatography, UV resonance Raman spectroscopy, grading
1 Finnish Forest Research Institute, Punkaharju Unit, Finlandiantie 18, FI-58450 Punkaharju, Tel: +358 10 2111 (central), Fax: +358 211 4201, E-mail: [email protected], [email protected], [email protected] 2 Aalto University, Department of Forest Products Technology, P.O. Box 16300, 00076 Aalto, Tel: +358 9 47001 (central), Fax: +358 9 470 22017, E-mail: [email protected], [email protected], [email protected] 3 Finnish Forest Research Institute, Vantaa Unit, P.O. Box 18, FI-01301 Vantaa, Tel: +358 10 2111 (central), Fax: +358 10 211 2202, E-mail: [email protected], [email protected], [email protected]

189
IMPACT OF TEMPERATURE AND GRAIN ANGLE ON THE VELOCITY OF SOUND IN MODIFIED OAK WOOD
Zaleckis, E.1 & Ukvalbergienė, K.2
Wood modification is carried out in order to improve wood properties or to change its color, aesthetic appearance or design. In addition, there are also changes in wood physical and mechanical properties. When modified with ammonia, wood without vivid texture gains a wide spectrum of colors. Furthermore, while being under moist conditions, wood deformation properties tend to improve, density seems to increase and wood acquires plastic properties. However, in addition to the mentioned advantages, there are number of disadvantages as well. Ammonia breaks down cellulose microfibriles into elementary fibriles, which results in cell walls containing water soluble materials. Wood modified with ammonia tends to absorb larger quantities of moisture than natural wood.
Ultrasound velocity is considered as very sensitive to wood structure variation. Its numeric value depends on many factors: wood species, moisture content, grain angle, temperature, density, etc.
In this work the impact of temperature and grain angle on the velocity of sound in ammonia modified oak (Quercus robur) was studied. For measurements special non-destructive test method was used. Temperature influences elastic and damping properties of wood. Consequently, as temperature increases sound velocity decreases. As wood is elastic anisotropic material its` response depends on the direction of the applied stress. Properties parallel to the grain differ considerably from the properties in the transverse direction. In this research measurements were made in three perpendicular directions: longitudinal along grain, radial towards to the growth rings and tangential to the annual rings. Herewith the impact of temperature was evaluated.
Key words: wood, temperature, grain angle, velocity of sound
1 Master Student, Department of Wood Technology, Kaunas University of Technology, Studentu str. 56, LT-51424 Kaunas, Tel: +370 37 353863, Fax: +370 37 353863, E-mail: [email protected] 2 University Lecturer, Department of Wood Technology, Kaunas University of Technology, Studentu str. 56, LT-51424 Kaunas, Tel: +370 37 353863, Fax: +370 37 353863, E-mail: [email protected]

190
ALTERNATIVE WOOD PRESERVATIVE SYSTEMS IN A COMBINED IMPREGNATION PROCESS (CIP)
Liibert, L.1, Treu, A.2, Meier, P.3
A range of studies has shown that Royal treated wood can provide excellent protection against weathering and decay fungi. This treatment combines the protective properties of a wood protection agent and the hydrophobic properties of a subsequent oil treatment in a wood product.
Copper-based wood preservatives, which are tradidionally used in CIP, are very effective but their long-term future use is questionable because of environmental issues, especially the toxicity against marine organisms. There is a need for new eco-friendly wood preservative systems for a use in CIP.
The substitutes for copper used in this study are natural polymers and organic biocides. The aim of this research is to describe the fixation and antifungal effectiveness of the following compounds: CX-8, Chitosan, Scanimp, Tannin, fire protection agent.
The scots pine sapwood samples (50x25x15mm) were impregnated and oil treated. The treated products were analysed for their preservative-and oil-retention. Preservative fixation time influence on oil treatment was tested. The treated samples were leached according to EN84. Water samples were analyzed for the amount of active ingredient. After leaching the samples were exposed to fungal attack by Coniophora puteana and Trametes versicolor according to EN113. Treated samples without oil showed less performance against fungi, especially tannin and chitosan.
Key words: copper, chitosan, tannin, scots pine sapwood, leaching, EN113
1 Master student, Department of Polymer Materials, Tallinn University of Technology, Tallinn, Estonia. Email: [email protected] 2 Norwegian Forest and Landscape Institute, Section Wood technology, Ås, Norway. Email: [email protected] 3 Department of Polymer Materials, Tallinn University of Technology, Tallinn, Estonia. Email: [email protected]

191
HOW DOES SAMPLE POSITION AFFECT THE LEACHABILITY OF WOOD PRESERVATIVES
Kängsepp, K.1 & Larnøy, E.2 & Meier, P.3
As we move towards more and more eco-friendly society, the wood industries must also adjust to new rules and restrictions. Even though new and greener solutions have been introduced, the leaching of wood preservatives into the nature is still a problem, especially agents that consist copper. Several studies have been conducted on the raw material`s influence on impregnability and it has been found that large variations in sapwood penetration exist which affect a homogeneous distribution of preservatives. This gives reason to believe that the leaching of wood preservatives is also influenced by the raw material. To ensure better economic process conditions which also apply environmentally safe protective agents, it is important to understand material features that influence permeability, retention and leaching of the impregnation agents. This study tries to set the variation of leachability of copper in system, evaluating both the origin of a tree and the origin of a sample.
Samples of scotch pine sapwood (Pinus Sylvestris) (20x20x50mm) are treated with the wood protection agents Wolmanit CX-8 and Tanalith. The variation in leachability within trees, between trees and between different stands of Scots pine (from Norway and Denmark) is studied. Within this material, it is possible to trace the individual sample to its original position in the stem. Samples are climatised, impregnated with preservatives and leached according to standard EN_84. Water samples are then sent to ICP machine (Iductively Coupled Plasma Technique) to analyze copper content in the leachates.
Key words: copper-containing wood preservatives, leaching, EN_84
1 Master student, Faculty of Chemical and Materials Technology, Tallinn University of Technology, Tallinn, Estonia. E-mail: [email protected] 2 Norwegian Forest and Landscape Institute, Section Wood Technology, Ås, Norway. E-mail: [email protected] 3 Associate professor, Faculty of Chemical and Materials Technology, Tallinn University of Technology, Tallinn, Estonia. E-mail: [email protected]

192
EFFECT OF BIRCH VENEER PROCESSING FACTORS ON ADHESIVE BOND STRENGTH DEVELOPMENT
M. Piirlaid1 A. Rohumaa2
, M. Matsi1, M. Hughes2 and P. Meier1
Birch (Betula pendula) is a hardwood which has been used in plywood manufacturing for a long time. The quality of the plywood depends on veneer and plywood processing factors as well as the type of adhesive used. The phenol-formaldehyde (PF) resin was the first synthetic resin used in plywood production and it is still used in the plywood bonding process. The main target of the present study was to evaluate the effect of veneer processing parameters on bond development with PF resin. To evaluate the quality of the adhesive bond in plywood by standard testing methods is laborious and time consuming. This study concentrates on the use of the Automated Bonding Evaluation System (ABES) as an alternative. ABES is miniature hot-pressing device which is equipped with a shear strength testing unit. It is a compact system which allows precise control of the pressing parameters and at same time evaluation of the shear strength properties of the bonds obtained. ABES has been used mainly in studies to characterise the adhesive curing process. The results show that the hydrothermal pre-treatment, drying temperature and the moisture content of veneer has an effect on bond strength development between Birch veneer and PF adhesive.
1 Tallinn University of Technology, Ehitajate tee 5, 19086 Tallinn, Estonia 2 Aalto University School of Science and Technology, P.O.Box 16400, FI-00076 Aalto, Finland

193
ASSESSING THE POTENTIAL OF FURAN POLYMER-BASED RESIN DEVELOPMENT IN BONDED VENEER PROCESSING FACTORS ON
ADHESIVE BOND STRENGTH
M. Matsi1, A. Rohumaa2
M. Piirlaid1, M. Hughes2 and P. Meier1
Plywood manufacturing has so far mostly used phenol-formaldehyde (PF) and urea (UF) resins. Nowadays there is a big demand for environmental friendlier substances, because at this moment widely used resins contain toxic and carcinogenic compounds. Also environmental friendlier substances are key to the future. Therefore studies are being conducted to find new and nontoxic resins. The present study concentrates on a resin system which does not contain formaldehyde and can be applied in the plywood production process without a reduction in strength compared with PF resin. A potential alternative is a furan polymer-based resin. Furan resin has been tested with several different modifications (three different amounts of catalyst) with Automated Bonding Evaluation System (ABES) at different curing temperatures and times. ABES is small precise device equipped with a miniature hot-press and testing device. It is a compact system providing the opportunity to control pressing parameters and measuring the shear strength for overlapped veneer specimens. The test results on Birch (Betula pendula) veneers show that furan resin can achieve comparable strength properties with PF resin. The difference is that furfural resin with certain amount of catalytic agent needs higher pressing temperature than pure PF resin, to obtain almost the same shear strength.
1 Tallinn University of Technology, Ehitajate tee 5, 19086 Tallinn, Estonia 2 Aalto University School of Science and Technology, P.O.Box 16400, FI-00076 Aalto, Finland

194
ANALYTICAL CONTROL OF THE PROCESS OF PREPARING LIGNOCELLULOSE FOR OBTAINING LEVOGLUCOSAN
A. Pazhe, M. Puke, J. Zandersons
The yield of the main product of the thermal destruction of cellulose - 1,6-anhydro-β,D-glucopyranose or levoglucosan (LG) in the fast thermolysis of hardwood increases several times, if pre-hydrolysis of wood in the presence of a sulphuric acid catalyst at the temperature 150 -155°C is carried out, thereby achieving the hydrolysis of the main part of hemicelluloses. The lignocellulose (LC) obtained after washing are also the LG raw material. In the study, the chemical composition of the intermediate products formed in the technological process of preparing LC as well as the degree of polymerisation (DP) of cellulose in wood and the obtained LC are investigated. A possible correlation between the DP and the LG yield is discussed. The component composition is determined, and the applicability and purification potentialities of the obtained intermediate products – prehydrolysis condensates and LC washing waters are evaluated.
The pre-hydrolysis process condensate contains a considerable amount of acetic acid and furfural, namely, 5% and 12% from the oven dry wood mass, respectively. The obtained LC chips are washed with water till the pH 2.0-2.2 or the H2SO4 concentration from oven dry LC about 0.1% from its mass. 19-21% of oven dry wood organic substances, from which 78-88% are monosaccharides, are diluted in the washing waters. After the washing, the LC yield is 52-55% in terms of oven dry wood.
During the pre-hydrolysis, as a result of the action of sulphuric acid and elevated temperature, the DP of cellulose decreased from 1800-1900 in alder wood to 1200-1400 in LC. Comparing the LG yields from Kuerschner cellulose preparations prepared from the initial wood and LC, a considerably higher LG yield is obtained from the latter.
The thermolysis with the corresponding wood and LC samples, carried out in parallel, has shown that the acid-treated material (LC) demonstrated considerably higher LG yields, which, taking into account the cellulose content in LC (45-55%), actually correspond to the LG yield from the corresponding Kuerschner cellulose preparation. The use of the condensate for obtaining furfural and acetic acid is technically feasible. The applicability of the LC washing waters is still under study, although they do not present any problems in the wastewater biological treatment facilities.
Latvian State Institute of Wood Chemistry, 27 Dzerbenes Str., LV-1006 Riga, Latvia, e-mail: [email protected]

195
INFLUENCE OF TEMPERATURE ON LIGNIN COAGULATION WITH ALUMINUM CLORIDE IN
WASTEWATER TREATMENT
Brovkina, J.1, Shulga, G.2, Ozolins, J.3
Latvia is the biggest producer of plywood in Eastern Europe. One of the stages of raw material preparation for plywood producing is hydrothermal treatment of birch wood. Wastewater from plywood hydrothermal basin is characterized by the high degree of contamination. The basic contaminating component of this wastewater is lignin, which is the main reason of a high level of chemical oxygen demand (COD) and color of water. Insufficient efficiency of purification of lignin wastewater requires the development of advanced coagulation methods. It is known that the coagulation process is affected by its conditions, among which a temperature of wastewater plays a significant role. It has been assumed that the correct choice of this parameter can considerably improve the process of purification of lignin wastewater from hydrothermal basin, using chemical coagulants. The main objective of the present study is to investigate the influence of temperature on birch lignin coagulation in the model solution, which imitated the wastewater of hydrothermal basin of plywood industry. The wastewater samples at different temperatures (3, 22 and 70oC) were prepared by refrigeration and by warming in a water bath, respectively. The coagulation process was produced by mixing wastewater and water solutions of aluminum chloride with different concentrations. The efficiency of the coagulation within a pH range 3-10 was determined after 2 h of settling and filtration of the system. The method of spectrophotometry was used for determination of a remaining concentration of dissolved solids in a filtrate. COD was measured by total chemical oxidation of the received filtrate by adding potassium dichromate (LVS ISO 6060:1989). The color of the filtrate was determined by the method of photometry at the wavelength 436 nm. The results were related to the Pt – Co reference solutions (ISO 7887:1994). The optimum dosage of aluminum chloride and pH value for the model solution treatment at a temperature 3°C are 400 mg/l and 6.0, respectively, at which 37.2% reduction of COD, 80.0% of dissolved solids removal and 32.8% of color reduction are obtained. The conducted experiments at varying temperatures have demonstrated that, with increasing a treatment temperature, contaminant removal is enhanced. For the model solution with a temperature 22°C, the optimum aluminum chloride dosage is 130 mg/l and optimum pH is 6.0. Applying these parameters, 45.1% of COD decrease, 1 PhD student, Laboratory of Lignin Chemistry, Latvian State Institute of Wood Chemistry, 27 Dzerbenes Str., LV 1006, Riga, Latvia, Tel:+37126744945, E-mail: [email protected] 2 Dr.habil.chem, Laboratory of Lignin Chemistry, Latvian State Institute of Wood Chemistry, 27 Dzerbenes Str., LV 1006, Riga,Latvia, Tel:+37167545139, E-mail: [email protected] 3 Professor, Faculty of Material Science and Applied Chemistry, Riga Technical University, Azenes 14/24, LV 1658, Riga, Latvia, Tel: +37129241368, E-mail: [email protected]

196
82.1% of dissolved solids removal and 62.7% of color reduction are obtained. It should be noted that, for the model solution treatment at a temperature 70°C, the optimum aluminum chloride dosage decreases fourfold in comparison with the treatment at 3oC.The system showed the highest efficiency in terms of decrease of COD (54.2%), removal of the dissolved solids (85.7%) and reduction of color (69.0%). Acknowledgement. The researches leading to these results have received funding from the Latvian Council of Science for a grant no 09-1610c, the European Community's Seventh Framework Programme (FP7/2007-2013) under grant agreement n° 203459, as well as from the European Social Fund within the project „Support for the implementation of doctoral studies at Riga Technical University”.