Talaat Mostafa Group Holding Companytalaatmoustafagroup.com/Portals/0/TMG Presentation.pdf ·...
39
Company Logo Talaat Mostafa Group Holding Company Group Presentation M h 2010 March 2010
Transcript of Talaat Mostafa Group Holding Companytalaatmoustafagroup.com/Portals/0/TMG Presentation.pdf ·...
CompanyLogo
Talaat Mostafa Group Holding Company
Group Presentation
M h 2010March 2010
Safe Harbour Statement
CompanyLogo
Certain information disclosed in this presentation consists of forward looking statements reflecting the current view of thecompany with respect to future events and are subject to certain risks uncertainties and assumptions Many factors couldcompany with respect to future events, and are subject to certain risks, uncertainties and assumptions. Many factors couldcause the actual results, performance or achievements of the company to be materially different from any future results,performance or achievements that may be expressed or implied by such forward looking statements, including worldwideaccount of trends, economic and political climate of Egypt, the Middle East, and changes in business strategy and variousother factors. Should one or more of these risks or uncertainties materialize or should underlying assumptions provei t t l lt t i ll f th d ib d i h f d l ki t t tincorrect, actual results may vary materially from those described in such forward looking statements.
2
Outline
G C P fil CompanyLogoTMG Corporate Profile
TMG at a Glance
Projects Development, Achievements and Growth ProspectsProjects Development, Achievements and Growth Prospects
Share Data
Board of Directors and Corporate Governance, Executive Team and Business Partners
Strategy and Business Model, Quality Control and Operating Systems
Market and Operational ReviewMacroeconomic Indicators Real Estate Drivers Tourism DriversMacroeconomic Indicators, Real Estate Drivers, Tourism Drivers
Financial and Operational Review, Hotels & Resorts Operational Review
Future GrowthReal Estate Development Plans And Projects Progress
Real Estate Future Growth
Hotels & Resorts Future Growth
Investment and Risk Considerations
G C P fil CompanyLogoTMG Corporate Profile
TMG at a Glance
Projects DevelopmentProjects Development
Achievements and Growth Prospects
Share Data
Board of Directors and Corporate Governance
Executive Team and Business Partners
Strategy and business modelStrategy and business model
Quality Control and Operating Systems
TMG
A f l 20 t k d i hi h 8 5 f
TMG at a GlanceCompany
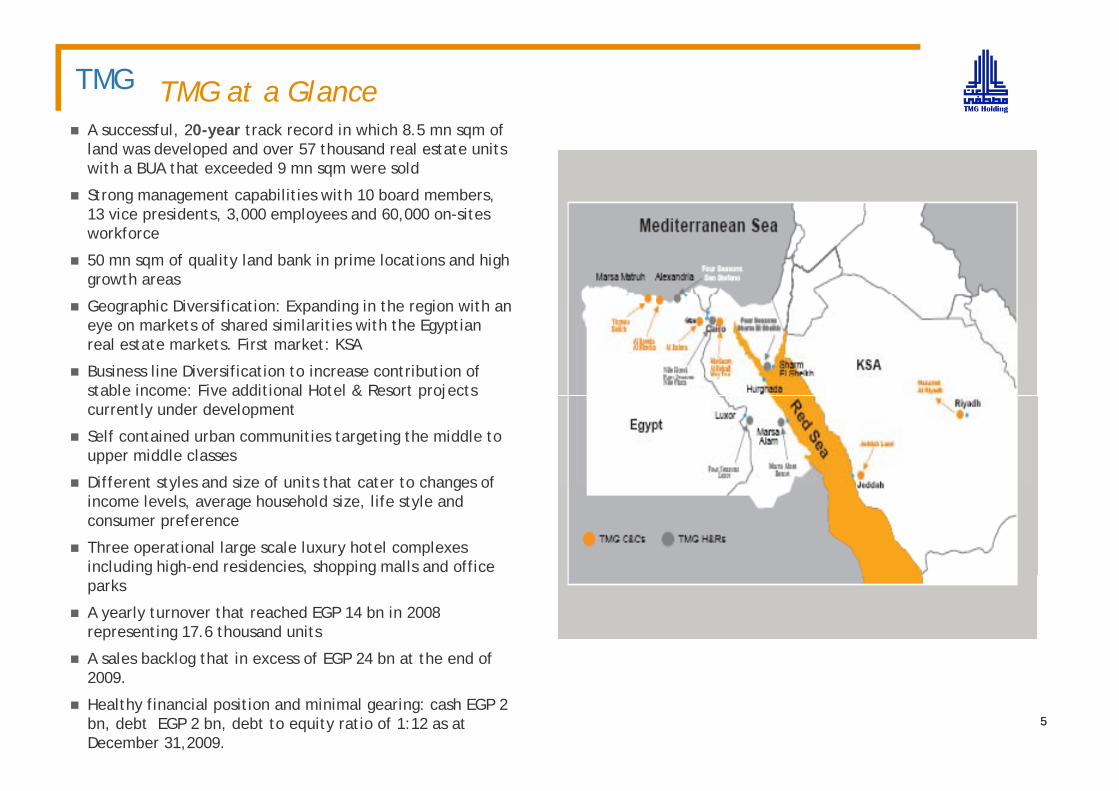
LogoA successful, 20-year track record in which 8.5 mn sqm of land was developed and over 57 thousand real estate units with a BUA that exceeded 9 mn sqm were sold
Strong management capabilities with 10 board members, 13 vice presidents 3 000 employees and 60 000 on-sites 13 vice presidents, 3,000 employees and 60,000 on sites workforce
50 mn sqm of quality land bank in prime locations and high growth areas
Geographic Diversification: Expanding in the region with an Geographic Diversification: Expanding in the region with an eye on markets of shared similarities with the Egyptian real estate markets. First market: KSA
Business line Diversification to increase contribution of stable income: Five additional Hotel & Resort projects stable income: Five additional Hotel & Resort projects currently under development
Self contained urban communities targeting the middle to upper middle classes
Different styles and size of units that cater to changes of Different styles and size of units that cater to changes of income levels, average household size, life style and consumer preference
Three operational large scale luxury hotel complexes including high-end residencies, shopping malls and office g g pp gparks
A yearly turnover that reached EGP 14 bn in 2008 representing 17.6 thousand units
A sales backlog that in excess of EGP 24 bn at the end of
55
g2009.
Healthy financial position and minimal gearing: cash EGP 2 bn, debt EGP 2 bn, debt to equity ratio of 1:12 as at December 31,2009.
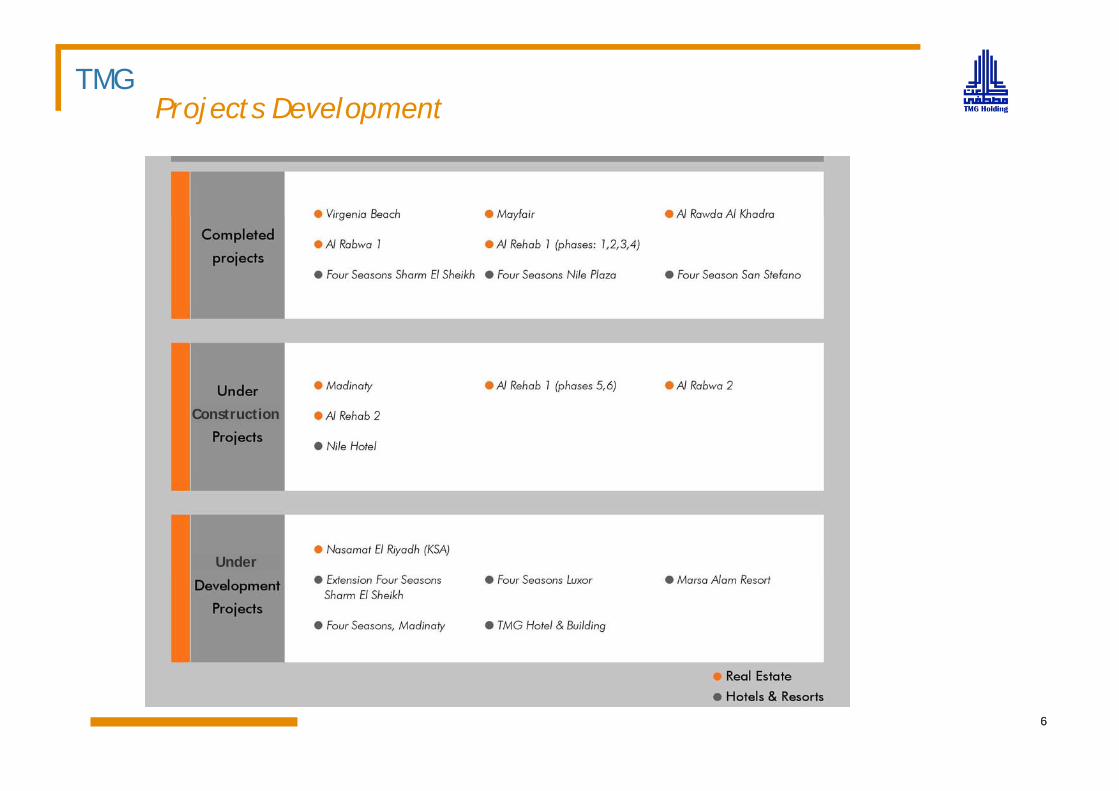
TMGProjects Development
CompanyLogo
Construction
Under
66
TMG
A hi t CompanyLogo
2.6% 0.2%1.1%0 8%
0.5%
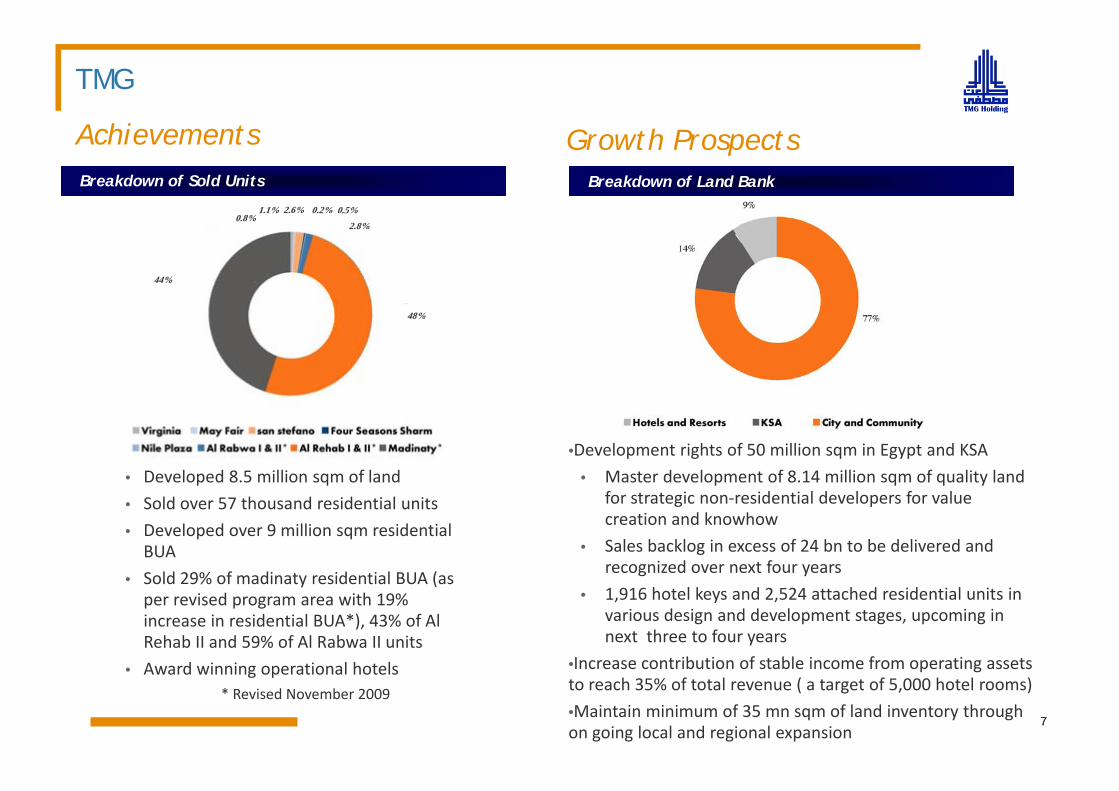
AchievementsBreakdown of Sold Units Breakdown of Land Bank
Growth Prospects
44%
2.8%0.8%
48%
• Developed 8.5 million sqm of land
•Development rights of 50 million sqm in Egypt and KSA
• Master development of 8.14 million sqm of quality land p q
• Sold over 57 thousand residential units
• Developed over 9 million sqm residential BUA
S ld 29% f di t id ti l BUA (
p q q yfor strategic non‐residential developers for value creation and knowhow
• Sales backlog in excess of 24 bn to be delivered and recognized over next four years
• Sold 29% of madinaty residential BUA (as per revised program area with 19% increase in residential BUA*), 43% of Al Rehab II and 59% of Al Rabwa II units
A d i i ti l h t l
g y
• 1,916 hotel keys and 2,524 attached residential units in various design and development stages, upcoming in next three to four years
•Increase contribution of stable income from operating assets
77
• Award winning operational hotels* Revised November 2009
•Increase contribution of stable income from operating assets to reach 35% of total revenue ( a target of 5,000 hotel rooms)
•Maintain minimum of 35 mn sqm of land inventory through on going local and regional expansion
TMGShare DataCompany
Logo
TMG RE & TourismOther major
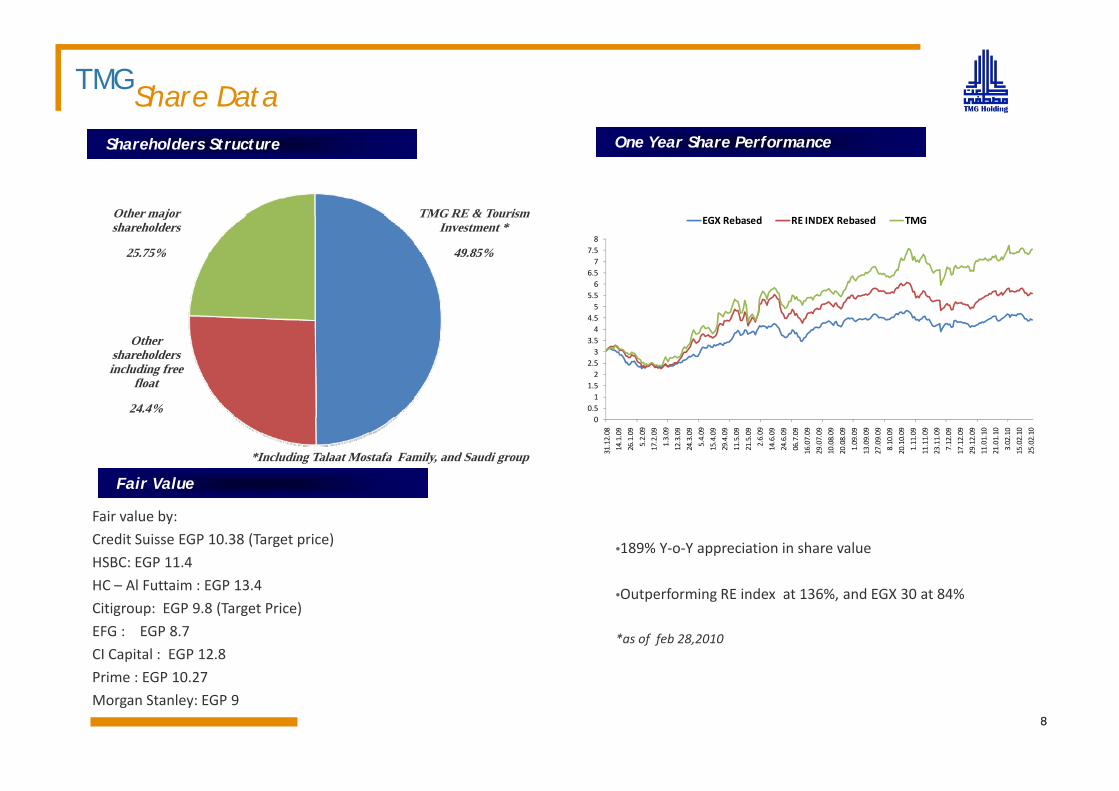
Shareholders Structure One Year Share Performance
TMG RE & Tourism Investment *
49.85%
Other major shareholders
25.75%
55.56
6.57
7.58
EGX Rebased RE INDEX Rebased TMG
Other shareholders including free
float1
1.52
2.53
3.54
4.55
24.4%
*Including Talaat Mostafa Family, and Saudi group
Fair Value
00.51
31.12.08
14.1.09
26.1.09
5.2.09
17.2.09
1.3.09
12.3.09
24.3.09
5.4.09
15.4.09
29.4.09
11.5.09
21.5.09
2.6.09
14.6.09
24.6.09
06.7.09
16.07.09
29.07.09
10.08.09
20.08.09
1.09.09
13.09.09
27.09.09
8.10.09
20.10.09
1.11.09
11.11.09
23.11.09
7.12.09
17.12.09
29.12.09
11.01.10
21.01.10
3.02.10
15.02.10
25.02.10
•189% Y‐o‐Y appreciation in share value
Fair value by:
Credit Suisse EGP 10.38 (Target price)
HSBC: EGP 11.4
Fair Value
•Outperforming RE index at 136%, and EGX 30 at 84%
*as of feb 28,2010
HC – Al Futtaim : EGP 13.4
Citigroup: EGP 9.8 (Target Price)
EFG : EGP 8.7
CI Capital : EGP 12.8
88
Prime : EGP 10.27
Morgan Stanley: EGP 9
Board of Directors and Corporate GovernanceTMG
CompanyLogo
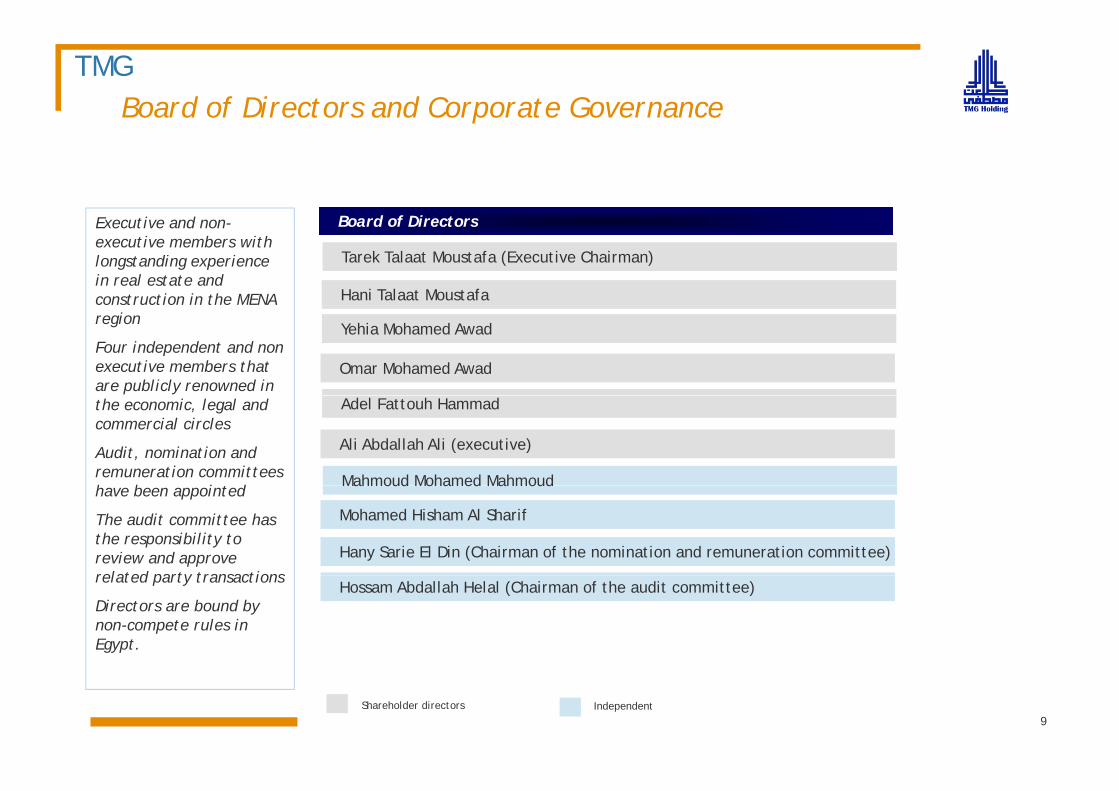
B d f Di t Executive and non-executive members with longstanding experience in real estate and construction in the MENA
Board of Directors
Hani Talaat Moustafa
Tarek Talaat Moustafa (Executive Chairman)
region
Four independent and non executive members that are publicly renowned in
Yehia Mohamed Awad
Omar Mohamed Awad
the economic, legal and commercial circles
Audit, nomination and remuneration committees h b i d
Mahmoud Mohamed Mahmoud
Adel Fattouh Hammad
Ali Abdallah Ali (executive)
have been appointed
The audit committee has the responsibility to review and approve related party transactions
Mahmoud Mohamed Mahmoud
Mohamed Hisham Al Sharif
Hany Sarie El Din (Chairman of the nomination and remuneration committee)
related party transactions
Directors are bound by non-compete rules in Egypt.
Hossam Abdallah Helal (Chairman of the audit committee)
Shareholder directors Independent9
Executive Management
TMG
CompanyLogo
Executive Management
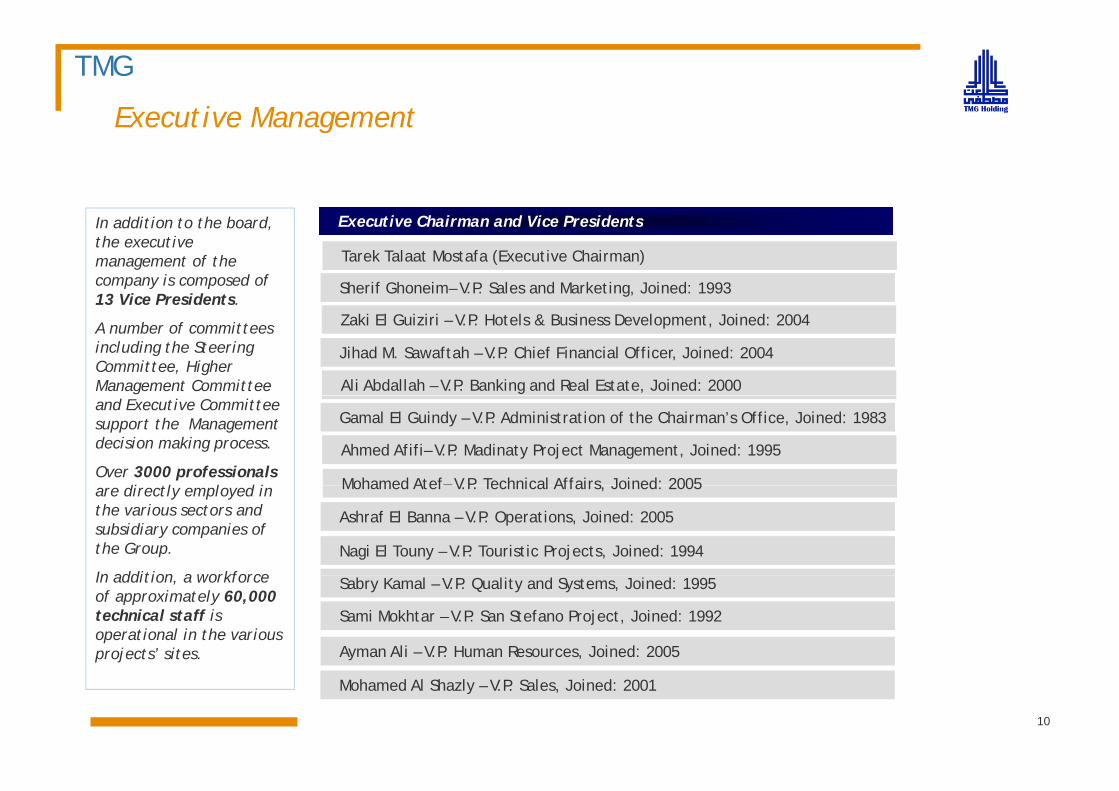
E ti Ch i d Vi P id t In addition to the board, the executive management of the company is composed of 13 Vice Presidents.
Executive Chairman and Vice Presidents
Sherif Ghoneim– V.P. Sales and Marketing, Joined: 1993
Tarek Talaat Mostafa (Executive Chairman)
A number of committees including the Steering Committee, Higher Management Committee
Zaki El Guiziri – V.P. Hotels & Business Development, Joined: 2004
Ali Abdallah – V.P. Banking and Real Estate, Joined: 2000
Jihad M. Sawaftah – V.P. Chief Financial Officer, Joined: 2004
and Executive Committee support the Management decision making process.
Over 3000 professionals di l l d i Mohamed Atef– V P Technical Affairs Joined: 2005
Ahmed Afifi– V.P. Madinaty Project Management, Joined: 1995
Gamal El Guindy – V.P. Administration of the Chairman’s Office, Joined: 1983
are directly employed in the various sectors and subsidiary companies of the Group.
In addition a workforce
Mohamed Atef V.P. Technical Affairs, Joined: 2005
Ashraf El Banna – V.P. Operations, Joined: 2005
Nagi El Touny – V.P. Touristic Projects, Joined: 1994
In addition, a workforce of approximately 60,000 technical staff is operational in the various projects’ sites.
Sami Mokhtar – V.P. San Stefano Project, Joined: 1992
Sabry Kamal – V.P. Quality and Systems, Joined: 1995
Ayman Ali – V.P. Human Resources, Joined: 2005
Mohamed Al Shazly – V.P. Sales, Joined: 2001
10
Business Partners
TMG
CompanyLogo
Th F S d K i ki i t ti ll t bl g t h i f h t l
Business Partners
The Four Seasons and Kempinski :internationally reputable management chains of our hotels
A Joint Venture with Hill International for projects management
A joint venture with Al Mehedeb, Al Fawzan and Al Kahtani through Al Oula for Real Estate S.A.E, Local Saudi Partners for Saudi Developments
Top class worldwide contractors, master planners, designers of projects components and execution:
Main contractor for our projects as Joannou and paraskavides, Hundai, Murray and Roberts and Binladen
The master planning of madinaty was made by a group of consulting firms from the United States: Sasaki, SWA and HHCP and their Egyptian counterparts Cairo Group for planning and architecture
Architects as HKS, USA for sharm extension design WZMH, Canada for luxor design, Studio sergi, Italy for marsa alam design
MEP companies as MMM Canada for sharm extension
I t i d i i GA UK f LInterior design companies as GA, UK for Luxor
Signature golf courses designers as Robert Trent Jones II and HHCP Design International
1111
TMGStrategy and Business Model Company
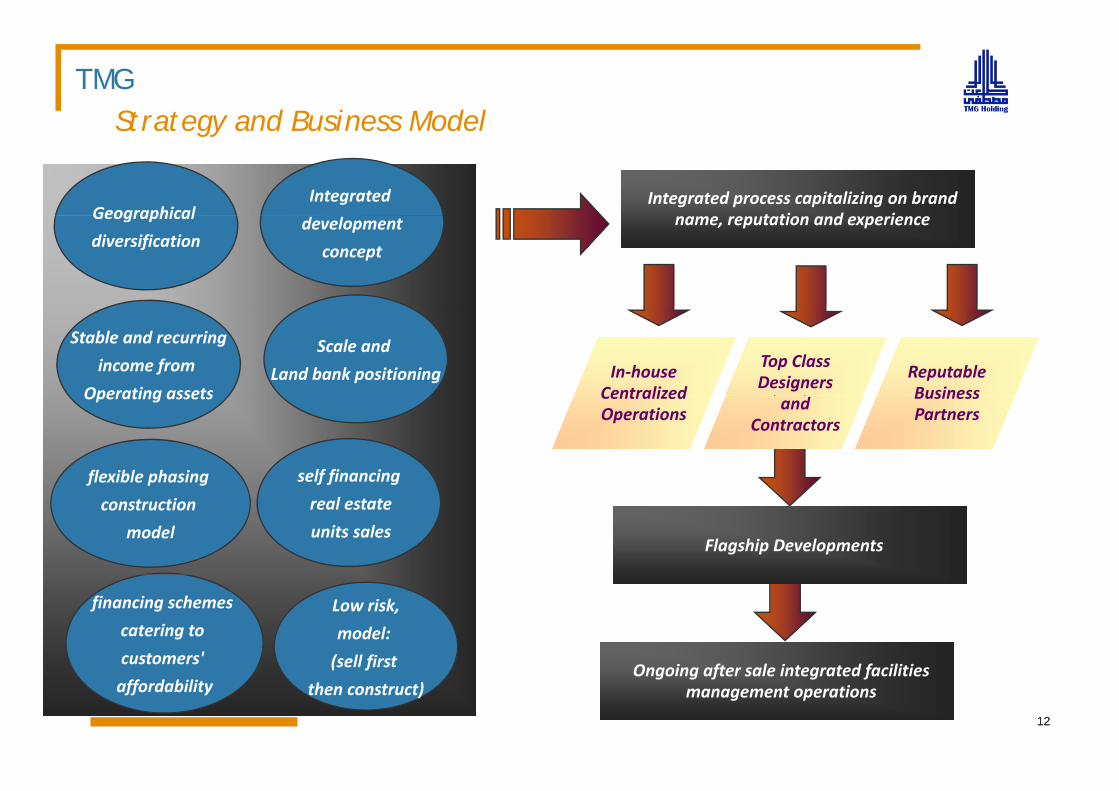
LogoStrategy and Business Model
Integrated Integrated process capitalizing on brand t ti d i
Integrated process capitalizing on brand t ti d iGeographical development
concept
name, reputation and experiencename, reputation and experienceGeographical
diversification
In‐houseCentralized
Stable and recurring
income from
Operating assets
Top Class Designers Reputable
Business
Scale and
Land bank positioning
flexible phasing
Centralized Operations
self financing
Operating assets and Contractors
Business Partners
f p g
construction
model
real estate
units salesFlagship DevelopmentsFlagship Developments
financing schemes
catering to
customers'
Low risk,
model:
(sell first O i f l i d f ili iO i f l i d f ili i
1212
affordability(sell first
then construct)Ongoing after sale integrated facilities
management operationsOngoing after sale integrated facilities
management operations
TMG
Quality Control and Advanced Operating Systems CompanyLogo
Quality Control and Advanced Operating Systems
• 2007: Application of the SAP Enterprise Resources Planning System (ERP) on all functions of the Group • 2007: Application of the SAP Enterprise Resources Planning System (ERP) on all functions of the Group Subsidiaries. The result is a smooth process integration between sales, accounting and treasury, with facilitated financial and managerial reporting, streamlined accounting bookkeeping and consolidation, improved administration of internal controls, corporate governance and transparency, and an optimized cash management processcash management process.
• Feb 2008: qualified for the ISO 9001:2000 certification requirements for a quality management system and maintained the certificate upon renewal in 2009 where an organization:maintained the certificate upon renewal in 2009 where an organization:
1. needs to demonstrate its ability to consistently provide product that meets customer and applicable regulatory requirements, and
2 aims to enhance customer satisfaction through the effective application of the system including 2. aims to enhance customer satisfaction through the effective application of the system, including processes for continual improvement of the system and the assurance of conformity to customer and applicable regulatory requirements.
13
k d O i l R i CompanyLogoMarket and Operational Review
Macroeconomic Indicators
Real Estate Market Drivers Real Estate Market Drivers
Tourism Market Drivers
Financial Review
Consolidated Operational Review
Hotels & Resorts Operational Review
Macro Economic Indicators
TMG
CompanyLogo
Growth in Real GDP
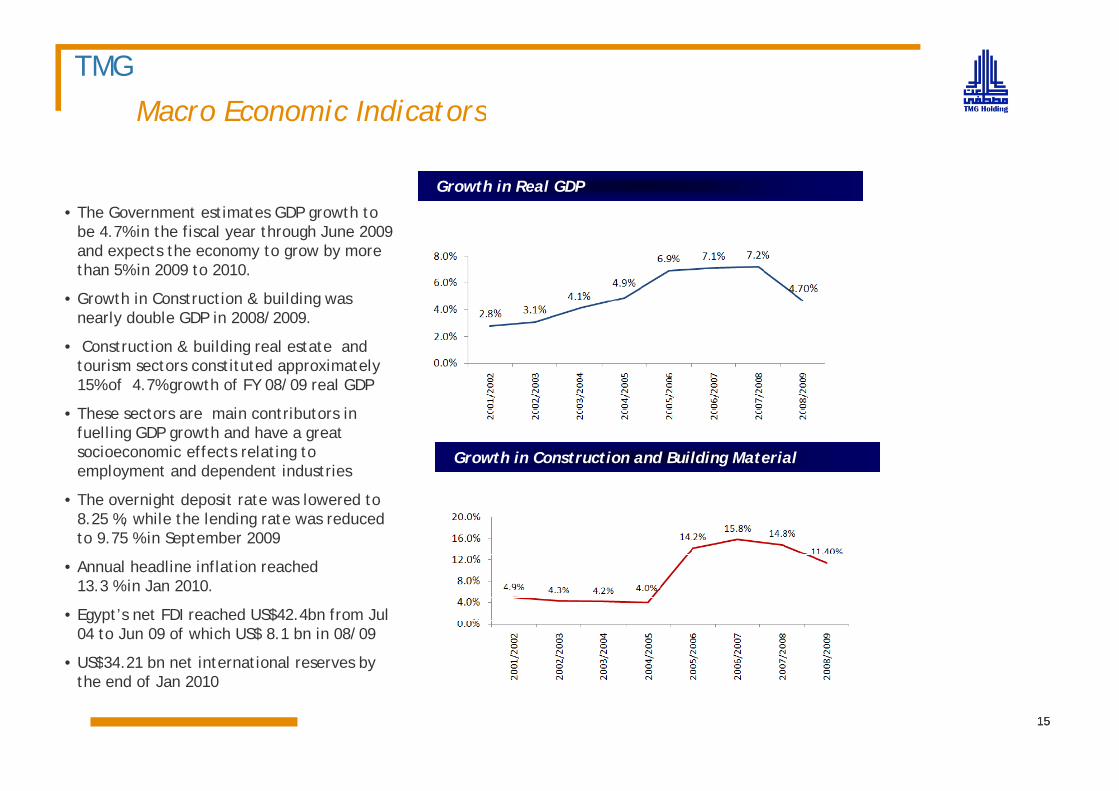
• The Government estimates GDP growth to The Government estimates GDP growth to be 4.7% in the fiscal year through June 2009 and expects the economy to grow by more than 5% in 2009 to 2010.
• Growth in Construction & building was gnearly double GDP in 2008/2009.
• Construction & building real estate and tourism sectors constituted approximately 15% of 4.7% growth of FY 08/09 real GDP
Growth in Construction and Building Material
• These sectors are main contributors in fuelling GDP growth and have a great socioeconomic effects relating to employment and dependent industries
• The overnight deposit rate was lowered to 8.25 %, while the lending rate was reduced to 9.75 % in September 2009
• Annual headline inflation reached 13.3 % in Jan 2010.
• Egypt’s net FDI reached US$42.4bn from Jul 04 to Jun 09 of which US$ 8.1 bn in 08/09
• US$34 21 bn net international reserves by
1515
US$34.21 bn net international reserves by the end of Jan 2010
Real Estate market drivers in EgyptTMG
CompanyLogo
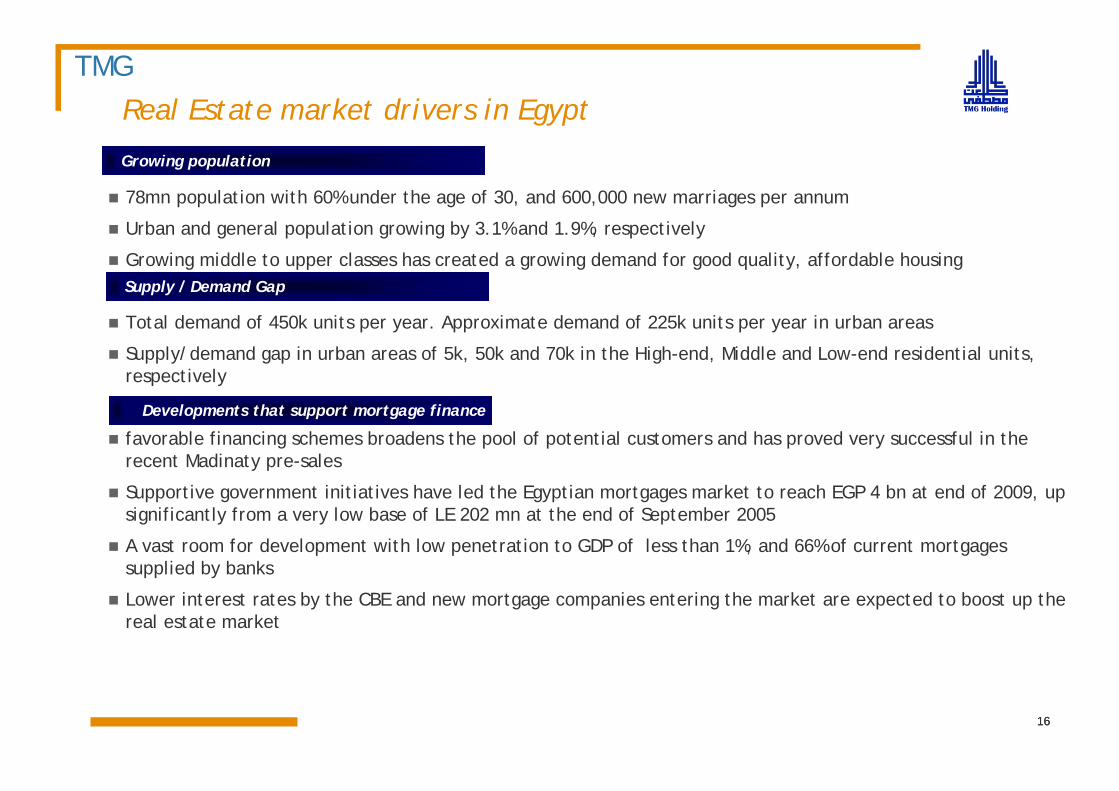
78mn population with 60% under the age of 30, and 600,000 new marriages per annum
Growing population
Urban and general population growing by 3.1% and 1.9%, respectively
Growing middle to upper classes has created a growing demand for good quality, affordable housingSupply / Demand Gap
Total demand of 450k units per year. Approximate demand of 225k units per year in urban areas
Supply/demand gap in urban areas of 5k, 50k and 70k in the High-end, Middle and Low-end residential units, respectively
favorable financing schemes broadens the pool of potential customers and has proved very successful in the recent Madinaty pre-sales
S i i i i i h l d h E i k h EGP 4 b d f 2009
Developments that support mortgage finance
Supportive government initiatives have led the Egyptian mortgages market to reach EGP 4 bn at end of 2009, up significantly from a very low base of LE 202 mn at the end of September 2005
A vast room for development with low penetration to GDP of less than 1%, and 66% of current mortgages supplied by bankspp y
Lower interest rates by the CBE and new mortgage companies entering the market are expected to boost up the real estate market
1616
Tourism market drivers in EgyptTMG
CompanyLogo
A fast-growing economic sector, with an average annual growth of 25 % in arrivals and 32.5% increase in i h f
•Key Figures
receipts over the past four years
12.3 million people visited Egypt in FY 2007/2008, and number of arrivals was sustained in 2008/2009
Revenue from tourism was US$ 10.8 billion in FY 2007/2008 with a slight decrease to 10.5 billion in in 2008/20092008/2009
Tourist arrivals in Egypt are expected to grow at nearly 6% over 2008- 2012
Top hard currency earner, key contributor to GDP and employs 13.7% of the Egyptian workforce
intensify promotion and advertising campaigns to preserve Egypt’s share of 4% of international tourists flow
Government initiatives to support tourism during financial crisis
exempt hotels from contributing to the tourism promotion authority
reduce landing, take-off and ground-handling fees for charter flights, waiving them entirely for charter flights making 11 trips to designated destinations in the span of three months
t f th t f d t fli ht t diff t i li ipay part of the cost of unreserved seats on flights to different airline agencies
No price-reduction strategy since prices in Egypt were already very affordable and any extra reductions would affect the quality of services offered
1717
TMGFinancial Review
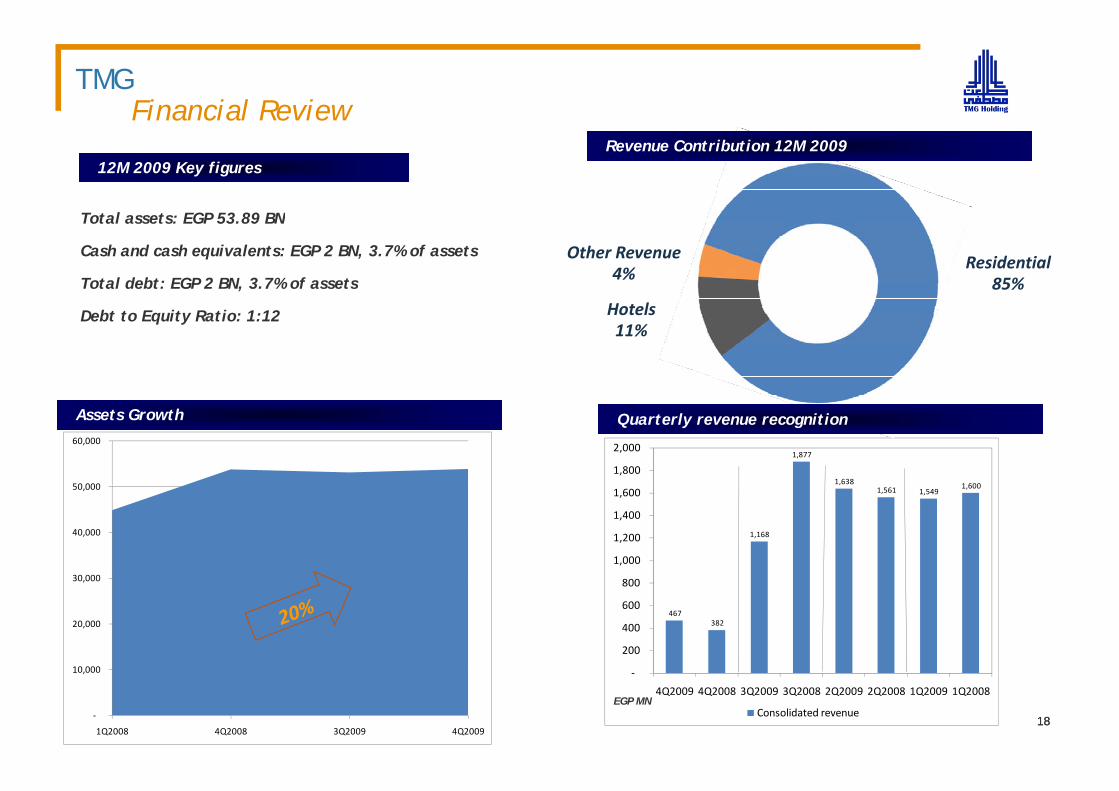
CompanyLogoRevenue Contribution 12M 2009
Total assets: EGP 53 89 BN
12M 2009 Key figures
H t l
Residential85%
Other Revenue4%
Total assets: EGP 53.89 BN
Cash and cash equivalents: EGP 2 BN, 3.7% of assets
Total debt: EGP 2 BN, 3.7% of assets
Hotels11%
Debt to Equity Ratio: 1:12
1,877
1,638 1 600
1,800
2,000
50 000
60,000
Quarterly revenue recognitionAssets Growth
1,168
1,561 1,549 1,600
1,000
1,200
1,400
1,600
30 000
40,000
50,000
467 382
200
400
600
800
20,000
30,000
‐
4Q2009 4Q2008 3Q2009 3Q2008 2Q2009 2Q2008 1Q2009 1Q2008
Consolidated revenue‐
10,000
1Q2008 4Q2008 3Q2009 4Q20091818
EGP MN
TMG
Consolidated Operational ReviewCompany
Logo
p
Quarterly profitsQuarterly Review
4Q2009 4Q2008 3Q2009 3Q2008 2Q2009 2Q2008 1Q2009 1Q2008
Revenues breakdown
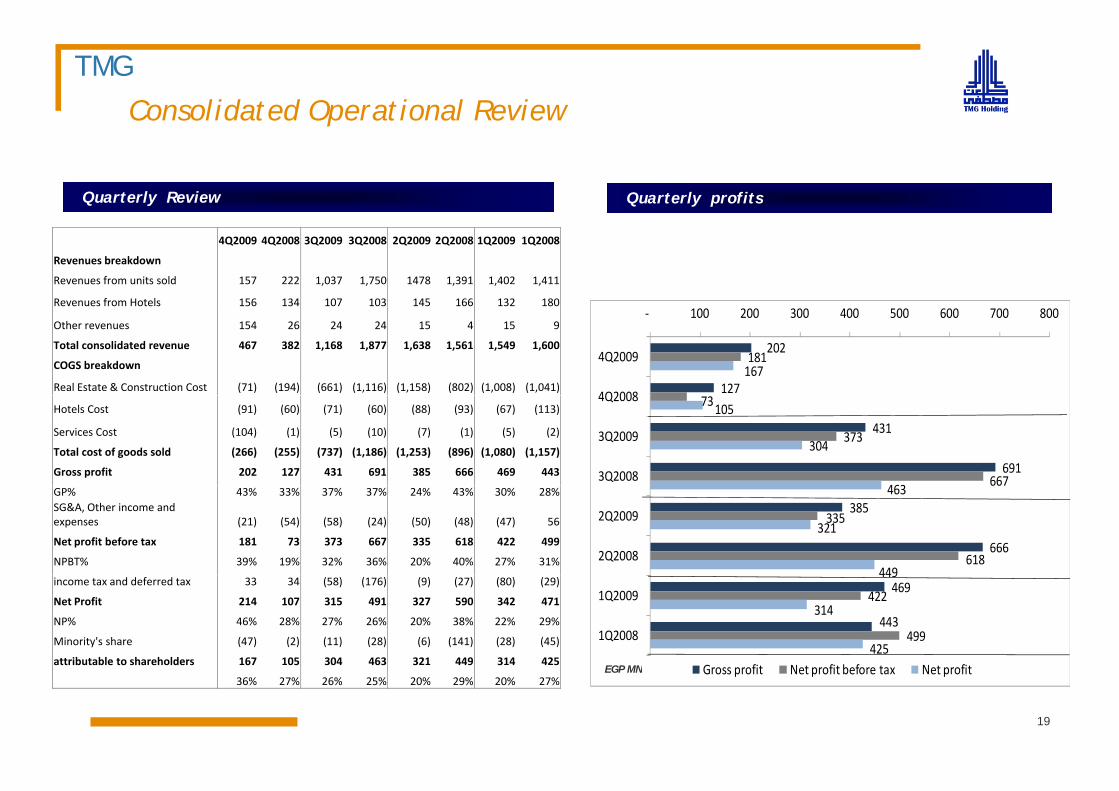
Revenues from units sold 157 222 1,037 1,750 1478 1,391 1,402 1,411
Revenues from Hotels 156 134 107 103 145 166 132 180
202
127
181 167
‐ 100 200 300 400 500 600 700 800
4Q2009
4Q2008
Revenues from Hotels 156 134 107 103 145 166 132 180
Other revenues 154 26 24 24 15 4 15 9
Total consolidated revenue 467 382 1,168 1,877 1,638 1,561 1,549 1,600
COGS breakdown
Real Estate & Construction Cost (71) (194) (661) (1,116) (1,158) (802) (1,008) (1,041)
431
691
73
373
667
105
304
463
4Q2008
3Q2009
3Q2008
Hotels Cost (91) (60) (71) (60) (88) (93) (67) (113)
Services Cost (104) (1) (5) (10) (7) (1) (5) (2)
Total cost of goods sold (266) (255) (737) (1,186) (1,253) (896) (1,080) (1,157)
Gross profit 202 127 431 691 385 666 469 443
385
666
667
335
618
463
321
449
2Q2009
2Q2008
GP% 43% 33% 37% 37% 24% 43% 30% 28%SG&A, Other income and expenses (21) (54) (58) (24) (50) (48) (47) 56
Net profit before tax 181 73 373 667 335 618 422 499
NPBT% 39% 19% 32% 36% 20% 40% 27% 31%
469
443
422
499
449
314
425
1Q2009
1Q2008
G fi N fi b f N fi
income tax and deferred tax 33 34 (58) (176) (9) (27) (80) (29)
Net Profit 214 107 315 491 327 590 342 471
NP% 46% 28% 27% 26% 20% 38% 22% 29%
Minority's share (47) (2) (11) (28) (6) (141) (28) (45)
attributable to shareholders 167 105 304 463 321 449 314 425Gross profit Net profit before tax Net profit
19
EGP MNattributable to shareholders 167 105 304 463 321 449 314 425
36% 27% 26% 25% 20% 29% 20% 27%
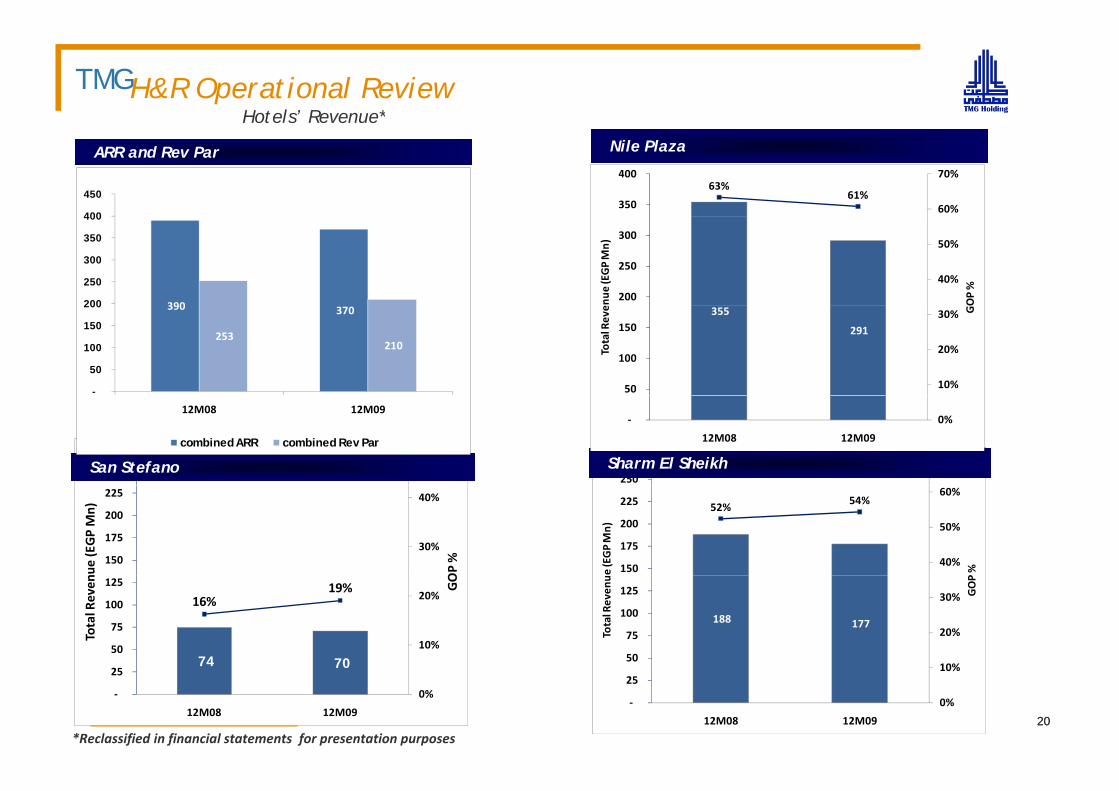
TMGH&R Operational ReviewHotels’ Revenue*
CompanyLogoNile PlazaARR and Rev Par
400
450 63%
61%60%
70%
350
400
390200
250
300
350
400
40%
50%
200
250
300
OP %
enue
(EGP Mn)
390 370
253 210
-
50
100
150
200 355
291
10%
20%
30%
50
100
150
G
Total Reve
70%
250
275 50%
250
275 Sharm El SheikhSan Stefano
12M08 12M09
combined ARR combined Rev Par
0%‐
12M08 12M09
52%54%
40%
50%
60%
150
175
200
225
P %e (EGP Mn)
30%
40%
150
175
200
225
OP %
nue (EGP Mn)
188 177
10%
20%
30%
50
75
100
125 GOP
Total Reven
u
74 70
16%19%
10%
20%
50
75
100
125 GO
Total Reven
0%
10%
‐
25
12M08 12M09
74 70
0%‐
25
12M08 12M092020
*Reclassified in financial statements for presentation purposes
G h CompanyLogoFuture Growth
Real Estate Development Plans
Real Estate Projects ProgressReal Estate Projects Progress
Real Estate Future Growth
Hotels and Resorts Future Growth
TMG
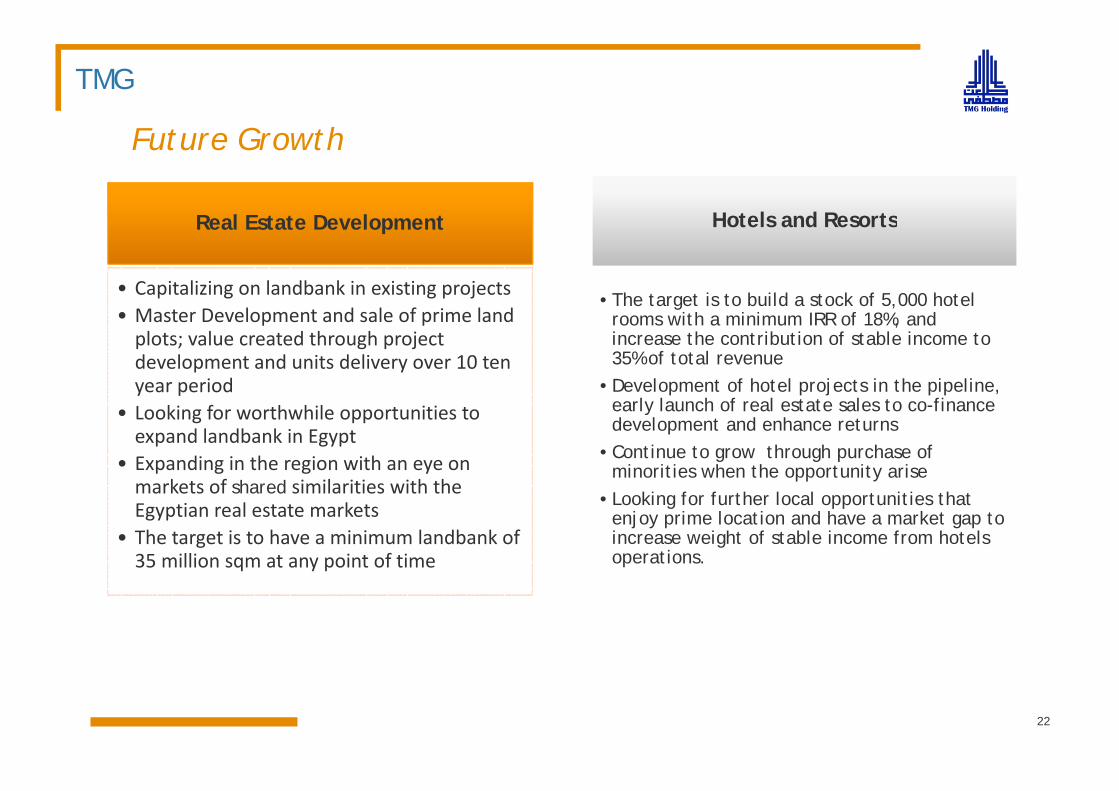
CompanyLogoFuture Growth
R l E t t D l t Hotels and ResortsReal Estate Development
• Capitalizing on landbank in existing projects
Hotels and Resorts
•The target is to build a stock of 5,000 hotel • Master Development and sale of prime land plots; value created through project development and units delivery over 10 ten year period
The target is to build a stock of 5,000 hotel rooms with a minimum IRR of 18%, and increase the contribution of stable income to 35% of total revenue
•Development of hotel projects in the pipeline, y p• Looking for worthwhile opportunities to expand landbank in Egypt
• Expanding in the region with an eye on markets of shared similarities with the
early launch of real estate sales to co-finance development and enhance returns
•Continue to grow through purchase of minorities when the opportunity arise
markets of shared similarities with the Egyptian real estate markets
• The target is to have a minimum landbank of 35 million sqm at any point of time
•Looking for further local opportunities that enjoy prime location and have a market gap to increase weight of stable income from hotels operations.
22
TMG
Real Estate Development PlanCompany
Logo
p2010 Real Estate Market conditions:
• Egypt is one of the least affected economies at a GDP growth of 4 7% (estimated to reach 5% in 2010) and• Egypt is one of the least affected economies at a GDP growth of 4.7% (estimated to reach 5% in 2010) and construction growth of 11.4%
• Solid financial sector; No actual problem in the Egyptian real estate market• A state of pent up demand, buyers are adopting a temporary wait and see approach that will eventually end• A state of stagflation resulting from over money supply may follow in 2010
TMG at start of 2010:Sales backlog that exceeds EGP 24 bn• Sales backlog that exceeds EGP 24 bn
• Delivery dates of large scale developments starting April 2010
TMG’s plan for 2010:p• Introduce products that have the right mix of size and space utilization • Offer affordable financing scheme to attract new buyers• Delivery of sold units in Madinaty and Rehab Extension with required services making the cities alive and
d f h id iready for the residents move in• Opening of Nile Kempinski Hotel in Cairo
23
TMG
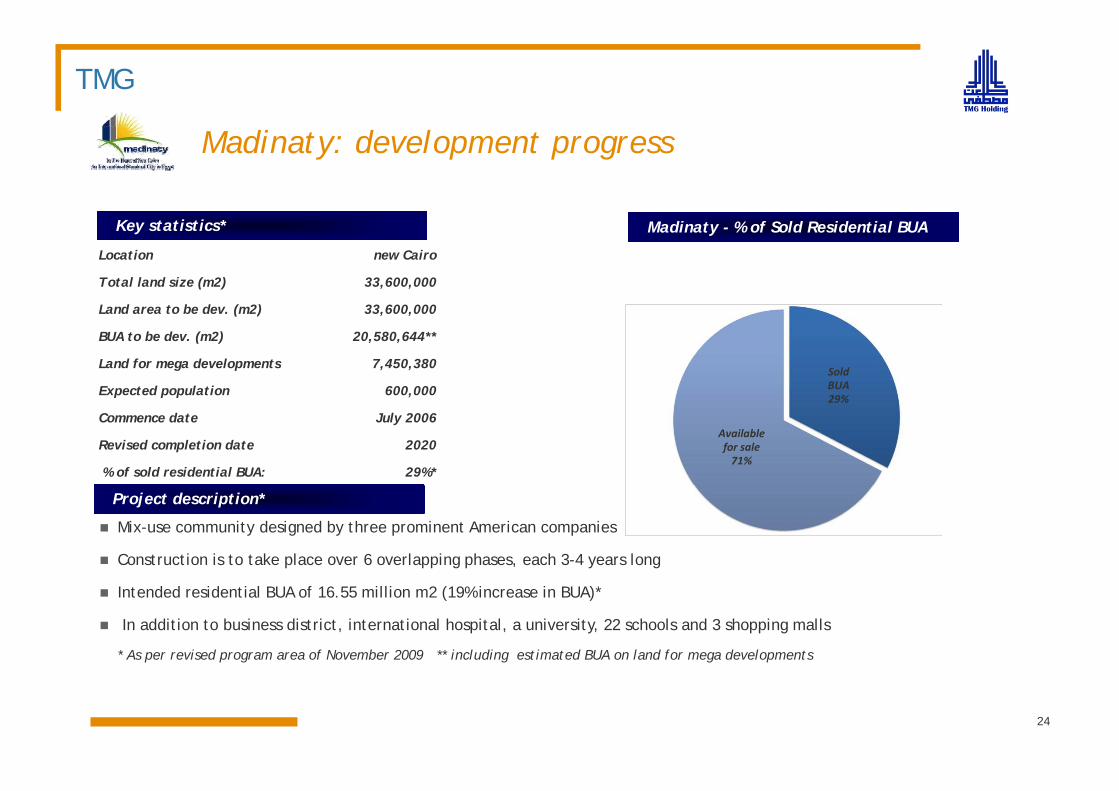
CompanyLogoMadinaty: development progress
Location new Cairo
Total land size (m2) 33,600,000
L d t b d ( 2) 33 600 000
Key statistics* Madinaty - % of Sold Residential BUA
Land area to be dev. (m2) 33,600,000
BUA to be dev. (m2) 20,580,644**
Land for mega developments 7,450,380
Expected population 600,000Sold BUA 29%
p p p ,
Commence date July 2006
Revised completion date 2020
% of sold residential BUA: 29%*
Available for sale71%
29%
Project description*
Mix-use community designed by three prominent American companies
Construction is to take place over 6 overlapping phases, each 3-4 years long
Intended residential BUA of 16.55 million m2 (19% increase in BUA)*
In addition to business district, international hospital, a university, 22 schools and 3 shopping malls
* As per revised program area of November 2009 ** including estimated BUA on land for mega developments
24
TMG
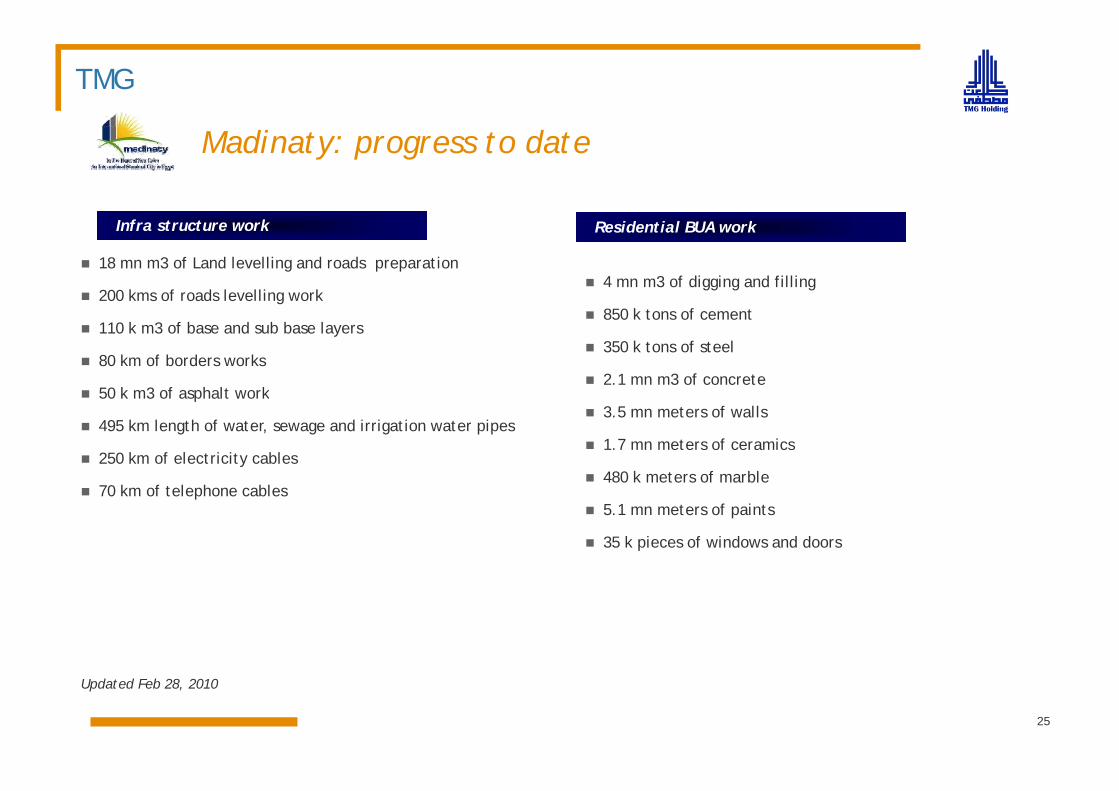
CompanyLogoMadinaty: progress to date
18 mn m3 of Land levelling and roads preparation
200 kms of roads levelling work
Infra structure work Residential BUA work
4 mn m3 of digging and filling
110 k m3 of base and sub base layers
80 km of borders works
50 k m3 of asphalt work
850 k tons of cement
350 k tons of steel
2.1 mn m3 of concrete50 k m3 of asphalt work
495 km length of water, sewage and irrigation water pipes
250 km of electricity cables
70 k f l h bl
3.5 mn meters of walls
1.7 mn meters of ceramics
480 k meters of marble70 km of telephone cables
5.1 mn meters of paints
35 k pieces of windows and doors
Updated Feb 28, 2010
25
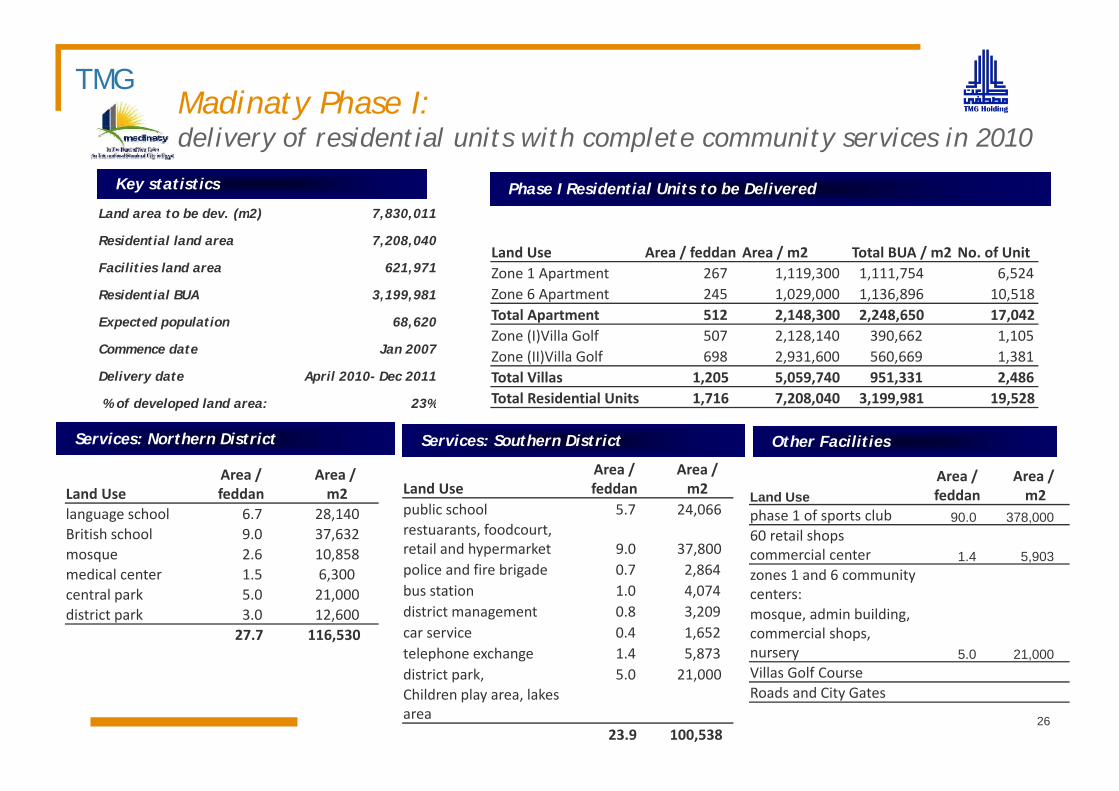
TMGMadinaty Phase I:
CompanyLogodelivery of residential units with complete community services in 2010
Phase I Residential Units to be DeliveredKey statistics
Land area to be dev. (m2) 7,830,011Land area to be dev. (m2) 7,830,011
Residential land area 7,208,040
Facilities land area 621,971
Residential BUA 3,199,981
Land Use Area / feddan Area / m2 Total BUA / m2 No. of UnitZone 1 Apartment 267 1,119,300 1,111,754 6,524 Zone 6 Apartment 245 1,029,000 1,136,896 10,518
Expected population 68,620
Commence date Jan 2007
Delivery date April 2010- Dec 2011
Total Apartment 512 2,148,300 2,248,650 17,042 Zone (I)Villa Golf 507 2,128,140 390,662 1,105 Zone (II)Villa Golf 698 2,931,600 560,669 1,381 Total Villas 1,205 5,059,740 951,331 2,486 Total Residential Units 1 716 7 208 040 3 199 981 19 528
Services: Northern District
% of developed land area: 23% Total Residential Units 1,716 7,208,040 3,199,981 19,528
Area / Area /
Services: Southern District
L d UArea / f dd
Area / 2
Area / Area /
Other Facilities
Land Use feddan m2language school 6.7 28,140 British school 9.0 37,632 mosque 2.6 10,858 medical center 1 5 6 300
Land Use feddan m2public school 5.7 24,066 restuarants, foodcourt, retail and hypermarket 9.0 37,800 police and fire brigade 0.7 2,864
Land Use feddan m2phase 1 of sports club 90.0 378,000 60 retail shops commercial center 1.4 5,903 zones 1 and 6 communitymedical center 1.5 6,300
central park 5.0 21,000 district park 3.0 12,600
27.7 116,530
p g ,bus station 1.0 4,074 district management 0.8 3,209 car service 0.4 1,652 telephone exchange 1.4 5,873
zones 1 and 6 community centers:mosque, admin building, commercial shops, nursery 5.0 21,000
26
district park, 5.0 21,000 Children play area, lakes area
23.9 100,538
Villas Golf CourseRoads and City Gates
TMG
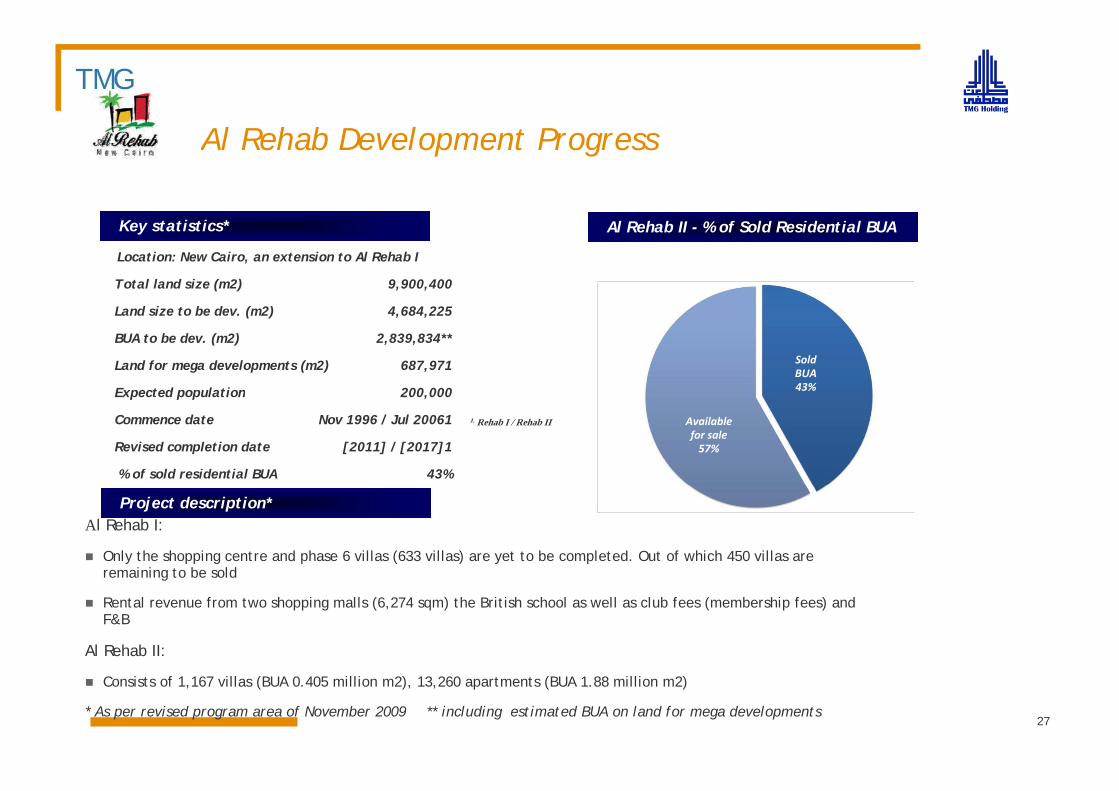
CompanyLogoAl Rehab Development Progress
Key statistics* Al Rehab II - % of Sold Residential BUA
Location: New Cairo, an extension to Al Rehab I
Total land size (m2) 9,900,400
d i b dLand size to be dev. (m2) 4,684,225
BUA to be dev. (m2) 2,839,834**
Land for mega developments (m2) 687,971
Expected population 200,000
Sold BUA 43%Expected population 200,000
Commence date Nov 1996 / Jul 20061
Revised completion date [2011] / [2017]1
% of sold residential BUA 43%
1. Rehab I / Rehab II Available for sale57%
Project description*Al Rehab I:
Only the shopping centre and phase 6 villas (633 villas) are yet to be completed. Out of which 450 villas are remaining to be soldremaining to be sold
Rental revenue from two shopping malls (6,274 sqm) the British school as well as club fees (membership fees) and F&B
Al Rehab II:
Consists of 1,167 villas (BUA 0.405 million m2), 13,260 apartments (BUA 1.88 million m2)
* As per revised program area of November 2009 ** including estimated BUA on land for mega developments27
TMG
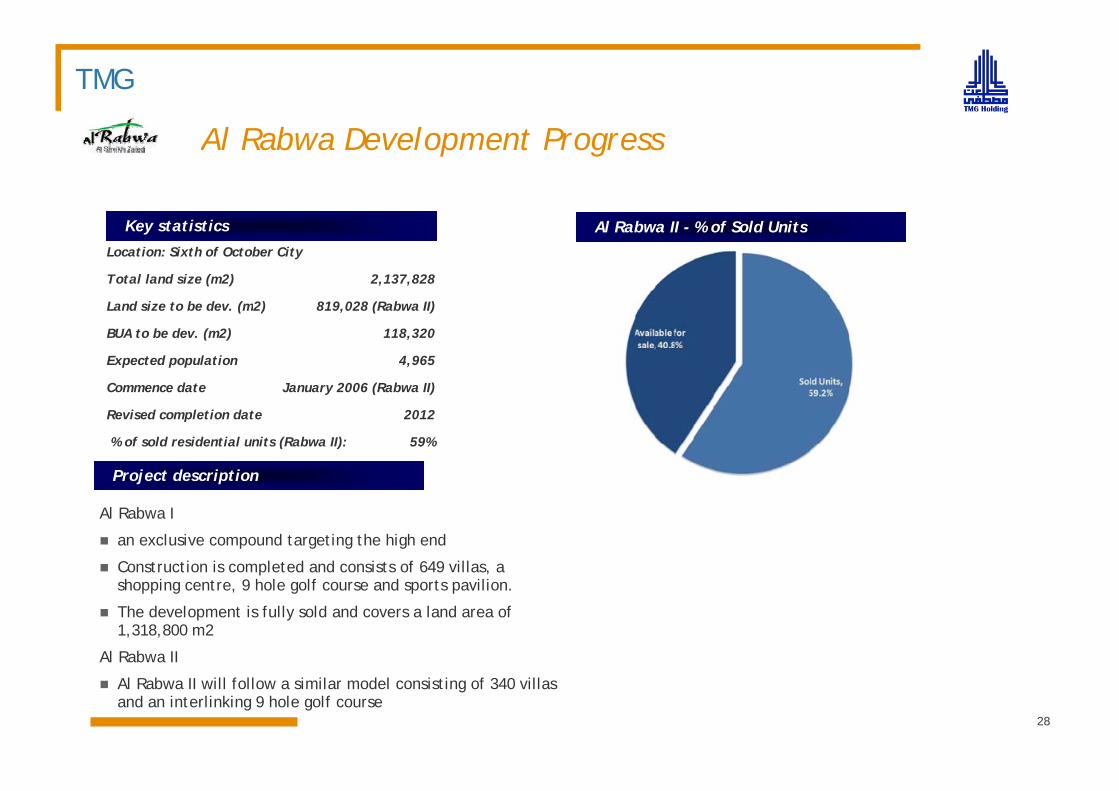
CompanyLogoAl Rabwa Development Progress
Key statistics Al Rabwa II - % of Sold UnitsLocation: Sixth of October City
Total land size (m2) 2,137,828
Land size to be dev (m2) 819 028 (Rabwa II)Land size to be dev. (m2) 819,028 (Rabwa II)
BUA to be dev. (m2) 118,320
Expected population 4,965
Commence date January 2006 (Rabwa II)
Project description
Revised completion date 2012
% of sold residential units (Rabwa II): 59%
Al Rabwa I
an exclusive compound targeting the high end
Construction is completed and consists of 649 villas, a pshopping centre, 9 hole golf course and sports pavilion.
The development is fully sold and covers a land area of 1,318,800 m2
Al Rabwa II
Al Rabwa II will follow a similar model consisting of 340 villas and an interlinking 9 hole golf course
28
TMGReal Estate Future Growth: Company
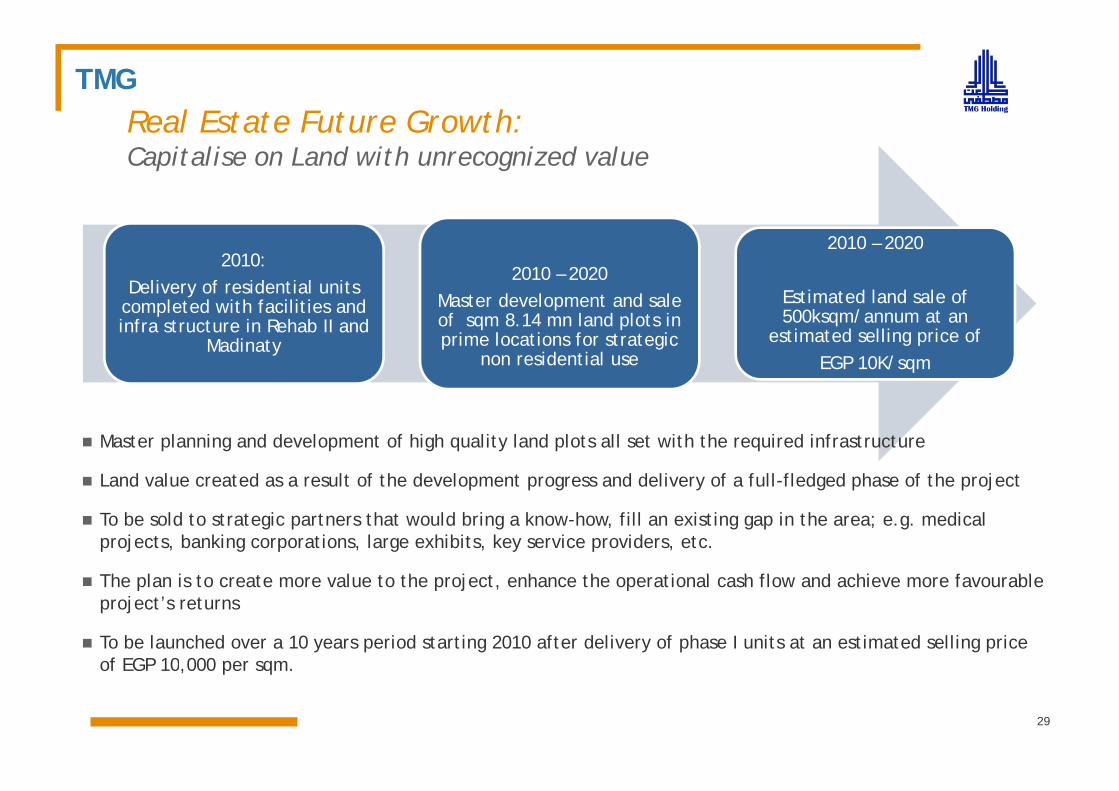
LogoReal Estate Future Growth:Capitalise on Land with unrecognized value
2010: Delivery of residential units
completed with facilities and
2010 – 2020Master development and sale
2010 – 2020
Estimated land sale of completed with facilities and infra structure in Rehab II and
Madinaty
Master development and sale of sqm 8.14 mn land plots in prime locations for strategic
non residential use
500ksqm/annum at an estimated selling price of
EGP 10K/sqm
Master planning and development of high quality land plots all set with the required infrastructure
Land value created as a result of the development progress and delivery of a full-fledged phase of the projectLand value created as a result of the development progress and delivery of a full fledged phase of the project
To be sold to strategic partners that would bring a know-how, fill an existing gap in the area; e.g. medical projects, banking corporations, large exhibits, key service providers, etc.
Th l i t t l t th j t h th ti l h fl d hi f bl The plan is to create more value to the project, enhance the operational cash flow and achieve more favourable project’s returns
To be launched over a 10 years period starting 2010 after delivery of phase I units at an estimated selling price of EGP 10 000 per sqm
29
of EGP 10,000 per sqm.
TMGReal Estate Future Growth: Company
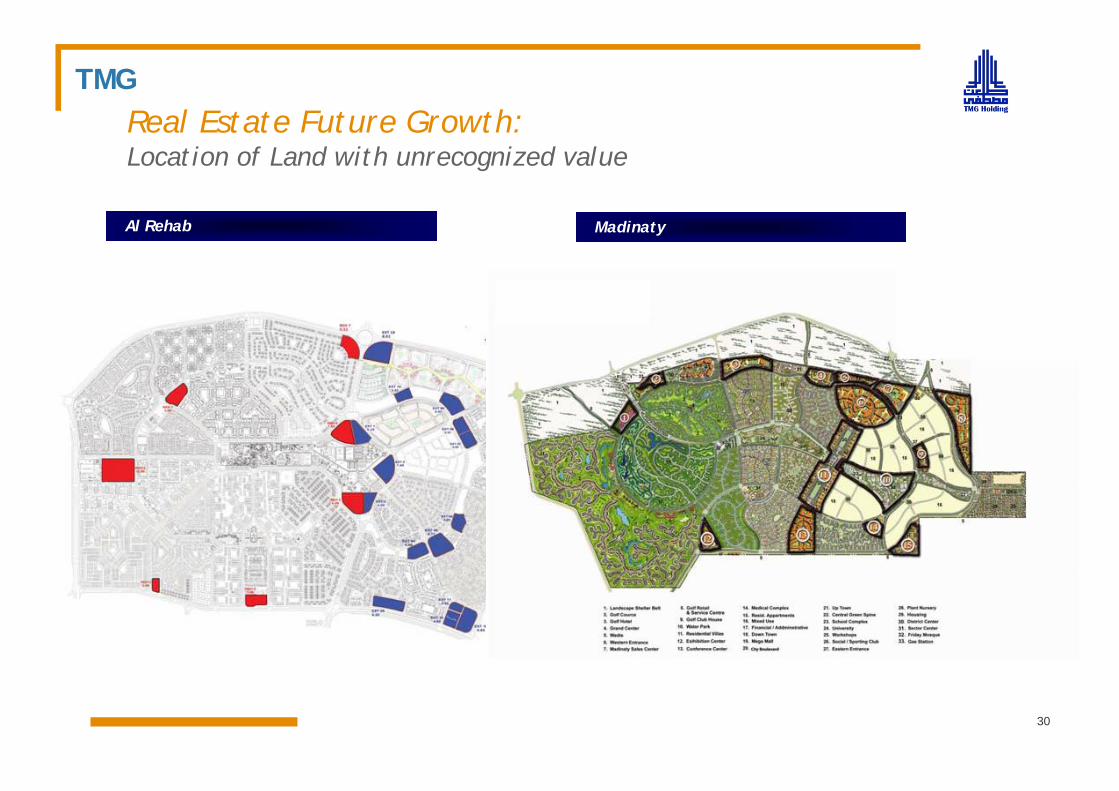
LogoReal Estate Future Growth:Location of Land with unrecognized value
Al Rehab Madinaty
30
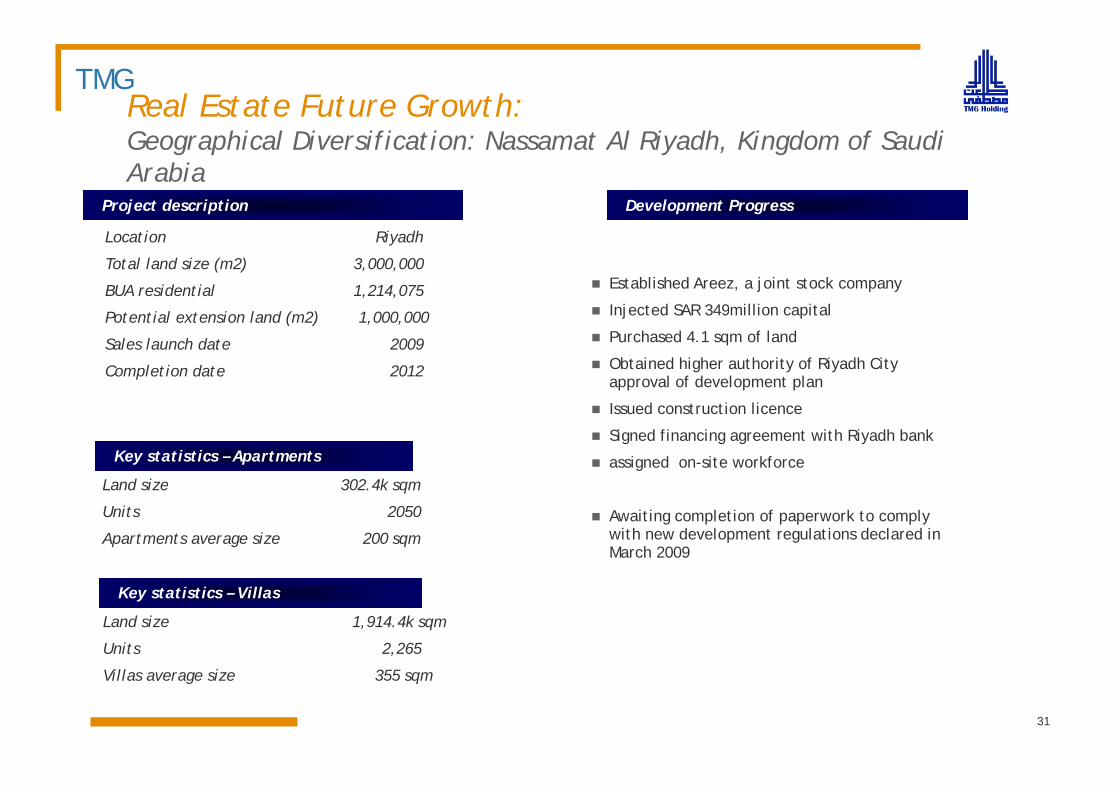
TMGReal Estate Future Growth:
CompanyLogoGeographical Diversification: Nassamat Al Riyadh, Kingdom of Saudi
ArabiaProject description Development Progress
Location Riyadh
Total land size (m2) 3,000,000
BUA residential 1,214,075 Established Areez, a joint stock company
I j t d SAR 349 illi it lPotential extension land (m2) 1,000,000
Sales launch date 2009
Completion date 2012
Injected SAR 349million capital
Purchased 4.1 sqm of land
Obtained higher authority of Riyadh City approval of development plan
Key statistics – Apartments
Land size 302 4k sqm
Issued construction licence
Signed financing agreement with Riyadh bank
assigned on-site workforceLand size 302.4k sqm
Units 2050
Apartments average size 200 sqmAwaiting completion of paperwork to comply with new development regulations declared in March 2009
Key statistics – Villas
Land size 1,914.4k sqm
Units 2,265
Villas average size 355 sqm
31
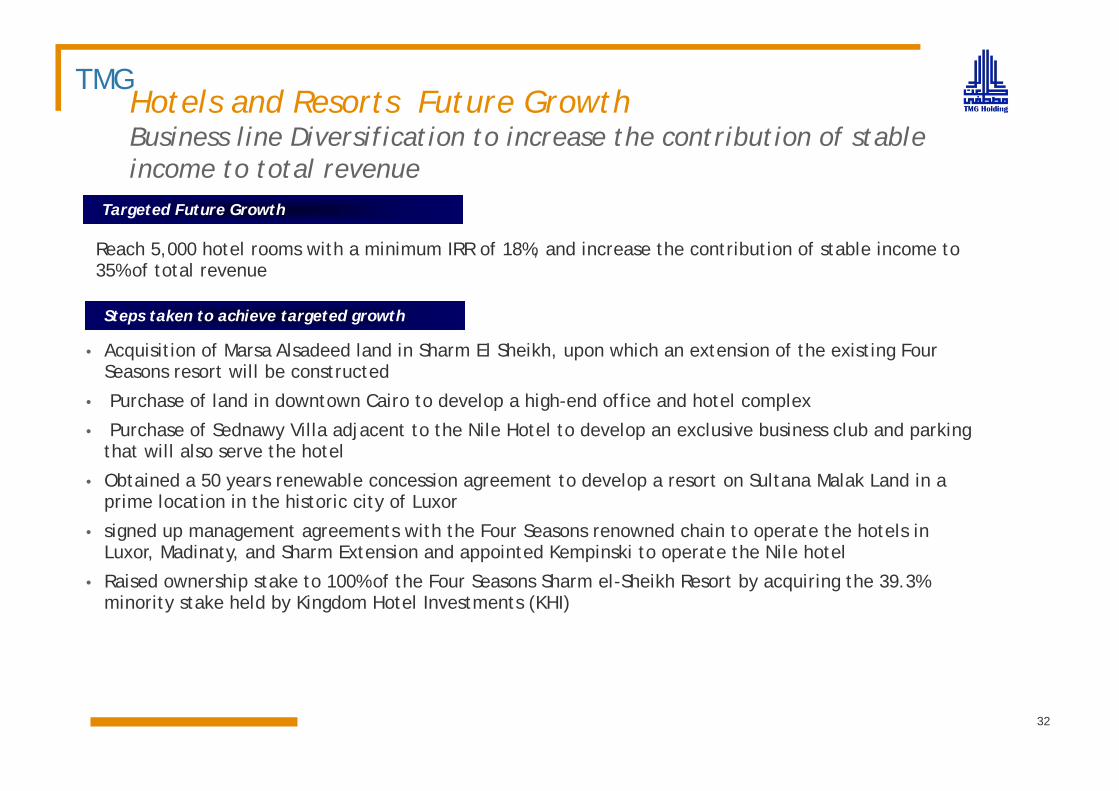
TMGHotels and Resorts Future Growth
l f h b f bl CompanyLogoBusiness line Diversification to increase the contribution of stable
income to total revenueTargeted Future Growthg
Reach 5,000 hotel rooms with a minimum IRR of 18%, and increase the contribution of stable income to 35% of total revenue
• Acquisition of Marsa Alsadeed land in Sharm El Sheikh, upon which an extension of the existing Four Seasons resort will be constructed
P h f l d i d t C i t d l hi h d ffi d h t l l
Steps taken to achieve targeted growth
• Purchase of land in downtown Cairo to develop a high-end office and hotel complex
• Purchase of Sednawy Villa adjacent to the Nile Hotel to develop an exclusive business club and parking that will also serve the hotel
• Obtained a 50 years renewable concession agreement to develop a resort on Sultana Malak Land in a Obtained a 50 years renewable concession agreement to develop a resort on Sultana Malak Land in a prime location in the historic city of Luxor
• signed up management agreements with the Four Seasons renowned chain to operate the hotels in Luxor, Madinaty, and Sharm Extension and appointed Kempinski to operate the Nile hotel
R i d hi t k t 100% f th F S Sh l Sh ikh R t b i i th 39 3% • Raised ownership stake to 100% of the Four Seasons Sharm el-Sheikh Resort by acquiring the 39.3% minority stake held by Kingdom Hotel Investments (KHI)
32
TMG
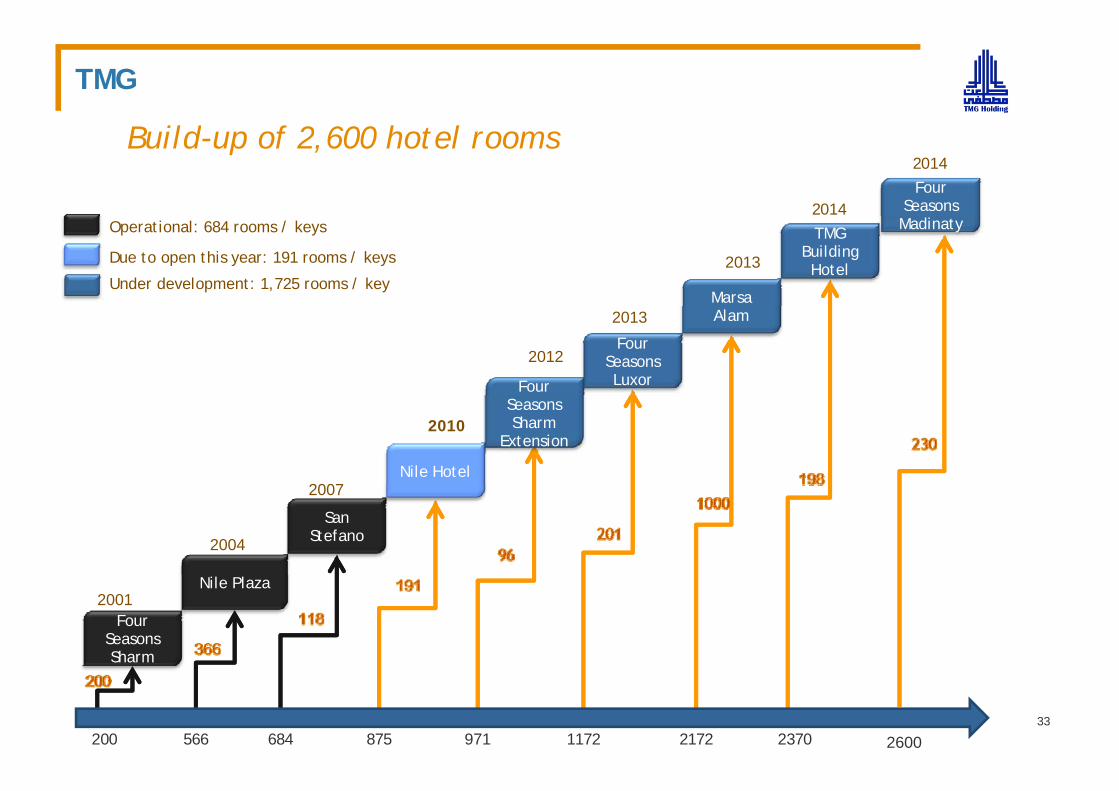
B ild f 2 600 h l CompanyLogoBuild-up of 2,600 hotel rooms
2014Four
Seasons
2014
Marsa
2013
TMG Building Hotel
Operational: 684 rooms / keys
Due to open this year: 191 rooms / keys
Under development: 1,725 rooms / key
Madinaty
Four
2012Four
Seasons Luxor
2013 Alam
2007Nile Hotel
2010Seasons Sharm
Extension
2004
2007
San Stefano
Nile Plaza
Four Seasons Sharm
2001
33237021721172971875684566200 2600
TMG
U i h l j CompanyLogoUpcoming hotel projects
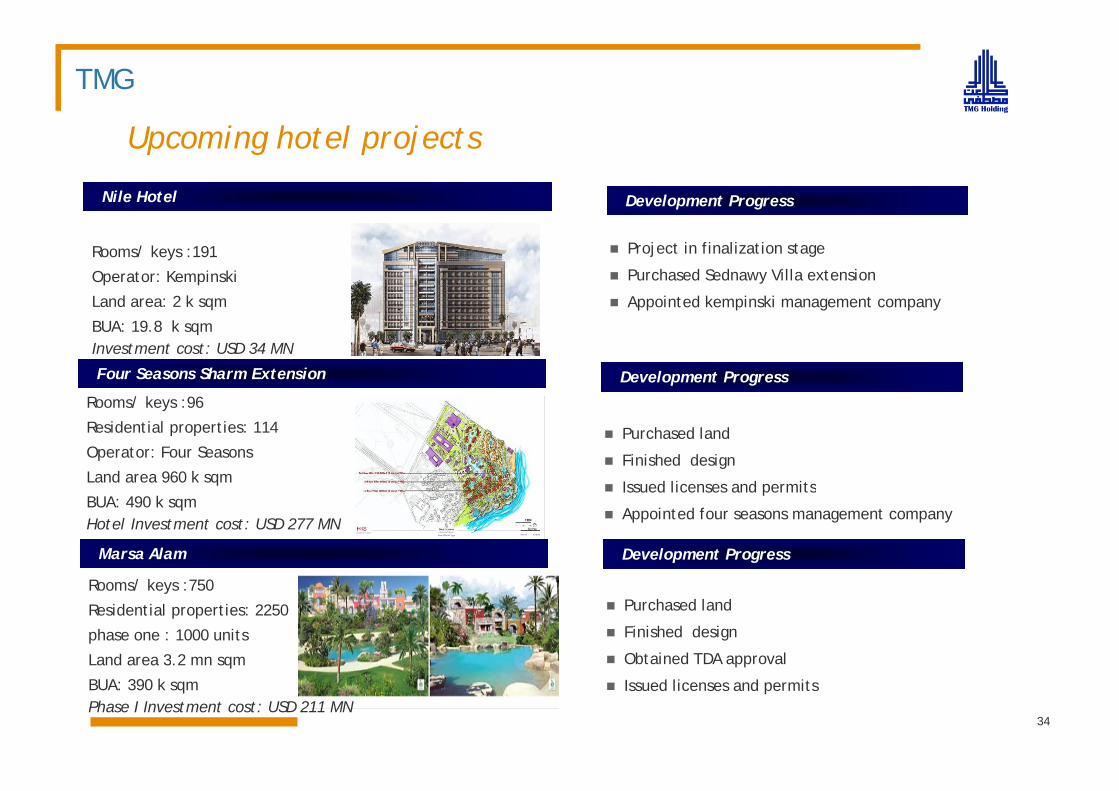
Nile Hotel Development Progress
Rooms/ keys :191
Operator: Kempinski
Land area: 2 k sqm
Project in finalization stage
Purchased Sednawy Villa extension
Appointed kempinski management companyLand area: 2 k sqm
BUA: 19.8 k sqmInvestment cost: USD 34 MN
Appointed kempinski management company
Four Seasons Sharm Extension Development Progress
Rooms/ keys :96
Residential properties: 114
Operator: Four Seasons
Land area 960 k sqm
Purchased land
Finished design
Issued licenses and permitsq
BUA: 490 k sqmHotel Investment cost: USD 277 MN
Issued licenses and permits
Appointed four seasons management company
Marsa Alam Development Progress
Rooms/ keys :750
Residential properties: 2250
phase one : 1000 units
Land area 3.2 mn sqm
Purchased land
Finished design
Obtained TDA approval
34
Land area 3.2 mn sqm
BUA: 390 k sqmPhase I Investment cost: USD 211 MN
pp
Issued licenses and permits
TMG
U i h l j CompanyLogoUpcoming hotel projects
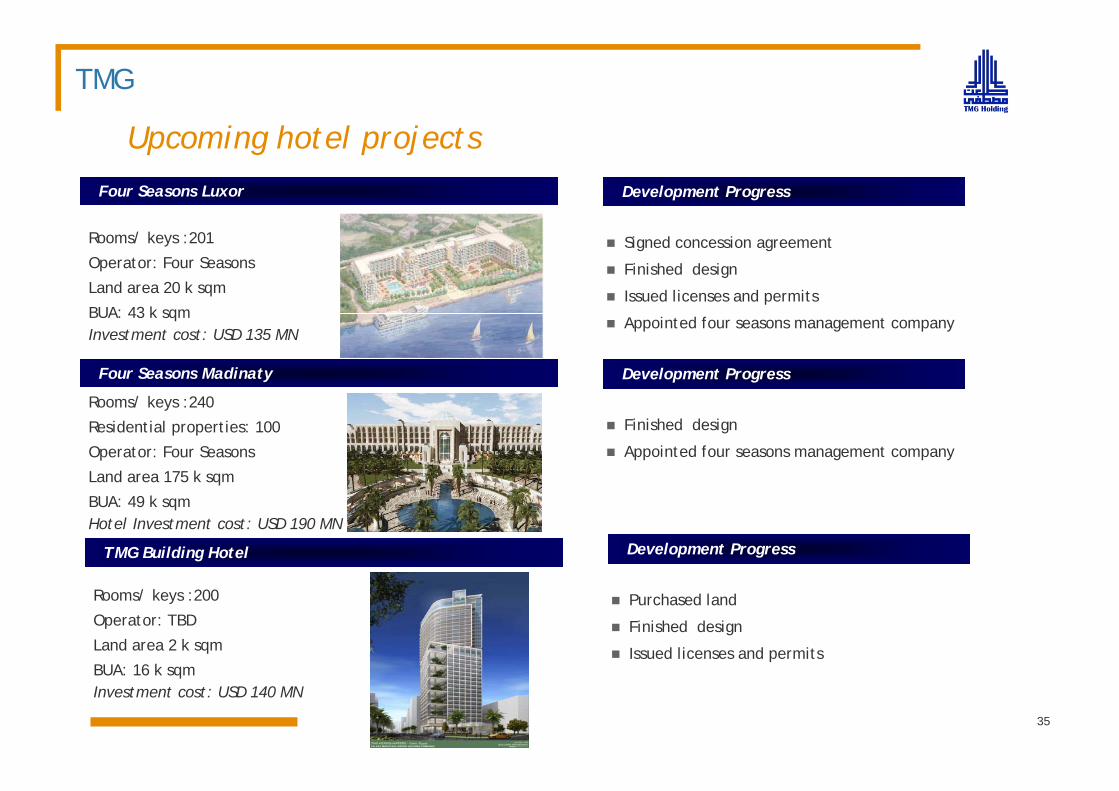
Four Seasons Luxor Development Progress
Rooms/ keys :201
Operator: Four Seasons
Land area 20 k sqm
Signed concession agreement
Finished design
Issued licenses and permits
Four Seasons Madinaty Development Progress
BUA: 43 k sqmInvestment cost: USD 135 MN
Appointed four seasons management company
Rooms/ keys :240
Residential properties: 100
Operator: Four Seasons
Land area 175 k sqm
Finished design
Appointed four seasons management company
q
BUA: 49 k sqmHotel Investment cost: USD 190 MN
TMG Building Hotel Development Progress
Rooms/ keys :200
Operator: TBD
Land area 2 k sqm
BUA 16 k
Purchased land
Finished design
Issued licenses and permits
35
BUA: 16 k sqmInvestment cost: USD 140 MN
CompanyLogo
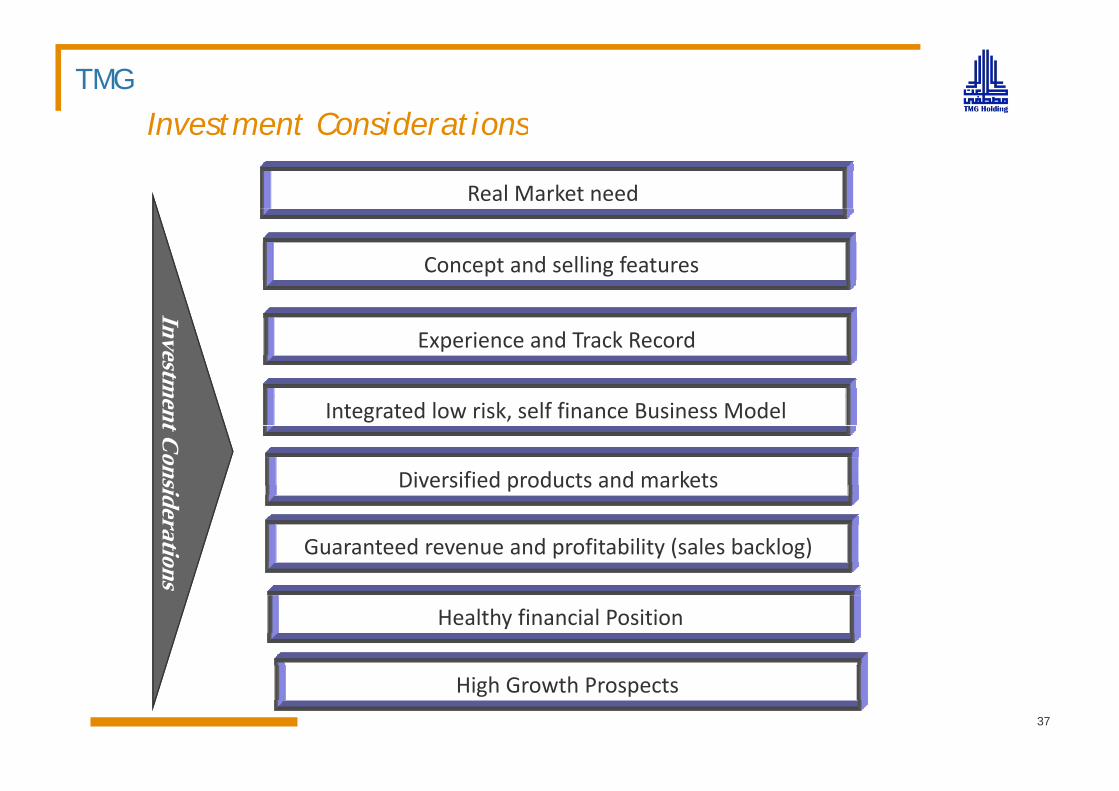
Investment Considerations
Risks and Mitigants
TMG
Investment Considerations CompanyLogo
Investment Considerations
Real Market need
Concept and selling features
Investm
Experience and Track Record
ment C
ons
Integrated low risk, self finance Business Model
Diversified products and marketssideration Guaranteed revenue and profitability (sales backlog)
Diversified products and markets
ns
Healthy financial Position
High Growth Prospects37
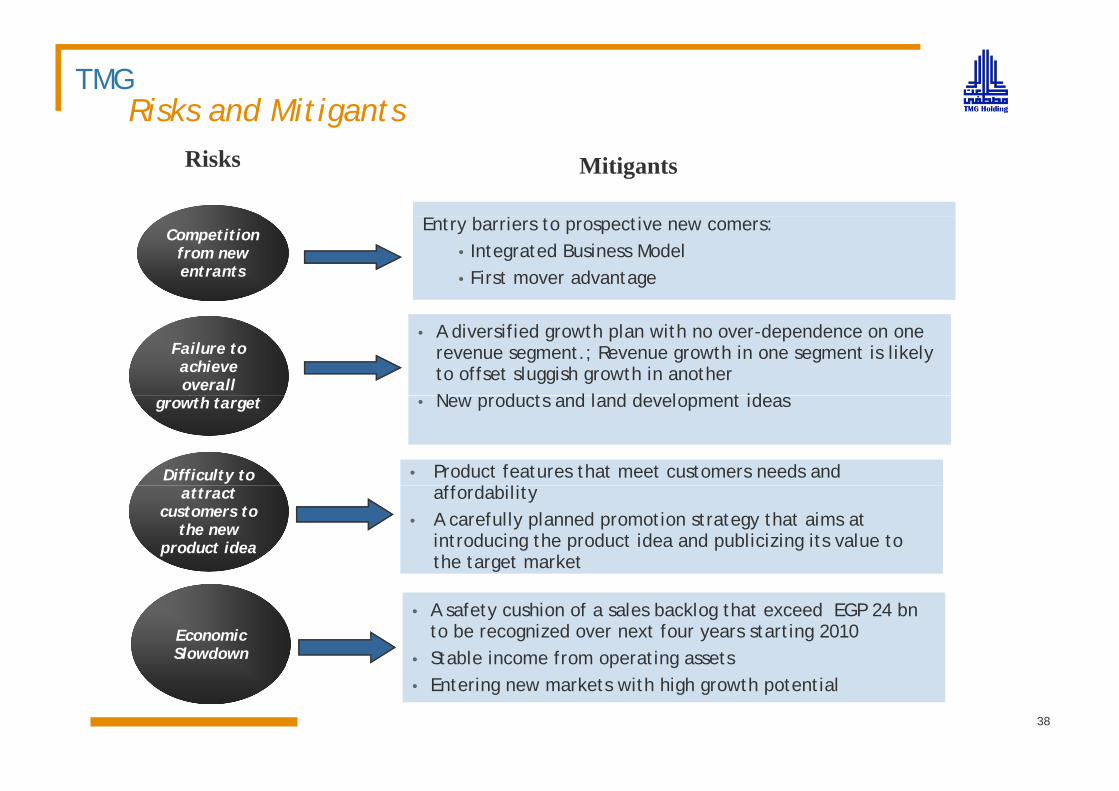
TMGRisks and Mitigants
CompanyLogo
gRisks Mitigants
Entry barriers to prospective new comers:• Integrated Business Model • First mover advantage
Competition from new entrants
• A diversified growth plan with no over-dependence on one revenue segment.; Revenue growth in one segment is likely to offset sluggish growth in another N d t d l d d l t id
Failure to achieve overall
• New products and land development ideasgrowth target
• Product features that meet customers needs and ff d b l
Difficulty to affordability
• A carefully planned promotion strategy that aims at introducing the product idea and publicizing its value to the target market
attract customers to
the new product idea
• A safety cushion of a sales backlog that exceed EGP 24 bnto be recognized over next four years starting 2010
• Stable income from operating assetsEconomic Slowdown p g
• Entering new markets with high growth potential
38
CompanyLogo
Thank you