Taking Stock: Examining the financing of nonprofit ... the financing of nonprofit community...
43
Taking Stock: Examining the financing of nonprofit community organizations in Calgary AUTHORS: Lynn Eakin, Lynn Eakin and Associates Matthew Kealey Katherine van Kooy, Calgary Chamber of Voluntary Organizations Calgary Chamber of Voluntary Organizations April, 2006
-
Upload
phungtuong -
Category
Documents
-
view
215 -
download
0
Transcript of Taking Stock: Examining the financing of nonprofit ... the financing of nonprofit community...

Taking Stock: Examining the financing of
nonprofit community organizations
in Calgary
AUTHORS:
Lynn Eakin, Lynn Eakin and Associates
Matthew Kealey
Katherine van Kooy, Calgary Chamber of Voluntary Organizations
Calgary Chamber of Voluntary Organizations
April, 2006
Acknowledgements Many thanks to the agencies who volunteered to participate in this study. Your commitment to the project was exceptional. Despite the very real constraints of time and resources experienced by every organization, almost 100% of the organizations that began the study completed the intensive data collection process, providing a substantial information base for this study. Without your assistance this study would not have been possible. Special thanks to Lynn Eakin. Lynn’s original study in Toronto provided the inspiration for this project, and the financial workbook developed by Lynn Eakin and Associates provided the essential tool for collecting the data. Her knowledge, advice, unfailing support and good humour were invaluable through this long process. Project manager, Matthew Kealey, kept us all on track and on schedule. His excellent coaching contributed to the increased completion rate in this study and ensured consistency in the data. Matthew was tireless in meeting our requests for data analysis and finding ways to present a vast amount of information in a meaningful manner. I would also like to thank Laurie Rektor, formerly with the Voluntary Sector Forum, for her support for this project and assistance in obtaining the funding that made the project possible; Kristina Cherneski for her assistance in recruiting organizations to participate in the study; and Diana Jossa for her assistance in developing the project design. CCVO gratefully acknowledges the Voluntary Sector Forum, the City of Calgary, Family and Community Support Services and the United Way of Calgary and Area for their financial support for this initiative and to The Muttart Foundation whose core operating support has made our work possible. All of your contributions have been essential to the success of this project. Thank you so much. Katherine van Kooy

Table of Contents 1. Introduction................................................................................................................ 1
2. Profile of Participating Organizations.................................................................... 2
3. Study Methodology .................................................................................................. 3
4. The Alberta Context ................................................................................................. 4
5. Study Findings .......................................................................................................... 7
5.1 Overview of Revenue Sources .................................................................... 7
5.2 Understanding the Program Revenue/Expenditure Gap ......................... 9
5.2.1 Funding Overview for All Programs .................................................. 10 5.2.2 Analyzing the Revenue Shortfall ........................................................ 11 5.2.3 Program Funding in Small, Medium and Large Organizations.......... 15 5.2.4 Program Funding Stability.................................................................. 16 5.2.5 Program Funding Summary................................................................ 17
5.3 The Role of Undesignated Revenues in Off-setting Program Revenue Shortfalls ...................................................................................... 18 5.3.1 Gaming Revenue................................................................................. 21 5.3.2 Undesignated Fund-raised Revenue ................................................... 21 5.3.3 Gifts in Kind ....................................................................................... 22 5.3.4 United Way Undesignated Funds and Other Miscellaneous Revenue 22
5.4 Overview of Expenditures ........................................................................... 23
5.4.1 Impact of Funding Practices ............................................................... 23 5.4.2 Benefits ............................................................................................... 24 5.4.3 Core Costs........................................................................................... 25 5.4.4 Supervision ......................................................................................... 28 5.4.5 Overtime ............................................................................................. 30 5.4.6 Volunteers ........................................................................................... 31
6. What the Participating Organizations Learned.................................................. 32
7. Key Observations and Analysis ........................................................................... 33
8. Conclusions............................................................................................................. 37
9. Recommendations ................................................................................................. 38
1
1. Introduction The objective of this study was to develop a more in depth understanding of the financing of nonprofit organizations in Calgary. The people of Calgary, our government, foundations and businesses rely on local nonprofit organizations to help make Calgary a preferred place to live, work and play. In the past few years, several major national studies have identified the importance of nonprofit organizations in the provision of community based services; however, these same studies reported that many nonprofit organizations have problems with funding their organizations and are operating under significant financial strain.1 A qualitative study by the Calgary Chamber of Voluntary Organizations (CCVO) in 2005 identified a local nonprofit community under stress. Key informant interviews identified financial capacity and funding issues as paramount. Most organizations reported trying to sustain themselves through a patchwork of short term, program specific contracts that create a host of challenges.2 The purpose of this study was to explore more fully exactly how organizations are financed, documenting information about what costs are covered and the implications when full costs are not met. While the national studies have sounded the alarm, it has not been clear from the overview studies or from the qualitative studies exactly how the funding of community nonprofit organizations operates on the ground. The information collected in this study complements and deepens our understanding of the profile of Alberta’s nonprofit organizations recently published by the National Survey of Nonprofit and Voluntary Organizations (NSNVO). This more detailed understanding of how nonprofit organizations are managing is essential to make informed decisions about funding policy and practices. This study replicates a similar study undertaken by Lynn Eakin in 2004 in Toronto, Ontario. An up-dated version of the Financial Workbook developed by Lynn Eakin was used to collect the data, providing a common format and definitions that facilitated comparability of information across organizations and with the previous study. The Financial Workbook format requires organizations to allocate revenues and expenses by program, providing participating organizations with a clear picture of the true costs of their programs and operations. Community-based nonprofit organizations operate in a complex and complicated funding environment. This report presents a picture of the various revenue streams organizations depend on to fund their programs. It also analyzes the details of their expenditures, including the extent to which program funding covers core costs. This information is enriched with information on the use of volunteers, staff overtime and gifts in kind to
1K. Scott, Funding Matters, CCSD 2004 and National Survey of Nonprofit and Voluntary Organizations, Statistics Canada, 2004 2 K Cherneski, Strength under Stress: A Portrait of Calgary’s Voluntary Sector, CCVO, 2005
2
support the work of the organizations participating in this study. The study concludes with recommendations for future action and research. 2. Profile of Participating Organizations Twenty-three (23) organizations participated in this study. The annual budgets of participating organizations ranged from just over $100,000 to $15 million. We grouped organizations into three categories based on budget size, as follows:
a) Small organizations = annual budgets under $1 million b) Medium, or mid-size organizations = annual budgets between $1 – $5 million c) Large organizations = annual budgets over $5 million
Twenty organizations are service providers, meaning they serve the “public good”3, providing services and programs to Calgarians. The other three organizations provide grants, volunteer and policy support to the sector. All twenty-three organizations in the sample have paid staff as well as volunteers. Recruitment to the study was aimed at including the broadest spectrum of types of service organizations in the sample. The organizations in our sample provide a broad range of community support services. Organizations were asked to identify their primary and secondary types of activity using the International Classification of Non-Profit Organizations (ICNPO) developed at Johns Hopkins University.4 The primary purpose of the sample organizations spanned eight of the fifteen major service categories including arts and culture, education and research, social services, health, development and housing, grant making and voluntarism, law and advocacy.5 In addition, organizations in our sample provided an average of four different secondary services (ranging from a single service to a high of 15 different services). For example, an organization that identified itself as primarily a community and neighbourhood organization provided ten services. These included services for youth, families and the elderly, as well as self-help, job training, vocational counselling, legal assistance, voluntarism, public health and continuing education. Organizations that provided multiple services were most often engaged in activities that strengthen our communities by supporting new immigrants, people with low incomes, disabilities, or groups identified as being ‘at risk’. There were fifteen such organizations in the sample that provided a range of different services to meet the needs of the people they serve. Six organizations 3 Some nonprofit organizations - like recreation and service clubs - provide services to their members while other nonprofits offer services to a larger community and or the general public. Organizations participating in the study belong to the latter category. 4 Salamon, Lester M. and Helmut K. Anheier, International Classification of Nonprofit Organizations: ICNPO-Revision1, 1996. Baltimore, MD: Johns Hopkins University Inst. for Policy Studies, 1996. 5 Universities , colleges, and hospitals, environmental, international, religious and business associations, and organizations whose activities were primarily sports and recreation were not included in this study.
3
had just two services and two organizations provided a single service reflecting more narrowly focused mandates, e.g. grant making or a specific medical service. The sample organizations have a substantial record of community service. Ten of the twenty-three participating organizations (43%) have been around for twenty-five years or more; seven have operated for six to twenty-four years, and six for five years or less. Of the organizations with under five years of operation only one had a budget over 1 million dollars. The remaining five young organizations had budgets under $500,000. Three agencies with more than 25 years of operation and another three agencies with 6-24 years of operation also had annual budgets of less than $500,000. All but one organization – the youngest organization (2002) – were registered charities, enabling them to provide tax receipts to donors, as well as making them eligible for grants from foundations. 3. Study Methodology Participating organizations were asked to complete a financial workbook that gathered information on program/service revenues and expenses. Revenues were divided into two primary categories: Program funding and undesignated funding. Program funding is funding the organization receives to provide a specified service. Often there is a contract between the funder and the service provider specifying the amount of funding to be provided, the way the funding is to be spent and the services to be provided. Undesignated funding, on the other hand, are funds given to the organization without the kinds of conditions that apply to program funding. The organization has more flexibility over the use of these funds. In addition to collecting information about funding provided from governments and foundations for service delivery, the workbook also gathered information on other sources of revenue obtained by the organization including fundraising, casino and United Way revenues, fees and other earned income. In addition, organizations were asked profile information regarding categories of service provided, years of operation, and the scope of their services. They were also asked for data regarding the use of volunteers in service and administrative functions (information on Board volunteers was not included since all organizations had a volunteer board). Data were gathered on overtime worked by staff and whether that time was paid, compensated with lieu time, or not compensated at all. Information was also collected on business activities and gifts in kind. The result is a detailed profile of the revenues and expenses of these nonprofit organizations that provide programs and services to Calgarians. Due to the sensitivity of the information gathered, participating organizations were promised anonymity and the workbooks were assigned a code identifier with only the

4
Coach knowing the identity of the organization. More detail on the study methodology is included in Appendix A. 4. The Alberta Context The first National Survey of Nonprofit and Voluntary Organizations (NSNVO) was completed in 2003 by Statistics Canada and a consortium of organizations from across Canada.6 Their findings, discussed in detail in Cornerstones of Community: Highlights of the National Survey of Nonprofit and Voluntary Organizations (Catalogue No. 61-533-XPE), offer a fresh understanding of the size and economic importance of this previously unmapped terrain. In addition to a national picture, the NSNVO’s provincial data uncovered a number of findings of special interest to those of us who work in the nonprofit sector here in Alberta. The Province is home to approximately 12% of Canada’s 161,000 nonprofit and voluntary organizations surveyed.7
• Over 2 million Canadians are employed by nonprofit organizations across the country. Of those, almost 176,000 (full-time and part-time) are Albertans.
• In Alberta, unpaid staff (volunteers) worked ‘the equivalent of approximately
234,000 full-time jobs’.8
• According to the NSNVO data, 58% of Alberta-based nonprofit and voluntary organizations surveyed reported having no paid personnel on staff in 2003 to support nonprofit and voluntary initiatives.
Nationally, the organizations surveyed reported total annual revenues of $112 billion; if universities, colleges and hospitals are excluded, the total revenue reported was $75 billion. Including hospitals, universities and colleges, Alberta’s nonprofit and voluntary sector reported total revenues of almost $10 billion9 – about 8.6 per cent of the national
6 Consortium members: the Canadian Centre for Philanthropy; l’Alliance de recherche universités-communautés en économie sociale, l’Université du Quebec á Montréal; Canada West Foundation; Canada Council on Social Development; Capacity Development Network, University of Victoria; Community Services Council, Newfoundland and Labrador; School of Policy Studies, Queen’s University; Secretariat on Voluntary Sector Sustainability at the Manitoba Voluntary Sector Initiative. 7 This number does not include grass-roots or unincorporated citizens’ groups; public schools and their boards, and public libraries were also excluded. For more information see Cornerstones of Community. 8 Imagine Canada (2005). The Nonprofit and Voluntary Sector in Alberta Toronto: Imagine Canada. http://www.nonprofitscan.ca/files/nsnvo/factsheet_voluntary_sector_alberta.pdf, accessed March 24, 2006. 9 Imagine Canada (2005). The Nonprofit and Voluntary Sector in Alberta Toronto: Imagine Canada. http://www.nonprofitscan.ca/files/nsnvo/factsheet_voluntary_sector_alberta.pdf, accessed March 24, 2006.

5
total.10 Excluding universities, colleges and hospitals, remaining Alberta-based organizations reported $9 billion in the total revenue. Across Canada, the main geographic areas that nonprofits and voluntary organizations were found to serve were their own neighbourhoods (64%) and regions (19%).11 Though we know that the City of Calgary has over 2,300 registered charities and approximately 4,000 nonprofit societies,12 a detailed picture of Calgary’s nonprofit and voluntary sector is not available. Only aggregate data for the Province was reported by Statistics Canada. Table 1 shows the number of Alberta-based organizations who participated in the NSNVO survey broken into categories based upon their reported annual revenue. The Calgary-based organizations who participated in the study discussed in this report are shown for comparison. Table 1: Percentage of nonprofit organizations by reported revenue
Alberta, 200313 Calgary Sample, 2005 Under $100,000 65.2% 0.0%
$100,000 – 249,999 16.5% 17.4% $250,000 – 499,999 7.4% 26.1% $500,000 – 999,999 5.6% 17.4%
$1,000,000 – 9,999,999 5.2% 30.4% $10 million plus 0.7% 8.7%
Total 100.0% * 100.0% * Actual total equals 100% (individual figures have been rounded) Unlike most of the other provinces, the largest source for funding for Alberta-based nonprofits was not government. Instead, earned income – fees for goods or services (31%), membership fees (12%), charitable gaming (3%) and investment income (3%) – accounted for almost half of the revenue reported by Alberta-based nonprofit and voluntary organizations in 2003.14 Government funding, including payment for goods and services as well as grants and contributions, accounted for approximately one-third of their reported revenues.
10 Source: Statistics Canada, Survey of Nonprofit and Voluntary Organizations. 11 Statistics Canada, Cornerstones of Community: Highlights of the National Survey of Nonprofit and Voluntary Organization, Catalogue No. 61-533-XPE, September 2004 pp.15. 12 K. Cherneski, Strength under Stress, CCVO, 2005 13 Adapted from Statistics Canada, Cornerstones of Community: Highlights of the National Survey of Nonprofit and Voluntary Organization, Catalogue No. 61-533-XPE, September 2004 pp.19 14 Adapted from Statistics Canada, Cornerstones of Community: Highlights of the National Survey of Nonprofit and Voluntary Organization, Catalogue No. 61-533-XPE, September 2004 pp.11, 30.

6
Although Alberta may be unusual in that respect, a number of key themes that emerged from the NSNVO data resonate with findings described in the following discussion of the finances of nonprofit community organizations in Calgary. Across Canada, almost half of the organizations who participated in the NSNVO reported having difficulty obtaining funding and over 40% reported difficulty earning revenue. The authors of Cornerstones of Community suggest that a majority of those organizations were “having problems fulfilling their missions and achieving their organizational objectives (… and that …) many organizations may be struggling to provide the public with all the benefits they have the potential to offer.”15 It should be noted that the profile of the organizations participating in this study is a particular sub-set of organizations. The sample organizations are large enough to employ at least one staff and are engaged in providing services to Calgarians. Their profile differs from the provincial profile in several ways – there are no organizations with revenues under $100,000; organizations in the sample have a higher level of government funding (54 % compared to 33% overall) and do not reflect the full diversity of the sector.16
15 Statistics Canada, Cornerstones of Community: Highlights of the National Survey of Nonprofit and Voluntary Organization, Catalogue No. 61-533-XPE, September 2004 pp.9. 16 Universities , colleges, and hospitals, environmental, international, religious and business associations, and organizations whose activities were primarily sports and recreation were not involved.

7
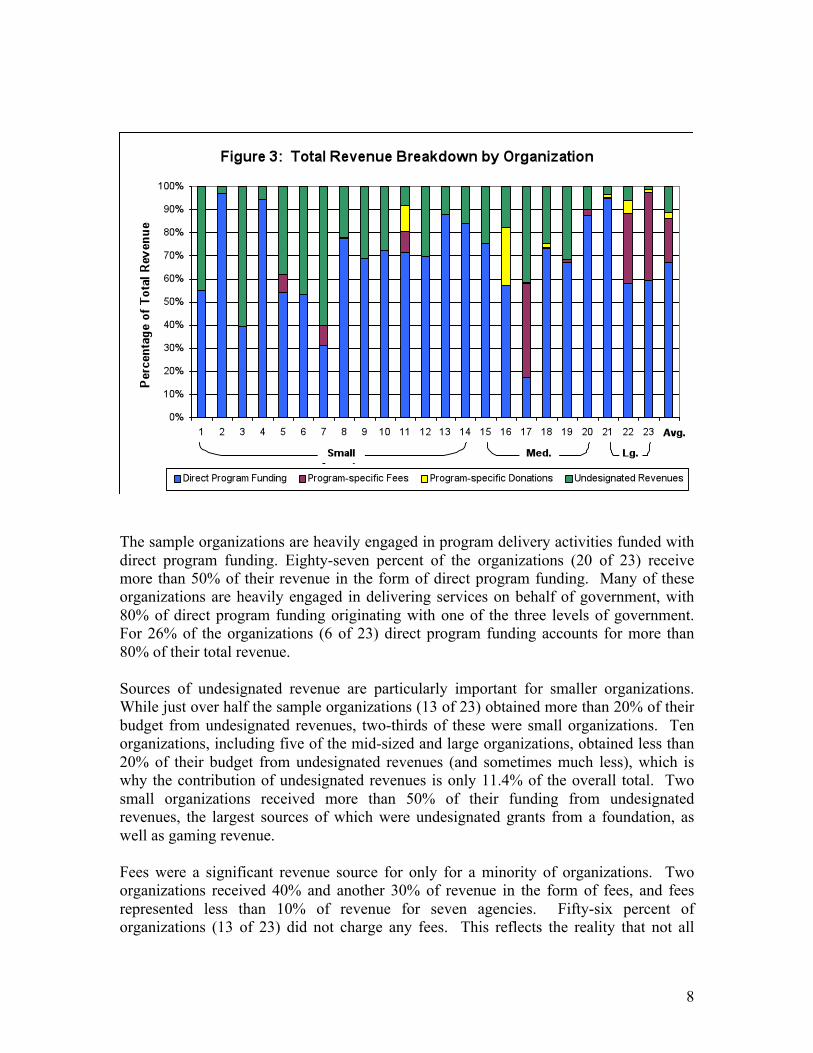
5. Study Findings 5.1 Overview of Revenue Sources Figure 2 below provides an overview of all revenue sources for the full sample of 23 participating organizations, while Figure 3 gives an overview of each organization.
Overall, 88.6% of all revenues are program-specific, the breakdown of which is as follows:
• 67.2% in direct program funding (i.e. money from funders provided explicitly for the provision of a specified program or service); 53.3% of revenue is program funding from government, with other sources (e.g. foundations) making up the balance;
• 18.8% from program-specific fees; and • 2.6% from program-specific fund-raised revenue or designated donations.
The remaining 11.4% of total revenues are undesignated, again meaning that the organizations have discretion over where they are applied. Sources for this category of funding include gaming revenue, undesignated fund-raised revenue, investment income, profit from small business ventures, sale or rental of goods, as well as undesignated grants from foundations and/or anonymous donors, among others.
8
The sample organizations are heavily engaged in program delivery activities funded with direct program funding. Eighty-seven percent of the organizations (20 of 23) receive more than 50% of their revenue in the form of direct program funding. Many of these organizations are heavily engaged in delivering services on behalf of government, with 80% of direct program funding originating with one of the three levels of government. For 26% of the organizations (6 of 23) direct program funding accounts for more than 80% of their total revenue. Sources of undesignated revenue are particularly important for smaller organizations. While just over half the sample organizations (13 of 23) obtained more than 20% of their budget from undesignated revenues, two-thirds of these were small organizations. Ten organizations, including five of the mid-sized and large organizations, obtained less than 20% of their budget from undesignated revenues (and sometimes much less), which is why the contribution of undesignated revenues is only 11.4% of the overall total. Two small organizations received more than 50% of their funding from undesignated revenues, the largest sources of which were undesignated grants from a foundation, as well as gaming revenue. Fees were a significant revenue source for only for a minority of organizations. Two organizations received 40% and another 30% of revenue in the form of fees, and fees represented less than 10% of revenue for seven agencies. Fifty-six percent of organizations (13 of 23) did not charge any fees. This reflects the reality that not all

9
community services lend themselves to charging fees, especially the outreach and prevention type services for disadvantaged and at risk communities. 5.2 Understanding the Program Revenue/Expenditure
Gap One purpose of this study was to determine whether total program revenues cover the cost of service delivery. The financial workbook collects both revenue and expenditure information on a program level. The organizations define their programs and assign revenues and expenses to each program. Because the workbook operates on the basis of full-cost accounting, each program also contributes to the core operating costs of the organization (the workbook assigns core costs to organizations on the basis of revenue). In order to understand the data that follows, it is important to understand the manner in which the information is collected in the workbook. As mentioned previously, total program revenue includes three things:
Direct program funding – revenue provided by a funder for a specific program; Program-specific fees (if applicable); and Program-specific fundraised revenue or designated donations.
For example, if an organization providing a family counselling service received a government grant for that program, charged clients fees for the service and held an annual golf tournament whose proceeds went entirely to the family counselling program, then the total program revenue would be the sum of the government grant, the fees collected and the net funds raised at the golf tournament. In capturing expenditure information, the workbook requires the organization to identify all inputs to the program regardless of the source of funding. For example, if program funding does not cover program supervision or shared (organization-wide) operating costs, these costs are still assigned to the program if they are incurred. In this way, the workbook obtains an accurate assessment of actual program cost. This provides the most useful information for organizations to be able to understand the cost structure of their programs and the extent to which they recover full costs through program revenues. However, since the workbook is designed to balance, the expense assigned to the under-funded program will reduce the expenses shown for other funded programs. To illustrate how this works take the example of a day program which has a manager (fully funded) and a smaller outreach program which has no funding for supervision. The day program manager is ultimately responsible for both programs, so in assigning costs to each program the salary for this position would be divided between the two programs, e.g. 95% to the day program and 5% to the outreach program. In this case, the day program

10
expenses would be reduced and the program might even show a surplus equal to 5% of the salary of the manager. What this means for our data analysis is that the workbook is accurate in identifying revenue funding shortfalls but is not reliable in identifying situations where the funding exceeds the expenditures. 5.2.1 Funding Overview for All Programs One of the basic findings in this study was the gap between total program revenues (i.e. direct program funding, designated donations/fundraising, and fees) and program expenditures. Of the 23 organizations in this study, in only one case did program revenues completely meet program expenses. Figure 4 illustrates total program revenue compared to total program expenses, by organization.
Figure 4 reflects the wide variations across the study sample, ranging from a low of about 45% of program expenses covered by program revenue, to one case where progam revenues exceeded total program costs. The difference between program revenues and program expenditures represents the funding that agencies must raise from other sources to cover the cost of delivering their programs. This figure illustrates the importance of fees and program-specific donations for several of the organizations in the study. It is important to recognize that revenue from fees and donations may vary from year to year affecting the size of the revenue/expenditure gap.

11
The study involved a total of 229 programs across the 23 organizations. Based on an individual program analysis, 70 programs (30.6%) were adequately funded through program revenues (i.e. direct program funding, program-specific donations and program-specific fees met or exceeded program expenditures), while the remaining 159 programs (69.4%) had to supplement program revenues from other sources in order to meet program costs. On average, for those 159 under-funded programs, the additional revenue required for these programs represented 19% of program costs, amounting to a total shortfall of $6.2 million. When the net surplus of the 70 adequately-funded programs, as calculated by the workbook, is taken into consideration, the overall net shortfall among all 229 programs is reduced to $3.6 million. 5.2.2 Analyzing the Revenue Shortfall It is important to view the data which follows as indicative of trends and as providing an approximate rather than actual number. One of the benefits of this study was that refinements to the financial workbook enabled a closer examination of funding trends by category of funder. The purpose of this analysis was to see if there were any patterns or differences related to the source of funding. Programs were organized according to the primary source of funding into the following seven categories:
a) Federal Government; b) Provincial Government; c) Regional Authorities; d) Municipal Government; e) Jointly-funded (i.e. multiple funders, none of which provided a majority of the
funding); f) Foundations, United Way and Other Nonprofit funders; and g) “All Others” which included programs primarily funded by corporations, fees,
donations or anonymous sources. Table 2 presents an overview by category of funder.
12
Table 2: Program Funding Trends by Funder Category
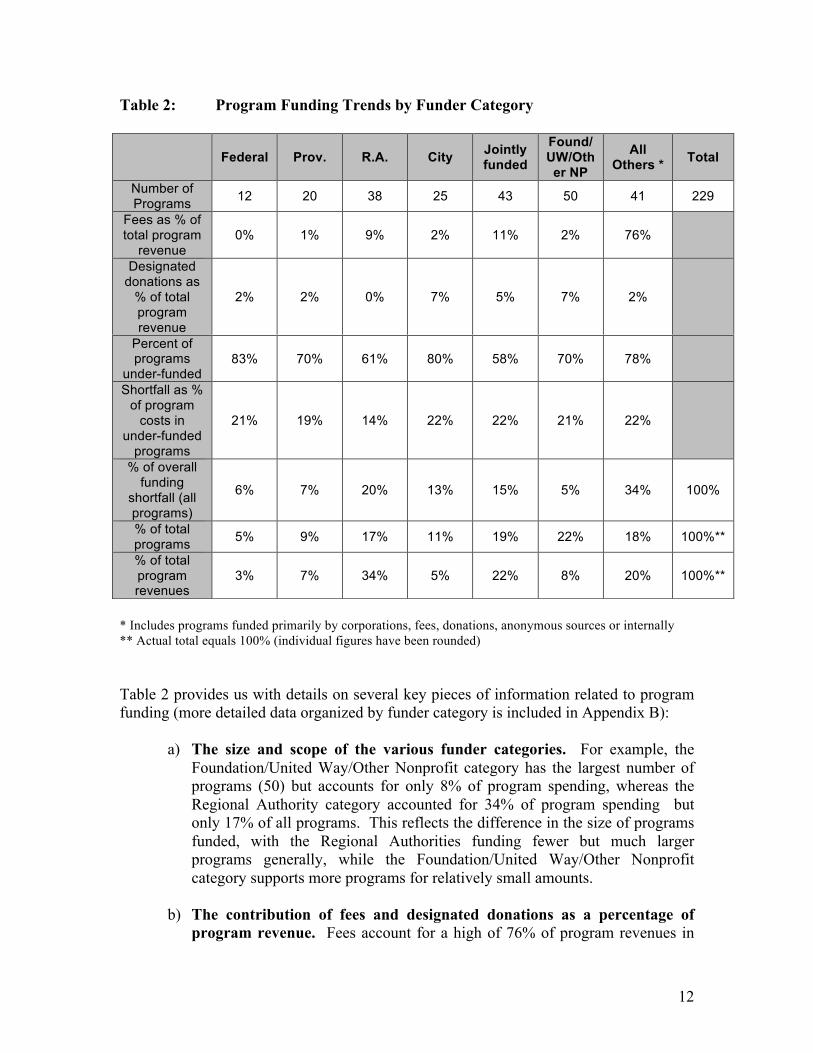
* Includes programs funded primarily by corporations, fees, donations, anonymous sources or internally ** Actual total equals 100% (individual figures have been rounded) Table 2 provides us with details on several key pieces of information related to program funding (more detailed data organized by funder category is included in Appendix B):
a) The size and scope of the various funder categories. For example, the Foundation/United Way/Other Nonprofit category has the largest number of programs (50) but accounts for only 8% of program spending, whereas the Regional Authority category accounted for 34% of program spending but only 17% of all programs. This reflects the difference in the size of programs funded, with the Regional Authorities funding fewer but much larger programs generally, while the Foundation/United Way/Other Nonprofit category supports more programs for relatively small amounts.
b) The contribution of fees and designated donations as a percentage of
program revenue. Fees account for a high of 76% of program revenues in
Federal Prov. R.A. City Jointly funded
Found/UW/Other NP
All Others * Total
Number of Programs 12 20 38 25 43 50 41 229
Fees as % of total program
revenue 0% 1% 9% 2% 11% 2% 76%
Designated donations as
% of total program revenue
2% 2% 0% 7% 5% 7% 2%
Percent of programs
under-funded 83% 70% 61% 80% 58% 70% 78%
Shortfall as % of program
costs in under-funded
programs
21% 19% 14% 22% 22% 21% 22%
% of overall funding
shortfall (all programs)
6% 7% 20% 13% 15% 5% 34% 100%
% of total programs 5% 9% 17% 11% 19% 22% 18% 100%**
% of total program revenues
3% 7% 34% 5% 22% 8% 20% 100%**
13
the “All Others” category and 11% for “Jointly funded” programs. Fees are a negligible revenue source for provincially and federally funded programs, at 1% and zero per cent, respectively. Information on the contribution of fees and designated donations to program revenues deepens the understanding of how programs are funded and the role of these sources of revenue in meeting program costs.
c) The extent of the gap between program revenues and expenditures.
Among those programs which were under-funded, the gap between program revenues and expenditures was the lowest in the “Regional Authority” category, at 14%. (Note: there were two authorities represented in this category – Calgary and Area Child & Family Services and the Calgary Health Region; the funding gap in under-funded programs was slightly different between the two, at 12% and 19%, respectively). The comparable funding gap ranged between 19-22% for all other categories.
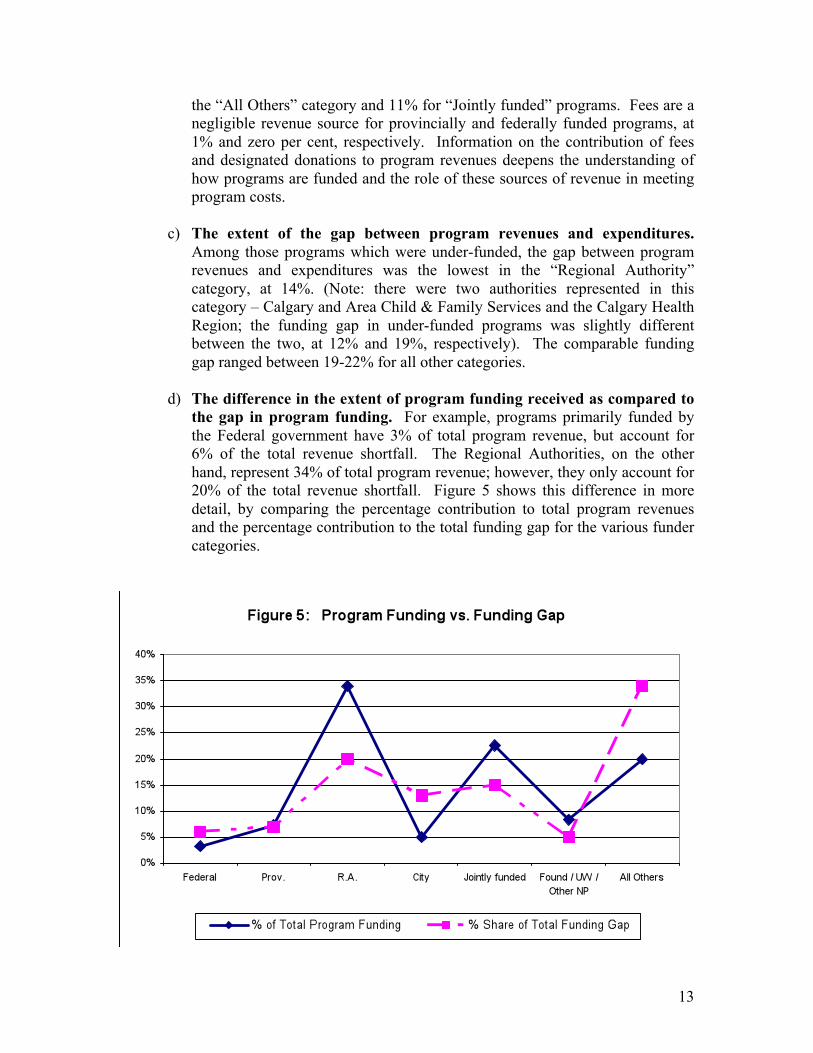
d) The difference in the extent of program funding received as compared to
the gap in program funding. For example, programs primarily funded by the Federal government have 3% of total program revenue, but account for 6% of the total revenue shortfall. The Regional Authorities, on the other hand, represent 34% of total program revenue; however, they only account for 20% of the total revenue shortfall. Figure 5 shows this difference in more detail, by comparing the percentage contribution to total program revenues and the percentage contribution to the total funding gap for the various funder categories.
14
As can be seen in Figure 5, only in the “Provincial government” category did the contribution to the funding gap match the percentage of program revenue from that category. As mentioned previously, in only 31% of the programs in this study did program revenues cover their total program expenditures. Although the data identifies differences between different categories of funders, it does not explain why and how some funding sources are covering expenditures and others are not. Part of the explanation may lie in the nature of the funding organizations receive. The literature identifies three primary categories of funding:17
• “Giving” – Where the Funder makes a contribution18 grant to support a worthy cause and help with its financing. The program is not their program, but they have an interest in the program being delivered. The contribution funder often does not intend to pay for the full cost of the program but wishes to support the program. They expect that there will be other funders also supporting the program and that revenue will be acquired from other sources. Grants to programs are typically not as prescribed and closely monitored as service purchase agreements.
• “Shopping” – Service purchase agreements where the funder (usually government) contracts with the nonprofit organization to deliver a service on their behalf. Examples might be funding for women’s shelters or a support service for a disability group. Typically in a service purchase agreement the service deliverables are defined and the funding is linked to an approved budget that is monitored. The service purchase funder takes a direct interest in the program and is often quite proscriptive about the program elements to be provided and the outcomes to be achieved.
• “Investing” – Capacity building grants are grants designed to strengthen the organization’s capacity. They are characterized by their investment approach. The capacity funder provides an organization with funding to build staff capacity and infrastructure.
While funders may have different objectives when they provide funding support, the size and scope of the funding gap identified in this study is a major challenge for all funders and nonprofit organizations. To address this problem, however, the policy and practice implications are different if the funding is in the form of contribution grants or service purchase agreements. For example, when an organization delivers a program through a service purchase agreement, there is an expectation that program funding should be self-sustaining and cover the cost of the program operation. Service purchase agreements 17 J. Unwin, The Grant-making tango: Issues for Funders, Baring Foundation, UK. 2004 18 This contribution grant is meant to be a “donation” to a program, and is not to be confused with the Federal government contribution agreements which are service purchase agreements.
15
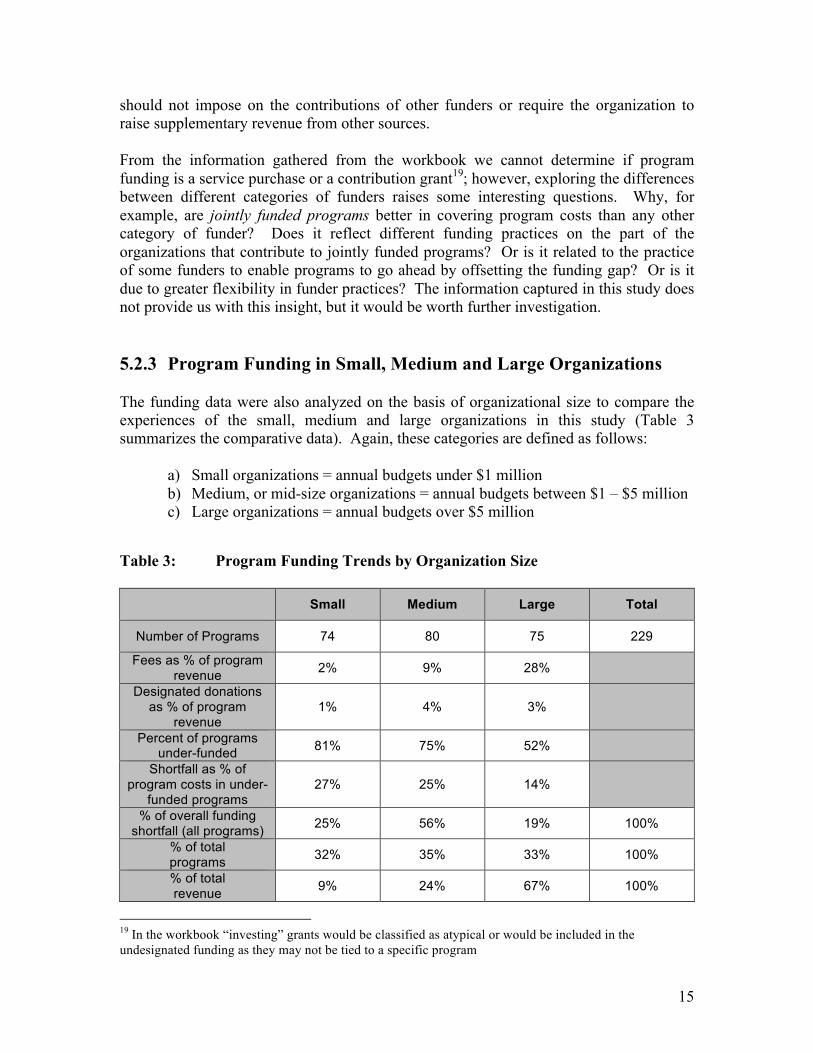
should not impose on the contributions of other funders or require the organization to raise supplementary revenue from other sources. From the information gathered from the workbook we cannot determine if program funding is a service purchase or a contribution grant19; however, exploring the differences between different categories of funders raises some interesting questions. Why, for example, are jointly funded programs better in covering program costs than any other category of funder? Does it reflect different funding practices on the part of the organizations that contribute to jointly funded programs? Or is it related to the practice of some funders to enable programs to go ahead by offsetting the funding gap? Or is it due to greater flexibility in funder practices? The information captured in this study does not provide us with this insight, but it would be worth further investigation. 5.2.3 Program Funding in Small, Medium and Large Organizations The funding data were also analyzed on the basis of organizational size to compare the experiences of the small, medium and large organizations in this study (Table 3 summarizes the comparative data). Again, these categories are defined as follows:
a) Small organizations = annual budgets under $1 million b) Medium, or mid-size organizations = annual budgets between $1 – $5 million c) Large organizations = annual budgets over $5 million
Table 3: Program Funding Trends by Organization Size
Small Medium Large Total
Number of Programs 74 80 75 229
Fees as % of program revenue 2% 9% 28%
Designated donations as % of program
revenue 1% 4% 3%
Percent of programs under-funded 81% 75% 52%
Shortfall as % of program costs in under-
funded programs 27% 25% 14%
% of overall funding shortfall (all programs) 25% 56% 19% 100%
% of total programs 32% 35% 33% 100%
% of total revenue 9% 24% 67% 100%
19 In the workbook “investing” grants would be classified as atypical or would be included in the undesignated funding as they may not be tied to a specific program

16
Small organizations were 61% of the study sample (14 of 23 organizations), with 9% of total program revenues for a total of $4.6 million dollars. In only 19% of the programs in small organizations did program revenues meet program costs, with an average funding shortfall of 27%. Fees at 2% and designated donations at 1% are not significant sources of revenue. The six (6) medium-sized organizations in the study (26% of the sample), received 24% of total program revenues for a total of $11.6 million dollars. Seventy-five percent of programs (60 of 80) had a funding shortfall. The average gap between program revenues and expenditures for these organizations was 25% of program costs. It is interesting to note that the medium-sized organizations represented 56% of the total funding shortfall for all programs (i.e. the difference between program revenues and expenditures), although they delivered only 35% of the total number of programs. Fees and designated donations are more important sources of revenue for these organizations, contributing 9% and 4% respectively to total program revenue. Large organizations comprised three (3) of the 23 study organizations (13%), and received 67% of total program revenue for a total of $32.7 million dollars. Forty-eight percent of programs (36 of 75) were fully funded by program revenues. The gap for those programs where program revenues did not meet program costs was an average of 14%. Fees represent a major source of revenue for these organizations, contributing 28% to total program revenue. Designated donations, on the other hand, contribute only 3% of total program revenues. 5.2.4 Program Funding Stability Another interesting perspective on funding practices relates to the perceived stability of funding sources. The organizations in this study were asked to designate whether they considered a funding source to be stable or short term/unstable. “Stable” funding was defined as funding the organization expected to be available on an on-going basis, including revenue from fees and donations. “Short term/unstable funding” referred to funding that was expected for 2-3 years or less, including one-time funding. It should be emphasized that “stable” only refers to the expected continuity of this funding source; it is not a measure of the adequacy of the funding. Based on the organizations’ own assessments, 89% of total program revenue was described as “stable”, and 10% as “short term”. Funding from the Regional Authorities, Province, Municipal government and jointly-funded programs are largely considered to be “stable” funding. Two-thirds of the funding from Foundations and the United Way is considered “stable”. Funding from the Federal Government was determined to be the least stable, with more than 50% of revenue designated as “short term” or atypical.
17
One third of organizations in the sample had more than 20% of their funding in short term programming. These seven organizations (five of which were small organizations) had $3,200,000 in temporary or short term funding they were juggling. The stability of funding is a significant factor in program design and development. If funding is temporary or uncertain, organizations cannot invest in program and staff development. In many instances they are too busy setting up the program, searching for alternate funding, and/or winding down the program. Moreover, to reduce their liabilities agencies will staff with contract personnel. The recent report by the Calgary Centre for Nonprofit Management20 identifies the top negatives reported by Executive Directors as fundraising, anxiety over finances, difficult human resources issues, high stress, government requirements and long hours. When funding instability is added to the problem of revenues not covering program costs, the scramble and pressure to raise funds and find new sources of revenue is considerable. Program funding instability places significant stresses on the senior managers of the organization and on the volunteer boards of directors, particularly if the services provided with unstable funding respond to an ongoing need in the community. 5.2.5 Program Funding Summary The funding summaries show that program revenues frequently fall significantly short of covering actual program operating costs, requiring organizations to supplement program revenues from other sources, such as fundraising, business revenue and gaming funds. The large organizations in this study received 67% of total program revenue and appeared better positioned to negotiate cost recovery contracts with their program funders, achieving full cost recovery on 48% of their programs. When program revenues did not fully fund expenditures, the funding gap for these organizations averaged 14%. The mid-size organizations fared less well. They received 24% of total program revenue; however, this revenue did not meet expenditures 75% of the time. In such cases, the shortfall averaged 25% of the cost of program delivery. The small organizations had even more difficulties. Program revenues covered the cost of program delivery for only 19% of their programs with an average revenue/expenditure gap of 27% in those programs where programs costs were not fully covered.
This analysis of program funding raised a number of important questions such as:
20 Boland, Jenson, Meyers, Addressing the Leadership Challenge: Nonprofit Executive Directors views on tenure and transition In Alberta, Calgary Centre for Nonprofit Management, June 2005
18
1. Why are mid and small sized organizations so much less well funded for program delivery? Is it the category of funder? Is it their lack of negotiating power? The kind of services they provide? Do they ask for too little?
2. In several categories fees and donations were a significant part of the revenue
source but we do not know how or if variations from year to year in fee or donation revenue contributes to funding shortfalls or surpluses. Are shortfalls the result of fluctuating fee revenues, perhaps due to limited capacity of service users to pay fees, or are funders not appreciating the actual cost of program operation?
3. Is the higher level of designated donations in some funder categories due to
agencies making extra effort to compensate for fee and funding shortfalls or are these programs donors find more attractive? What is the role of designated donations in these programs?
The answer to these questions will contribute to a better understanding of the factors behind the shortfall in program funding that is so pervasive in the community service sector in Calgary. 5.3 The Role of Undesignated Revenues in Off-setting
Program Revenue Shortfalls Figure 4 illustrates the extent to which program revenues cover program expenses. Overall, the total net program funding shortfall across all 229 programs in the sample is $3.6 million, which raises the question as to how organizations bridge such a gap. Organizations rely on undesignated revenues to fill the gap between program revenues and expenses. In the workbook, undesignated revenues are defined as the funds organizations obtain beyond direct program funding, program-specific donations and program-specific fees. For the organizations in this study, these undesignated revenues come from four main sources: gaming revenue, undesignated fund-raised revenue, undesignated United Way funding, and a very diverse catch-all category we refer to as “other miscellaneous revenue”. In Figure 2 (Breakdown of Total Revenue), the average amount of undesignated revenue raised by community organizations was 11.4% of budget. One of the characteristics of undesignated revenue is that it is more flexible funding, without the conditions typically attached to program revenue. As such, these funds can be used to the best advantage for the organization. However, we found there is a significant difference in the ability of organizations to raise undesignated revenues. Four of the organizations in the study (17%) were able to raise in excess of $600,000. Another
19
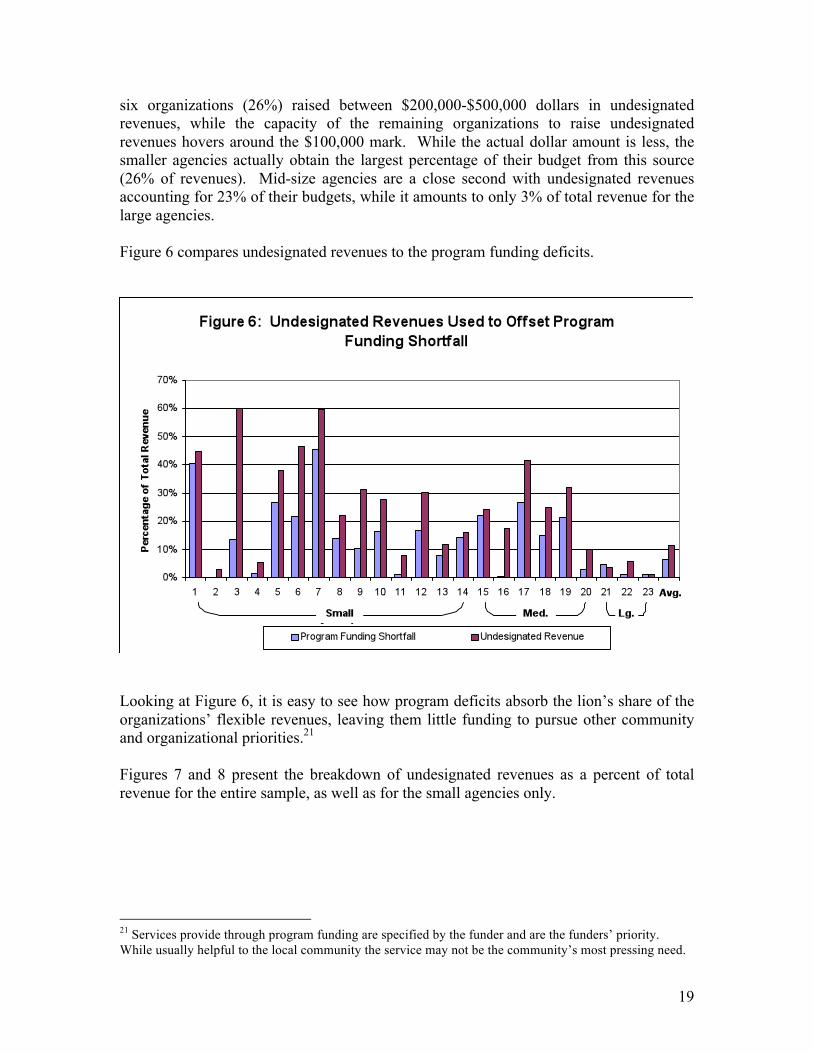
six organizations (26%) raised between $200,000-$500,000 dollars in undesignated revenues, while the capacity of the remaining organizations to raise undesignated revenues hovers around the $100,000 mark. While the actual dollar amount is less, the smaller agencies actually obtain the largest percentage of their budget from this source (26% of revenues). Mid-size agencies are a close second with undesignated revenues accounting for 23% of their budgets, while it amounts to only 3% of total revenue for the large agencies. Figure 6 compares undesignated revenues to the program funding deficits.
Looking at Figure 6, it is easy to see how program deficits absorb the lion’s share of the organizations’ flexible revenues, leaving them little funding to pursue other community and organizational priorities.21 Figures 7 and 8 present the breakdown of undesignated revenues as a percent of total revenue for the entire sample, as well as for the small agencies only.
21 Services provide through program funding are specified by the funder and are the funders’ priority. While usually helpful to the local community the service may not be the community’s most pressing need.

20
Each key source of undesignated revenue is discussed below.

21
5.3.1 Gaming Revenue A closer look at the undesignated revenues raised by the small organizations (i.e. those with budgets under 1 million dollars) shows some very clear patterns. The first is the relative importance of gaming revenue. While fifteen organizations in the study (65%) made use of such funding, this source of revenue was particularly critical for the smaller nonprofits. Gaming revenue accounts for 8.0% of revenue for small organizations, compared to only 1.6% of revenue for the sample as a whole. Gaming revenues are the most reliable undesignated revenue source for small organizations. Ten of the 14 small organizations receive gaming revenues, which typically provide in the range of $40,000 – $50,000 towards their annual budgets. For relatively little effort (i.e. providing volunteers for casino nights), gaming revenue provides the smaller nonprofit organization enough funding to provide some services, providing that critical momentum needed to raise additional funds. Despite the relative ease of raising revenue from gaming, a number of organizations in the study choose not to use gaming funds on the basis of principle. Given the challenge of raising funds from other sources, this is a significant decision. 5.3.2 Undesignated Fund-raised Revenue Fundraising is hard and risky work for community organizations. Of the twenty organizations in this study that engaged in fundraising activity, four actually lost money with expenses greater than revenues. Three organizations raised less than $10,000 net. This means seven of the 20 organizations (33%) lost money, or made very little money from fundraising. Even the large and medium size agencies were only modestly successful at fundraising. The community organizations in this study raised, on average, 3.0% of budget from undesignated fundraising. (Note: this is in addition to funds raised to support specific programs.) This experience raises some interesting questions for further study. More and more organizations are feeling the pressure to engage in fundraising activities in order to generate revenues to support their activities. While this sample is not representative of the sector, it would be useful to undertake a broader analysis to obtain a better understanding of the actual net benefit from fundraising activity, especially for smaller organizations. Does the return warrant the commitment of time and resources (volunteer and staff) and the diversion from the core activities of the organization? Can local community organizations compete successfully for the charitable dollar with larger and more high profile organizations such as colleges, universities, hospitals and the growing number of public foundations?

22
5.3.3 Gifts in Kind While gifts in kind rarely appear on the organization’s balance sheet, we explored how significant gifts in kind are for these nonprofit organizations. Are non-profit organizations looking for and obtaining significant amounts of in-kind donations? Seventeen of the twenty-three organizations (74%) reported gifts in kind. We gathered information on whether these gifts were stable (reasonably expected to continued year over year) or unstable (unpredictable). Seven of the organizations reported stable in kind donations and 10 reported in kind donations that were one time or unpredictable. All 10 organizations receiving one-time/unpredictable donations provided charitable receipts for the donations while only two of the seven receiving ongoing in kind support issued tax receipts. Small agencies were the most active in seeking this type of donation and reported the greatest number and broadest range of gifts. The type of gifts received fell largely into two categories – office supports and program participant supplies. Office support included both outright gifts and access to equipment, office furniture, and IT support. In two instances actual office space was supplied. Three reported donations of either car on lease or conference travel. Program participant supplies included furniture, used clothing, food and hygiene supplies, baby items, tickets to events and movies, household items. From our survey it appears that gifts in kind are not a consistent source of program or office supplies. Gifts in kind are a bonus but are not a substitute for adequate funding of agency infrastructure and program. 5.3.4 United Way Undesignated Funds and Other Miscellaneous
Revenue United Way funding comprises 1.4% of undesignated revenues in the sample. For the agencies that receive this flexible funding it is significant (the United Way also provides designated program funding which is included in the discussion of program funding in section 5.2). “Miscellaneous revenues” also play an important part in the overall funding picture, especially for small organizations, making up almost 10% of their revenues. The sources of miscellaneous revenues are extremely varied. They include investment income, profit from small business ventures, sale or rental of goods, conference and training revenues, as well as undesignated grants from foundations and/or anonymous donors. Miscellaneous revenues for the typical organization usually represent the sum of a number of little pockets of additional revenue. With the exception of one organization that operates a business and applies the profit to fund services, business income was not a significant source of income. Business revenues were typically less than $10,000 and were less frequent than we anticipated at the start of the research.
23
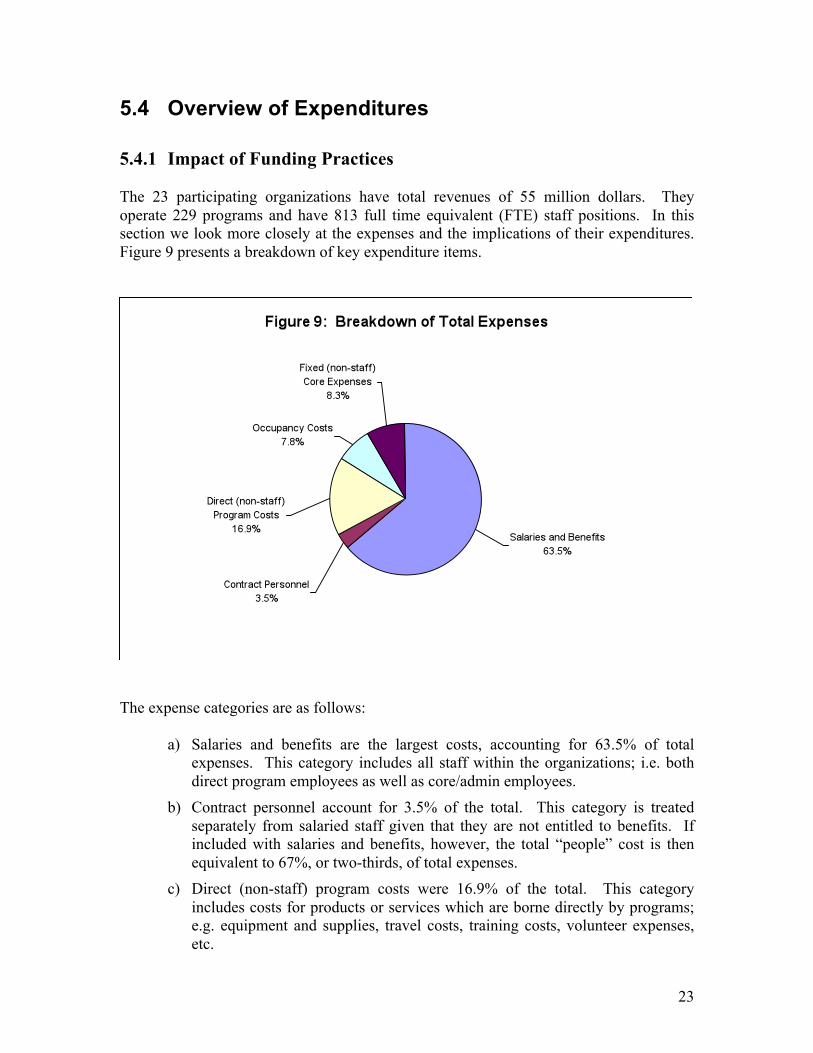
5.4 Overview of Expenditures 5.4.1 Impact of Funding Practices The 23 participating organizations have total revenues of 55 million dollars. They operate 229 programs and have 813 full time equivalent (FTE) staff positions. In this section we look more closely at the expenses and the implications of their expenditures. Figure 9 presents a breakdown of key expenditure items.
The expense categories are as follows:
a) Salaries and benefits are the largest costs, accounting for 63.5% of total expenses. This category includes all staff within the organizations; i.e. both direct program employees as well as core/admin employees.
b) Contract personnel account for 3.5% of the total. This category is treated separately from salaried staff given that they are not entitled to benefits. If included with salaries and benefits, however, the total “people” cost is then equivalent to 67%, or two-thirds, of total expenses.
c) Direct (non-staff) program costs were 16.9% of the total. This category includes costs for products or services which are borne directly by programs; e.g. equipment and supplies, travel costs, training costs, volunteer expenses, etc.
24
d) Occupancy costs account for 7.8% of the total. This category includes costs for rent/lease, utilities, facility maintenance, etc.
e) Fixed (non-staff) core expenses accounted for the remaining 8.3% of the total. This category includes all expenses that are not directly related to the delivery of programs, but which are a shared and essential cost of operating a nonprofit organization; e.g. board expenses, audit costs, bank charges, and central office costs.
The proportion of salaries and benefits relative to other expenses in the nonprofit sector may be due to several reasons. Firstly, salaries and benefits in the voluntary sector are lagging other sectors. Recent human resource studies on the sector report declining wages and a growing gap between salaries in the community services sector and salaries in the government, hospital and education, and private sectors.22 Secondly, given the relatively small size of organizations in this sector they have higher fixed operating costs than larger organizations. Thirdly, when the gap between revenues and expenses widens the only area to yield significant expenditure reductions in the voluntary sector is by reducing staff costs (salaries and benefits). 5.4.2 Benefits One of the measures of staff compensation is the level of benefits provided to staff. The study collected information on funding designated for benefits costs and compared that to the actual cost of benefits incurred by the organizations. The actual experience of the organizations in this study was quite diverse. Four organizations received no revenue for the cost of staff benefits. Among those that did receive funding for benefits, this funding generally lagged well behind the cost of those benefits. Benefits costs across the sample average 13% of payroll while the organizations received an average of 7.5% of payroll for benefits, leaving a gap of 40% in unfunded benefits. For benefits alone the organizations in this study have to find an additional $1.5 million to cover their costs. Moreover, many agencies offer relatively low-cost benefit packages to their staff. No agency paid in excess of 20% in benefits; indeed, only six organizations (27%) offered benefit packages over 15% of payroll and nine (41%) offered packages between 10% and 15% of payroll. Five (23%) had benefits expenses of between 5% and 10% of payroll. Not enough is known about the quality or adequacy of the benefit packages offered by the organizations in our sample. From our data we know that 79% of the organizations offer extended health benefits and 42% offer other benefits; however, only 37% have Workers’ Compensation coverage and 37% pay RRSP contributions.
22 Saunders, R. (2004). Passion and Commitment Under Stress: Human Resource Issues in Canada’s Non- Profit Sector-A Syntheses Report, Canadian Policy Research Network Research Series on Human Resources In the Non-Profit Sector,

25
In a hot employment market like Calgary, as nonprofit organizations lag behind in wages and benefits, they will have trouble attracting and keeping qualified staff. 5.4.3 Core Costs Core costs cover the shared functions that make an organization run - functions such as finance, human resources, information technology, records maintenance, facility maintenance etc. Core costs include both staff costs and other expenses related to these functions. Core Costs as a Percentage of Budget Funders and organizations are always most interested in what is a realistic level of core costs. It has been difficult to get a handle on the level of real core costs. Many organizations have had to downplay their real operating costs for so long, that even the organizations themselves do not know what their real overhead costs are or if they are in line with other similar organizations. With two studies completed using the same methodology to calculate overhead, we can begin to see the range of core costs for the different sizes of organizations. The following table presents the findings from the earlier Eakin study of ten (10) agencies in Toronto23 and the 23 Calgary organizations in this study. Table 4: Summary of Core Costs
Average core costs as % of total expenses
Small agency average
core % of expenses
Medium agency average
core % of expenses
Large agency average
core % of expenses
Fixed core expenses
(non staff)
Toronto 19% 21% 21% 14% 6%
Calgary 26% 30% 24% 13% 8%
The percentage of shared core services shows some economies of scale with the large organizations, operating at an average of 13% - 14% overhead. Mid-size and small organizations operate on average in the 21-30% range. In the financial workbook core costs are allocated on the basis of revenue. Every dollar of revenue received by the organization is assigned its share of core costs (organizational overhead), regardless of the source of funding. In this way the organizational overhead is
23Eakin, Community Capacity draining; The Impact of funding practices on Community Organizations, Social Planning Council of Toronto 2004

26
equitably shared across all sources of revenue, including fees, designated donations, undesignated revenues, and direct program funding. Although the workbook allocates core costs against the funding received from program funders, in actual fact individual program funders may attach conditions to their funding specifying the funding lines or types of costs (e.g. direct service only) the funding can be used for. This means the funds received from program funders cannot be reallocated. Of the 229 programs, 166 (72%) had a shortfall of revenue for core expenses. The total actual shortfall in the 166 programs was $2.8 million of core costs, or 40% of the $7.1 million in core costs allocated to the 229 programs. When the 63 fully funded programs are included the net shortfall drops to $1.8 million or 25% (similar to the treatment of program costs, the workbook requires core costs to balance, so when core costs are allocated to programs without actual revenue to cover those costs, the programs that are fully funded have their core costs reduced and therefore show a surplus). The organizations’ undesignated revenues are covering this $1.8 million shortfall. It is interesting to note that of the total program funding shortfall among all 229 programs ($3.6 million), essentially half is related to an under-funding of programs’ share of core costs (49.4%), while the other half is related to an under-funding of programs’ direct service and supervision costs (50.6%). This observation is even more striking when we consider that of all program revenue ($48.9 million), 89.2% is allocated to direct service and supervision, while the remaining 10.8% is allocated to core. Essentially this means that there is far less attention paid to the funding of core costs as compared to the funding of direct program costs. Appendix C provides a detailed breakdown of the data by the various categories of funders, as well as a breakdown of core cost recovery based on organizational size; however, summaries of each analysis are presented in Tables 5 and 6.

27
Table 5: Summary of Core Cost Funding by Funder Category
Federal Prov. RA City Found/UW/Other NP
Jointly funded
All Others * Total
Number of Programs 12 20 38 25 50 43 41 229
Percent of programs with
core costs under-funded
67% 90% 42% 84% 80% 91% 59%
Shortfall as percent of
core costs in under-funded
programs
30% 77% 57% 55% 60% 66% 40%
Percent of core funding
shortfall (of all programs)
2% 20% -16% 15% 7% 56% 17% 100%**
Percent of total number of programs
5% 9% 17% 11% 22% 19% 18% 100%**
Similar to the experience with program funding, this study found that all categories of program funders under funded core costs. The most severe funding shortfall of core costs occurred in the “jointly funded” category (i.e. two or more funders co-funding a program), where 91% of their programs have an average core cost shortfall of 66%. This category alone is responsible for 56% of the total core funding shortfall, which is significant given that this funder category accounts for only 19% of all 229 programs in the sample. This raises questions about whether each funder thinks the other is covering core costs or whether there is a greater expectation in shared programs that the organizations should find alternate revenue sources to cover core costs. Regional authority funding provided the most complete coverage of core costs. Fifty-eight percent of regional authority programs were fully funded, but the other 42% had an average shortfall of 57% in core funding. The shortfall was greatest for those programs funded by the Calgary Health Region at 66%, compared to 53% for programs funded by Calgary and Area Child & Family Services. Compared to the other funder categories, the regional authorities provide the most support for core funding. Provincially-funded programs account for 20% of the shortfall in core funding and municipally-funded programs accounted for 15% of the total shortfall. We do not know from the data whether the core funding shortfall occurs because the organization did not ask for funding for core costs, if the funder does not recognize core costs, or some combination of the two. It is a vicious circle with organizations not asking because they fear funders will not pay and funders not paying because they poorly understand the importance of core costs to program delivery. Either way, everyone involved is poorly served when core costs are not a recognized expense.

28
Table 6: Summary of Core Cost Funding by Organization Size
Small Mid-size Large Total
Number of Programs 74 80 75 229
Percent of programs with core costs under-funded 78% 80% 60%
Shortfall as percent of core costs in under-funded programs 55% 61% 55%
Percent of core funding shortfall (of all programs) 16% 66% 18% 100%
Percent of total number of programs 32% 35% 33% 100%
We looked at the small, medium and large organizations to see if there were differences among the groups in their ability to cover their core costs. What we found was that shortfalls in core cost recovery are a serious challenge for the community agency. The large organizations fared best with 40% of their programs covering core costs, the small organizations had 22% of programs covering core costs and the mid-size organizations had only 20% of their programs covering core costs. The mid-size agencies were significantly worse funded for core costs than the large organizations. The average shortfall in funding to mid-size organizations for core costs was 61% and 80% of all their programs were short funded. The shortfall of funding for core costs to mid size organizations accounted for 66% of the shortfall for all the programs combined. Surprisingly, the small agencies fared somewhat better, where 78% of their projects had a shortfall of core costs though the average shortfall was less, at 55%. Small organizations incurred 16% of the overall shortfall for core funding. The large agencies had a pattern similar to the small agencies but fewer of their programs were affected (60% of programs had shortfalls averaging of 55%, representing 18% of the total shortfall across programs). 5.4.4 Supervision This study collected data on the level of funding provided to cover the cost of program supervision. Figure 10 illustrates the average funding for supervision by organization size.

29
Many grants do not fund program specific supervision/program management, often covering salary costs for front line staff only. However, direct service programs do not spontaneously run themselves. Staff need to be hired, trained, helped to design and delivery the program, community collaboration and networking is needed to tie the program into other services in the community, locations and equipment secured, etc. These are some of the roles performed by supervisory or program management staff. If the cost of supervision/program management is not adequately funded, organizations are faced with several choices. They can cover these costs from other revenue sources or add responsibilities to other staff, such as, by increasing the number of staff supervised by one position. As can be seen from Figure 10, the level of funding for supervision increases with organizational size, with the small agencies averaging only 2.4% of program expense for supervision, compared to 4.3% for medium size organizations and 7% for the large agencies. Only the large agencies seem to be able to consistently negotiate significant funding for program supervision and management at 7% average; however, this is not to suggest that even at this level the funding for supervision is adequate. Funding supervision at a rate of 7% of program expense is the equivalent of providing one supervisor/manager for fifteen full-time staff. In community based programs, this would often mean being responsible for three or four different programs and upwards of 20-25 different staff once part-time staff are included. In the smaller organizations, funding is inconsistently provided for front line program management. If program management is not recognized, as the organization acquires additional programs the cumulative pressures on the core staff to provide program

30
management mounts. It must also be remembered that the small organizations also have the greatest levels of program under funding and funding instability, placing additional pressure on senior staff. Organizational size appears to be a key factor in the ability to negotiate program management funding. Organizations providing similar types of services did not receive similar levels of program management resources. There appears to be no benchmark or standard within programs regarding suitable levels of program management funding. This lack of consistency raises questions regarding risk and quality management strategies for both the organizations and their funders. 5.4.5 Overtime Information on the use of overtime was collected for frontline, supervisory, administrative and senior management staff. Overtime for front line and administrative staff was reasonable and was compensated in overtime pay or time back. However, overtime for supervisory and senior agency staff reflects the pressures described in recent provincial and Calgary surveys.24 Organizations were asked to indicate the number of staff who worked overtime in the following categories.
i. very often (averages 11+ hours per week than scheduled) ii. often (averages 5-10 hours per week more than scheduled) iii. sometimes (averages 2-4 hours per week more than scheduled) iv. seldom (up to 6 hours on average each month) v. rarely (only in extraordinary circumstances works more than scheduled)
Analysis of the overtime data revealed the following:
• Twenty-eight per cent of supervisors worked in excess of 11 hours a week overtime on a regular basis for which they receive no compensation (either they could not find the time to take compensating time off, or were not granted such a provision.) More than half of the supervisors (53%) in the sample worked overtime (“very often” and “often”) on a regular and continuing basis.
• All data for senior management was collected as a group. Senior management
includes such positions as financial, human resource, development and program directors, as well as Executive Directors. Nineteen per cent of senior managers work more than 11 hours uncompensated overtime per week and an additional 20% work between 5-10 hours of uncompensated overtime weekly. In total, 38% of senior management worked significant hours of uncompensated overtime on a regular basis.
24 Boland, Jensen and Meyers, 2005 and Cherneski, 2005

31
5.4.6 Volunteers Organizations reported that they used volunteers in two ways. Some organizations used volunteers to undertake work essential to the operation of the organization – work that would have to be replaced with paid staff if volunteers were unable to undertake the work. In other cases organizations used volunteers to enrich and extend their work. In these instances the activities of the volunteer would not have been replaced by paid staff if the volunteer had not been available. In most instances the activity would not be undertaken. This does not mean the activity was not important, just that it was not essential or was beyond the reach of the program. All the volunteer information provided is program and project related; information was not collected on volunteers engaged in governance. The research captured both essential and value-added volunteer activity. Figure 11 shows the essential volunteer contribution and the value added contribution of volunteers.
Some agencies operate with significant volunteer labour to accomplish essential organizational and program tasks. Usually essential activities are undertaken by volunteers when the organization cannot afford to employ paid staff. In small organizations, on average 10% of essential work is done by volunteers. Between the small and mid size agencies, the equivalent of 19 full time staff positions were donated
32
by volunteers to the essential work of the organizations. The small and mid size organizations attract and coordinate significant volunteer contributions. The list of roles that essential volunteers fulfil is long and varied and includes such roles as: reception, evaluation, administration support, childcare for program, care attendants, community outreach, computer trainers, tutors/mentoring, legal services, interpretation and translation, charitable donation administration, intake workers, leisure/recreation, community kitchen, hamper program, photographers, librarians, and janitorial services. Relying on volunteers for essential functions can be very stressful and leave organizations vulnerable when volunteers are unable to follow through. Community organizations are very successful involving volunteers and volunteers make important contributions. Volunteers, however, should not be considered a reliable alternative to paid staff for essential organizational functions. 6. What the Participating Organizations Learned Feedback from the participating organizations was captured on two fronts:
i) informal comments conveyed to the Workbook Coach during the process of data collection; and
ii) a formal evaluation, which was delivered to CCVO directly upon completion of the project.
Upon completing the workbook, the most common learning on the part of the participating organizations was in seeing the true costs of their programs. This was generally more applicable to the small or mid-size organizations, however, in that the larger organizations (all of which had been in operation for over twenty years) had already developed a greater level of sophistication in this regard. In fact, the greatest eye-opener for a number of these organizations related to the size of their programs’ core costs. As is discussed in section 5.4.3 of this report, program-specific core costs are not funded in a consistent fashion; however, there could be any number of reasons for this disparity. While some funders do provide limited support for core costs, it may also be true that the under-funding of core costs relates to an organization’s miscalculation of these costs to begin with (i.e. by not having a good handle on such costs, they may not request adequate funding). The workbook provided the participating organizations with precise information, free of any personal bias. For a large percentage of organizations, the tool allowed them to view their financial systems and budgets from a different perspective which, for some, subsequently led to a re-evaluation of their processes related to human resource

33
management, effective program delivery, revenue diversification, and asset management. A number of organizations also commented that they planned to apply their new-found knowledge during their next budget preparation phase, and that they would be able to more accurately forecast the cost of future programs. It should also be mentioned that the level of coaching support provided was a key contributor in enabling the organizations to complete the workbook in a relatively short amount of time. As determined from the evaluations, the organizations responded positively on the coach’s detailed knowledge of the workbook, as well as his ability to troubleshoot questions effectively and respond in a timely fashion. In fact, some said that they would not have been able to complete the project without this support. 7. Key Observations and Analysis A Complex and Fragmented Funding Environment
The description that emerges from the data is of a complex and fragmented funding environment that is poorly serving both funders and the nonprofit organizations. The 23 nonprofit organizations in our sample, regardless of size, relied on a wide variety of revenue sources to cover the costs of program operation. While almost one third of programs in this study received sufficient funding from program revenues to cover the cost of program delivery, the organizations were cobbling together funding from multiple sources to cover off the revenue/expenditure gap for more than two-thirds of all programs. Small and mid-size organizations had greater difficulties covering the costs of programs. The mid-size organizations had the largest share of the funding gap (56%), even though they account for only 24% of total program revenues. Since the organizations on average provided four distinct programs, a single organization could easily be coordinating eight funders for their four programs. In addition, they would seek funding from numerous other sources, including gaming revenue, undesignated grants, fundraising and perhaps fees in order to generate the flexible funding needed to pay for the supervision, staff benefits and core operating costs that are often not adequately covered by program funding. All of these funders and funding sources are required even though many of the community organizations in the sample are small in organizational terms. Fourteen (14) organizations in the study sample had operating budgets under 1 million dollars, six (6) organizations had budgets between 1-5 million, and three (3) had budgets over 5 million dollars. To survive, organizations are required to cobble together funding from a variety of sources to make an organization work. Organizations are juggling different timelines – does the foundation grant period match the government grant period? They have to apply to more than one source because they might not get the funding being sought. What
34
happens if they get both grants or lose them both? They return any surpluses to funders, but are left to cope with all deficits on their own. The complexity in funding patterns that emerged from the data has clear implications for the strains and challenges in managing nonprofit organizations, issues that have been identified in other studies, both local and national. Broad-based and Systemic Funding Challenges Of the 229 programs included in the revenue analysis, 70 (31%) covered the cost of program operation with program revenues, which included fees and fundraised revenue specific to those programs. The remaining 159 programs (69%) had to be supplemented with revenues from other sources in order to cover program costs. In-depth analysis of primary funder categories (e.g. federal, provincial, municipal, foundations, etc.), found a revenue/expenditure gap averaging 19% of program costs among programs which were under-funded. The data showed significant and system wide gapping between the cost of program operation and program revenues. We do not know from the financial analysis if funders are purchasing services under service contracts or if funders are providing a contribution (grant) to assist with program operations. However, regardless of the funding approach, in two-thirds of the cases, program revenues (including funders’ contributions, fees and designated donations) do not cover the cost of service provision and therefore fall short of achieving the objectives of funders and meeting the needs of the organizations. The wide spread difficulty with obtaining sufficient revenue to cover the cost of programs negatively impacts both the nonprofit organizations and their funders. Several recent studies have identified the difficulties nonprofit organizations have in trying to patch together enough funding from different sources to cover their operating costs and how this diverts critical management and volunteer time from attention to mission. In this study we can now also see the impact on funders working with non-profit organizations to build strong and resilient communities and provide important services to the people of Calgary. No funder escaped the draining impact of the revenue/expense funding gap. All but one of the 23 organizations studied had a revenue gap to contend with. Even funders paying the full cost of service provision were impacted. By paying their full share, they indirectly subsidized other funders and the stress placed on the organizations to meet the funding gap of their other programs takes disproportionate amounts of management’s attention away from program delivery. Core Funding is Linked to Organizational Capacity One of the major findings of this study was the under-funding of core costs. This study begins to document the extent of the problem. For the 229 programs in this study, 72% of programs did not receive enough funding to cover their core costs. The total net shortfall was 25% of the $7.1 million in core costs allocated in the 229 programs.

35
There appear to be many factors that contribute to the under-funding of core costs. Many funders have shied away from supporting the common core costs of nonprofit organizations wanting all funding to go directly to program. The focus by some funders on funding “only program costs” has contributed to a situation where both the funders and the nonprofit organizations minimize the importance and true costs of overhead. This situation is compounded by the fact that many organizations do not have a clear understanding of their overhead costs or the true full cost of delivering a program. As a result, they may not request sufficient funding to cover their core costs. Many organizations participating in the study were pleased to be able to calculate in a structured way, across programs, the cost of overhead and be able to see from the workbook reports what costs they were recovering on which programs. Going forward these organizations will have a much better understanding of their core costs and will be in a much better position to ask for recovery of these costs. However, these and other organization will need funders to recognize core costs. Some agencies report that their proposals are rejected if they include core costs, so they shy away from including them in order to improve their chances for funding. This may be a logical response, given the pressure to generate revenue, but in the longer term it fundamentally undermines the capacity of the organization to serve the community. Core costs include such functions as senior management, human resources, volunteer management, finance, governance, information technology, data management, records, insurance, shared facilities costs, etc. Funders need to recognize that these are legitimate costs of running an organization and pick-up their fair share. If funders of individual programs do not acknowledge and support an appropriate portion of the shared core costs, they need to understand that they are transferring this burden to other funders who end up paying more than their fair share of core costs. The bottom line is that because core costs are essential to the functioning of the organization and its program delivery, they must be covered somehow. If they are not adequately funded, organizations will have to generate revenue from some other source to offset this deficit. If that is not possible, then they may be forced to make difficult choices, such as deferring maintenance, reducing supervision, limiting insurance coverage, etc. – choices that have consequences for the health and vitality of the organization. When funders do not adequately contribute to the core costs of the organization, they undermine the capacity of the organization to be able to deliver the program they are supporting. It is particularly concerning that organizations reported that more funders are moving to program funding. Based on the apparent inadequacy of program funding identified in this study, that trend would suggest increased challenges for the financial sustainability of organizations in the future.
36
Fees and Fundraising are not Part of the Solution Fees provided 18.8% of total revenues in this study, but were not evenly distributed throughout the sample organizations. Fees were a significant source of revenue for only three organizations; 60% of the study sample did not collect any fees and another 25% received less than 10% of their revenue from fees. Many services provided by nonprofit organizations do not lend themselves to successful fee charging, particularly for those organizations serving marginalized or at risk populations. Undesignated fundraising accounted for only 3.0% of total revenues (though an additional 2.6% of total revenues were obtained from program-specific donations). As a means of generating revenue, fundraising takes time, connections and know-how to attract charitable donations, assets many community based organizations do not have. The experience of organizations in this study suggests that many organizations have difficulty in raising funds, especially the smaller organizations. Of the twenty organizations that tried to raise charitable donations, four actually lost money and three others netted less than $10,000 each for their efforts. The results of this study bring into question the potential for fees or fundraising as solutions to address the revenue/expenditure shortfall experienced by organizations. The Impact of the Revenue/Expense Funding Gap on Human Resources The data gathered identified serious problems with funding for the supervision/ management of programs, for the provision of benefits to staff, and to cover the cost of core management functions. To compensate for the lack of funding for management and administrative staff, supervisors and senior managers are providing significant amounts of uncompensated overtime on an ongoing basis and volunteers are providing essential organizational and program functions. The voluntary sector in Calgary faces serious recruitment and retention challenges as they have limited ability to attract and retain staff in a competitive market environment. The effectiveness of these organizations is based on the quality of their staff and volunteers. The systemic underfunding of the sector risks undermining the investments of funders and local donors in communities. The Interplay between Service Delivery and Community Building The research reinforces how important direct program funding is to community organizations (i.e. money from funders provided explicitly for the provision of a specified program or service). It provides critical revenue to support the organization, accounting for 67% of all revenues, with the greatest proportion (53%) coming from various levels of government. Providing services for funders, especially governments, provides a critical extension to community organizations. Such program funding could, if properly
37
funded, provide a stable base for organizations to develop the resources to serve the needs of their community. Unfortunately this is not how it is currently working. The gap between program expenditures and revenues has meant most of the 11.4% of flexible (i.e. undesignated) funding raised by the non-profit organizations is going to back-fill revenue gaps in programs. These flexible resources are therefore not available for meeting local community needs, building partnerships in communities, or developing innovative programs to meet emerging community challenges. Nonprofit organizations need to improve their capacity for cost analysis as a basis for negotiating and applying for funding that will cover program expenses, so they can ensure the flexible financial resources they develop can be used to build and renew their communities. The Limitations of the Silo Approach to Funding Program funders, looking at the maze of funding for community agencies have worried that the organization may be receiving funding for the same service twice. Based on our research, the revenue/expense gap of most funded programs is a much larger concern than the potential for such double-dipping. Program funding for services is currently provided as if it is “silo” funding, targeting a specific service and target group and operating as if the funder and the organization were in an exclusive relationship. The reality is far different. In analysing program funding, it becomes clear how the funding practices of one funder impact other funders. The health and sustainability of an individual program has ramifications for other programs delivered by an organization. Interdependence, not independence, is the operative principle. All funders contributing to an organization have a common interest in ensuring the organization is funded adequately and fairly and that the funding regime does not place inordinate demands on an organization’s time and energy. A more holistic perspective of the health of the entire organization, rather than just one program or initiative, is essential for the longer term sustainability of organizations. 8. Conclusions Running on Empty The financial profile of nonprofit community organizations emerging from this study is very significant. We now understand that community based nonprofit organizations are not competing successfully for the charitable dollar, often cannot charge significant fees, and have little clout to wrestle full-cost funding for program service agreements. It gives

38
us a clearer understanding of the cumulative impact of financing practices on nonprofit organizations providing programs and service to the people of Calgary. Nonprofit organizations have demonstrated amazing resilience in serving their community. The boundless optimism that makes some people want to make the world a better place, and the quiet determination to succeed that so characterises community nonprofit organizations has fooled policy makers, funders, communities, and the organizations themselves into thinking community organizations will always be there, that they will find a way to manage. The hard financial analysis shows otherwise. The community organizations in the research sample are surviving but at what effort and at what cost? If funding practices were changed what else could be done with the energy that currently goes into balancing the budget? It is time to ask serious questions about the sustainability of organizations that contribute so significantly to the quality of life in Calgary. 9. Recommendations Nurturing vibrant and resilient communities requires thoughtful and deliberate planning. The following policy and research directions emerge from this report.
1. Funding policy needs to be redesigned to better accomplish funding objectives and improve returns on investment. Nonprofit community funding needs to be delivered in such a way as to support the dual purpose of service provision and local community building objectives. It needs to enhance and build the capacity of local nonprofit organizations, and recognize the interdependence of community funders in supporting community organizations.
Future Research:
• What is the current mix between service purchase agreements and contributions (grants)? Do the funding methods match the outcomes funders are seeking?
• What changes to policy and practice are required so both service purchasers and contribution funders facilitate organizations focus on their services and mission and do not exacerbate financing difficulties?

39
2. Funders need to move rapidly toward providing full cost funding for services they purchase from community organizations. The underfunding of program costs, including core costs, is a drain on the capacity of organizations to serve their communities. It diverts limited resources in a constant struggle to fill the revenue/expenditure gap. It is a reasonable expectation that organizations that purchase services from community organizations should pay the full cost of those services. If they do not, they erode the community capacity they rely on. On the other hand, nonprofit organizations need to increase their capacity to calculate the cost of program operation and improve their capacity for financial analysis and negotiation with funders. Additional research is required to understand the reasons behind the high incidence of the gap between revenue and program expenses. The problem is pervasive throughout the community sector but is particularly acute for small and mid-size organizations. Why? What are the factors contributing to this situation?
3. Room to grow and innovate – a policy for small nonprofit organizations.
Alberta has a large number of small nonprofit organizations. Innovation and new community needs are often behind the emergence of new small nonprofit organizations. A healthy nonprofit sector needs to be able to incubate new nonprofits and provide the most successful with room to grow and develop. A funding policy for small nonprofit organizations should recognize the special challenges these organizations face and include measures for ensuring stability of funding so they can get develop their potential.
4. Invest in mid-size organizations. This study suggests that mid size nonprofit organizations are very successful in recruiting volunteers, raising other sources of revenue and realizing efficiencies of scale; however, they experience the highest levels of under funding for program and core costs. By their size and longevity of service, they have demonstrated their success in meeting community needs. Program funders need to invest in and support mid-size organizations in local communities as a sound strategic investment strategy.

40
5. Support community service provider organizations to complement, enhance, extend, and support other key service sectors like health and education. The larger community based service provider organizations have special responsibilities and roles as major non-government service providers. Community service providers, however, because they are a smaller and diverse group have not received the same resourcing or policy attention as larger and more visible sectors such as health and education. Research needs to be undertaken on how government planning processes can ensure the community sector is included as a key component of vibrant and healthy communities.
6. Sharing the wealth with community organizations. The competition for charitable donations is increasing and individual community based organizations are not able to compete effectively against the growing number of large, well-resourced fundraising campaigns undertaken by hospitals, universities, and other organizations, including foundations which raise funds for services previously funded by tax dollars. Creative planning needs to take place to assist them community organizations to obtain a share of the wealth transfer that is taking place in communities.