TAKE A FEW MORE MOMENTS - Zespri · 2 Financial Highlights 3 Chairman and CEO’s Report 11 Zespri...
76
TAKE A FEW MORE MOMENTS ... Annual Report 2016/17
-
Upload
nguyendieu -
Category
Documents
-
view
216 -
download
0
Transcript of TAKE A FEW MORE MOMENTS - Zespri · 2 Financial Highlights 3 Chairman and CEO’s Report 11 Zespri...

TAKE AFEW MOREMOMENTS ...
Annual Report2016/17
© 2017 Zespri Group Limited. All rights reserved.
Zesp
ri Gro
up
Limited
Annual Rep
ort 20
16/17

N E W Z E A L A N D
AU ST R A L I A
I N D O N E S I A
M A L AYS I AS I N G A P O R E
TA I WA NH O N G KO N G
I N D I A
U N I T E D A R A B E M I R AT E S
S O U T H A F R I C A
B R A Z I L
S PA I NI TA LY
SW E D E N
U N I T E D K I N G D O M
F R A N C EB E LG I U M E U R O P E
U N I T E D STAT E S O F A M E R I C AJ A PA N
S O U T H KO R E A
C H I N A
M E X I CO
Using vibrant messaging and ‘magic’, the Beyond
Expectation campaign promotes the health
benefit of Zespri Green Kiwifruit to families.
The ‘Kiwi Brothers’ have taken Japan by storm
with their madcap antics in the fresh produce
sections of supermarkets, highlighting the health benefits and quality of
Zespri Kiwifruit in a funny and memorable way.
European consumers got to experience a
New Zealand kiwifruit orchard for themselves
with this augmented reality game held in
busy railway stations.
People in the Middle East and India have wholeheartedly embraced social
media and our team ran a series of short, light-hearted videos to introduce
Zespri Kiwifruit across the region.
Our ‘Go for Gold’ campaign encouraged consumers to make
healthy everyday choices with Zespri SunGold Kiwifruit, with promotions
alongside events from running competitions to yoga activations.
Zespri once again teamed up with McDonald’s to include
Zespri SunGold in Happy Meals in a special promotion
across the country.
72Zespri Group Limited and Subsidiaries Annual Report for the year ended 31 March 2017Zespri Annual Report 2016/17
TO CELEBRATE... ...


SEASON OVERVIEW
ANNUAL MEETING
Zespri sold more fruit faster than ever before during the 2016/17 season. The total volume from New Zealand was 137.7 million trays, which is 18 percent above the previous year and 45 percent greater than two seasons ago. Sales from Zespri Global Supply also increased, by 14 percent to 16.6 million trays, driven mainly by SunGold coming into production in Italy.
Zespri sold almost double the volume of SunGold from New Zealand compared with 2015/16 and delivered a third season in a row of Green returns of over $50,000 a hectare. Volume growth and continued strong investment in marketing and market development helped to lift the total fruit and service payment, including the loyalty premium, by 21 percent to $1.38 billion. Export earnings also increased by 21 percent, to $1.603 billion.
Zespri’s net profi t aft er tax more than doubled from $35.8 million to $73.7 million, mainly due to licence revenue from the SunGold tender in 2016. This will be realised over a number of years. Zespri announced a full year dividend of 25 cents a share. Normalised profi t aft er tax for the fi nancial year was $78.8 million.
The season was challenging in several respects. The sharp increase in Green volume and a late start to the season owing to delayed maturity put pressure on pricing, but record average yields of
12,281 trays per hectare enabled the industry to achieve per-hectare returns at $53,555. The Green return was $4.36 per tray. The extraordinary increase in Green volume to over 93 million trays in gross submit led to a programme of crop management as the best way to handle fruit in sizes surplus to demand.
SunGold again delivered an outstanding result, with an average per-tray return for the Gold pool rising to $8.64 despite an increase in supply to 48.5 million trays from 32.6 million trays in 2015/16. Average per-hectare returns increased by 39 percent to $98,838. The customer and consumer response to SunGold was very positive, supporting our confi dence in market demand. Zespri allocated a 400-hectare tranche of SunGold licence in 2016, which attracted strong participation, and completed a second 400-hectare allocation in 2017 as the outlook for growing market demand continues.
Looking ahead, Zespri aims to implement a consistent strategy to deliver value to growers and shareholders. Our primary focus is on growing demand ahead of supply, fulfi lling demand and innovating to develop more eff ective ways to deliver value. The 2016/17 season again generated robust returns and the challenge is to sustain and improve performance over coming years.
A remarkable season of record yields and the largest-ever New Zealand crop.
31 MARCH2017
Financial year-end
19 JULY2017
Annual Report circulated
22 AUGUST 2017 - 1PM
Deadline for receipt of proxies for
Annual Meeting
24 AUGUST 2017
Annual Meeting
ANNUAL MEETINGThe Annual Meeting of Shareholders of Zespri Group Limited will take place at 1pm on Thursday 24 August 2017 at ASB Arena Baypark, 81 Truman Lane, Mount Maunganui.
DECEMBERAND AUGUST
Indicative dates for dividend payments, December (interim)
and August (final)
ANNUALREPORT
For full financial statements, please
refer to the separate Annual Report,
available on www.zespri.com
1 www.zespri.comZespri Group Limited and Subsidiaries Annual Report for the year ended 31 March 2017
2 Financial Highlights
3 Chairman and CEO’s Report
11 Zespri Alternative Revenue Statement
13 Cause of Change
13 New Zealand Pool Costs
15 Corporate Governance
22 Auditor’s Report
25 Financial Statements
29 Notes to the Financial Statements
62 Statutory Information
71 Zespri Around the World
CONTENTS
2016/17 2015/16 Variance
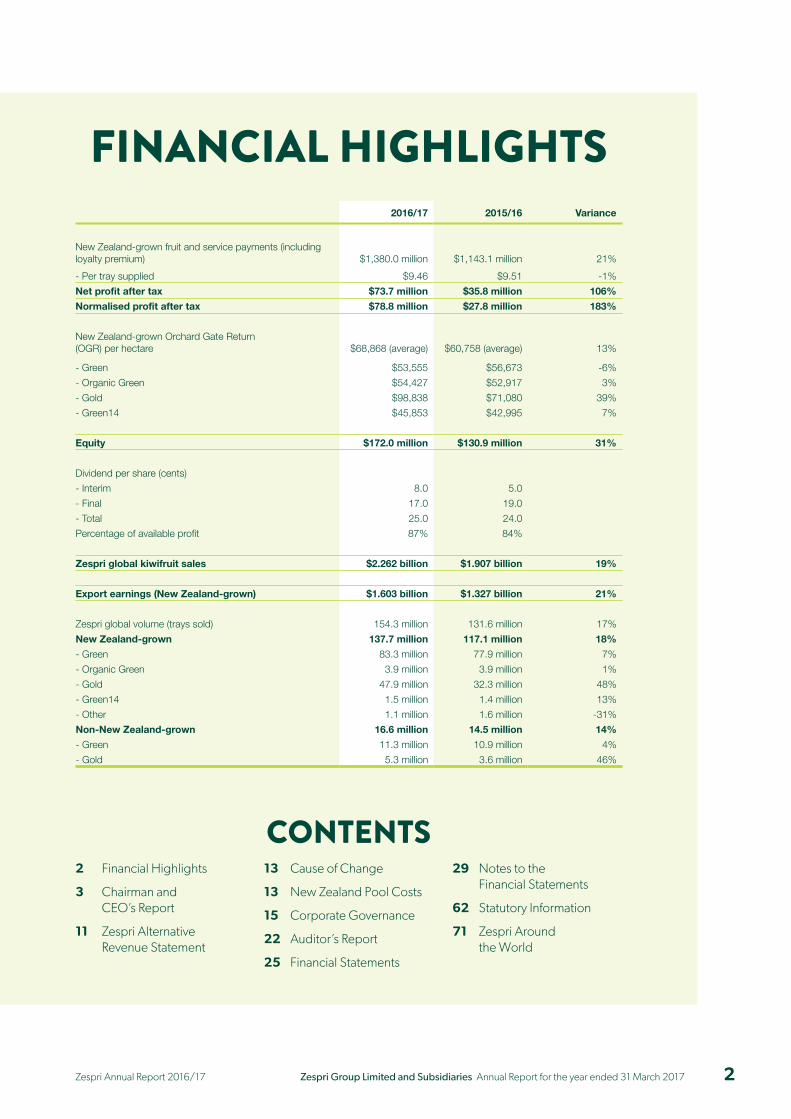
New Zealand-grown fruit and service payments (including loyalty premium) $1,380.0 million $1,143.1 million 21%
- Per tray supplied $9.46 $9.51 -1%
Net profit after tax $73.7 million $35.8 million 106%
Normalised profit after tax $78.8 million $27.8 million 183%
New Zealand-grown Orchard Gate Return (OGR) per hectare $68,868 (average) $60,758 (average) 13%
- Green $53,555 $56,673 -6%
- Organic Green $54,427 $52,917 3%
- Gold $98,838 $71,080 39%
- Green14 $45,853 $42,995 7%
Equity $172.0 million $130.9 million 31%
Dividend per share (cents)
- Interim 8.0 5.0
- Final 17.0 19.0
- Total 25.0 24.0
Percentage of available profit 87% 84%
Zespri global kiwifruit sales $2.262 billion $1.907 billion 19%
Export earnings (New Zealand-grown) $1.603 billion $1.327 billion 21%
Zespri global volume (trays sold) 154.3 million 131.6 million 17%
New Zealand-grown 137.7 million 117.1 million 18%
- Green 83.3 million 77.9 million 7%
- Organic Green 3.9 million 3.9 million 1%
- Gold 47.9 million 32.3 million 48%
- Green14 1.5 million 1.4 million 13%
- Other 1.1 million 1.6 million -31%
Non-New Zealand-grown 16.6 million 14.5 million 14%
- Green 11.3 million 10.9 million 4%
- Gold 5.3 million 3.6 million 46%
FINANCIAL HIGHLIGHTSSEASON OVERVIEW
ANNUAL MEETING
Zespri sold more fruit faster than ever before during the 2016/17 season. The total volume from New Zealand was 137.7 million trays, which is 18 percent above the previous year and 45 percent greater than two seasons ago. Sales from Zespri Global Supply also increased, by 14 percent to 16.6 million trays, driven mainly by SunGold coming into production in Italy.
Zespri sold almost double the volume of SunGold from New Zealand compared with 2015/16 and delivered a third season in a row of Green returns of over $50,000 a hectare. Volume growth and continued strong investment in marketing and market development helped to lift the total fruit and service payment, including the loyalty premium, by 21 percent to $1.38 billion. Export earnings also increased by 21 percent, to $1.603 billion.
Zespri’s net profi t aft er tax more than doubled from $35.8 million to $73.7 million, mainly due to licence revenue from the SunGold tender in 2016. This will be realised over a number of years. Zespri announced a full year dividend of 25 cents a share. Normalised profi t aft er tax for the fi nancial year was $78.8 million.
The season was challenging in several respects. The sharp increase in Green volume and a late start to the season owing to delayed maturity put pressure on pricing, but record average yields of
12,281 trays per hectare enabled the industry to achieve per-hectare returns at $53,555. The Green return was $4.36 per tray. The extraordinary increase in Green volume to over 93 million trays in gross submit led to a programme of crop management as the best way to handle fruit in sizes surplus to demand.
SunGold again delivered an outstanding result, with an average per-tray return for the Gold pool rising to $8.64 despite an increase in supply to 48.5 million trays from 32.6 million trays in 2015/16. Average per-hectare returns increased by 39 percent to $98,838. The customer and consumer response to SunGold was very positive, supporting our confi dence in market demand. Zespri allocated a 400-hectare tranche of SunGold licence in 2016, which attracted strong participation, and completed a second 400-hectare allocation in 2017 as the outlook for growing market demand continues.
Looking ahead, Zespri aims to implement a consistent strategy to deliver value to growers and shareholders. Our primary focus is on growing demand ahead of supply, fulfi lling demand and innovating to develop more eff ective ways to deliver value. The 2016/17 season again generated robust returns and the challenge is to sustain and improve performance over coming years.
A remarkable season of record yields and the largest-ever New Zealand crop.
31 MARCH2017
Financial year-end
19 JULY2017
Annual Report circulated
22 AUGUST 2017 - 1PM
Deadline for receipt of proxies for
Annual Meeting
24 AUGUST 2017
Annual Meeting
ANNUAL MEETINGThe Annual Meeting of Shareholders of Zespri Group Limited will take place at 1pm on Thursday 24 August 2017 at ASB Arena Baypark, 81 Truman Lane, Mount Maunganui.
DECEMBERAND AUGUST
Indicative dates for dividend payments, December (interim)
and August (final)
ANNUALREPORT
For full financial statements, please
refer to the separate Annual Report,
available on www.zespri.com
2Zespri Annual Report 2016/17 Zespri Group Limited and Subsidiaries Annual Report for the year ended 31 March 2017
CHAIRMAN AND CEO’S REPORT
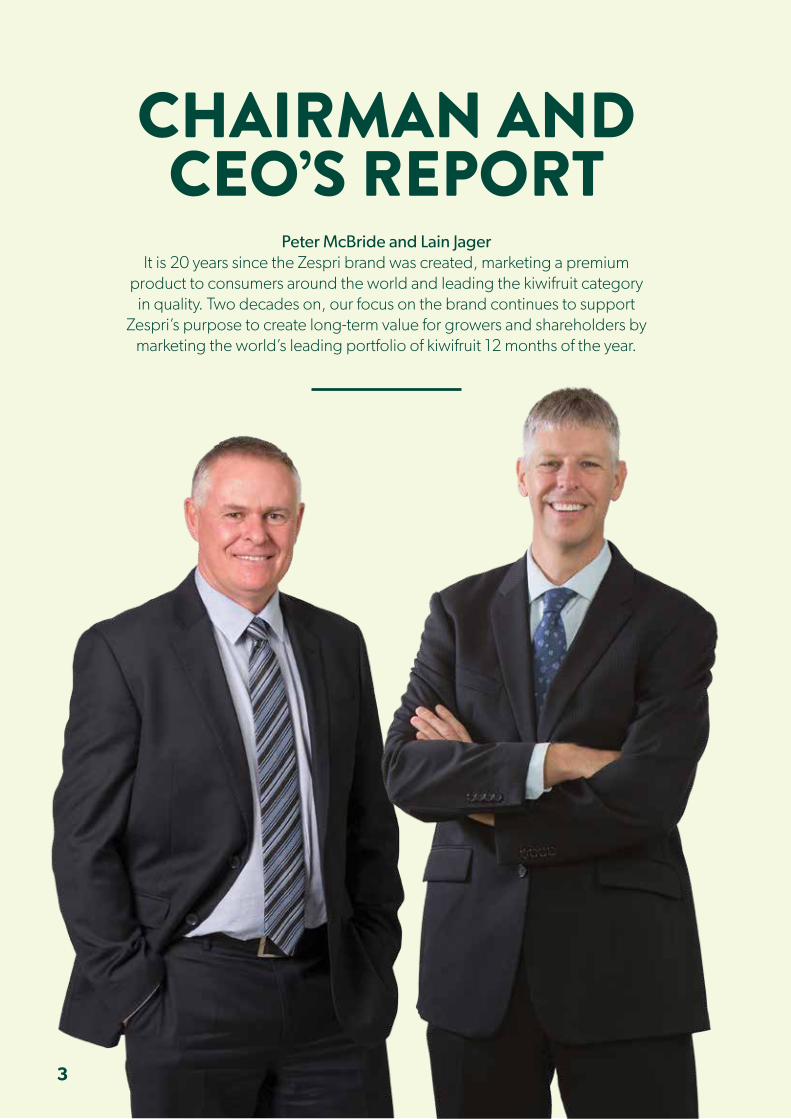
Peter McBride and Lain JagerIt is 20 years since the Zespri brand was created, marketing a premium
product to consumers around the world and leading the kiwifruit category in quality. Two decades on, our focus on the brand continues to support
Zespri’s purpose to create long-term value for growers and shareholders by marketing the world’s leading portfolio of kiwifruit 12 months of the year.
Investment in the Zespri brand is a strategic pillar in our goal to double global sales to $4.5 billion by 2025. The opportunity is signifi cant, with worldwide consumption of kiwifruit today accounting for less than half a percent of all internationally traded fruit.
The 2016/17 season was remarkable: growing conditions delivered record yields and lower-dry-matter-fruit in a year following on the heels of a substantial Italian crop that sold into June. Despite this very challenging context, Zespri sold more fruit faster than ever before, to deliver increased Gold per-hectare returns. Zespri sold almost double the volume of SunGold compared with the previous season and delivered a third season in a row of Green returns of over $50,000 a hectare. This result refl ects the strong investment in marketing and market development that Zespri and New Zealand kiwifruit growers have made throughout successive seasons.
Zespri’s approach is to implement our strategy through successive seasons with consistency and discipline. Our strategy is to supply the highest-quality fruit to consumers around the world, all year round; to invest in our brand; to strengthen our supply chain systems; and to forge ahead with our long-term investment in developing new cultivars. We have also made progress during the 2016/17 season in strengthening and renewing the foundations on which we will deliver growth and value in the future. We continue to invest in people, particularly in our global sales and marketing teams, and in our supply chain systems and processes. We are continuing to develop our policies and procedures across ethics and compliance, and health and safety.
ResultsCorporate results
Zespri’s global kiwifruit revenue increased by 19 percent to $2.26 billion in 2016/17, driven by volume growth and a greater contribution of SunGold to total sales. Net profi t aft er tax more than doubled from $35.8 million to $73.7 million, mainly due to licence revenue from the SunGold tender in 2016, which was $46.6 million aft er tax.
The cashfl ow relating to the 2016 licence release will be realised over a number of years. The take-up of the 2016 deferral terms by a substantial number of bidders means that the licence release will not generate signifi cant net cashfl ow to Zespri until the 2018/19, 2019/20 and 2020/21 fi nancial years. At that time the Zespri Board will make decisions regarding use of funds and distribution to shareholders.
In the 12-month period to 31 March 2017, Zespri’s share price more than doubled, from $1.82 a share to $4.00 a share. This equates to an increase in the market capitalisation of Zespri from $220 million to more than $480 million.
For the reported period, revenue per full time employee equivalent decreased from $5.5 million last year to $5.4 million, and trays per full-time employee equivalent decreased from 373,000 trays to 354,000 trays. This deterioration in overhead ratios refl ects an increase in overhead costs and deliberately strong investment by Zespri as we focus on driving demand growth ahead of supply. It is important to note that Zespri is evolving its business model in key markets to become an importer of record and to lift our key account capability. While this requires greater staff numbers, it extends our reach along the value chain and drives long-term value for growers.
During 2016/17, Zespri redefi ned its operating segments to better refl ect its key business activities. Going forward, Zespri will report against four key segments: New Zealand kiwifruit; non-New Zealand supply; new cultivars; and other.
The New Zealand kiwifruit segment is Zespri’s core business and at over $2 billion of sales represents 90 percent of total global sales. It also accounts for $22.2 million of segment profi t before tax.
The non-New Zealand supply segment, also referred to as Zespri Global Supply (ZGS), generated sales revenue in 2016/17 of $216 million. Profi t before tax was $11.9 million.
The new cultivar segment generates revenue through licensing, royalty streams and co-funded new cultivar research. Overall, this segment achieved revenue of $87.5 million and a segment profi t before tax of $70.9 million.
The ‘other’ segment covers activities related mainly to land and buildings and interest income. Other segment revenue was $4.0 million and profi t before tax was $2.2 million. Activity in this segment will increase following the commencement of the new head offi ce project in Mount Maunganui, New Zealand.
Category performance
Zespri sold more fruit faster than ever before. During the 2016/17 season we sold 137.7 million trays of New Zealand crop, 18 percent above the previous year and 45 percent greater than two seasons ago. A key factor was the increase in average yield per hectare for Green. The sharp increase in volume and late start to the season owing to delayed maturity put pressure on pricing, with returns per tray falling to $4.36 (2015/16: $5.13). However, high average yields of 12,281 trays, compared with 11,048 in 2015/16, enabled the industry to achieve average per-hectare returns of $53,555 (2015/16: $56,673). This is the third year in a row that Green returns have been maintained above the $50,000 mark.
With a fi nal gross submit volume of 93.4 million trays of Green, Zespri recommended a programme of crop management as the best way to handle fruit in sizes that would have been surplus to market demand and would have provided an uneconomic return to growers. Over fi ve million trays were crop managed, which reduced OGR per tray by 34 cents. The cost to growers would have exceeded this amount if the surplus fruit had been shipped and sold. The surplus was a result of an extraordinary increase in volume, rather than any weakness in markets, with demand growth continuing as expected across successive seasons.
The average return for Organic Green was $6.86 per tray (2015/16: $7.18). The average per-hectare return of $54,427 (2015/16: $52,917) is a record result for the category. This was supported by strong average yield in 2016/17 of 7,933 trays per hectare, compared with 7,373 trays in 2015/16. The total sales volume for Organic Green was 3.9 million trays (2015/16: 3.9 million trays).
SunGold again delivered an outstanding result. We delivered an average return per tray for the Gold pool of $8.64 (2015/16: $8.21) despite an increase in supply of 49 percent to 48.5 million trays from 32.6 million trays in 2015/16. Average per-hectare returns increased 39 percent to $98,838 (2015/16: $71,080). We had a much later close to the season than in previous years and the fi nal weeks saw an increase in storage diffi culties. We will continue to learn and improve our storage performance in future seasons. During 2016/17, Zespri also sold 743,000 trays of Organic SunGold, up from 449,000 trays the previous year, helped by strong consumer demand.
3

CHAIRMAN AND CEO’S REPORT
Peter McBride and Lain JagerIt is 20 years since the Zespri brand was created, marketing a premium
product to consumers around the world and leading the kiwifruit category in quality. Two decades on, our focus on the brand continues to support
Zespri’s purpose to create long-term value for growers and shareholders by marketing the world’s leading portfolio of kiwifruit 12 months of the year.
Investment in the Zespri brand is a strategic pillar in our goal to double global sales to $4.5 billion by 2025. The opportunity is signifi cant, with worldwide consumption of kiwifruit today accounting for less than half a percent of all internationally traded fruit.
The 2016/17 season was remarkable: growing conditions delivered record yields and lower-dry-matter-fruit in a year following on the heels of a substantial Italian crop that sold into June. Despite this very challenging context, Zespri sold more fruit faster than ever before, to deliver increased Gold per-hectare returns. Zespri sold almost double the volume of SunGold compared with the previous season and delivered a third season in a row of Green returns of over $50,000 a hectare. This result refl ects the strong investment in marketing and market development that Zespri and New Zealand kiwifruit growers have made throughout successive seasons.
Zespri’s approach is to implement our strategy through successive seasons with consistency and discipline. Our strategy is to supply the highest-quality fruit to consumers around the world, all year round; to invest in our brand; to strengthen our supply chain systems; and to forge ahead with our long-term investment in developing new cultivars. We have also made progress during the 2016/17 season in strengthening and renewing the foundations on which we will deliver growth and value in the future. We continue to invest in people, particularly in our global sales and marketing teams, and in our supply chain systems and processes. We are continuing to develop our policies and procedures across ethics and compliance, and health and safety.
ResultsCorporate results
Zespri’s global kiwifruit revenue increased by 19 percent to $2.26 billion in 2016/17, driven by volume growth and a greater contribution of SunGold to total sales. Net profi t aft er tax more than doubled from $35.8 million to $73.7 million, mainly due to licence revenue from the SunGold tender in 2016, which was $46.6 million aft er tax.
The cashfl ow relating to the 2016 licence release will be realised over a number of years. The take-up of the 2016 deferral terms by a substantial number of bidders means that the licence release will not generate signifi cant net cashfl ow to Zespri until the 2018/19, 2019/20 and 2020/21 fi nancial years. At that time the Zespri Board will make decisions regarding use of funds and distribution to shareholders.
In the 12-month period to 31 March 2017, Zespri’s share price more than doubled, from $1.82 a share to $4.00 a share. This equates to an increase in the market capitalisation of Zespri from $220 million to more than $480 million.
For the reported period, revenue per full time employee equivalent decreased from $5.5 million last year to $5.4 million, and trays per full-time employee equivalent decreased from 373,000 trays to 354,000 trays. This deterioration in overhead ratios refl ects an increase in overhead costs and deliberately strong investment by Zespri as we focus on driving demand growth ahead of supply. It is important to note that Zespri is evolving its business model in key markets to become an importer of record and to lift our key account capability. While this requires greater staff numbers, it extends our reach along the value chain and drives long-term value for growers.
During 2016/17, Zespri redefi ned its operating segments to better refl ect its key business activities. Going forward, Zespri will report against four key segments: New Zealand kiwifruit; non-New Zealand supply; new cultivars; and other.
The New Zealand kiwifruit segment is Zespri’s core business and at over $2 billion of sales represents 90 percent of total global sales. It also accounts for $22.2 million of segment profi t before tax.
The non-New Zealand supply segment, also referred to as Zespri Global Supply (ZGS), generated sales revenue in 2016/17 of $216 million. Profi t before tax was $11.9 million.
The new cultivar segment generates revenue through licensing, royalty streams and co-funded new cultivar research. Overall, this segment achieved revenue of $87.5 million and a segment profi t before tax of $70.9 million.
The ‘other’ segment covers activities related mainly to land and buildings and interest income. Other segment revenue was $4.0 million and profi t before tax was $2.2 million. Activity in this segment will increase following the commencement of the new head offi ce project in Mount Maunganui, New Zealand.
Category performance
Zespri sold more fruit faster than ever before. During the 2016/17 season we sold 137.7 million trays of New Zealand crop, 18 percent above the previous year and 45 percent greater than two seasons ago. A key factor was the increase in average yield per hectare for Green. The sharp increase in volume and late start to the season owing to delayed maturity put pressure on pricing, with returns per tray falling to $4.36 (2015/16: $5.13). However, high average yields of 12,281 trays, compared with 11,048 in 2015/16, enabled the industry to achieve average per-hectare returns of $53,555 (2015/16: $56,673). This is the third year in a row that Green returns have been maintained above the $50,000 mark.
With a fi nal gross submit volume of 93.4 million trays of Green, Zespri recommended a programme of crop management as the best way to handle fruit in sizes that would have been surplus to market demand and would have provided an uneconomic return to growers. Over fi ve million trays were crop managed, which reduced OGR per tray by 34 cents. The cost to growers would have exceeded this amount if the surplus fruit had been shipped and sold. The surplus was a result of an extraordinary increase in volume, rather than any weakness in markets, with demand growth continuing as expected across successive seasons.
The average return for Organic Green was $6.86 per tray (2015/16: $7.18). The average per-hectare return of $54,427 (2015/16: $52,917) is a record result for the category. This was supported by strong average yield in 2016/17 of 7,933 trays per hectare, compared with 7,373 trays in 2015/16. The total sales volume for Organic Green was 3.9 million trays (2015/16: 3.9 million trays).
SunGold again delivered an outstanding result. We delivered an average return per tray for the Gold pool of $8.64 (2015/16: $8.21) despite an increase in supply of 49 percent to 48.5 million trays from 32.6 million trays in 2015/16. Average per-hectare returns increased 39 percent to $98,838 (2015/16: $71,080). We had a much later close to the season than in previous years and the fi nal weeks saw an increase in storage diffi culties. We will continue to learn and improve our storage performance in future seasons. During 2016/17, Zespri also sold 743,000 trays of Organic SunGold, up from 449,000 trays the previous year, helped by strong consumer demand.
4Zespri Annual Report 2016/17 Zespri Group Limited and Subsidiaries Annual Report for the year ended 31 March 2017

Total Fruit and Service Payments – 7 YearsNew Zealand-grown kiwifruit (excluding loyalty premium)
Green Organic Green Gold Non-Standard Supply and Class 2 Sweet Green
Total Volume Sold – 7 YearsNew Zealand-grown kiwifruit
Green Organic Green Gold Non-Standard Supply and Class 2 Sweet Green
Onshore Fruit Loss – 7 Years
Green Organic Green Gold Sweet Green
Off shore Fruit Loss – 7 Years
Green Organic Green Gold Sweet Green
3.5
73
.3
29
.1
3.3
3.1
68
.9
11.1
2.5
0.4 3
.5
69
.3
18.6
2.9
0.9 3
.9
77.
9
32
.3
1.6
1.4
2010/11 2011/12 2012/13 2013/14 2014/15 2015/16 2016/17
Tray
Eq
uiv
alen
ts M
illio
ns
0
908070605040302010
69
.9
3.3
21.
1
3.9
3.2
70
.4
24
.6
2.8
0.4 3
.9
83
.3
47.
9
1.1
1.5
31.
2
54
8.4
35
5.7
17.5
30
.1
54
7.2
179
.7
17.2
5.7 3
4.2
60
8.0
24
7.1
17.1
9.3 3
8.3
66
6.8
38
5.4
9.0 13
.9
2010/11 2011/12 2012/13 2013/14 2014/15 2015/16 2016/17
NZ
D M
illio
ns
$0
$700
$600
$500
$400
$300
$200
$100
53
2.7
30
.3
27
1.2
24
.6
28
.5
53
0.6
35
3.6
17.7
3.7 3
7.7
68
5.8
60
0.1
6.3 14
.1
2010/11 2011/12 2012/13 2013/14 2014/15 2015/16 2016/17
Perc
enta
ge
Fru
it L
oss
0%
6%
5%
4%
3%
2%
1%
2.2
42.8
8
1.5
1
1.3
3
1.3
1
1.3
8 1.9
4
2.2
5
1.0
91.7
1
1.4
6
3.3
9
1.8
1
3.7
4
1.12
0.4
1 1.16
2.7
6
0.8
7 1.3
6
4.2
75.0
0
2.7
7
3.0
2
4.2
9
2.3
9
2010/11 2011/12 2012/13 2013/14 2014/15 2015/16 2016/17
Perc
enta
ge
Fru
it L
oss
0%
6%
5%
4%
3%
2%
1%
1.9
3
1.4
4
1.5
5
0.4
8
0.5
3
0.5
3
0.2
1
0.4
2
0.2
4
0.4
8
0.7
6
0.1
8 0.7
7
3.4
1
0.6
5
0.7
2
1.0
6
2.2
3
1.2
2
0.3
3
1.5
0
5.0
6
2.7
1
1.7
1
4.1
1
1.6
6
These fruit loss percentages do not include crop-managed trays.
The customer and consumer response to SunGold was very positive, supporting our confi dence in market demand, although we note feedback highlighting the critical importance of high dry matter with this variety. During 2016, we released 400 hectares of SunGold licence. There was a total of 266 successful bidders and strong participation, which refl ects confi dence in the variety. The Zespri Board approved the allocation of a further 400 hectares of SunGold licence in 2017, and plans to allocate a further 1,200 hectares in 400-hectare tranches during 2018, 2019 and 2020, dependent on market performance.
The 2016/17 plan for Sweet Green was to develop an early supply programme with a focus on the Japan and China markets. This was hindered by the late maturity that characterised the season. Product performance was also aff ected by quality issues and a small profi le. The return per tray was $5.79, compared with $7.01 in the 2015/16 season. However, the average per-hectare return increased to $45,853 (2015/16: $42,995), driven by higher average yields of 7,921 trays, versus 6,135 in 2015/16, as orchards came into full production. During 2016, Zespri consulted with Sweet Green growers on the future of the variety and recommended moving it into a combined Green pool. Sweet Green growers opted, by majority of volume, to remain in a stand-alone pool, and Zespri’s focus is now on working with growers to maximise the value of the crop within its own pool for the 2017/18 season. The strategy for Sweet Green is to deliver it to market sweet and early, with allocation primarily to the Europe and Japan markets.
Zespri Global Supply
Zespri is building its investment in global supply to serve consumers with Zespri-branded kiwifruit 12 months of the year and to support retailers with a year-round category management solution.
We expect to see strong growth in ZGS volumes in the coming years, driven mainly by SunGold coming into production in Italy. The Zespri Board approved the release of 1,800 hectares of licence over the next three years in Europe, which is in addition to 1,650 hectares currently in the ground in Italy and 270 hectares in France. The full allocation will quadruple European volumes of SunGold over the next fi ve years, from 4.4 million trays in 2016/17. Growth in ZGS production is expected to be a signifi cant driver of corporate income over the years ahead.
Demand for SunGold is strong and forecast to increase across all markets over the next fi ve to 10 years and Zespri needs to ensure a balanced 12-month supply in our key markets. Incremental production of SunGold in Italy over the next fi ve years will help to meet unfulfi lled demand in both Europe and our other export markets. The SunGold conversion strategy is also under way in our current production sites in Japan and South Korea. Sources of production are likely to diversify in the next few years, which will complement current supply out of Italy, France, South Korea and Japan.
Zespri continues to explore the production potential in China. A Centre of Excellence has been formed that is providing the opportunity for Zespri to better understand the Chinese industry and develop strong relationships. The Zespri team is presently working with two trial growing partners and one post-harvest operator in Shaanxi province. This is allowing the identifi cation and resolution of constraints to the establishment of modern, large-scale and effi cient orchards; the evaluation of diff erent Chinese varieties; and the gaining of insight into post-harvest performance. Consumer insight work is also being undertaken.
Ultimately, the projects will determine whether Zespri can one day provide our Chinese customers with Chinese-grown Zespri Kiwifruit during the New Zealand off -season.
Collaborative marketing
In 2016/17, 11 companies operated 22 collaborative marketing sales programmes, selling 2.73 million trays of New Zealand kiwifruit. Zespri supports collaborative marketing because it allows for innovation in New Zealand kiwifruit marketing. It also off ers an alternative channel to market for those individuals or companies that believe they can deliver sustainable wealth creation for New Zealand kiwifruit suppliers from kiwifruit sales programmes that can operate in collaboration with Zespri.
Our experience is that well-considered programmes with high-quality collaboration with Zespri are usually supported by the regulator, Kiwifruit New Zealand (KNZ). For example, the Pacifi c Islands have a long-standing, collaborative marketing programme in a region typically serviced by Auckland-based exporters that ship containers of mixed fruit and vegetables on a weekly basis.
Zespri partners with Bidfood, South Seas and T&G to supply Zespri Kiwifruit as part of these companies’ weekly fresh produce sales programmes, with volumes of 102,000 trays this season. Marketing programmes generally use promotional material from Zespri France, as the main Pacifi c Island markets are French-speaking New Caledonia and Tahiti.
Of particular note in 2016 was the operation of the proactive collaborative marketing initiative which saw Zespri partnering with two New Zealand export companies, T&G Global and Southern Fresh Fruit Export. The two companies manage the Zespri-branded kiwifruit sales programme in Thailand, Cambodia, Myanmar and in the Philippines via an extended-term collaborative marketing approval provided by KNZ. These two programmes represented one million trays in 2016/17. Additional proactive collaborative marketers have obtained KNZ approval for 2017, with Freshmax developing regions in Indonesia and Mr Apple in the Russian Far East.
Marketing and market development
During 2016, Zespri reconfi gured the business model in China to become an importer of record, recognising the maturing of our China operations and aligning with our long-established Japan, South Korea and Europe markets. This change allows us to optimise our quality delivery in market and off er an enhanced level of service to our distribution customers.
Zespri Kiwifruit has been sold in China since 1999. We are building on our history in this region by broadening our distribution and sales from tier one and two cities and the eastern seaboard, expanding inland into other large provincial cities and more tier two and tier three cities. Zespri is rapidly building sales in developing markets also, notably in India where sales in 2016 grew by 124 percent to 3.2 million trays.
We offi cially opened an offi ce in Dubai to service the rapidly growing sales in the Middle East, India and Africa.
Our overall marketing strategy aimed to launch SunGold well at the start of the season, to rapidly build sales run rates and drive demand, in the context of a slow start of Green sales and with extensive sales and distribution support. We created campaigns that sold a record volume of Green and built distribution and category penetration in new developing markets, including India, Indonesia and South Africa. We also increased brand awareness and penetration in all our top 10 markets.
5 www.zespri.comZespri Group Limited and Subsidiaries Annual Report for the year ended 31 March 2017

Total Fruit and Service Payments – 7 YearsNew Zealand-grown kiwifruit (excluding loyalty premium)
Green Organic Green Gold Non-Standard Supply and Class 2 Sweet Green
Total Volume Sold – 7 YearsNew Zealand-grown kiwifruit
Green Organic Green Gold Non-Standard Supply and Class 2 Sweet Green
Onshore Fruit Loss – 7 Years
Green Organic Green Gold Sweet Green
Off shore Fruit Loss – 7 Years
Green Organic Green Gold Sweet Green
3.5
73
.3
29
.1
3.3
3.1
68
.9
11.1
2.5
0.4 3
.5
69
.3
18.6
2.9
0.9 3
.9
77.
9
32
.3
1.6
1.4
2010/11 2011/12 2012/13 2013/14 2014/15 2015/16 2016/17
Tray
Eq
uiv
alen
ts M
illio
ns
0
908070605040302010
69
.9
3.3
21.
1
3.9
3.2
70
.4
24
.6
2.8
0.4 3
.9
83
.3
47.
9
1.1
1.5
31.
2
54
8.4
35
5.7
17.5
30
.1
54
7.2
179
.7
17.2
5.7 3
4.2
60
8.0
24
7.1
17.1
9.3 3
8.3
66
6.8
38
5.4
9.0 13
.9
2010/11 2011/12 2012/13 2013/14 2014/15 2015/16 2016/17
NZ
D M
illio
ns
$0
$700
$600
$500
$400
$300
$200
$100
53
2.7
30
.3
27
1.2
24
.6
28
.5
53
0.6
35
3.6
17.7
3.7 3
7.7
68
5.8
60
0.1
6.3 14
.1
2010/11 2011/12 2012/13 2013/14 2014/15 2015/16 2016/17
Perc
enta
ge
Fru
it L
oss
0%
6%
5%
4%
3%
2%
1%
2.2
42.8
8
1.5
1
1.3
3
1.3
1
1.3
8 1.9
4
2.2
5
1.0
91.7
1
1.4
6
3.3
9
1.8
1
3.7
4
1.12
0.4
1 1.16
2.7
6
0.8
7 1.3
6
4.2
75.0
0
2.7
7
3.0
2
4.2
9
2.3
9
2010/11 2011/12 2012/13 2013/14 2014/15 2015/16 2016/17
Perc
enta
ge
Fru
it L
oss
0%
6%
5%
4%
3%
2%
1%
1.9
3
1.4
4
1.5
5
0.4
8
0.5
3
0.5
3
0.2
1
0.4
2
0.2
4
0.4
8
0.7
6
0.1
8 0.7
7
3.4
1
0.6
5
0.7
2
1.0
6
2.2
3
1.2
2
0.3
3
1.5
0
5.0
6
2.7
1
1.7
1
4.1
1
1.6
6
These fruit loss percentages do not include crop-managed trays.
The customer and consumer response to SunGold was very positive, supporting our confi dence in market demand, although we note feedback highlighting the critical importance of high dry matter with this variety. During 2016, we released 400 hectares of SunGold licence. There was a total of 266 successful bidders and strong participation, which refl ects confi dence in the variety. The Zespri Board approved the allocation of a further 400 hectares of SunGold licence in 2017, and plans to allocate a further 1,200 hectares in 400-hectare tranches during 2018, 2019 and 2020, dependent on market performance.
The 2016/17 plan for Sweet Green was to develop an early supply programme with a focus on the Japan and China markets. This was hindered by the late maturity that characterised the season. Product performance was also aff ected by quality issues and a small profi le. The return per tray was $5.79, compared with $7.01 in the 2015/16 season. However, the average per-hectare return increased to $45,853 (2015/16: $42,995), driven by higher average yields of 7,921 trays, versus 6,135 in 2015/16, as orchards came into full production. During 2016, Zespri consulted with Sweet Green growers on the future of the variety and recommended moving it into a combined Green pool. Sweet Green growers opted, by majority of volume, to remain in a stand-alone pool, and Zespri’s focus is now on working with growers to maximise the value of the crop within its own pool for the 2017/18 season. The strategy for Sweet Green is to deliver it to market sweet and early, with allocation primarily to the Europe and Japan markets.
Zespri Global Supply
Zespri is building its investment in global supply to serve consumers with Zespri-branded kiwifruit 12 months of the year and to support retailers with a year-round category management solution.
We expect to see strong growth in ZGS volumes in the coming years, driven mainly by SunGold coming into production in Italy. The Zespri Board approved the release of 1,800 hectares of licence over the next three years in Europe, which is in addition to 1,650 hectares currently in the ground in Italy and 270 hectares in France. The full allocation will quadruple European volumes of SunGold over the next fi ve years, from 4.4 million trays in 2016/17. Growth in ZGS production is expected to be a signifi cant driver of corporate income over the years ahead.
Demand for SunGold is strong and forecast to increase across all markets over the next fi ve to 10 years and Zespri needs to ensure a balanced 12-month supply in our key markets. Incremental production of SunGold in Italy over the next fi ve years will help to meet unfulfi lled demand in both Europe and our other export markets. The SunGold conversion strategy is also under way in our current production sites in Japan and South Korea. Sources of production are likely to diversify in the next few years, which will complement current supply out of Italy, France, South Korea and Japan.
Zespri continues to explore the production potential in China. A Centre of Excellence has been formed that is providing the opportunity for Zespri to better understand the Chinese industry and develop strong relationships. The Zespri team is presently working with two trial growing partners and one post-harvest operator in Shaanxi province. This is allowing the identifi cation and resolution of constraints to the establishment of modern, large-scale and effi cient orchards; the evaluation of diff erent Chinese varieties; and the gaining of insight into post-harvest performance. Consumer insight work is also being undertaken.
Ultimately, the projects will determine whether Zespri can one day provide our Chinese customers with Chinese-grown Zespri Kiwifruit during the New Zealand off -season.
Collaborative marketing
In 2016/17, 11 companies operated 22 collaborative marketing sales programmes, selling 2.73 million trays of New Zealand kiwifruit. Zespri supports collaborative marketing because it allows for innovation in New Zealand kiwifruit marketing. It also off ers an alternative channel to market for those individuals or companies that believe they can deliver sustainable wealth creation for New Zealand kiwifruit suppliers from kiwifruit sales programmes that can operate in collaboration with Zespri.
Our experience is that well-considered programmes with high-quality collaboration with Zespri are usually supported by the regulator, Kiwifruit New Zealand (KNZ). For example, the Pacifi c Islands have a long-standing, collaborative marketing programme in a region typically serviced by Auckland-based exporters that ship containers of mixed fruit and vegetables on a weekly basis.
Zespri partners with Bidfood, South Seas and T&G to supply Zespri Kiwifruit as part of these companies’ weekly fresh produce sales programmes, with volumes of 102,000 trays this season. Marketing programmes generally use promotional material from Zespri France, as the main Pacifi c Island markets are French-speaking New Caledonia and Tahiti.
Of particular note in 2016 was the operation of the proactive collaborative marketing initiative which saw Zespri partnering with two New Zealand export companies, T&G Global and Southern Fresh Fruit Export. The two companies manage the Zespri-branded kiwifruit sales programme in Thailand, Cambodia, Myanmar and in the Philippines via an extended-term collaborative marketing approval provided by KNZ. These two programmes represented one million trays in 2016/17. Additional proactive collaborative marketers have obtained KNZ approval for 2017, with Freshmax developing regions in Indonesia and Mr Apple in the Russian Far East.
Marketing and market development
During 2016, Zespri reconfi gured the business model in China to become an importer of record, recognising the maturing of our China operations and aligning with our long-established Japan, South Korea and Europe markets. This change allows us to optimise our quality delivery in market and off er an enhanced level of service to our distribution customers.
Zespri Kiwifruit has been sold in China since 1999. We are building on our history in this region by broadening our distribution and sales from tier one and two cities and the eastern seaboard, expanding inland into other large provincial cities and more tier two and tier three cities. Zespri is rapidly building sales in developing markets also, notably in India where sales in 2016 grew by 124 percent to 3.2 million trays.
We offi cially opened an offi ce in Dubai to service the rapidly growing sales in the Middle East, India and Africa.
Our overall marketing strategy aimed to launch SunGold well at the start of the season, to rapidly build sales run rates and drive demand, in the context of a slow start of Green sales and with extensive sales and distribution support. We created campaigns that sold a record volume of Green and built distribution and category penetration in new developing markets, including India, Indonesia and South Africa. We also increased brand awareness and penetration in all our top 10 markets.
6Zespri Annual Report 2016/17 Zespri Group Limited and Subsidiaries Annual Report for the year ended 31 March 2017

People and systems
Zespri made a number of appointments in its executive team in 2016. Jiunn Shih, General Manager Marketing, was formerly a Senior Global Category Director at Unilever and brings extensive experience across multiple international markets. Sheila McCann- Morrison, General Manager for Global Supply, joined Zespri from Chiquita Brands in Switzerland where she led the sales and marketing teams of Germany, Austria and Switzerland as Regional Director. Patrick Watson has joined Zespri as Group HR Manager, bringing experience from a varied international career and positions with New Zealand Inland Revenue, Deloitte and the British Army.
During 2016, the Board of Directors announced that Zespri will start a search process to select a new Chief Executive Offi cer (CEO). The succession is being planned to have the new CEO in place by the beginning of 2018, with Lain Jager remaining in the role until his successor commences. The process is at an optimal time, balancing continuity and renewal in the leadership of the organisation. In 2017 the Zespri Board welcomed a new independent director, Peter Springford, replacing long-serving director David Pilkington. Peter has an extensive business track record in managing companies in Australia, New Zealand and Asia, as well as signifi cant corporate governance experience. We thank David for his outstanding contribution to Zespri and to the kiwifruit industry as a whole.
Zespri continues to invest in people to deliver sustainable business growth over the long term. During 2016, 86 permanent employees joined the team, of whom 45 are based off shore in
sales and marketing and other supporting roles. This refl ects our continued investment in driving demand off shore.
Zespri employs people with local sales and marketing expertise on the ground in 28 countries, with offi ces in 21 countries, delivering targeted programmes in 56 countries around the world. During the 2016/17 year, Zespri had in its employment 436 full-time equivalent people (FTEs), with 203 FTEs in the markets and 233 FTEs in New Zealand (including seasonal employees).
As the Company grows, we recognise the need to ensure common organisational values are in place and applied consistently across the business. During 2016, we rolled out what we call our ‘DNA’ – the building blocks of Zespri, who we are as an organisation and how we work together. It includes our purpose, mission and vision, describing what we are seeking to accomplish. It also includes our strategy, priorities and values, describing how we will be successful in achieving our aims for the future.
In December, the Board approved investment in a fi t-for-purpose head offi ce in Mount Maunganui, with construction to be fi nished in early 2019. The building will provide the facilities needed to support future growth and serve as a hub for the kiwifruit industry, with space to host growers, customer and media tour programmes, and offi ces for other kiwifruit-related organisations.
Zespri recognises the need to modernise and upgrade its information systems as the business continues to grow and our legacy systems no longer meet the needs of an expanding global business. Two years ago, Zespri started a major technology investment programme as we gained confi dence in the recovery from Psa. Systems already upgraded include the planning and
During 2016, Zespri launched its company values. They were developed by Zespri people for Zespri people, involving extensive employee input and Board endorsement. We have developed guidelines on what each value means in terms of specifi c actions to empower our people and create strong alignment around the behaviours that support how we deliver on our promise to growers and shareholders.
INNOVATION BUDDING WITH FRESH IDEAS
PASSION BURSTING WITH
VITALITY
INTEGRITY STAYING TRUE TO
OUR CORE
TEAMWORK WORKING TOGETHER QUALITY
REACHING FORTHE BEST
SUSTAINABILITY
GROWING A HEALTHIERTOMORROW
RESULTS REAPING THE
REWARDS
it's
in our nature
OUR VALUES
Zespri Group Limited Profi tability – 7 Years Net Profi t Aft er Tax (NPAT) Normalised Net Profi t Aft er Tax
Net Profi t Aft er Tax Excluding Licence Revenue
Zespri Group Limited Equity, Dividend Returned and Share Price – 7 Years
Equity NZD Dividend NZD Share Price NZD
2010/11 2016/172011/12 2012/13 2013/14 2014/15 2015/16
ZG
L N
PAT
NZ
D M
illio
ns
$0
$80
$50
$60
$70
$40
$30
$20
$10 7.3
15.8
16.4
20
.5
7.6
23
.2
17.2
14.6
5.0
18.0
3.8
17.2
21.
517
.2
34
.6
27.
83
4.035
.8
78
.82
5.3
73
.7
Equ
ity
NZ
D M
illio
ns
Div
iden
d a
nd
Sh
are
Pri
ce N
ZD
2010/11 2016/172011/12 2012/13 2013/14 2014/15 2015/16
71.
9
85
.2
78
.2
89
.4
109
.5
130
.9
172
.0
0.0
8
0.10
0.0
5
0.1
1
0.1
2 0.2
4
0.2
54
.00
1.6
4
0.7
7
0.4
8
0.5
00.6
5
1.8
2
$0
$30
$60
$90
$120
$150
$180
$0
$1.00
$2.00
$3.00
$4.00
$5.00
supply management system, the grower relations database and self-service web interface, and analytical capabilities. Over the next fi ve years, we will invest around $70 million in enhancing our information systems and technology as a critical foundation for business performance.
Compliance and ethics
Acting with integrity is one of Zespri’s core values and our responsibilities for compliance with the law around the world and conducting our business ethically are set out in the Company’s employee Code of Conduct. We have supported these standards through a continuing focus on mandatory training for all staff worldwide. During 2016/17, Zespri provided training on labour standards, information security, data protection, confl icts of interest and ethical leadership.
An investigation by the Serious Fraud Offi ce, fi rst announced to us in October 2013, is still ongoing. Zespri’s costs including provisions to date are now around $6.8 million. These costs are attributed to Zespri corporate and not to the New Zealand grower pools.
Operational challenges
The industry responded to a number of operational challenges in 2016. In April, Zespri applied a precautionary hold on two million trays of SunGold in inventory due to concerns over traces of mechanical lubricant contamination on a batch of pocket packs. Aft er determining that there was no risk to human health, the industry put in place strong measures to check and repack potentially-aff ected trays. This decision was guided by Zespri’s absolute commitment to provide customers with healthy and
safe-to-eat kiwifruit. We acknowledge the very good work of suppliers in responding to this challenging issue and also note that some liability issues remain to be worked through.
In August, Zespri temporarily deferred exports to China following the notifi cation by Chinese authorities of the detection of the fungal rot Neofabraea actinidiae. Exports resumed quickly aft er the industry adopted additional pre-export checking processes. While the checking process is expensive and operationally onerous, we note that the New Zealand kiwifruit industry delivered a new record for sales in China of nearly 24 million trays, up from 18 million trays the previous season. Enhanced checking processes will remain in place for the 2017/18 season.
Grower payments
Zespri made some mistakes in the August 2016 forecast of grower payments, which understandably caused concern and frustration for both post-harvest operators and growers. The errors were corrected in the October forecast and processes have been put in place to mitigate against future errors occurring. Substantial work is under way to improve our grower payment system.
Looking AheadNew Zealand supply
Total supply from New Zealand increased 26 percent (24 million trays) in 2015/16 and 21 percent (26 million trays) in 2016/17. Total supply for the 2017/18 season is expected to be around 130 million trays as SunGold volumes move through to around 55 million trays and Green volumes come back to around
7 www.zespri.comZespri Group Limited and Subsidiaries Annual Report for the year ended 31 March 2017

People and systems
Zespri made a number of appointments in its executive team in 2016. Jiunn Shih, General Manager Marketing, was formerly a Senior Global Category Director at Unilever and brings extensive experience across multiple international markets. Sheila McCann- Morrison, General Manager for Global Supply, joined Zespri from Chiquita Brands in Switzerland where she led the sales and marketing teams of Germany, Austria and Switzerland as Regional Director. Patrick Watson has joined Zespri as Group HR Manager, bringing experience from a varied international career and positions with New Zealand Inland Revenue, Deloitte and the British Army.
During 2016, the Board of Directors announced that Zespri will start a search process to select a new Chief Executive Offi cer (CEO). The succession is being planned to have the new CEO in place by the beginning of 2018, with Lain Jager remaining in the role until his successor commences. The process is at an optimal time, balancing continuity and renewal in the leadership of the organisation. In 2017 the Zespri Board welcomed a new independent director, Peter Springford, replacing long-serving director David Pilkington. Peter has an extensive business track record in managing companies in Australia, New Zealand and Asia, as well as signifi cant corporate governance experience. We thank David for his outstanding contribution to Zespri and to the kiwifruit industry as a whole.
Zespri continues to invest in people to deliver sustainable business growth over the long term. During 2016, 86 permanent employees joined the team, of whom 45 are based off shore in
sales and marketing and other supporting roles. This refl ects our continued investment in driving demand off shore.
Zespri employs people with local sales and marketing expertise on the ground in 28 countries, with offi ces in 21 countries, delivering targeted programmes in 56 countries around the world. During the 2016/17 year, Zespri had in its employment 436 full-time equivalent people (FTEs), with 203 FTEs in the markets and 233 FTEs in New Zealand (including seasonal employees).
As the Company grows, we recognise the need to ensure common organisational values are in place and applied consistently across the business. During 2016, we rolled out what we call our ‘DNA’ – the building blocks of Zespri, who we are as an organisation and how we work together. It includes our purpose, mission and vision, describing what we are seeking to accomplish. It also includes our strategy, priorities and values, describing how we will be successful in achieving our aims for the future.
In December, the Board approved investment in a fi t-for-purpose head offi ce in Mount Maunganui, with construction to be fi nished in early 2019. The building will provide the facilities needed to support future growth and serve as a hub for the kiwifruit industry, with space to host growers, customer and media tour programmes, and offi ces for other kiwifruit-related organisations.
Zespri recognises the need to modernise and upgrade its information systems as the business continues to grow and our legacy systems no longer meet the needs of an expanding global business. Two years ago, Zespri started a major technology investment programme as we gained confi dence in the recovery from Psa. Systems already upgraded include the planning and
During 2016, Zespri launched its company values. They were developed by Zespri people for Zespri people, involving extensive employee input and Board endorsement. We have developed guidelines on what each value means in terms of specifi c actions to empower our people and create strong alignment around the behaviours that support how we deliver on our promise to growers and shareholders.
INNOVATION BUDDING WITH FRESH IDEAS
PASSION BURSTING WITH
VITALITY
INTEGRITY STAYING TRUE TO
OUR CORE
TEAMWORK WORKING TOGETHER QUALITY
REACHING FORTHE BEST
SUSTAINABILITY
GROWING A HEALTHIERTOMORROW
RESULTS REAPING THE
REWARDS
it's
in our nature
OUR VALUES
Zespri Group Limited Profi tability – 7 Years Net Profi t Aft er Tax (NPAT) Normalised Net Profi t Aft er Tax
Net Profi t Aft er Tax Excluding Licence Revenue
Zespri Group Limited Equity, Dividend Returned and Share Price – 7 Years
Equity NZD Dividend NZD Share Price NZD
2010/11 2016/172011/12 2012/13 2013/14 2014/15 2015/16
ZG
L N
PAT
NZ
D M
illio
ns
$0
$80
$50
$60
$70
$40
$30
$20
$10 7.3
15.8
16.4
20
.5
7.6
23
.2
17.2
14.6
5.0
18.0
3.8
17.2
21.
517
.2
34
.6
27.
83
4.035
.8
78
.82
5.3
73
.7
Equ
ity
NZ
D M
illio
ns
Div
iden
d a
nd
Sh
are
Pri
ce N
ZD
2010/11 2016/172011/12 2012/13 2013/14 2014/15 2015/16
71.
9
85
.2
78
.2
89
.4
109
.5
130
.9
172
.0
0.0
8
0.10
0.0
5
0.1
1
0.1
2 0.2
4
0.2
54
.00
1.6
4
0.7
7
0.4
8
0.5
00.6
5
1.8
2
$0
$30
$60
$90
$120
$150
$180
$0
$1.00
$2.00
$3.00
$4.00
$5.00
supply management system, the grower relations database and self-service web interface, and analytical capabilities. Over the next fi ve years, we will invest around $70 million in enhancing our information systems and technology as a critical foundation for business performance.
Compliance and ethics
Acting with integrity is one of Zespri’s core values and our responsibilities for compliance with the law around the world and conducting our business ethically are set out in the Company’s employee Code of Conduct. We have supported these standards through a continuing focus on mandatory training for all staff worldwide. During 2016/17, Zespri provided training on labour standards, information security, data protection, confl icts of interest and ethical leadership.
An investigation by the Serious Fraud Offi ce, fi rst announced to us in October 2013, is still ongoing. Zespri’s costs including provisions to date are now around $6.8 million. These costs are attributed to Zespri corporate and not to the New Zealand grower pools.
Operational challenges
The industry responded to a number of operational challenges in 2016. In April, Zespri applied a precautionary hold on two million trays of SunGold in inventory due to concerns over traces of mechanical lubricant contamination on a batch of pocket packs. Aft er determining that there was no risk to human health, the industry put in place strong measures to check and repack potentially-aff ected trays. This decision was guided by Zespri’s absolute commitment to provide customers with healthy and
safe-to-eat kiwifruit. We acknowledge the very good work of suppliers in responding to this challenging issue and also note that some liability issues remain to be worked through.
In August, Zespri temporarily deferred exports to China following the notifi cation by Chinese authorities of the detection of the fungal rot Neofabraea actinidiae. Exports resumed quickly aft er the industry adopted additional pre-export checking processes. While the checking process is expensive and operationally onerous, we note that the New Zealand kiwifruit industry delivered a new record for sales in China of nearly 24 million trays, up from 18 million trays the previous season. Enhanced checking processes will remain in place for the 2017/18 season.
Grower payments
Zespri made some mistakes in the August 2016 forecast of grower payments, which understandably caused concern and frustration for both post-harvest operators and growers. The errors were corrected in the October forecast and processes have been put in place to mitigate against future errors occurring. Substantial work is under way to improve our grower payment system.
Looking AheadNew Zealand supply
Total supply from New Zealand increased 26 percent (24 million trays) in 2015/16 and 21 percent (26 million trays) in 2016/17. Total supply for the 2017/18 season is expected to be around 130 million trays as SunGold volumes move through to around 55 million trays and Green volumes come back to around
8Zespri Annual Report 2016/17 Zespri Group Limited and Subsidiaries Annual Report for the year ended 31 March 2017

Global Kiwifruit Sales – 7 Years New Zealand-grown kiwifruit Non-New Zealand-grown kiwifruit
Total Volume Sold – 7 Years Non-New Zealand-grown kiwifruit
69 million trays due to seasonal factors. Looking out to 2021, we expect steady volumes of Green and continued growth of SunGold as we continue to license this exciting new product and vines come into production. To give a sense of this, we expect SunGold supply growth will steady to around six million trays a year, which represents sustainable growth for this category and good opportunities for our customers globally.
Zespri Global Supply
Demand for Northern Hemisphere supply is expected to be strong during the next fi ve years. Over this period, ZGS SunGold volumes are expected to increase to around 20 million trays and Green supply, procured to meet demand, is forecast to increase to around 25 million trays.
Taste
On the supply side, our strategy is to deliver the best quality to markets through a lean and effi cient supply chain to refl ect market signals from growers. This is about optimising taste and ready-to-eat quality and working relentlessly to improve our supply chain processes. Optimising taste is the most important aspect of diff erentiating Zespri Green from competitor greens around the world and maintaining our price positioning. Taste is crucially important for SunGold as lower-dry-matter-fruit does not deliver our promise to consumers. Following taste reviews in 2015 and 2016, growers have supported measures to improve the fi nancial incentives for growing higher-tasting fruit, which is all the more important given the plethora of potential new competitor varieties coming into the market.
Innovation
The success of the New Zealand kiwifruit industry in the long term depends on how well we innovate in comparison to our competitors, creating value across the supply chain from breeding to consumer. New cultivar development remains the biggest investment in Zespri’s innovation portfolio, with combined investment of around $20 million a year in our joint breeding programme with Plant & Food Research and with support from the New Zealand Government. Zespri is continuing to evaluate the potential of new proprietary green and red varieties through pre-commercial trials.
The Kiwifruit Industry Strategy Project (KISP)
Zespri is awaiting the outcomes of the New Zealand Government’s regulatory review and amendments to the Kiwifruit Export Regulations 1999. This review follows the grower referendum in 2015 which asked the Government to amend the regulations to allow for closer shareholding alignment with production, update the defi nition of Zespri’s core business and provide the regulator Kiwifruit New Zealand (KNZ) with a broader skill set and more independence. We believe that the new regulations will provide the industry with suffi cient tools to improve alignment between growers and shareholders, reduce the number of dry shareholders and mitigate against producers becoming signifi cantly ‘over-shared’. Implementing these changes, following the regulatory changes, requires shareholders to approve amendments to the Zespri Constitution, which will be put to a vote at a Special Meeting in due course.
98
.2
105
.5
144
.2
167.
1
183
.6
2010/11 2016/172011/12 2012/13 2013/14 2014/15 2015/16
NZ
D M
illio
ns
$0
$2,400
$1,800
$2,000
$2,200
$1,600
$1,400
$1,200
$1,000
$800
$600
$400
$200
119
.7
215
.6
1,5
05
.0
1,5
22
.2
1,4
55
.7
1,2
04
.5
1,4
01.
1
1,7
23
.3
2,0
46
.3
2010/11 2016/172011/12 2012/13 2013/14 2014/15 2015/16
Tray
Eq
uiv
alen
ts M
illio
ns
8.6
7.4
8.8
11.2
13.2
14.5
16.6
0
2
4
6
8
10
12
14
16
18
Foreign Exchange and Oil Hedging Gain/LossWhat has been particularly meaningful for me personally is to work for New Zealand kiwifruit
growers as they build a hugely successful global brand and develop cultivars that will deliver many
years of prosperity to come.
The industry’s structure and cohesion mean it has been able to deal with numerous challenges
over the years and is now well-positioned for growth. Zespri has set a target of growing
global sales revenues to $4.5 billion by 2025. Consistency in delivering a premium branded
strategy, supported by investment in marketing, innovation and 12-month supply and ongoing
supply chain improvements, will make this target achievable.
Moreover, Zespri’s foundations are being strengthened and renewed. The implementation of the KISP recommendations will be a milestone.
Also important is Zespri’s work to reshape our organisational culture and structure to deliver a sustainable future characterised by a relentless
focus on our consumers, our customers, quality and innovation.
Both the New Zealand kiwifruit industry and Zespri are in great shape and I leave
confi dently believing the best is still to come.
A NOTE FROM CEO LAIN JAGER As the industry marks 20 years since
the creation of a highly successful New Zealand brand, it can look
forward to sustained growth, driven by the fantastic success of SunGold. It has been a huge privilege to work
as part of this industry leadership team and with Zespri employees and partners around the world.
$0
$20
$40
$60
$80
$100
$120
$140
2010/11 2016/172011/12 2012/13 2013/14 2014/15 2015/16
NZ
D M
illio
ns
86
.5
119
.8
89
.0
107.
5
103
.1
5.7
55
.2
Zespri has a medium-term hedging horizon which, when currencies and oil prices fall, can lead to reduced gains or possible losses. For 2016/17 the hedging result reflects the continued strength in the New Zealand Dollar, particularly in relation to the Japanese Yen and Euro.
Progress has been made in a number of other areas relating to KISP. Changes have been made to the New Zealand Kiwifruit Growers Forum, reduced from 37 to 27 members. Also, Māori kiwifruit grower representation in the industry has been strengthened with the establishment of a National Māori Growers Forum with the support of Te Puni Kōkiri, the Ministry of Maori Development. Furthermore, with the appointment in late 2016 of a market maker to facilitate ZGL share trading on the Unlisted trading platform, we believe that we have seen a signifi cant improvement in liquidity and a reduction in price volatility in Zespri shares.
Conclusion
We are satisfi ed overall with performance in the 2016/17 season with continued strong returns in recent years refl ected in orchard values, Zespri shares and SunGold licences. We are confi dent that continued investment by Zespri in innovation and market development will sustain returns into the future.
Peter McBride Lain JagerChairman Chief Executive Offi cer
9 www.zespri.comZespri Group Limited and Subsidiaries Annual Report for the year ended 31 March 2017

Global Kiwifruit Sales – 7 Years New Zealand-grown kiwifruit Non-New Zealand-grown kiwifruit
Total Volume Sold – 7 Years Non-New Zealand-grown kiwifruit
69 million trays due to seasonal factors. Looking out to 2021, we expect steady volumes of Green and continued growth of SunGold as we continue to license this exciting new product and vines come into production. To give a sense of this, we expect SunGold supply growth will steady to around six million trays a year, which represents sustainable growth for this category and good opportunities for our customers globally.
Zespri Global Supply
Demand for Northern Hemisphere supply is expected to be strong during the next fi ve years. Over this period, ZGS SunGold volumes are expected to increase to around 20 million trays and Green supply, procured to meet demand, is forecast to increase to around 25 million trays.
Taste
On the supply side, our strategy is to deliver the best quality to markets through a lean and effi cient supply chain to refl ect market signals from growers. This is about optimising taste and ready-to-eat quality and working relentlessly to improve our supply chain processes. Optimising taste is the most important aspect of diff erentiating Zespri Green from competitor greens around the world and maintaining our price positioning. Taste is crucially important for SunGold as lower-dry-matter-fruit does not deliver our promise to consumers. Following taste reviews in 2015 and 2016, growers have supported measures to improve the fi nancial incentives for growing higher-tasting fruit, which is all the more important given the plethora of potential new competitor varieties coming into the market.
Innovation
The success of the New Zealand kiwifruit industry in the long term depends on how well we innovate in comparison to our competitors, creating value across the supply chain from breeding to consumer. New cultivar development remains the biggest investment in Zespri’s innovation portfolio, with combined investment of around $20 million a year in our joint breeding programme with Plant & Food Research and with support from the New Zealand Government. Zespri is continuing to evaluate the potential of new proprietary green and red varieties through pre-commercial trials.
The Kiwifruit Industry Strategy Project (KISP)
Zespri is awaiting the outcomes of the New Zealand Government’s regulatory review and amendments to the Kiwifruit Export Regulations 1999. This review follows the grower referendum in 2015 which asked the Government to amend the regulations to allow for closer shareholding alignment with production, update the defi nition of Zespri’s core business and provide the regulator Kiwifruit New Zealand (KNZ) with a broader skill set and more independence. We believe that the new regulations will provide the industry with suffi cient tools to improve alignment between growers and shareholders, reduce the number of dry shareholders and mitigate against producers becoming signifi cantly ‘over-shared’. Implementing these changes, following the regulatory changes, requires shareholders to approve amendments to the Zespri Constitution, which will be put to a vote at a Special Meeting in due course.
98
.2
105
.5
144
.2
167.
1
183
.6
2010/11 2016/172011/12 2012/13 2013/14 2014/15 2015/16
NZ
D M
illio
ns
$0
$2,400
$1,800
$2,000
$2,200
$1,600
$1,400
$1,200
$1,000
$800
$600
$400
$200
119
.7
215
.6
1,5
05
.0
1,5
22
.2
1,4
55
.7
1,2
04
.5
1,4
01.
1
1,7
23
.3
2,0
46
.3
2010/11 2016/172011/12 2012/13 2013/14 2014/15 2015/16
Tray
Eq
uiv
alen
ts M
illio
ns
8.6
7.4
8.8
11.2
13.2
14.5
16.6
0
2
4
6
8
10
12
14
16
18
Foreign Exchange and Oil Hedging Gain/LossWhat has been particularly meaningful for me personally is to work for New Zealand kiwifruit
growers as they build a hugely successful global brand and develop cultivars that will deliver many
years of prosperity to come.
The industry’s structure and cohesion mean it has been able to deal with numerous challenges
over the years and is now well-positioned for growth. Zespri has set a target of growing
global sales revenues to $4.5 billion by 2025. Consistency in delivering a premium branded
strategy, supported by investment in marketing, innovation and 12-month supply and ongoing
supply chain improvements, will make this target achievable.
Moreover, Zespri’s foundations are being strengthened and renewed. The implementation of the KISP recommendations will be a milestone.
Also important is Zespri’s work to reshape our organisational culture and structure to deliver a sustainable future characterised by a relentless
focus on our consumers, our customers, quality and innovation.
Both the New Zealand kiwifruit industry and Zespri are in great shape and I leave
confi dently believing the best is still to come.
A NOTE FROM CEO LAIN JAGER As the industry marks 20 years since
the creation of a highly successful New Zealand brand, it can look
forward to sustained growth, driven by the fantastic success of SunGold. It has been a huge privilege to work
as part of this industry leadership team and with Zespri employees and partners around the world.
$0
$20
$40
$60
$80
$100
$120
$140
2010/11 2016/172011/12 2012/13 2013/14 2014/15 2015/16
NZ
D M
illio
ns
86
.5
119
.8
89
.0
107.
5
103
.1
5.7
55
.2
Zespri has a medium-term hedging horizon which, when currencies and oil prices fall, can lead to reduced gains or possible losses. For 2016/17 the hedging result reflects the continued strength in the New Zealand Dollar, particularly in relation to the Japanese Yen and Euro.
Progress has been made in a number of other areas relating to KISP. Changes have been made to the New Zealand Kiwifruit Growers Forum, reduced from 37 to 27 members. Also, Māori kiwifruit grower representation in the industry has been strengthened with the establishment of a National Māori Growers Forum with the support of Te Puni Kōkiri, the Ministry of Maori Development. Furthermore, with the appointment in late 2016 of a market maker to facilitate ZGL share trading on the Unlisted trading platform, we believe that we have seen a signifi cant improvement in liquidity and a reduction in price volatility in Zespri shares.
Conclusion
We are satisfi ed overall with performance in the 2016/17 season with continued strong returns in recent years refl ected in orchard values, Zespri shares and SunGold licences. We are confi dent that continued investment by Zespri in innovation and market development will sustain returns into the future.
Peter McBride Lain JagerChairman Chief Executive Offi cer
10Zespri Annual Report 2016/17 Zespri Group Limited and Subsidiaries Annual Report for the year ended 31 March 2017

From 2017 the segments are disclosed to align with the strategic focus of the business. The new segments are defined as: New Zealand kiwifruit, non-New Zealand supply, new cultivars, and land and buildings. In 2017 the segment financial information has been provided in two tables, one under the old segment disclosure layout and one under the new segment disclosure layout.
A Other direct pool costs – onshore include: Kiwifruit Vine Health Inc (KVH) funding, KNZ fees and New Zealand Kiwifruit Growers Incorporated (NZKGI) funding, which were previously reported separately.
B Innovation funding has been split between the New Zealand kiwifruit segment and the new cultivars segment based on the segment activity (refer to Note 2(b) and Note 30 in the Annual Report).
C These costs are now split between the segments: New Zealand kiwifruit, non-New Zealand supply, new cultivars, and land and buildings, based on segment activity.
D New cultivars costs include overhead costs and innovation costs (refer to Note 30 in the Annual Report).
For Notes 1 to 8 please refer to page 25.
Zespri Alternative Revenue Statement – New Segment DisclosureNew segment disclosure
2016/17
Tray Equivalents (TEs) – Supplied (millions) Total New Zealand kiwifruit segment (includes collaborative marketing) 145.9 Total non-New Zealand supply segment 16.8
New Zealand kiwifruit segment $’000Gross sales of New Zealand kiwifruit 2,149,786 Promotional rebates, claims and discounts (122,595)Net sales of New Zealand kiwifruit 2,027,191 Net fruit return through collaborative marketers 19,141 Other pool income 1,742 Revenue attributable to New Zealand pools 1 2,048,074
Less New Zealand pool costs:Freight 135,107 Insurance (onshore and offshore excluding hail) 3,159 Hail self-insurance 3,499 Duty and customs 80,168 Other direct pool costs – onshore 2 & 3 & 5 & A 61,592 Other direct pool costs – offshore 76,763 Promotion 149,597 Interest income 4 (810)Total pool costs 509,075
Return from fruit sales 1,538,999
New Zealand fruit and service payments 1,343,983 Zespri margin 6 195,016
Other non-pool revenue 2,385 Innovation funding B 4,315 New Zealand kiwifruit corporate revenue 201,716 Less corporate overhead expenses:Innovation C 11,651 Class 2 mainpack subsidy 10 Overhead costs – onshore C 70,059 Overhead costs – offshore C 61,781 New Zealand kiwifruit corporate overhead expenses 143,501 Zespri EBIT and loyalty premium from New Zealand kiwifruit segment 58,215 Loyalty premium 36,047 Zespri EBIT from New Zealand kiwifruit segment 22,168
Non-New Zealand supply segment 7 Revenue from non-New Zealand supply kiwifruit 216,533 Less non-New Zealand supply costs:Direct costs including fruit purchases 189,385 Overhead costs C 15,296
204,681 EBIT from non-New Zealand supply segment 11,852
New cultivars segmentNew cultivars licence revenue 8 67,178 New cultivars royalty income 2 16,673 New cultivars innovation funding B 3,646 Revenue attributable to new cultivars 87,497 Less new cultivars costs:Amortisation of new cultivars 1,917 New cultivars costs C & D 14,688
16,605 EBIT from new cultivars segment 70,892
Land and buildings segment Income 705 Overhead costs C 966
966 EBIT from land and buildings segment (261)
Zespri Group EBIT 104,651
Net interest income 2,424 Zespri Group profit before taxation 107,075
Taxation 33,374 Zespri Group profit after tax 73,701
Total fruit and service payments 1,343,983 Loyalty premium 36,047 Total fruit and service payments (including loyalty premium) 1,380,030
Zespri Alternative Revenue Statement – Previous Segment Disclosure2016/17 2015/16 2014/15
Tray Equivalents (TEs) – Supplied (millions)Total New Zealand-grown kiwifruit (includes collaborative marketing) 145.9 120.1 95.7Total non-New Zealand-grown supply 16.8 14.7 13.2
$’000 $’000 $’000
Gross sales of New Zealand-grown kiwifruit 2,149,786 1,800,294 1,458,678 Promotional rebates, claims and discounts (122,595) (88,418) (69,448) Net sales of New Zealand-grown kiwifruit 2,027,191 1,711,876 1,389,230 Net fruit return through collaborative marketers 19,141 11,427 11,861 Other pool income 1,742 1,061 126 Revenue attributable to New Zealand pools 1 2,048,074 1,724,364 1,401,217
Less pool costs:Freight 135,107 138,749 116,894 Insurance (onshore and offshore excluding hail) 3,159 2,756 1,923 Hail self-insurance 3,499 3,417 2,162 Duty and customs 80,168 78,340 68,116 Other direct pool costs – onshore 2 57,162 45,480 30,892 Other direct pool costs – offshore 76,763 51,800 46,467 KVH funding 3 2,689 2,226 1,144 Promotion 149,597 125,394 82,749 Interest income 4 (810) (2,472) (2,801) KNZ fees 5 493 444 453 NZKGI funding 5 1,248 1,072 857
Total pool costs 509,075 447,206 348,856
Return from fruit sales 1,538,999 1,277,158 1,052,361
New Zealand fruit and service payments 1,343,983 1,113,410 915,776 Zespri margin 6 195,016 163,748 136,585
Other non-pool revenue 2,385 1,265 509 Royalty income from new cultivars 2 16,673 6,185 2,747 Research grant co-funding 7,961 8,921 4,041 Zespri income attributable to New Zealand-grown kiwifruit 222,035 180,119 143,882 Onshore costs:
Innovation 25,349 23,901 15,928 Class 2 mainpack subsidy expense/(income) 10 (10) (713) Gold9 decommercialisation provision funding - - 1,551 Amortisation of new cultivars 1,917 1,786 1,491 Onshore overheads 71,310 58,690 46,229
98,586 84,367 64,486 Offshore costs 61,781 39,705* 43,721
61,668 56,047 35,675 Add operating surplus from other business activities:
Non-New Zealand-grown supply (before taxation) 7 11,852 10,415 8,992 Gold defence fund (before taxation) - 4,191 2,076 Income from sale of Zespri licences (before taxation) 8 67,178 2,589 24,175
EBIT before loyalty premium 140,698 73,242 70,918
Net interest income 2,424 2,916 3,200 Zespri profit before tax and loyalty premium 143,122 76,158 74,118
Loyalty premium 36,047 29,642 23,192
Zespri Group profit before taxation 107,075 46,516 50,926 Tax expense 33,374 10,688 16,305 Zespri Group profit after taxation 73,701 35,828 34,621
Total fruit and service payments 1,343,983 1,113,410 915,776 Loyalty premium 36,047 29,642 23,192 Total fruit and service payments (including loyalty premium) 1,380,030 1,143,052 938,968
The Alternative Revenue Statement is used for management information and is the basis for the calculation of the fruit and service payments. Foreign exchange gains and losses are allocated differently from the way that they are allocated in the Financial Statements in that they are apportioned to the relevant line items above. The Alternative Revenue Statement is consistent with the business segment analysis in Note 30 of the Annual Report.
* Offshore overheads of $39.7 million in 2015/16 include the reversal of the China provision of $13.0 million.
From 2017 the segments are disclosed to align with the strategic focus of the business. The new segments are defined as: New Zealand kiwifruit, non-New Zealand supply, new cultivars, and land and buildings. In 2017 the segment financial information has been provided in two tables, one under the old segment disclosure layout and one under the new segment disclosure layout.
A Other direct pool costs – onshore include: Kiwifruit Vine Health Inc (KVH) funding, KNZ fees and New Zealand Kiwifruit Growers Incorporated (NZKGI) funding, which were previously reported separately.
B Innovation funding has been split between the New Zealand kiwifruit segment and the new cultivars segment based on the segment activity (refer to Note 2(b) and Note 30 of the Financial Statements).
C These costs are now split between the segments: New Zealand kiwifruit, non-New Zealand supply, new cultivars, and land and buildings, based on segment activity.
D New cultivars costs include overhead costs and innovation costs (refer to Note 30 of the Financial Statements).
For Notes 1 to 8 please refer to page 13.
11 www.zespri.comZespri Group Limited and Subsidiaries Annual Report for the year ended 31 March 2017

From 2017 the segments are disclosed to align with the strategic focus of the business. The new segments are defined as: New Zealand kiwifruit, non-New Zealand supply, new cultivars, and land and buildings. In 2017 the segment financial information has been provided in two tables, one under the old segment disclosure layout and one under the new segment disclosure layout.
A Other direct pool costs – onshore include: Kiwifruit Vine Health Inc (KVH) funding, KNZ fees and New Zealand Kiwifruit Growers Incorporated (NZKGI) funding, which were previously reported separately.
B Innovation funding has been split between the New Zealand kiwifruit segment and the new cultivars segment based on the segment activity (refer to Note 2(b) and Note 30 in the Annual Report).
C These costs are now split between the segments: New Zealand kiwifruit, non-New Zealand supply, new cultivars, and land and buildings, based on segment activity.
D New cultivars costs include overhead costs and innovation costs (refer to Note 30 in the Annual Report).
For Notes 1 to 8 please refer to page 25.
Zespri Alternative Revenue Statement – New Segment DisclosureNew segment disclosure
2016/17
Tray Equivalents (TEs) – Supplied (millions) Total New Zealand kiwifruit segment (includes collaborative marketing) 145.9 Total non-New Zealand supply segment 16.8
New Zealand kiwifruit segment $’000Gross sales of New Zealand kiwifruit 2,149,786 Promotional rebates, claims and discounts (122,595)Net sales of New Zealand kiwifruit 2,027,191 Net fruit return through collaborative marketers 19,141 Other pool income 1,742 Revenue attributable to New Zealand pools 1 2,048,074
Less New Zealand pool costs:Freight 135,107 Insurance (onshore and offshore excluding hail) 3,159 Hail self-insurance 3,499 Duty and customs 80,168 Other direct pool costs – onshore 2 & 3 & 5 & A 61,592 Other direct pool costs – offshore 76,763 Promotion 149,597 Interest income 4 (810)Total pool costs 509,075
Return from fruit sales 1,538,999
New Zealand fruit and service payments 1,343,983 Zespri margin 6 195,016
Other non-pool revenue 2,385 Innovation funding B 4,315 New Zealand kiwifruit corporate revenue 201,716 Less corporate overhead expenses:Innovation C 11,651 Class 2 mainpack subsidy 10 Overhead costs – onshore C 70,059 Overhead costs – offshore C 61,781 New Zealand kiwifruit corporate overhead expenses 143,501 Zespri EBIT and loyalty premium from New Zealand kiwifruit segment 58,215 Loyalty premium 36,047 Zespri EBIT from New Zealand kiwifruit segment 22,168
Non-New Zealand supply segment 7 Revenue from non-New Zealand supply kiwifruit 216,533 Less non-New Zealand supply costs:Direct costs including fruit purchases 189,385 Overhead costs C 15,296
204,681 EBIT from non-New Zealand supply segment 11,852
New cultivars segmentNew cultivars licence revenue 8 67,178 New cultivars royalty income 2 16,673 New cultivars innovation funding B 3,646 Revenue attributable to new cultivars 87,497 Less new cultivars costs:Amortisation of new cultivars 1,917 New cultivars costs C & D 14,688
16,605 EBIT from new cultivars segment 70,892
Land and buildings segment Income 705 Overhead costs C 966
966 EBIT from land and buildings segment (261)
Zespri Group EBIT 104,651
Net interest income 2,424 Zespri Group profit before taxation 107,075
Taxation 33,374 Zespri Group profit after tax 73,701
Total fruit and service payments 1,343,983 Loyalty premium 36,047 Total fruit and service payments (including loyalty premium) 1,380,030
Zespri Alternative Revenue Statement – Previous Segment Disclosure2016/17 2015/16 2014/15
Tray Equivalents (TEs) – Supplied (millions)Total New Zealand-grown kiwifruit (includes collaborative marketing) 145.9 120.1 95.7Total non-New Zealand-grown supply 16.8 14.7 13.2
$’000 $’000 $’000
Gross sales of New Zealand-grown kiwifruit 2,149,786 1,800,294 1,458,678 Promotional rebates, claims and discounts (122,595) (88,418) (69,448) Net sales of New Zealand-grown kiwifruit 2,027,191 1,711,876 1,389,230 Net fruit return through collaborative marketers 19,141 11,427 11,861 Other pool income 1,742 1,061 126 Revenue attributable to New Zealand pools 1 2,048,074 1,724,364 1,401,217
Less pool costs:Freight 135,107 138,749 116,894 Insurance (onshore and offshore excluding hail) 3,159 2,756 1,923 Hail self-insurance 3,499 3,417 2,162 Duty and customs 80,168 78,340 68,116 Other direct pool costs – onshore 2 57,162 45,480 30,892 Other direct pool costs – offshore 76,763 51,800 46,467 KVH funding 3 2,689 2,226 1,144 Promotion 149,597 125,394 82,749 Interest income 4 (810) (2,472) (2,801) KNZ fees 5 493 444 453 NZKGI funding 5 1,248 1,072 857
Total pool costs 509,075 447,206 348,856
Return from fruit sales 1,538,999 1,277,158 1,052,361
New Zealand fruit and service payments 1,343,983 1,113,410 915,776 Zespri margin 6 195,016 163,748 136,585
Other non-pool revenue 2,385 1,265 509 Royalty income from new cultivars 2 16,673 6,185 2,747 Research grant co-funding 7,961 8,921 4,041 Zespri income attributable to New Zealand-grown kiwifruit 222,035 180,119 143,882 Onshore costs:
Innovation 25,349 23,901 15,928 Class 2 mainpack subsidy expense/(income) 10 (10) (713) Gold9 decommercialisation provision funding - - 1,551 Amortisation of new cultivars 1,917 1,786 1,491 Onshore overheads 71,310 58,690 46,229
98,586 84,367 64,486 Offshore costs 61,781 39,705* 43,721
61,668 56,047 35,675 Add operating surplus from other business activities:
Non-New Zealand-grown supply (before taxation) 7 11,852 10,415 8,992 Gold defence fund (before taxation) - 4,191 2,076 Income from sale of Zespri licences (before taxation) 8 67,178 2,589 24,175
EBIT before loyalty premium 140,698 73,242 70,918
Net interest income 2,424 2,916 3,200 Zespri profit before tax and loyalty premium 143,122 76,158 74,118
Loyalty premium 36,047 29,642 23,192
Zespri Group profit before taxation 107,075 46,516 50,926 Tax expense 33,374 10,688 16,305 Zespri Group profit after taxation 73,701 35,828 34,621
Total fruit and service payments 1,343,983 1,113,410 915,776 Loyalty premium 36,047 29,642 23,192 Total fruit and service payments (including loyalty premium) 1,380,030 1,143,052 938,968
The Alternative Revenue Statement is used for management information and is the basis for the calculation of the fruit and service payments. Foreign exchange gains and losses are allocated differently from the way that they are allocated in the Financial Statements in that they are apportioned to the relevant line items above. The Alternative Revenue Statement is consistent with the business segment analysis in Note 30 of the Annual Report.
* Offshore overheads of $39.7 million in 2015/16 include the reversal of the China provision of $13.0 million.
The Alternative Revenue Statement is used for management information and is the basis for the calculation of the fruit and service payments. Foreign exchange gains and losses are allocated differently from the way that they are allocated in the Financial Statements in that they are apportioned to the relevant line items above. The Alternative Revenue Statement is consistent with the business segment analysis in Note 30 of the Financial Statements.
12Zespri Annual Report 2016/17 Zespri Group Limited and Subsidiaries Annual Report for the year ended 31 March 2017

Cause of Change 2016/17 vs 2015/16$Millions
New Zealand Pool Costs as a Percentage of Pool Revenue
2016/17 2015/16 2014/15
Zespri margin (net of loyalty premium) 6 7.8% 7.8% 8.1%Freight 6.6% 8.0% 8.3%Insurance 0.3% 0.4% 0.3%Duty and customs 3.9% 4.5% 4.9%Other direct pool costs – onshore 2 3.0% 2.8% 2.4%Other direct pool costs – offshore 3.7% 3.0% 3.3%Promotion 7.3% 7.3% 5.9%Interest income 4 0.0% (0.1%) (0.2%)Total fruit and service payments (including loyalty premium) 67.4% 66.3% 67.0%
100.0% 100.0% 100.0%Revenue attributable to New Zealand pools ($’000) 1 2,048,074 1,724,364 1,401,217
The Cause of Change chart outlines the increase in the return to the industry this season to $1,454 million from $1,179 million in 2015/16.
$’000
Total fruit and service payments 2015/16 (including loyalty premium) 1,143,052 Add Zespri net profit after tax 2015/16 35,828 Return to industry 2015/16 1,178,880
Movements due to change in:Sales price/offshore fruit loss (22,374) Market and profile mix (25,909) Volume 292,898 Foreign exchange (15,098) Other income/costs 68,020 Taxation (22,686)
Return to industry 2016/17 1,453,731
Total fruit and service payments 2016/17 1,343,983 Add Zespri loyalty premium 2016/17 36,047
Total including loyalty premium 2016/17 1,380,030 Add Zespri net profit after tax 2016/17 73,701 Return to industry 2016/17 1,453,731
1 Net revenue attributable to the pools includes sales of New Zealand-grown kiwifruit, net fruit returns income from New Zealand collaborative marketing programmes and other pool income as noted in the Alternative Revenue Statement.
2 Within ‘Other direct pool costs – onshore’ is the 3.0 percent royalty from new cultivars on net sales for Gold3 and Green14. This royalty is made up of two components: 1.35 percent of this royalty is paid to Plant & Food Research and 1.65 percent royalty income to the new cultivars segment in Zespri Group. Also included is the 1.5 percent royalty for Hort16A solely paid to Plant & Food Research. The defence fund reserve was disestablished on 31 March 2016. 2016 and 2015 defence fund income has been included in royalty income.
3 From 2013/14, the New Zealand pool funded the KVH levy. The rate was $0.01 per tray Class 1 Green and $0.02 per tray Class 1 Gold sold in markets other than Australia and New Zealand. From 2015/16 a levy for biosecurity readiness and response activities for all varieties was introduced. The levy is $0.006 per tray for all varieties sold in markets other than Australia and New Zealand.
4 Interest income is made up of the following: interest income of $1.41 million, interest paid of $0.38 million and an interest charge from Zespri corporate of $0.22 million. This results in an overall interest income to the pools of $0.81 million.
5 KNZ is the statutory board funded under regulation 39 of the Kiwifruit Export Regulations 1999. NZKGI is the kiwifruit grower representation body and Zespri Group Limited is required by the Commodity Levies (Kiwifruit) Order 2012 to pay a levy to NZKGI on behalf of New Zealand growers. The rate for the 2016/17 year was $0.009 per tray of kiwifruit sold in markets other than Australia and New Zealand.
6 Zespri margin is calculated in accordance with the New Zealand Supply Agreement, being 5.0 percent of net sales (excluding collaborative marketing programmes) and 7.75 percent of fruit payments to suppliers.
7 Further analysis of non-New Zealand-grown supply is available within the segment reporting in Note 30 of the Annual Report.
8 In prior years, the sale of new variety licences has included deferred payments, hardship or surrender clauses that result in uncertainty as to the collectability of the outstanding consideration. As such, this revenue had not been recognised until cash proceeds had been received. In 2014/15 the revenue for the sale of new variety licences in prior years was recognised, as the Directors considered the uncertainty regarding material collection had been removed.
(22.4)
(25.9)
292.9
(15.1)
68.0
(22.7)
274.9
Sales price/offshore fruit loss
Market and profile mix
Total
Taxation
Other income/costs
Foreign exchange
Volume
1 Net revenue attributable to the pools includes sales of New Zealand-grown kiwifruit, net fruit returns income from New Zealand collaborative marketing programmes and other pool income as noted in the Alternative Revenue Statement.
2 Within ‘Other direct pool costs – onshore’ is the 3.0 percent royalty from new cultivars on net sales for Gold3 and Green14. This royalty is made up of two components: 1.35 percent of this royalty is paid to Plant & Food Research and 1.65 percent royalty income to the new cultivars segment in Zespri Group. Also included is the 1.5 percent royalty for Hort16A solely paid to Plant & Food Research. The defence fund reserve was disestablished on 31 March 2016. 2016 and 2015 defence fund income has been included in royalty income.
3 From 2013/14, the New Zealand pool funded the KVH levy. The rate was $0.01 per tray Class 1 Green and $0.02 per tray Class 1 Gold sold in markets other than Australia and New Zealand. From 2015/16 a levy for biosecurity readiness and response activities for all varieties was introduced. The levy is $0.006 per tray for all varieties sold in markets other than Australia and New Zealand.
4 Interest income is made up of the following: interest income of $1.41 million, interest paid of $0.38 million and an interest charge from Zespri corporate of $0.22 million. This results in an overall interest income to the pools of $0.81 million.
5 KNZ is the statutory board funded under regulation 39 of the Kiwifruit Export Regulations 1999. NZKGI is the kiwifruit grower representation body and Zespri Group Limited is required by the Commodity Levies (Kiwifruit) Order 2012 to pay a levy to NZKGI on behalf of New Zealand growers. The rate for the 2016/17 year was $0.009 per tray of kiwifruit sold in markets other than Australia and New Zealand.
6 Zespri margin is calculated in accordance with the New Zealand Supply Agreement, being 5.0 percent of net sales (excluding collaborative marketing programmes) and 7.75 percent of fruit payments to suppliers.
7 Further analysis of non-New Zealand-grown supply is available within the segment reporting in Note 30 of the Financial Statements.
8 In prior years, the sale of new variety licences has included deferred payments, hardship or surrender clauses that result in uncertainty as to the collectability of the outstanding consideration. As such, this revenue had not been recognised until cash proceeds had been received. In 2014/15 the revenue for the sale of new variety licences in prior years was recognised, as the Directors considered the uncertainty regarding material collection had been removed.
13 www.zespri.comZespri Group Limited and Subsidiaries Annual Report for the year ended 31 March 2017

Cause of Change 2016/17 vs 2015/16$Millions
New Zealand Pool Costs as a Percentage of Pool Revenue
2016/17 2015/16 2014/15
Zespri margin (net of loyalty premium) 6 7.8% 7.8% 8.1%Freight 6.6% 8.0% 8.3%Insurance 0.3% 0.4% 0.3%Duty and customs 3.9% 4.5% 4.9%Other direct pool costs – onshore 2 3.0% 2.8% 2.4%Other direct pool costs – offshore 3.7% 3.0% 3.3%Promotion 7.3% 7.3% 5.9%Interest income 4 0.0% (0.1%) (0.2%)Total fruit and service payments (including loyalty premium) 67.4% 66.3% 67.0%
100.0% 100.0% 100.0%Revenue attributable to New Zealand pools ($’000) 1 2,048,074 1,724,364 1,401,217
The Cause of Change chart outlines the increase in the return to the industry this season to $1,454 million from $1,179 million in 2015/16.
$’000
Total fruit and service payments 2015/16 (including loyalty premium) 1,143,052 Add Zespri net profit after tax 2015/16 35,828 Return to industry 2015/16 1,178,880
Movements due to change in:Sales price/offshore fruit loss (22,374) Market and profile mix (25,909) Volume 292,898 Foreign exchange (15,098) Other income/costs 68,020 Taxation (22,686)
Return to industry 2016/17 1,453,731
Total fruit and service payments 2016/17 1,343,983 Add Zespri loyalty premium 2016/17 36,047
Total including loyalty premium 2016/17 1,380,030 Add Zespri net profit after tax 2016/17 73,701 Return to industry 2016/17 1,453,731
1 Net revenue attributable to the pools includes sales of New Zealand-grown kiwifruit, net fruit returns income from New Zealand collaborative marketing programmes and other pool income as noted in the Alternative Revenue Statement.
2 Within ‘Other direct pool costs – onshore’ is the 3.0 percent royalty from new cultivars on net sales for Gold3 and Green14. This royalty is made up of two components: 1.35 percent of this royalty is paid to Plant & Food Research and 1.65 percent royalty income to the new cultivars segment in Zespri Group. Also included is the 1.5 percent royalty for Hort16A solely paid to Plant & Food Research. The defence fund reserve was disestablished on 31 March 2016. 2016 and 2015 defence fund income has been included in royalty income.
3 From 2013/14, the New Zealand pool funded the KVH levy. The rate was $0.01 per tray Class 1 Green and $0.02 per tray Class 1 Gold sold in markets other than Australia and New Zealand. From 2015/16 a levy for biosecurity readiness and response activities for all varieties was introduced. The levy is $0.006 per tray for all varieties sold in markets other than Australia and New Zealand.
4 Interest income is made up of the following: interest income of $1.41 million, interest paid of $0.38 million and an interest charge from Zespri corporate of $0.22 million. This results in an overall interest income to the pools of $0.81 million.
5 KNZ is the statutory board funded under regulation 39 of the Kiwifruit Export Regulations 1999. NZKGI is the kiwifruit grower representation body and Zespri Group Limited is required by the Commodity Levies (Kiwifruit) Order 2012 to pay a levy to NZKGI on behalf of New Zealand growers. The rate for the 2016/17 year was $0.009 per tray of kiwifruit sold in markets other than Australia and New Zealand.
6 Zespri margin is calculated in accordance with the New Zealand Supply Agreement, being 5.0 percent of net sales (excluding collaborative marketing programmes) and 7.75 percent of fruit payments to suppliers.
7 Further analysis of non-New Zealand-grown supply is available within the segment reporting in Note 30 of the Annual Report.
8 In prior years, the sale of new variety licences has included deferred payments, hardship or surrender clauses that result in uncertainty as to the collectability of the outstanding consideration. As such, this revenue had not been recognised until cash proceeds had been received. In 2014/15 the revenue for the sale of new variety licences in prior years was recognised, as the Directors considered the uncertainty regarding material collection had been removed.
(22.4)
(25.9)
292.9
(15.1)
68.0
(22.7)
274.9
Sales price/offshore fruit loss
Market and profile mix
Total
Taxation
Other income/costs
Foreign exchange
Volume
14Zespri Annual Report 2016/17 Zespri Group Limited and Subsidiaries Annual Report for the year ended 31 March 2017
CORPORATE GOVERNANCE
Strong corporate governance means acting and leading with integrity and maintaining a high standard of business ethics, underpinned by written policies and procedures which ensure that the culture and expectations are clearly understood and embraced throughout the Company. The Board considers it essential that a high standard of corporate governance practices is in place across the organisation, starting with the Directors themselves at Board level. This section provides an overview of the key elements of the Company’s corporate governance framework.
Legislative and regulatory framework
Zespri Group Limited is regulated by the provisions of the Companies Act 1993 and other relevant legislation governing the duties of directors, including financial reporting obligations, offering and trading in securities, employment, environment, and health and safety. As the Company also issues shares, it is required to comply with all requirements of applicable securities legislation, including the Financial Markets Conduct Act 2013 and, therefore, share transactions and some company publications are subject to scrutiny by the Financial Markets Authority.
The Company and its Directors are bound by the Zespri Group Limited Constitution, which contains details regarding shares in the Company, transfer and voting of shares, procedures for shareholder meetings, and director election and tenure (among other matters). The Kiwifruit Export Regulations 1999 also contain provisions that impact on the governance of the Company, which are monitored and enforced by the industry regulator, Kiwifruit New Zealand. Under the Regulations:
• Zespri must not discriminate between suppliers and potential suppliers in relation to the decision to purchase kiwifruit or the terms of purchase, other than on commercially justifiable grounds;
• Zespri must not carry out any activity, nor own nor operate assets, that are not necessary for the core business of exporting kiwifruit, unless approved by the providers of capital used or to be used for that activity, and only if the risks of the activity are minimal for those shareholders and suppliers who have not given approval;
• Zespri must comply with certain specific information disclosure requirements regarding its activities; and
• Zespri must publish disclosure accounts which are audited and available on request.
The Company has policies and procedures in place to ensure compliance with all of the above obligations and, at the end of each financial year, the Chief Executive Officer, Chief Financial Officer and General Counsel provide an assurance to the Board regarding legislative and regulatory compliance.
The Zespri Group Limited Constitution also contains provisions regarding confidentiality of shareholder proxy and voting
information which exceed legal and regulatory requirements. These provisions reflect standards of corporate governance in relation to shareholder democracy that go beyond those required of publicly listed companies.
The Board
The Company’s eight-member Board is made up of five Directors drawn from the kiwifruit industry and three Independent Directors. Having three Independent Directors is in line with good governance practice and, collectively, eight Directors bring together a wide range of experience, from international marketing and agribusiness to kiwifruit industry knowledge and financial expertise. One of the outcomes of the Kiwifruit Industry Strategy Project (KISP) process conducted in 2014 was to make it a formal requirement to have three Independent Directors under the Zespri Group Limited Constitution. The relevant changes to the Constitution were approved by shareholders at the 2016 Annual Meeting.
Background profiles of each Director are on the Company’s corporate website (www.zespri.com) and the Company’s grower website, The Canopy (https://canopy.zespri.com). The Board’s task is to govern the Company, in particular by providing strong strategic direction to achieve maximum returns for shareholders while, at the same time, safeguarding the interests of shareholders and other relevant stakeholders as appropriate.
Each Board member is issued with a comprehensive Director’s Manual which contains detailed information on the corporate governance regime that applies to the Company and the Directors’ duties and responsibilities in that regard. The Director’s Manual is kept up to date by the General Counsel and recirculated to Directors periodically.
Each Zespri Director serves a three-year term and must retire by rotation at the Annual Meeting nearest to the expiry of three years since his or her election. Since 2012 the Board has adopted a policy of formally reviewing the contribution of each Independent Director, the desired mix of skills for the future that should be contributed by the Independent Directors and the general desirability of rotation among the Independent Directors. This process of formally assessing the skill sets required permits the Board to undertake an objective assessment of whether or not incumbent Independent Directors fulfil the requirements of the Board overall, as well as to conduct targeted recruitment initiatives focused on identifying the best candidates for the Board. In 2017 David Pilkington retired as an Independent Director after approximately 12 years on the Board. The Board and Management extend their thanks to Mr Pilkington for his strong leadership and commitment during his time on the Board.
Following Mr Pilkington’s decision not to stand for re-election, the Board undertook an extensive search for a new Independent Director, and sought a candidate with strong business leadership
15 www.zespri.comZespri Group Limited and Subsidiaries Annual Report for the year ended 31 March 2017
and corporate governance experience together with exposure to the Asian business environment. Peter Springford was chosen as a suitable replacement and became a Director on 1 May 2017. Mr Springford is being recommended by the Board for election as an Independent Director at the 2017 Annual Meeting.
Details of Directors’ remuneration and interests are recorded on pages 64 to 68, under Directors’ Disclosures.
Board committees
The Board has an Audit and Risk Management Committee currently chaired by Jonathan Mason. This Committee reviews and monitors the Company’s overall risk (both financial and non-financial) and its risk management strategies. It reviews the effectiveness of, and monitors compliance with, all internal controls including those relevant to finance, tax and treasury, and supports management in reviewing key accounting judgements and ensuring that the financial statements are consistent with NZ GAAP. The Committee also reviews and monitors both internal and external audit processes as well as compliance education and other compliance initiatives.
The Board’s Organisation and Administration Committee oversees the appointment and remuneration of senior executives and strategic employment matters, such as general employee remuneration and incentive policies, employee engagement, and organisational development strategies. Bruce Cameron currently chairs this Committee.
Board oversight of innovation activities including reviewing the amount and priority of innovation spend, is performed by the Board Innovation Subcommittee, which is currently chaired by Nathan Flowerday.
Minutes are kept of all Board and Board Committee meetings, and all Directors receive copies of all Board Committee papers. A table showing the frequency of meetings of the Board and its Committees, and attendance by Zespri Directors at those meetings, is shown on page 63.
In addition to these Committees, the Board convenes small informal subcommittees from time to time, to consider particular matters or issues of focus to the Company. Directors also represent the Company in other industry bodies including the Industry Advisory Council (IAC) and Kiwifruit Vine Health Incorporated (KVH).
Conflicts of interest
With five industry Directors on the Board, governance of the Company is partly in the hands of individuals who have their own private interests in the wider kiwifruit industry. The Company benefits greatly from the industry experience that these Directors bring to the boardroom table. However, it also means that conflicts of interest need to be managed carefully.
The Company has comprehensive policies and practices to manage actual and potential conflicts of interest that meet, and in some cases exceed, Companies Act 1993 requirements:
• All Directors, including Independent Directors, are required to declare actual or potential conflicts of interest as soon as they arise. These are discussed and managed as necessary at the beginning of each Board meeting, and are recorded in the Company’s Interests Register. Details of all relevant matters to 31 March 2017, which have been entered in the Interests Register by individual Directors, are set out under Directors’ Disclosures on pages 65 to 68; and
• As a matter of good governance practice at Board meetings, Directors with any relevant interests excuse themselves from the meetings while issues which may present significant conflicts are discussed or decided upon. Where a significant conflict exists with matters being considered by the Board, Board papers and minutes are edited for the applicable Director to remove references to any such matters.
In certain circumstances, a conflict of interest may not be manageable using the steps noted above. In these cases a Director may need to choose between continuing as a Zespri Director and their other business interests.
A Conflicts of Interest Policy is also in place for employees. Like Directors, employees are required to declare actual or potential conflicts of interest on a regular basis to ensure these are managed appropriately, and an Interests Register is maintained and monitored.
Share trading
Zespri shares are now listed on the Unlisted share trading platform which has improved transparency of information. Comprehensive approval and disclosure policies and procedures are in place for trading in Zespri Group Limited shares by Directors and employees. This ensures that Directors and employees only complete such transactions in a market where potential stakeholders have had a reasonable opportunity to be fairly informed of knowledge which may affect the price of Zespri Group Limited shares. Pursuant to the relevant policies and procedures, Directors may transact only:
• with the approval of an Independent Director acting as Approval Officer; and
• when no information which may impact on the share price is known to Directors or employees but not known to the industry as a whole.
Directors are automatically embargoed from trading shares each month from the date of receipt of Board papers until an agreed period after the Board meeting is concluded and the Chairman’s announcement to the industry is made. At the end of each Board meeting, the Board considers whether there is any price-sensitive
16Zespri Annual Report 2016/17 Zespri Group Limited and Subsidiaries Annual Report for the year ended 31 March 2017

information known to the Board which should preclude Directors or employees from transacting in Zespri Group Limited shares. Director trading was suspended at various times through the year when information that was judged potentially material to the share price was known to the Board. Details of all share trading by Directors and their relevant interests are published on the Company’s website (www.zespri.com) and on the Company’s grower website, The Canopy (https://canopy.zespri.com).
Since 1 February 2016 the Company has operated its share trading platform through the Unlisted platform. Unlisted is a Financial Product Market operating under an exemption from subpart 7 of Part 5 of the Financial Markets Conduct Act 2013. At the 2016 Annual Meeting, shareholders also approved amendments to the Constitution to allow the Board to appoint a `market maker’ with a view to ensuring that the market for Zespri shares is as effective as possible. The Board appointed Craigs Investment Partners from November 2016 to provide market maker services for Zespri Group Limited shares; management believes the introduction of the market maker has resulted in more liquidity in the market, and decreased share price volatility.
Ethics
High ethical standards are of critical importance to the Company, and the Board periodically receives presentations and/or training in respect of ethical issues for Directors and the Company. In addition to these sessions, the Director’s Manual addresses ethical issues across a number of areas such as legislative requirements, conflicts of interest and best-practice guidance. Directors and employees are governed by a Code of Conduct which is periodically reviewed and updated to ensure the maintenance of high standards.
Confidentiality
To support compliance for both Directors and employees with their obligations under law, comprehensive policies on confidential information and privacy are in place. These policies are reviewed periodically, together with document retention and information management policies and procedures, to ensure they remain best practice and fit for purpose in changing regulatory environments.
Delegation of Board power
Under the Companies Act 1993, management of a company rests with its directors. However, decision-making on all but a few critical matters may be delegated to management. The Company maintains a comprehensive Delegated Authorities Policy which is a key governance document specifying the kinds of decisions and approvals that can be made by managers at various levels within the Company, and identifying those which are reserved for the Board or its Committees. A number of other internal policies are in place which guide certain aspects of day-to-day management of the business and sit below the Delegated Authorities Policy.
Evaluating Board performance
The Board reviews its performance so that it may continuously monitor and improve the quality of its meetings and meeting support. The Board undertakes an extensive self-evaluation process to assess performance on an annual basis, and works with the Institute of Directors to provide training and evaluation of individual Directors. Feedback from both the self-evaluation and the Institute of Directors is discussed with a view to continuously improving performance. Individual Directors’ training requirements may be identified at this time also.
Remuneration of Directors
The Company’s Constitution provides that shareholders shall, from time to time, set the maximum total amount payable to Directors as Directors’ fees. The amount actually paid to Directors is determined by the Board up to the maximum set by shareholders, and the total Directors’ fees may be distributed among them in such manner as the Board determines periodically. Details of Director remuneration are set out on page 64.
Consideration of Directors’ fees is undertaken by the Director Remuneration Committee, which comprises three elected shareholder members – John Cook (Chair), Michelle Dyer and John Griffin – and one independent member appointed by the Board, Warren Larsen. John Griffin is retiring by rotation from the Director Remuneration Committee at the 2017 Annual Meeting and intends to stand for re-election.
The Director Remuneration Committee considers Director remuneration and governance succession issues, including mechanisms for the identification and guidance of future industry leaders. The Board works closely with the Director Remuneration Committee in respect of initiatives around succession planning for the industry as a whole, including supporting participation by future young leaders in governance and leadership programmes such as the Kellogg Rural Leadership Programme operated by Lincoln University. In 2015 the Zespri Industry Governance Development programme was established to provide more targeted development for potential industry leaders including regular interaction with Directors. Following the successful first round in 2015, the second intake of candidates is under way in 2017.
Insurance
During the year, the Board resolved to continue with Directors and Officers’ liability insurance cover, with the premium costs met by Zespri Group Limited.
Approval of major transactions
At the 2015 Annual Meeting the Company obtained a five-year approval to enter into certain major transactions. Such transactions are: acquisitions or disposal of assets whose value is more than half the value of the Company’s assets before the transaction; or a transaction that has the effect of the Company acquiring rights or interests or incurring obligations or liabilities, the value of which is more than half the value of the Company’s assets before the transaction.
Transactions identified under this authority include entering into the seasonal funding facility with our banking syndicate, the giving of security to enable the Company to carry out its treasury functions such as hedging on foreign exchange and bunker fuel, the acquiring (and sale) of New Zealand-grown kiwifruit for export or sale in New Zealand, the acquiring (and sale) of non-New Zealand-grown kiwifruit for sale in markets outside New Zealand and the procuring of transport, insurance, promotional and other services in respect of such kiwifruit.
Information disclosure requirements under the Kiwifruit Export Regulations 1999
Regulation 12 of the Kiwifruit Export Regulations 1999 requires that the Company must publicly disclose financial statements as defined in the Kiwifruit Export Information Disclosure Handbook. The principal disclosures required are included within the New Zealand Industry Performance Section of the Annual Review, or within the Financial Statements of the Annual Report.
17 www.zespri.comZespri Group Limited and Subsidiaries Annual Report for the year ended 31 March 2017

Further disclosures are contained in the special purpose financial statements, including the certificate from the auditors, that are publicly available as required under the Regulations.
Compliance issues
Zespri maintains an internal audit function which regularly monitors compliance of all of the above policies and procedures, with any exceptions being reported to the Audit and Risk Management Committee.
In this regard, the Company has an in-house audit and compliance function with responsibility for conducting audits and managing a compliance framework, as well as auditing and monitoring on a risk basis compliance in targeted areas such as customs and duty declarations by customers in all markets where Zespri is not the importer of record, and for all new customers. In addition, training on compliance-related topics is provided both internally and by external providers during the year for all global Zespri staff, focusing on areas which are potentially of heightened risk due to Zespri’s global business profile.
The Board is committed to ensuring that the Zespri reputation and business is not adversely affected by non-compliance by the Company or its business partners. This means improving and monitoring internal processes and understanding the legal obligations throughout the distribution chain to ensure that opportunities for unlawful conduct by third parties are mitigated as far as possible, and that the Company’s business and culture are consistent with the operations of multinational businesses, and the laws of the countries in which Zespri kiwifruit is sold. The Company has developed a Global Customer Code of Conduct which has been incorporated into distribution contracts in most markets; this Code generally sets expectations for Zespri customers and distributors regarding matters such as legal and financial compliance, quality and food safety standards, fair competition, compliance with anti-bribery and anti-corruption laws, confidential information, discrimination, harassment and abuse, fair employment practices and labour standards, health and safety and care for the environment. In 2017 the Company has introduced a Global Supplier Code of Conduct which will be progressively rolled out to the Company’s supply chain partners. The Company also completes “Know Your Customer” due diligence, on a risk basis, for all existing and new customers, and is progressively rolling out third-party due diligence on all supply chain partners.
The Company is presently heavily focused on strategic initiatives to ensure that Zespri’s systems and processes are sustainable and scalable in the context of anticipated growth over upcoming seasons. This investment will ensure that global initiatives are appropriately prioritised having regard to the commercial impact of such initiatives, not only from the perspective of revenue generation for shareholders and growers but also risk mitigation and long-term sustainability of the business as a whole through consideration of future trends in the kiwifruit and broader fruit category and agribusiness generally.
KISP
In 2015 New Zealand kiwifruit growers approved a number of strategic industry proposals developed as part of the KISP via an industry referendum. A number of the proposals will have an impact on corporate governance, including elements such as the composition of the Board, the contractual arrangements for supply of kiwifruit, definition of core business and diversified activities, and ownership of Zespri shares. Where initiatives could be implemented without legislative change, the Company has
progressed these, including changes to the Zespri Constitution, moving share trading to the Unlisted share trading platform and considering an enduring funding methodology with respect to resetting the Zespri margin for New Zealand-supplied kiwifruit. The Company is awaiting the outcomes of the governmental regulatory review which is currently under way. Zespri is undertaking planning and analysis of the KISP ownership proposals in parallel with the regulatory review, with a view to progressing them expeditiously upon the revised regulations becoming law. Subject to completion of the regulatory process, a Special Meeting of shareholders is likely to be convened in late 2017 to consider changes to the ownership rules regarding Zespri shares; these changes will be material to all shareholders and the Company will be communicating extensively on these proposed changes. Subject to shareholders accepting the new ownership rules, the Company proposes to conduct a targeted share issue and buy-back in 2018.
Health and safety
The Board is strongly focused on ensuring that the Company’s workers and business partners are operating in safe and healthy workplaces, and receives updates on health and safety matters at each Board meeting. Following the introduction of the Health and Safety at Work Act in April 2016, Zespri has continued to focus on initiatives to improve worker health and safety in the new regulatory environment. The Company has a Board Charter on Health and Safety which is reviewed periodically and is working closely with other industry stakeholders to ensure that all participants in the industry are focused on ensuring a safe and healthy environment for workers in the kiwifruit industry.
Litigation and disputes
The Company continues to work on settling outstanding matters arising from failures by Zespri’s former Chinese importers to pay import duty on Zespri Kiwifruit in seasons prior to 2011. Two legal proceedings relating to this issue remain ongoing, being the claim by Zespri’s former importers for termination of the distribution relationship and employment proceedings by Zespri’s former employee. Work will continue on these matters in the 2017/18 financial year and provisions have been made for such ongoing efforts.
No new litigation has been commenced against the Company in the current financial year. As with any business, the Company does from time to time become involved in commercial disputes relating to its business, and seeks to resolve such disputes through commercial discussions or alternative dispute resolution processes such as mediation or arbitration. Where disputes are anticipated to have a quantifiable financial exposure or progress to formal proceedings, provisions are made for the costs of defending or pursuing such claims.
Serious Fraud Office
An investigation by the Serious Fraud Office, first announced to us in October 2013, is still ongoing.
18Zespri Annual Report 2016/17 Zespri Group Limited and Subsidiaries Annual Report for the year ended 31 March 2017

www.zespri.comZespri Group Limited and Subsidiaries Annual Report for the year ended 31 March 201719

FINANCIAL STATEMENTS
AND STATUTORY INFORMATION
For the year ended 31 March 2017
Your Directors take pleasure in presenting the Financial Statements of the Company and its subsidiaries (collectively Zespri Group) and
Statutory Information for the year ended 31 March 2017.
For and on behalf of the Directors
P J McBride Chairman
J P Mason Director
20Zespri Annual Report 2016/17 Zespri Group Limited and Subsidiaries Annual Report for the year ended 31 March 2017

Page left intentionally blank.
21 www.zespri.comZespri Group Limited and Subsidiaries Annual Report for the year ended 31 March 2017

22
Independent Auditor’s Report To the Shareholders of Zespri Group Limited
Report on the Consolidated Financial Statements
Opinion In our opinion, the accompanying Consolidated Financial Statements of Zespri Group Limited (the Company) and its subsidiaries (the Group) on pages 25 to 61:
i. Present fairly in all material respects the Group’sfinancial position as at 31 March 2017 and itsfinancial performance and cash flows for theyear ended on that date; and
ii. Comply with New Zealand Equivalents toInternational Financial Reporting Standards andInternational Financial Reporting Standards.
We have audited the accompanying Consolidated Financial Statements which comprise:
— The consolidated balance sheet as at 31 March2017;
— The consolidated income statement,statements of other comprehensive income, changes in equity and cash flows for the year then ended; and
— Notes, including a summary of significantaccounting policies and other explanatory information.
Basis for opinion
We conducted our audit in accordance with International Standards on Auditing (New Zealand) (“ISAs (NZ)”). We believe that the audit evidence we have obtained is sufficient and appropriate to provide a basis for our opinion.
We are independent of the Group in accordance with Professional and Ethical Standard 1 (Revised) Code of Ethics for Assurance Practitioners issued by the New Zealand Auditing and Assurance Standards Board and the International Ethics Standards Board for Accountants’ Code of Ethics for Professional Accountants (IESBA Code), and we have fulfilled our other ethical responsibilities in accordance with these requirements and the IESBA Code.
Our responsibilities under ISAs (NZ) are further described in the Auditor’s Responsibilities for the Audit of the Consolidated Financial Statements section of our report.
Our firm has also provided other services to the Group in relation to taxation advice and services, review and regulatory compliance services. These matters have not impaired our independence as auditor of the Group. The firm has no other relationship with, or interest in, the Group.
Other Information
The Directors, on behalf of the Group, are responsible for the other information included in the entity’s Annual Report. Other information includes the Season Overview, Financial Highlights, Chairman and CEO’s Report, Zespri Alternative Revenue Statement, Cause of Change, New Zealand Pool Costs, Corporate Governance, statutory information and Zespri Around the World. Our opinion on the Consolidated Financial Statements does not cover any other information and we do not express any form of assurance conclusion thereon.
22Zespri Annual Report 2016/17 Zespri Group Limited and Subsidiaries Annual Report for the year ended 31 March 2017

23
In connection with our audit of the Consolidated Financial Statements our responsibility is to read the other information and, in doing so, consider whether the other information is materially inconsistent with the Consolidated Financial Statements or our knowledge obtained in the audit or otherwise appears materially misstated. If, based on the work we have performed, we conclude that there is a material misstatement of this other information, we are required to report that fact. We have nothing to report in this regard.
Use of this Independent Auditor’s Report
This report is made solely to the shareholders as a body. Our audit work has been undertaken so that we might state to the shareholders those matters we are required to state to them in the Independent Auditor’s Report and for no other purpose. To the fullest extent permitted by law, we do not accept or assume responsibility to anyone other than the shareholders as a body for our audit work, this report, or any of the opinions we have formed.
Responsibilities of the Directors for the Consolidated Financial Statements The Directors, on behalf of the Group, are responsible for:
— The preparation and fair presentation of the Consolidated Financial Statements in accordance with generally accepted accounting practice in New Zealand (being New Zealand Equivalents to International Financial Reporting Standards) and International Financial Reporting Standards;
— Implementing necessary internal control to enable the preparation of a consolidated set of financial statements that is fairly presented and free from material misstatement, whether due to fraud or error; and
— Assessing the ability to continue as a going concern. This includes disclosing, as applicable, matters related to going concern and using the going concern basis of accounting unless they either intend to liquidate or to cease operations, or have no realistic alternative but to do so.
Auditor’s Responsibilities for the Audit of the Consolidated Financial Statements
Our objective is:
— To obtain reasonable assurance about whether the Consolidated Financial Statements as a whole are free from material misstatement, whether due to fraud or error; and
— To issue an Independent Auditor’s Report that includes our opinion.
Reasonable assurance is a high level of assurance, but is not a guarantee that an audit conducted in accordance with ISAs NZ will always detect a material misstatement when it exists.
Misstatements can arise from fraud or error. They are considered material if, individually or in the aggregate, they could reasonably be expected to influence the economic decisions of users taken on the basis of these Consolidated Financial Statements.
23 www.zespri.comZespri Group Limited and Subsidiaries Annual Report for the year ended 31 March 2017

24
A further description of our responsibilities for the audit of these Consolidated Financial Statements is located at the External Reporting Board (XRB) website at:
https://www.xrb.govt.nz/Site/Auditing_Assurance_Standards/Current_Standards/Page5.aspx.
This description forms part of our Independent Auditor’s Report.
Ian Proudfoot
For and on behalf of
KPMG Auckland
25 May 2017
24Zespri Annual Report 2016/17 Zespri Group Limited and Subsidiaries Annual Report for the year ended 31 March 2017

Income Statement and Statement of Comprehensive Income
Income Statement Notes2017$’000
2016$’000
Operating revenue 2(a) 2,288,996 1,860,672
Other revenue 2(b) 26,067 20,430
Operating expenses 3 (2,243,128) (1,881,080)
Other net gains 5 30,976 42,814
Operating profit before taxation 102,911 42,836
Finance revenue 6(a) 5,275 5,560
Finance expense 6(b) (1,111) (1,880)
Net profit before taxation 107,075 46,516
Taxation expense 7(a) (33,374) (10,688)
Net profit after taxation 73,701 35,828
Earnings per share: basic and diluted 8 $0.611 $0.297
Statement of Comprehensive Income2017$’000
2016$’000
Profit for the year 73,701 35,828
Total comprehensive income for the year 73,701 35,828
The above Income Statement and Statement of Comprehensive Income should be read in conjunction with the accompanying notes.
www.zespri.comZespri Group Limited and Subsidiaries Annual Report for the year ended 31 March 201725

Balance Sheet
Balance Sheet at 31 March Notes2017$’000
2016$’000
Current assets
Cash and cash equivalents 23(b) 187,010 165,027
Accounts receivable 12 67,348 67,126
Income tax receivable 21,317 11,217
Other financial assets 14(a) 52,021 44,979
Prepayments 13 20,454 16,208
Inventories 15 55,832 37,473
403,982 342,030
Non-current assets
Accounts receivable 12 50,789 5,959
Other financial assets 14(a) 44,305 39,187
Property, plant and equipment 16 18,263 16,425
Intangibles 17 31,275 30,571
Deferred tax assets 7(b) 4,163 2,469
Prepayments 13 603 1,263
149,398 95,874
Total assets 553,380 437,904
Current liabilities
Accounts payable and accruals 19 215,755 177,301
Income tax payable 35,346 7,726
Provisions and insurance liabilities 20 30,926 29,317
Other financial liabilities 14(b) 51,967 44,979
333,994 259,323
Non-current liabilities
Accounts payable and accruals 19 1,483 1,337
Provisions and insurance liabilities 20 593 652
Deferred tax liabilities 7(b) 1,032 6,530
Other financial liabilities 14(b) 44,305 39,187
47,413 47,706
Equity
Share capital 10(b) 18,017 18,017
Retained earnings 9(b) 153,956 112,858
171,973 130,875
Total liabilities and equity 553,380 437,904
The above Balance Sheet should be read in conjunction with the accompanying notes.
The Financial Statements were authorised for issue by the Directors of Zespri Group Limited on 25 May 2017.
Authorised for, and on behalf of, the Board:
P J McBrideChairman
J P MasonDirector
26Zespri Group Limited and Subsidiaries Annual Report for the year ended 31 March 2017Zespri Annual Report 2016/17

Statement of Changes in Equity
Share capital Retained earnings Other reserves Total
Statement of Changes in Equity Notes2017$’000
2016$’000
2017$’000
2016$’000
2017$’000
2016$’000
2017$’000
2016$’000
Attributable to shareholders:
Balance at 1 April 18,017 18,017 112,858 88,787 - 2,744 130,875 109,548
Comprehensive income:
Net profit after taxation - - 73,701 35,828 - - 73,701 35,828
Transfers to/(from) retained earnings 9 - - - 2,744 - (2,744) - -
Total comprehensive income for the year - - 73,701 38,572 - (2,744) 73,701 35,828
Transactions with owners:
Dividends paid during the year 11 - - (32,603) (14,501) - - (32,603) (14,501)
Total transactions with owners in their capacity as owners - - (32,603) (14,501) - - (32,603) (14,501)
Balance at 31 March 18,017 18,017 153,956 112,858 - - 171,973 130,875
The above Statement of Changes in Equity should be read in conjunction with the accompanying notes.
www.zespri.comZespri Group Limited and Subsidiaries Annual Report for the year ended 31 March 201727

Statement of Cash Flows
Statement of Cash Flows Notes2017$’000
2016$’000
Cash flows from operating activities
Cash was provided from:
Receipts from sales 2,212,471 1,845,042
Receipts from sales of Zespri licences 28,396 8,803
Receipts from income in advance 20,085 -
Receipts from research co-funding 11,030 3,880
Other sundry items 4,178 6,494
Insurance receipts – reinsurance assets 479 1
Proceeds from derivatives 55,196 5,693
Taxation refunded 2,179 867
2,334,014 1,870,780
Cash was applied to:
Payments to contracted suppliers – New Zealand-grown fruit 1,390,758 1,140,786
Payments to contracted suppliers – non-New Zealand-grown fruit 158,956 143,959
Payments to other suppliers and employees 674,810 532,485
Insurance claims – reinsurance liabilities 5,251 4,789
Taxation paid 25,225 13,140
2,255,000 1,835,159
Net cash provided from operating activities 22 79,014 35,621
Cash flows from investing activities
Cash was provided from:
Proceeds from sale of property, plant and equipment and intangibles 22 15
22 15
Cash was applied to:
Purchase of intangible assets 10,628 7,756
Purchase of property, plant and equipment 3,971 14,862
14,599 22,618
Net cash used in investing activities (14,577) (22,603)
Cash flows from financing activities
Cash was provided from:
Interest received 3,950 5,723
3,950 5,723
Cash was applied to:
Interest paid 395 172
Dividend payments 11 32,603 14,501
32,998 14,673
Net cash used in financing activities (29,048) (8,950)
Net increase in cash held 35,389 4,068
Effect of exchange rate changes on foreign currency cash balances (13,406) 13,963
Add opening cash brought forward 165,027 146,996
Ending cash carried forward 187,010 165,027
Represented by:
Cash and cash equivalents 23(b) 187,010 165,027
187,010 165,027
The above Statement of Cash Flows should be read in conjunction with the accompanying notes.
28Zespri Group Limited and Subsidiaries Annual Report for the year ended 31 March 2017Zespri Annual Report 2016/17

1. Summary of significant accounting policies Statement of compliance
The Financial Statements are a consolidation of Zespri Group Limited (‘the Company’) and its subsidiaries (collectively ‘Zespri Group’). The Company is domiciled in New Zealand and is a profit-oriented entity incorporated under the Companies Act 1993 of New Zealand. Zespri Group’s primary activity is the purchase, export and marketing of fresh kiwifruit.
The Financial Statements of the Group have been prepared in accordance with the Financial Markets Conduct Act 2013 and Financial Reporting Act 2013.
The Financial Statements have been prepared in accordance with Generally Accepted Accounting Practice in New Zealand (NZ GAAP). They comply with New Zealand Equivalents to International Financial Reporting Standards (NZ IFRS) and with International Financial Reporting Standards (IFRS).
The Financial Statements and Notes to the Financial Statements are presented in New Zealand Dollars, the functional and presentational currency of the Group.
Basis of preparation
The following accounting principles have been followed in the preparation of the consolidated Financial Statements:
• Historical cost basis, modified by the revaluation of certain items as identified in the specific accounting policies below; and
• Accrual accounting.
The Directors and management have reviewed the Zespri Group current business plans, financial forecasts and related assumptions for the next 12 months and beyond, and are satisfied that it is appropriate for reliance to be placed on the fact that Zespri Group is a going concern.
Use of estimates and judgements
The preparation of Financial Statements and related disclosures that conform with NZ IFRS requires management to make estimates and assumptions that affect the reported amounts of assets and liabilities and disclosure of contingent assets and liabilities at the date of the Financial Statements. Judgement is applied in determining estimates and the application of accounting standards.
Critical accounting estimates in applying significant accounting policies
The Group makes estimates and assumptions concerning the future. The resulting accounting estimates will, by definition, seldom exactly equal the related actual results.
Judgements and estimates are continually evaluated and are based on historical experience and other factors, including expectations of future events that are believed to be reasonable under the circumstances. Because judgement is applied, actual results could differ from estimates made. Estimates and assumptions are reviewed periodically and the effects of any changes are reflected immediately in the Income Statement.
The estimates and assumptions that have a significant risk of causing a material adjustment to the carrying amounts of assets and liabilities within the next financial year are in accounting for new variety licence revenue, taxation, accounts receivable, accounts payable and accruals, provisions, derivatives and contingent liabilities. Assumptions applied, methods used and uncertainties pertaining to these areas are discussed in the related specific accounting policies below, and in Notes 2: Revenue, 7: Taxation, 12: Accounts receivable, 14: Financial assets and liabilities, 17: Intangibles, 19: Accounts payable and accruals, 20: Provisions and insurance liabilities, 23: Financial instruments, and 24: Guarantees and contingent liabilities.
Specific accounting policies
The principal accounting policies adopted in the preparation of the Financial Statements are set out below:
(a) Basis of consolidation
The consolidated Financial Statements include the results and balances of all entities over which the Company and its subsidiary companies (refer Note 18) have control. All companies in Zespri Group are wholly owned by companies within the Group and, therefore, are ultimately fully controlled by the Company.
All subsidiaries have been incorporated and consolidated at inception by Zespri Group companies. No subsidiaries have been obtained by acquisition. The results and balances of subsidiaries are included in the consolidated Financial Statements of Zespri Group from the date of inception.
All inter-company transactions are eliminated on consolidation.
Accounting policies of subsidiaries have been changed where necessary to ensure consistency with the policies adopted by the Company.
(b) Indirect tax
The Income Statement, Statement of Comprehensive Income, Statement of Cash Flows, Statement of Changes in Equity and Balance Sheet have been presented so that all components are stated net of indirect tax (such as Goods and Services Tax (GST) and Value Added Tax (VAT)) where such taxes can be reclaimed from the relevant authorities with the exception of receivables and payables, which include indirect tax invoiced.
Notes to the Financial Statements
www.zespri.comZespri Group Limited and Subsidiaries Annual Report for the year ended 31 March 201729

Notes to the Financial Statements (continued)
1. Summary of significant accounting policies (continued)(c) Revenue recognition
Revenue is recognised as follows:
(i) Sale of goods and licences: Sales revenue (including collaborative marketing sales) is recognised when the risks and rewards of ownership of the goods or licences have passed to the customer or grower. Sales revenue reflects the fair value of the sale of goods, net of rebates and discounts.
(ii) Interest: Interest income is recognised on a time-proportion basis using the effective interest method.
(iii) Royalties: Royalty income is recognised on an accrual basis in accordance with the substance of the relevant agreement.
(d) Co-funding
Co-funding is recognised as follows:
(i) Research co-funding, including research co-funding from government grants, relating to research and development costs is recognised over the period necessary to match it with the costs that it is intended to compensate.
Where research and development expenditure is expensed in the Income Statement, co-funding income to which it relates is shown separately as income. Where research and development costs are capitalised as intangible assets, co-funding income is netted off the expenses being capitalised.
(ii) Co-funding income is recognised only when there is reasonable assurance that any conditions attached to the co-funding have been complied with, and that the co-funding will be received.
(e) Borrowing costs
Borrowing costs directly attributable to the acquisition, construction or production of qualifying assets, which are assets that necessarily take a substantial period of time to prepare for the intended use or sale, are added to the cost of those assets, until such time as the assets are substantially ready for their intended use or sale. All other borrowing costs are recognised in the Income Statement in the period in which they have been incurred.
(f) Earnings per share
Basic earnings per share are calculated by dividing net profit after tax by the weighted average number of shares outstanding during the year. In the calculation of diluted earnings per share, the weighted average number of shares outstanding is adjusted assuming conversion of all potential dilutive shares.
(g) Taxation
(i) Current tax payable or receivable:
Current tax is calculated by reference to the amount of income taxes payable or receivable in respect of the taxable profit or tax loss for the period in the tax jurisdictions in which Zespri Group’s companies operate. It is calculated using tax rates and laws that have been enacted or substantively enacted by the reporting date.
Current tax for the current and prior periods is recognised as a liability (or asset) to the extent that it is unpaid (or refundable).
Income taxes payable or receivable are shown net where there is a legal right of offset for balances recognised in the same tax jurisdiction.
(ii) Deferred tax:
Deferred income tax is provided in full using the balance sheet method on temporary differences arising between the tax bases of assets and liabilities and their carrying amounts. Deferred income tax is determined using tax rates and laws that have been enacted or substantively enacted by balance date and are expected to apply when the related deferred income tax asset is realised or the deferred income tax liability is settled.
Deferred income tax assets are recognised to the extent that it is probable that future taxable profits will be available against which the temporary differences can be utilised.
Deferred income tax assets or liabilities are shown net where there is a legal right of offset for balances recognised in the same tax jurisdiction.
(iii) Current and deferred tax for the period:
Current and deferred tax is recognised as an expense or income in the Income Statement, except when it relates to items credited or debited directly to equity, in which case the related tax is also recognised directly in equity.
30Zespri Group Limited and Subsidiaries Annual Report for the year ended 31 March 2017Zespri Annual Report 2016/17

Notes to the Financial Statements (continued)
1. Summary of significant accounting policies (continued)(h) Foreign currency translation
(i) Functional and presentational currency:
Transactions in each of Zespri Group’s companies are measured using the currency of the primary economic environment in which the entity operates. The functional currency of foreign operations is also considered in light of its dependence on the Company. All Zespri Group companies are currently deemed to have New Zealand Dollars as both their functional and presentational currencies.
(ii) Transactions and balances in functional currency:
Foreign currency transactions are translated into the functional currency of each entity using the exchange rates prevailing at the date of the transaction. Foreign exchange gains and losses resulting from the settlement of transactions during the year and from the translation of monetary assets and liabilities at balance date are recognised in the Income Statement.
Non-monetary items held at historical cost are translated using the historical exchange rate at the date of the transaction.
(i) Share capital
On the issue of shares, the value of the shares issued at the issue price is recognised in shareholders’ equity.
Costs associated with the issue of shares are recognised (net of any tax deduction) as a deduction from the amount collected from the share issue.
(j) Dividends
Dividends are reported as a movement in shareholders’ equity in the period in which they are declared by the Board of Directors.
(k) Other reserves
Retained earnings are set aside in other reserves where the Board of Directors resolves to separate certain funds from those able to be distributed from retained earnings. Historically, a separate defence fund reserve was transferred from retained earnings to hold funds for use in defending any challenges on Plant Variety Rights (PVRs). In 2015/16 the Directors reviewed the defence fund reserve and resolved to disestablish it on 31 March 2016. The balance of the defence fund reserve was transferred to retained earnings as at this date.
(l) Cash and cash equivalents
Cash and cash equivalents include cash on hand and demand deposits, and short-term investments that are readily convertible to known amounts of cash.
Bank overdrafts are shown within borrowings in current liabilities.
(m) Accounts receivable and payable
Accounts receivable are initially recognised at fair value and subsequently measured at amortised cost using the effective interest method, less any provision for doubtful debts.
Collectability of accounts receivable is reviewed on an ongoing basis. Debts which are known to be uncollectable are written off.
A provision for doubtful debts is established when there is objective evidence that the Group will not be able to collect all amounts due according to the original terms of the receivable.
The movement in the provision is recognised in the Income Statement. When a receivable is uncollectable, it is written off against the provision. Subsequent recoveries of amounts previously written off are credited against other expenses in the Income Statement.
Accounts payable are initially measured at fair value and subsequently measured at amortised cost.
(n) Inventories
Inventories are valued at the lower of cost or net realisable value. Costs incurred in bringing inventory to its present location and condition are accounted for at purchased cost on a first-in first-out basis. Borrowing costs are excluded.
(o) Derivatives
Zespri Group may reduce its exposure to fluctuations in foreign currency exchange rates and commodity prices affecting operating costs, through the use of derivatives. Derivatives are not entered into for speculative purposes.
Derivatives able to be utilised under the Treasury Management Policy include interest rate swaps, oil swaps, foreign exchange options and forward contracts.
Zespri Group’s policy is to manage risk from an economic perspective. As a result, Zespri Group manages the risks of net positions subject to market risks. Hedge accounting has not been applied. As a result, all derivatives are required to be classified as ‘held for trading’, and are measured at fair value with changes recognised through the Income Statement.
The full fair value of a hedging derivative is classified as a non-current asset or liability when the remaining maturity of the hedging derivative is for more than 12 months, and as a current asset or liability when the remaining maturity of the hedging derivative is for less than 12 months.
31 www.zespri.comZespri Group Limited and Subsidiaries Annual Report for the year ended 31 March 2017
Notes to the Financial Statements (continued)
1. Summary of significant accounting policies (continued)(o) Derivatives (continued)
(i) Recognition and derecognition:
Derivatives are recognised initially and subsequently at fair value, with changes in fair value of derivatives recognised in the Income Statement. The fair value of all financial instruments is recorded in the Balance Sheet. Derivatives are derecognised when the contractual rights or obligations relating to the cash flow expire.
(ii) Embedded derivatives:
Embedded derivatives are derivatives that are included within the terms of a non-derivative host contract. They affect the cash flows of the combined instrument in a way similar to a stand-alone derivative. An embedded derivative causes some or all of the cash flows that otherwise would be required by the contract to be modified according to a specified index, price, rate or other variable.
Companies within Zespri Group enter into contracts in the normal course of their operations. Within some of these contracts are embedded derivatives. Where the embedded derivatives are deemed to be closely related to the host contract, they are not valued or recognised separately from the accounting required for the host contract in the Financial Statements. Embedded derivatives deemed not to be closely related to the host contract are accounted for as if they were stand-alone derivatives.
(iii) Fair value estimation:
The fair value of derivatives traded in an active market are based on a price within the bid-ask spread that is most representative of fair value (refer Note 14).
The fair value of forward foreign exchange contracts is determined using quoted forward foreign exchange rates, option volatilities and interest rate yield curves at balance date.
The fair value of derivatives that are not traded in an active market is determined by using valuation techniques as specified at Note 23, adjusted for credit risk of the counter-party.
(p) Property, plant and equipment
The cost of purchased property, plant and equipment is the value of the consideration given to acquire the assets and the value of other directly attributable costs which have been incurred in bringing the assets to the location and condition necessary for their intended use.
The cost of assets constructed by Zespri Group includes the cost of all materials used in construction and direct labour on the project, and financing costs that are directly attributable to the project. Costs cease to be capitalised as soon as the asset is ready for productive use.
The major asset classes are land and improvements, buildings, leasehold improvements, plant and equipment, motor vehicles and capital work in progress.
(q) Depreciation
Depreciation is provided on a straight-line basis at rates calculated to allocate the cost of assets over their estimated useful lives. Capital work in progress is not depreciated until the work is complete and the asset is fit for its intended use. The estimated useful lives used for depreciation purposes are as follows:
Buildings Lower of 50 years or useful life of the building
Leasehold improvements Lower of 10 years or unexpired portion of lease
Plant and equipment 2 – 10 years
Motor vehicles 5 years
The useful life and residual value of property, plant and equipment are reviewed annually. Any change required as a result in the change of these estimates is recognised in the Income Statement during the period.
(r) Intangibles
(i) Research and development costs:
Research expenditure is expensed in the period incurred. Development costs are capitalised as internally generated intangible assets where future benefits are expected to exceed those costs; otherwise, development costs are expensed in the period incurred.
Development costs include costs relating to the development and production of Zespri-developed cultivars. Costs capitalised include those of budwood, legal fees and costs of obtaining Plant Variety Rights less any research co-funding received in respect of this expenditure. Development costs capitalised as an internally generated intangible asset have finite useful lives and are carried at cost less accumulated amortisation.
Amortisation is calculated using the straight-line method to allocate the cost over the estimated useful life of five years.
32Zespri Annual Report 2016/17 Zespri Group Limited and Subsidiaries Annual Report for the year ended 31 March 2017

Notes to the Financial Statements (continued)
1. Summary of significant accounting policies (continued)(r) Intangibles (continued)
(ii) Computer software:
Zespri Group purchases and develops software for use in its own business only. Because the software is without physical substance and is not linked to a producing asset with substance, it is classified as an intangible asset.
The cost of computer software acquired is the value of the purchase price to acquire the assets, and the value of other directly attributable costs which have been incurred in bringing the assets to the location and condition necessary for their intended use.
The cost of software developed by, and for the use of, Zespri Group includes the cost of all materials used to develop the software, direct labour on the project and financing costs that are directly attributable to the project. Computer software has a finite useful life and is carried at cost less accumulated amortisation.
Amortisation is calculated using the straight-line method to allocate the cost over the estimated useful life of three to five years.
(iii) Intangibles work in progress:
Intangibles work in progress is not amortised until work is complete and the asset is fit for its intended use.
The useful life and residual value of intangibles are reviewed annually. Any change required as a result in the change of these estimates is recognised in the Income Statement during the period.
(s) Impairment of non-financial assets
Non-financial assets that are subject to amortisation or depreciation are reviewed for impairment whenever events or changes in circumstances indicate that the carrying amounts may not be recoverable.
An impairment loss is recognised when an asset’s carrying amount exceeds its recoverable amount. For the purposes of assessing impairment, assets are grouped at the lowest levels for which there are separately identifiable cash flows.
(t) Employee benefits
Employee entitlements to salaries and wages, bonuses, annual leave, contributions to defined-contribution pension schemes and other accumulating benefits are recognised when they accrue to employees. Liabilities for employee benefits are carried at the value of the estimated future cash flows required to settle the obligation arising from services rendered by employees up until balance date.
Termination benefits are payable whenever an employee’s employment is terminated before the normal retirement date or whenever an employee accepts voluntary redundancy in exchange for these benefits. The Group recognises termination benefits when it is demonstrably committed to either terminate the employment of current employees, or to provide termination benefits as a result of an offer made to encourage voluntary redundancy.
(u) Provisions and insurance cover offered
Provisions
Zespri Group records provisions when: it has a legal or constructive obligation to satisfy a claim as the result of a past event; it is more likely than not that an outflow of resources will be required to satisfy the obligation; and a reliable estimate of the amount can be made. The amount recognised as a provision is the net present value of the best estimate of the outflows required to settle the obligation.
Insurance cover offered
(i) Marine cargo insurance:
The Company insures New Zealand contractors to the New Zealand Supply Agreement for loss of kiwifruit resulting from specific risks between picking and ‘Free on board stowed’ (FOBS). The annual period of cover is from 1 April to 31 March the following year. Zespri Group purchases marine cargo insurance as reinsurance of this risk. The terms of cover are contained in the annual New Zealand Supply Agreement issued every year to New Zealand-contracted suppliers.
An insurance liability is recognised to the extent of the estimated future cash flows that may be required to settle claims from New Zealand-contracted suppliers and related costs. An expense is recognised for known liabilities under the terms of insurance, and estimated for claims made but not yet settled. Claims are expected to be settled within one year. There is no discounting or inflation adjustment in measuring the liability because of the short settlement period.
An insurance asset and resultant revenue, relating to claims made pre-FOBS, are recognised to the extent of the estimated future cash flows that may be receivable from Zespri Group’s insurer as a result of known claims made against the reinsurance policy.
(ii) Hail insurance:
The Company insures New Zealand contractors to the New Zealand Supply Agreement annually for kiwifruit lost as a result of hail during the New Zealand growing period. The period of cover is from 1 August to 30 June the following year. The terms of cover are contained in the annual New Zealand Supply Agreement.
An insurance liability is recognised to the extent of the estimated future cash flows that may be required to settle claims and related costs. An expense is recognised for known liabilities under the terms of insurance, and estimated for claims made but not yet settled. Claims are settled at the end of the insurance period. There is no discounting or inflation adjustment in measuring the liability because of the short settlement period.
33 www.zespri.comZespri Group Limited and Subsidiaries Annual Report for the year ended 31 March 2017

Notes to the Financial Statements (continued)
1. Summary of significant accounting policies (continued)(v) Leases
Zespri Group leases premises, certain plant and equipment, and motor vehicles. Operating lease payments, where the lessor effectively retains substantially all the risks and benefits of ownership of the leased item, are included in the Income Statement in equal instalments over the lease term. Lease payments are shown net of any receipts earned from the subleases of these assets.
The cost of improvements to leasehold property is capitalised, disclosed as leasehold improvements and depreciated over the unexpired period of the lease or the estimated useful life of the improvements, whichever is the shorter.
(w) Statement of Cash Flows
The following definitions are the terms used in the Statement of Cash Flows:
(i) Cash and cash equivalents are considered to be cash on hand, current accounts and short-term money market deposits in banks, net of bank overdrafts.
(ii) Investing activities are those activities relating to the acquisition, holding and disposal of property, plant and equipment, intangibles and investments. Investments can include securities not falling within the definition of cash.
(iii) Financing activities are those activities which result in changes in the size and composition of the capital structure of Zespri Group. This includes both equity and debt not falling within the definition of cash. Dividends paid in relation to the capital structure are included in financing activities.
(iv) Operating activities include all transactions and other events that are not investing or financing activities.
(x) Segment reporting
Zespri Group determines its reportable segments by reference to the internal reporting of the activities of the Group to the Board of Directors, the chief operating decision-maker, as defined in NZ IFRS 8 (Operating Segments). Reportable segments have been determined to follow the strategic business lines of the Group, which also reflect groups of similar products and services. Zespri Group has four reportable segments:
(i) New Zealand kiwifruit: all activities related to the production and sale of New Zealand-grown kiwifruit varieties, other than activities included in the New cultivar segment. Activities include but are not limited to innovation, procurement, transport, marketing, selling and administration overheads.
(ii) Non-New Zealand supply: all activities related to the production and sale of non-New Zealand-grown kiwifruit varieties, other than activities included in the New cultivar segment. Activities include but are not limited to innovation, production, procurement, transport, marketing, selling and administration overheads.
(iii) New cultivars: all pre-commercialised activities related to any Zespri PVR kiwifruit. Activities include but are not limited to innovation, production, procurement, transport, marketing, selling and administration overheads. It also covers activities related to the selling and administration of PVR licences, and the associated ongoing royalty income.
(iv) All other segments: all other segments not covered above including ownership of land and buildings.
(y) Changes in accounting policies, disclosures and legislation
Certain new standards, amendments and interpretations issued by the International Accounting Standards Board (IASB) and the Accounting Standards Review Board in New Zealand (ASRB) have been published which will be mandatory for the Group in the accounting period beginning on or after 1 April 2017.
The following standards are not yet effective and have not been early adopted by the Group, but will be applicable to the Group:
• Amendments to NZ IAS 7 (Disclosure Initiative) – effective on or after 1 January 2017. The amendments include additional disclosures to evaluate changes in liabilities arising from financing activities, including both changes arising from cash flows and non-cash changes (such as effects of changes in foreign exchange rates and changes in fair values).
• Amendments to NZ IAS 12 (Recognition of Deferred Tax Assets for Unrealised Losses) – effective on or after 1 January 2017. The amendments clarify that the existence of a deductible temporary difference depends solely on a comparison of the carrying amount of an asset and its tax base at the end of the reporting period, and is not affected by possible future changes in the carrying amount or expected manner of recovery of the asset.
• NZ IFRS 9 (Financial Instruments) – effective on or after 1 January 2018. The new standard includes revised guidance on the classification and measurement of financial assets, including a new expected credit loss model for calculating impairment, and supplements the new general hedge accounting requirements previously published.
• NZ IFRS 15 (Revenue from Contracts with Customers) – effective on or after 1 January 2018. This standard impacts on how and when revenue is recognised. Additionally, there will be changes in disclosure requirements.
• Clarifications to NZ IFRS 15 (Revenue from Contracts with Customers) – effective on or after 1 January 2018. These amendments do not change the underlying principles of NZ IFRS 15 Revenue from Contracts with Customers but clarify how those principles should be applied. The clarifications address four areas: identifying performance obligations; principal vs agent considerations; licences of intellectual property; and transition.
• NZ IFRS 16 (Leases) – effective on or after 1 January 2019. This standard changes the accounting treatment of leases by lessees fundamentally as it eliminates the current dual accounting model for lessees, which distinguishes between on-balance sheet finance leases and off-balance sheet operating leases. Instead, there is a single, on-balance sheet accounting model that is similar to current finance lease accounting. Therefore, lessees will appear to become more asset-rich but also more heavily indebted, and lessor accounting remains similar to current practice with lessors continuing to classify leases as finance and operating leases. There are also changes in accounting over the life of the lease.
34Zespri Annual Report 2016/17 Zespri Group Limited and Subsidiaries Annual Report for the year ended 31 March 2017
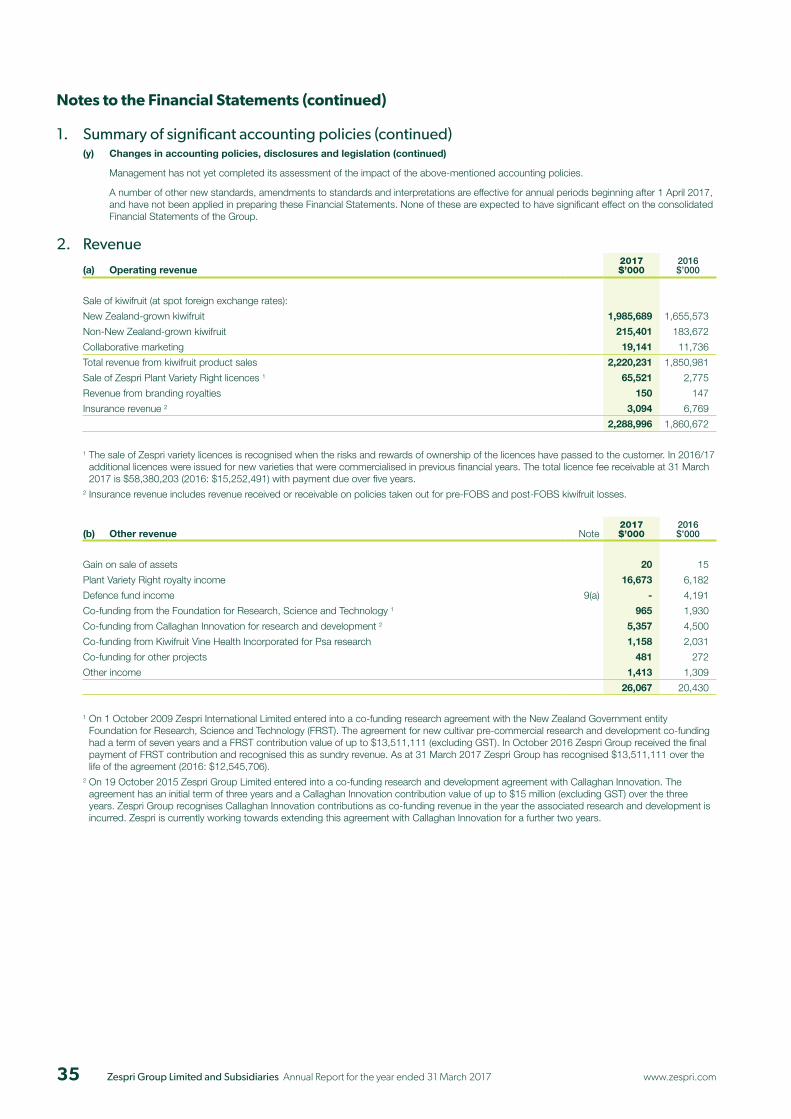
Notes to the Financial Statements (continued)
1. Summary of significant accounting policies (continued)(y) Changes in accounting policies, disclosures and legislation (continued)
Management has not yet completed its assessment of the impact of the above-mentioned accounting policies.
A number of other new standards, amendments to standards and interpretations are effective for annual periods beginning after 1 April 2017, and have not been applied in preparing these Financial Statements. None of these are expected to have significant effect on the consolidated Financial Statements of the Group.
2. Revenue
(a) Operating revenue2017$’000
2016$’000
Sale of kiwifruit (at spot foreign exchange rates):
New Zealand-grown kiwifruit 1,985,689 1,655,573
Non-New Zealand-grown kiwifruit 215,401 183,672
Collaborative marketing 19,141 11,736
Total revenue from kiwifruit product sales 2,220,231 1,850,981
Sale of Zespri Plant Variety Right licences 1 65,521 2,775
Revenue from branding royalties 150 147
Insurance revenue 2 3,094 6,769
2,288,996 1,860,672
1 The sale of Zespri variety licences is recognised when the risks and rewards of ownership of the licences have passed to the customer. In 2016/17 additional licences were issued for new varieties that were commercialised in previous financial years. The total licence fee receivable at 31 March 2017 is $58,380,203 (2016: $15,252,491) with payment due over five years.
2 Insurance revenue includes revenue received or receivable on policies taken out for pre-FOBS and post-FOBS kiwifruit losses.
(b) Other revenue Note2017$’000
2016$’000
Gain on sale of assets 20 15
Plant Variety Right royalty income 16,673 6,182
Defence fund income 9(a) - 4,191
Co-funding from the Foundation for Research, Science and Technology 1 965 1,930
Co-funding from Callaghan Innovation for research and development 2 5,357 4,500
Co-funding from Kiwifruit Vine Health Incorporated for Psa research 1,158 2,031
Co-funding for other projects 481 272
Other income 1,413 1,309
26,067 20,430
1 On 1 October 2009 Zespri International Limited entered into a co-funding research agreement with the New Zealand Government entity Foundation for Research, Science and Technology (FRST). The agreement for new cultivar pre-commercial research and development co-funding had a term of seven years and a FRST contribution value of up to $13,511,111 (excluding GST). In October 2016 Zespri Group received the final payment of FRST contribution and recognised this as sundry revenue. As at 31 March 2017 Zespri Group has recognised $13,511,111 over the life of the agreement (2016: $12,545,706).
2 On 19 October 2015 Zespri Group Limited entered into a co-funding research and development agreement with Callaghan Innovation. The agreement has an initial term of three years and a Callaghan Innovation contribution value of up to $15 million (excluding GST) over the three years. Zespri Group recognises Callaghan Innovation contributions as co-funding revenue in the year the associated research and development is incurred. Zespri is currently working towards extending this agreement with Callaghan Innovation for a further two years.
35 www.zespri.comZespri Group Limited and Subsidiaries Annual Report for the year ended 31 March 2017

Notes to the Financial Statements (continued)
3. Operating expenses
Notes2017$’000
2016$’000
Zespri Group’s operating expenses include the following (at spot foreign exchange rates):
Amortisation 17 9,288 7,322
Bad debts written off/provision for doubtful debts 12 3,259 20
Commissions 19,199 16,426
Depreciation 1 16 2,528 1,741
Directors’ fees 798 782
Employee remuneration and benefits 59,935 51,802
Employee remuneration and benefits – defined contribution plan 1,297 1,262
Freight and distribution 186,640 168,000
Fruit and service payments – New Zealand-grown kiwifruit 2 1,343,983 1,113,410
Fruit purchases – non-New Zealand-grown kiwifruit 160,133 141,627
Innovation 4 25,349 23,901
Insurance 7,988 6,737
KVH funding levy 2,689 2,226
Legal fees 5,899 3,849
Loss on sale of assets 146 140
Loyalty premium – New Zealand-grown kiwifruit 20 36,047 29,642
Other selling and direct costs 169,211 147,276
Other offshore costs 16,703 13,620
Penalties provision release 3 20 - (13,022)
Promotion 150,879 131,934
Serious Fraud Office (SFO) investigation costs 495 205
1 Depreciation of $56,975 (2016: $56,426) is included in the New Zealand-grown kiwifruit research figure. Total depreciation is $2,584,858.2 Contracted-supplier fruit returns by means of fruit and service payments reflect the value of sales from New Zealand-grown kiwifruit after
deducting those expenses defined under the annual New Zealand Supply Agreement, including derivative gains and losses.3 In 2015/16 the penalties provision release for China includes $975,179 of unrealised foreign exchange differences.4 Psa research conducted in conjunction with KVH of $1,158,270 (2016: $2,031,150) is included in the innovation figure.
36Zespri Annual Report 2016/17 Zespri Group Limited and Subsidiaries Annual Report for the year ended 31 March 2017

Notes to the Financial Statements (continued)
4. Fees to auditorsFees are paid to the auditors of the Company and its subsidiaries for the audit of the Financial Statements and for other services. The auditor of the Group is KPMG.
2017$’000
2016$’000
Audit services:
Audit of the Financial Statements of the Group – KPMG NZ 219 195
Audit of the Financial Statements of the Group’s subsidiaries – KPMG network firms 107 108
Total audit fees 326 303
Audit-related services:
Pool assurance services 1 - 30
Other assurance services 2 39 19
Total audit fees and audit-related services 365 352
Non-audit-related services:
Taxation consulting and compliance services 33 -
SFO compliance - 10
Training courses 10 -
Total non-audit-related services 43 10
Total fees paid to the Company’s auditors 408 362
1 Pool assurance services relate to the external review by KPMG of the allocation of material costs to the pool. 2 Other assurance services include a review engagement related to Callaghan Innovation Growth grant, agreed-upon procedures related to the
share trading platform and an assurance engagement in relation to overhead allocations between segments.
Other audit fees of $137,167 (2016: $100,346) have been paid to other auditors to meet local audit requirements.
5. Other net gains2017$’000
2016$’000
Net gains from derivatives 55,250 5,693
Net foreign exchange (losses)/gains from non-derivatives (24,274) 37,121
Total other net gains 30,976 42,814
6. Finance revenue and expense
(a) Finance revenue2017$’000
2016$’000
Interest revenue 5,275 5,560
Total finance revenue 5,275 5,560
2017 $’000
2016 $’000 (b) Finance expense
Interest expense 395 172
Fee expense 716 1,708
Total finance expense 1,111 1,880
37 www.zespri.comZespri Group Limited and Subsidiaries Annual Report for the year ended 31 March 2017

Notes to the Financial Statements (continued)
7. Taxation
(a) Taxation expense2017$’000
2016$’000
Net profit before taxation 107,075 46,516
Taxation at 28% 29,981 13,024
Tax effect of:
Non-deductible or non-assessable items 806 (2,687)
Translation differences on foreign tax 498 (1,069)
Tax under/(over) provided in prior year 83 (75)
Foreign income at different tax rates 1,868 837
Movement in distribution of accumulated retained earnings of subsidiaries 138 658
Taxation expense 33,374 10,688
Effective tax rate (%) 1 31.2% 23.0%
Taxation expense is represented by:
Current taxation expense:
Current income tax charge 40,693 10,357
Adjustments of prior years 83 (75)
Deferred taxation expense:
Origination and reversal of temporary differences (7,402) 406
Taxation expense 33,374 10,688
1 For the 2015/16 year the effective tax rate, excluding the provision release for Zespri Jia Pei Fruit (Shanghai) Co. Limited, was 31.9 percent.
The 28 percent tax rate used above is the corporate tax rate payable by New Zealand corporate entities on taxable profit under New Zealand tax law.
(b) Components of deferred taxation2017$’000
2016$’000
Property, plant and equipment, and intangibles (3,095) (2,785)
Inventories and receivables 2,016 (3,870)
Retained earnings in subsidiaries (1,019) (2,417)
Provisions and accruals 3,814 2,903
Other financial assets and liabilities (66) (138)
Employee entitlements 1,481 2,246
Net deferred assets/(liabilities) 3,131 (4,061)
Deferred tax assets 4,163 2,469
Deferred tax liabilities (1,032) (6,530)
Net deferred assets/(liabilities) 3,131 (4,061)
(c) Net change in deferred tax balances2017$’000
2016$’000
Net deferred liabilities at 1 April (4,061) (3,898)
Charged to Income Statement 7,402 (406)
Exchange differences and other (210) 243
Net deferred assets/(liabilities) at 31 March 3,131 (4,061)
All movements have been charged to the Income Statement. No movements have been recorded directly within equity.
38Zespri Annual Report 2016/17 Zespri Group Limited and Subsidiaries Annual Report for the year ended 31 March 2017

Notes to the Financial Statements (continued)
7. Taxation (continued)
(d) Tax credits available to shareholders2017$’000
2016$’000
New Zealand imputation credit account
Balance at 1 April credit 2,220 6,405
Income tax payments made to New Zealand tax authorities during the year 16,000 2,300
Imputation credits attached to dividends paid (3,746) (5,618)
Transfers/refunds (3,270) (867)
Balance at 31 March credit 11,204 2,220
Adjustments required under FRS-44: 1
Imputation credits available to refund excess tax - (2,115)
Total tax credits available for use at 31 March 11,204 105
1 Effective for reporting periods beginning on or after 1 July 2011, an entity is required to adjust imputation credits available for use for income tax refunds due.
On 25 May 2017 the Board of Directors announced an intention to declare a dividend of 17.0 cents per share which will not be recognised in the Financial Statements until July 2017, when it is declared. It is intended that the dividend will be fully imputed and imputation credits of $7,980,757 will be required to fully impute the dividend.
8. Earnings per share2017 2016
Net profit after taxation attributable to shareholders ($’000) 73,701 35,828
Weighted average shares (’000) 120,717 120,717
Basic and diluted earnings per share ($) 0.611 0.297
9. Reconciliation of movements in reserves
(a) Other reserves Notes
Defence fund reserve
2017$’000
2016$’000
Balance at 1 April - 2,744
Revenue transferred from retained earnings 9(b) - 4,191
Income tax effect on items transferred from retained earnings 9(b) - (1,174)
Transfers to retained earnings 9(b) - (5,761)
Balance at 31 March - -
In 2015/16, the Directors reviewed the defence fund reserve and resolved to transfer the balance from other reserves to retained earnings as at 31 March 2016. An amount of $5,760,738 was transferred from the defence fund reserve to retained earnings.
(b) Retained earnings Notes2017$’000
2016$’000
Balance at 1 April 112,858 88,787
Dividend paid during the year 11 (32,603) (14,501)
Net profit after taxation attributable to shareholders 73,701 35,828
Revenue attributed to defence fund transferred to other reserves 9(a) - (4,191)
Income tax effect on items transferred to other reserves 9(a) - 1,174
Transfers from other reserves 9(a) - 5,761
Balance at 31 March 153,956 112,858
39 www.zespri.comZespri Group Limited and Subsidiaries Annual Report for the year ended 31 March 2017

Notes to the Financial Statements (continued)
10. Share capital
(a) Number of shares issued2017
No. of shares2016
No. of shares
Number of authorised and fully paid issued ordinary shares at 31 March, at no par value 120,717,335 120,717,335
(b) Share capital value 2017$’000
2016$’000
Balance at 31 March 18,017 18,017
Ordinary shares: All ordinary shares rank equally subject to the voting cap. Each shareholder is entitled to one vote per ordinary share up to a maximum that is calculated by reference to that shareholder’s share of total New Zealand production supplied to Zespri Group.
(c) Capital management
The Company’s activities are restricted under the Kiwifruit Export Regulations 1999 in order to protect shareholders and contracted suppliers. The providers of capital must agree to the use of capital for any non-core activities and those who have not agreed cannot be exposed to more than minimal risk.
Because Zespri Group is a short-term borrower, capital management is restricted to the management of authorised and issued share capital, retained earnings and other reserves.
Under its Constitution, the Company may issue, buy back, consolidate or subdivide shares. Since incorporation in 2000, the Company has:
• issued shares under the Kiwifruit Industry Restructuring Act 1999 in line with the production of New Zealand kiwifruit vines existing at the time;
• issued shares in a pro-rata offer in 2001 to obtain equity required to support activities stemming from increases in new plantings in New Zealand;
• issued shares in 2005 in a targeted offer to growers to realign shareholdings with levels of production of growers, while offering a voluntary share buy-back to dry shareholders or growers holding more shares than their proportion of production;
• transferred retained earnings to other reserves (refer Notes 1(k) and 9(a)) to separate funds from those available for distribution to shareholders;
• performed a share split in September 2010 to achieve a better alignment between trays supplied and total shares; and
• transferred other reserves to retained earnings to cover Psa-related funding.
Share capital
The Regulations do not restrict the levels of share capital able to be authorised for issue by the Company. The Company’s Constitution provides some restriction over the scale of individual offers for shares. To date, in line with the Kiwifruit Export Regulations 1999, shares have been issued by the Company to producing New Zealand kiwifruit growers.
As noted in (b) above, voting rights of shareholders are capped by reference to the individual shareholder’s share of total New Zealand production supplied to the Company during the year. Divergence between shareholdings and production can occur through the production impact of new plantings and as growers enter or exit the industry in New Zealand. This divergence is monitored by the Company at least annually, through the process of determining the voting caps of shareholders prior to the Annual Meeting of the Company.
Future issues or buy-backs may occur to support increases in core or other approved activities, or to achieve a closer alignment between production levels and shareholdings of shareholders.
Payment of dividends
Capital levels are monitored as part of the solvency tests required under the Companies Act 1993 to approve the payment of dividends to shareholders. Capital retained in the Company is measured for solvency purposes, and to determine whether the minimum level of equity retained in Zespri Group, as agreed by the Board of Directors, is maintained.
40Zespri Annual Report 2016/17 Zespri Group Limited and Subsidiaries Annual Report for the year ended 31 March 2017

Notes to the Financial Statements (continued)
11. Dividends paid2017$’000
2016$’000
Ordinary dividends:
On ordinary shares – final (prior year) 22,936 8,450
On ordinary shares – interim (current year) 9,658 6,036
Supplementary dividends (to non-residents) 9 15
Total dividends paid 32,603 14,501
The 2017 interim dividend paid in December 2016 was fully imputed. No imputation credits were attached to the 2016 final dividend paid in August 2016. Supplementary dividends of $9,248 (2016: $15,308) were paid to shareholders not tax resident in New Zealand, for which Zespri Group received a foreign investor tax credit entitlement.
On 25 May 2017 the Board of Directors announced an intention to pay a fully imputed final dividend of 17.0 cents per share (2016: 19.0 cents per share), totalling $20,521,947 (2016: $22,936,294). This dividend will be paid in August 2017. Because the intention was announced after balance date, the financial effect has not been recognised in the Financial Statements. During the year, the 2016 final dividend declared on 26 July 2016 of 19.0 cents per share and the 2017 interim dividend declared on 22 November 2016 of 8.0 cents per share were paid and recognised in the Financial Statements.
12. Accounts receivable 2017$’000
2016$’000
Current:
Trade receivables 36,173 35,994
Other receivables 1 14,032 18,571
Less: Provision for doubtful debts (3,259) -
46,946 54,565
Indirect taxation 20,402 12,561
Total current receivables 67,348 67,126
Non-current:
Trade receivables 2 50,789 5,959
Total non-current receivables 50,789 5,959
Total gross receivables 121,396 73,085
Less: Total provision for doubtful debts (3,259) -
Total receivables 118,137 73,085
1 Other receivables include an amount of $4.0 million (2016: $3.6 million) of ‘hail’ receivable against the New Zealand pool to offset the insurance provision. The majority of hail events occurred in October 2016. Research and development co-funding of $2.3 million is receivable from Callaghan Innovation (2016: $4.5 million).
2 Non-current receivables include licence revenue receivables which have deferred payment terms for up to five years. In June 2016 400 hectares of SunGold licence was released with an option to apply for deferred payment terms.
The carrying value of the items above has been determined by the Board of Directors as representative of the fair value of the assets.
The fair value of licence revenue receivables has been determined on a discounted cash flow basis.
Amounts receivable from related parties are disclosed at Note 27.
A provision for doubtful debts is recognised where there is evidence that an individual trade receivable is impaired. As at 31 March 2017, $3,258,751 of trade receivables (2016: $Nil) were impaired and provided for.
Accounts receivable past due but not impaired2017$’000
2016$’000
Less than 3 months overdue 7,345 4,535
Between 3 and 6 months overdue 1,535 4,652
Between 6 and 12 months overdue 313 245
More than 12 months overdue - 13
Accounts receivable past due but not impaired at 31 March 9,193 9,445
The ‘less than 3 months overdue’ amounts include charges relating to suppliers.
In certain regions a portion of accounts receivable amounts is secured by bank guarantees or other collateral, with all others being unsecured.
41 www.zespri.comZespri Group Limited and Subsidiaries Annual Report for the year ended 31 March 2017

Notes to the Financial Statements (continued)
13. Prepayments2017$’000
2016$’000
Current:
Prepaid submit payments for next season’s fruit not recorded in inventory 6,877 8,563
Insurance 4,127 3,462
Other 9,450 4,183
Total current prepayments 20,454 16,208
Non-current:
Other 603 1,263
Total non-current prepayments 603 1,263
Total prepayments 21,057 17,471
14. Financial assets and liabilities
(a) Financial assets per Balance Sheet Notes
Loans and receivables
Assets designated at fair value through
the Income Statement Total2017$’000
2016$’000
2017 $’000
2016$’000
2017$’000
2016$’000
Derivatives – held for trading - - 96,326 84,166 96,326 84,166
Accounts receivable 12 118,137 73,085 - - 118,137 73,085
Cash and cash equivalents 23(b) 187,010 165,027 - - 187,010 165,027
Total other financial assets 305,147 238,112 96,326 84,166 401,473 322,278
Represented by:
Current 254,358 232,153 52,021 44,979 306,379 277,132
Non-current 50,789 5,959 44,305 39,187 95,094 45,146
Total other financial assets 305,147 238,112 96,326 84,166 401,473 322,278
(b) Financial liabilities per Balance Sheet Note
Liabilities atamortised cost
Liabilities designatedat fair value through
the Income Statement Total2017$’000
2016$’000
2017 $’000
2016$’000
2017$’000
2016$’000
Derivatives – held for trading - - 6,498 25,160 6,498 25,160
Contracted future suppliers - - 89,774 59,006 89,774 59,006
Accounts payable and accruals 19 217,238 178,638 - - 217,238 178,638
Total other financial liabilities 217,238 178,638 96,272 84,166 313,510 262,804
Represented by:
Current 215,755 177,301 51,967 44,979 267,722 222,280
Non-current 1,483 1,337 44,305 39,187 45,788 40,524
Total other financial liabilities 217,238 178,638 96,272 84,166 313,510 262,804
42Zespri Annual Report 2016/17 Zespri Group Limited and Subsidiaries Annual Report for the year ended 31 March 2017

Notes to the Financial Statements (continued)
14. Financial assets and liabilities (continued)
Fair value of financial assets and liabilities
The fair value of financial instruments is determined by using valuation techniques. These valuation techniques maximise the use of observable market data where it is available and rely as little as possible on entity-specific estimates. Where necessary, estimated future cash flows are calculated using forward prices and interest rate yield curves. Forward prices and interest rate yields are sourced from relevant published market-observable exchange rates and interest rates applicable to the remaining life of the instrument, at the valuation date. The calculation of the fair value of financial instruments reflects the impact of credit risk where applicable.
The derivative financial instruments below have been valued using a discounted cash flow valuation methodology.
The table below presents assets and liabilities that are measured at fair value by the following fair value measurement hierarchy:
Level 1 - Quoted prices (unadjusted) in active markets for identical assets or liabilities;
Level 2 - Inputs other than quoted prices included within Level 1 that are observable for the asset or liability, either directly (i.e. as prices) or indirectly (i.e. derived from prices); and
Level 3 - Inputs for the asset or liability that are not based on market-observable data (i.e. unobservable inputs).
Fair value of financial assets and liabilities valuation hierarchy
Level 2 Total2017 $’000
2016$’000
2017$’000
2016$’000
Assets
Derivatives – held for trading 96,326 84,166 96,326 84,166
96,326 84,166 96,326 84,166
Liabilities
Derivatives – held for trading 6,498 25,160 6,498 25,160
Contracted future suppliers 89,774 59,006 89,774 59,006
96,272 84,166 96,272 84,166
15. Inventories2017$’000
2016$’000
New Zealand-grown kiwifruit inventory (next season) 40,880 25,009
Non-New Zealand-grown kiwifruit inventory 4,581 3,537
Packaging materials 10,206 8,870
Other 165 57
Total inventories 55,832 37,473
Security pledged
Refer to Note 25 for details of security pledged by Zespri Group.
43 www.zespri.comZespri Group Limited and Subsidiaries Annual Report for the year ended 31 March 2017

Notes to the Financial Statements (continued)
16. Property, plant and equipment
Land and improvements
Leasehold improvements Buildings
Plant and equipment
Motor vehicles
Work in progress Total
$’000 $’000 $’000 $’000 $’000 $’000 $’000
2017
Cost as at 1 April 9,580 1,777 3,960 9,757 696 564 26,334
Accumulated depreciation (2) (831) (1,587) (7,164) (325) - (9,909)
Net book value 1 April 9,578 946 2,373 2,593 371 564 16,425
Depreciation expense (21) (548) (684) (1,210) (122) - (2,585)
Additions 30 744 - 1,112 300 2,332 4,518
Disposals (net) - (53) (9) (31) (2) - (95)
Transfers (net) - 290 - 92 - (382) -
Net book value 31 March 9,587 1,379 1,680 2,556 547 2,514 18,263
Cost as at 31 March 9,610 2,628 3,834 8,974 938 2,514 28,498
Accumulated depreciation (23) (1,249) (2,154) (6,418) (391) - (10,235)
Net book value 31 March 9,587 1,379 1,680 2,556 547 2,514 18,263
2016
Cost as at 1 April - 2,626 - 8,234 699 1,620 13,179
Accumulated depreciation - (1,796) - (6,600) (453) - (8,849)
Net book value 1 April - 830 - 1,634 246 1,620 4,330
Depreciation expense (2) (331) (293) (1,016) (157) - (1,799)
Additions 9,580 479 2,634 358 415 564 14,030
Disposals (net) - - - (3) (133) - (136)
Transfers (net) - (32) 32 1,620 - (1,620) -
Net book value 31 March 9,578 946 2,373 2,593 371 564 16,425
Cost as at 31 March 9,580 1,777 3,960 9,757 696 564 26,334
Accumulated depreciation (2) (831) (1,587) (7,164) (325) - (9,909)
Net book value 31 March 9,578 946 2,373 2,593 371 564 16,425
Security pledged
Refer to Note 25 for details of security pledged by Zespri Group.
44Zespri Annual Report 2016/17 Zespri Group Limited and Subsidiaries Annual Report for the year ended 31 March 2017

Notes to the Financial Statements (continued)
17. Intangibles Development
costs Computer software
Work in progress Total
$’000 $’000 $’000 $’000
2017
Cost as at 1 April 16,164 41,308 1,983 59,455
Accumulated amortisation (11,203) (17,681) - (28,884)
Net book value 1 April 4,961 23,627 1,983 30,571
Amortisation expense (1,923) (7,365) - (9,288)
Impairment expense - - - -
Additions 1,155 6,102 2,936 10,193
Disposals (net) - (201) - (201)
Transfers 50 1,933 (1,983) -
Net book value 31 March 4,243 24,096 2,936 31,275
Cost as at 31 March 17,370 48,954 2,936 69,260
Accumulated amortisation (13,127) (24,858) - (37,985)
Net book value 31 March 4,243 24,096 2,936 31,275
2016
Cost as at 1 April 15,023 34,567 3,457 53,047
Accumulated amortisation (9,397) (13,381) - (22,778)
Net book value 1 April 5,626 21,186 3,457 30,269
Amortisation expense (1,786) (5,536) - (7,322)
Impairment expense (20) - - (20)
Additions 1,052 4,655 1,942 7,649
Disposals (net) - (5) - (5)
Transfers 89 3,327 (3,416) -
Net book value 31 March 4,961 23,627 1,983 30,571
Cost as at 31 March 16,164 41,308 1,983 59,455
Accumulated amortisation (11,203) (17,681) - (28,884)
Net book value 31 March 4,961 23,627 1,983 30,571
Development costs
The development costs of commercialised varieties has been capitalised since commercialisation and is amortised at a rate of 20 percent per annum. The development costs include, but are not limited to, legal fees, PVR application fees, budwood collection and GPS mapping. The Company was granted PVRs for the Gold3 and Green14 varieties, effective 9 September 2016, which were commercialised for production in mid-2010. The PVR establishes exclusive intellectual property rights in the jurisdictions where they apply. On all post-commercialisation sales of the new cultivars a royalty is payable to The New Zealand Institute for Plant & Food Research Limited (Plant & Food Research).
The Company purchased Hort16A PVRs from Plant & Food Research, effective 1 April 2004. The purchase of the PVRs gives the Company the exclusive intellectual property rights on all Hort16A kiwifruit in the jurisdictions in which the PVRs apply. As part of the purchase, the Company will continue to pay a royalty to Plant & Food Research, and as collateral for these future royalty payments, Plant & Food Research holds a security interest in the Hort16A PVRs and all Hort16A intellectual property. In addition, the assignment of the Hort16A PVRs and its associated rights and obligations outside Zespri Group requires the consent of Plant & Food Research.
In New Zealand, the Company holds the exclusive right to propagate and distribute plant material, and market and sell the following comercialised varieties of kiwifruit, known in New Zealand as:
• Hort16A (Gold), until 14 November 2018
• Gold3 (SunGold), until 6 September 2039
• Green14 (Sweet Green), until 6 September 2039
Intangibles work in progress
As at 31 March 2017, 99 percent (2016: 97 percent) of the Group’s intangibles work in progress relates to ongoing computer software projects.
Security pledged
In addition to Plant & Food Research security interest mentioned above, refer to Note 25 for other details on security pledged by Zespri Group.
45 www.zespri.comZespri Group Limited and Subsidiaries Annual Report for the year ended 31 March 2017

Notes to the Financial Statements (continued)
18. Investment in subsidiary companies Zespri Group Limited is the ultimate holding company for the Zespri Group of companies. All subsidiaries have a 31 March balance date with the exception of Zespri Jia Pei Fruit (Shanghai) Co. Limited, Zespri Fruit (Shanghai) Co. Limited and Zespri Fruit Consultoria (Brasil) Ltda which all have a 31 December balance date due to local requirements. The results of the operations of the following wholly owned subsidiaries for the year ending 31 March 2017 have been included in the consolidated Financial Statements.
Subsidiary Incorporated Nature of activities
Zespri International Limited New Zealand Management of the export, sale and marketing of New Zealand-grown kiwifruit and management of the sale and marketing of non-New Zealand-grown kiwifruit
Aragorn Limited New Zealand Non-trading company
Zespri Innovation Company Limited New Zealand Research
Zespri International (Asia) Limited New Zealand Marketing and promotion services, includes Taiwan Branch
Zespri International (Japan) Limited New Zealand Non-trading company
Zespri International Trading Limited New Zealand Investment company, includes South African Branch
Zespri New Zealand Limited New Zealand Investment company
Zespri International (Australia) Pty Limited Australia Management of the growing, sourcing and sale of Zespri Gold (Hort16A) Kiwifruit grown in Australia and in-market support and marketing services
Zespri International (Europe) N.V. Belgium Management of sales and marketing in Europe of all New Zealand-grown kiwifruit and non-New Zealand-grown Zespri Gold (Hort16A and Gold3) Kiwifruit. Management of trading in non-New Zealand-grown Zespri Green Kiwifruit produced in Europe
Zespri Service Centre N.V. Belgium Service provision to Zespri Group companies
Zespri Fruit Consultoria (Brasil) Ltda Brazil In-market support and marketing services
Zespri Jia Pei Fruit (Shanghai) Co. Limited China In-market support and marketing services
Zespri Fruit (Shanghai) Co. Limited China Management of the sale of New Zealand-grown kiwifruit and non-New Zealand-grown kiwifruit
Zespri Fresh Produce France S.A.R.L. France Management of the growing and sourcing of Zespri Gold3 Kiwifruit and management of the growing, sourcing and sale of Zespri Hort16A Kiwifruit grown in France
Zespri International France E.U.R.L. France In-market support of Belgian companies
Zespri International Germany GmbH Germany In-market support of Belgian companies
Zespri International (India) Pvt Limited India In-market support and marketing services
Zespri Fresh Produce Italy S.r.l. Italy Management of the growing and sourcing of Zespri Gold3 Kiwifruit and management of the growing, sourcing and sale of Zespri Hort16A Kiwifruit grown in Italy
Zespri International Italy S.r.l. Italy In-market support of Belgian companies
Zespri International (Japan) K.K. Japan Management of the growing, sourcing and sale of Zespri Gold (Hort16A and Gold3) Kiwifruit grown in Japan, and management of the sale of New Zealand-grown kiwifruit
Zespri International (Korea) Co. Limited South Korea Management of the growing, sourcing and sale of Zespri Gold (Hort16A and Gold3) Kiwifruit grown in South Korea, and management of the sale of New Zealand-grown kiwifruit
Zespri International (Singapore) Pte Limited Singapore Regional marketing and support services
Zespri International Iberica SL Spain In-market support of Belgian companies
Zespri International Nordic AB Sweden In-market support of Belgian companies
Zespri Fruit (Middle East) DMCC United Arab Emirates In-market support and marketing services
Zespri International (United Kingdom) Limited United Kingdom In-market support of Belgian companies
Zespri Fresh Produce North America Inc. United States of America Non-trading company
New Zealand Kiwi Holdings Inc. United States of America In-market support and marketing services
New Zealand Kiwi Corporation Inc. United States of America Non-trading company
46Zespri Annual Report 2016/17 Zespri Group Limited and Subsidiaries Annual Report for the year ended 31 March 2017

Notes to the Financial Statements (continued)
19. Accounts payable and accruals2017$’000
2016$’000
Current:
Trade creditors 53,896 32,834
Accrued expenses 48,151 53,482
New Zealand fruit and service payments accrued – current season 1 39,332 44,693
New Zealand fruit and service payments accrued – next season 39,234 34,264
Income in advance 20,204 119
Payroll tax deductions payable 1,652 1,705
Employee entitlements 13,286 10,204
Total current accounts payable and accruals 215,755 177,301
Non-current:
Employee entitlements 1,483 1,337
Total non-current accounts payable and accruals 1,483 1,337
Total accounts payable and accruals 217,238 178,638
1 Relates to contracted suppliers of New Zealand-grown kiwifruit. As at 31 March 2017, 97 percent (2016: 96 percent) of fruit and service payments had been made.
The carrying value of the items above has been determined by the Board of Directors as representative of the fair value of the liabilities. Amounts payable to, or accrued to, related parties are disclosed in Note 27.
20. Provisions and insurance liabilities
Loyalty premium Other provisions Insurance liabilities Total
2017$’000
2016$’000
2017$’000
2016$’000
2017 $’000
2016$’000
2017$’000
2016$’000
Value at 1 April 17,861 13,972 8,160 17,872 3,948 4,007 29,969 35,851
Amounts charged (32,201) (25,753) (6,844) (4,087) (2,995) (3,022) (42,040) (32,862)
Reversal of provision - - (148) (14,019) (953) (985) (1,101) (15,004)
Additional provision 36,047 29,642 4,692 7,419 3,959 3,948 44,698 41,009
Exchange differences - - (7) 975 - - (7) 975
Value at 31 March 21,707 17,861 5,853 8,160 3,959 3,948 31,519 29,969
Represented by:
Current 21,707 17,861 5,260 7,508 3,959 3,948 30,926 29,317
Non-current - - 593 652 - - 593 652
21,707 17,861 5,853 8,160 3,959 3,948 31,519 29,969
47 www.zespri.comZespri Group Limited and Subsidiaries Annual Report for the year ended 31 March 2017

Notes to the Financial Statements (continued)
20. Provisions and insurance liabilities (continued)Loyalty premium
A loyalty premium is paid to New Zealand growers who have signed a three-year rolling grower contract and met the conditions of that contract. The loyalty premium is 25 cents (2016: 25 cents) per-tray equivalent of New Zealand Class 1 kiwifruit supplied to the Company. The premium is paid in two instalments. The first instalment of 10 cents per Class 1 tray equivalent was paid on 20 January 2017 (2016: 20 January 2016). The remaining 15 cents of loyalty premium per Class 1 tray equivalent will be paid on 15 June 2017 (2016: 15 June 2016).
Other provisions
Serious Fraud Office
The Serious Fraud Office (SFO) has issued notices to the Company seeking company documents and information pursuant to Section 9 of the Serious Fraud Act 1990. Over the 2016/17 financial year, the SFO conducted interviews with some Directors and employees and the Company completed production of documents pursuant to the Section 9 notices. This information is being compiled and provided to the SFO as required. As at 31 March 2017 an amount of $0.75 million (2016: $0.5 million), representing the estimate of legal and other costs to meet the requirements anticipated by management, is recorded in other provisions.
Plant Variety Rights
During the 2016/17 year, the Company became aware of unauthorised transfers of Gold3 and Gold9 plant material, and has been working with the New Zealand Police and others to investigate the extent and nature of the issue. The matter is now the subject of a New Zealand Police investigation but may also lead to civil proceedings by the Company, and a provision of $0.9 million has been included in relation to legal fees and other costs associated with this issue.
WorkSafe
The Company has been co-operating with WorkSafe New Zealand in relation to a quad bike accident in the 2016 season which resulted in the death of a worker employed by a Zespri contractor. Subsequent to 31 March 2017, Zespri International Limited was charged in relation to this incident. A provision has been included in the accounts for legal and other costs which could accrue as a result of this issue.
Other provisions
Other provisions include: costs in relation to supplier provisions relating to the 2016 season; final costs of compensation for the withdrawal of the Gold9 variety from commercial production; future obligations specified in the sale and purchase agreement for the purchase of land at 400-410 Maunganui Road; and legal costs relating to ongoing proceedings in the Employment and High Courts of New Zealand.
In the normal course of business, the Zespri Group is party to various lawsuits and claims (refer Note 24).
Insurance liabilities
During the year, a number of orchards were affected by hail events around New Zealand. An amount of $4.0 million (2016: $3.9 million) has been recognised as an insurance liability in the Zespri Group accounts as at 31 March 2017.
21. Operating leases and other commitments
Operating lease commitments2017$’000
2016$’000
Non-cancellable operating lease payments:
Payable within one year 3,514 4,056
Payable between one and five years 3,220 4,172
Payable after five years - 126
6,734 8,354
Total future non-cancellable operating lease receipts (34) (19)
(34) (19)
Lease expense recognised in the Income Statement under operating expenses:
Minimum lease payments 4,112 2,520
Sublease and lease receipts (23) (29)
4,089 2,491
Zespri Group leases premises, motor vehicles and office equipment under operating leases, and sublets excess office capacity. Operating leases for premises give Zespri Group companies, in most cases, the right to renew the lease subject to a redetermination of the lease rental by the lessor. There are no options to purchase any of the leased assets at the expiry of the lease period.
48Zespri Annual Report 2016/17 Zespri Group Limited and Subsidiaries Annual Report for the year ended 31 March 2017

Notes to the Financial Statements (continued)
22. Reconciliation of net profit after taxation with net cash from operating activities
Notes2017$’000
2016$’000
Net profit after taxation 73,701 35,828
Non-cash items:
Net loss on sale of property, plant and equipment, and intangibles 126 125
Impairment of intangible assets 17 - 20
Net loss/(gain) on foreign currency cash balances 13,406 (13,963)
Additional provisions net of reversals and foreign exchange differences 43,590 26,978
Depreciation of plant, property and equipment 16 2,585 1,798
Amortisation of intangibles 17 9,288 7,322
Movement in deferred taxation (7,192) 163
61,803 22,443
Movement in working capital:
Increase in receivables and prepayments (48,638) (15,885)
Increase/(decrease) in net current income tax 17,520 (1,748)
(Increase)/decrease in other financial assets (12,160) 84,907
Increase in inventories (18,359) (17,755)
Increase in payables to contracted suppliers 1 4,632 30,153
Decrease in accounts payable, accruals, provisions and employee entitlements (8,036) (12,022)
Increase/(decrease) in other financial liabilities 12,106 (84,749)
(52,935) (17,099)
Items classified as financing activities (3,555) (5,551)
Net cash available from operating activities 79,014 35,621
1 Group totals include amounts payable to contracted suppliers of non-New Zealand-grown kiwifruit.
23. Financial instrumentsZespri Group is subject to a number of financial risks that arise as a result of its operational activities. To manage and limit the effect of these financial risks, the Board of Directors has approved policy guidelines and authorised the use of various financial instruments. The policies and financial instruments permitted are documented in the Treasury Management Policy which is reviewed and approved annually. The policies and financial instruments being utilised at balance date are discussed under the sections Liquidity risk, Credit risk and Market risk below.
(a) Liquidity risk
The liquidity risk to which Zespri Group is exposed is managed under the Treasury Management Policy. The objective is to ensure that cash is available to pay obligations as they fall due. There are three forms of liquidity management recognised: day-to-day cash management to ensure funds are available for short-term requirements; long-term going-concern liquidity management to ensure facilities are in place to meet future requirements; and short-term liquidity crisis management to cover unforeseen crisis events.
49 www.zespri.comZespri Group Limited and Subsidiaries Annual Report for the year ended 31 March 2017

Notes to the Financial Statements (continued)
23. Financial instruments (continued) (a) Liquidity risk (continued)
Contractual maturities as at 31 March Notes < 1 year $’000
1-2 years$’000
2-5 years$’000
Total$’000
2017
Non-derivatives:
Trade creditors 19 53,896 - - 53,896
Accruals and other payables 19 161,859 - 1,483 163,342
215,755 - 1,483 217,238
Derivatives:
Derivatives – held for trading 14(b) 5,729 769 - 6,498
Contracted future suppliers 14(b) 46,238 34,577 8,959 89,774
51,967 35,346 8,959 96,272
Total contractual maturities 267,722 35,346 10,442 313,510
2016
Non-derivatives:
Trade creditors 19 32,834 - - 32,834
Accruals and other payables 19 144,467 - 1,337 145,804
177,301 - 1,337 178,638
Derivatives:
Derivatives – held for trading 14(b) 19,157 4,346 1,657 25,160
Contracted future suppliers 14(b) 25,822 17,242 15,942 59,006
44,979 21,588 17,599 84,166
Total contractual maturities 222,280 21,588 18,936 262,804
(b) Credit risk
Zespri Group is exposed to credit risk from transactions with trade debtors and financial institutions in the normal course of business.
Zespri Group has a credit approval policy which restricts the exposure to individual debtors and the Board of Directors reviews exposures to trade debtors on a regular basis. In certain regions a portion of amounts owed by trade debtors is secured by way of bank guarantees or other collateral, with all others being unsecured. Zespri Group does not require any collateral or security from financial institutions to support its transactions with those institutions. The counter-parties used for banking and finance activities are financial institutions with credit ratings ranging from A to AA-.
(i) Credit risk counter-parties:
Financial instruments to which Zespri Group is exposed for credit risk consist principally of bank balances, short-term deposits, accounts receivable and foreign exchange contracts with banks. Zespri Group does not consider balances owed by government tax authorities to be credit risks.
Zespri Group continuously monitors the credit quality of the counter-parties to its financial instruments. Zespri Group does not anticipate non-performance by any of its counter-parties, except where already provided for in provision for doubtful debts.
50Zespri Annual Report 2016/17 Zespri Group Limited and Subsidiaries Annual Report for the year ended 31 March 2017

Notes to the Financial Statements (continued)
23. Financial instruments (continued) (b) Credit risk (continued)
(ii) Maximum exposures to credit risk at 31 March:
Maximum exposures to credit risk Notes2017$’000
2016$’000
Bank balances 67,025 64,956
Short-term deposits 119,985 100,071
Cash and cash equivalents 187,010 165,027
Accounts receivable 12 97,735 60,524
Derivatives – held for trading 14(a) 96,326 84,166
Total maximum exposures to credit risk 381,071 309,717
The amounts above have been determined by the Board of Directors to be the fair value of these classes of financial instruments. Exposure risk on guarantees pledged is further disclosed in Note 24.
Refer to Note 12 for further information on credit risk of accounts receivable.
(iii) Concentration of credit risk:
Concentration of credit risk by geographical location is indicated below:
Location of counter-party
Europe Japan ChinaSouth Korea Other Asia
New Zealand Other Total
$’000 $’000 $’000 $’000 $’000 $’000 $’000 $’000
2017
Bank balances 4,812 342 34,410 23,326 774 1,198 2,163 67,025
Short-term deposits - - - - - 119,985 - 119,985
Cash and cash equivalents 4,812 342 34,140 23,326 774 121,183 2,163 187,010
Accounts receivable 19,797 16 52 1,035 3,837 71,251 1,747 97,735
Derivatives – held for trading 25,258 - - - - 68,350 2,718 96,326
Total location of counter-party 49,867 358 34,462 24,361 4,611 260,784 6,628 381,071
2016
Bank balances 3,219 3,937 576 19,642 33,431 940 3,211 64,956
Short-term deposits - - - - - 100,071 - 100,071
Cash and cash equivalents 3,219 3,937 576 19,642 33,431 101,011 3,211 165,027
Accounts receivable 19,230 544 898 112 529 37,482 1,729 60,524
Derivatives – held for trading 15,729 - - - - 67,458 979 84,166
Total location of counter-party 38,178 4,481 1,474 19,754 33,960 205,951 5,919 309,717
51 www.zespri.comZespri Group Limited and Subsidiaries Annual Report for the year ended 31 March 2017

Notes to the Financial Statements (continued)
23. Financial instruments (continued) (c) Market risk
Zespri Group is subject to market risks that arise as a result of its operational activities. The types of market risk to which Zespri Group is exposed include interest rate risk, currency risk and commodity price risk.
(i) Interest rate risk:
Zespri Group’s policy relating to interest rate risk management aims to achieve the lowest cost of funds while meeting seasonal funding needs.
Zespri Group may put in place seasonal funding facilities if required (refer Note 25). Zespri Group is primarily a short-term borrower and investor and generally carries any interest rate risk itself. Investments consist of on-call funds and short-term deposits. Interest rate derivative instruments may be used at Zespri Group’s discretion within the confines of the Treasury Management Policy. No interest rate derivative contracts were entered into during the year (2016: Nil).
(ii) Currency risk:
During the course of business, Zespri Group procures and exports fruit, incurs selling, marketing and administrative costs, and carries cash denominated in foreign currencies. As a result of these transactions, exposures to fluctuations in foreign currency exchange rates occur. The foreign currencies in which Zespri Group primarily deals are Euro (EUR), Japanese Yen (JPY), United States Dollars (USD), Chinese Renminbi (CNY) and Korean Won (KRW).
Zespri Group’s primary objective in managing foreign exchange risk is to mitigate excess volatility in the New Zealand Dollar return to shareholders and the New Zealand kiwifruit industry arising from foreign currency movements.
Net exposures of expected foreign currency income and expenditure are estimated. The Treasury Management Policy provides guidelines within which Zespri Group enters into contracts to manage the expected net exposures. Based on these guidelines, contracts are taken out up to 36 months in advance. With express Board approval, the Company can take out contracts that are in excess of 36 months in advance. The Treasury Management Policy is reviewed by the Board of Directors and is approved annually.
Foreign exchange contracts
As part of the foreign currency hedging strategy, Zespri Group has entered into forward foreign exchange contracts and options. The value of these contracts held at balance date were:
Notional value Fair value gain/(loss)
At fair value through the Income Statement – held for trading2017 $’000
2016$’000
2017$’000
2016$’000
Sell forward exchange contracts 1,171,707 1,645,442 84,018 58,405
Currency option contracts 435,455 196,804 5,810 6,909
1,607,162 1,842,246 89,828 65,314
Represented by:
Other financial assets 96,326 84,166
Other financial liabilities (6,498) (18,852)
89,828 65,314
By currency:
EUR/NZD 437,441 536,251 33,131 21,368
JPY/NZD 487,449 469,996 20,089 23,881
USD/NZD 682,272 835,999 36,608 20,065
1,607,162 1,842,246 89,828 65,314
Notional value Fair value gain
Maturity of foreign exchange contracts2017 $’000
2016 $’000
2017 $’000
2016 $’000
Less than one year 1,037,966 945,684 46,292 32,129
Within one to two years 444,369 542,902 34,576 17,243
More than two years 124,827 353,660 8,960 15,942
1,607,162 1,842,246 89,828 65,314
52Zespri Annual Report 2016/17 Zespri Group Limited and Subsidiaries Annual Report for the year ended 31 March 2017
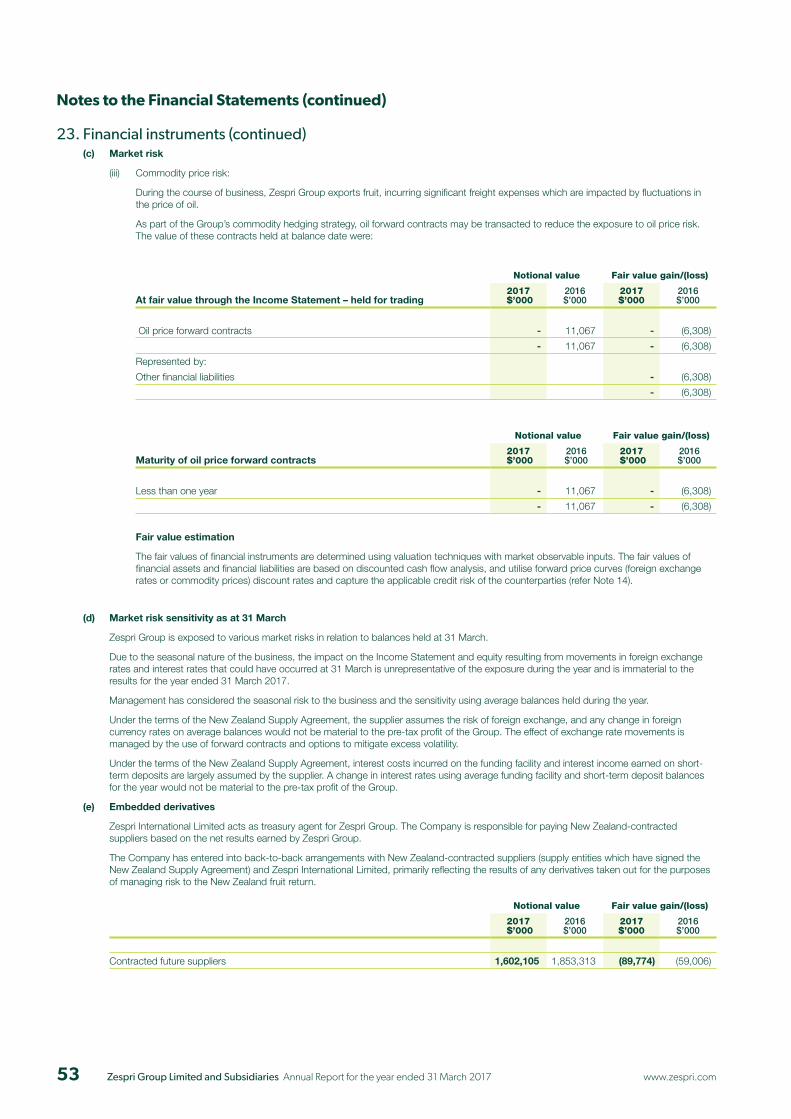
Notes to the Financial Statements (continued)
23. Financial instruments (continued) (c) Market risk
(iii) Commodity price risk:
During the course of business, Zespri Group exports fruit, incurring significant freight expenses which are impacted by fluctuations in the price of oil.
As part of the Group’s commodity hedging strategy, oil forward contracts may be transacted to reduce the exposure to oil price risk. The value of these contracts held at balance date were:
Notional value Fair value gain/(loss)
At fair value through the Income Statement – held for trading2017 $’000
2016$’000
2017$’000
2016$’000
Oil price forward contracts - 11,067 - (6,308)
- 11,067 - (6,308)
Represented by:
Other financial liabilities - (6,308)
- (6,308)
Notional value Fair value gain/(loss)
Maturity of oil price forward contracts2017 $’000
2016 $’000
2017 $’000
2016 $’000
Less than one year - 11,067 - (6,308)
- 11,067 - (6,308)
Fair value estimation
The fair values of financial instruments are determined using valuation techniques with market observable inputs. The fair values of financial assets and financial liabilities are based on discounted cash flow analysis, and utilise forward price curves (foreign exchange rates or commodity prices) discount rates and capture the applicable credit risk of the counterparties (refer Note 14).
(d) Market risk sensitivity as at 31 March
Zespri Group is exposed to various market risks in relation to balances held at 31 March.
Due to the seasonal nature of the business, the impact on the Income Statement and equity resulting from movements in foreign exchange rates and interest rates that could have occurred at 31 March is unrepresentative of the exposure during the year and is immaterial to the results for the year ended 31 March 2017.
Management has considered the seasonal risk to the business and the sensitivity using average balances held during the year.
Under the terms of the New Zealand Supply Agreement, the supplier assumes the risk of foreign exchange, and any change in foreign currency rates on average balances would not be material to the pre-tax profit of the Group. The effect of exchange rate movements is managed by the use of forward contracts and options to mitigate excess volatility.
Under the terms of the New Zealand Supply Agreement, interest costs incurred on the funding facility and interest income earned on short-term deposits are largely assumed by the supplier. A change in interest rates using average funding facility and short-term deposit balances for the year would not be material to the pre-tax profit of the Group.
(e) Embedded derivatives
Zespri International Limited acts as treasury agent for Zespri Group. The Company is responsible for paying New Zealand-contracted suppliers based on the net results earned by Zespri Group.
The Company has entered into back-to-back arrangements with New Zealand-contracted suppliers (supply entities which have signed the New Zealand Supply Agreement) and Zespri International Limited, primarily reflecting the results of any derivatives taken out for the purposes of managing risk to the New Zealand fruit return.
Notional value Fair value gain/(loss)
2017 $’000
2016$’000
2017$’000
2016$’000
Contracted future suppliers 1,602,105 1,853,313 (89,774) (59,006)
53 www.zespri.comZespri Group Limited and Subsidiaries Annual Report for the year ended 31 March 2017
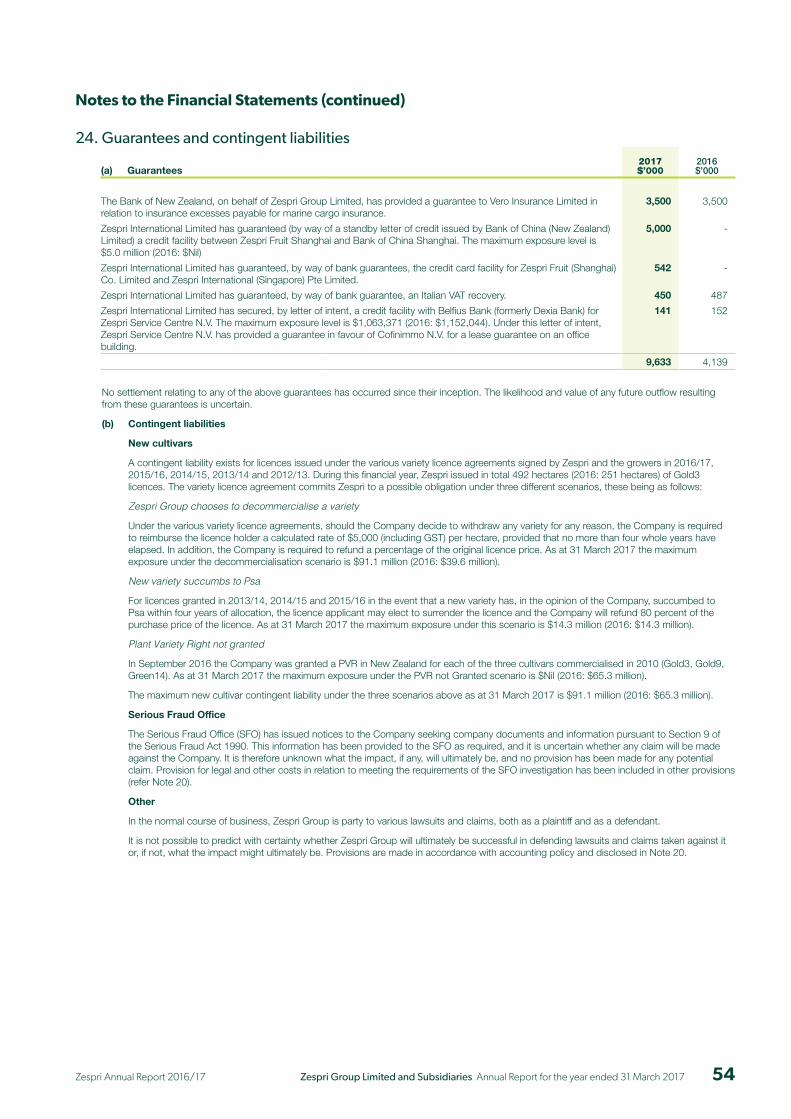
Notes to the Financial Statements (continued)
24. Guarantees and contingent liabilities
(a) Guarantees2017$’000
2016$’000
The Bank of New Zealand, on behalf of Zespri Group Limited, has provided a guarantee to Vero Insurance Limited in relation to insurance excesses payable for marine cargo insurance.
3,500 3,500
Zespri International Limited has guaranteed (by way of a standby letter of credit issued by Bank of China (New Zealand) Limited) a credit facility between Zespri Fruit Shanghai and Bank of China Shanghai. The maximum exposure level is $5.0 million (2016: $Nil)
5,000 -
Zespri International Limited has guaranteed, by way of bank guarantees, the credit card facility for Zespri Fruit (Shanghai) Co. Limited and Zespri International (Singapore) Pte Limited.
542 -
Zespri International Limited has guaranteed, by way of bank guarantee, an Italian VAT recovery. 450 487
Zespri International Limited has secured, by letter of intent, a credit facility with Belfius Bank (formerly Dexia Bank) for Zespri Service Centre N.V. The maximum exposure level is $1,063,371 (2016: $1,152,044). Under this letter of intent, Zespri Service Centre N.V. has provided a guarantee in favour of Cofinimmo N.V. for a lease guarantee on an office building.
141 152
9,633 4,139
No settlement relating to any of the above guarantees has occurred since their inception. The likelihood and value of any future outflow resulting from these guarantees is uncertain.
(b) Contingent liabilities
New cultivars
A contingent liability exists for licences issued under the various variety licence agreements signed by Zespri and the growers in 2016/17, 2015/16, 2014/15, 2013/14 and 2012/13. During this financial year, Zespri issued in total 492 hectares (2016: 251 hectares) of Gold3 licences. The variety licence agreement commits Zespri to a possible obligation under three different scenarios, these being as follows:
Zespri Group chooses to decommercialise a variety
Under the various variety licence agreements, should the Company decide to withdraw any variety for any reason, the Company is required to reimburse the licence holder a calculated rate of $5,000 (including GST) per hectare, provided that no more than four whole years have elapsed. In addition, the Company is required to refund a percentage of the original licence price. As at 31 March 2017 the maximum exposure under the decommercialisation scenario is $91.1 million (2016: $39.6 million).
New variety succumbs to Psa
For licences granted in 2013/14, 2014/15 and 2015/16 in the event that a new variety has, in the opinion of the Company, succumbed to Psa within four years of allocation, the licence applicant may elect to surrender the licence and the Company will refund 80 percent of the purchase price of the licence. As at 31 March 2017 the maximum exposure under this scenario is $14.3 million (2016: $14.3 million).
Plant Variety Right not granted
In September 2016 the Company was granted a PVR in New Zealand for each of the three cultivars commercialised in 2010 (Gold3, Gold9, Green14). As at 31 March 2017 the maximum exposure under the PVR not Granted scenario is $Nil (2016: $65.3 million).
The maximum new cultivar contingent liability under the three scenarios above as at 31 March 2017 is $91.1 million (2016: $65.3 million).
Serious Fraud Office
The Serious Fraud Office (SFO) has issued notices to the Company seeking company documents and information pursuant to Section 9 of the Serious Fraud Act 1990. This information has been provided to the SFO as required, and it is uncertain whether any claim will be made against the Company. It is therefore unknown what the impact, if any, will ultimately be, and no provision has been made for any potential claim. Provision for legal and other costs in relation to meeting the requirements of the SFO investigation has been included in other provisions (refer Note 20).
Other
In the normal course of business, Zespri Group is party to various lawsuits and claims, both as a plaintiff and as a defendant.
It is not possible to predict with certainty whether Zespri Group will ultimately be successful in defending lawsuits and claims taken against it or, if not, what the impact might ultimately be. Provisions are made in accordance with accounting policy and disclosed in Note 20.
54Zespri Annual Report 2016/17 Zespri Group Limited and Subsidiaries Annual Report for the year ended 31 March 2017

Notes to the Financial Statements (continued)
25. Funding facilitiesFunding arrangements for Zespri Group Limited are made when required following the assessment of cash requirements for the season.
The security for the day-to-day operational treasury activities and the funding facilities is a first-ranking general security deed dated 30 April 2007 in favour of Bank of New Zealand (as security representative for our bankers) entered into by the Zespri Group of Companies that form a Guaranteeing Group. Pursuant to the general security deed the collateral at risk is all property for those entities within the Guaranteeing Group, other than assets over which another creditor has a higher-ranking claim. The registered security interests include a priority security interest in favour of The New Zealand Institute for Plant & Food Research Limited in relation to the Hort16A PVR and Hort16A intellectual property. Property within the definition of collateral includes (but is not limited to) cash balances, inventory, accounts receivable, other financial assets, intangible assets, and property, plant and equipment.
As at 31 March 2017 the members of the Guaranteeing Group are:
• Zespri Group Limited
• Aragorn Limited (non-trading, refer Note 18)
• Zespri Innovation Company Limited
• Zespri International Limited
• Zespri International (Asia) Limited
• Zespri International (Japan) Limited (non-trading, refer Note 18)
• Zespri International Trading Limited
• Zespri New Zealand Limited
As at 31 March 2017 the outstanding borrowing under the funding facility is $Nil (2016: $Nil). The maximum exposure relating to the operational treasury activities as at 31 March 2017 is $6,498,049 (2016: $25,160,143). This exposure relates entirely to the unrealised mark-to-market losses on derivatives as at 31 March 2017.
26. Capital commitments (a) Property, plant and equipment commitments
As at 31 March 2017 there are outstanding capital commitments totalling $34,149,927 for property, plant and equipment (2016: $525,936). The 2017 commitments relate to building contracts for Zespri’s new head office at 400-410 Maunganui Road.
(b) Intangibles commitments
As at 31 March 2017 there are outstanding capital commitments totalling $1,243,700 for intangible assets (2016: $1,452,472).
27. Related party transactions (a) Key management personnel
Zespri Group’s key management personnel include:
• Directors of the Company; and
• Members of the senior executive of Zespri Group.
During the year, key management personnel received the following compensation:
2017$’000
2016$’000
Short-term key employee benefits (for key management personnel and Directors) 9,787 9,019
Short-term key employee benefits outstanding as at 31 March (for key management personnel and Directors) 2,095 1,756
The Company has not provided post-employment benefits or other long-term benefits.
Certain Directors, including B L Cameron, A E de Farias, N W Flowerday, P R Jones and P J McBride, conduct business with the Company and its subsidiaries in the normal course of their business activities as growers and as shareholders. All these transactions are conducted on commercial terms and conditions. Directors are required to record all interests in the Company’s Interests Register.
55 www.zespri.comZespri Group Limited and Subsidiaries Annual Report for the year ended 31 March 2017

Notes to the Financial Statements (continued)
27. Related party transactions (continued) (b) External related parties through common directorship, control or significant influence by key management personnel
During the year ended 31 March 2017, the Company conducted transactions with the following entities in the normal course of business:
Cameron Orchards Limited, DMS Progrowers Supply Entity Limited, DMS Progrowers Limited, Fraser Road Orchard Limited Partnership, Fruit Force Partnership, Golf Course Orchard Limited Partnership, High Fives Orchard Limited, Kiwifruit Vine Health Incorporated, Kiwifruit Vine Health Foundation Incorporation, Mangatarata Orchards Limited, Montrose Partnership, Opotiki Packing and Coolstorage Limited, OPAC Growers Limited, OPAC Growers Supply Limited, Patricia Jones Family Trust, Port of Tauranga Limited, Progeny Kiwifruit Limited, Progeny Kiwifruit Partnership, Rivas Orchard Limited, South-East Hort Limited and Trinity Lands Limited.
(2016: AgResearch Limited, DMS Progrowers Supply Entity Limited, DMS Progrowers Limited, Fruit Force Partnership, Golf Course Orchard Limited Partnership, High Fives Orchard Limited, Kiwifruit Vine Health Incorporated, Kiwifruit Vine Health Foundation Incorporation, Mangatarata Orchards Limited, Montrose Partnership, Opotiki Packing and Coolstorage Limited, OPAC Growers Supply Limited, Port of Tauranga Limited, Progeny Kiwifruit Partnership, Rivas Orchard Limited, Somerset Marketing Limited and Trinity Lands Limited.)
These entities are, or were, related to the Company by virtue of shareholding, control, significant influence or common directorship.
(i) Types of transactions with external related parties include the following:
• The Company pays fruit and service payments under the terms of the New Zealand Supply Agreement.
• The entities are charged penalties and other charges under the terms of the New Zealand Supply Agreement and the Quality Manual. There are standard dispute procedures which may be enacted if the entities receiving the charges do not agree with these charges.
• Under the terms of the New Zealand Supply Agreement, growers and contracted suppliers are able to make insurance claims to the Company for specific risks. In certain cases, the Company pays out insurance for losses under these claims.
• The Company may, at its discretion, sell licences for kiwifruit varieties for which it controls the Plant Variety Rights.
All of the transactions above, including any disputes, were entered into under the same contracted and commercial terms as for all other growers and contracted suppliers in New Zealand.
(ii) Transactions during the year and balances outstanding as at 31 March with external related parties. All related party disclosures are GST exclusive.
2017$’000
2016$’000
Revenue/(expenses):
Sale of Zespri variety licences 1 2,843 25
Income received from KVH 1,296 2,872
Sundry income 1,449 400
Fruit and service payments (160,561) (129,649)
Loyalty premium (3,818) (3,056)
Expenses paid to KVH (2,718) (2,203)
Other expenses (4,153) (1,634)
Balances receivable/(payable):
Sundry income receivable 626 10
Fruit and service payments outstanding (4,617) (4,915)
Loyalty premium payable (2,291) (1,834)
Provision for funding to KVH - (298)
Income receivable from KVH 340 1,417
Other expenses receivable/(payable) 3,261 -
Less: Provision for doubtful debts (1,447) -
1 In 2016/17, interests directly associated with Directors purchased 39.17 hectares of new variety licences (2016: 2.63 hectares). Of these, 17.97 hectares were purchased through the 2016 licence release and 21.2 hectares were other licences including Gold One For One (GOFO). Revenue of $2,843,491 (2016: $25,269) has been recognised. Revenue of $2,641,195 relates to the 2016 licence release and $202,296 relates to other licences issued during the year. As at 31 March 2017 $1,381,994 of licence fee revenue is due in future years (2016: $153,254).
56Zespri Annual Report 2016/17 Zespri Group Limited and Subsidiaries Annual Report for the year ended 31 March 2017

Notes to the Financial Statements (continued)
28. Events occurring after balance dateOn 25 May 2017 the Board of Directors of Zespri Group Limited announced its intention to pay a final dividend of 17.0 cents per fully paid ordinary share (2016: 19.0 cents) to be paid in August 2017. As the intention was announced after balance date, the financial effect has not been recognised in the Financial Statements.
In April 2017 400 hectares of Gold3 licences were released. The total revenue excluding GST was $98 million. Full settlement of the related licence receivables are due by 28 July 2017.
In May 2017 Zespri International Limited was charged by WorkSafe New Zealand in relation to a quad bike accident in the 2016 season which resulted in the death of a worker employed by a Zespri contractor. Zespri has raised a provision in the Financial Statements (refer Note 20).
Subsequent to 31 March 2017 no other events have occurred that require disclosure in the Financial Statements.
29. Statutory board and grower representation fundingThe Company is required, under Regulation 39 of the Kiwifruit Export Regulations 1999, to fund the statutory board Kiwifruit New Zealand.
Zespri Group Limited is required by The Commodity Levies (Kiwifruit) Order 2012 to pay a levy to New Zealand Kiwifruit Growers Incorporated on behalf of growers. The rate for the 2017 financial year was $0.009 per tray of kiwifruit exported to markets other than Australia (2016: $0.009 per tray).
Zespri Group Limited pays two different levies to Kiwifruit Vine Health Inc. on behalf of growers: (1) a Psa levy of $0.01 per tray Class 1 Green and $0.02 per tray Class 1 Gold exported to markets other than Australia; and (2) a biosecurity levy of $0.006 per tray for all varieties exported to markets other than Australia.
2017$’000
2016$’000
Kiwifruit New Zealand 493 444
New Zealand Kiwifruit Growers Incorporated 1,248 1,072
Kiwifruit Vine Health Inc. 2,689 2,226
The financial statements of New Zealand Kiwifruit Growers Incorporated are available for viewing on request.
57 www.zespri.comZespri Group Limited and Subsidiaries Annual Report for the year ended 31 March 2017

Notes to the Financial Statements (continued)
30. Group segment resultsRevenues, direct costs, promotion and overheads are identified and recognised for each business unit under the application of NZ IFRS. In 2016/17 Zespri undertook a review of its business units and reassessed its key business units as New Zealand kiwifruit, non-New Zealand supply, new cultivars, and land and buildings. Land and buildings has been recorded within the segment “all other segments”. The revenue and costs associated with the removed segments, Research and Development (R&D) and Corporate, are split between the available segments. The 2017 segment financial information has been provided in two tables, one under the old segment layout and one under the new segment layout. Zespri has not changed the 2016 year comparable information as it is not readily available and the cost to develop it would be excessive.
The internal management information on which segment results are based uses a different method for allocating realised gains and losses on treasury activities. For internal management reporting, realised gains and losses from the management of foreign exchange risk are allocated to the business unit’s individual revenue and expense lines based on the underlying currencies of the transactions to effect what would be a ‘hedged’ rate on the cumulative transactions. For financial reporting purposes, these net realised foreign exchange gains/(losses) on derivatives are disclosed separately from the operating revenue and operating expense within other net gains/(losses) (refer Note 5).
2017 new segments
New Zealand kiwifruit
Non-New Zealand supply
New cultivars
All other segments Eliminations Total
$’000 $’000 $’000 $’000 $’000 $’000
Total sales revenue – external customers 2,046,332 215,570 - - - 2,261,902
Inter-segment revenue 83 - 16,673 705 (17,461) -
Interest revenue - - - 3,234 - 3,234
Licence income - - 67,178 - - 67,178
Other revenue 8,359 963 3,646 - - 12,968
Total revenue 2,054,774 216,533 87,497 3,939 (17,461) 2,345,282
Freight 135,107 8,917 - - - 144,024
Insurance (onshore and offshore) 6,658 (1) - - - 6,657
Duty and customs 80,168 5,613 - - - 85,781
Promotion 149,597 5,659 - - - 155,256
Other direct costs – onshore 46,374 - - - - 46,374
Other direct costs – offshore 76,763 7,609 - - - 84,372
Fruit and service payments 1,343,983 160,133 - - - 1,504,116
Loyalty premium 36,047 - - - - 36,047
Innovation 11,651 - 13,615 - - 25,266
New cultivar ammortisation - - 1,917 - - 1,917
Inter-segment expense 15,923 1,455 83 - (17,461) -
Inter-segment interest (income)/expense (810) - - 810 - -
Other onshore overhead costs 69,354 6,540 990 966 - 77,850
Other offshore overhead costs 61,781 8,756 - - - 70,537
Class 2 mainpack subsidy 10 - - - - 10
Total expense 2,032,606 204,681 16,605 1,776 (17,461) 2,238,207
Segment profit before taxation 22,168 11,852 70,892 2,163 - 107,075
58Zespri Annual Report 2016/17 Zespri Group Limited and Subsidiaries Annual Report for the year ended 31 March 2017
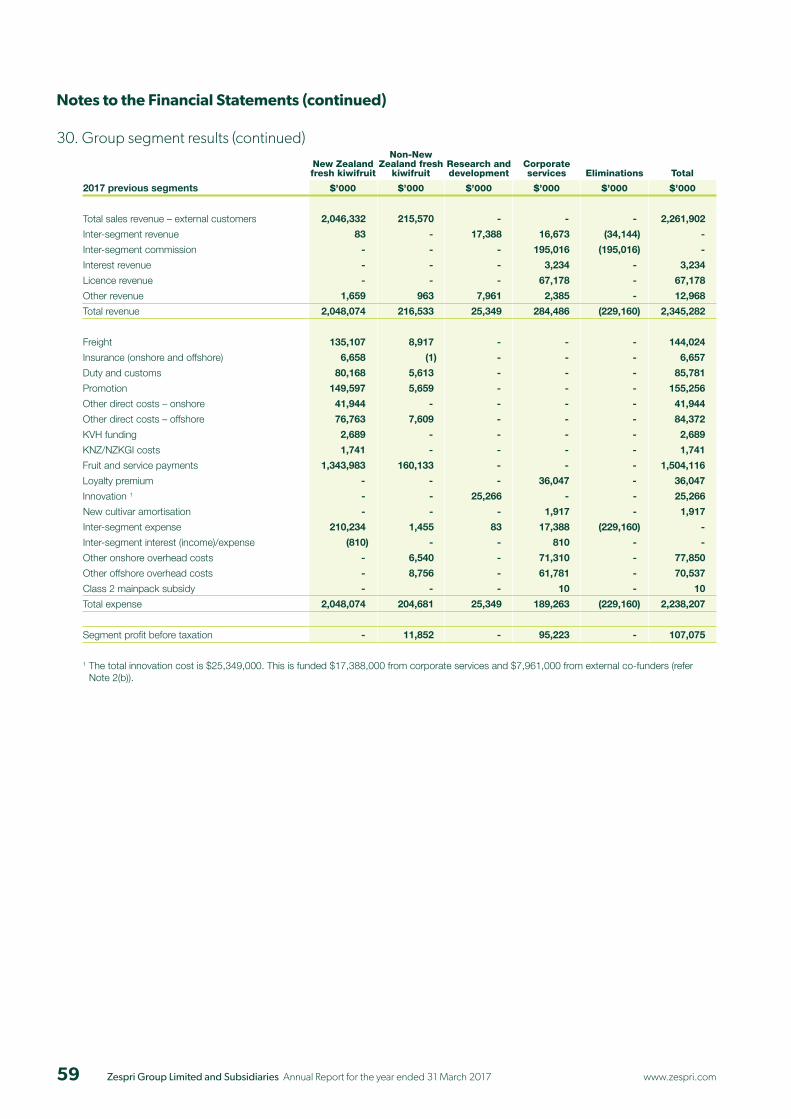
Notes to the Financial Statements (continued)
30. Group segment results (continued)
2017 previous segments
New Zealand fresh kiwifruit
Non-New Zealand fresh
kiwifruitResearch and development
Corporate services Eliminations Total
$’000 $’000 $’000 $’000 $’000 $’000
Total sales revenue – external customers 2,046,332 215,570 - - - 2,261,902
Inter-segment revenue 83 - 17,388 16,673 (34,144) -
Inter-segment commission - - - 195,016 (195,016) -
Interest revenue - - - 3,234 - 3,234
Licence revenue - - - 67,178 - 67,178
Other revenue 1,659 963 7,961 2,385 - 12,968
Total revenue 2,048,074 216,533 25,349 284,486 (229,160) 2,345,282
Freight 135,107 8,917 - - - 144,024
Insurance (onshore and offshore) 6,658 (1) - - - 6,657
Duty and customs 80,168 5,613 - - - 85,781
Promotion 149,597 5,659 - - - 155,256
Other direct costs – onshore 41,944 - - - - 41,944
Other direct costs – offshore 76,763 7,609 - - - 84,372
KVH funding 2,689 - - - - 2,689
KNZ/NZKGI costs 1,741 - - - - 1,741
Fruit and service payments 1,343,983 160,133 - - - 1,504,116
Loyalty premium - - - 36,047 - 36,047
Innovation 1 - - 25,266 - - 25,266
New cultivar amortisation - - - 1,917 - 1,917
Inter-segment expense 210,234 1,455 83 17,388 (229,160) -
Inter-segment interest (income)/expense (810) - - 810 - -
Other onshore overhead costs - 6,540 - 71,310 - 77,850
Other offshore overhead costs - 8,756 - 61,781 - 70,537
Class 2 mainpack subsidy - - - 10 - 10
Total expense 2,048,074 204,681 25,349 189,263 (229,160) 2,238,207
Segment profit before taxation - 11,852 - 95,223 - 107,075
1 The total innovation cost is $25,349,000. This is funded $17,388,000 from corporate services and $7,961,000 from external co-funders (refer Note 2(b)).
59 www.zespri.comZespri Group Limited and Subsidiaries Annual Report for the year ended 31 March 2017

Notes to the Financial Statements (continued)
30. Group segment results (continued)
2016
New Zealand fresh kiwifruit
Non-New Zealand fresh
kiwifruit Research and development
Corporate services Eliminations Total
$’000 $’000 $’000 $’000 $’000 $’000
Total sales revenue – external customers 1,723,303 183,616 - - - 1,906,919
Inter-segment revenue 76 - 14,980 10,376 (25,432) -
Inter-segment commission - - - 163,748 (163,748) -
Interest revenue - - - 5,388 - 5,388
Licence income - - - 2,589 - -
Other revenue 985 91 8,921 1,265 - 13,851
Total revenue 1,724,364 183,707 23,901 183,366 (189,180) 1,926,158
Freight 138,749 7,924 - - - 146,673
Insurance (onshore and offshore) 6,173 27 - - - 6,200
Duty and customs 78,340 88 - - - 78,428
Promotion 125,394 5,656 - - - 131,050
Other direct costs – onshore 36,018 - - - - 36,018
Other direct costs – offshore 51,800 5,650 - - - 57,450
KVH funding 2,226 - - - - 2,226
KNZ/NZKGI costs 1,516 - - - - 1,516
Fruit and service payments 1,113,410 141,627 - - - 1,255,037
Loyalty premium - - - 29,642 - 29,642
Innovation 1 - - 23,825 - - 23,825
New cultivar amortisation - - - 1,786 - 1,786
Inter-segment expense 173,210 915 76 14,979 (189,180) -
Inter-segment interest (income)/expense (2,472) - - 2,472 - -
Other onshore overhead costs - 4,936 - 58,691 - 63,627
Other offshore overhead costs - 6,469 - 39,705 - 46,174
Class 2 mainpack subsidy - - - (10) - (10)
Total expense 1,724,364 173,292 23,901 147,265 (189,180) 1,879,642
Segment profit before taxation - 10,415 - 36,101 - 46,516
1 The total innovation cost is $23,900,941. This is funded $15,167,441 from corporate services and $8,733,500 from external co-funders (refer Note 2(b)).
Methods and assumptions
Zespri Group allocates assets, and any related depreciation and amortisation, on a basis which reflects where the assets are generated or utilised.
Zespri Group employs a central treasury function and does not allocate cash between the segments because it is managed centrally. Interest revenue and expense have been allocated on the basis of where funds are being utilised.
Inter-company debtor and creditor accounts are settled through the central treasury function. Any other outstanding balances created between companies as part of this settlement process or any other intra-group borrowing or lending transactions, are not allocated to any segment, but form part of the centrally managed funding of Zespri Group.
Zespri Group does not allocate income tax to reportable segments.
60Zespri Annual Report 2016/17 Zespri Group Limited and Subsidiaries Annual Report for the year ended 31 March 2017

Notes to the Financial Statements (continued)
30. Group segment results (continued)
Group sales revenue – by location of external customers
2017 Local currency
’000
2016 Local currency
’0002017$’000
2016$’000
Japan JPY 37,392,130 JPY 32,538,050 513,908 467,972
China 1 CNY 2,070,135 CNY 1,335,507 446,327 299,737
Spain EUR 126,904 EUR 112,834 207,814 183,465
Taiwan USD 117,725 USD 105,224 166,679 145,103
Germany EUR 74,670 EUR 64,655 124,595 105,725
South Korea KRW 98,248,848 KRW 89,432,097 120,821 110,340
Italy EUR 61,377 EUR 50,899 100,959 82,987
France EUR 58,195 EUR 47,053 96,932 76,963
Netherlands EUR 53,107 EUR 50,670 87,268 82,599
USA USD 44,892 USD 32,953 63,557 45,253
Belgium EUR 36,806 EUR 36,254 60,450 59,014
Hong Kong USD 26,172 USD 23,921 37,094 33,136
India USD 15,550 USD 10,111 21,999 14,091
Australia AUD 20,771 AUD 13,585 21,887 14,795
New Zealand NZD 3,878 NZD 1,269 3,878 1,700
Other Various - Various - 187,734 184,039
Total revenue from product sales to external customers 2,261,902 1,906,919
1 China sales were reported in USD in the 2016 Annual Report. China sales above are stated in CNY. For consistency the 2016 sales have been converted using a 2016 effective CNY:NZD foreign exchange rate of 4.4556.
Individual customers which account for at least 10 percent of sales across the Group are:
2017 Local currency
’000
2016 Local currency
’0002017$’000
2016$’000
Golden Wing Mau Agricultural Produce Company (China) CNY 1,137,950 CNY 896,128 245,290 201,124
Non-current assets – by location of asset2017$’000
2016$’000
New Zealand 97,277 51,227
Belgium 666 930
Japan 359 618
Other 2,628 1,443
100,930 54,218
Other non-current assets (no assigned location):
Deferred tax 4,163 2,469
Non-current other financial assets 44,305 39,187
Total non-current assets 149,398 95,874
61 www.zespri.comZespri Group Limited and Subsidiaries Annual Report for the year ended 31 March 2017

Statutory information
Shareholder information
Top 20 shareholders at 31 March 2017Number of
shares %
Trinity Lands Limited 2,129,300 1.76%
Mark Lionel William Gardiner & Robyn Anne Gardiner 1,868,975 1.55%
Cherry Trust 1,634,645 1.35%
DMS Horticulture Limited 1,407,500 1.17%
Maketu Estates Limited 1,373,470 1.14%
Estate of MP Jones 1,339,545 1.11%
Kiwi Green New Zealand Limited 1,225,770 1.02%
Hopai Holdings Limited 1,097,432 0.91%
Mangatarata Orchards Limited 1,085,310 0.90%
Montrose Partnership 850,000 0.70%
Ngai Tukairangi Trust 816,590 0.68%
Seeka Kiwifruit Industries Limited 740,825 0.61%
Matai Pacific Limited 677,720 0.56%
Birdhurst Limited 675,610 0.56%
Strathboss Kiwifruit Limited 653,130 0.54%
Progeny Kiwifruit Limited 624,335 0.52%
John David Anderson & IML Aerocool Trustee Company Limited 605,470 0.50%
DM & BA Reid Family Trust 596,450 0.49%
Aronia Corporation Limited 579,570 0.48%
Sunnyvale Enterprises Limited 568,515 0.47%
20,550,162 17.02%
Distribution of ordinary shares and registered shareholders at 31 March 2017
Size of holdingNumber of
shareholdersNumber of
shares
Size of holding
%%
1 – 5,000 143 7.2% 433,375 0.4%
5,001 – 25,000 755 38.2% 10,737,392 8.9%
25,001 – 50,000 438 22.2% 15,923,201 13.2%
50,001 – 250,000 564 28.5% 53,727,392 44.5%
Over 250,000 77 3.9% 39,895,975 33.0%
Total 1,977 100.0% 120,717,335 100.0%
62Zespri Annual Report 2016/17 Zespri Group Limited and Subsidiaries Annual Report for the year ended 31 March 2017

Statutory information (continued)
Shareholder information (continued)
Shareholder statistics 2017 2016
Number of shares (’000) 120,717 120,717
Interim and final dividend (per share) $0.25 $0.24
Share price at year-end $4.00 $1.82
Earnings per share $0.61 $0.30
Net dividend yield 6.3% 13.2%
Gross dividend yield at 28% tax rate 8.7% 14.3%
Share trading
Number of shares sold: on-market trades 2,112,284 1,657,730
Number of shares sold: off-market trades 4,808,594 646,750
Equity ratio 31.1% 29.9%
Net tangible assets value per share $1.17 $0.83
Directors’ disclosures
Directors’ meeting attendances and business travel overseas
Zespri Group Limited Board
Audit and Risk Management Committee
Organisation and
Administration Committee
Industry Advisory Council
Board Innovation
Subcommittee
Number of business trips
overseas Regions visited
B L Cameron 16 3 5 7 - 5 Americas, China, Europe
T Ciprian 16 - 4 - 6 2 China, East Asia, Japan
A E de Farias 15 - 3 6 - 3 Europe, Iran, South America, Turkey
N W Flowerday 15 4 1 1 6 1 Americas
P R Jones 16 5 1 6 6 3 China, Europe, India
J P Mason 15 5 5 - - 1 China, East Asia, Japan
P J McBride – Chairman 17 5 4 1 5 8 China, Dubai, East Asia, Europe
D A Pilkington 16 5 1 - 6 1 Europe
In addition to the meetings detailed above, the Directors’ attendances included planning meetings, Directors’ conferences and grower meetings and sub-group meetings along with a number of industry briefing forums.
63 www.zespri.comZespri Group Limited and Subsidiaries Annual Report for the year ended 31 March 2017

Directors’ disclosures (continued)
Committee members – Directors
Audit and Risk Management Committee
J P Mason (Chair)
N W Flowerday
P R Jones (ceased September 2016)
D A Pilkington
Organisation and Administration Committee
B L Cameron (Chair)
T Ciprian
A E de Farias (ceased September 2016)
J P Mason
Industry Advisory Council
P R Jones (Chair)
B L Cameron
A E de Farias
Board Innovation Subcommittee
N W Flowerday (Chair)
T Ciprian
P R Jones (appointed September 2016)
D A Pilkington (ceased September 2016)
Remuneration of Directors2017
$2016
$
B L Cameron 104,250 102,500
T Ciprian 78,750 77,083
A E de Farias 78,750 78,333
N W Flowerday 81,250 76,875
P R Jones 83,750 82,083
J P Mason 94,250 92,500
P J McBride 196,000 190,833
D A Pilkington 81,250 82,083
Total 798,250 782,290
The Chair of each committee receives $5,000 of remuneration per annum.
Statutory information (continued)
64Zespri Annual Report 2016/17 Zespri Group Limited and Subsidiaries Annual Report for the year ended 31 March 2017

Directors’ disclosures (continued)Directors’ interests – shareholdings
The following table sets out the shareholdings in Zespri Group Limited held by each Director or related entity as at 31 March 2017.
Shareholding as at
31 Mar 16Date of
transactionShare price
$
Number purchased/ transferred Number sold
Interest commenced/
(ceased)
Shareholdingas at
31 Mar 17
B L Cameron 341,619 341,619
T Ciprian - -
A E de Farias 221,179 08/09/2016 3.20 10,000
15/09/2016 3.39 20,000
15/09/2016 3.40 30,000
12/01/2017 3.28 132,394 413,573
N W Flowerday 567,835 567,835
P R Jones 3,623,073 14/10/2016 3.15 10,000
18/10/2016 3.40 8,850
18/10/2016 3.40 8,850
04/11/2016 3.10 10,000
15/11/2016 3.00 6,798
15/11/2016 3.00 6,797
12/01/2017 3.26 39,425
12/01/2017 3.26 39,426
09/02/2017 3.25 50,000 3,803,219
J P Mason - -
P J McBride 1 850,000 04/08/2016 3.50 38,980
04/08/2016 3.50 14,900
24/08/2016 3.31 29,314
08/09/2016 3.40 5,885
15/09/2016 3.39 9,115
15/09/2016 3.40 885
15/09/2016 3.40 33,510
04/11/2016 3.15 7,411
02/12/2016 3.17 10,000
01/02/2017 2,064,300
02/03/2017 3.34 65,000 3,129,300
D A Pilkington - -
1 An interest commenced of 2,064,300 during the 2017 financial year for P J McBride which relates to his appointment as Chief Executive Officer of Trinity Lands Limited: however, he has no beneficial interest in the shares of this entity.
Shares above are held personally by Directors or are held by way of relevant interest. Interests included in the above table are only those entities which directors are able to influence the share trading activity through directorships, ownership control or management positions. A full list of Directors’ Interests is included on pages 66 and 68.
Statutory information (continued)
65 www.zespri.comZespri Group Limited and Subsidiaries Annual Report for the year ended 31 March 2017
Directors’ disclosures (continued)
Directors’ interests – Directors in office as at 31 March 2017
B L Cameron
Director of, and shareholder in, Zespri Group Limited
Director of Zespri International Limited
Director of, and shareholder in, Cameron Farms Limited
Director of, and shareholder in, Cameron Orchards Limited
Director of, and shareholder in, Gilston Mains Limited and subsidiary
Director of, and shareholder in, Strathlea Holdings Limited (interest commenced June 2016)
Trustee of BL and GM Cameron Family Trust
Trustee of Rawenga Trust
Trustee of Waipuna Hospice Foundation Board
T Ciprian
Director of Zespri Group Limited
Director of Zespri International Limited
Chair of Phytomed Medicinal Herbs Limited (interest commenced September 2016)
Director of AgResearch Limited (interest ceased June 2016)
Director of Aspeq Limited and subsidiaries
Director of Firstlight Foods Limited
Director of Superthriller Jet Sprint Limited
Director of Zenoch Management Limited
A E de Farias
Director of, and shareholder in, Zespri Group Limited
Director of Zespri International Limited
Chairman of Horizon Energy Distribution Limited and subsidiaries
Chairman of Maxwell Farms Limited and Director of associated entities
Chairman of Opotiki Packing and Cool Storage Limited and subsidiaries (related party interests in various orchards)
Chairman of The Fresh Fruit Company of Nelson Limited
Chairman of Whakatane District Council Commercial Advisory Board (replaced Grow Whakatane Advisory Board)
Director and principal of DFR Consultants Limited
Director of Biolumic Limited
Director of Canterbury Grasslands Limited and subsidiaries (interest ceased December 2016)
Director of Chiefs Rugby Club GP Limited
Director of Ngati Awa Asset Holdings Limited
Director of Ngati Awa Farms (Rangitaiki) Limited
Director of Ngati Awa Group Holdings Limited and subsidiaries
Director, and shareholder in, Rivas Orchard Limited
Statutory information (continued)
66Zespri Annual Report 2016/17 Zespri Group Limited and Subsidiaries Annual Report for the year ended 31 March 2017

Directors’ disclosures (continued)
Directors’ interests – Directors in office as at 31 March 2017 (continued)
N W Flowerday
Director of, and shareholder in, Zespri Group Limited
Director of Zespri International Limited
Beneficiary of Milan Trust
Consultant to Riverlock Orchard Pack & Coolstore Limited
Director of Kiwifruit Vine Health Foundation Incorporated
Director of Kiwifruit Vine Health Incorporated
Director of, and shareholder in, High Fives Orchard Limited
Director of, and shareholder in, NWF Holdings Limited
P R Jones
Director of, and shareholder in, Zespri Group Limited
Director of Zespri International Limited
Director of DMS Group Limited and subsidiaries
Director of DMS Progrowers Supply Entity Limited
Director of Fraser Road Orchard GP Limited & Limited Partnership
Director of Fruit Force Partnership
Director of Golf Course Orchard GP Limited and Limited Partnership
Director of Mangatarata Orchards Limited & Mangatarata Orchard Partnership
Director of New Zealand Avocado Marketing Limited
Director of Tinopai Orchards Limited & Tinopai Orchard Partnership
Director of TKG Agent Limited & TKG Partnership
Director of, and shareholder in, Direct Management Services Limited
Director of, and shareholder in, DMS Progrowers Limited
Director of, and shareholder in, Elizabeth Heights Limited
Director of, and shareholder in, OTK Orchards Limited
Partner of Progeny Kiwifruit Partnership
Shareholder in Hopai Holdings Limited
Shareholder in Mangatarata Farms Limited
Shareholder in Progeny Kiwifruit Limited
Trustees of, and beneficiary of, the PR Jones Family Trust and related entities
Trustees of, and beneficiary of, the Patricia Jones Trust and related entities
J P Mason
Director of Zespri Group Limited
Director of Zespri International Limited
Chairman of Compac Holdings Limited
Director of Air New Zealand Limited
Director of Allagash Limited
Director of New Zealand Assets Management Limited
Director of Vector Limited
Director of Westpac New Zealand Limited
Trustee of University of Auckland Endowment Fund
Trustee of Beloit College (USA)
Statutory information (continued)
67 www.zespri.comZespri Group Limited and Subsidiaries Annual Report for the year ended 31 March 2017
Statutory information (continued)
Directors’ disclosures (continued)
Directors’ interests – Directors in office as at 31 March 2017 (continued)
P J McBride
Director and Chairman of, and shareholder in, Zespri Group Limited
Director of Zespri International Limited and a number of other Zespri subsidiaries
Managing Director of, and shareholder in, South-East Hort Limited and subsidiaries (related party interests in various orchards)
Managing Director of Montrose Partnership
Chief Executive Officer of Trinity Lands Limited
Trustee of P J and L R McBride Family Trust
Trustee of Somerset Trust (contingent interest)
D A Pilkington
Director of Zespri Group Limited
Director of Zespri International Limited
Director of Aragorn Limited
Chairman of Douglas Pharmaceuticals Limited and subsidiaries
Chairman of Port of Tauranga Limited
Chairman of Rangatira Limited and Director of related entities
Director of Northport Limited
Director of Primeport Timaru Limited
Director of Tuatara Brewing Company (interest ceased January 2017)
Director of, and shareholder in, Excelsa Associates Limited
Trustee and beneficiary of Pilkington Family Trust
Trustee of New Zealand Community Trust
68Zespri Annual Report 2016/17 Zespri Group Limited and Subsidiaries Annual Report for the year ended 31 March 2017

Statutory information (continued)
Employee remunerationFor the year ended 31 March 2017, the number of employees whose total remuneration and value of any benefits received or receivable exceeded $100,000 between the following bands was:
Number of non-New Zealand-based employees Number of New Zealand-based employees Total remuneration and benefits ($)
10 16 $100,000 to $109,999
13 10 $110,000 to $119,999
7 13 $120,000 to $129,999
4 3 $130,000 to $139,999
4 2 $140,000 to $149,999
7 6 $150,000 to $159,999
9 4 $160,000 to $169,999
3 8 $170,000 to $179,999
2 4 $180,000 to $189,999
1 3 $190,000 to $199,999
4 1 $200,000 to $209,999
3 - $210,000 to $219,999
2 4 $220,000 to $229,999
1 1 $230,000 to $239,999
2 3 $250,000 to $259,999
- 3 $260,000 to $269,999
2 1 $270,000 to $279,999
3 - $280,000 to $289,999
2 - $290,000 to $299,999
1 - $300,000 to $309,999
1 - $310,000 to $319,999
2 1 $340,000 to $349,999
1 - $400,000 to $409,999
1 - $410,000 to $419,999
1 - $480,000 to $489,999
1 - $490,000 to $499,999
1 1 $500,000 to $509,999
- 1 $510,000 to $519,999
1 - $520,000 to $529,999
1 - $580,000 to $589,999
1 1 $610,000 to $619,999
1 - $620,000 to $629,999
1 - $650,000 to $659,999
- 1 $670,000 to $679,999
- 1 $1,220,000 to $1,229,999
1 - $1,230,000 to $1,239,999
Note: These bands are New Zealand Dollar equivalents and reflect foreign exchange fluctuations.
69 www.zespri.comZespri Group Limited and Subsidiaries Annual Report for the year ended 31 March 2017

Page left intentionally blank.
70Zespri Annual Report 2016/17 Zespri Group Limited and Subsidiaries Annual Report for the year ended 31 March 2017

N E W Z E A L A N D
AU ST R A L I A
I N D O N E S I A
M A L AYS I AS I N G A P O R E
TA I WA NH O N G KO N G
I N D I A
U N I T E D A R A B E M I R AT E S
S O U T H A F R I C A
B R A Z I L
S PA I NI TA LY
SW E D E N
U N I T E D K I N G D O M
F R A N C EB E LG I U M E U R O P E
U N I T E D STAT E S O F A M E R I C AJ A PA N
S O U T H KO R E A
C H I N A
M E X I CO
Using vibrant messaging and ‘magic’, the Beyond
Expectation campaign promotes the health
benefit of Zespri Green Kiwifruit to families.
The ‘Kiwi Brothers’ have taken Japan by storm
with their madcap antics in the fresh produce
sections of supermarkets, highlighting the health benefits and quality of
Zespri Kiwifruit in a funny and memorable way.
European consumers got to experience a
New Zealand kiwifruit orchard for themselves
with this augmented reality game held in
busy railway stations.
People in the Middle East and India have wholeheartedly embraced social
media and our team ran a series of short, light-hearted videos to introduce
Zespri Kiwifruit across the region.
Our ‘Go for Gold’ campaign encouraged consumers to make
healthy everyday choices with Zespri SunGold Kiwifruit, with promotions
alongside events from running competitions to yoga activations.
Zespri once again teamed up with McDonald’s to include
Zespri SunGold in Happy Meals in a special promotion
across the country.
ZESPRI AROUNDTHE WORLD
Zespri sells consistently high-quality, great-tasting, premium kiwifruit in more than 50 countries around the world. Our in-market staff support sales
and execute marketing campaigns tailored to each country we sell in.
71 www.zespri.comZespri Group Limited and Subsidiaries Annual Report for the year ended 31 March 2017
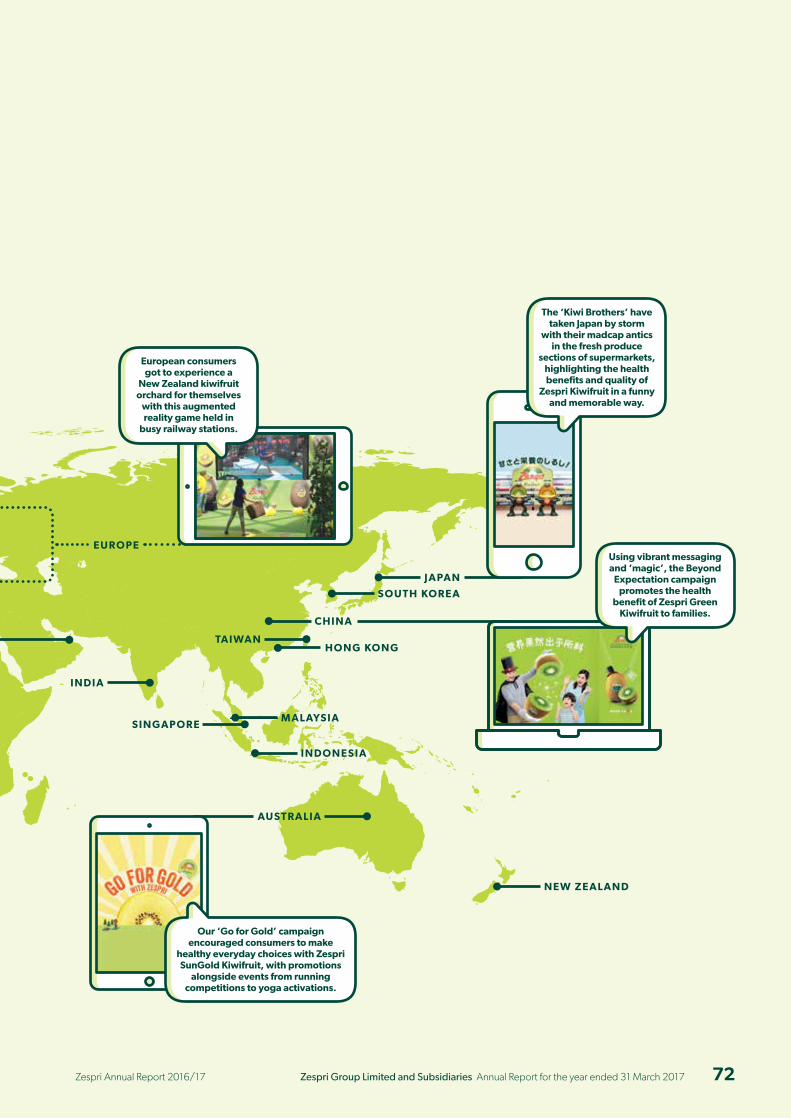
N E W Z E A L A N D
AU ST R A L I A
I N D O N E S I A
M A L AYS I AS I N G A P O R E
TA I WA NH O N G KO N G
I N D I A
U N I T E D A R A B E M I R AT E S
S O U T H A F R I C A
B R A Z I L
S PA I NI TA LY
SW E D E N
U N I T E D K I N G D O M
F R A N C EB E LG I U M E U R O P E
U N I T E D STAT E S O F A M E R I C AJ A PA N
S O U T H KO R E A
C H I N A
M E X I CO
Using vibrant messaging and ‘magic’, the Beyond
Expectation campaign promotes the health
benefit of Zespri Green Kiwifruit to families.
The ‘Kiwi Brothers’ have taken Japan by storm
with their madcap antics in the fresh produce
sections of supermarkets, highlighting the health benefits and quality of
Zespri Kiwifruit in a funny and memorable way.
European consumers got to experience a
New Zealand kiwifruit orchard for themselves
with this augmented reality game held in
busy railway stations.
People in the Middle East and India have wholeheartedly embraced social
media and our team ran a series of short, light-hearted videos to introduce
Zespri Kiwifruit across the region.
Our ‘Go for Gold’ campaign encouraged consumers to make
healthy everyday choices with Zespri SunGold Kiwifruit, with promotions
alongside events from running competitions to yoga activations.
Zespri once again teamed up with McDonald’s to include
Zespri SunGold in Happy Meals in a special promotion
across the country.
72Zespri Annual Report 2016/17 Zespri Group Limited and Subsidiaries Annual Report for the year ended 31 March 2017

TAKE AFEW MOREMOMENTS ...
Annual Report2016/17
© 2017 Zespri Group Limited. All rights reserved.
Zesp
ri Gro
up
Limited
Annual Rep
ort 20
16/17