Tài Liệu Bất Động Sản VN
76
REDISCOVERING VIETNAM’S REAL ESTATE POTENTIAL 1 st March, 2007 Renaissance Hotel, Kuala Lumpur, Malaysia Presented by: Marc Townsend – Managing Director
-
Upload
thuong-doan -
Category
Documents
-
view
222 -
download
0
description
Â
Transcript of Tài Liệu Bất Động Sản VN
REDISCOVERING VIETNAM’S REAL ESTATE POTENTIAL
1st March, 2007Renaissance Hotel, Kuala Lumpur, Malaysia
Presented by:Marc Townsend – Managing Director

CB Richard Ellis | Page 2
Client Logo Goes Here
WHAT HAS BEEN DRIVING THE PROPERTY MARKET SINCE 2003?
•Limited capital markets
•An emerging condo market in Hanoi and HCMC
• Conspicuous consumption
• Ability to borrow from local banks at 10-11% per annum
• Consistently rising GDP and FDI
• China + 1, APRC, the Stock Market and entry to WTO has put Vietnam on the radar
screen, coupled with the ML report in Feb and the Euro Money Conference in Mar 2006
• Saturation in other South East Asian markets
CB Richard Ellis | Page 3
Client Logo Goes Here
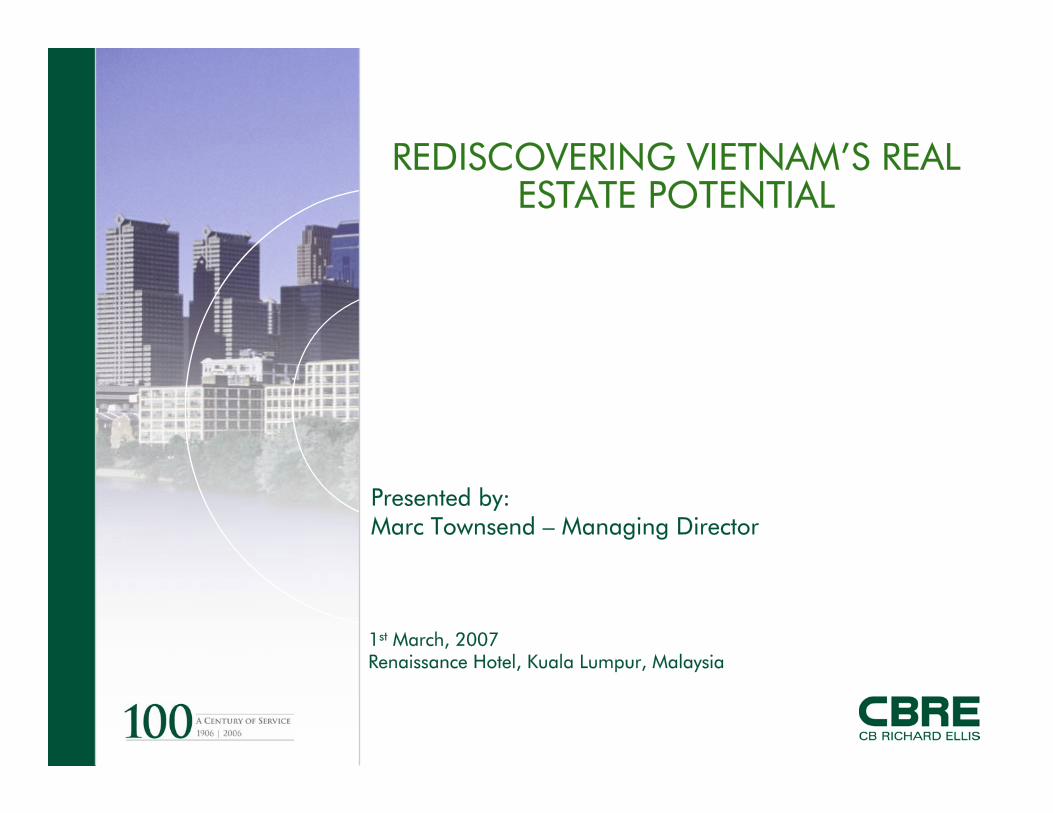
MAP OF VIETNAM

CB Richard Ellis | Page 4
Client Logo Goes Here
HO CHI MINH CITY

CB Richard Ellis | Page 5
Client Logo Goes Here
VIETNAM TODAY
• No Starbucks and No MacDonalds
• World leaders in pepper, coffee, cashew, shoes, fish/prawns, oil & gas exports
• No shortage of land, just good sites
• “If you build it, they will come” still exists but may not last much longer
• Many similarities to China in the early 90s in terms of work ethic, chaos on the
streets, migration of work force and market driven decisions
• Traffic, complete absence of infrastructure, MRT/MTR, bridges and tunnels
CB Richard Ellis | Page 6
Client Logo Goes Here
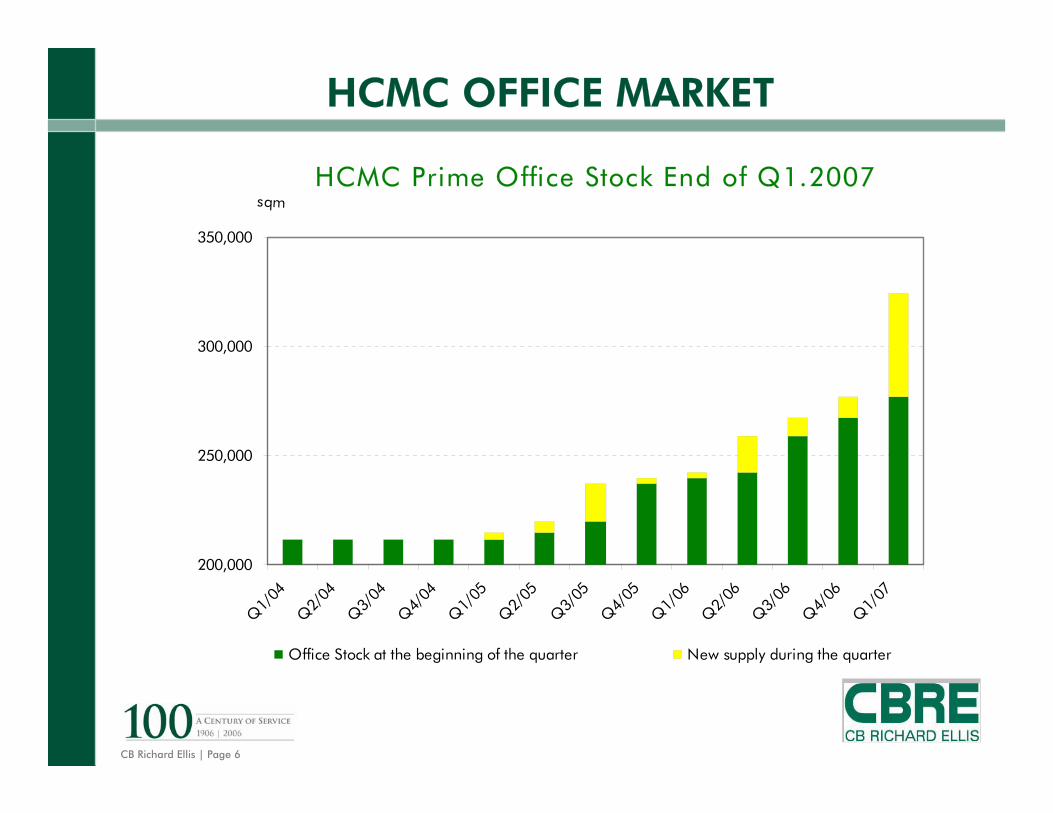
HCMC OFFICE MARKET
HCMC Prime Office Stock End of Q1.2007
200,000
250,000
300,000
350,000
Q1/
04
Q2/
04
Q3/
04
Q4/
04
Q1/
05
Q2/
05
Q3/
05
Q4/
05
Q1/
06
Q2/
06
Q3/
06
Q4/
06
Q1/
07
sqm
Office Stock at the beginning of the quarter New supply during the quarter
CB Richard Ellis | Page 7
Client Logo Goes Here
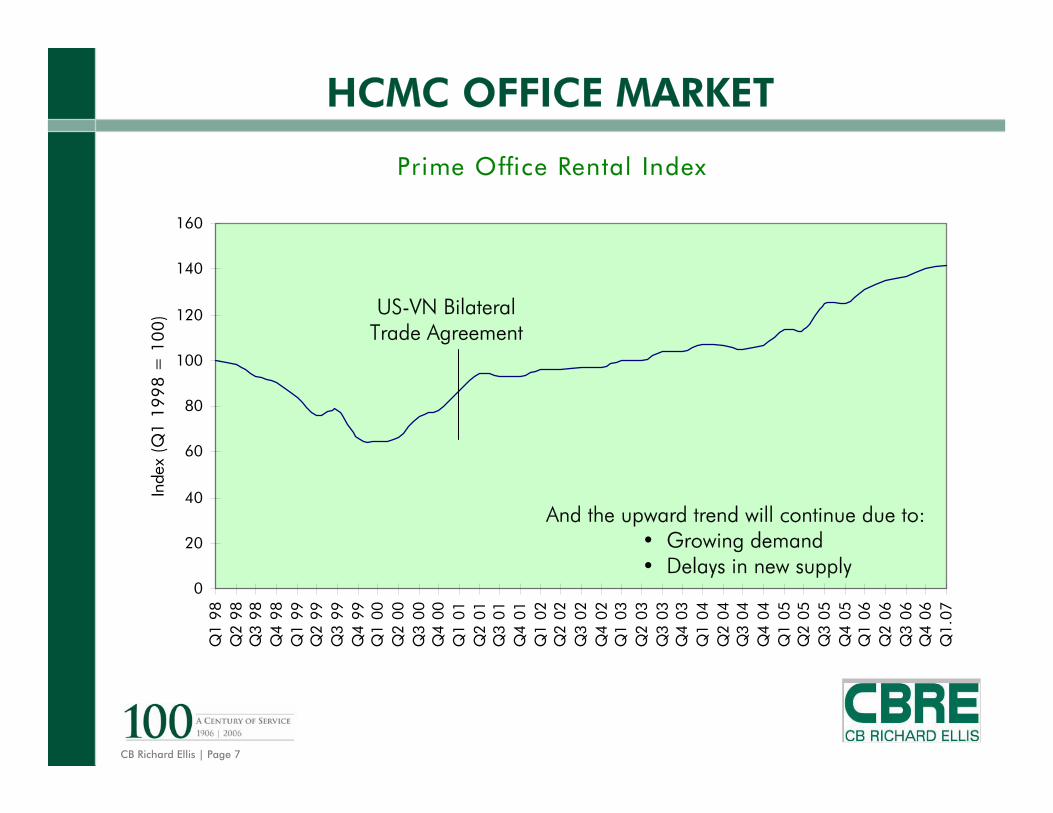
HCMC OFFICE MARKET
Prime Office Rental Index
0
20
40
60
80
100
120
140
160Q
1 98
Q2
98Q
3 98
Q4
98Q
1 99
Q2
99Q
3 99
Q4
99Q
1 00
Q2
00Q
3 00
Q4
00Q
1 01
Q2
01Q
3 01
Q4
01Q
1 02
Q2
02Q
3 02
Q4
02Q
1 03
Q2
03Q
3 03
Q4
03Q
1 04
Q2
04Q
3 04
Q4
04Q
1 05
Q2
05Q
3 05
Q4
05Q
1 06
Q2
06Q
3 06
Q4
06Q
1.07
Inde
x (Q
1 1
99
8 =
10
0)
And the upward trend will continue due to:• Growing demand• Delays in new supply
US-VN Bilateral Trade Agreement
CB Richard Ellis | Page 8
Client Logo Goes Here
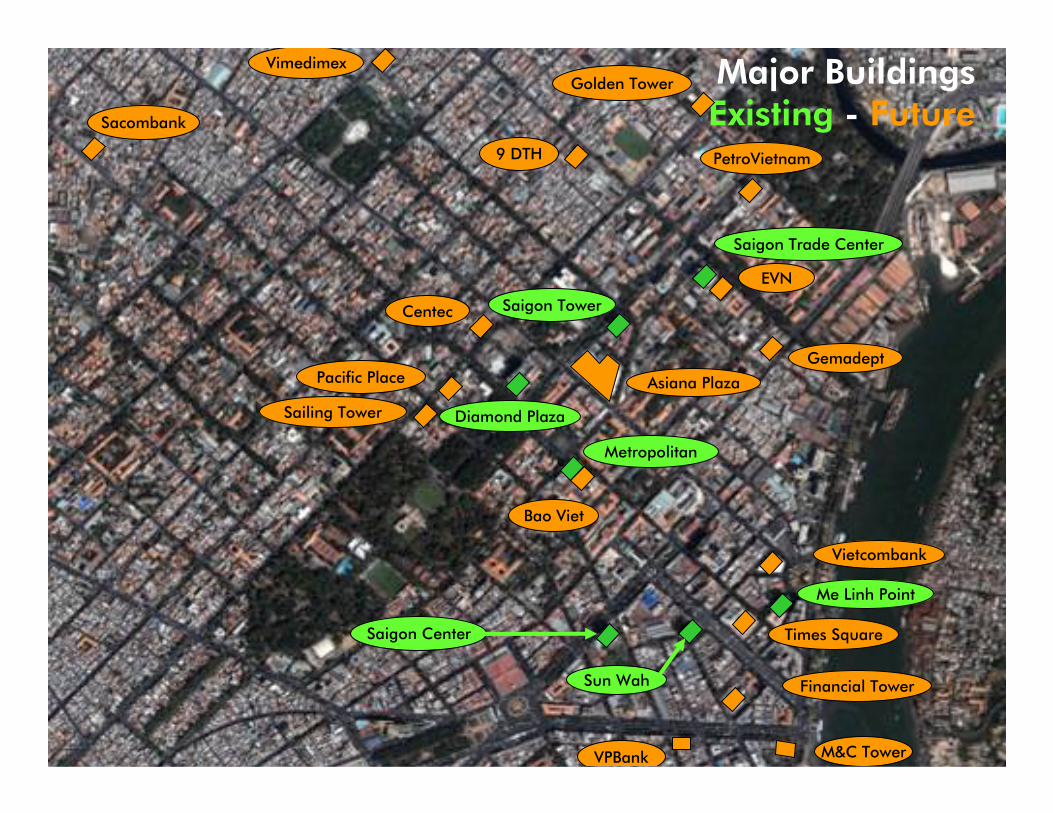
Major BuildingsExisting - Future
Centec
EVN
Vietcombank
Times Square
M&C Tower
Financial Tower
VPBank
Sailing Tower
Pacific Place Asiana Plaza
Metropolitan
Saigon Tower
Sun Wah
Saigon Center
Diamond Plaza
Gemadept
Saigon Trade Center
Me Linh Point
PetroVietnam9 DTH
Vimedimex
Sacombank
Bao Viet
Golden Tower
CB Richard Ellis | Page 9
Client Logo Goes Here
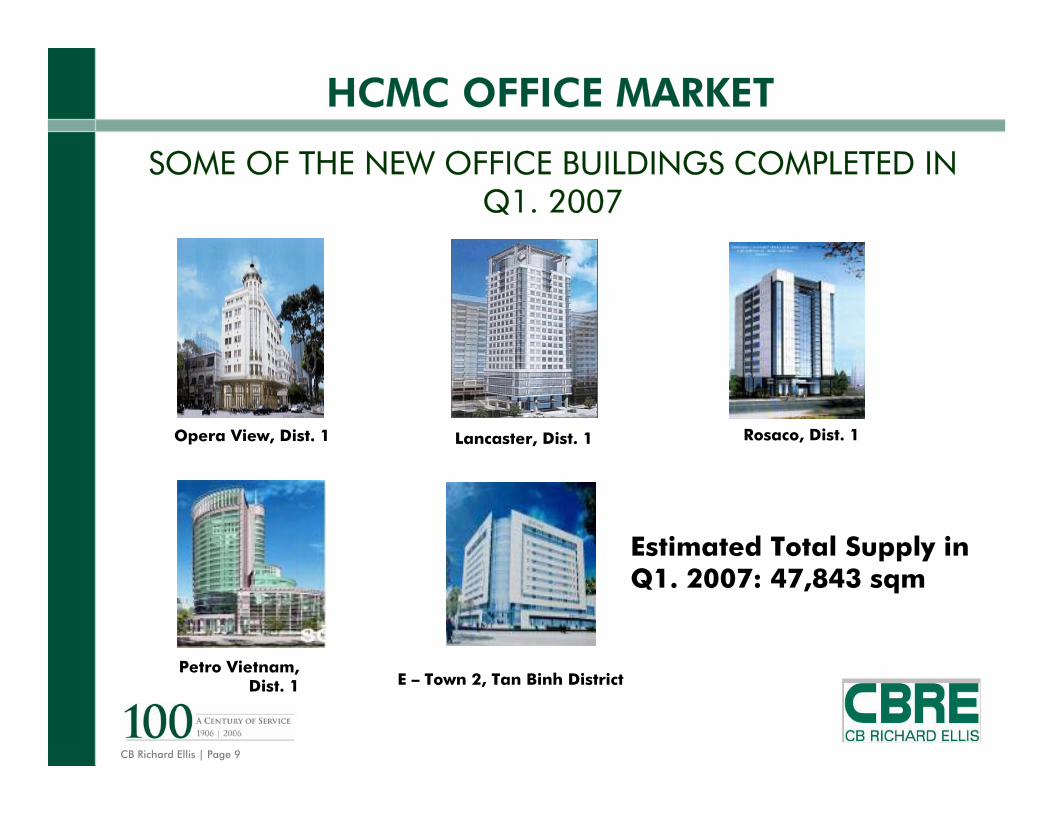
HCMC OFFICE MARKET
SOME OF THE NEW OFFICE BUILDINGS COMPLETED IN Q1. 2007
Opera View, Dist. 1 Lancaster, Dist. 1 Rosaco, Dist. 1
Petro Vietnam, Dist. 1 E – Town 2, Tan Binh District
Estimated Total Supply in Q1. 2007: 47,843 sqm

CB Richard Ellis | Page 10
Client Logo Goes Here
HCMC OFFICE MARKET
Take up and vacancy rate of HCMC office buildings
-2,000
4,0006,0008,000
10,00012,00014,000
16,00018,000
Q1.04 Q2.04 Q3.04 Q4.04 Q1.05 Q2.05 Q3.05 Q4.05 Q1.06 Q2.06 Q3.06 Q4.06
sqm
0.0%
1.0%
2.0%
3.0%
4.0%
5.0%
6.0%
7.0%
8.0%
%
Take-up (Sqm) Vacancy Rate (%)

CB Richard Ellis | Page 11
Client Logo Goes Here
HCMC OFFICE MARKET – Rental Rates
Rental growth of Grade A2006 - 2007
2329.5
Q1/2006 Q1/2007
*Note : Rents excluding S . C and VAT
uni t : US$growth rate 28%
Q1 - 2006 $23.00
Q1 - 2007 $29.50
Increase of 28%
Occupancy 100%

CB Richard Ellis | Page 12
Client Logo Goes Here
HCMC OFFICE MARKET – Rental Rates
Rental Growth of Grade B2006 - 2007
2126.5
Q1/2006 Q1/2007
* Note : rents e xcluding S .C and VAT
uni t :US$ growth rate 26%
Q1 - 2006 $21.00
Q1 - 2007 $26.50
Increase of 26%
Occupancy 99%
CB Richard Ellis | Page 13
Client Logo Goes Here
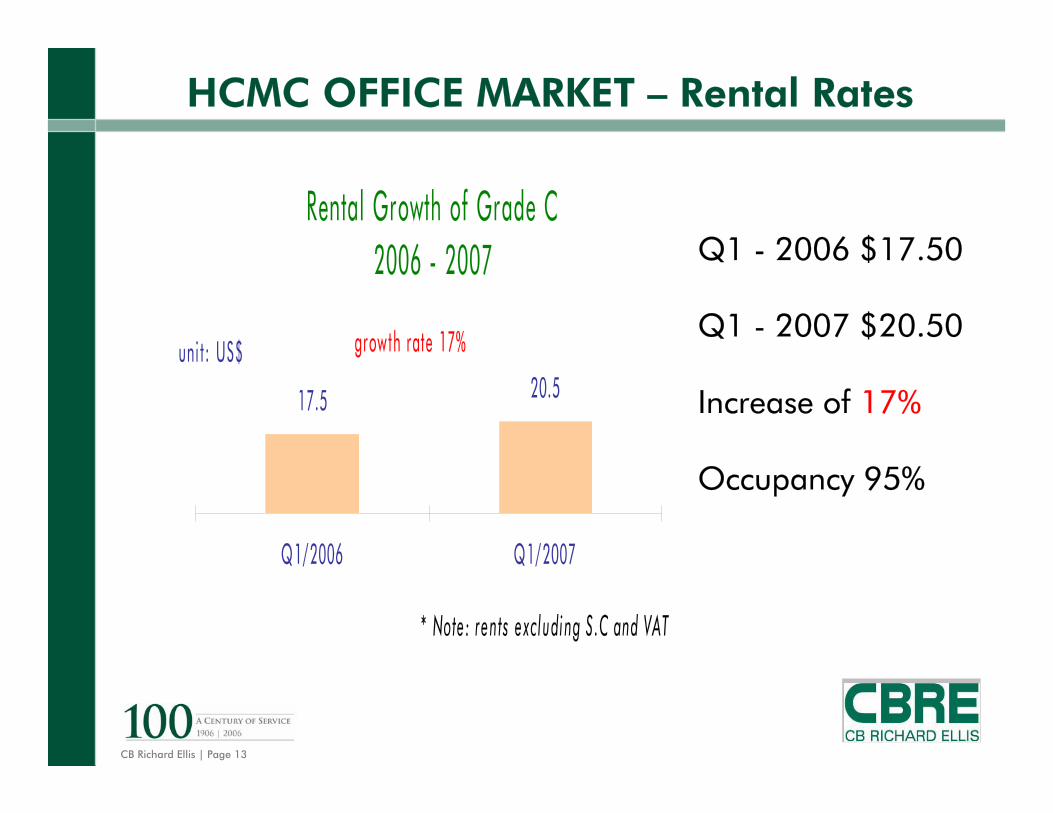
HCMC OFFICE MARKET – Rental Rates
Rental Growth of Grade C2006 - 2007
17.5 20.5
Q1/2006 Q1/2007
* Note : rents excluding S .C and VAT
uni t : US$ growth rate 17%
Q1 - 2006 $17.50
Q1 - 2007 $20.50
Increase of 17%
Occupancy 95%

CB Richard Ellis | Page 14
Client Logo Goes Here
HCMC OFFICE MARKET
Market Outlook in 2007:
Limited grade A office space still remains.
Some new supply of Grade B office space expected to come on line during 2007.
Factors driving demand: Strong economic growth, FDI growth, WTO access, new multi-national companies, expansion of existing multi-national companies, Vietnam companies upgrading, safety & quality Issues
Grade A office rental rates reflects upward momentum and growing demand vis-à-vis tight supply
Vacancy rate remains low, grade A (0%)and B (<1%)
180,657182008
187,824152009
273,146122010
800,42572TOTAL
158,798272007
Expected supply (sqm)
Supply of new grade A, B & C buildings
Expected year of
completion
CB Richard Ellis | Page 15
Client Logo Goes Here
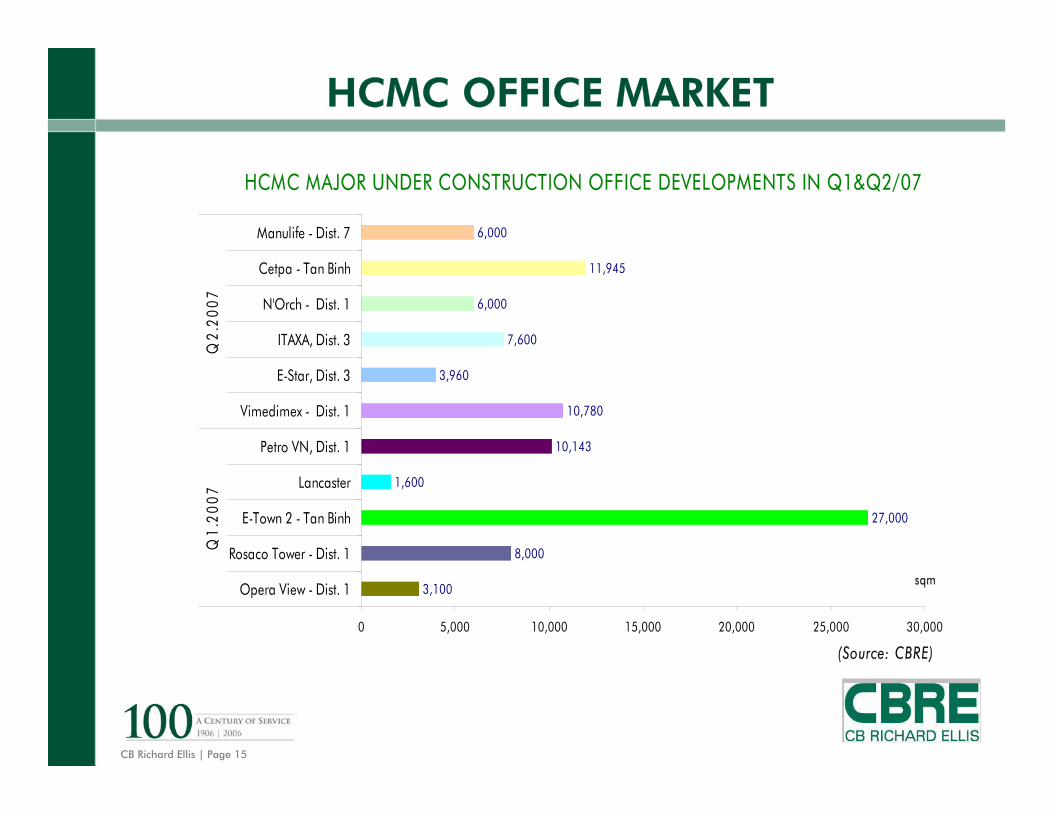
HCMC OFFICE MARKET
HCMC MAJOR UNDER CONSTRUCTION OFFICE DEVELOPMENTS IN Q1&Q2/07
3,100
8,000
27,000
1,600
10,143
10,780
3,960
7,600
6,000
11,945
6,000
0 5,000 10,000 15,000 20,000 25,000 30,000
Opera View - Dist. 1
Rosaco Tower - Dist. 1
E-Town 2 - Tan Binh
Lancaster
Petro VN, Dist. 1
Vimedimex - Dist. 1
E-Star, Dist. 3
ITAXA, Dist. 3
N'Orch - Dist. 1
Cetpa - Tan Binh
Manulife - Dist. 7Q
1.2
007
Q2.
200
7
(Source: CBRE)
sqm
CB Richard Ellis | Page 16
Client Logo Goes Here
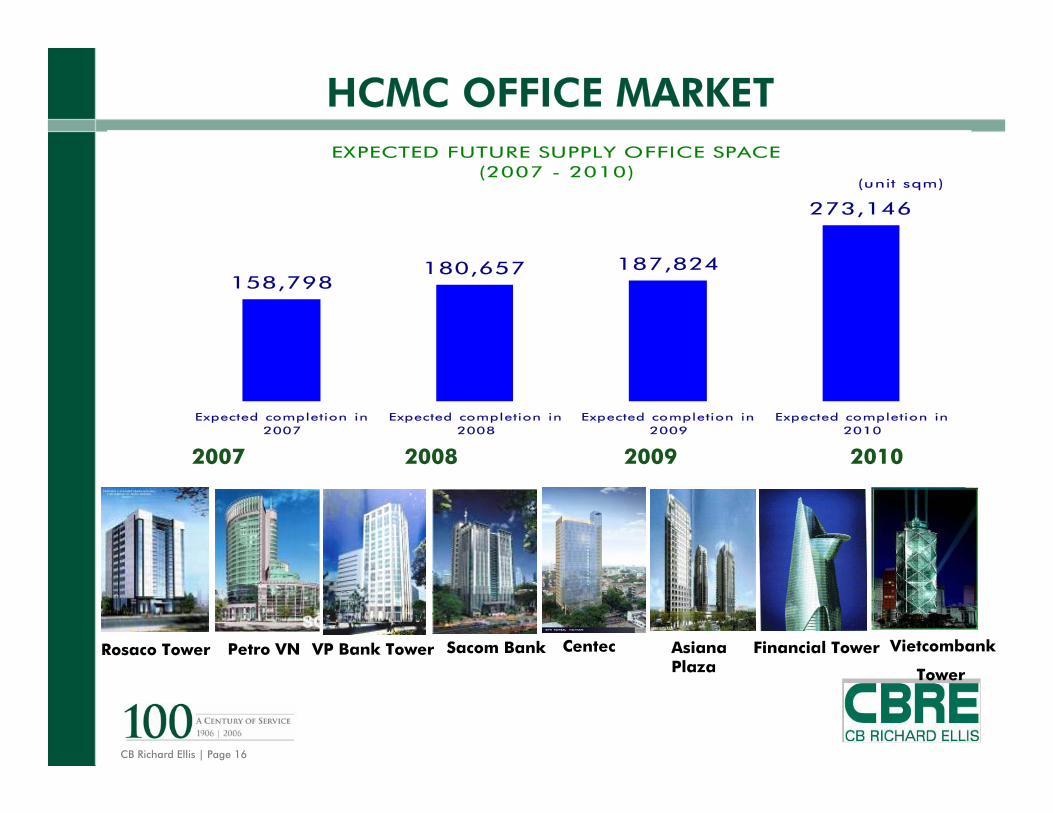
HCMC OFFICE MARKETEXPECTED FUTURE SUPPLY OFFICE SPACE
(2007 - 2010)
273,146
187,824180,657158,798
Expected completion in2007
Expected completion in2008
Expected completion in2009
Expected completion in2010
(unit sqm)
Rosaco Tower Petro VN VP Bank Tower Sacom Bank Centec Asiana Plaza
Financial Tower Vietcombank
Tower
2007 2008 2009 2010

CB Richard Ellis | Page 17
Client Logo Goes Here
THE MARKET’S TIMING – LARGER BUILDINGS
Bao Viet 20,000 sqm(owner occupied)
VPBank20,000 sqm(12,000 sqm for lease)
Times Square31,000 sqm
HCMC Power Head Office20,000 sqm(10,000 sqm for lease)
Centec25,000 sqm
Asiana Plaza32,000 sqm
Vietcombank77,000 sqm
Financial Tower100,000 sqm
M&C Tower35,000 sqm
2008 2009 2010
113,000 sqm 212,000 sqm
2010
2011Gemadept16,500 sqm(10,000 sqm for lease)
A & B25,000 sqm
2010
76,500 sqm(32,000 sqm for lease)

CB Richard Ellis | Page 18
Client Logo Goes Here
RESIDENTIAL CONDO HCMC
Number of Condos and Projects launched year-by-year
0
3,000
6,000
9,000
12,000
Co
nd
os
0
10
20
30
40
50
Pro
ject
s
Uni ts 648 0 0 0 150 0 0 124 1,234 3,418 7,644 10,37 11,47 7,270
Projects 1 0 0 0 1 0 0 1 3 16 27 42 33 9
1994 1995 1996 1997 1998 1999 2000 2001 2002 2003 2004 2005 2006 2007
CB Richard Ellis | Page 19
Client Logo Goes Here
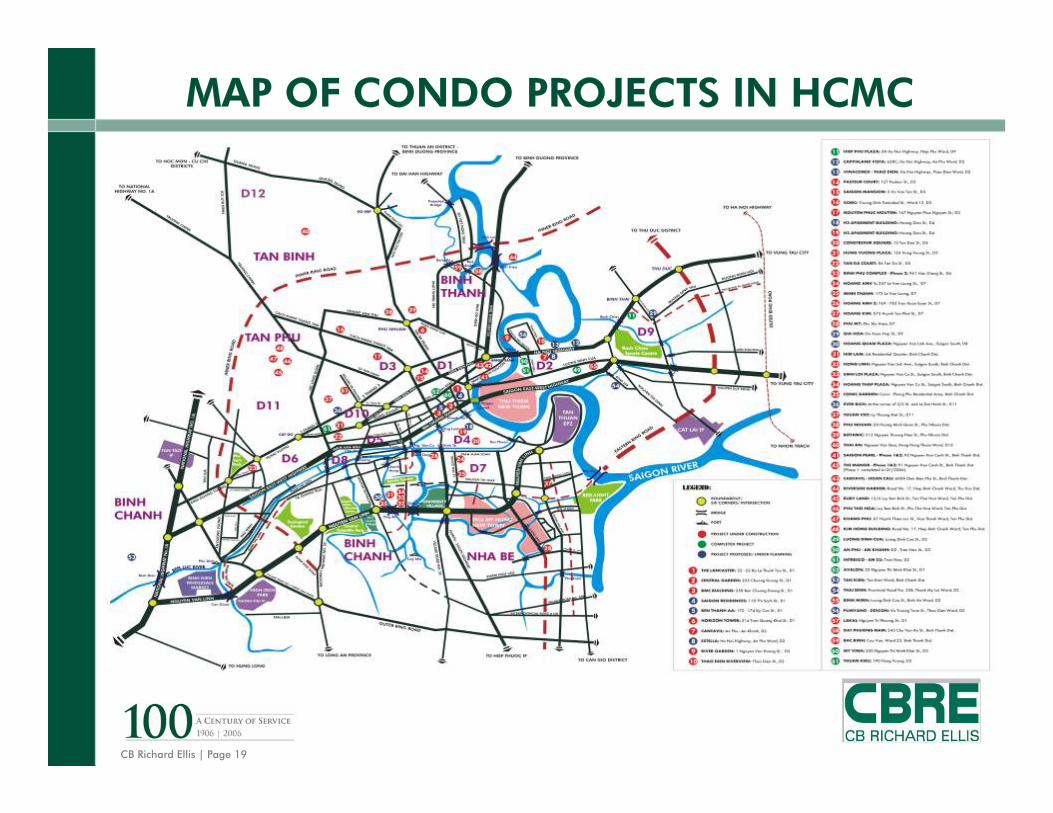
MAP OF CONDO PROJECTS IN HCMC

CB Richard Ellis | Page 20
Client Logo Goes Here
RESIDENTIAL CONDO HCMC
Completed Condominium Units year-by-year
0
500
1000
1500
2000
2500
Over US$2,000 141 252
US$1,501 - US$2,000 526
US$1,001 - US$1,500 97 66 270 405
US$600 - US$1,000 798 124 1,110 1,965 1,330
Less US$600 552 1,594 881
1999 2003 2004 2005 2006 Q1/07

CB Richard Ellis | Page 21
Client Logo Goes Here
RESIDENTIAL CONDO HCMC
Average Se l l ing P r i ce Change of T ypical High-end Condo P rojects in Dist r i c t 1
Indo china P ark T o wer
US$ 1800Indo china P ark
T o werUS$ 1,500
T he Lancaster US$ 3,450
T he Lancaster US$ 2,050
A valo n US$ 2,800
A valo n US$ 2,089
H o rizo n US$ 1,300H o rizo n
US 850
-
500
1,000
1,500
2,000
2,500
3,000
3,500
4,000
2003 2004 2005 Q1/ 06 Q2/ 06 Q3/ 06 Q4/ 06 Q1/ 07
CB Richard Ellis | Page 22
Client Logo Goes Here
RESIDENTIAL CONDO HCMC
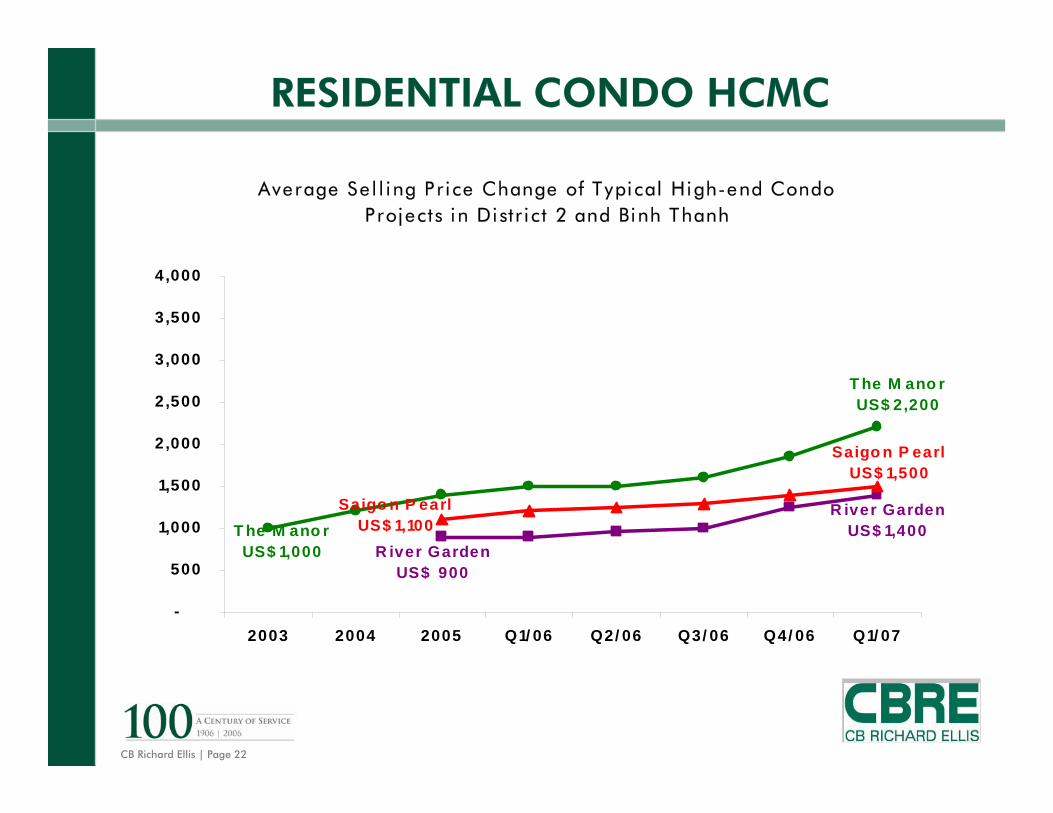
Average Se l l ing P r i ce Change of Typical High-end Condo P rojects in Di str i ct 2 and Binh Thanh
R iver Garden US$ 900
R iver Garden US$ 1,400
Saigo n P earl US$ 1,100
Saigo n P earl US$ 1,500
T he M ano r US$ 2,200
T he M ano r US$ 1,000
-
500
1,000
1,500
2,000
2,500
3,000
3,500
4,000
2003 2004 2005 Q1/ 06 Q2/ 06 Q3/ 06 Q4/ 06 Q1/ 07
CB Richard Ellis | Page 23
Client Logo Goes Here
RESIDENTIAL CONDO HCMC
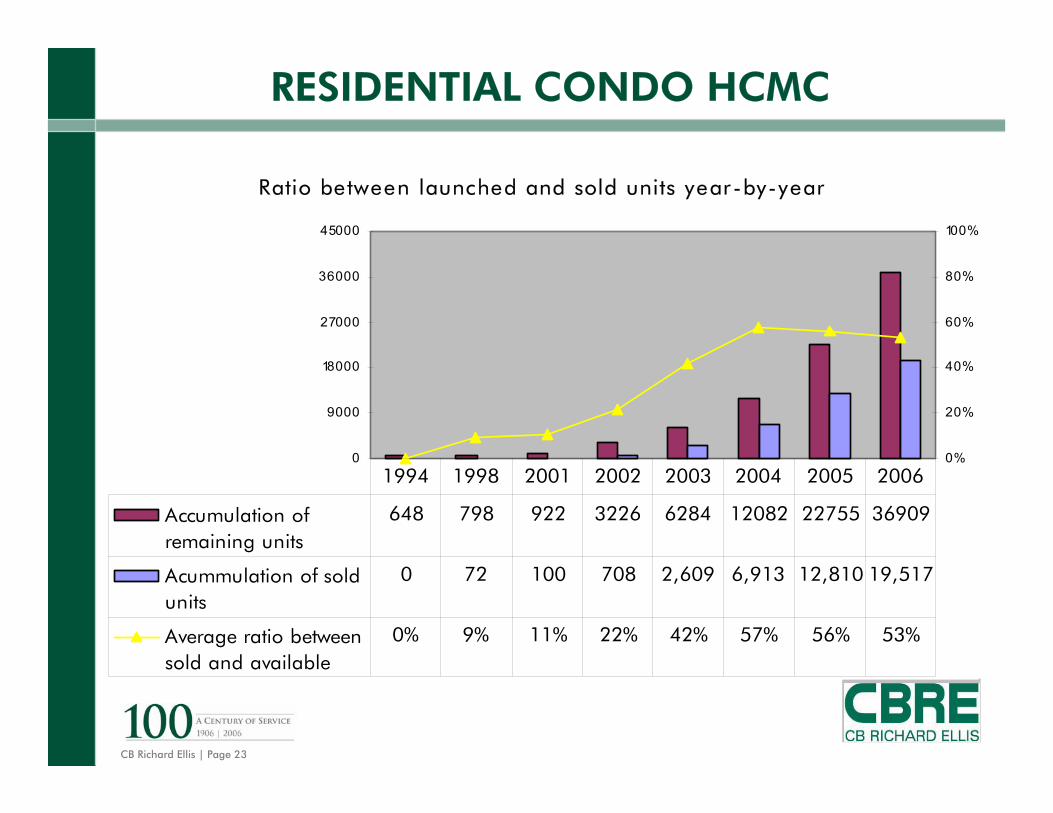
Ratio between launched and sold units year-by-year
0
9000
18000
27000
36000
45000
0%
20%
40%
60%
80%
100%
Accumulation ofremaining units
648 798 922 3226 6284 12082 22755 36909
Acummulation of soldunits
0 72 100 708 2,609 6,913 12,810 19,517
Average ratio betweensold and available
0% 9% 11% 22% 42% 57% 56% 53%
1994 1998 2001 2002 2003 2004 2005 2006
CB Richard Ellis | Page 24
Client Logo Goes Here
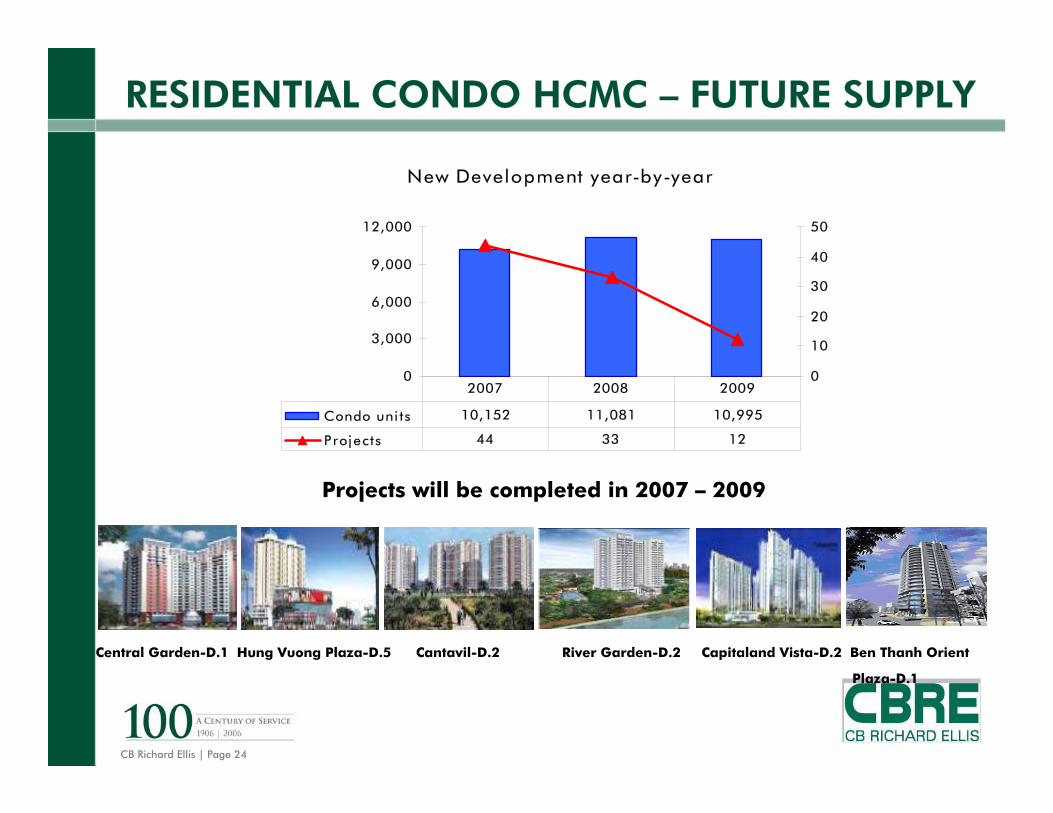
RESIDENTIAL CONDO HCMC – FUTURE SUPPLY
Projects will be completed in 2007 – 2009
Central Garden-D.1 Hung Vuong Plaza-D.5 Cantavil-D.2 River Garden-D.2 Capitaland Vista-D.2 Ben Thanh Orient
Plaza-D.1
New Development year-by-year
0
3,000
6,000
9,000
12,000
0
10
20
30
40
50
Condo uni ts 10,152 11,081 10,995
Projects 44 33 12
2007 2008 2009

CB Richard Ellis | Page 25
Client Logo Goes Here
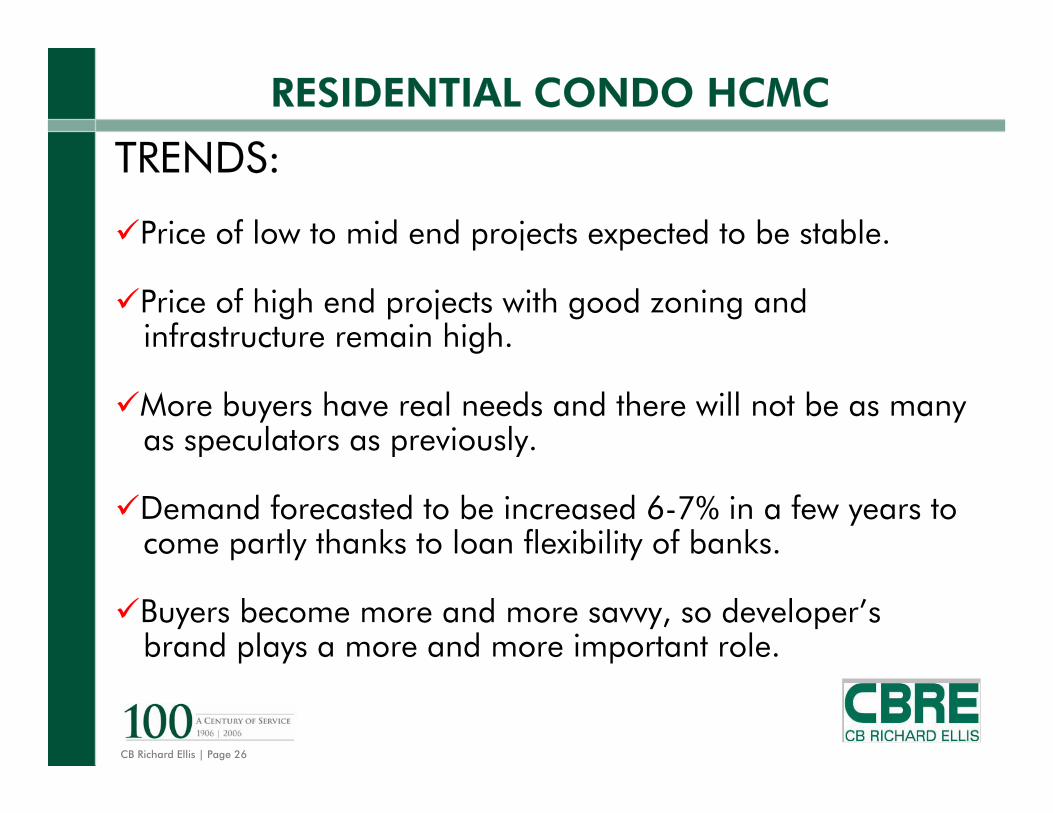
RESIDENTIAL CONDO HCMC
TRENDS:
New money flow from stock market into property.
Strong investment wave from Asia: Korea, Japan, Singapore. Keen on buying projects already licensed and under construction instead of leasing land, developing from the beginning.
Hot market with more money from foreign institutional and individual investors activated by Land Law effective from 1 Jul 06 and Property Trading Law from 1 Jan 07.
With encouraging Government policies, more developers investing in low income projects.
CB Richard Ellis | Page 26
Client Logo Goes Here
RESIDENTIAL CONDO HCMC
TRENDS:
Price of low to mid end projects expected to be stable.
Price of high end projects with good zoning and infrastructure remain high.
More buyers have real needs and there will not be as many as speculators as previously.
Demand forecasted to be increased 6-7% in a few years to come partly thanks to loan flexibility of banks.
Buyers become more and more savvy, so developer’s brand plays a more and more important role.
CB Richard Ellis | Page 27
Client Logo Goes Here
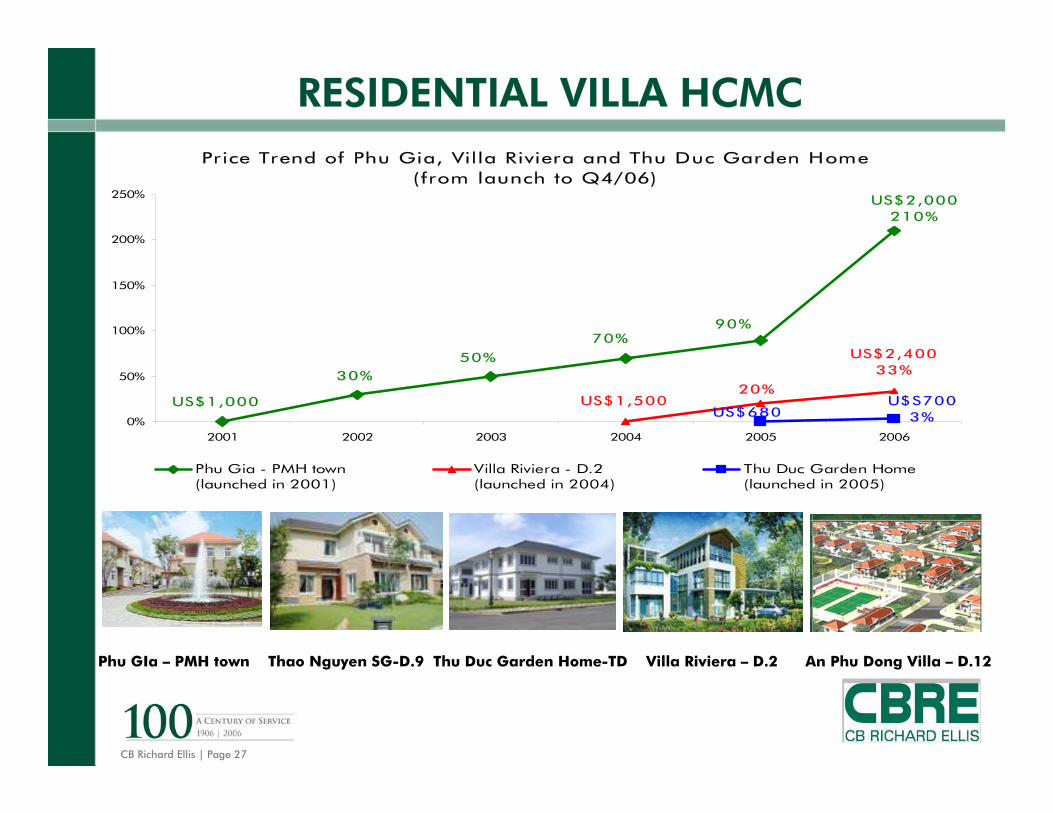
RESIDENTIAL VILLA HCMC
Phu GIa – PMH town Thao Nguyen SG-D.9 Thu Duc Garden Home-TD Villa Riviera – D.2 An Phu Dong Villa – D.12
Price Trend of Phu Gia, Villa Riviera and Thu Duc Garden Home (from launch to Q4/06)
US$1,000
30%
US$2,000210%
90%70%
50%
US$1,500
US$2,40033%
20%
US$680U$S700
3%0%
50%
100%
150%
200%
250%
2001 2002 2003 2004 2005 2006
Phu Gia - PMH town(launched in 2001)
Villa Riviera - D.2(launched in 2004)
Thu Duc Garden Home (launched in 2005)
CB Richard Ellis | Page 28
Client Logo Goes Here
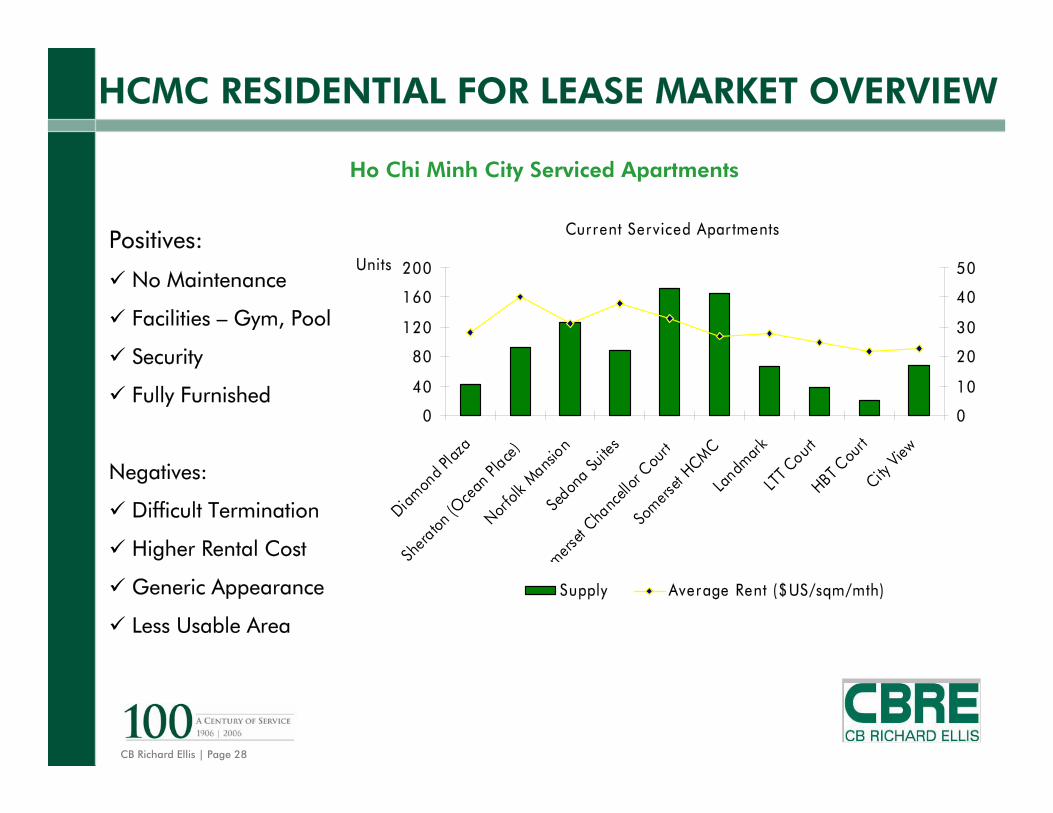
HCMC RESIDENTIAL FOR LEASE MARKET OVERVIEW
Ho Chi Minh City Serviced Apartments
Positives:
No Maintenance
Facilities – Gym, Pool
Security
Fully Furnished
Negatives:
Difficult Termination
Higher Rental Cost
Generic Appearance
Less Usable Area
Current Serviced Apar tments
0
40
80
120
160
200
Diamon
d Plaz
a
Shera
ton (O
cean
Place
)
Norfol
k Mans
ionSe
dona Su
ites
Somers
et Cha
ncell
or C
ourt
Somers
et HCMC
Landm
ark
LTT C
ourtHBT C
ourt
City Vi
ew
Units
0
10
20
30
40
50
Supply Average Rent ($US/sqm/mth)

CB Richard Ellis | Page 29
Client Logo Goes Here
District 1 & 3Highest demand for serviced apartmentsVery limited supply, especially for International quality projects. There are 7 grade A serviced apartment projects provide over 500 units from 1 to 4 bedrooms. Average occupancy rate is now 96% (both grade A and B) with most marketable size of 1 & 2 bedrooms, from 50 – 80 sqmThe rent for most of the serviced apartments are up by 10 –20%, from US$22 to US$31 per sqm per month in January 2006 to US$25 to US$35 in December 2006Due to the limited supply and growing demand, rent are expected to keep rising during 2007.
RESIDENTIAL FOR LEASE HCMC

CB Richard Ellis | Page 30
Client Logo Goes Here
RESIDENTIAL FOR LEASE HCMC
An Phu, An Khanh, District 2 Still an attractive area for tenants with family
Limited good quality villas and serviced apartments
Few new developing projects in apartments and gated compound (River View and River Garden)
Average rent of US$2,500 to 3,500 per month. With a 15% - 20% increase in rental prices within the past year.
CB Richard Ellis | Page 31
Client Logo Goes Here
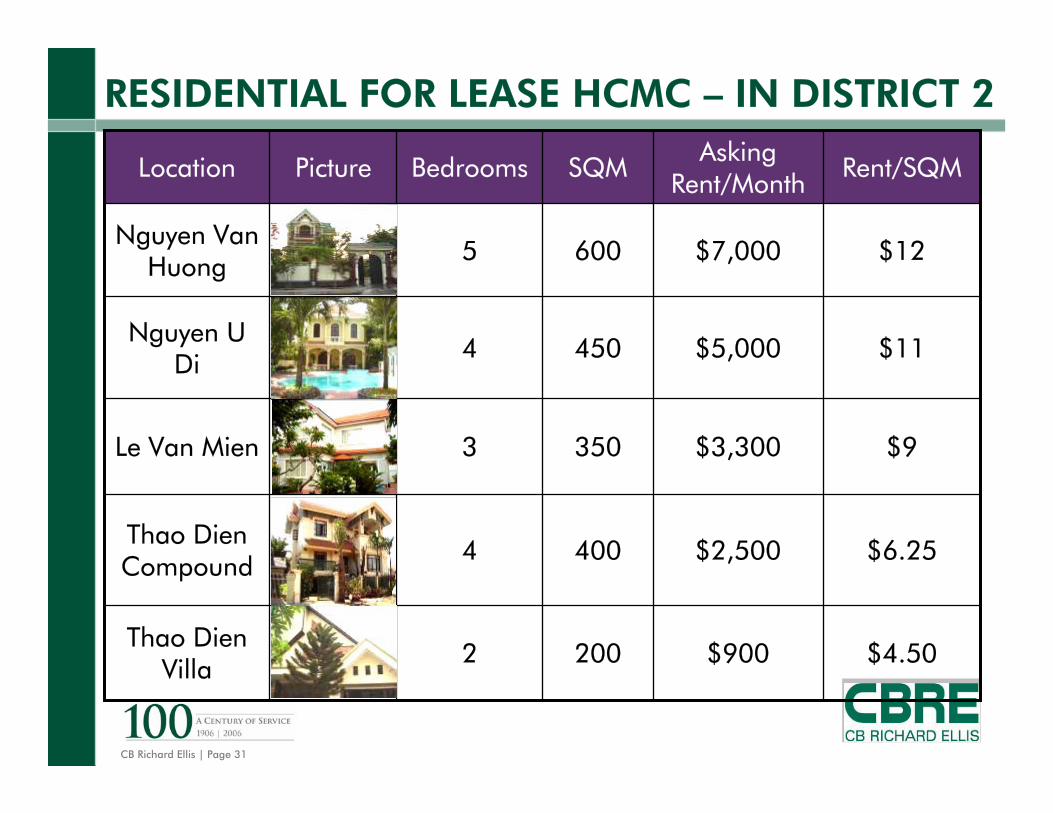
RESIDENTIAL FOR LEASE HCMC – IN DISTRICT 2
$11$5,0004504Nguyen U
Di
$4.50$9002002Thao Dien
Villa
$6.25$2,5004004Thao Dien Compound
$9$3,3003503Le Van Mien
$12$7,0006005Nguyen Van
Huong
Rent/SQMAsking Rent/Month
SQMBedroomsPictureLocation

CB Richard Ellis | Page 32
Client Logo Goes Here
RESIDENTIAL FOR LEASE HCMC - 2007 NEW SUPPLY
1,160
11,300
3,300
27,531
Total sqm
10 – 12
11 - 20
30 - 38
21 - 32
Target Rent$/sqm/mth
Unit types
No of Units
CompletionLocationProject
4-5 bdrs11January 2007
Saigon Queen VillaNguyen Van
Huong, An Phu, District 2,
15 minutes to CBD
1-4 bdrs100February 2007
Green HillsLot 25, Quang Trung Software
Park, District 12, 40 minutes to CBD
1-3 bdrs40 - 50February/ March 2007
The LancasterLe Thanh Ton
Street, District 1, CBD
2-4 bdrs228February/March
2007
Pasteur CourtPasteur Street,
District 3, 5 minutes to CBD
CB Richard Ellis | Page 33
Client Logo Goes Here
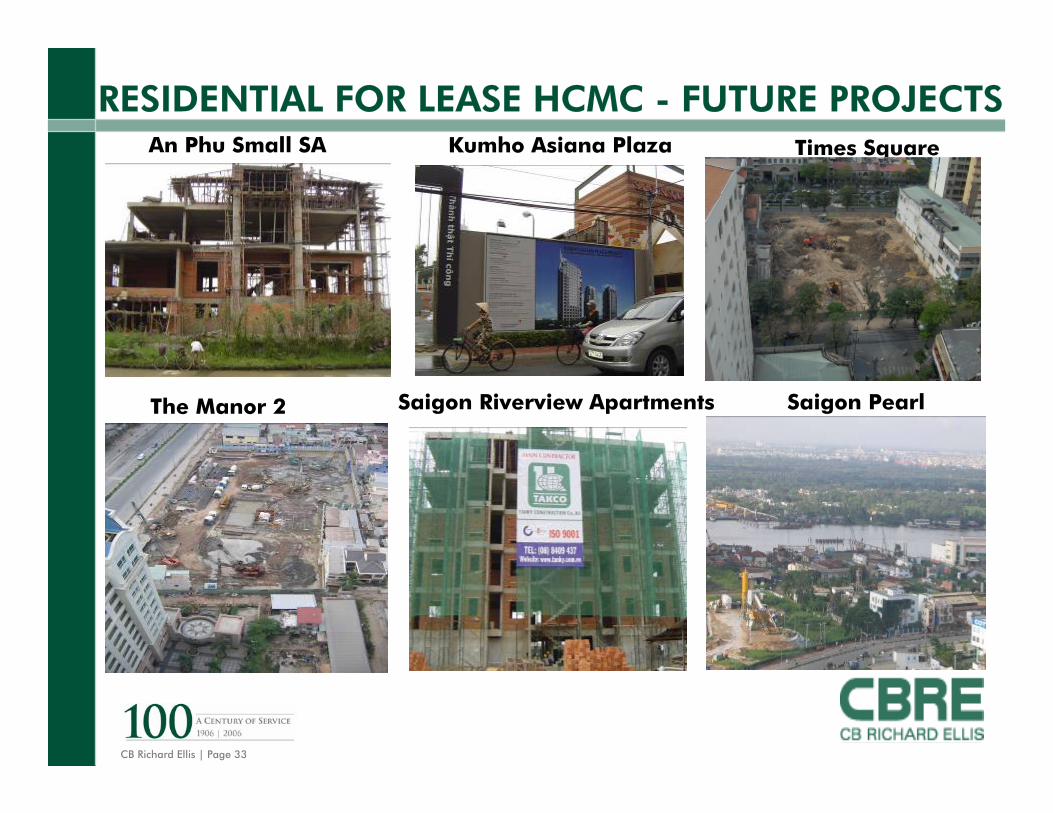
An Phu Small SA
The Manor 2
Kumho Asiana Plaza Times Square
Saigon Riverview Apartments Saigon Pearl
RESIDENTIAL FOR LEASE HCMC - FUTURE PROJECTS

CB Richard Ellis | Page 34
Client Logo Goes Here
VN STOCK MARKET
VN Index from 18 July 2000 to 27 February 2007

CB Richard Ellis | Page 35
Client Logo Goes Here
VN STOCK MARKET
0
200
400
600
800
1000
2000 2007
VN index
28/7/2000:2 listed companies - VN Index: 100 – Daily turnover Avg. $45m
27/2/2007:107 listed companies & 2 funds- VN Index: 1167.36 - Market capitalisation:$15b
VN Index: increased by 9.5 times
0
2,000
4,000
6,000
8,000
10,000
12,000
14,000
16,000
2000 2007
Market cap
Market cap: increased by 300 times
CB Richard Ellis | Page 36
Client Logo Goes Here
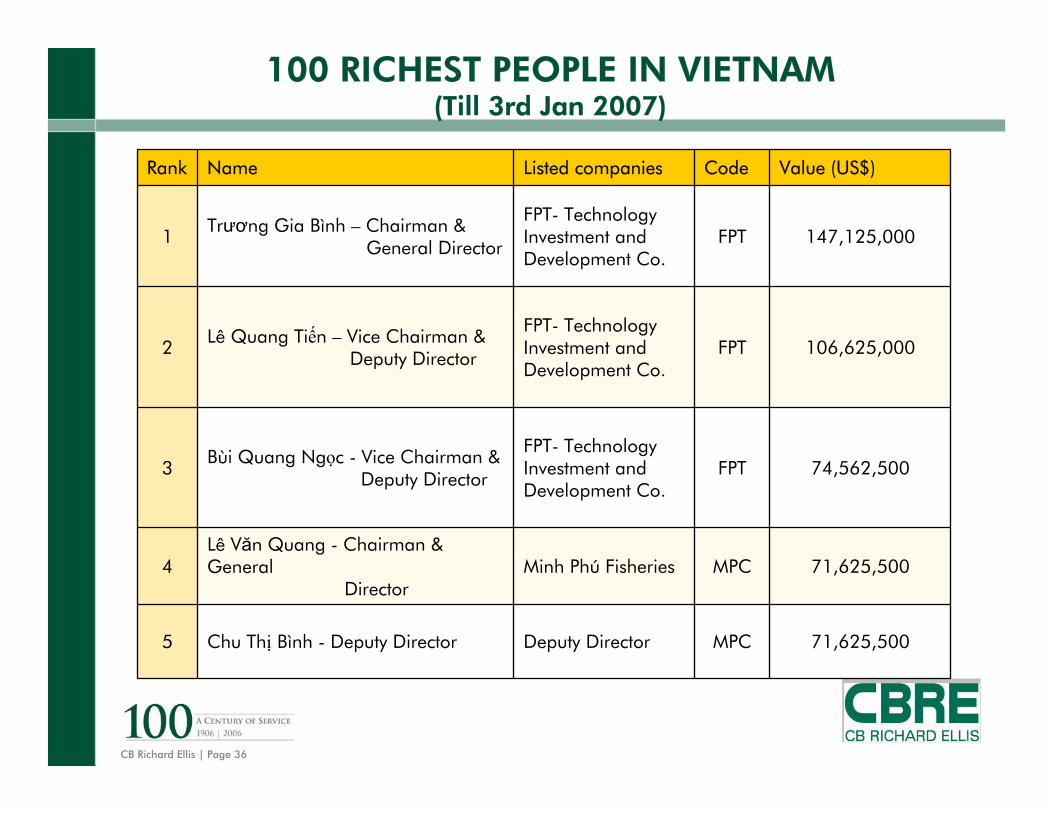
100 RICHEST PEOPLE IN VIETNAM (Till 3rd Jan 2007)
71,625,500MPCDeputy DirectorChu Thị Bình - Deputy Director5
71,625,500MPCMinh Phú FisheriesLê Văn Quang - Chairman & General
Director4
74,562,500FPTFPT- Technology Investment and Development Co.
Bùi Quang Ngọc - Vice Chairman & Deputy Director
3
106,625,000FPTFPT- Technology Investment and Development Co.
Lê Quang Tiến – Vice Chairman & Deputy Director2
147,125,000 FPTFPT- Technology Investment and Development Co.
Trương Gia Bình – Chairman & General Director
1
Value (US$)CodeListed companiesName Rank
CB Richard Ellis | Page 37
Client Logo Goes Here
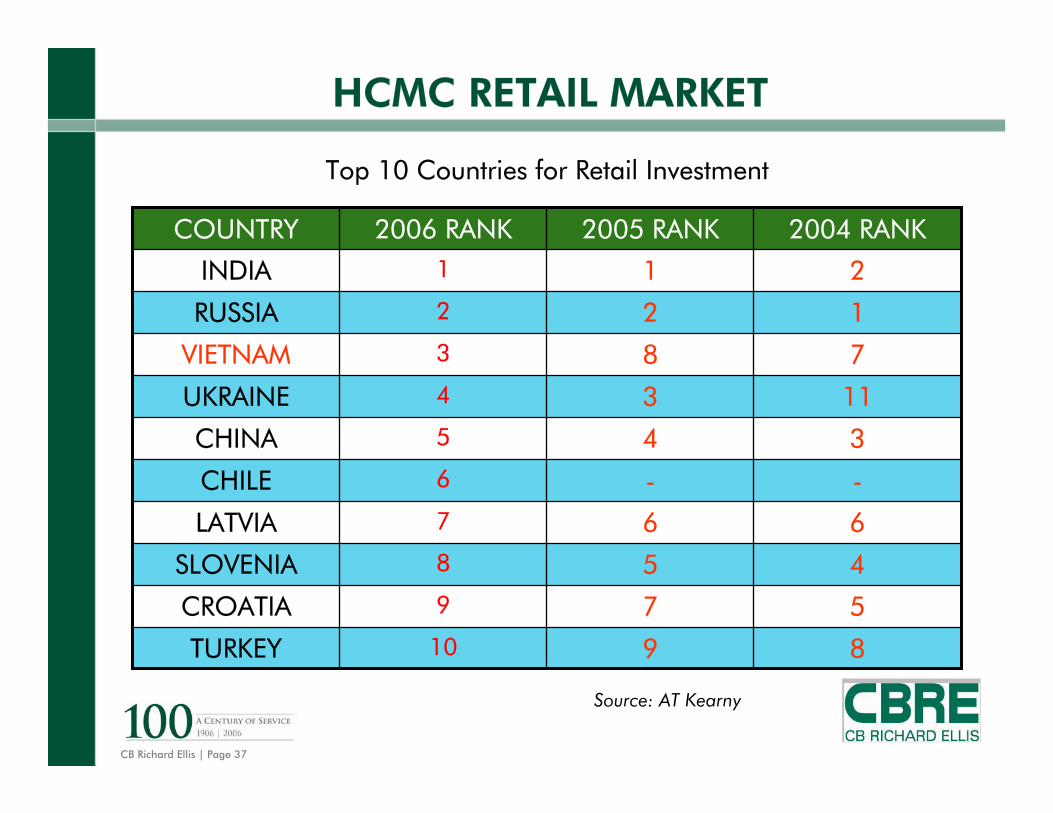
HCMC RETAIL MARKET
2004 RANK2005 RANK2006 RANKCOUNTRY
8910TURKEY
579CROATIA
458SLOVENIA
667LATVIA
--6CHILE
345CHINA
1134UKRAINE
783VIETNAM
122RUSSIA
211INDIA
Source: AT Kearny
Top 10 Countries for Retail Investment

CB Richard Ellis | Page 38
Client Logo Goes Here
HCMC RETAIL MARKET
HCMC Shopping Centre Existing Supply
6,252
5,700
8,000
1,366
6,810
21,797
17,000
14,670
18,000
5,000
5,000
Saigon CentreDist. 1
Saigon SuperbowlTan Binh
Diamond PlazaDist. 1
Lucky PlazaDist. 1
Zen PlazaDist. 1
Thuan Kieu PlazaDist. 5
ParksonDist. 1
Tax PlazaDist. 1
An Dong PlazaDist. 5
Saigon Square
Eden MallDist. 1
19
96
19
99
20
00
20
02
20
03
20
04
20
06
(Source: CB Richard Ellis)

CB Richard Ellis | Page 39
Client Logo Goes Here
HCMC RETAIL MARKET
AVERAGE OCCUPANCY & RENTAL RATESOF HCMC CBD RETAIL CENTRES
0%
20%
40%
60%
80%
100%
%
$0
$30
$60
$90
$120
$150
CBD prime occupancy rate 100% 100% 100% 100% 98% 95% 95% 95% 94% 100% 100%
CBD prime average rents $32.40 $32.40 $32.40 $35.33 $36.67 $39.95 $43.03 $45.11 $49.21 $59.68 $80.00
1996 1997 1998 1999 2000 2001 2002 2003 2004 2005 2006

CB Richard Ellis | Page 40
Client Logo Goes Here
HCMC RETAIL MARKET
unit: US$/sqm/month
COMP AR IS ON OF R ET AIL R ENT S IN CIT IE S IN S OUT H E AS T AS IA
727
560
290
191
185
133
70
80
48
20
Hong Kong
Bangkok
S ingapore
Taipei
Shanghai
Beijing
Jakarta
Ho Chi Minh City
New Delhi
Manila
(Source: CBR E)
CB Richard Ellis | Page 41
Client Logo Goes Here
HCMC RETAIL MARKET
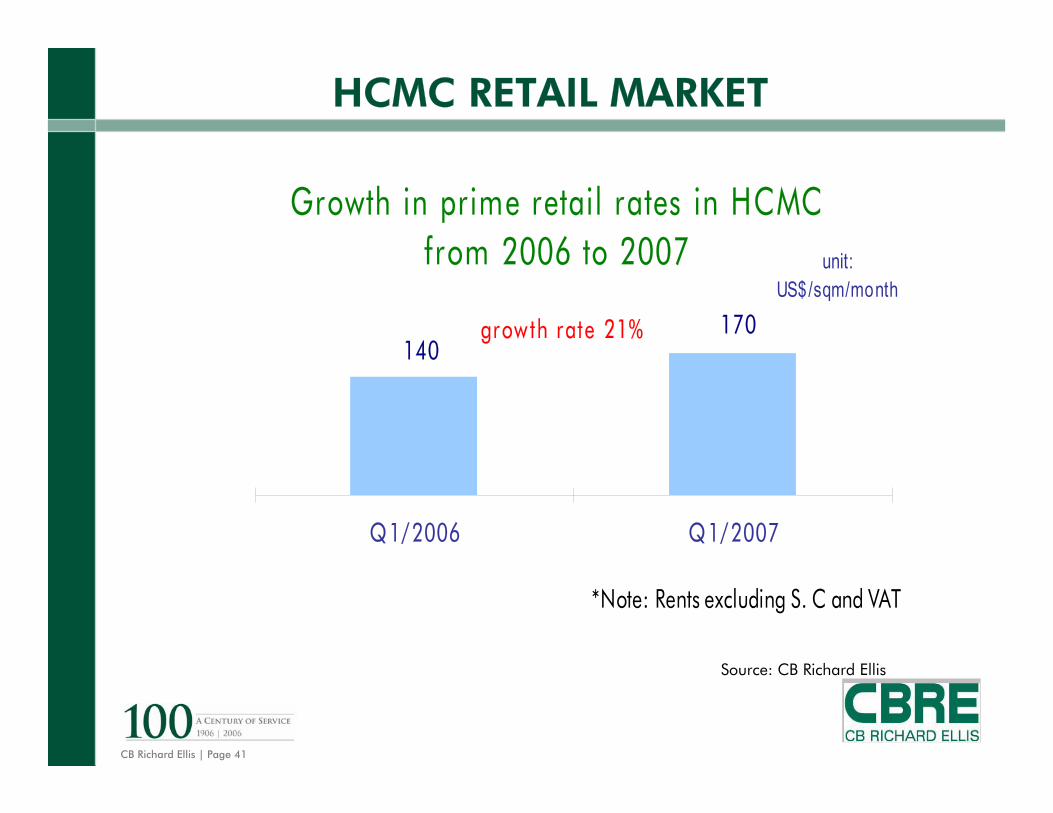
Source: CB Richard Ellis
Growth in prime retail rates in HCMCfrom 2006 to 2007
140170
Q1/2006 Q1/2007
*Note: Rents excluding S. C and VAT
unit: US$/sqm/month
growth rate 21%
CB Richard Ellis | Page 42
Client Logo Goes Here
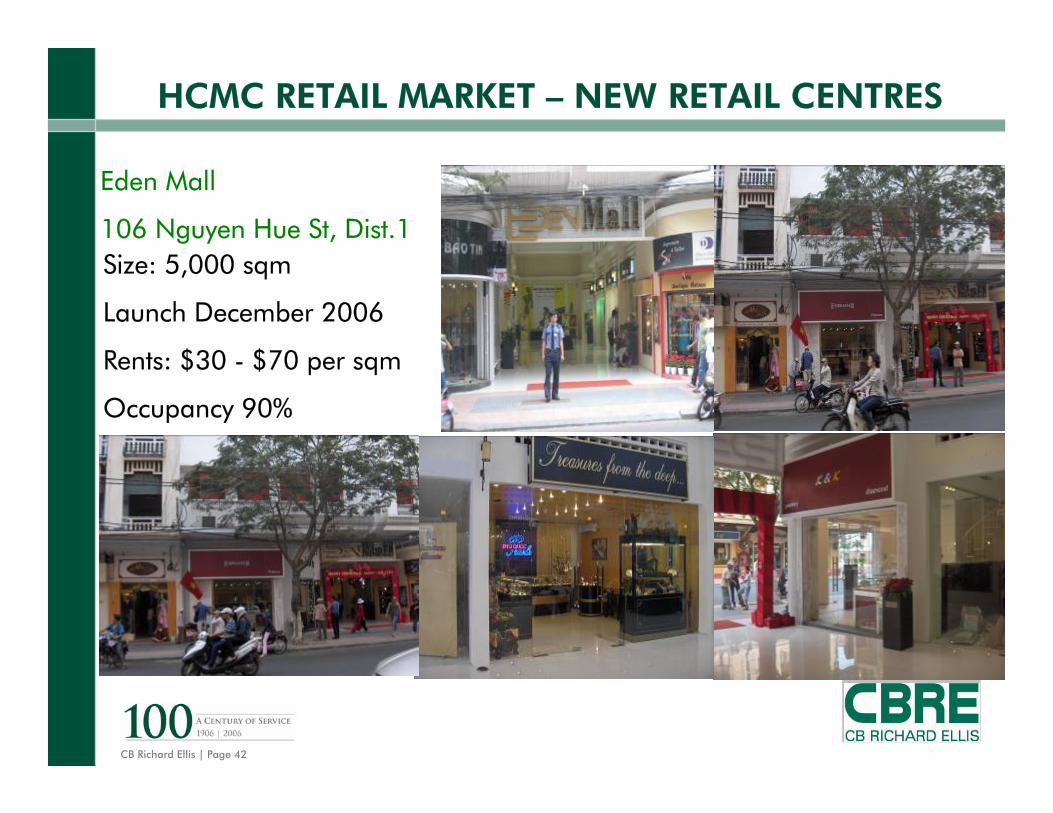
Eden Mall
106 Nguyen Hue St, Dist.1Size: 5,000 sqm
Launch December 2006
Rents: $30 - $70 per sqm
Occupancy 90%
HCMC RETAIL MARKET – NEW RETAIL CENTRES

CB Richard Ellis | Page 43
Client Logo Goes Here
HCMC RETAIL MARKET – NEW RETAIL CENTRES
SAIGON SQUARE
3 Le Van Huu, Dist. 1
Launch January 2007
Size: 5,000 sqm
Rents: 66 - $100 per sqm
Occupancy 100%

CB Richard Ellis | Page 44
Client Logo Goes Here
HCMC RETAIL MARKET – FUTURE SUPPLY
HCMC Future Supply
1,280
4,300
15,000
33,000
2,560
12,367
11,882
6,880
8,292
30,000
Opera ViewDist. 1
Tan Da CourtDist. 5
Saigon ParagonDist. 7
Hung Vuong PlazaDist. 5
Sailing TowerDist. 1
Times SquareDist. 1
Happiness SquareDist. 5
Kumho AsianaDist. 1
SJC TowerDist. 1
Saigon PearlBinh Thanh
20
07
20
08
20
09
20
10
(Sou rce : CBRE)
sqm

CB Richard Ellis | Page 45
Client Logo Goes Here
HCMC RETAIL MARKET – FUTURE SUPPLYCOMING NEXT IN EARLY 2007
OPERA VIEW – 161 – 167 Dong Khoi, Dist. 1
Retail GFA: 1,280 sqm
Rents: US$80 to US$130 per sqm
Occupancy: 100%
Major tenant: Louis Vuitton
CB Richard Ellis | Page 46
Client Logo Goes Here
HCMC RETAIL MARKET – FUTURE SUPPLY
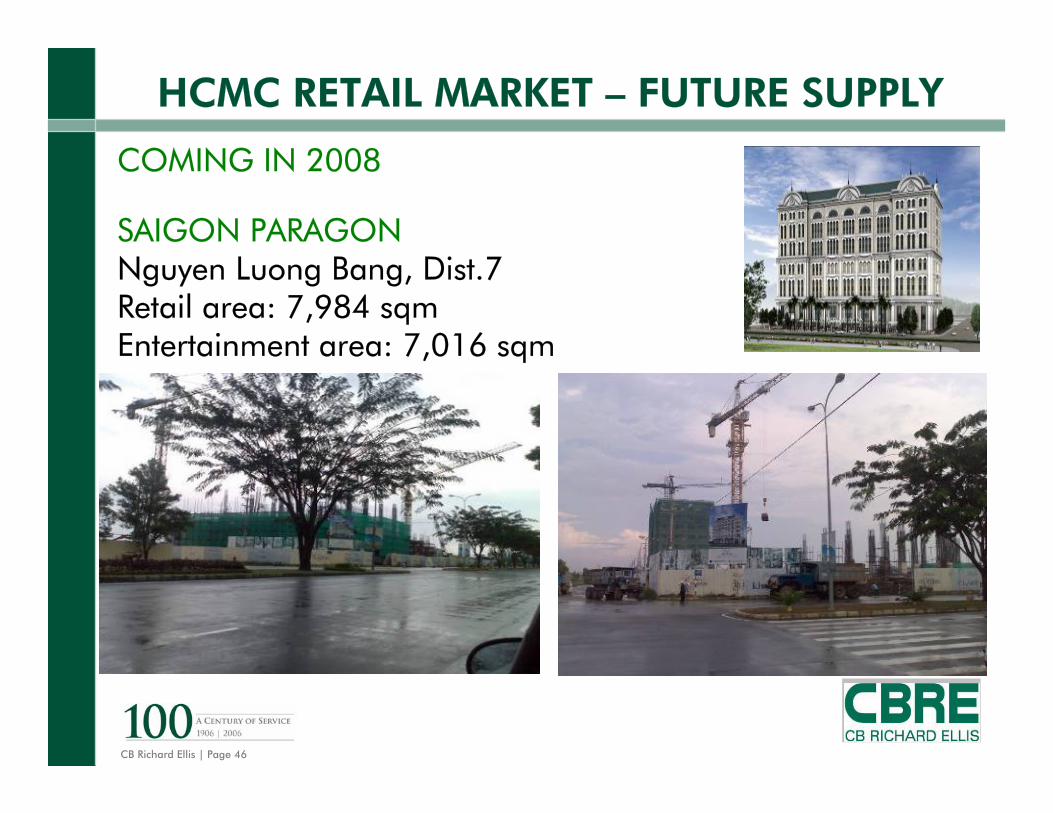
COMING IN 2008
SAIGON PARAGONNguyen Luong Bang, Dist.7Retail area: 7,984 sqmEntertainment area: 7,016 sqm
CB Richard Ellis | Page 47
Client Logo Goes Here
HCMC RETAIL MARKET – FUTURE SUPPLY
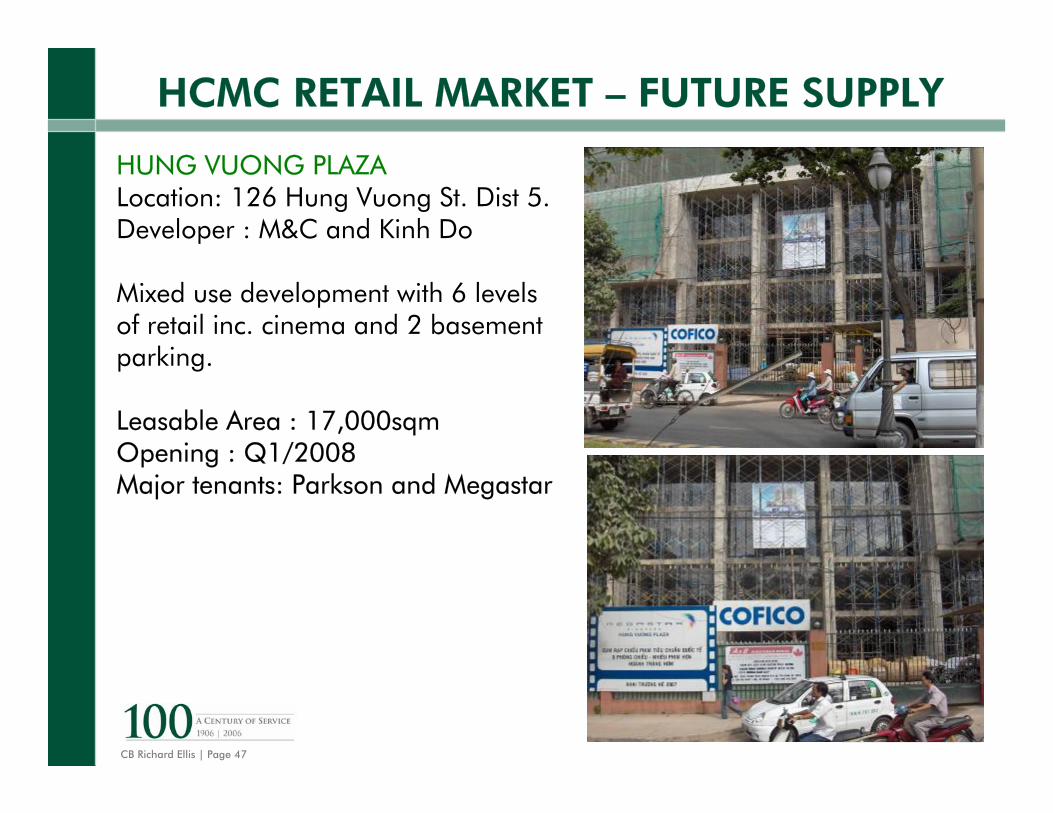
HUNG VUONG PLAZALocation: 126 Hung Vuong St. Dist 5.Developer : M&C and Kinh Do
Mixed use development with 6 levels of retail inc. cinema and 2 basement parking.
Leasable Area : 17,000sqmOpening : Q1/2008Major tenants: Parkson and Megastar

CB Richard Ellis | Page 48
Client Logo Goes Here
Hotel Market HCMC
416,785 TOTAL
83231,903 3 - star
18181,447 4 - star
344 103,435 5 – star
ROOMSPER
HOTELHOTELSROOMSHOTEL
HOTELS FROM FIVE TO THREE STARS, 2006
(Source: CBRE)
No. of No. of HotelsHotels
No. of No. of RoomsRooms
57.50%17.50%
25.00%
28.05%
21.33%
50.63%
5 – star 4 - star 3 - star

CB Richard Ellis | Page 49
Client Logo Goes Here
Hotel Market HCMC
0.00
20.00
40.00
60.00
80.00
100.00
120.00
140.00
5 star 108.00 128.20
4 star 80.00 94.96
3 star 45.00 53.42
2005 2006(Est.)
AVERAGE ROOM RATE (US$), 2005-2006
Average % Increase from 2005
5 Star - 15.76%4 Star - 15.75%3 Star - 15.79%
D1 5 Star Hotel Rates on average range from: $77 -$165 per night
CB Richard Ellis | Page 50
Client Logo Goes Here
Hotel Market HCMC
68.00%
70.00%
72.00%
74.00%
76.00%
78.00%
80.00%
82.00%
84.00%
5 star
4 star
3 star
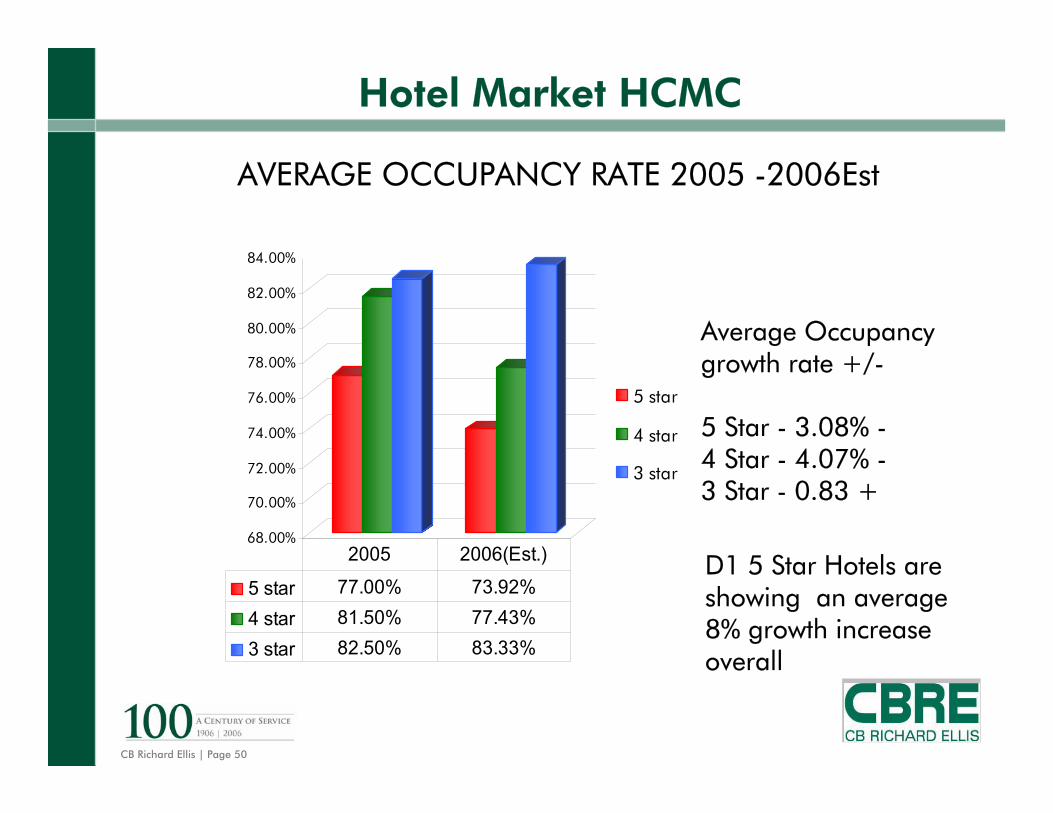
5 star 77.00% 73.92%4 star 81.50% 77.43%3 star 82.50% 83.33%
2005 2006(Est.)
AVERAGE OCCUPANCY RATE 2005 -2006Est
Average Occupancy growth rate +/-
5 Star - 3.08% -4 Star - 4.07% -3 Star - 0.83 +
D1 5 Star Hotels are showing an average 8% growth increase overall

CB Richard Ellis | Page 51
Client Logo Goes Here
Hotel Market HCMC
-20.00%
-10.00%
0.00%
10.00%
20.00%
30.00%
40.00%
50.00%
60.00%
70.00%
80.00%
-20.00%
-10.00%
0.00%
10.00%
20.00%
30.00%
40.00%
50.00%
60.00%
70.00%
80.00%
VN - Domestic 12.00% 4.46% 11.11% 3.85% 7.41% 11.03% 8.70% 5.71%
VN - International 20.11% 8.91% 12.76% -7.56% 20.51% 18.44% 3.81% 22.22%
HCMC - Domestic -0.12% 73.35% 6.91% 22.00% 30.39% 20.00% 26.67% 18.42%
HCMC - International 72.55% 12.99% 16.85% -9.14% 21.35% 26.58% 17.50% 12.77%
2000 2001 2002 2003 2004 2005 2006 2007P
International Tourist arrivals up 350,000 from 2005
Growth down from 2006 by 9.08 %

CB Richard Ellis | Page 52
Client Logo Goes Here
Hotel Market HCMC
776
692
519
80
- 1,000 2,000 3,000 4,000 5,000 6,000 7,000 8,000
2007F
2008F
2009F
2010F
Existing Supply New Supply
Times Square, Saigon Happiness
2010F
Asiana Plaza and International Trade Centre (Tax Plaza)
2009F
Grand, Majestic, Continental, Majestic Upgrade. In PMH District 7 of Saigon Tourist
2008F
Rex Upgrade 2007F
DEVELOPMENTYEAR
EXISTING AND FUTURE SUPPLY OF 4 AND 5EXISTING AND FUTURE SUPPLY OF 4 AND 5--STAR ROOMSSTAR ROOMS
CB Richard Ellis | Page 53
HANOI OFFICE MARKET
Supply - Demand
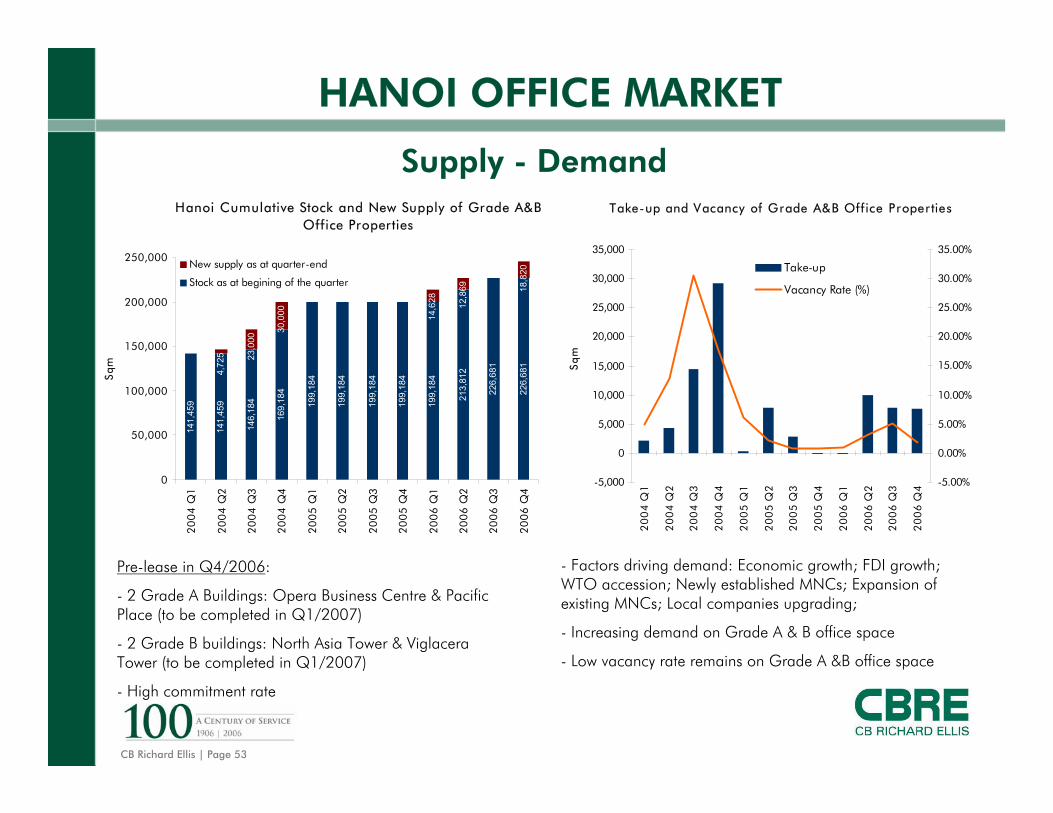
Pre-lease in Q4/2006:
- 2 Grade A Buildings: Opera Business Centre & Pacific Place (to be completed in Q1/2007)
- 2 Grade B buildings: North Asia Tower & ViglaceraTower (to be completed in Q1/2007)
- High commitment rate
- Factors driving demand: Economic growth; FDI growth; WTO accession; Newly established MNCs; Expansion of existing MNCs; Local companies upgrading;
- Increasing demand on Grade A & B office space
- Low vacancy rate remains on Grade A &B office space
Take-up and Vacancy of Grade A&B Off ice Proper ties
-5,000
0
5,000
10,000
15,000
20,000
25,000
30,000
35,000
20
04
Q1
20
04
Q2
20
04
Q3
20
04
Q4
20
05
Q1
20
05
Q2
20
05
Q3
20
05
Q4
20
06
Q1
20
06
Q2
20
06
Q3
20
06
Q4
Sq
m
-5.00%
0.00%
5.00%
10.00%
15.00%
20.00%
25.00%
30.00%
35.00%
Take-up
Vacancy Rate (%)
Hanoi Cumulative Stock and New Supply of Grade A&B Office Properties
141,
459
141,
459
146,
184
169,
184
199,
184
199,
184
199,
184
199,
184
199,
184
213,
812
226,
681
226,
681
4,72
5 23,0
00
30,0
00 14,6
28 12,8
69 18,8
20
0
50,000
100,000
150,000
200,000
250,000
20
04
Q1
20
04
Q2
20
04
Q3
20
04
Q4
20
05
Q1
20
05
Q2
20
05
Q3
20
05
Q4
20
06
Q1
20
06
Q2
20
06
Q3
20
06
Q4
Sq
m
New supply as at quarter-end
Stock as at begining of the quarter

CB Richard Ellis | Page 54
HANOI OFFICE MARKET
Rental
Q3-Q4/2006: Sharp increase in Grade A & Grade B office rentals
- Grade A Office: 9.5% and 7.5% increase q-o-q, respectively in Q3 and Q4
- Grade B Office: 10.7% and 7.9% increase q-o-q, respectively in Q3 and Q4
Average Rental of Hanoi Grade A Off ice Proper ties
20.00
22.00
24.00
26.00
28.00
30.00
32.00
20
04
Q1
20
04
Q2
20
04
Q3
20
04
Q4
20
05
Q1
20
05
Q2
20
05
Q3
20
05
Q4
20
06
Q1
20
06
Q2
20
06
Q3
20
06
Q4
US
$ P
SQ
MP
M
Average Rental of Hanoi Grade B Off ice Proper ties
16.00
18.00
20.00
22.00
24.00
26.00
28.00
30.00
20
04
Q1
20
04
Q2
20
04
Q3
20
04
Q4
20
05
Q1
20
05
Q2
20
05
Q3
20
05
Q4
20
06
Q1
20
06
Q2
20
06
Q3
20
06
Q4
US
$ P
SQ
MP
M

CB Richard Ellis | Page 55
HANOI OFFICE MARKET
Future Supply
- 22,350sqm GFA of Grade A Office space will come on stream in Q1/2007
- Significant amount of Grade B office space will be launched during 2007
Estimated new stock of Grade A,B&C Off ice
239,022
92,900 87,500
58,000
0
50,000
100,000
150,000
200,000
250,000
2007 2008 2009 2010
Sqm
Estimated new stock of Hanoi Grade A Off ice
22,350
33,000
71,000
58,000
0
20,000
40,000
60,000
80,000
100,000
2007 2008 2009 2010
Sqm

CB Richard Ellis | Page 56
HANOI OFFICE MARKET
Location:6B Trang Tien Str., Hoan Kiem Dist., HanoiDeveloper:Opera Business Centre JVCProject:3 level retail podium attached to 10 level office buildingGrade A Mixed-used of Retail / OfficeCompletion Date & Opening Date:Q1/2007Leasable Area:Land Area – 888sqmOffice GFA – 3,550sqmRetail NLA – 1,070sqm
OPERA BUSINESS CENTRE
Opening date
Q1/2007

CB Richard Ellis | Page 57
HANOI OFFICE MARKET
Location:83B Ly Thuong Kiet St., Hoan Kiem Dist., HanoiDeveloper:Ever Fortune Co., LtdProject:18 storey Grade A Mixed-use development with 5 basementsLeasable Area:Office: 18,500sqm GFARetail: Approx 8,000sqmCondos: 22,000sqm (185 units)Completion Date & Opening Date:Q1/2007
Opening date
Q1/2007
PACIFIC PLACE
CB Richard Ellis | Page 58
HANOI SERVICED APARTMENT MARKET
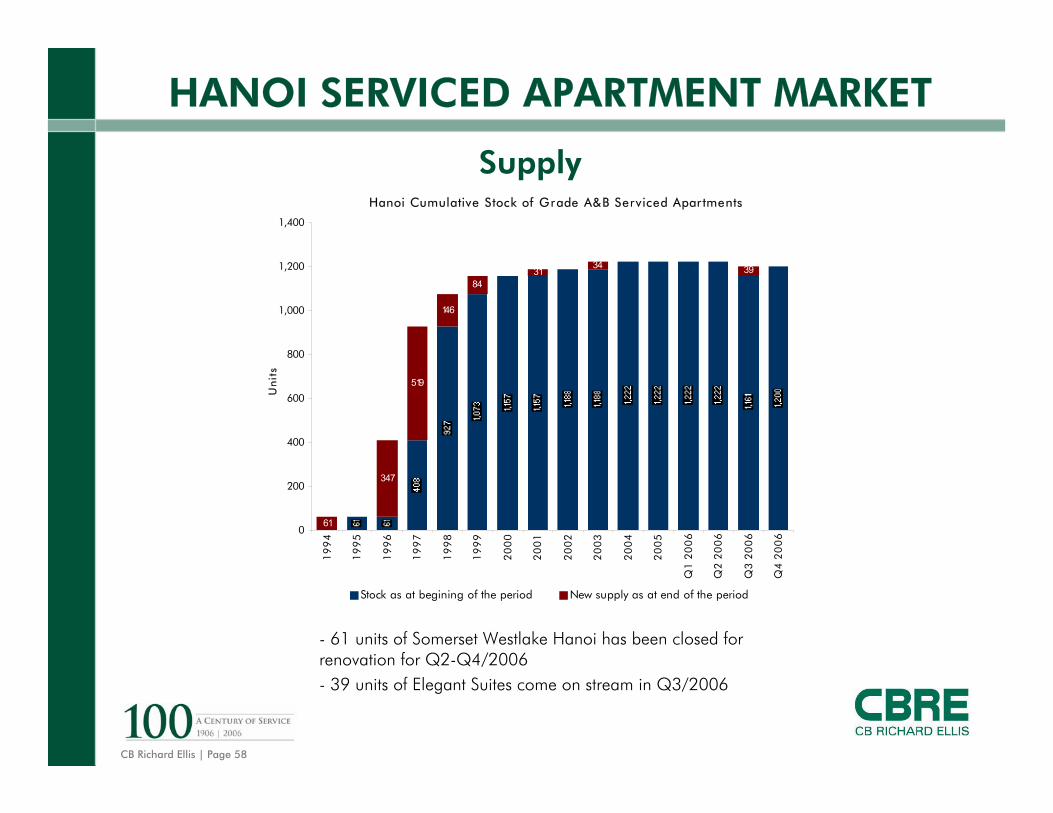
Supply
- 61 units of Somerset Westlake Hanoi has been closed for renovation for Q2-Q4/2006- 39 units of Elegant Suites come on stream in Q3/2006
Hanoi Cumulative Stock of Grade A&B Serviced Apar tments
61
347
519
8431 3934
146
0
200
400
600
800
1,000
1,200
1,400
19
94
19
95
19
96
19
97
19
98
19
99
20
00
20
01
20
02
20
03
20
04
20
05
Q1
20
06
Q2
20
06
Q3
20
06
Q4
20
06
Un
its
Stock as at begining of the period New supply as at end of the period

CB Richard Ellis | Page 59
HANOI SERVICED APARTMENT MARKET
Demand
- Low vacancy rate- High demand
Rentals
- Rental rate: US$18 - US$45/sqm/month
Average Asking Rent per sqm per month (US$)
$0.00
$10.00
$20.00
$30.00
$40.00
$50.00
$60.00
Co
Co
Villa
ge
Dae
ha C
ompl
ex
Ori
enta
l Pal
ace
Gol
den
Lodg
e
Som
erse
t Gra
nd H
anoi
May
fair
Pan
Hor
izon
Sedo
na S
uite
s
Jana
Gar
den
Terr
ace
Rose
Gar
den
Sun
Red
Rive
r
V- T
ower
Han
oi L
ake
View
Sofit
el P
laza
Eleg
ant S
uite
s
Take-up & Vacancy Rate Q4/2006
-20
-10
0
10
20
30
Q3
/20
04
Q4
/20
04
Q1
/20
05
Q2
/20
05
Q3
/20
05
Q4
/20
05
Q1
/20
06
Q2
/20
06
Q3
/20
06
Q4
/20
06
Un
its
-2.00%
-1.00%
0.00%
1.00%
2.00%
3.00%
Va
can
cy R
ate
(%
)
Take-up
Vacancy Rate
CB Richard Ellis | Page 60
HANOI SERVICED APARTMENT MARKET
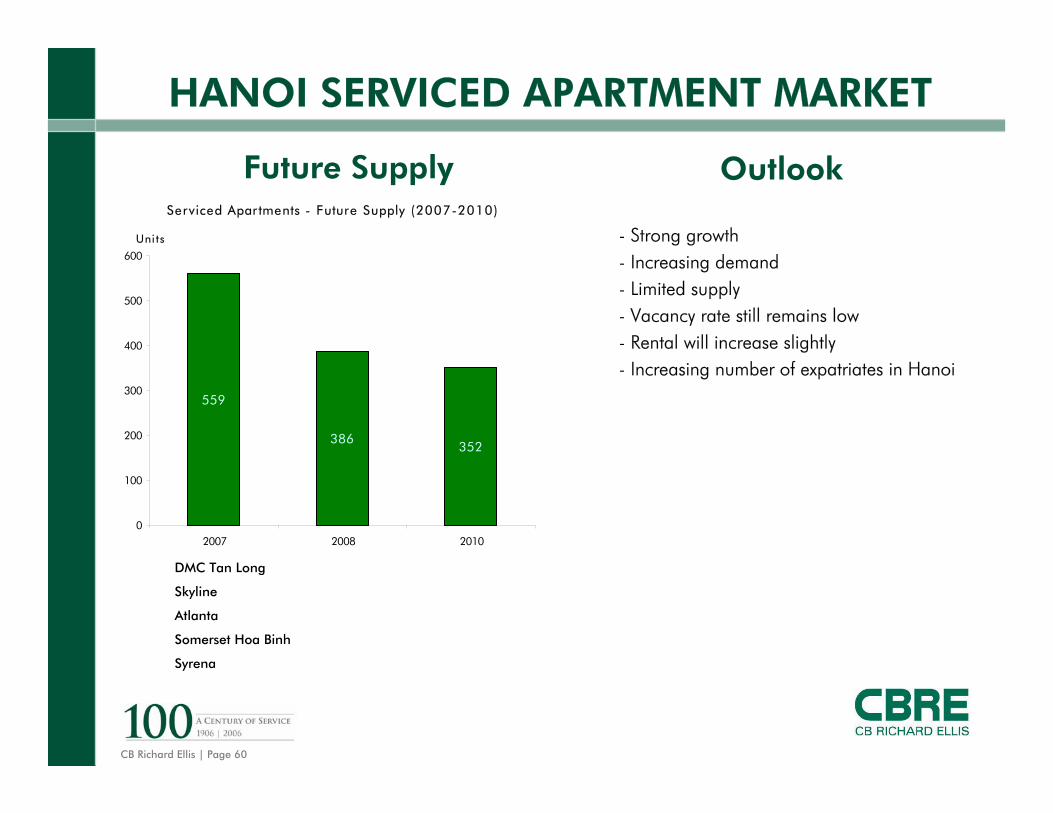
Future Supply
- Strong growth- Increasing demand- Limited supply- Vacancy rate still remains low- Rental will increase slightly- Increasing number of expatriates in Hanoi
OutlookServiced Apar tments - Future Supply (2007-2010)
559
386352
0
100
200
300
400
500
600
2007 2008 2010
Uni ts
DMC Tan Long
Skyline
Atlanta
Somerset Hoa Binh
Syrena

CB Richard Ellis | Page 61
HANOI SERVICED APARTMENT MARKET
Location:49 Hang Chuoi St., Hai Ba Trung Dist., HanoiDeveloper:Green Globe Co., Ltd.Marketing:CB Richard Ellis Vietnam- Exclusive Marketing AgentProject:Serviced Apartment Building15 storey building with 2 basements for parkingCompletion Date & Opening Date:Q1/2007Leasable Area:NLA: 5,000sqm52 Apartments
Opening date
Q1/2007
ATLANTA

CB Richard Ellis | Page 62
HANOI SERVICED APARTMENT MARKET
Location:4 Dang Dung St., Ba Dinh Dist., HanoiDeveloper:Nam Hung Corporation (Nahuco)Marketing:CB Richard Ellis Vietnam- Exclusive Marketing AgentProject:Serviced Apartment Building23 storey building with 1 basementCompletion Date & Opening Date:Q1/2007Leasable Area:NLA: 8,714sqm88 Apartments
Opening date
Q1/2007
SKYLINE

CB Richard Ellis | Page 63
HOTEL & TOURISM MARKET
Y-o-Y Visitor Arrivals to Vietnam
- Low fair airlines: AsiaAir, Jetstar & Tiger Airlines
- 20% of 3.6 million int’l visitors was MICE tourists
Number of Foreign Visi tor A rrivals to Vietnam
0
500,000
1,000,000
1,500,000
2,000,000
2,500,000
3,000,000
3,500,000
4,000,000
19
90
19
91
19
92
19
93
19
94
19
95
19
96
19
97
19
98
19
99
20
00
20
01
20
02
20
03
20
04
20
05
20
06
arr
iva
ls
-20.0%
-10.0%
0.0%
10.0%
20.0%
30.0%
40.0%
50.0%
60.0%
Number of foreign tourist arrivals y-o-y change
CB Richard Ellis | Page 64
HANOI HOTEL & TOURISM MARKET
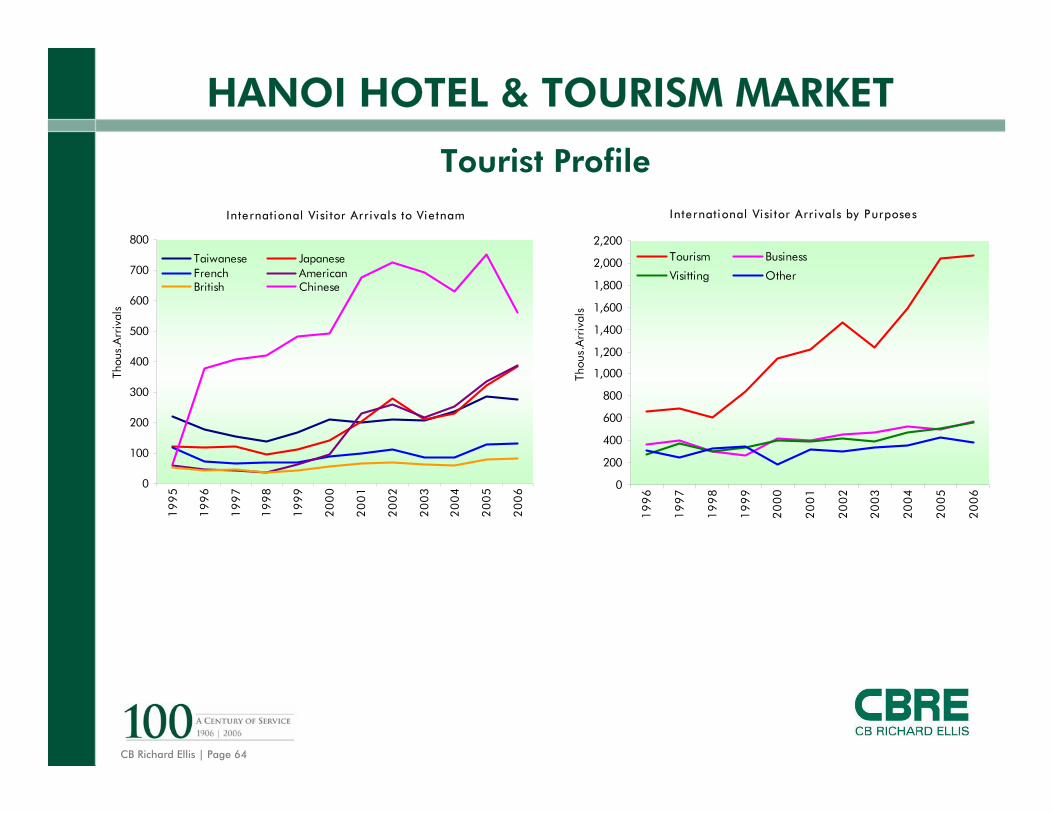
Tourist Profile Inte rnat ional Vi si tor Arr i val s to Vie tnam
0
100
200
300
400
500
600
700
800
19
95
19
96
19
97
19
98
19
99
20
00
20
01
20
02
20
03
20
04
20
05
20
06
Thou
s.A
rriv
als
Taiwanese JapaneseFrench AmericanBritish Chinese
Inte rnat ional Vi si tor Arr i val s by Purposes
0
200
400
600
800
1,000
1,200
1,400
1,600
1,800
2,000
2,200
19
96
19
97
19
98
19
99
20
00
20
01
20
02
20
03
20
04
20
05
20
06
Thou
s.A
rriv
als
Tourism Business
Visitting Other

CB Richard Ellis | Page 65
HANOI HOTEL & TOURISM MARKET Room Supply: 4,924 (5, 4 and 3 star hotels)
Number of Hotels5-star
23.53%
4-star14.71%
3-star61.76%
Number of Hotels ' rooms
5-star48.01%
4-star17.75%
3-star34.24%
- 1.15 million int’l visitor arrivals to Hanoi in 2006
- 4,924 rooms, including 5, 4 and 3 star hotel rooms
- 5 star hotels: 2,364 rooms/ 8 hotels
- 4 star hotels: 874 rooms/ 5 hotels
- 3 star hotels: 1,686 rooms/ 21 hotels
NUMBER OF FOREIGN VISITOR ARRIVALS
0
500,000
1,000,000
1,500,000
2,000,000
2,500,000
3,000,000
3,500,000
4,000,000
19
90
19
92
19
94
19
96
19
98
20
00
20
02
20
04
20
06
arr
iva
ls
To Vietnam To Hanoi

CB Richard Ellis | Page 66
HANOI HOTEL & TOURISM MARKET
Room Supply: 3,238 rooms (5 and 4 star)
- Most of 5 and 4 star hotels came on stream in 1990s
- No new supply over last few years
- Lack of quality hotel rooms
Cumulative Stock & New Supply of 5 & 4 star Hotel rooms
218
102
250
1,131
1,131
102
299
0
500
1,000
1,500
2,000
2,500
3,000
3,500
19
94
19
95
19
96
19
97
19
98
19
99
20
00
20
01
20
02
20
03
20
04
20
05
20
06
Ro
om
s
New supply as at year-end
Stock as at beginning of the year

CB Richard Ellis | Page 67
HANOI HOTEL & TOURISM MARKET
ADR & Occupancy rate of 5 star hotels
- Stably high occupancy rate over years
- Occupancy rate as at end Q4/2006:
•5 star hotels: approx 84.28%
•4 star hotels: approx 90.00%
•3 star hotels: approx 80%
- High demand
- Limited supply
- High occupancy rate, approximately 84% in Q4/2006
- 5 star hotels: ADR of US$128.26 as at end of Q4/2006
Average Occupancy Rate & ADR of 5-star Hotels
$50.00
$60.00
$70.00
$80.00
$90.00
$100.00
$110.00
$120.00
$130.00
$140.00
Q2/2005 Q3/2005 Q4/2005 Q1/2006 Q2/2006 Q3/2006 Q4/200650.00%
60.00%
70.00%
80.00%
90.00%
100.00%
Ave. Room rate Ave. Occupancy rate
Monthly Occupancy Rate of Hanoi's 5-star Hotels
0%
10%
20%
30%
40%
50%
60%
70%
80%
90%
100%
Jan-06
Feb-06
Mar-06
Apr-06
May-06
Jun-06
Jul-06 Aug-06
Sep-06
Oct-06
Nov-06
Dec-06

CB Richard Ellis | Page 68
HANOI HOTEL & TOURISM MARKET
Requirement for Hotel Rooms (2005 - 2020)
4,924 6,2854,170
11,076
20,715
5,530
0
5,000
10,000
15,000
20,000
25,000
30,000
3- to 5-star 1- to 2-star Others
Ro
om
s
Actual Hotel Rooms as at 2005 Hotel Rooms Requirement as at 2020-2005
Hotel Market Outlook:- Hot market for investors, foreign investment funds …- High occupancy rate- Limited supply- High demand- Increasing number of int’l visitor arrivals- More high quality hotels required- Tourism industry has significant impacts on property sector (hotel, retail & second-home projects)
Market Highlights:- High occupancy rate- 390 new 3 to 5 star hotel rooms in 2007- 2 licenses were granted in early Q1/2007 to build 2 5-star hotels in My Dinh area
Hotel - Future Supply
Dan Chu Hotel
Hoan Kiem Hotel
Dong Loi Hotel
Hanoi Sofitel Metropole
Inter-Continental
0 50 100 150 200 250 300 350
2007
2007
2007
2007
2008
Rooms

CB Richard Ellis | Page 69
HANOI RETAIL MARKET Number of supermarkets by distr icts
23.91%
13.04%
8.70%10.87%
8.70%
17.39%
6.52%6.52% 2.17% 2.17%
Dong Da Hai Ba Trung Cau Giay Hoan Kiem Hoang Mai
Ba Dinh Thanh Xuan Tu Liem Dong Anh Thanh Tri
No. DistrictNumber of
Supermarkets GFA (sqm)Trading area
(sqm)
1 Dong Da 11 17,140 11,533
2 Hai Ba Trung 6 8,480 5,580
3 Cau Giay 4 24,027 9,310
4 Hoan Kiem 5 10,280 5,870
5 Hoang Mai 4 2,554 1,004
6 Ba Dinh 8 7,865 3,520
7 Thanh Xuan 3 1,702 1,702
8 Tu Liem 3 63,585 11,725
9 Dong Anh 1 440 300
10 Thanh Tri 1 250 250
Total 46 136,323 50,794
HANOI SUPERMARKETS
Total trading areas of Supermarkets in Hanoi (by distr ict)
11,533
5,580
9,310
5,870
1,004
3,520
1,702
11,725
300
250
0 3,000 6,000 9,000 12,000 15,000
Dong Da
Hai Ba Trung
Cau Giay
Hoan Kiem
Hoang Mai
Ba Dinh
Thanh Xuan
Tu Liem
Dong Anh
Thanh Tri
sqm
Major players:-Intimex
-Fivimart
-Citimart
-Hapro Mart

CB Richard Ellis | Page 70
HANOI RETAIL MARKET SHOPPING CENTRES
Future Supply of Hanoi Shopping Centres
The
Man
or
Vigl
acer
a
Ruby
Pla
za
Thai
Thi
nh P
laza
Ngo
c K
hanh
Pla
za
Cau
Gia
y C
omle
x
The
Gar
den
Viet
Tow
er
Cip
utra
Mal
l
Han
oi C
ity C
ompl
ex
0
20,000
40,000
60,000
80,000
100,000
120,000
140,000
Q1
/20
07
Q1
/20
07
Q1
/20
07
Q3
/20
07
Q4
/20
07
Q4
/20
07
Q1
/20
08
Q1
/20
08
20
09
20
10
sqm
Market highlights:- High occupancy
- Strong & increasing demand
- Limited supply
- Increasing rental
Net Area and Average Rent of Hanoi Shopping Centres
0
10,000
20,000
30,000
40,000
50,000
60,000
70,000
80,000
Tran
g Ti
en P
laza
Han
oi T
ower
V -
Tow
er
VKO
Vinc
om C
ityTo
wer
s
BigC
Tha
ng L
ong
Me
Linh
Pla
za
Hoa
Bin
h In
t'lTo
wer
s
Ope
ra B
usin
ess
Cen
tre
Paci
fic P
lace
sqm
$0.00
$10.00
$20.00
$30.00
$40.00
$50.00
$60.00
$70.00
$80.00
$90.00
$100.00Leasable Area (sqm)
Gross Rent per sqm
CB Richard Ellis | Page 71
HANOI RETAIL MARKET
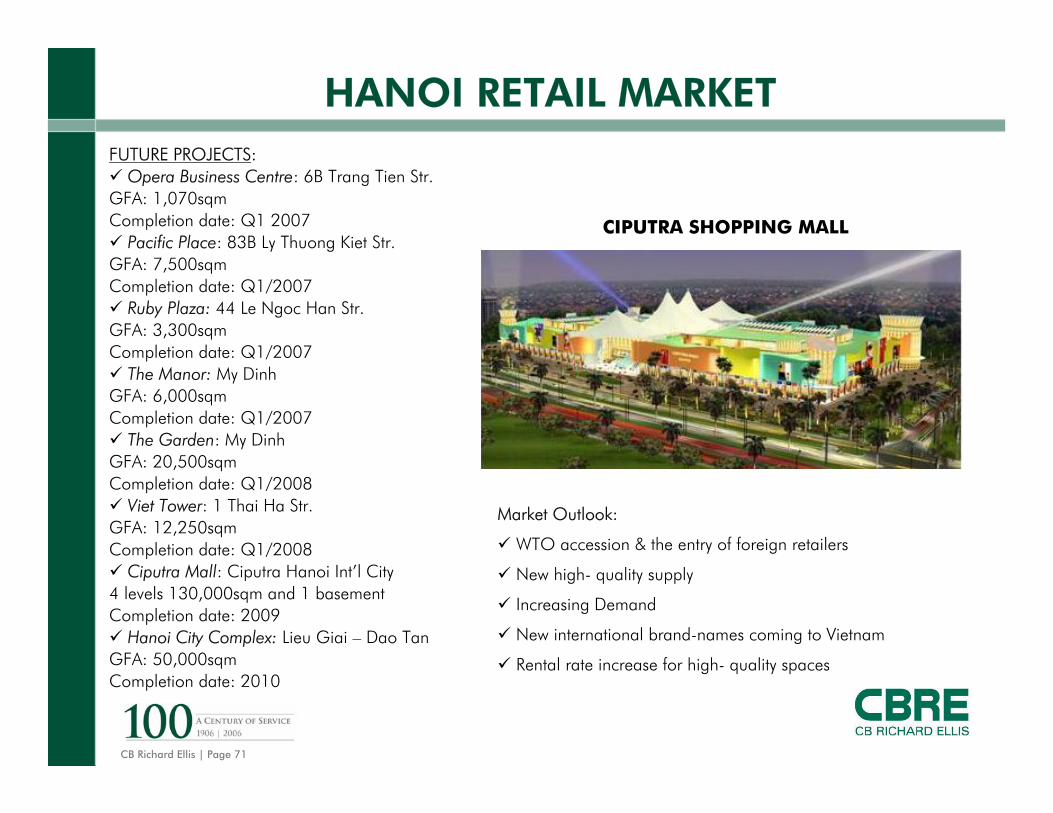
Market Outlook:
WTO accession & the entry of foreign retailers
New high- quality supply
Increasing Demand
New international brand-names coming to Vietnam
Rental rate increase for high- quality spaces
FUTURE PROJECTS:Opera Business Centre: 6B Trang Tien Str.
GFA: 1,070sqmCompletion date: Q1 2007
Pacific Place: 83B Ly Thuong Kiet Str.GFA: 7,500sqmCompletion date: Q1/2007
Ruby Plaza: 44 Le Ngoc Han Str.GFA: 3,300sqmCompletion date: Q1/2007
The Manor: My DinhGFA: 6,000sqmCompletion date: Q1/2007
The Garden: My DinhGFA: 20,500sqmCompletion date: Q1/2008
Viet Tower: 1 Thai Ha Str.GFA: 12,250sqmCompletion date: Q1/2008
Ciputra Mall: Ciputra Hanoi Int’l City4 levels 130,000sqm and 1 basementCompletion date: 2009
Hanoi City Complex: Lieu Giai – Dao TanGFA: 50,000sqmCompletion date: 2010
CIPUTRA SHOPPING MALL
CB Richard Ellis | Page 72
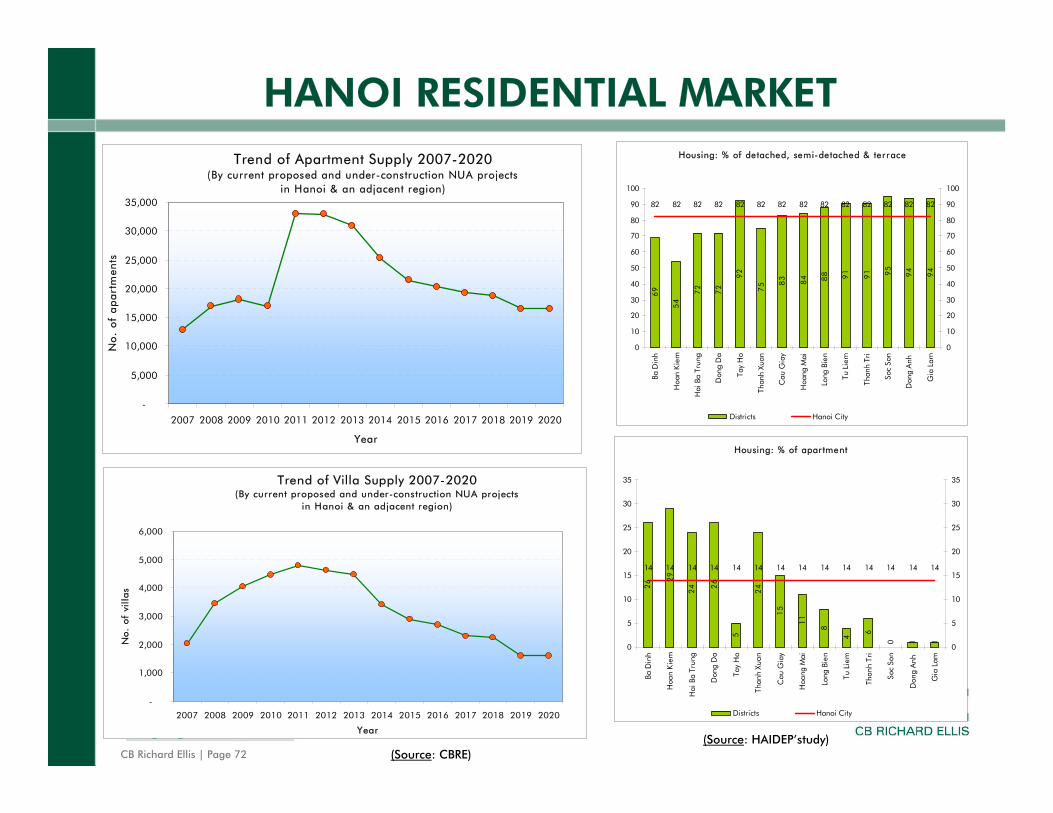
HANOI RESIDENTIAL MARKET Trend of Apartment Supply 2007-2020
(By current proposed and under-construction NUA projects in Hanoi & an adjacent region)
-
5,000
10,000
15,000
20,000
25,000
30,000
35,000
2007 2008 2009 2010 2011 2012 2013 2014 2015 2016 2017 2018 2019 2020
Year
No
. o
f a
pa
rtm
ents
Trend of Villa Supply 2007-2020(By current proposed and under-construction NUA projects
in Hanoi & an adjacent region)
-
1,000
2,000
3,000
4,000
5,000
6,000
2007 2008 2009 2010 2011 2012 2013 2014 2015 2016 2017 2018 2019 2020
Year
No
. o
f vi
lla
s
Housing: % of apar tment
26 2
9
24 2
6
5
24
15
11
8
4
6
0 1 1
14 14 14 14 14 14 14 14 14 14 14 14 14 14
0
5
10
15
20
25
30
35
Ba D
inh
Hoa
n K
iem
Hai
Ba
Trun
g
Don
g D
a
Tay
Ho
Than
h Xu
an
Cau
Gia
y
Hoa
ng M
ai
Long
Bie
n
Tu L
iem
Than
h Tr
i
Soc
Son
Don
g A
nh
Gia
Lam
0
5
10
15
20
25
30
35
Districts Hanoi City
(Source: HAIDEP’study)(Source: CBRE)
Housing: % of detached, semi-detached & terrace
69
54
72
72
92
75 8
3 84 88 91
91 95
94
94
82 82 82 82 82 82 82 82 82 82 82 82 82 82
0
10
20
30
40
50
60
70
80
90
100
Ba D
inh
Hoa
n K
iem
Hai
Ba
Trun
g
Don
g D
a
Tay
Ho
Than
h Xu
an
Cau
Gia
y
Hoa
ng M
ai
Long
Bie
n
Tu L
iem
Than
h Tr
i
Soc
Son
Don
g A
nh
Gia
Lam
0
10
20
30
40
50
60
70
80
90
100
Districts Hanoi City
CB Richard Ellis | Page 73
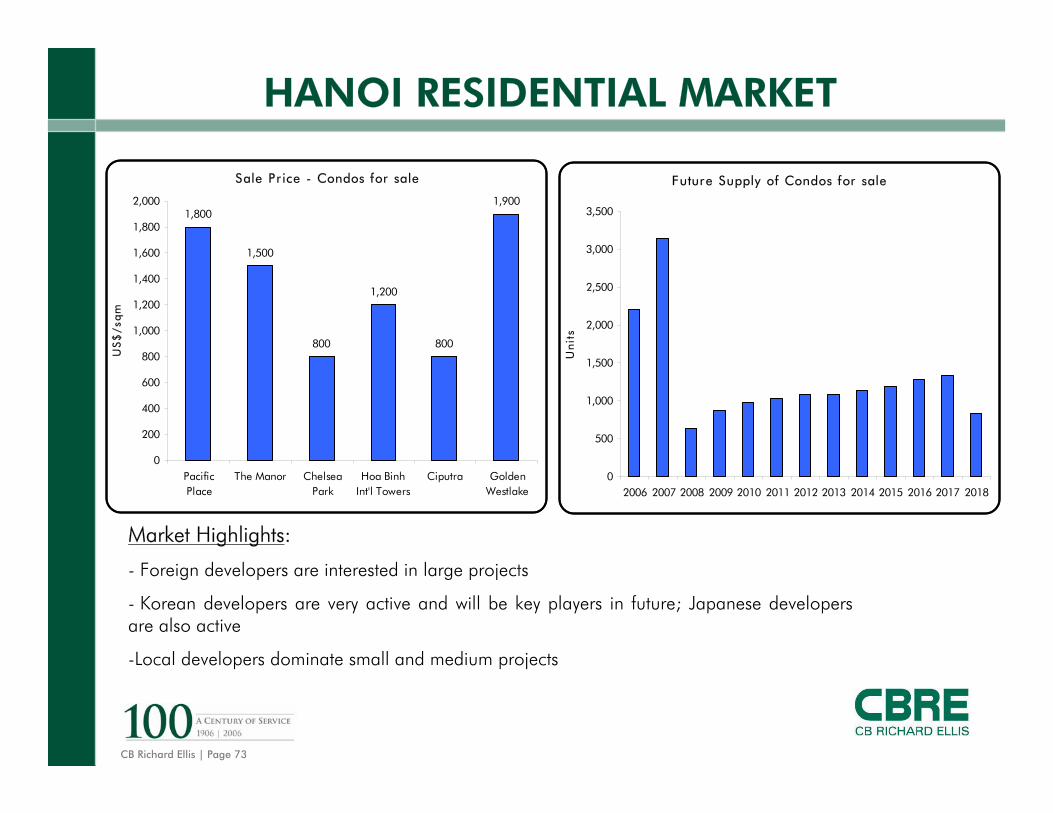
HANOI RESIDENTIAL MARKET
Market Highlights:
- Foreign developers are interested in large projects
- Korean developers are very active and will be key players in future; Japanese developers are also active
-Local developers dominate small and medium projects
Future Supply of Condos for sale
0
500
1,000
1,500
2,000
2,500
3,000
3,500
2006 2007 2008 2009 2010 2011 2012 2013 2014 2015 2016 2017 2018
Un
its
Sale Pr ice - Condos for sale
1,800
1,500
800
1,200
800
1,900
0
200
400
600
800
1,000
1,200
1,400
1,600
1,800
2,000
PacificPlace
The Manor ChelseaPark
Hoa BinhInt'l Towers
Ciputra GoldenWestlake
US
$/s
qm
CB Richard Ellis | Page 74
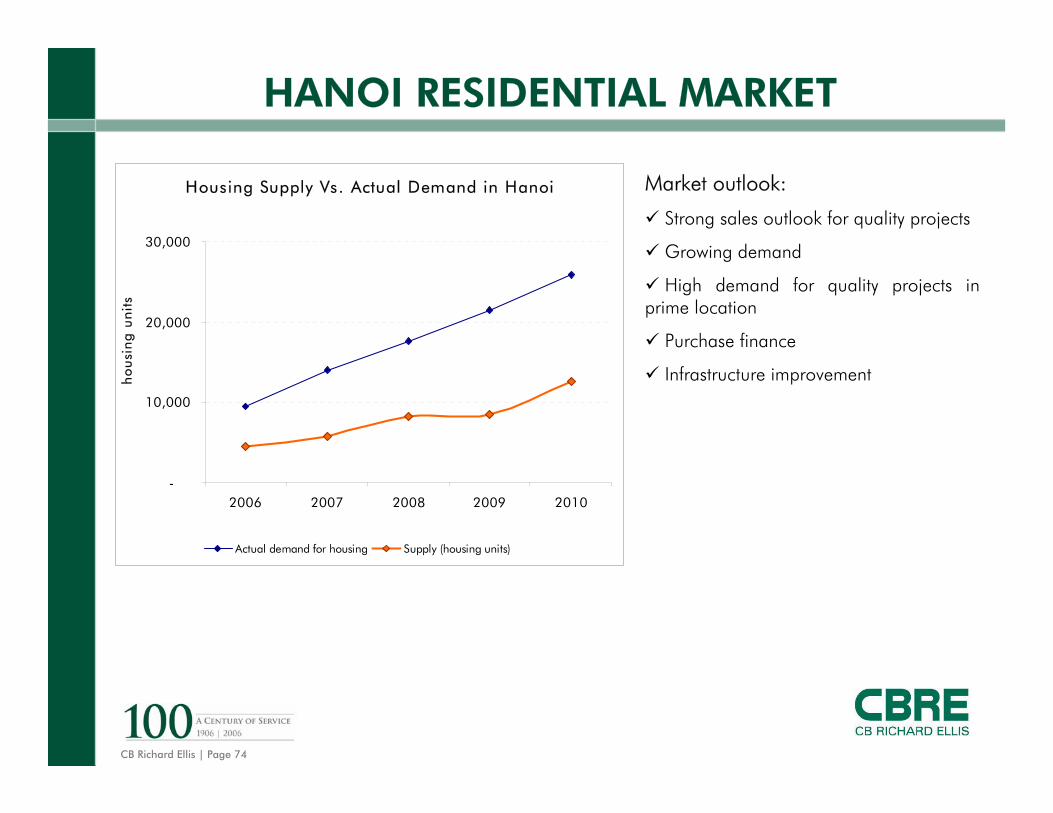
HANOI RESIDENTIAL MARKET
Market outlook:
Strong sales outlook for quality projects
Growing demand
High demand for quality projects in prime location
Purchase finance
Infrastructure improvement
Housing Supply Vs. Actual Demand in Hanoi
-
10,000
20,000
30,000
2006 2007 2008 2009 2010
ho
usi
ng
un
its
Actual demand for housing Supply (housing units)
CB Richard Ellis | Page 75
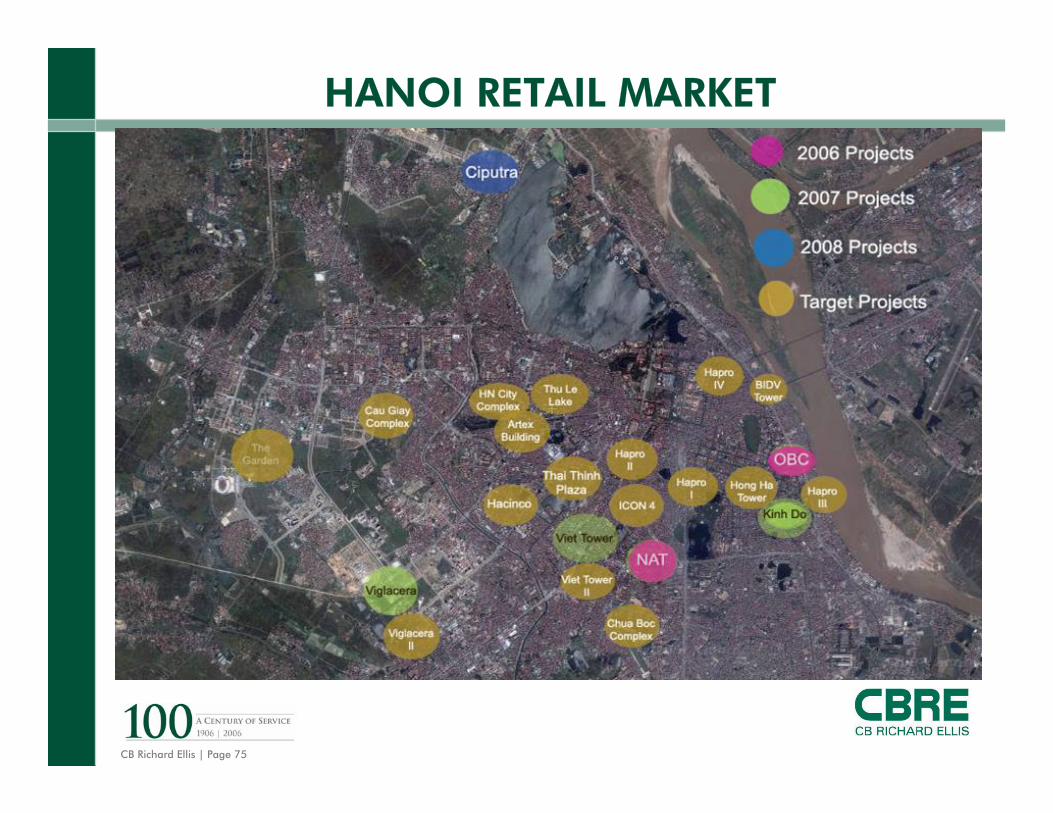
HANOI RETAIL MARKET

CB Richard Ellis | Page 76
CBRE GLOBAL OFFICE LOCATIONS
THANK YOU!www.cbrevietnam.com