TagItSmart! ecosystems of connected objects Grant ...
81
TagItSmart! Smart Tags driven service platform for enabling ecosystems of connected objects Grant agreement 688061 Operational trial on core platform integration Deliverable ID: D 5.2 Deliverable Title: Operational trial on core platform integration Revision #: Dissemination Level: Public Responsible beneficiary: VTT Contributing beneficiaries: DNET, FLE, UNIS, EVT, UPC, SIE, TFE, UNILEVER, DURST, PICOM, DONDE, UNIEX, UNIPD Contractual date of delivery: 31.3.2017 Actual submission date: Start Date of the Project: 1 January 2016 Duration: 36 Months Ref. Ares(2017)1754356 - 01/04/2017
Transcript of TagItSmart! ecosystems of connected objects Grant ...
TagItSmart!
Smart Tags driven service platform for enabling ecosystems of connected objects
Grant agreement 688061
Operational trial on core platform integration
Deliverable ID: D 5.2 Deliverable Title: Operational trial on core platform integration Revision #: Dissemination Level: Public Responsible beneficiary: VTT
Contributing beneficiaries: DNET, FLE, UNIS, EVT, UPC, SIE, TFE, UNILEVER, DURST, PICOM, DONDE, UNIEX, UNIPD
Contractual date of delivery: 31.3.2017 Actual submission date:
Start Date of the Project: 1 January 2016 Duration: 36 Months
Ref. Ares(2017)1754356 - 01/04/2017
Contents
Section 1 - Introduction .................................................................................................. 4
Section 2 - Key Performance Indicators ........................................................................ 5
Section 3 - SmartTag creation ........................................................................................ 7
3.1 Encoding .............................................................................................................. 7 3.1.1 Encoding of Data Matrix code ............................................................................ 7 3.1.2 Encoding of QR codes ......................................................................................10 3.1.3 Encoding as a combination of QR code and image ...........................................11
3.2 Printing ................................................................................................................13 3.2.1 Thermochromic inks ..........................................................................................13 3.2.2 Photochromic inks .............................................................................................16 3.2.3 Flash reactive inks ............................................................................................19 3.2.4 Oxygen indicator ...............................................................................................20 3.2.5 Conclusions ......................................................................................................22
3.3 NFC manufacturing .............................................................................................23
Section 4 - TagItSmart repositories for storing and retrieving ...................................27 4.1.1 Sematic Registries and discovery .....................................................................28
Section 5 - SmartTag Scanning .....................................................................................35
5.1 Scanner authentication module .........................................................................35 5.1.1 User authentication using location .....................................................................35 5.1.2 Scanner authentication using biometrics ...........................................................44
5.2 Scanning Data Matrix codes ..............................................................................45 5.2.1 Conclusions ......................................................................................................46
5.3 Scanning QR codes ............................................................................................47 5.3.1 Scanning service including Coelition Atom for consent tracking ........................47 5.3.2 Scanning with context .......................................................................................48 5.3.3 Scanning to trigger AR/VR content based on context ........................................50
5.4 NFC scanning ......................................................................................................53
Section 6 - Use case related operational trials ............................................................55
6.1 Digital product.....................................................................................................55 6.1.1 Sensor printing ..................................................................................................55 6.1.2 Sensor scanning ...............................................................................................56 6.1.3 Conclusions ......................................................................................................56
6.2 Lifecycle management ........................................................................................57 6.2.1 Pilot tests ..........................................................................................................57 6.2.2 Usage of Smart Tags in the pilots .....................................................................63 6.2.3 Conclusions ......................................................................................................64
6.3 Brand protection .................................................................................................65 6.3.1 Functional Ink development ..............................................................................66 6.3.2 Outlook on further development ........................................................................69 6.3.3 Conclusions ......................................................................................................69

6.4 Dynamic pricing ..................................................................................................70
6.4.1 Information collection from cash register ...........................................................71
6.5 Home services.....................................................................................................72 6.5.1 Integration tests with retailers ............................................................................73
6.6 User experience on use cases ...........................................................................76
Section 7 - Handbook on components and functionalities available .........................79
Section 8 - Conclusions and next steps .......................................................................80
Section 9 - References ...................................................................................................81

Page 4/81
Section 1 - Introduction TagItSmart project sets out to redefine the way we think of everyday mass-market objects not normally considered as part of an IoT ecosystem. These new smarter objects will dynamically change their status in response to a variety of factors and be seamlessly tracked during their lifecycle. This will change the way users-to-things interactions are viewed. Combining the power of functional inks with the pervasiveness of digital (e.g. QR-codes) and electronic (e.g. NFC tags) markers, billions of objects will embed cheap sensing capabilities thus being able to capture new contextual information. Beside this, the ubiquitous presence of smartphones with their cameras and NFC readers will create the perfect bridge between everyday users and their objects. This will create a completely new flow of crowdsourced information, which extracted from the objects and enriched with user data, can be exploited by new services. TagItSmart will create an open, interoperable cloud-based platform with all the tools and enabling technologies, which will address the challenges related to the lifecycle management of new innovative services capitalizing on objects “sensorization”. TagItSmart will empower all steps involved from creating smart markers, Functional Codes (FunCodes/FCs) / SmartTags, to supporting secure and reliable acquisition and consumption of such contextual data, while preserving user privacy, to the provision of generic functionalities and a service composition platform, which will allow even inexperienced users to create and deploy their FCs based services while maintaining system efficiency. The goal of Work Package 5 (WP5 Ecosystem trials and platform validation) of TagItSmart project is to identify available infrastructures for operational and field trials, to implement services comprising of B2C and B2B services, and ecosystems, and evaluate them by stakeholders and end-users. All these will focus on the use cases that have been defined and further specified in WP1 (Use cases, requirements and interoperable architecture) and at a later stage also on use cases introduced through the Open Calls. Task 5.2 (Core platform operational trial) implements the operational trials focusing on FCs creation and FC-scanners interaction. This will focus on evaluation in laboratory environments of components as they become available during the course of the project. This deliverable D5.2 (Operational trial on core platform integration) of TagItSmart project reports activities related to task 5.2 until M15. However, this task will continue throughout the whole project and will carry out operational trials whenever new functionalities will become available from WP2 (Functional codes governance and information sharing) and WP3 (Context-aware FC-scanners usage). The deliverable reports the details of the operational trial activity and tested components. It presents detailed evaluation of the considered components, according to pre-defined Key Performance Indicators (KPIs), and the initial plan for architecture integration. It will serve as a handbook on available and integrated components for the first open call, but also for the use case implementation. The rest of this deliverable is structured as follows. Section 2 will list the pre-defined KPIs against which the results presented in the Sections 3-6 will be compared against. Section 3 presents results related to SmartTag Creation, including both encoding and printing, and Section 5 related to SmartTag Scanning. Section 4 presents the related repositories for storing and retrieving based on sematic modelling. Section 6 summarizes results for use case preparations, including results for preliminary end user (consumers) survey on user experience of the use cases. Section 7 summarizes the preceding sections as a list of available components (the handbook). Section 8 concludes the deliverable and discusses directions for future work.

Page 5/81
Section 2 - Key Performance Indicators Table 1 lists the Key Performance Indicators (KPIs) defined for the first operational trials reported in this document. Components and functionalities reported here are the first versions which will be further developed during the course of the project together with new modules. New KPIs will be added and the existing ones updated to reflect developments in the project. The results presented in sections 2-6 are compared against the KPIs listed in Table 1. Table 1. KPIs for the operational trials.
Category KPIs
Encoding Reliability of encoding service ≥ 80% Mono code tag printable Dual code tag printable
Printing QR and DM printing with functional inks - Cell size printed ≤ 0.50 mm
- Cell size scanned ≤ 0.50 mm
- Colour change green-clear ≤ +8oC
- Photochromic colour change clear-colour ≤ 10 min.
NFC manufacturing successful
Data storing / retrieval Average query response time without federated queries < 2s
Scanning Scanner authentication module - Authorized access ≥ 75% (location)
- FC-scanner authentication working (biometrics)
SmartTags combining QR and image: - Scanning reliability ≥ 95%
- Scanning speed ≤ 2s
- AR content generated based on scanned information ≤ 4s
Data Matrix scanning - Scanning reliability ≥ 95%
- Lightning conditions ≥ 100 lux
- Tag size ≤ 1.8 cm x 1.8 cm
Scanning service including Coelition Atom for consent tracking - Consent granting
- Updating or withdrawing consent (interactive)
- 16 purposes identifies
Scanning with context - Reliability of Item identification
- Reliabililty of adding context when scanning
- Speed of scanning with context
NFC scanning - Scanning reliability ≥ 99%
- Scanning distance < 2 cm
- Scanning response time < 0.5s
Use case related Digital product use case - Scanning reliability ≥ 95%
- Lightning conditions ≥ 100 lux

Page 6/81
Category KPIs
- Tag size ≤ 1.8 cm x 1.8 cm
Lifecycle management use case - Scanning speed ≤ 2s - Scanning reliability ≥ 95%
Brand protection use case - Functional substance assessment
- Inkjet-able functional ink (lab-scale)
- Inkjet-able functional ink (industrial printhead)
Dynamic pricing use case - Decision on discounted price when scanned at cash
register, accuracy ≥ 95%
- Retailer information collected when scanned at cash
register, accuracy ≥ 95%
Home services use case - Scanning speed ≤ 3s - Scanning reliability ≥ 95%

Page 7/81
Section 3 - SmartTag creation 3.1 Encoding
3.1.1 Encoding of Data Matrix code UpCode uses Data Matrix codes [1] as the base code in Digital Product use case. Sensor data will be integrated into 2-D code data using functional ink. Ink type has been chosen to match optimal drinking temperature for beer. Thermochromic ink and type of this ink has been described in Sections 3.2.1.1 and 6.1 in this document. During this project we have prototyped different approaches how to integrate sensor information into existing 2-D codes. First generation was to print functional ink dots inside code (Figure 1). This type of 2-D functional code has been introduced in D2.1 (Semantic model for FunCodes) [2].
Figure 1. 1st generation of 2-D code with sensor dots This approach was feasible and worked very well in Mobile Reading. Biggest problems are in the printing procedure, because aligning sensor dots inside the existing code is very demanding. Also, this approach requires lookup tables or algorithm development for dots placing. This could be problematic when printing tags, also significant changes might be needed for the existing scanners to make them fully support SmartTags. There is also drawback when using dots as sensors, as when an algorithm tries to resolve color of dots it becomes unreliable when dots area is too small. Because of that another solution was developed. Idea is to find the best combination of: 1) limitation of printing procedure and functional inks, 2) reading capability of mobile application, and 3) the cost of a solution. The best alternative so far has been to use a 2-D code with a bar of functional ink overlaying part of the code (Figure 3). Also a square with functional ink was tested (Figure 2). As result of a survey within a small review group, that contained developers, marketing specialists and product managers, illustration of a square sensor was deemed as looking too clumsy. That’s why another option was designed, implementing a rectangle bar at the bottom of the tag. This implementation has various advantages, as rectangle covers only a small area and as such it doesn’t’ affect scanning process significantly. Multiple sensor can be added to one tag and this is visually pleasing.

Page 8/81
Figure 2. 2nd generation of 2-D code with sensor area
Figure 3. 3rd generation of 2-D code with sensor area Encoding process itself is very easy when a rectangular symbol is used. 1) Data matrix is encoded based on the existing standards 2) sensor rectangle is added on top of the data matrix. Also, it is possible to encode a tag in the reverse order, i.e. first, the sensor rectangle is encoded and then data matrix is layered on top of it. As these are most simple cases (and work in various printing systems) more complex encoding might be used for example in digital printing; in this case placing algorithm is used after the data matrix has been encoded. This algorithm replaces white cells at two last rows of the barcode with sensor ink. Reliability of this encoding process has been evaluated and results are presented below.
KPI title Reliability of encoding service ≥ 80 %
Actors: Product manufacturers
Description: Encode tag with functional ink sensor (DM tag with sensor bar)
Trigger: Encode tag
Preconditions: Necessary information to encode a tag
Normal Flow: Unique id, print tag and print sensor over tag
Notes and Issues: In this process, SmartTag is printed twice
Value 100 %
In task 2.2 (Enablers for FCs) test prints have been made to find the best combination of ink and amount of layer (see Section 3.2.1.1) and readability with mobile phone. Based on these tests the 3rd generation tag has been chosen for the Digital Product use case. Information of the used sensor will be stored into (according to our TagItSmart architecture) the virtual entity counterpart of the product following the workflow shown in the figure below.

Page 9/81
Figure 4. SmartTag Creation and Printing (Basic Identity Provisioning)

Page 10/81
3.1.2 Encoding of QR codes There are several issues associated with encoding tags that change with environmental conditions. These issues stem from the error correction mechanisms built into the QR code generation algorithms. Actually these issues apply to all visual codes, but we will discuss only QR codes as a specific example. The simplest approach to encoding a changing tag would be to simply design the two tags that are needed and then print the differences in disappearing or invisible inks that change under the same conditions. However, it is very difficult, and for some environmental conditions impossible, to change both inks under the same conditions. Therefore, the approach to encoding requires that only one type of ink (disappearing or invisible) be used. As a result, the code can be constructed in such a way that sensor dots either appear or disappear, but not both. It might be proposed that simply having a new dot appear so that the encoded URL for http://www.example.com/Product123/Condition0 changes to http://www.example.com/Product123/Condition1 as this only changes one bit from 0 to 1. This is true of the message part of the QR code. However, the nature the Reed Solomon error correction requires that many bits in the error correcting parts of the code also change. The location of these bits and whether they change from 0 to 1 or from 1 to 0 is determined by the complex mathematics of the Reed Solomon encoding algorithm. One of the TagtSmart partners, FLE, has developed and made available during the project, two protected techniques for addressing these issues, dual and mono coded tags. Note that by using nonstandard encoding schemes, simple encoding schemes are possible. Dual Coded Tags In this technique, two tags are created. Each is designed in the normal way; one tag reads as the 'before' activation and the other reads as the 'after' activation. Before printing a carefully chosen set of dots on each tag are identified for printing with reactive inks. For example, let's assume disappearing ink. For the 'before' tag some 1 dots are printed with the reactive inks, so that when they disappear the tag no longer reads as valid. The 'after' tag has some 0 dots printed with reactive ink so that the tag fails to read before activation. When these dots disappear the tag reads correctly. Both tags are printed side by side and the scanner will only read one of them. Mono Coded Tags The mono tag approach is more complicated and restrictive. The design process must be allowed to choose some of the characters in the code. For example, if the code is formatted as follows AAAAAA - AA the user can choose the initial part, but the encoding algorithm must choose the last two characters. The technique is similar to the above but with both 0 and 1 bits printed in reactive inks and carefully placed to allow the code to be read in both ways.
Conclusions Creation of mono and dual Tags with QR codes has been evaluated against the corresponding KPIs below and it has been proven possible to create such SmartTags.

Page 11/81
KPI title Dual Code Tags Printable
Actors: The user, the design algorithm, reactive ink, scanner.
Description: Is it possible to endode two tags so that only one reads at a time in a before and after exposure to an environmental conditional, e.g. heat.
Trigger: Exposure to environmentall contitions change.
Preconditions: None.
Normal Flow: Design the tags, print them with normal ink and one reactive ink, scan, environmental exposure, and scan.
Notes and Issues: None
Value Possible.
KPI title Mono Code Tag Printable
Actors: The user, the design algorithm, reactive ink, scanner.
Description: Is it possible to endode one tag so that its reads differently before and after exposure to an environmental conditional, e.g. heat.
Trigger: Exposure to environmental contitions change.
Preconditions: The design algorithm must have control over part of the encoded text.
Normal Flow: Design the tag, print it with normal ink and one reactive ink, scan, environmental exposure, and scan.
Notes and Issues: Limit on the flexibility of the encoded messages due to the algorithm needing to have choice over two characters.
Value Possible.
3.1.3 Encoding as a combination of QR code and image The encoding methodology for SmartTag based on QR code in retail is described in deliverable D2.1. The proposed format for the SmartTag is extended with an image encoded as a part of QR code (Figure 5) and it is being used for testing purposes to evaluate the accuracy for different types and positions of a logo that is going to be partialy printed with functional ink.

Page 12/81
Figure 5. QR code versions with image and functional ink (red) The QR code represents 25 digit alphanumeric value, which includes product code (first 15 characters), product line (16-22) and sensor value (last three characters). The functional ink is presented in red color that will disappear when predefined environment conditions are met, i.e. when the temperature reaches a predefined threshold. Printing of the functional ink is done separately from printing the QR codes, which requires several types of testing using predefined KPIs from Section 2. Printing of the tag will be more effective from the FC-reader perspective if the functional ink part is printed outside of the QR code, thus the QR code example provided on the further right side (Figure 5) was not considered during the tests, as it can be difficult to provide accurate two cycle printing in the predefined positions. Reliability of the encoding of a combination of QR code and image has been evaluated.
KPI title Reliability of encoding service ≥ 80 %
Actors: Module for encoding, retailer
Description: The encoding reliability for embedding information of product, and including sensors (functional ink) and AR/VR triggers (images)
Trigger: Exposure to environmental conditions
Preconditions: User is successfully logged in into the system; product data are entered and all necessary fields filled in
Normal Flow: Retailer logs in the Retailer’s system, generates the barcode by selecting the barcode type and encodes the information into the barcode
Notes and Issues: During the tests there was variation in encoding accuracy corresponding to the place of image in the barcode and in the version of logo used which is partially printed with functional ink. The moderate accuracy was achieved when the image was outside of the barcode and when the letters are not printed with functional ink
Value 83%

Page 13/81
3.2 Printing
The following functional ink technologies have been evaluated by VTT for their suitability for printing SmartTags, specifically QR and Data Matrix codes or parts of those:
Reversible thermochromic inks
Reversible and irreversible photochromic inks
Reversible flasher inks (ink reacting to camera flash)
Irreversible oxygen indicator Use case requirements have been kept in mind when selecting the inks for the functional ink printing operational trials. The following printing equipment at VTT have been used for the printing trials (Figure 6):
Laboratory scale flexography printer with camera-based alignment: RK Flexiproof
Laboratory scale screen printer
Inkjet printers with laboratory scale printheads: DMP-2831 (Fujifilm Dimatix) and PiXDRO LP50 (Meyer Burger) both with single-use 16 nozzle printheads with 10 pl drop size, and with camera-based alignment. Printing resolution 1270 dpi.
Figure 6. Printing machinery used in the operational trials. From left: flexography printer, screen printer, DMP-2831 inkjet printer and PiXDRO LP50 inkjet printer. The following paper based substrates have been used for the printing trials:
Colour copier paper 100 g/m2 (copy paper)
Coated photographic paper PDQ Gloss Photobase 250 µm thick (photo paper)
Adhesive label for office copier (Label)
DIG UV INKJET MC80 FSC PET coated paper (IJ label)
PE85 TOP WHITE (PE coated paper) 3.2.1 Thermochromic inks
Analog printing Flexography printing of cells of QR codes was evaluated with a reversible red thermochromic ink (Chameleon WB flexo ink slurry, colour red, temperature 47 oC from LCR Hallcrest) that is red < +47 oC and clear > +47 oC. The following printing settings were used: 3 printed layers, anilox 18 cm3/m2. Printed samples were used for demonstration purposes at different events (e.g. NetFutures 2016, IoT Week 2016). The layout contained an original QR code, logos and other elements printed with regular inks (office copier), and areas to be printed with a thermochromic ink (Figure 7 and Figure 8). Cells were printed on QR codes that were 3 cm x

Page 14/81
3 cm and 5 cm x 5 cm in size. Paper substrates were used: label and copy paper. Approximately 25 printed tags were made altogether.
(a) (b) (c)
Figure 7. QR code layout for thermochromic red ink: (a) original QR code printed with regular ink, (b) cells printed with the thermochromic ink, (c) resulting QR code containing (a) and (b).
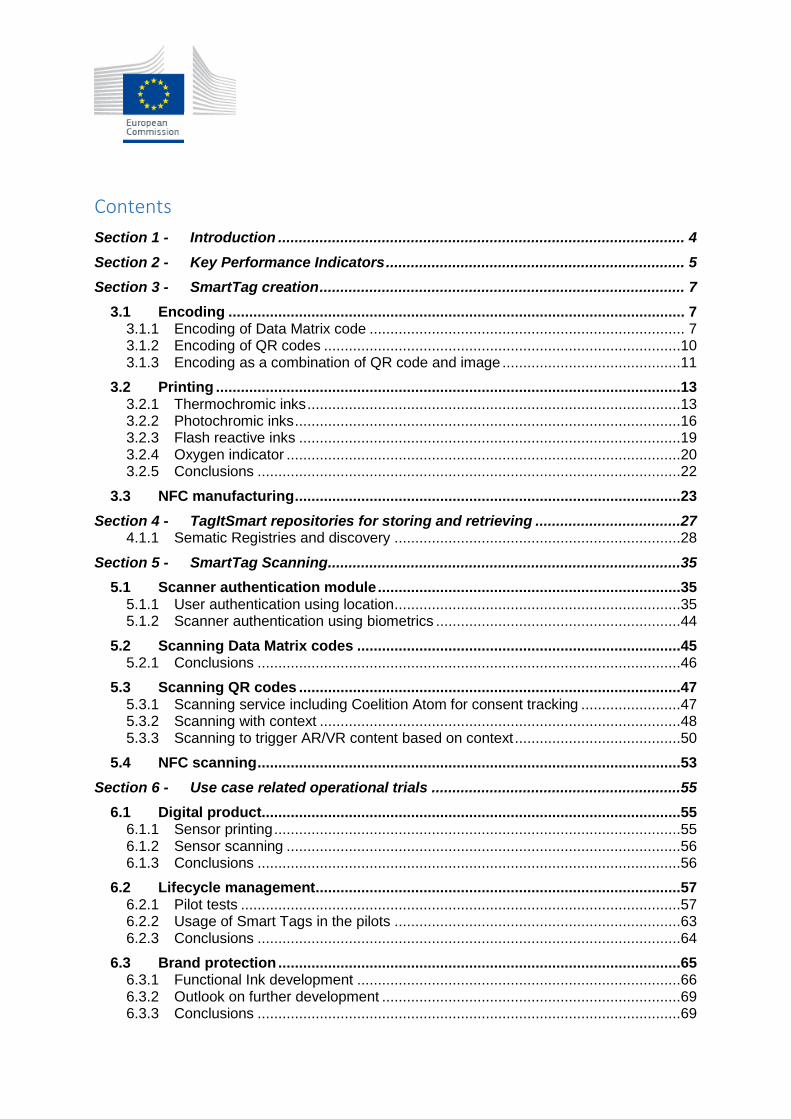
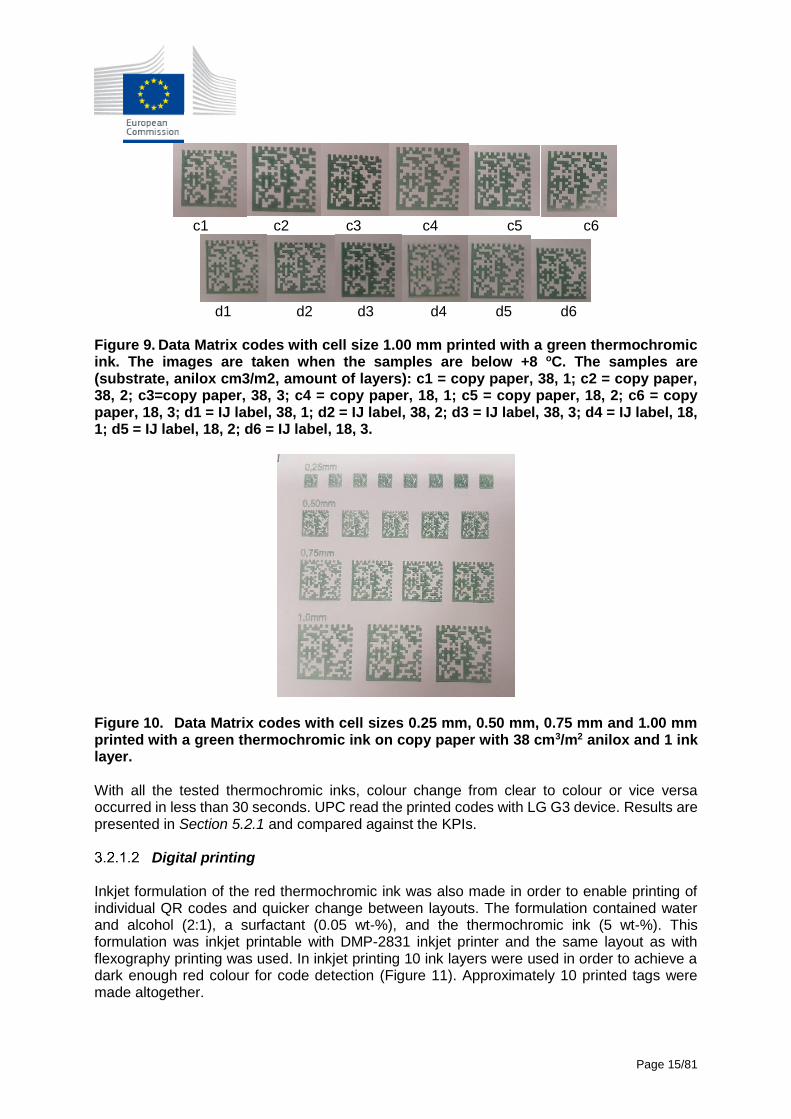
Figure 8. Final layout of the printed tags and working principle when attached to a coffee cup. On the left the coffee cup is empty. On the right the cup contains hot water resulting in cells and a circle printed with the red thermochromic ink to disappear. The areas will appear when the water is cooled below +47 oC. A similar approach was used with a reversible black thermochromic ink (Chameleon WB flexo ink slurry, colour black, temperature 31 oC from LCR Hallcrest) that is black < +31 oC and clear > +31 oC. The following printing settings were used: 3 printed layers, anilox 18 cm3/m2. Printed samples were used for demonstration purposes with Fujitsu Smart Bin demonstrator. The layout was similar to Figure 7, but the QR codes led to a different website. Paper substrates were used : label and copy paper. Approximately 10 printed tags were made altogether. Flexography printing of a reversible green thermochromic ink (WB FLEXO GREEN TO CLR FC 08C from Chromatic Technologies Inc. = CTI) that is green < +8 oC and clear > +8 oC was carried out on different substrates (copy paper, IJ label). Different anilox (18 cm3/m2 and 38 cm3/m2) and the amount of printed layers (1, 2 and 3) were used. The larger the anilox the more ink is transferred to the substrate thus producing a darker printed area, but also providing more ink spreading having an effect on detail rendering. The printing layout consisted of Data Matrix codes of different sizes (cell size 0.25 mm - 1.5 mm with 0.25 mm intervals). Printed samples with different substrate, anilox and amount of layers are presented in Figure 9. The codes with cell size 0.5 mm or more were of good print quality and cells were reproduced properly, but there was too much ink spreading in codes with cell size 0.25 mm. The same applied to all printing process combinations used. An example of the codes with different cell size is presented in Figure 10, where the poor print quality of the smallest codes can be seen.
Page 15/81
c1 c2 c3 c4 c5 c6
d1 d2 d3 d4 d5 d6
Figure 9. Data Matrix codes with cell size 1.00 mm printed with a green thermochromic ink. The images are taken when the samples are below +8 oC. The samples are (substrate, anilox cm3/m2, amount of layers): c1 = copy paper, 38, 1; c2 = copy paper, 38, 2; c3=copy paper, 38, 3; c4 = copy paper, 18, 1; c5 = copy paper, 18, 2; c6 = copy paper, 18, 3; d1 = IJ label, 38, 1; d2 = IJ label, 38, 2; d3 = IJ label, 38, 3; d4 = IJ label, 18, 1; d5 = IJ label, 18, 2; d6 = IJ label, 18, 3.
Figure 10. Data Matrix codes with cell sizes 0.25 mm, 0.50 mm, 0.75 mm and 1.00 mm printed with a green thermochromic ink on copy paper with 38 cm3/m2 anilox and 1 ink layer. With all the tested thermochromic inks, colour change from clear to colour or vice versa occurred in less than 30 seconds. UPC read the printed codes with LG G3 device. Results are presented in Section 5.2.1 and compared against the KPIs.
Digital printing Inkjet formulation of the red thermochromic ink was also made in order to enable printing of individual QR codes and quicker change between layouts. The formulation contained water and alcohol (2:1), a surfactant (0.05 wt-%), and the thermochromic ink (5 wt-%). This formulation was inkjet printable with DMP-2831 inkjet printer and the same layout as with flexography printing was used. In inkjet printing 10 ink layers were used in order to achieve a dark enough red colour for code detection (Figure 11). Approximately 10 printed tags were made altogether.

Page 16/81
Figure 11. QR codes inkjet printed with the red thermochromic ink formulation. Inkjet ink formulation was also tested with the black thermochromic ink, but no printability was achieved probably due to too a large particle size typical for black pigments in general.
Combination of two functional inks Flexography printing of two thermochromic inks (Chameleon WB flexo ink slurry, colour red, temperature 47 oC from LCR Hallcrest and Chameleon WB flexo ink slurry, colour black, temperature 31 oC from LCR Hallcrest) on single Data Matrix code was also evaluated. This was done by registering cells with two inks on codes that were 2 cm, 3 cm and 4 cm squares. It was found that printing two functional inks into a single code is a feasible solution with good enough registration. This idea can be utilized for making codes that contain cells that disappear and other cells that appear when exposed to certain external stimuli.
Figure 12. Data Matrix code with two functional inks. Code size is 3 cm x 3 cm. In the left picture both thermochromic inks can be seen (T < +31 oC). In the middle picture black thermochromic ink has disappeared (+31 oC < T < +47 oC). In the right picture both black and red thermochromic inks have disappeared (T > +47 oC). 3.2.2 Photochromic inks
Analog printing Flexography printing of a red reversible photochromic ink (UV flexo red photo from CTI) was carried out on different substrates (copy paper, IJ label, PE coated paper) with different anilox (18 cm3/m2 and 38 cm3/m2). Only one ink layer was printed in all cases since it already provided dark enough printing and multiple layers spread too much. The printing layout consisted of Data Matrix codes of different size (cell size 0.25 mm - 1.5 mm with 0.25 mm intervals). After printing the codes are clear, and when exposed to UV or sunlight turn red in approximately 10-30 seconds. The red colour starts to fade immediately when the light source is removed. Printed samples are presented in Figure 13 and Figure 14. The codes with cell size 0.5 mm or

Page 17/81
more were of good print quality and cells were reproduced properly, but there was too much ink spreading in codes with cell size 0.25 mm. The same applied to all substrates used.
Figure 13. Data Matrix codes with 1 mm cell size printed with a reversible photochromic ink when under UV light. From left: copy paper with 38 cm3/m2 anilox, copy paper with 18 cm3/m2 anilox, IJ label with 38 cm3/m2 anilox, IJ label with 18 cm3/m2 anilox, PE coated paper with 38 cm3/m2 anilox, and PE coated paper with 18 cm3/m2 anilox.
Figure 14. Data Matrix codes with different cell size printed with a reversible photochromic ink when under UV light on copy paper with 38 cm3/m2 anilox. The Data Matrix codes were detected with Samsung Galaxy S7 mobile phone and Upcode code reader software was used. With all the substrate and anilox combinations codes with cell size down to 0.50 mm were decoded correctly. With the copy paper substrate also codes with 0.25 mm cell size were occasionally decoded. Colour change from clear to red occurred in less than 30 seconds under UV light that simulated sunlight. Screen printing of a red reversible photochromic ink (Chameleon water based screen ink RED from LCR Hallcrest) was carried out on different substrates (copy paper, IJ label) in order to produce even darker codes since compared to flexography printing screen printing produces thicker ink layers. One, two and three ink layers were printed. The printing layout consisted of Data Matrix codes of different size (cell size 0.25 mm - 1.5 mm with 0.25 mm intervals). After printing the codes are clear, and when exposed to UV or sunlight turn red in approximately 10-30 seconds. The red colour starts to slowly fade when the light source is removed, but remains slightly red even after 24 hours. Printed samples are presented in Figure 15. With both the substrates the codes with all the cell sizes were of good print quality and cells were reproduced properly. When multiple layers were printed, the ink started to crack and deattach from the substrate (Figure 16). Also, when printed with a laboratory scale printer the ink started to dry on the screen mesh quite soon. Thus, it seems to be more suited for high speed printing (pilot and industrial scale). Also a blue version of the same ink was tested (Chameleon W/B screen ink, photostar BLUE, from LCR Hallcrest), but it dried more quickly and only one ink layer samples were produced.

Page 18/81
Figure 15. Data Matrix codes with 1 mm cell size screen printed with a reversible photochromic ink when under UV light. From left: copy paper 1 layer, copy paper 2 layers, copy paper 3 layers, IJ label 1 layer, IJ label 2 layer, IJ label 3 layers, copy paper 1 layer, IJ label 2 layers.
Figure 16. Example of a printed Data Matrix code that is deteriorated due to ink cracking with multiple printed layers and ink drying during printing process. The Data Matrix codes were detected with Samsung Galaxy S7 mobile phone and Upcode code reader software. The codes printed with the red ink were decodable down to cell size 0.25 mm on every substrate. The codes printed with the blue ink were more challenging as the colour tone is not very dark (low contrast with the background) and the colour reverts back to clear stage very fast. Thus only the largest codes (with cell size 1.5 mm) were decodable. Except for IJ label substrate codes with 2 ink layers were decodable down to 0.25 mm probably due to an ink-paper combination providing dark enough contrast.
Digital printing Inkjet formulation of an irreversible red photochromic ink was carried out. The formulation contained water and alcohol (2:1), a surfactant (0.05 wt-%), and the photochromic ink slurry (10 wt-%, Lumi Inkodye RED). The formulation was inkjet printable with both inkjet printers and 10 ink layers were required for achieving dark enough colour for code detection with Lumia mobile phone. Printed tags were prepared for the M9 project review to demonstrate the brand protection use case, and approximately 10 tags were printed (Figure 17). The size of the tags was 3 cm x 3 cm. Colour change from clear to red when exposed to UV light occurred in less than 10 seconds, and when exposed to natural sunlight in less than 5 minutes.

Page 19/81
Figure 17. Printed tag with an inkjet printed photochromic ink (red QR code). The red QR code appears when exposed to UV or sunlight. Inkjet formulation for a reversible red photochromic UV curable ink was carried out. 5 wt-% of the red reversible photochromic ink (UV flexo red photo from CTI) was mixed with an inkjet printable UV curable RHO SPEC VARNISH (from Durst Phototechnic) that is a clear ink designed to be used as a protective layer on top of printed areas. The formulation was inkjet printable with PiXDRO LP50 printer. Immediately after printing it was UV cured for 2 seconds. The formulation seems to cure properly, but after curing the photochromic part of the cured area can be easily rubbed off. It seems like the formulation is mixed and printed properly, but after curing the components are incompatible and don’t provide a durable layer. Under UV light the printed QR code is bright red (Figure 18), but there is no adhesion of the colorant on the substrate. Also the formulation spreads significantly on all the tested substrates, except for photo paper.
Figure 18. Printed QR codes with an inkjet printed UV curable photochromic ink. From left QR code on photo paper under UV light, on right QR code printed on copy paper. 3.2.3 Flash reactive inks
Digital printing Inkjet formulation for an ink that fluorescence under camera flash light was carried out. 5 wt-% of a solvent based flasher ink (Thermostar inks, 4440 from LCR Hallcrest) was mixed with diacetone alcohol (DAA). The ink was successfully inkjet printable with PiXDRO LP50 printer. However, although the guidelines of the ink manufacturer were followed carefully (e.g. proper stirring before printing, curing at 150 oC, use of a glossy paper), the ink didn’t fluoresce under flash light. Samples were also prepared by hand-coating from the original ink without DAA addition, but no fluorescence also in this case. Since also the coating process wasn’t providing functional ink layers, no further printing trials were carried out.

Page 20/81
3.2.4 Oxygen indicator The oxygen indicator is a liquid ink printed or coated directly on the packaging material or on a sticker attached inside the package to monitor the product headspace. The system consists of two parts: the indicator inside the package and an outer label. The indicator provides irreversible evidence of leakage or tampering of a package. It is suitable for any product packed in a modified atmosphere or any other packages in which air is replaced with an inert gas. The indicator is attached in the package on the packaging line. It can be handled and stored in air at room temperature. After packaging (preferably with scavenger) the indicator is activated automatically or by touching the indicator with a heated tool. Activating by heat is needed for products stored in cold temperatures. The indicator changes colour from yellow, over green, to blue. The indicator turns to blue when piercing or leakage of the package occurs. The indicator reacts within minutes after tampering and operates in all temperatures. An outer label with a window can be printed with reference colours (Figure 19). Under perfect conditions the dot is yellow. If the dot is yellow/slightly greenish the product has not been compromised by any intrusion. When the dot reaches a blue colour it has detected intrusion in the package meaning the package is leaking/pierced/tampered. Alternatively the clear blue dot indicates that the indicator has not been activated and the safety of the product cannot be guaranteed. The product is not fit for use in either case and the customer should contact the supplier. VTT has developed and validated the indicator for food packages. The indicator is single use and can be easily disposed of with the packaging material. The outer label can present design and logos of the customer. The per unit cost is low.
Figure 19. Packages carrying the reactive ink in a window: activated and intact (yellow, left), leaking (blue, right). The outer label shows reference colours. The composition of the ink is proprietary. Basically, the active components and the binder polymer are dissolved in solvents, while observing the correct operation of the chemical reaction. The formulation for the printable ink is carried out. The selection of appropriate solvent, as well as finding the optimal formulation for flexo and inkjet printing, respectively, has been tricky. Tests on various formulations for their performance in flexo printing and inkjet printing are ongoing. Flexography printing of an oxygen sensitive ink (VTT, proprietary formulation) was carried out on plastic film (polyester film DuPont Melinex 504). Anilox 38 cm3/m2 was used, and one, two, five respective ten layers were printed. The printed ink was pale yellow. The larger anilox was chosen as more ink is transferred to the substrate thus producing a more distinct printed area. The printing layout consisted of Data Matrix codes of different size (cell size 1.00 mm - 1.5 mm with 0.25 mm intervals). The codes were of good print quality and cells were reproduced properly, but the colour shade was too pale when only 1 and 2 layers were printed. Five print layers gave a very good print quality. Ten layers gave also a very good print result, but when

Page 21/81
drying, thin threads were formed of the ink, and the print started to split. An example of the codes with different cell size is presented in Figure 20.
Figure 20. Data Matrix codes with cell sizes 1.00 mm, 1.25 mm, and 1.50 mm, 10 ink layers printed with a yellow oxygen sensitive ink on PET plastic film with 38 cm3/m2 anilox. The printed code was placed inside a plastic pouch made of barrier material on a position where it can be seen from the outside. The code was packed in an inert oxygen-free atmosphere (nitrogen) together with an oxygen scavenger. The oxygen scavenger needs some time to remove any remaining oxygen. The next day the package was opened and the colour change of the code resulting from reaction with air was documented by taking a picture. The colour change of the first tested ink was, however, quite weak but clearly noticeable. The colour change from pale yellow to pale green occurred in less than two minutes. In a second trial we reformulated the ink in such a way that the dye content was increased and the other components were adjusted as well. We prepared two versions, A and B, of the ink. Flexography printing was carried out as described above. Five and ten layers were printed. The codes were of good print quality and cells were reproduced properly. The colour of the print is green, the two versions of the ink formulation giving slightly different shades. The print colour does not change during storage in air.
Figure 21. Oxygen indicators with 10 ink layers (ink version A), cell sizes 0.50 mm to 1.50 mm

Page 22/81
5 layers (ink version A) 10 layers (ink version A) 5 layers (ink version B) 10 layers (ink version B)
Figure 22. Data Matrix codes 5 and 10 ink layers printed with two versions of oxygen sensitive ink on PET plastic film with 38 cm3/m2 anilox. The oxygen sensitive codes were packed in an inert oxygen-free atmosphere (nitrogen) together with an oxygen scavenger as described above. Four parallel samples were prepared. The packages were stored at room temperature until the next morning. The dye undergoes an automatic chemical reaction during the storage in oxygen-free atmosphere at room temperature resulting in a colour change to yellow. The oxygen sensitive prints are now activated. When the packages were opened the colour changed to green in a couple of minutes (less than 3 minutes). The colour changes during the functioning of the reacting ink were documented by taking photographs. The function of the indicator is illustrated in Figure 23.
Code just packed in inert atmosphere
Code the next morning
in activated state
Code 3 minutes after opening of package
Code 50 minutes after opening of package
Figure 23. Data Matrix code printed using oxygen sensitive ink version A, with cell sizes 1.50 mm, 10 layers. The Data Matrix codes were detected with Samsung Galaxy S7 mobile phone and Upcode code reader software. The codes printed with the green ink, 10 layers, were decodable down to cell size 0.5 mm. The codes printed with 5 layers were more challenging as the colour shade is quite pale. 3.2.5 Conclusions Different printing methods have been evaluated for their capability to print QR and Data Matrix codes with different functional inks on different paper based substrates. The code printing trials in laboratory scale have successfully met the pre-defined KPIs.

Page 23/81
KPI title Cell size printed ≤ 0.50 mm
Actors: Printhouses
Description: The printing accuracy for producing functional codes with good enough print quality for scanning
Trigger: Printing of codes with functional inks
Preconditions: Successful code encoding and printing job workflow
Normal Flow: Printing press transfers ink into the substrate according to the printing plate / digital file design
Notes and Issues: Depends on ink-substrate interactions and process conditions
Value 0.25 mm
KPI title Cell size scanned ≤ 0.50 mm
Actors: End users
Description: The scanning accuracy related to printing accuracy
Trigger: Scanning the codes
Preconditions: Successful code reproduction during printing
Normal Flow: User uses the code scanning application
Notes and Issues: Dependent on printing process success and scanning conditions
Value 0.25 mm
KPI title Colour change green-clear ≤ +8 oC
Actors: End users
Description: Thermochromic ink shows the correct use temperature when at coloured stage
Trigger: Product where code attached to at ≤ +8 oC
Preconditions: Successful code reproduction during printing
Normal Flow: Green colour appears when temperature drops below +8 oC.
Notes and Issues: Partial colour change already ±2 oC
Value +8 oC
KPI title Photochromic colour change clear-colour ≤ 10 min
Actors: End users
Description: Photochromic ink shown only under UV / sunlight
Trigger: Code scanning at UV / sunlight
Preconditions: Successful code reproduction during printing
Normal Flow: Code at coloured stage under UV / sunlight
Notes and Issues: Return to non-coloured stage slower, residue colour
Value 30 seconds
3.3 NFC manufacturing
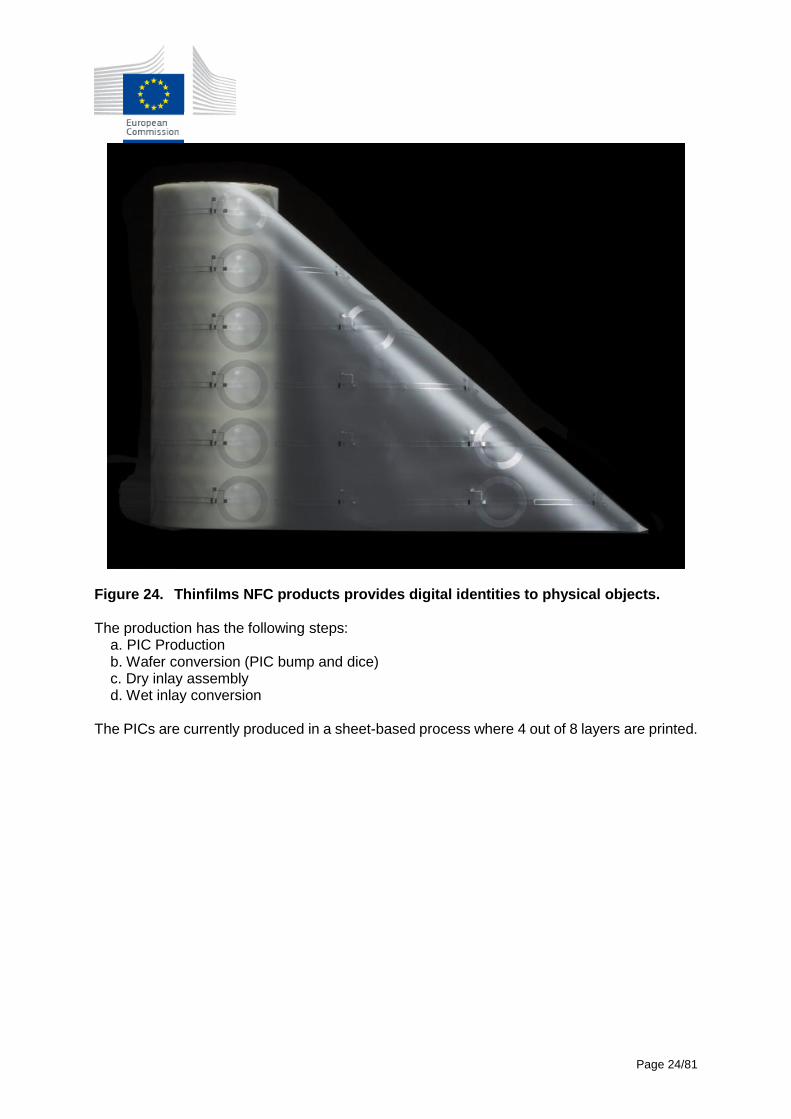
Thinfilm’s PDPS (Printed Dopant Polysilicon Technology) is used to produce the PIC (Printed IC) used in the NFC labels (Figure 24).
Page 24/81
Figure 24. Thinfilms NFC products provides digital identities to physical objects. The production has the following steps: a. PIC Production
b. Wafer conversion (PIC bump and dice) c. Dry inlay assembly d. Wet inlay conversion
The PICs are currently produced in a sheet-based process where 4 out of 8 layers are printed.

Page 25/81
Figure 25. The PICs are produced on stainless steel sheets. The PDPS (Printed Dopant PolySilicon) PICs for NFC Speedtap and NFC Opensense are produced at Thinfilm Inc in San Jose, California, USA. Thereafter, the sheets are shipped to China where they are converted at third party suppliers. The wafers are diced and thereafter converted to dry inlays and finally into wet inlays.
Figure 26. The production of the NFC labels from PIC production to wet inlays. Upper left: PIC production. Upper middle: Wafer conversion Upper right: Dry inlay assembly Lower left: Wet inlay conversion.

Page 26/81
After the conversion to wet inlays, the remaining steps are to place the labels on the final product. This is typically done by a converter or by the customer. Thinfilm have qualified converter partners to assist with this steps. Thinfilm is in the process of scaling up the production of the PICs which is the base of the NFC products. The objective is to invest in roll to roll production equipment with the goal of being able to produce 5 billion PICs annually.
Conclusions Thinfilm’s NFC products are delivered in the form of wet inlays to customers. The wet inlay is a sticker that can be placed onto products. Up to this point, the produced labels have been susccessfully manufactured and used for scanning testing (see Section 5.4).
KPI title NFC manufacturing successful
Actors: NFC manufacturers and integrators
Description: NFC production gives a sufficient yield of working NFC tags
Trigger: Performance testing of NFC tags (visual and functional properties)
Preconditions: Manufacturing steps working and integrated with good registration and detail rendering
Notes and Issues: Printing and hybrid technologies used suitable for flexible substrates
Value Yes

Page 27/81
Section 4 - TagItSmart repositories for storing and retrieving Deliverable D2.1 generated the first identified semantic model for FunCodes and associated artifacts. As observed resources and exposed services descriptions can be augmented through the use of domain specific ontologies. This makes use of the linked data paradigm which is a key concept of the semantic technologies. Semantic support for the components described in the reference architecture presented in D1.2 [19] is backed by a set of ontologies which either were developed as part of TagItSmart (the SmartTag ontology) or are reused from other sources (such those for IoT related concepts or the domain specific ones). Full or partial reuse of ontologies is preferred when the referenced concepts and their relations are already captured by existing and production proven ontologies. This also facilitates integration with other semantic datasources as well as further developments, beyond the scope of the project. Still, domain ontologies can be built by use case developers, TagISmart enabled Applications or TagItSmart-extensions developers to support the description of their use cases and most probably of the physical entities which their virtualized objects are representing. In some use cases new domain specific ontologies will be required since in some cases existing ontologies cannot be reused. In fact, from the perspective of the TagItSmart ontologies, there is no constraint regarding domain specific ontologies which are referenced in the semantic descriptions. D2.1 contains the description of a sample domain ontology which has been built around the early use case scenarios. The following figures are depicting the definition for a digital tag as sample of generic, highly reusable model, and that of the dynamic pricing use case, which is a more specific, targeted application. In TagItSmart a combination of such ontologies (see also D2.1 for the IoT related ones) provides a flexible modelling mechanism loosely coupled at design time but with the ability of being linked at instatiation time.
Figure 27. Semantic model for the digital product tag

Page 28/81
Figure 28. Semantic model for the dynamic pricing QR Code 4.1.1 Sematic Registries and discovery As can be observed, proper retrieval of the virtual representations and other TagItSmart related entities’ descriptions is a key requirement for the identification, access and sharing mechanism. To support this requirement we have designed a semantic registry whose role is to provide the adequate functionality for the retrieval of virtualized objects annotations. A semantic registry is implemented as a set of Semantic Store Access Microservices. This way each registry component is implemented as a microservice thus providing enhanced flexibility and modularity. By avoiding a monolithic approach each component of the registry can be developed, enhanced and maintained independently of the other. Components are also easily replaceable and this approach also strongly facilitates a distributed deployment. This also provides an improved separation of data and better supports different data ownership.
Page 29/81
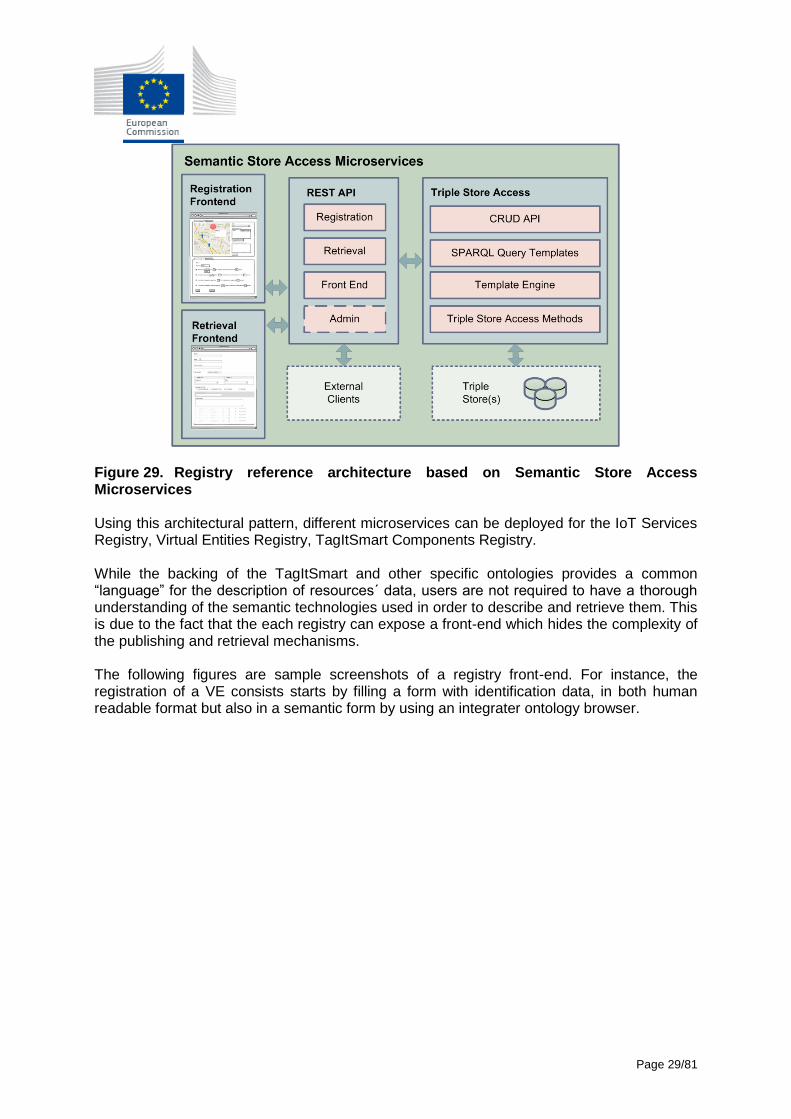
Figure 29. Registry reference architecture based on Semantic Store Access Microservices Using this architectural pattern, different microservices can be deployed for the IoT Services Registry, Virtual Entities Registry, TagItSmart Components Registry. While the backing of the TagItSmart and other specific ontologies provides a common “language” for the description of resources´ data, users are not required to have a thorough understanding of the semantic technologies used in order to describe and retrieve them. This is due to the fact that the each registry can expose a front-end which hides the complexity of the publishing and retrieval mechanisms. The following figures are sample screenshots of a registry front-end. For instance, the registration of a VE consists starts by filling a form with identification data, in both human readable format but also in a semantic form by using an integrater ontology browser.
Page 30/81
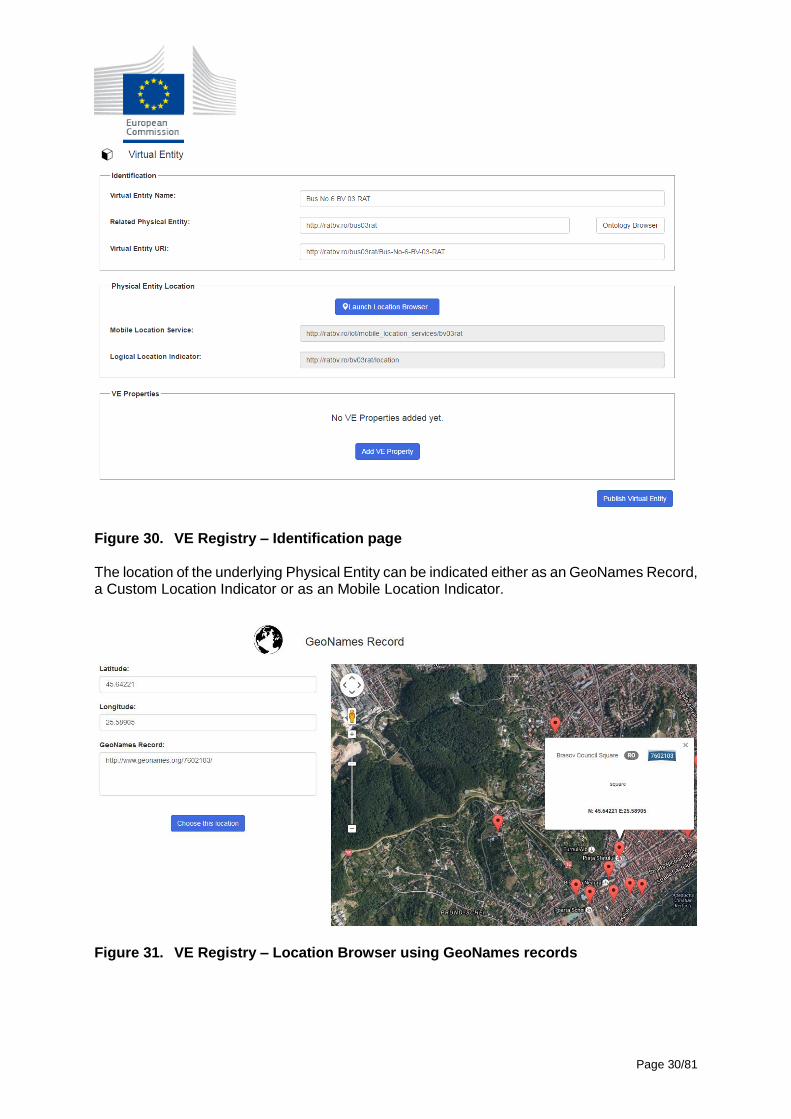
Figure 30. VE Registry – Identification page The location of the underlying Physical Entity can be indicated either as an GeoNames Record, a Custom Location Indicator or as an Mobile Location Indicator.
Figure 31. VE Registry – Location Browser using GeoNames records

Page 31/81
Each property which the VEs are exposing are also adnotated semantically and linked to their enpoinds. The endpoints a providing the actual access to the resource by referencing IoT services.
Figure 32. VE Registry – VE property definition form IoT service endpoints are also semantically adnotated using the IoT Service Registry in order to facilitate their retrieval and provide the necessary metadata for interface compatibility testing.
Figure 33. IoT Service Registry – Endpoint definition

Page 32/81
An essential feature of a semantic registry is related to the ability to search and retrieve the related data for entities which have been adnotated. This functionality is exposed through a multicriteria search API but can also be backed by a frontend such the one depicted in the following figures.
Figure 34. Entity Multicriteria Search Frontend The results are shown in a table like format and also in a graph based representation.
Figure 35. Search Results List The Graph Representation of the search results shows the existing relations of the search item and also provides the ability to navigate the nodes by making use of the linked data paradigm, upon which the semantic registry is based.

Page 33/81
Figure 36. Search Results in Graph Representation The registries’ back-ends are responsible for adequate storage, retrieval and maintenance of these descriptions. As also described in D2.1 and D4.1, triple stores provide the support for the persistence of the semantic descriptions made for FunCodes and other related entities and components. Moreover, the Registry exposes an API which can be used without any knowledge of the underlying technologies. Nevertheless, the exposed REST API also allows external clients (such as other components, Applications, peer IOT components) to connect to the registries and access their functionalities. The stores are accessed using SPARQL queries but the complexity of these queries is hidden to the user of the registries. The API provides access to CRUD operations from a higher level (virtualized object description) and handles transparently the triple creation, removal, update and deletion.
Evaluation The evaluation of the semantic registries and of the discovery mechanisms includes two components. The first one is related to actual semantic model being used in the semantic registries while the second one relates to he actual operation of the registries. The core part of the semantic model includes the concepts and relations used to describe IoT resources, services and their related enties. This is the part which has been reused used with

Page 34/81
minor udpates and has been successfully validated in EU projects such as IoT.est, UNCAP and COSMOS. The mechanisms used to implement the functionality of the registries have also been validated in the previously mentioned projects but the new version, improved for higher performance and optimized for the usage scenarios specific to TiS, has been implemented based on the architecture depicted in Figure 36. The evaluation of the developed registries has been performed on the internal testbench using automated tools for registry access (CRUD operations) and performance measurements.
Conclusions This section presented the semantic registries and the discovery mechanisms. As demonstrated by our laboratory tests, the performance of the registries rebuild on the improved architecture is beyond our expectations. As the architecture was designed in order to support a distributed deployment model, further work will be focused on integration with the other TiS components and testing it in an distribuited environment.
KPI title Average query response time without federated queries < 2s
Actors: Application developers, client components
Description: Measure response time for queries which do not require quering external triple stores.
Trigger: A query (implementing a single CRUD operation) requested to a a registry
Preconditions: Client authenticated
Normal Flow: An authenticated client user either the UI or directly the API of the registry in order to perform any CRUD operation
Notes and Issues: Current triple stores perform much better on retrieving data rather than on frequent updates. Tests where performed on a triple store containing 50.000 triples
Value Average value measured in laboratory 1,78 on a commodity grade PC.

Page 35/81
Section 5 - SmartTag Scanning 5.1 Scanner authentication module
5.1.1 User authentication using location One task of WP3 is to deliver an authentication module that is able to determine whether the user of the phone is the ‘rightful’ user, or whether the phone has been obtained illicitly by another user, termed an ‘imposter’. The rightful user is the person who should be in possession of the phone, such as the owner of the device. The imposter is an illicit user such as a thief who would like to use the phone to gain access to information and perform actions, such as using internet banking services, that should only be used by the rightful user. Deliverable D3.1 [4] detailed the state-of-the-art in terms of biometric authentication. The deliverable discusses novel biometrics which have arisen due to the ubiquitous smartphone that has allowed the measuring of human traits other than the traditional biometrics such as fingerprints and facial recognition. One novel biometric that is appealing for use as authentication data is mobility patterns. An extensive study by researchers at MIT led to a publication in Nature Magazine [5] which shows that mobility patterns can be considered to be as unique as fingerprints. Fifteen months of human mobility data for one and a half million individuals was studied and it was shown that four spatio-temporal points were enough to uniquely identify 95% of the individuals, showing that location-based authentication is a feasibility and a useful novel biometric. Since this research, several publications have examined the performance of location-based authentication using different approaches. Fridman et al [6] propose an authentication approach that uses location-based authentication in addition to three other biometric modalities. Location information was sampled at regular intervals of 1 minute and the latitude and longitude pair of values was used as input in to a support vector machine with the radial basis function kernel. An examination of the performance of the individual classifiers indicated that the location-based authentication classifier contributed the most to the performance of the fusion system. Mahbub et al. [7] proposed the algorithm, PATH (Person authentication using trace histories). The PATH authentication mechanism uses latitude, longitude and time as input into an algorithm which uses hidden Markov models to construct a model of the user mobility, where between one and four weeks was used to construct a model of the users mobility patterns. On a dataset specifically created to examine the authentication performance, it was shown to achieve an equal error rate of at most 20.73% In this deliverable, the initial algorithm for location-based authentication is presented. The aim is to show the operation of the algorithm and for it to identify the rightful user. The algorithm is evaluated on a mobility data set that has been used in previous publications on location-based authentication.
Algorithm The aim of authentication is to ensure that the user of the device is the rightful user, and not an imposter. Location-basd authentication performs user authentication based on the current location of the user and the user’s previous locations in the near past. Location information is obtained in the form of GPS coordinates from the user’s smartphone. The location service in a smartphone returns the GPS coordinates of the phone in terms of latitude and longitude. In addition to the location information, the GPS coordinates are time-stamped, therefore it is possible to model the users movements in time as well as space.

Page 36/81
The location data for a user consists of a sequence of data points, where each data point is a tuple containing the latitude, longitude and timestamp. This sequence of points for a time series that can be used to model the user’s behaviour. In the following sections, the algorithm to perform location-based authentication is detailed.
Data collection and pre-processing One data instance forms a tuple of the latitude, longitude and time, however, for the current iteration of the algorithm time is excluded. Therefore, each data instance consists of 𝑑𝑖 = [𝑙𝑎𝑡𝑖𝑡𝑢𝑑𝑒, 𝑙𝑜𝑛𝑔𝑖𝑡𝑢𝑑𝑒] The dataset consists of a time-ordered sequence of data instances. There is one dataset for each user. For the training dataset, the [𝑙𝑎𝑡𝑖𝑡𝑢𝑑𝑒, 𝑙𝑜𝑛𝑔𝑖𝑡𝑢𝑑𝑒] data are normalized so that one feature does not dominate. This is then used to construct the model of the normal pattern of data. After initial data collection and model construction, future data instances are normalized in the same manner. These are then used to authenticate the user.
Model construction The aim of model construction is to use the training data to construct a model that can then be used to authenticate the user based on their mobility pattern. A machine learning approach is taken in order to create a model of a sequential time-series. This is a one-class classification problem where the training set consists of data from the rightful user and the testing set consists of the rightful user and the imposter. This is a well researched area, for example [8, 9, 10]. The machine learning method chosen is to project the data into a phase-space [11] in order to retain the time-ordered nature of the sequence. Then k-nearest neighbours is chosen to determine whether the current test data instance (authentication attempt) is from the rightful user. K-nearest neighbour allows the identification of points that are close, in terms of Euclidean distance, the data instances in the training set. The first step is to project the data tuple [𝑙𝑎𝑡𝑖𝑡𝑢𝑑𝑒, 𝑙𝑜𝑛𝑔𝑖𝑡𝑢𝑑𝑒], into a phase space using a trajectory matrix. An embedding is constructed where the original time series for the latitude and longitude is mapped into a series of lagged vectors of size L. For example, the first lagged
vector is 𝑋1 = (𝑥1, … , 𝑥1+𝐿−1 )𝑇, the second is 𝑋2 = (𝑥2, … , 𝑥2+𝐿−1 )
𝑇 etc. Therefore, although the time element has been removed, each feature vector contains a small subset of the entire time series. This allows the retention of the dependency between data measurements in the time series. The lagged vectors form the columns of the trajectory matrix. This forms the features which represent the dynamics of a time series in the phase space.
𝑿 = [𝑋1: … : 𝑋𝐾] = (𝑥𝑖𝑗)𝑖,𝑗=1𝐿,𝐾
Formation of the lagged vectors.
𝑋𝑖 = (𝑥𝑖 , … , 𝑥𝑖+𝐿−1 )𝑇 (1 ≤ 𝑖 ≤ 𝐾) = (
𝑥1 ⋯ 𝑥𝐾
⋮ ⋱ ⋮𝑥𝐿 ⋯ 𝑥𝑁
)
Trajectory matrix There is one trajectory matrix for the latitude, and one for the longitude. These trajectory matrices are stacked horizontally. This produces a dataset that occupies a Euclidean space of

Page 37/81
ℝ2𝑚 , where m is the embedding dimension. The dataset still has a time and sequence element to it (i.e. the data instances are not independent and identically distributed). The dataset can be operated on with many standard machine learning methods. K-nearest neighbours was selected as it is non-linear and has been shown to have good performance with one-class classification problems [12, 13]. K-nearest is a well-known machine learning algorithm first proposed by Fix and Hodges [14]. It is a non-parametric approach which determines the distance of a testing data instance to the k-nearest neighbours in the training set. The smaller the distance, the more “similar” the points are to those in the training set.
Figure 37. System overview for the location-based authentication
Evaluation The purpose of the location-based authentication module is to determine that the algorithm is able to authenticate the rightful user and to not authenticate an imposter within specified performance metrics. The relevant KPI for the authentication module is
Scanner authentication module: Authorized access ≥ 75 %
An additional aim is to provide feedback on the current algorithm in order to perform an iterative improvement before it is implemented as an Android app for the open calls.
Evaluation framework The evaluation took place offline (i.e. not on smartphone), as this allows faster prototyping of the algorithm and evaluation. Although the evaluation took place offline, the evaluation was still close to the environment that the authentication module will operate on. A mobility dataset, the Geolife GPS trajectory dataset [17] was used for the evaluation. This dataset has been used in the evaluation of other location-based algorithms [9].

Page 38/81
The evaluation is performed on 20 users who have provided geo-location data for 6 weeks or more and follow a similar pattern in their mobility. All the users live in the city of Beijing, China. Figure 38 shows the GPS traces of the 20 users displayed as a heatmap. It can be seen that there are several locations that are frequently visited by the users, and this corresponds to the fact that the users were enlisted from one corporation with offices in Beijing. The horizontal and vertical lines correspond to roads in the city of Beijing. Figure 39 and Figure 40 show the GPS traces of 3 users in detail on a map of Central Beijing. It can be seen that the users follow a regular pattern in their mobility movements, with a small number of excursions to places that are visited only once. It is this regular mobility that allows a model to be trained on the pattern, and then for future movement following the same pattern to be identified. We remind the reader of the result of the MIT research [5] that states that human mobility patterns are as unique as a fingerprint. For example, User 3 appears to have a regular commute into central Beijing along the G2 highway to a location in the west of central Beijing. In addition, the user makes less regular trips to a location in the North West of central Beijing. This repetitive behaviour will be modelled and used to authenticate the user on future trips along this path.
Figure 38. The mobility pattern of users To evaluate the performance of the algorithm to authenticate users based on their mobility pattern, standard evaluations and metrics from the field of biometrics were used. For each user, 6 weeks of mobility data from the Geolife GPS trajectory dataset was used. The data in the dataset was collected at irregular intervals and with a high frequency. Therefore, the data was downsampled to 1 GPS location a minute. This provided a dataset that was the equivalent of a smartphone providing the GPS location to an authentication app every minute, a highly

Page 39/81
feasible operation for a smartphone. The result was 20 datasets each consisting of 42 days of mobility data. To evaluate the authentication performance for a specific user, first a model was constructed using the first 3 weeks as a training set. This enabled the model to be constructed using the user’s mobility pattern. To evaluate the performance, a testing data set is required. The testing data set for the current specific user consisted of the remaining 3 weeks of the training set. In addition, the final 3 weeks of the remaining 19 users was used to provide testing data for an imposter. The aim is for the algorithm to distinguish between the rightful user and the imposter. Therefore there are 4 results from each testing data item.
Figure 39. Users 2 and 9
True positive (TP) – Correctly identify rightful user
True negative (TN) – Correctly identify imposter
False positive (FP) – Incorrectly identify an imposter as a rightful user
False negative (FN) – Incorrectly identify a rightful user as an imposter
This leads to various metrics that are used to evaluate performance.
True positive rate = TP/Total positive
True negative rate = TN/Total negative
False positive rate = FP/Total negative
False negative rate = FN/Total positive

Page 40/81
In biometrics, the crossover error rate between the false positive rate and the false negative rate, termed the equal error rate (EER) is often used to evaluate performance. This metric aims to balance the trade-off between falsely accepting an imposter and falsely rejecting a rightful user. The lower the value of the EER, the more accurate the model.
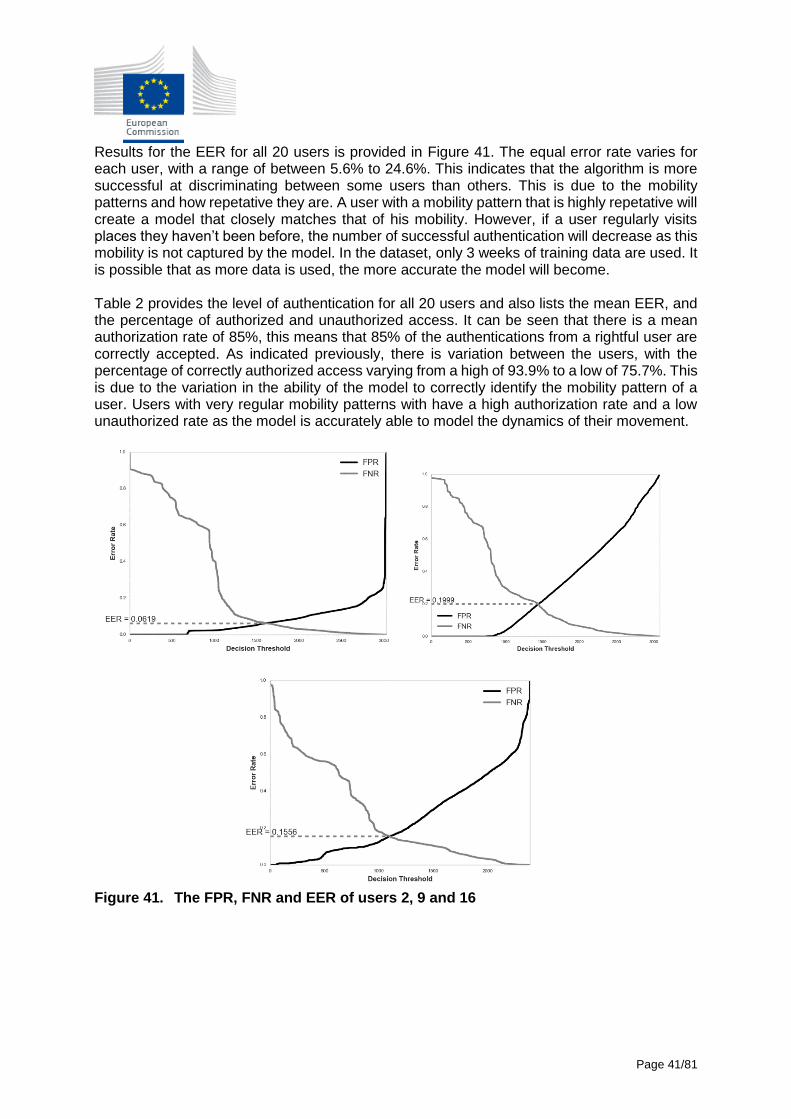
Evaluation results The algorithm is evaluated using the datasets described previously, with metrics used to evaluate biometrics. Figure 40 shows the FPR, FNR and EER for users 2, 9 and 16 whose mobility data is displayed in Figure 38 and Figure 39. It can be seen that there exists a trade-off between the FPR and FNR where a low decision threshold will result in a low number of false positive (imposter incorrectly authenticated) but a high number of false negatives (rightful user incorrectly rejected). The opposite occurs when selecting a high decision threshold. The EER aims to balance these by selecting a value that leads to the minimum number of false positives and false negatives.
Figure 40. Users 16
Page 41/81
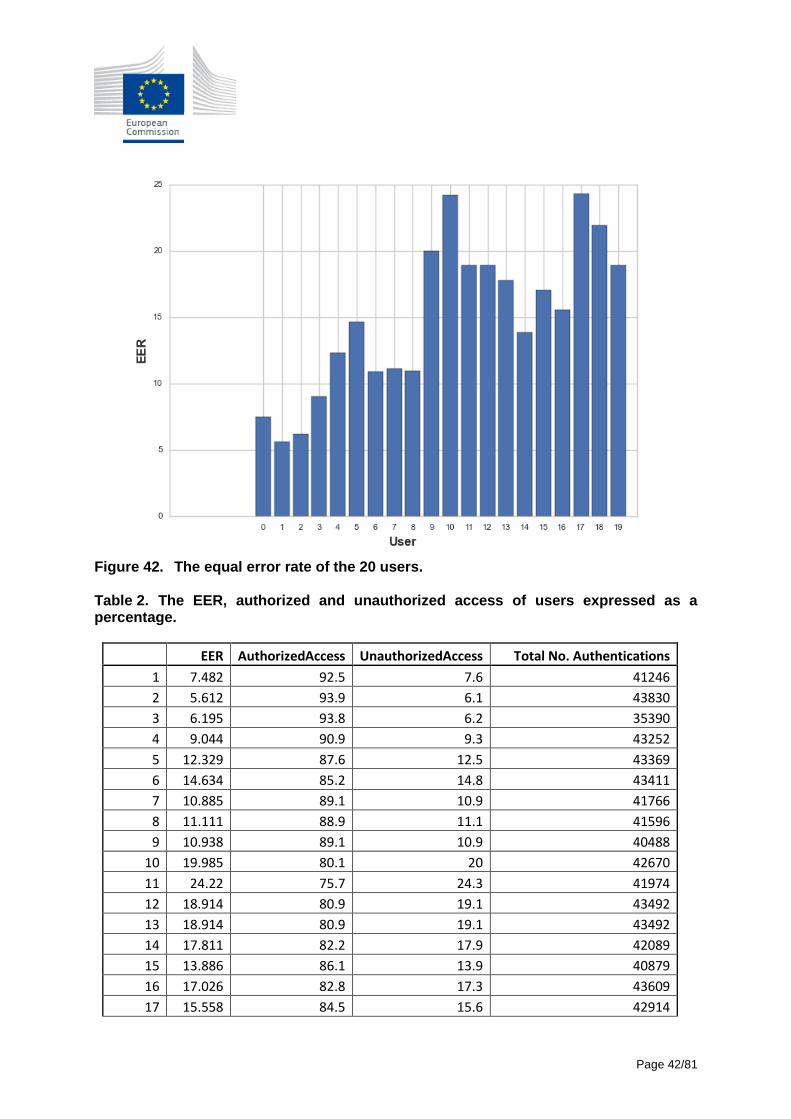
Results for the EER for all 20 users is provided in Figure 41. The equal error rate varies for each user, with a range of between 5.6% to 24.6%. This indicates that the algorithm is more successful at discriminating between some users than others. This is due to the mobility patterns and how repetative they are. A user with a mobility pattern that is highly repetative will create a model that closely matches that of his mobility. However, if a user regularly visits places they haven’t been before, the number of successful authentication will decrease as this mobility is not captured by the model. In the dataset, only 3 weeks of training data are used. It is possible that as more data is used, the more accurate the model will become. Table 2 provides the level of authentication for all 20 users and also lists the mean EER, and the percentage of authorized and unauthorized access. It can be seen that there is a mean authorization rate of 85%, this means that 85% of the authentications from a rightful user are correctly accepted. As indicated previously, there is variation between the users, with the percentage of correctly authorized access varying from a high of 93.9% to a low of 75.7%. This is due to the variation in the ability of the model to correctly identify the mobility pattern of a user. Users with very regular mobility patterns with have a high authorization rate and a low unauthorized rate as the model is accurately able to model the dynamics of their movement.
Figure 41. The FPR, FNR and EER of users 2, 9 and 16
Page 42/81
Figure 42. The equal error rate of the 20 users. Table 2. The EER, authorized and unauthorized access of users expressed as a percentage.
EER AuthorizedAccess UnauthorizedAccess Total No. Authentications
1 7.482 92.5 7.6 41246
2 5.612 93.9 6.1 43830
3 6.195 93.8 6.2 35390
4 9.044 90.9 9.3 43252
5 12.329 87.6 12.5 43369
6 14.634 85.2 14.8 43411
7 10.885 89.1 10.9 41766
8 11.111 88.9 11.1 41596
9 10.938 89.1 10.9 40488
10 19.985 80.1 20 42670
11 24.22 75.7 24.3 41974
12 18.914 80.9 19.1 43492
13 18.914 80.9 19.1 43492
14 17.811 82.2 17.9 42089
15 13.886 86.1 13.9 40879
16 17.026 82.8 17.3 43609
17 15.558 84.5 15.6 42914

Page 43/81
18 24.311 75.7 24.4 41669
19 21.948 78 22 41921
20 18.925 81.3 18.9 37437
Mean 15.0 85.0 15.1
Integration with the TagItSmart Framework The aim of the authentication module is to determine whether the rightful user or imposter is currently in possession of the phone. Continuous authentication occurs every minute and the result is transmitted to the TagItSmart Context Manager. The Context Manager stores the result of the last authentication. Applications are able to query the current status of a particular smartphone to determine whether the user is currently authenticated or not. Figure 43 illustrates the proposed architecture of the system for authentication for TagItSmart. The smartphone obtains the location data for a user and constructs a model of the user’s mobility pattern. Once the model is constructed, the authencation process can begin. Authentication occurs in the background and a Boolean True or False is communicated to the Context Manager. The Context Manager stores the user’s ID and the current result of the authentication. Applications are then able to query the Context Manager using the NGSI interface to determine the current result of the authentication. The TagItSmart Context Manager will be implemented using the Fiware Context Broker [15]. The implementation from the SocIoTal project [16] will be used.
Context Manager
Smartphone
Backend Application
3. Subscribe to context
4. Update authenticaton on
change
1. Post authentication
result
2. Send info
5. Return information
Figure 43. The architecture of the authentication system for TagItSmart

Page 44/81
Future work
The next step is to perform an iterative improvement of the algorithm. It will then be implemented as an Android app that will be available for the open calls. The infrastructure will then be set up, this will include the deployment of an instance of the Context Manager for the posting of the authentication results.
Conclusions In this deliverable, the location-based authentication enabler has been presented. The function and operation of the algorithm has been detailed. In addition, the enabler has been evaluated in a laboratory environment on a dataset that has been used in previous research to examine the authentication performance. The next step for the authentication enabler is to perform an iterative improvement on the algorithm based on the feedback that has been obtained from the evaluation on a mobility data set. Further evaluations will be performed using data gathered specifically for the purpose of performing authentications. The algorithm will then be implemented as an Android App that will be available for the open calls.
KPI title Authorized access ≥ 75 %
Actors: End user smartphone
Description: User correctly authenticated
Trigger: Authentication occurs automatically at 1 minute intervals
Preconditions: Training has occurred on the smarphone
Normal Flow: Automatic authentication
Notes and Issues: The value will change between users. We look for a mean rate
Value Mean of 85% over 20 users
5.1.2 Scanner authentication using biometrics To ensure that only the authenticated customer will be able to access the FC-scanner application running on its mobile device, we add an authentication technique on top of the traditional authentication mechanism (i.e., login details). In particular, it is a biometric mechanism that accurately authenticate users typing on mobile devices using their typing behaviour. This application will implicitly authenticate a user while she is typing a password to unlock their mobile device (i.e., at device level) or the FC-scanner app (i.e., application level). The key idea is to combine the traditional timing based characterization adopted in keystroke dynamics with movement sensors information that reflects the unique typing behavior of each user.
KPI title FC-scanner Authentication
Actors: Consumer
Description: ensure that only the authenticated customer will be able to access the FC-scanner
Trigger: Typing a password to unlock their mobile device or ) or the FC-scanner app
Normal Flow: This application will implicitly authenticate a user while she is typing on their mobile device by using keystroke dynamics with movement sensors information.

Page 45/81
Notes and Issues: Requires Android type smartphones.
Value Authenticated / Not Authenticated
5.2 Scanning Data Matrix codes
Scanning procedure of TagItSmart code is still in development phase. Because of different prototypes of physical code, there have been many versions of reader procedure. In WP2 we have defined preliminary enablers, which are key part in reading procedure. Thescanning procedure is as follows:
TagitSmart code is read by scanner app in mobile phone, this procedure follows guide
lines set in D2.2 [18]. In short, device camera is powered up to capture frames in real-
time form camera. For each frame image processing in done to prepare frame for
decoding. In the decoding data matrix shape is looked up, if shape is found it is
identified more accurately (position, size, orientation etc…). After that actual decoding
process is done, this follows data matrix standard guidelines, once decoding is
successful, sensor rectangle and its color is decoded. Both, sensor color information
and data matrix content are stored in to device memory for later use.
Unique id of code is used to find VE of this code, contents of the data matrix act as
identifier for item. This content is used to find appropriate VE from local database (that’s
synchronized with cloud database) or directly from cloud database.
VE have attributes, which have information of sensor type and range of acceptable
values. As this VE contains important information (like what sensor should item have)
it is used to validate scanning results.
Sensor value (mobile app) is compared into VE info, sensor value decoded from data
matrix is compared to VE information, if value is out range certain procedures are done
(user is warned that tag might be tampered).
User and device access level is checked, once scanning process is validated user and
device access levels is defined based on various procedures, including device ID, user
name, etc. This information is used locally with device to display some information or
when sent to cloud server.
Information of reading procedure is updated into TagItSmart database (timeseries), this
action changes lifecycle of the item, updates the data behind VE or does some other
action or only gets relevant information for TIS server.
Information of Digital Product and sensor value is shown to end user
Figure 44. 3rd generation of 2-D code in reader app with sensor data

Page 46/81
5.2.1 Conclusions KPIs presented in the table below are a summary of results from reading Data Matrix codes fully printed with a thermochromic ink (colour change at +8oC, see printing results in Section 3.2.1) and reading Data Matrix codes printed with regular inks, but containing areas printed with a thermochromic ink (see Section 6.1 for printing description). Otherwise the KPIs have been met, but scanning reliability with the sensor area is not yet at 95 %. Further work is carried out to meet this target.
Result title Scanning reliability ≥ 95 %
Actors: Consumer and retailer
Description: The scanning reliability for recognition of the SmartTag (DM Code with sensor bar)
Trigger: User opens the application and scans the code
Preconditions: SmartTag printed with proper registration and detail rendering
Normal Flow: Once the user opens the application and scans the SmartTag code the extracted alphanumeric string should be shown with accuracy of ≥ 95 %
Notes and Issues: The reader reliability is directly correlated to the angle and
distance of scanner during the scanning process. Tag size
was 1.8 cm x 1.8 cm. Lightning conditional and reading
angles varies during test. N = 45
Measured value 95% for codes printed with a functional ink
88% for codes containing a sensor area
Result title Scanning Speed < 2 s
Actors: Consumer and retailer
Description: The scanning Speed for recognition of the SmartTag
Trigger: User opens the application and scans the SmartTag
Preconditions: SmartTag printed with proper registration and detail rendering
Normal Flow: Once the user opens the application and scans the DM code the extracted alphanumeric string should be read in < 2 s
Notes and Issues: The reader reliability is directly correlated to the angle and
distance of scanner and lightning condition during the
scanning process
Measured value Average speed 2.1 s for codes printed with a functional ink
Average speed 2.7 s for codes containing a sensor area
Result title Tag size ≤ 1.8 cm x 1.8 cm
Actors: Manufacturer
Description: Size of tag should be larger than 1,8 cm x 1,8 cm
Trigger: User opens the application and scans the DM Code
Preconditions: SmartTag printed with proper registration and detail rendering
Normal Flow: Once the user opens the application and scans the DM code the extracted alphanumeric string should be read in < 2 s.
Notes and Issues: Printing method has affect for edge sharpness of cells
Measured value 0.5 mm cell size is smallest readable code.
Code size is then 1.8 cm x 1.8 cm
Page 47/81
Result title Lightning conditions ≤ 100 lux
Actors: Consumer and retailer
Description: It should be possible to read code under 100 lux
Trigger: User opens the application and scans the SmartTag (DM with sensor bar)
Preconditions: SmartTag printed with proper registration and detail rendering
Normal Flow: Once the user opens the application and scans the DM code the extracted alphanumeric string should be read in < 2 s.
Notes and Issues: Type of mobile phone and type of ambient light has influence
for result.
Measured value average 2.1 sections in 35-40 lux (functional ink)
average 2.4 seconds in 35-40 lux (sensor area)
5.3 Scanning QR codes
5.3.1 Scanning service including Coelition Atom for consent tracking The Coelition standard includes the ability to record the act of a consumer granting consent for their personal data to be used for specified purposes. This capability will be needed by all services that need to use consumers' personal data once the GDPR come into effect on May 25 2018. This service, which will be available from a RunMyProcess enabled application will allow the consumer to set, change and with their consent to the use of their persona data. It will then also tag each scan with the consent agreement along with the scan result and contextualized personal data, e.g. location. Related KPIs are presented below based on evaluation of the process during service development.
Result title Consent Granting (Interactive)
Actors: Consumer, Gateway Application, RMP, & Coeliton Data Engine.
Description: The granting of consent function allows the consumer to specify the purposes (see Purposes KPI) for which their data will be used. This function should be easy to use and perform at interactive speed.
Trigger: Consumer request to scanning application.
Preconditions: The application provider must have an account with the Data Engine and the Consuer must be a registered Consumer on the data engine. Initial granting of consent is likely to be part of the sign up process for the consumer.
Normal Flow: Trigger consent process, display privacy policy, present consent purposes, tick boxes accordingly, click grant consent.
Notes and Issues: None.
Measured value Boolean,e.g. the function exists and is at iinteractive speed.
Result title Updating or Withdrawing Consent (Interactive)
Actors: Consumer, Gateway Application, RMP, & Coeliton Data Engine.
Description: The modification of consent function allows the consumer to change or withdraw completely the purposes (see Purposes

Page 48/81
KPI) for which their data may be used. This function should be easy to use and perform at interactive speed.
Trigger: Consumer request to scanning application.
Preconditions: The consumer must have previously granted consent.
Normal Flow: Trigger consent process, display privacy policy, present consent purposes, tick boxes accordingly, click grant consent.
Notes and Issues: None.
Measured value Boolean,e.g. the function exists and is at iinteractive speed.
Result title 16 Purposes Identifies
Actors: Gateway Application & RMP
Description: There are 16 purposes outlines in the GDPR framework. These are the porposes to which the consumers data can applied.
Trigger: Not a triggered KPI.
Preconditions: None
Normal Flow: Not a process KPI.
Notes and Issues: None.
Measured value Integer between 0 and 16 inclusive.
5.3.2 Scanning with context While the SmartTag with the QR code is able to identify the object and the corresponding sensor information depending on the configuration of the ink used, the scanning process can be enhanced with context information that will complement and trigger different reactions to the scanning in the services that process it. Context information can be added to the scanning action by either the FC-Scanner or the services that process the scanning, which are able to exploit the application and the additional sensors available. The scanning with context will be based on SCANTHNG, a technology developed in EVRYTHNG’s platform that is designed to be used to recognize printed ID codes and product logos on physical objects. The concept is to create a scan action upon a successful recognition and decoding of the SmartTag. This action generates valuable contextual data which can be used for business rules/decision making and data insights analysis. Contextual data might be of any nature, though more typical information includes: geolocation, device type, user ID, time, etc.

Page 49/81
Figure 45. Adding context to a scan action information flow Validation results of SCANTECH are presented against the KPIs below.
Result title Reliability of Item identification
Actors: Consumer, Application, SmartTag FC-Scanner, Identity Management
Description: Scanned item is recognized correctly based on the SmartTag
Trigger: Consumer scans the SmartTag
Preconditions: SmartTag has been created in the platform beforehand. The application has the necessary permission. We assume the SmartTag has been read correctly.
Normal Flow: Consumer scans the SmartTag with the application and the item scanned is recognized
Notes and Issues: This process does not consider the accuracy of the optical
reader, this process is triggered afterwards.
Measured value 100% identification success, if the SmartTag was read
correctly there should not be any misidentified item.
Result title Reliabililty of adding context when scanning
Actors: Consumer, Application, SmartTag FC-Scanner, Identity Management, Virtual Entity Access Interface
Description: Scan action is populated with additional context
Trigger: After scanning, the FC-Scanner adds context information to the reading.
Preconditions: SmartTag has been created in the platform beforehand. The application has the necessary permissions. We assume the SmartTag has been read correctly.
Normal Flow: Consumer scans the SmartTag with the application and context information is added to the scan action.
Notes and Issues: This process does not consider the accuracy of the optical
reader, this process is triggered afterwards.

Page 50/81
Measured value 100% realiability on context being added to the right action
and VE
Result title Speed of scanning with context
Actors: Consumer, Application, SmartTag FC-Scanner
Description: Process since the consumer scans until they get feedback
Trigger: Consumers scan, all the processes are triggered until they get feedback based on the application.
Preconditions: SmartTag has been created in the platform beforehand. The application has the necessary permissions. We assume the SmartTag has been read correctly.
Normal Flow: Consumer scans the SmartTag with the application and eventually he gets feedback on the scanning.
Notes and Issues: This process does not consider the accuracy of the optical
reader, this process is triggered afterwards.
Measured value <2s reaction time since the user scans until he gets feedback
from the FC-Scanner
5.3.3 Scanning to trigger AR/VR content based on context There are several categories of triggers that initiate presentation of the AR/VR content to the end-user: 1) image based, 2) text based, 3) location based, etc. The proposed encoding with logo image as a part of the QR code belongs to the first and second category and requires utilization of image and text recognition techniques to recognize two different states (an image with text before and after disappearing of functional ink), as presented in Section 3.1.3. For the purpose of the evaluation of both techniques, initial evaluation of recognition using Azure API was done for the text recognition methonds. The scanning tests were executed in the UniverExport retail center with following devices: Huawei p9 lite, GSmart Guru G1, iPad mini 2 and iPhone 5s.
Evaluation process for the QR code with image The evaluation of the scanning process included two type of readers: (1) TagItSmart FC-scanner for Android developed with Xamarin, and (2) QR code readers downloaded from Google Play store1 in further text reffered to as Reader 1 and Reader 2. Tags were printed in two different formats (2x2cm and 4x4cm). Both formats are scanned from different angles and different distance:
4x4cm from distance of 30 and 60cm (from all angles) and
2x2cm from distance of 20 and 30 cm (from all angles).
1 https://play.google.com/store/apps/details?id=me.scan.android.client&hl=en, https://play.google.com/store/apps/details?id=tw.mobileapp.qrcode.banner

Page 51/81
Figure 46. 2x2cm tags scanned from 20 and 30cm distance
Figure 47. 4x4cm tags scanned from 30 and 60cm distance
FC-Scanner evaluation The distance of 60cm was inappropriate for scanning as there is possibility to fetch more than one tag with the scanner, having in mind the number of meat packages per square meter. The tags printed in format 2x2cm were readable from 30cm, but the best accuracy showed from 20cm above the QR code under 15-20 degree angle from left and right. The best accuracy for tags in 4x4cm format was from the 30cm distance.
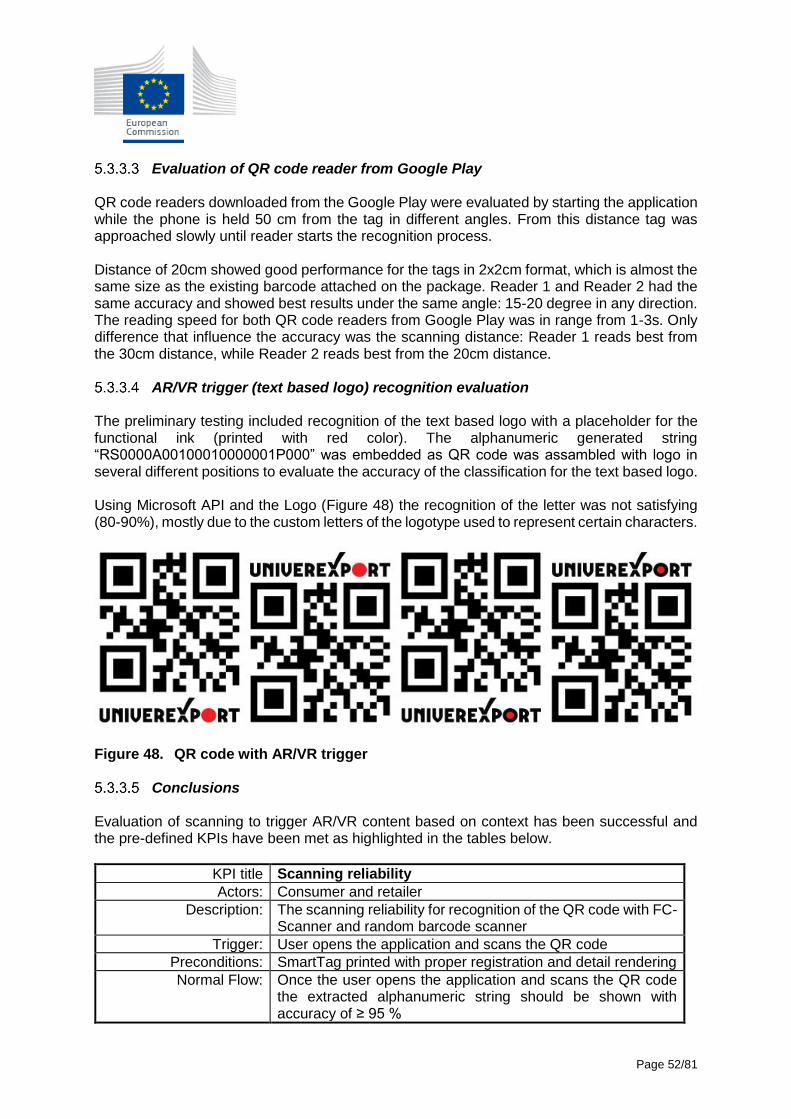
Page 52/81
Evaluation of QR code reader from Google Play
QR code readers downloaded from the Google Play were evaluated by starting the application while the phone is held 50 cm from the tag in different angles. From this distance tag was approached slowly until reader starts the recognition process. Distance of 20cm showed good performance for the tags in 2x2cm format, which is almost the same size as the existing barcode attached on the package. Reader 1 and Reader 2 had the same accuracy and showed best results under the same angle: 15-20 degree in any direction. The reading speed for both QR code readers from Google Play was in range from 1-3s. Only difference that influence the accuracy was the scanning distance: Reader 1 reads best from the 30cm distance, while Reader 2 reads best from the 20cm distance.
AR/VR trigger (text based logo) recognition evaluation The preliminary testing included recognition of the text based logo with a placeholder for the functional ink (printed with red color). The alphanumeric generated string “RS0000A00100010000001P000” was embedded as QR code was assambled with logo in several different positions to evaluate the accuracy of the classification for the text based logo. Using Microsoft API and the Logo (Figure 48) the recognition of the letter was not satisfying (80-90%), mostly due to the custom letters of the logotype used to represent certain characters.
Figure 48. QR code with AR/VR trigger
Conclusions Evaluation of scanning to trigger AR/VR content based on context has been successful and the pre-defined KPIs have been met as highlighted in the tables below.
KPI title Scanning reliability
Actors: Consumer and retailer
Description: The scanning reliability for recognition of the QR code with FC-Scanner and random barcode scanner
Trigger: User opens the application and scans the QR code
Preconditions: SmartTag printed with proper registration and detail rendering
Normal Flow: Once the user opens the application and scans the QR code the extracted alphanumeric string should be shown with accuracy of ≥ 95 %

Page 53/81
Notes and Issues: The reader reliability is directly correlated to the angle and distance of scanner during the scanning process
Value 90%
КPI title Scanning speed
Actors: Consumer
Description: The scanning speed for recognition of the QR code with FC-Scanner and random barcode scanner
Trigger: User opens the application and scans the QR code
Preconditions: SmartTag printed with proper registration and detail rendering
Normal Flow: Once the user opens the application and scans the QR code the extracted alphanumeric string should be timely shown ≤ 2 s
Notes and Issues: The reader scanning speed is directly correlated to the angle and distance of scanner during the scanning process
Value 1-3s
During the current scanning tests the KPI related to the AR/VR generated content based on scanned information was not evaluated. This will be done in further stage of the project when the AR/VR content is implemented as a part of the FC-Scanner. 5.4 NFC scanning
In order to test the NFC labels, a test setup has been built in Linköping, Sweden. The test setup will include evaluation of the NFC scanning reliability, the NFC reading distance as well as the NFC scanning response time. This test setup has been used for NFC scanning performance evaluation. Up to this point, the produced labels by Thinfilm have successfully met the pre-defined scanning-related KPIs.
KPI title Scanning reliability ≥ 99 %
Actors: TFE (test phase) and endusers
Description: Production gives sufficient yield (i. e. working chip, antenna and integration) to provide a scanning reliability ≥ 99 %.
Trigger: Reading of the NFC label.
Preconditions: Successful production and integration onto product.
Notes and Issues: Requires Android type smartphones.
Value Yes / No
KPI title Scanning distance < 2 cm
Actors: TFE (test phase) and endusers
Description: Production gives sufficient yield (i. e. working chip, antenna and integration).
Trigger: Reading of the NFC label.
Preconditions: Successful production and integration onto product.
Notes and Issues: Requires Android type smartphones.
Value Scanning distance in cm.
KPI title Scanning response time < 0.5 s

Page 54/81
Actors: TFE (test phase) and endusers
Description: Production gives sufficient yield (i. e. working chip, antenna and integration).
Trigger: Reading of the NFC label.
Preconditions: Successful production and integration onto product.
Notes and Issues: Requires Android type smartphones.
Value Scanning response time in ms.
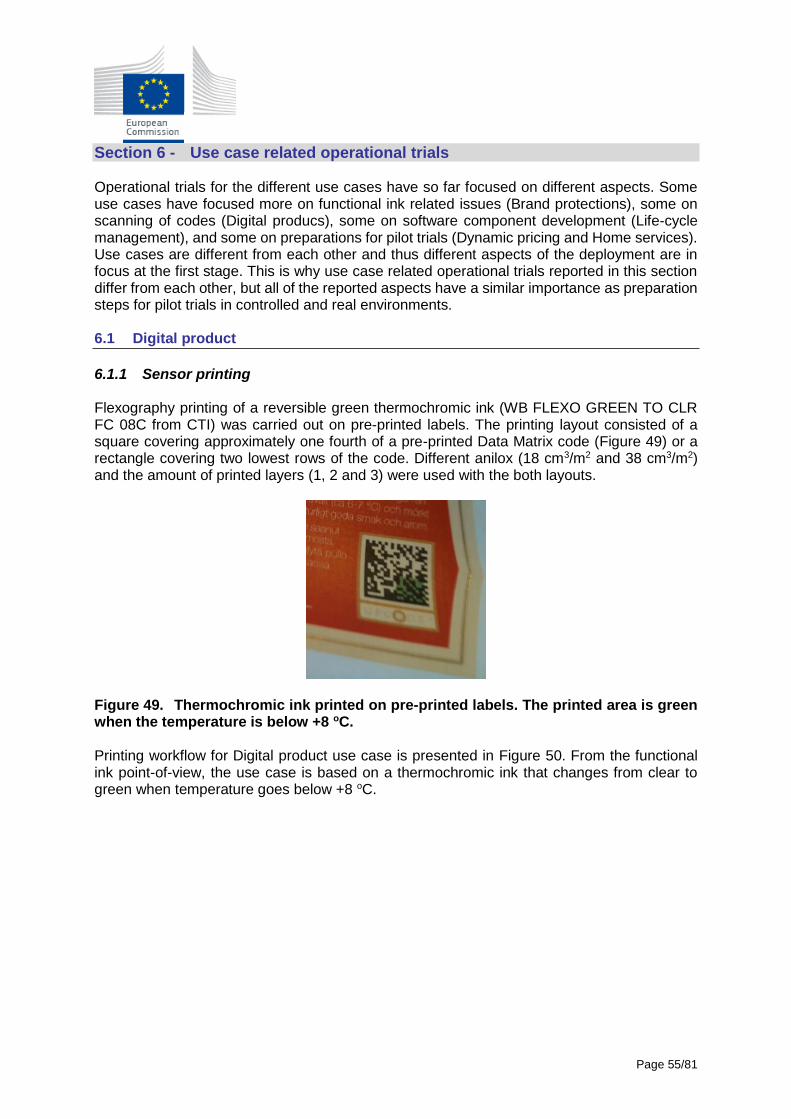
Page 55/81
Section 6 - Use case related operational trials Operational trials for the different use cases have so far focused on different aspects. Some use cases have focused more on functional ink related issues (Brand protections), some on scanning of codes (Digital producs), some on software component development (Life-cycle management), and some on preparations for pilot trials (Dynamic pricing and Home services). Use cases are different from each other and thus different aspects of the deployment are in focus at the first stage. This is why use case related operational trials reported in this section differ from each other, but all of the reported aspects have a similar importance as preparation steps for pilot trials in controlled and real environments. 6.1 Digital product
6.1.1 Sensor printing Flexography printing of a reversible green thermochromic ink (WB FLEXO GREEN TO CLR FC 08C from CTI) was carried out on pre-printed labels. The printing layout consisted of a square covering approximately one fourth of a pre-printed Data Matrix code (Figure 49) or a rectangle covering two lowest rows of the code. Different anilox (18 cm3/m2 and 38 cm3/m2) and the amount of printed layers (1, 2 and 3) were used with the both layouts.
Figure 49. Thermochromic ink printed on pre-printed labels. The printed area is green when the temperature is below +8 oC. Printing workflow for Digital product use case is presented in Figure 50. From the functional ink point-of-view, the use case is based on a thermochromic ink that changes from clear to green when temperature goes below +8 oC.

Page 56/81
Figure 50. Printing workflow for Digital Product use case. 6.1.2 Sensor scanning Prototype of scanning procedure of TagItSmart was developed in order to perform operational trials for sensor scanning. This procedure followed guidelines set for scanner enablers (D2.2) and steps metioned earlier in this document. Protype application was developed for Android devices but actual decoding of the tag was done on C/C++ so that it transferable to iOS or most other platforms. Resolution that works on most mobile devices and other devices was chosen (640x480) and SmartTAGs were scanned using this resolution. Camera used standard automatic adjustements during operational trial. As results SmartTAG scanning worked well and no noticeable difference (noticeable for standard user) was observed. Tags were scanned and contents of the tag were read correctly in both cases; sensor green and sensor clear. Some issues with intetisity of sensors were found and these will be addressed before sensor scanning in digital product use case can move to the next trial phase.
Figure 51. 3rd generation of 2-D code in reader app 6.1.3 Conclusions Sensor scanning for Digital product use case is linked to scanning results presented already in Section 5.2.1.
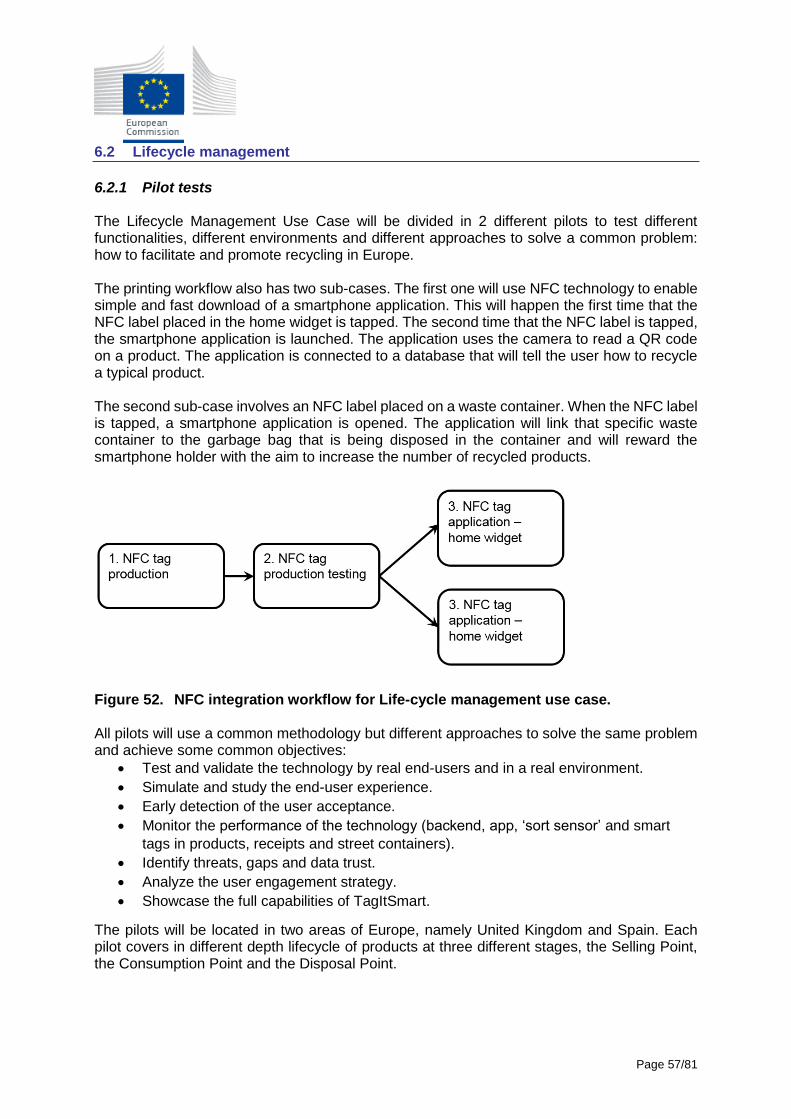
Page 57/81
6.2 Lifecycle management
6.2.1 Pilot tests The Lifecycle Management Use Case will be divided in 2 different pilots to test different functionalities, different environments and different approaches to solve a common problem: how to facilitate and promote recycling in Europe. The printing workflow also has two sub-cases. The first one will use NFC technology to enable simple and fast download of a smartphone application. This will happen the first time that the NFC label placed in the home widget is tapped. The second time that the NFC label is tapped, the smartphone application is launched. The application uses the camera to read a QR code on a product. The application is connected to a database that will tell the user how to recycle a typical product. The second sub-case involves an NFC label placed on a waste container. When the NFC label is tapped, a smartphone application is opened. The application will link that specific waste container to the garbage bag that is being disposed in the container and will reward the smartphone holder with the aim to increase the number of recycled products.
Figure 52. NFC integration workflow for Life-cycle management use case. All pilots will use a common methodology but different approaches to solve the same problem and achieve some common objectives:
Test and validate the technology by real end-users and in a real environment.
Simulate and study the end-user experience.
Early detection of the user acceptance.
Monitor the performance of the technology (backend, app, ‘sort sensor’ and smart
tags in products, receipts and street containers).
Identify threats, gaps and data trust.
Analyze the user engagement strategy.
Showcase the full capabilities of TagItSmart.
The pilots will be located in two areas of Europe, namely United Kingdom and Spain. Each pilot covers in different depth lifecycle of products at three different stages, the Selling Point, the Consumption Point and the Disposal Point.

Page 58/81
Figure 53. Lifecycle Management Use Case pilot planning
UK pilot The UK pilot will be deployed between month 11 and month 21, according to the planning overview in Figure 54.
Figure 54. UK pilot planning overview The basic working flow and functional components of the system in the UK pilot are as follows:
1. End-users buy goods. 2. Retailer provides the ‘sort sensor’. 3. End-users tap the NFC ‘sort sensor’, download and
launch the App (currently Android): o Create user registration. o Collect location information. o Relay data to and from a data backend.
LAB TRIALS (M11-M17)CONTROLLED ENVIRONMENT (M18-M21)
SELLINGPOINT
CONSUMPTIONPOINT
DISPOSALPOINT
UK pilot
SPAIN pilot
NO SELLING INFO
BARCODE SCANIN PRODUCTS
QR / DATAMATRIXIN RECEIPT
HOME RECYCLING INFO AND REWARDS
WITH ONE SCAN FOR EACH PRODUCT
NO DISPOSAL INFO
HOME RECYCLING INFO WITH ONE SCAN FOR ALL
PRODUCTS
REWARDS WITH ONE STREET CONTAINER SCAN FOR SEVERAL
PRODUCTS
LAB TRIALS (M15-M18)CONTROLLED ENVIRONMENT (M19-M23)
REAL ENVIRONMENT (M24-M36)
OPERATIONAL TRIAL
App-Backend development
Label/Tag creation
Beta App-Backend testingFocus group definition
1ST FIELD TRIAL
Lab preparation
Products labelling
Focus group callTrial execution
Monitoring
AFTER 1ST FIELD TRIAL
Data analysis
Reporting
NOVEMBER 2016 -MAY 2017 JUNE-SEPTEMBER 2017 OCTOBER 2017
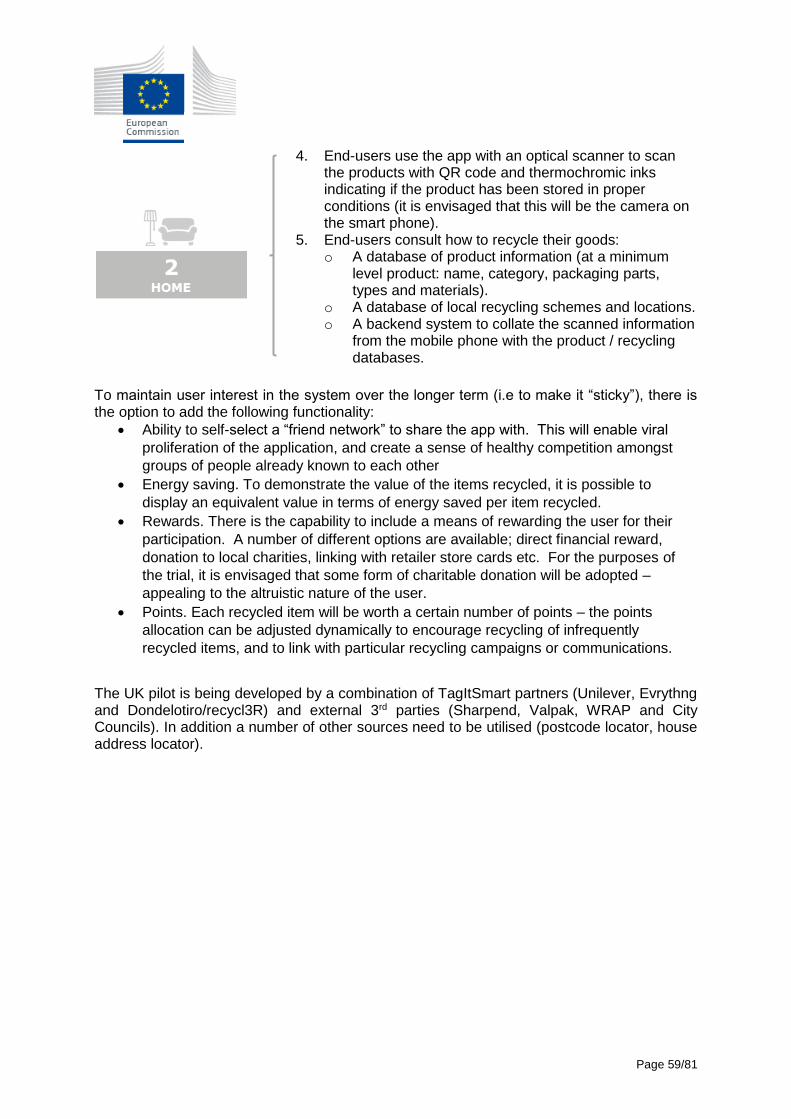
Page 59/81
4. End-users use the app with an optical scanner to scan the products with QR code and thermochromic inks indicating if the product has been stored in proper conditions (it is envisaged that this will be the camera on the smart phone).
5. End-users consult how to recycle their goods: o A database of product information (at a minimum
level product: name, category, packaging parts, types and materials).
o A database of local recycling schemes and locations. o A backend system to collate the scanned information
from the mobile phone with the product / recycling databases.
To maintain user interest in the system over the longer term (i.e to make it “sticky”), there is the option to add the following functionality:
Ability to self-select a “friend network” to share the app with. This will enable viral
proliferation of the application, and create a sense of healthy competition amongst
groups of people already known to each other
Energy saving. To demonstrate the value of the items recycled, it is possible to
display an equivalent value in terms of energy saved per item recycled.
Rewards. There is the capability to include a means of rewarding the user for their
participation. A number of different options are available; direct financial reward,
donation to local charities, linking with retailer store cards etc. For the purposes of
the trial, it is envisaged that some form of charitable donation will be adopted –
appealing to the altruistic nature of the user.
Points. Each recycled item will be worth a certain number of points – the points
allocation can be adjusted dynamically to encourage recycling of infrequently
recycled items, and to link with particular recycling campaigns or communications.
The UK pilot is being developed by a combination of TagItSmart partners (Unilever, Evrythng and Dondelotiro/recycl3R) and external 3rd parties (Sharpend, Valpak, WRAP and City Councils). In addition a number of other sources need to be utilised (postcode locator, house address locator).
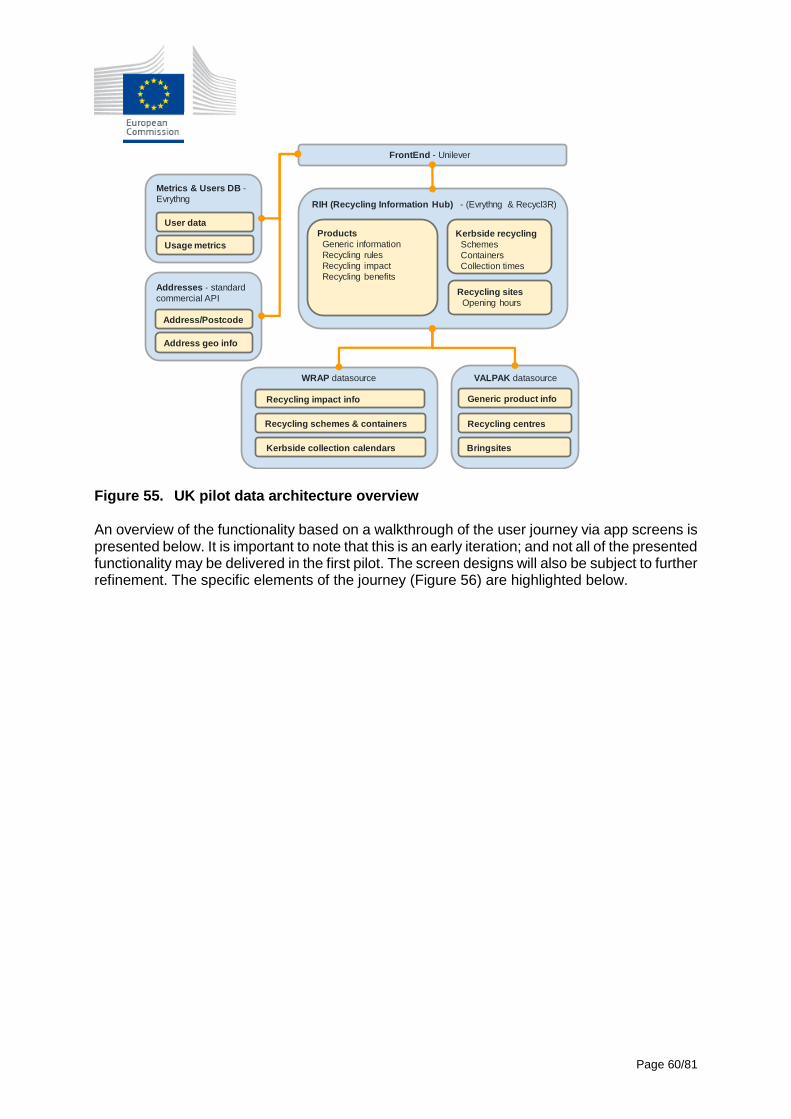
Page 60/81
Figure 55. UK pilot data architecture overview An overview of the functionality based on a walkthrough of the user journey via app screens is presented below. It is important to note that this is an early iteration; and not all of the presented functionality may be delivered in the first pilot. The screen designs will also be subject to further refinement. The specific elements of the journey (Figure 56) are highlighted below.
FrontEnd - Unilever
RIH (Recycling Information Hub) - (Evrythng & Recycl3R)
WRAP datasource VALPAK datasource
Addresses - standard
commercial API
Metrics & Users DB -
Evrythng
User data
Usage metrics
Recycling sites
Opening hours
Address geo info
Recycling schemes & containers
Recycling impact info
Kerbside collection calendars
Generic product info
Recycling centres
Bringsites
Kerbside recycling
Schemes
Containers
Collection times
Products
Generic information
Recycling rules
Recycling impact
Recycling benefits
Address/Postcode

Page 61/81
Figure 56. Wireframes for recycling system application

Page 62/81
Spanish pilot
The Spanish pilot will be deployed between month 15 and month 36, according to the following planning overview:
Figure 57. Spanish pilot planning overview The basic working flow and functional components of the system in the Spanish pilot are as follows:
1. End-users buy goods. 2. Retailer scans goods (barcodes) and gives a receipt to
the end-user: o When scanning, a unique digital shopping list and
QR code is created. o The receipt includes a printed QR code linked to the
unique id of the shopping list. 3. End-users download the App (currently Android) and with
an optical scanner (the camera in the smart phone) scan the receipt QR code: o Create user registration. o When scanning, a unique personal virtual fridge is
created and linked to the specific user. o Relay data to and from a data backend.
4. End-users consult in the App how to recycle their goods: o A database of product information (at a minimum
level product: name, category, packaging parts, types and materials).
o A database of local recycling schemes and locations. o A backend system to collate the scanned information
from the mobile phone with the product / recycling databases.
5. End-users recycle their goods in the App and create a virtual garbage bag.
6. End-users go with their garbage bag to their preferred disposal location, tap the NFC sensor or scan the QR code in the street container, link their virtual garbage bag to that specific street container and receive recycling points as a reward.
OPERATIONAL TRIAL
App-Backend development & testing
Label/Tag creation
Focus group definitionChoice experiment design
Retailer & city selection
1ST FIELD TRIAL
Lab preparation
Bins labelling
Focus group callTrial execution
Monitoring & reporting
)
PILOT
Development by retailer & city
Bins labelling
Public communicationPilot execution
Monitoring & reporting
MARCH-JUNE 2017 JULY-DECEMBER 2017 JANUARY-NOVEMBER 2018
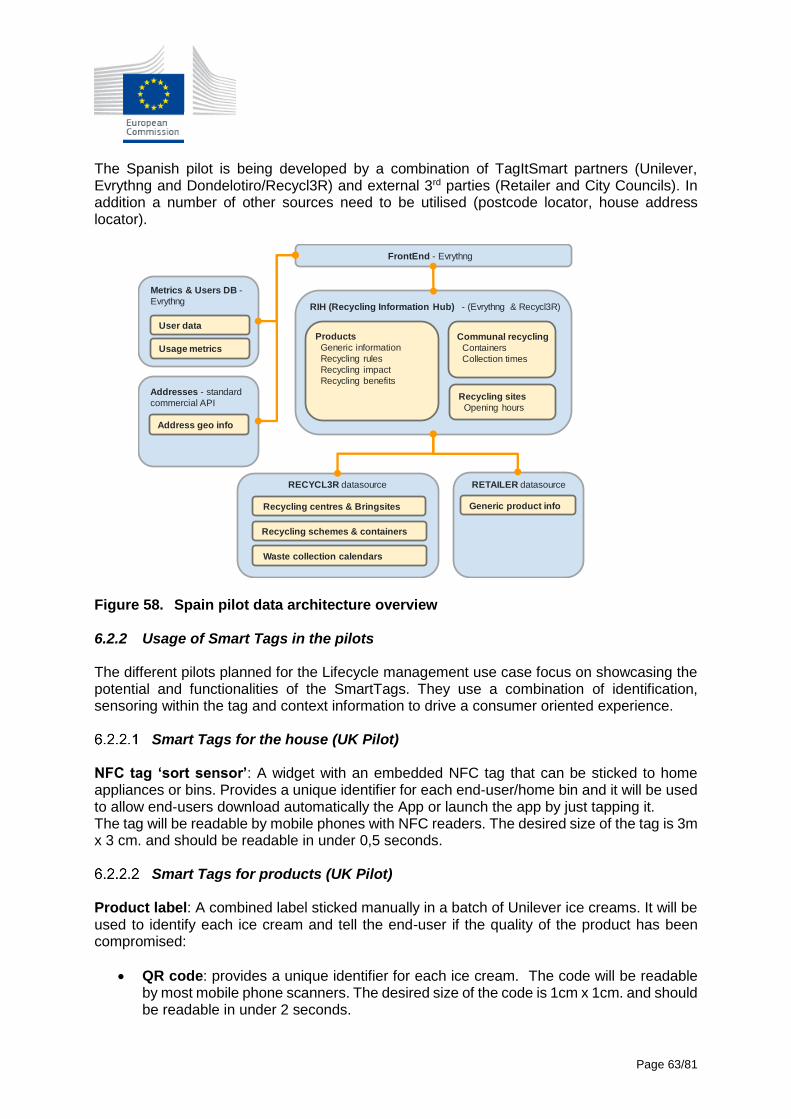
Page 63/81
The Spanish pilot is being developed by a combination of TagItSmart partners (Unilever, Evrythng and Dondelotiro/Recycl3R) and external 3rd parties (Retailer and City Councils). In addition a number of other sources need to be utilised (postcode locator, house address locator).
Figure 58. Spain pilot data architecture overview 6.2.2 Usage of Smart Tags in the pilots The different pilots planned for the Lifecycle management use case focus on showcasing the potential and functionalities of the SmartTags. They use a combination of identification, sensoring within the tag and context information to drive a consumer oriented experience.
Smart Tags for the house (UK Pilot) NFC tag ‘sort sensor’: A widget with an embedded NFC tag that can be sticked to home appliances or bins. Provides a unique identifier for each end-user/home bin and it will be used to allow end-users download automatically the App or launch the app by just tapping it. The tag will be readable by mobile phones with NFC readers. The desired size of the tag is 3m x 3 cm. and should be readable in under 0,5 seconds.
Smart Tags for products (UK Pilot) Product label: A combined label sticked manually in a batch of Unilever ice creams. It will be used to identify each ice cream and tell the end-user if the quality of the product has been compromised:
QR code: provides a unique identifier for each ice cream. The code will be readable by most mobile phone scanners. The desired size of the code is 1cm x 1cm. and should be readable in under 2 seconds.
FrontEnd - Evrythng
RIH (Recycling Information Hub) - (Evrythng & Recycl3R)
RECYCL3R datasource RETAILER datasource
Addresses - standard
commercial API
Metrics & Users DB -
Evrythng
User data
Usage metrics
Recycling sites
Opening hours
Recycling schemes & containers
Recycling centres & Bringsites
Waste collection calendars
Generic product info
Communal recycling
Containers
Collection times
Products
Generic information
Recycling rules
Recycling impact
Recycling benefits
Address geo info

Page 64/81
Time-temperature indicator (TTI): provides an indicator of the quality of the ice cream based on its cold chain. The indicator will be readable only by scanners that are TagItSmart compatible. The indicator will use irreversible thermochromic ink that will change its colour (red) after exposure to a temperature above -10 C° for more than 30 minutes. If the Time-Temperature Indicator is visible, it will warn the end-user that the quality of the ice cream can be compromised.
Smart Tags for street containers (Spain Pilot)
Street container label: A non-combined label sticked manually on every street container in the pilot (both Smart Tags will be part of a bigger sticker placed in the container that will explain how the system can be used). It will be used to identify each street container and complete the recycling action by the end-user to get rewards. End-users will be able to use just one method (QR code or NFC tag) to make the ‘virtual’ interaction between their recycling activity and the container.
QR code: provides a unique identifier for each street container. The code will be readable by most mobile phone scanners. The desired size of the code is 4.0 cm x 4.0 cm. and should be readable in under 2 seconds.
NFC tag ‘smart street container’: provides a unique identifier for each street container. The tag will be readable by mobile phones with NFC readers. The desired size of the tag is 3cm x 3cm. and should be readable in under 0,5 seconds. The NFC tag must be high temperature proof to allow container cleaning processes.
6.2.3 Conclusions So far the evaluation focus has been on SmartTag scanning targeted for this use case carried out with an Android device and related KPIs are presented below. The evaluation of the application has been based on development on the Android platform with a minimum SDK version 4.2 Jelly Bean. The following smart phones have been used:
Huawei P8 Lite (Android 6.0 - EMUI 4.0)
Samsung Galaxy Nexus (Android 4.3)
Samsung Galaxy Note 2014 (Android 5.1)
Samsung A5 (Android 6.0)
KPI title Scanning Speed ≤ 2 s
Actors: Consumer and retailer
Description: The scanning speed for recognition of the Smart Tag
Trigger: User opens the application and scans the SmartTag
Preconditions: Communication with backend server is working correctly
Normal Flow: Once the user opens the application and scans the Smart Tag the extracted alphanumeric string should be timely shown ≤ 2 s
Notes and Issues: The reader scanning speed is directly correlated to the angle and distance of scanner during the scanning process
Value 1-3s

Page 65/81
KPI title Scanning reliability ≥ 95 %
Actors: Consumer and retailer
Description: The scanning reliability for recognition of the SmartTag
Trigger: User opens the application and scans the Smart Tag
Preconditions: Communication with backend server is working correctly
Normal Flow: Once the user opens the application and scans the SmartTag the extracted alphanumeric string should be shown with accuracy of ≥ 95 %
Notes and Issues: The reader reliability is directly correlated to the angle and distance of scanner during the scanning process
Value 90%
6.3 Brand protection
The general aspect of the use case brand protection is to create a platform for originality proof of consumer goods at each part of the logistic chain and at the customer side for a broad variety of products such as high-performance brand (parfume, handbags, sport shoes) or medicine (vitamins, pain reliefs, vaccines). The originality proof tool consists of both a SmartT ag as well as the corresponding encoding / decoding mechanism. SmartTags consist of textures that stay in their original shape during the readout period and textures, that significantly change the outer appearance in a way that in the activated stage additional information is released. The SmartTag design changes within a certain lot size (f.e. per batch, per day); therefore the uniqueness for a limited amount of products is ensured – the encoded information is stored at a corresponding cloud. The frequent change in the tag design which has to be at least on a daily basis justifies the usage of digital printing technology. Within the course of the project the focus is set on the development of novel functional inkjet inks. The target formulations are:
(a) Photochromic inkjet inks: The prints of photochromic inkjet inks reversibly and significantly switch their outer appearance from non-colored to colored by visible light; most-preferably by the excitation by smartphone flash light (white LED). The spectrum of common white LEDs has excitation maxima at 455 and 550 nm (Figure 59). Thus, activation of the textures is done by the handheld device used for the readout.
(b) Thermochromic inkjet inks: The prints of thermochromic inkjet inks reversibly and significantly switch their outer appearance from non-colored to colored at a temperature of 30–37 °C. Activation of the textures is done by direct contact of the smart tag texture (“heating by the thumb”).

Page 66/81
Figure 59. Spectrum of a white LED.2 Printing workflow for Brand protection use case is presented in Figure 60. This is quite a similar process to Digital product use case except the whole label is printed with digital printing (inkjet). The sensor is based either on a photochromic ink or a thermochromic ink.
Figure 60. Printing workflow for Brand protection use case. 6.3.1 Functional Ink development The printing platforms will be the Durst Rho- (large format printer) and Tau-series (Label printer). Fluid parameters of the functional inkjet inks have to be adjusted according to the applied print head technology in those industrial printers. Physical fluid parameter adjustment has to done in a narrow range of viscosity, particle dimensions (sub-micron), density and surface tension. Furthermore, the focus of ink development is initially set to UV inkjet inks. UV inkjet inks most-likely consist of a mixture of mono- and multifunctional vinyl monomers, photo initiators viscosity modifiers, wetting agents and the colorant.
2 https://en.wikipedia.org/wiki/Light-emitting_diode#/media/File:White_LED.png

Page 67/81
Initial efforts have been done on the photochromic inkjet ink development. Commercially available are photochromic pigments (non-soluble, particulate materials with native average dimension of 5–10 µm), photochromic dyes (organic molecules, soluble in common fluid vehicle) and photochromic blends (mixture of polymer pastes and 2–5 wt.% pigments or dyes). Pigments in the commercially available dimensions are insufficient for inkjet applications, hence, the focus was set on soluble photochromic dyes that are homogeneously dispersed in a solution. In total, two suppliers have been detected for further studies on photochromic dyes. From each supplier cyan (C), magenta (M) and yellow (Y) photochromic dyes (spiropyranes) were purchased. In a first simple approach dissolution and performance testing of the photochromic dyes was tested in the environment of Rho Varnish Ink – an already existing non-pigmented Durst-UV ink which is used as topcoat in large format printing. The dissolution of C, M and Y in Rho Varnish Ink is giving to at least a minimal amount – partially a coloring of the solutions was observed. However, after doctor blading and UV-curing the inks, a permanent coloring of the prints is achieved as exemplary shown in Figure 61.
Figure 61. Permanent coloring of cyan photochromic dye (left) and yellow photochromic dye (right) in Rho Varnish Ink. Neither the inkjet ink solution nor the prints show a reversible photochromic switch by either VIS-excitation. Reversible color switching was achieved by UV irradiation (~ 45 mJ/cm²; 270 – 410 nm) for all layers. Exemplary, for the C / Rho Varnish print, after curing the UV inkjet ink, a permanent pink outer appearance resulted (L = 82.55; a* = 12.48; b* = 1.75) that turned blue (L = 63.72; a* = -12,34; b* = -25,69) after UV excitation and again switched back to pink within a couple of seconds. The appearance of the colors after UV excitation are just pale; the fluid vehicle obviously is insufficient for dissolution of higher photochromic dye amounts. Further dissolution experiments were performed on the photochromic dyes. There is a general trend in dissolution properties of the photochromic dyes notable: good solvents are esters, ketones and aromatic compounds, whereas in alcohols and aliphatic carbon hydrocarbons the solubility are bad solvents. Moreover, in alcohols a permanent coloring of the solutions was observed. In all photochromic dye solutions, except the alcohol solutions, a reversible photochromic color switch within the solution was observed (Figure 62). In the alcohol solutions, the spiropyran dyes obviously get permanently de-activated which is reported elsewhere.
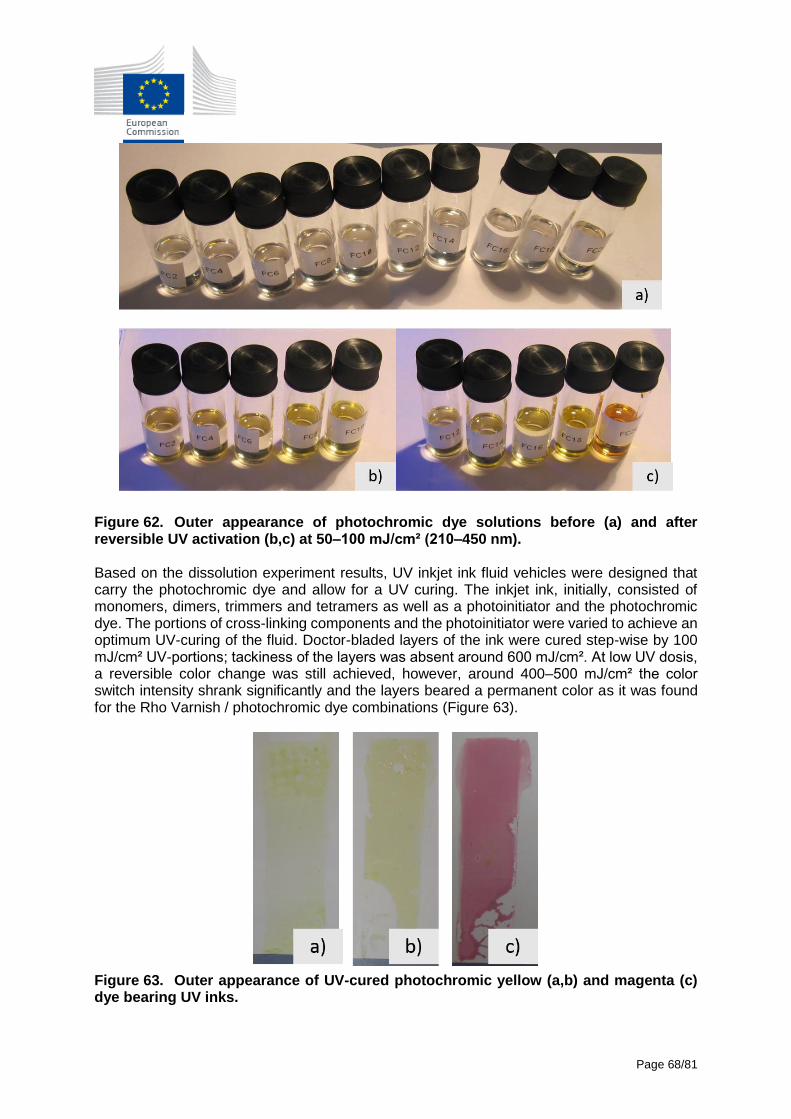
Page 68/81
Figure 62. Outer appearance of photochromic dye solutions before (a) and after reversible UV activation (b,c) at 50–100 mJ/cm² (210–450 nm). Based on the dissolution experiment results, UV inkjet ink fluid vehicles were designed that carry the photochromic dye and allow for a UV curing. The inkjet ink, initially, consisted of monomers, dimers, trimmers and tetramers as well as a photoinitiator and the photochromic dye. The portions of cross-linking components and the photoinitiator were varied to achieve an optimum UV-curing of the fluid. Doctor-bladed layers of the ink were cured step-wise by 100 mJ/cm² UV-portions; tackiness of the layers was absent around 600 mJ/cm². At low UV dosis, a reversible color change was still achieved, however, around 400–500 mJ/cm² the color switch intensity shrank significantly and the layers beared a permanent color as it was found for the Rho Varnish / photochromic dye combinations (Figure 63).
Figure 63. Outer appearance of UV-cured photochromic yellow (a,b) and magenta (c) dye bearing UV inks.

Page 69/81
Obviously, the functional dyes are sensitive to free radical species that are created during the curing process of the UV ink. Even by systematically reducing the photoinitiator and increasing the cross-linker concentration, no cured, functional layers were created. 6.3.2 Outlook on further development Investigations on UV photochromic inks have been made; obviously, that type of inkjet ink and curing method is incompatible with the functional materials. According to these results, the development of functional inks for brand protection will focus on:
- the finalization of studies at the photochromic UV inks (modificaton in the monomer- and multifunctional monomer contents, photoinitiator variation, two-step printing)
- implementation of functional dyes into solvent inkjet ink fluid vehicles and performance studies
- research on novel VIS-switchable photochromic dyes - investigations on thermochromic dyes (commercially available and up-scalable
colorants) - inkjet printing of photochromic inks and demo fabrication
The encoding / decoding for brand protection was initially planned by using solely QR code structures. However, when encrypting two distinct information in a QR code, two distinct designs are necessary requiring both appearing and disappearing textures and, therefore, at least two functional inks. To circumvent this issue, the data matrix approach which is used in use cases digital product and dynamic pricing will be applied in brand protection. By means of the data matrix concept solely a single reversible photochromic ink is required. 6.3.3 Conclusions
KPI title Functional Substance Assessment
Actors: Ink developers
Description: Performance assessment on functional substances for formulation of a functional inkjet ink
Trigger: Reversible decolorization and/or colorization by UV-LED, white/VIS LED or temperature (25–40 °C)
Preconditions: Commercially available raw materials and/or precursors; functionality in a print layer without notable degradation
Normal Flow: Supply of material and/or synthesis; general performance assessment; transfer to UV- or solvent-based ink environment
Notes and Issues: availability of technology; stability in inkjet ink formulation; stability at printing process, at multiple activation and in print
Value If particulate systems, then < 100 nm in naive particle dimension; Functionality of given pre-inkjet-ink formulation @ layer thickness < 24 µm; 5 s < half-life-period of colorization/decolorization< 300 s; Background-texture contrast > 30 for at least 10 activations
KPI title Inkjet-able functional ink (lab-scale)
Actors: Ink developers, printers

Page 70/81
Description: Transfer of substances that pass the pre-performance assessment into an inkjet-able version
Trigger: Reliable inkjet printing of functional inks with lab-material-printer
Preconditions: Transferable technology for functional substances into an UV- and/or solvent-based inkjet ink formulation
Normal Flow: formulation of an UV and/or solvent-based inkjet ink, reliability testing of the printing process on lab scale, adjustment of viscosity, surface tension, substrate-wetting and curing
Notes and Issues: Availability of functional material
Value Open time ≥ 15 min @ nozzle failure < 10% Sedimentation rate ≤ 5 µm/min Drop speed variation ≤ 15 %Functionality of functional textures @ 100–300 % coverage (1000x800 dpi, 10 pL)
KPI title Inkjet-able functional ink (industrial printhead)
Actors: Ink developers, printers
Description: Transfer of lab-scale printable ink onto industrial printhead and industrial printing conditions
Trigger: Reliable inkjet printing of functional inks with industrial printheads; Stable printing @ given ignition pulse curve applied at Durst printers
Preconditions: Lab-scale printable inkjet ink
Normal Flow: formulation of an UV and/or solvent-based inkjet ink, reliability testing of the printing process on industrial printhead, adjustment of viscosity, surface tension, substrate-wetting and curing
Notes and Issues: Availability of functional material Availability of lab-scale inkjet-able ink
Value Open time ≥ 15 min @ nozzle failure < 5% Stable printing in frequency range: 8–25 kHz Sedimentation rate ≤ 5 µm/min Drop speed variation ≤ 20 % @ relevant frequency sweep Texture functionality @ 100–300 % coverage (1000x800 dpi, 10 pL)
6.4 Dynamic pricing
Printing workflow for Dynamic pricing use case is presented in Figure 64. These are based on digitally printed labels with individual QR codes, and areas containing functional inks or indicators are added during label attachment. Dynamic pricing use case is based on a time-temperature indicator (TTI) that changes colour from clear to red when exposed to temperatures above +7 oC for longer than 30 minutes.

Page 71/81
Figure 64. Printing workflow for Dynamic Pricing use case. 6.4.1 Information collection from cash register The testing process for the cash register in the UniverExport is still under discussion with the goal to define most appropriate model for integration without influence on the efficiency of the employes working at the cash register. i.e. to avoid any possible changes in the retailer’s system. Currently, the information for the discounted price is entered into the retailer system and when retailer scans the product the price will be changed according to the predefined input. The other part of this use case, which is not implemented yet, is related to the printing of tags, labelling of the package, and the occurance of the first QR code scan. Further to this, when the QR code is first scanned, the information is entered into the system to keep track on the duration and date until the meat package is valid and for the calculation of the dynamic price.
Figure 65. Cash register setup for Dynamic pricing. There are two main KPIs that should be addressed and these KPIs have been met: - Decision on discounted price when scanned at cash register, required accuracy ≥ 95 %

Page 72/81
- Retailer information collected when scanned at cash register, required accuracy ≥ 95 %
KPI title Decision on discounted price when scanned at cash register
Actors: Retailer and retailer’s system
Description: The accuracy of the decision on the discounted price for the product in the retailer’s system
Trigger: Retailer checks the price or scans the QR code of the product to see the price
Preconditions: Retailer has entered information about discounted price into the system and the calculation for different dates is working correctly
Normal Flow: The system automatically calculates price for the given products based on the date threshold.
Notes and Issues:
Value 100%
KPI title Retailer information collected when scanned at cash register
Actors: Consumer and retailer
Description: The accuracy of the discounted price when the product is scanned at the cash register
Trigger: Retailer scans the QR code at the cash register
Preconditions: Retailer has entered information about discounted price into the system
Normal Flow: Once the retailer scans the barccode the discounted price should be displayed and counded for the product with accuracy ≥ 95 %
Notes and Issues:
Value 100%
6.5 Home services
Home services use case has three sub-cases for printing workflows. The first one (Error! Reference source not found.Figure 66) is based on three functional inks or indicators: 1) an irreversible thermochromic ink that changes from clear to visible when at temperature >+50 oC, 2) is a time elapse indicator that contains a progressing red liquid front (the front will become visible on the label after 3 months) and 3) hydrochromic ink reacting to the presence of water.

Page 73/81
Figure 66. The first sub-case printing workflow for Home Services use case. The second sub-case (Figure 67) is based on one or two inks or indicators: 1) a CO (carbon monoxide) indicator that changes colour from clear to light brown at the presence of CO, and 2) paint-sensitive ink. The third sub-case is based on NFC tags with a unique identifier similar to Life-cycle management printing workflow (see Figure 52).
Figure 67. The second sub-case printing workflow for Home Services use case. 6.5.1 Integration tests with retailers The trial for Home services was ran with Leroy Merlin to provide additional value for the end users in term of qualitative information about the appliances such as guarantee information (if device seal was opened), appliance condition (e.g. simple diagnostic messages about functionality, potential hazard information: CO broadcast, influence of applicance on environment, etc), inspection and maintance notifications and service scheduling, etc.

Page 74/81
The demo for the integration test included two mobile service application, one for the client, i.e. Customer app; and one for the retailer, i.e. Serviceman app. The customer app enables user to personalize his profile by adding several different organizational units in which the appliances are used, as well as to add the applicances to the specific organizational unit. The mockups of the applications are provided in the images below.
Figure 68. Customer mobile application: Composition of profile The application supports notifications about the maintaince period and configuration of subunits (rooms), placement of sensors and actuators on floor plan maps, monitoring of consumption information and messages when the CO is above predefined threshold that may influence peoples’ health.
Figure 69. Customer mobile application: Configuration, notification and power consumption monitoring

Page 75/81
Figure 70. Serviceman mobile application: Inspection and maintance report This use case should evaluate and provide feedback using the following KPIs: - Scanning speed ≤ 3s - Scanning realiability ≥ 95 % The scanning speed and scanning reability are evaluated previously as a part of QR code scanning tests as the same module will be used for the described application. The end user satisfaction is KPI which is pending to be evaluated when the applications are finalized and when users are capable to try the applications and express their feedback. The envisioned user satisfaction should be more then 70%.
KPI title Scanning reliability
Actors: Consumer and retailer
Description: The scanning reliability for recognition of the QR code with FC-Scanner and random barcode scanner
Trigger: User opens the application and scans the QR code
Preconditions: SmartTag printed with proper registration and detail rendering
Normal Flow: Once the user opens the application and scans the QR code the extracted alphanumeric string should be shown with accuracy of ≥ 95 %

Page 76/81
Notes and Issues: The reader reliability is directly correlated to the angle and distance of scanner during the scanning process
Measured Value 90%
КPI title Scanning speed
Actors: Consumer
Description: The scanning speed for recognition of the QR code with FC-Scanner and random barcode scanner
Trigger: User opens the application and scans the QR code
Preconditions: SmartTag printed with proper registration and detail rendering
Normal Flow: Once the user opens the application and scans the QR code the extracted alphanumeric string should be timely shown ≤ 2 s
Notes and Issues: The reader scanning speed is directly correlated to the angle and distance of scanner during the scanning process
Measured Value 1-3s
6.6 User experience on use cases
Use cases, developed in TagItSmart project, were evaluated with consumers. The goal of this study was to gather knowledge about use of QR codes or similar and to clarify where consumers would like to utilize printed intelligence and IoT based applications. In addition to use case evaluation, consumers were able to co-innovate novel Tag It Smart solutions. The study was carried out in Finland by using Owela platform (Open Web Lab, http://owela.fi). Owela has been developed at VTT in 2007 for user centric qualitative studies and it supports active user involvement in the innovation process from the early ideas to piloting and actual use. Owela can be utilized to involve users in all phases of a development process for an innovation. Discussion in Owela was open during two weeks from January 16th to 29th, 2017. Figure 71 discribes the layout of the Owela page (stories and discussion are in Finnis due to the fact that we will get the best results when people can participate with their own language). Totally, 45 Finnish consumers participated the discussion and gave 341 comments to the discussion. 53% of the participants were female, and 47% of male. Age distribution varied between 17-79 years, the average age of the participants was 49 years.

Page 77/81
Figure 71. Example of the layout of an Owela page. The use case is described as a story and questions related to it are below. The consumer-centric use cases were presented to the consumers as concept stories to make it easier for them to understand the idea of novel solutions and easily realize the possibilities the solution offers for their daily life. The concept themes were about:
1) Digital product and recycling, 2) Fast moving consumer goods and dynamic pricing, and 3) Authenticity of the products.
In the first story, Digital product and recycling, the idea was described by using beer bottles from a local brewery as an example. The consumer in this stroy had bought a bottle of beer from a local producer and read a unique code from the label on the bottle. The consumer received useful and entertaining information e.g. about the origin of ingredients, the producer, recycling of the package, and also information if the temperature of the beer is optimal. By reading the code the consumer was also able to create an interactive connection with the local producer, that makes it possible e.g. to personalize an own drink together with the producer and order the drinks via a digital service.

Page 78/81
The second story, Fast moving consumer goods and dynamic pricing, describes a situation in a retail store, where the consumer can easily get information if the best before date of the product is close enough to get a discount. This can be done by LED lights that automatically turn on after a certain time period. While being informative towards the consumer, it also makes the work of the retailer more effective. The retailer can also by reading the codes ensure that the products that arrive to the store, are in good condition after transportation and also the origin of the products. In this story meat products were used as an example, so e.g. ensuring that the temperature has been correct during transportation is very important for all the stakeholders. In the third story, Authenticity of the products, a family was on holiday abroad. There, they were able to ensure the authenticity of the medicine and sun classes they purchased by reading the 2D codes from the products in certain lighting conditions. Similar authenticity check could also be done with other products purchased from the internet. After reading the stories, participants discussed about their interest towards the different concepts. Based on the consumer study, it was clear that people in Finland are familiar with 2D codes. All the participants had seen them e.g. in the packages, advertisements and tickets. Three out of four had read 2D codes with their smart phones but only 17% said that they read the codes regularly. Consumers found all of these concepts interesting. 79% of the participants evaluated it to be interesting to read the codes from local producers’ products and to create an interactive relationship (story 1). To utilize the codes in fast moving consumer goods, like meat packages, was in the interest of 55% of the participants (story 2). Finnish consumers did not see so much potential in using the codes in cheap products and they were not concerned about the origin and safety of the products. That was also the case in the authenticity of the products (story 3), but still consumers saw a lot of potential in this case. 85% of the participants evaluated the authenticity of the products interesting. When consumers were asked to choose the most interesting concept for them, 52% chose the Digital product and recycling (story 1). Reasons for that were e.g. consumers’ willingness to support local producers, their interest to discuss interactively with the producer and personalized experiences. 31% preferred the Fast moving consumer goods and dynamic pricing (story 2) and 17% of the participants chose the Authenticity of the products (story 3) to be the most useful one for them. In addition, we got lots of information about the advantages of the TagItSmart concepts, and also about consumers’ consernes related to them. First, even if consumers are used to seeing and using 2D codes, they have often been disappointed with the content they can receive by reading the codes. They expect something more - high quality content that offers them additional value. In addition, consumers were also interested in the possibility of interactivity. There were most potential in using codes in unique and/or personalized products, ensuring food safety of the authenticity of the products and also in creationg interactive connection with producers. Based on this study, consumers were suspicious about if it is too easy to counterfeit the codes, recycling of the tags and also privacy issues related to the novel IoT services. It is essential that the consumers can trust the service and service provider. It is important to take into account when TagItSmart solutions will be brought to the market, how the services are communicated so that consumers understand the difference between traditional codes and functional ones, and also to realise the added value and ensure the trust.

Page 79/81
Section 7 - Handbook on components and functionalities available All the components and functionalities developed in TagItSmart project until M15 and reported in this deliverable are listed in Table 3 with their main characteristics. These components and functionalities are available to be used in Open Calls 1st round, and later in use case piloting. Table 3. Components and functionalities developed in TagItSmart project.
Component / functionality
Suitability for use cases (1)
Development stage Partner(s) responsible
Data Matrix encoding 1, 3 1st-3rd generation available UPC
QR code encoding 2, 4, 5 Available FLE, DNET
Dual tags QR code encoding
3 Available FLE
Encoding as a combination of QR code and image
2, 4, 5 Available DNET
Thermochromic ink printing
1, 2, 5 Available for analog printing, limited availability for digital printing
VTT, DUR
Photochromic ink printing 3, 5 Available for analog printing, limited availability for digital printing
VTT, DUR
Oxygen indicator 4 Available, but limitation in printability
VTT
NFC tags 2, 4, 5 Available TFE
Semantic annotation and query tool
1-5 Available SIE
Scanner authentication module
1-5 Available as an Android App for a smartphone
UNIS, UNIPD
Data Matrix scanning with sensor
1, 3 Available UPC
QR code scanning with context
4, 5 Available FLE, EVT
QR code scanning to trigger AR/VR content
4, 5 Available DNET
(1) Use cases: 1) Digital product, 2) Life-cycle management, 3) Brand protection, 4) Dynamic pricing, 5) Home services

Page 80/81
Section 8 - Conclusions and next steps This document has reported specific activities related to component and functionalities development with focus on SmartTag creation and scanning, as well as use case specific preparations. Results have been reported against pre-defined KPIs and most of the components and functionalities have already reached their target KPIs. Detailed options for architecture integration of the components and functionalities with the software component can be found in deliverable D1.2. Encoding trials for both Data Matrix codes and QR codes have been carried out and encoding reliability of 100% and 83% have been achieved, respectively. Also a method to create dual tags has been tested and it has been proven as a feasible method to implement QR codes with changing URL. Analog and digital printing of different functional inks has been evaluated. Functional codes with cell size down to 0.25 mm have been successfully printed and decoded. For manufacturing NFC tags a method has been developed. Finally, repositories and APIs for storing and retrieving information related to SmartTag and services are undergoing development . Scanning processes for smart tags have been evaluated. For Data Matrix codes scanning reliability of 88 % or 95 % (depending on how functional ink is used in the code) and scanning speed of approximately 2 s have been achieved. For QR codes corresponding values were 90 % and 1-3 s. Performance of a scanner authentication moduel has also been evaluated. Authorized access has been 85 %. Preparations for use case piloting have been carried out. Preliminary printing and scanning tests for Digital product use case have already been evaluated and the smart tag creation and scanning processes have been proven to work. Life-cycle management use case has focused on development of the software components and functionalities including APIs. Scanning reliability 95 % and scanning speed 2 s have been achieved. Ink development for Brand protection use case has been initiated. Dynamic pricing use case has focused on information collection from the cash registed and Home appliances use case for integration tests with retailers. Components and functionalities reported in this document will be used for two purposes: 1) for implementation of the 1st round of open calls projects, and 2) for implementation of use case focused field trials in tasks 5.3 (Field trial on information use and service creation) and 5.4 (Pilot in operational environment). Development and further testing of the existing components and functionalities will, however, continue also in task 5.2 with focus on use case requirements. For example, testing of the specific functional inks and indicators will continue throughout year 2 in order to have technologies available for field trials in year 3. Also new components and functionalities will be tested when those become available from WP2 and WP3. Use cases are more detailed as the project progresses and these presents needs for new components and functionalities. Similarly, challenges fed from the open calls projects will certainly also have an effect on requirements of the components and functionalities. Thus, the list serving as a handbook will be constantly updated during the whole life-cycle of TagItSmart project.

Page 81/81
Section 9 - References [1] GS1 DataMatrix Guidelines. Available: cGS1_DataMatrix_Guideline.pdf
[2] TagItSmart D2.1 deliverable - Semantic model for FunCode, January 2017
[3] TagItSmart D3.1 deliverable - Enablers for FC-scanners, January 2017
[4] TagItSmart Deliverable D3.1 - Enablers for FC-Scanners, January 2017
[5] De Montjoye, Yves-Alexandre, et al. "Unique in the crowd: The privacy bounds of human mobility." Scientific reports 3 (2013): 1376.
[6] Fridman, Lex, et al. "Active authentication on mobile devices via stylometry, application usage, web browsing, and GPS location." IEEE Systems Journal (2016).
[7] Mahbub, Upal, and Rama Chellappa. "PATH: Person authentication using trace histories." Ubiquitous Computing, Electronics & Mobile Communication Conference (UEMCON), IEEE Annual. IEEE, 2016.
[8] Tax, David MJ, and Robert PW Duin. "Support vector data description." Machine learning 54.1 (2004): 45-66.
[9] Hoffmann, Heiko. "Kernel PCA for novelty detection." Pattern Recognition 40.3 (2007): 863-874.
[10] Manevitz, Larry M., and Malik Yousef. "One-class SVMs for document classification." Journal of Machine Learning Research 2.Dec (2001): 139-154.
[11] Takens, Floris. "Detecting strange attractors in turbulence." Dynamical systems and turbulence, Warwick 1980. Springer Berlin Heidelberg, 1981. 366-381.
[12] Janssens, Jeroen HM, Ildiko Flesch, and Eric O. Postma. "Outlier detection with one-class classifiers from ML and KDD." Machine Learning and Applications, 2009. ICMLA'09. International Conference on. IEEE, 2009.
[13] Escalante, H. Jair. "A comparison of outlier detection algorithms for machine learning." Proceedings of the International Conference on Communications in Computing. 2005.
[14] Fix, Evelyn, and Joseph L. Hodges Jr. Discriminatory analysis-nonparametric discrimination: consistency properties. California Univ Berkeley, 1951.
[15] https://www.fiware.org/
[16] http://sociotal.eu/
[17] https://www.microsoft.com/en-us/download/details.aspx?id=52367
[18] TagItSmart D2.2 deliverable - Initial enabler for FunCodes, March 2017.
[19] TagItSmart D1.2 deliverable - Initial TagItSmart! Reference architecture and API description, January 2017.
![TagItSmart ecosystems of connected objects Grant agreement ... · IoT-A [1] was a pioneer in the IoT area setting the foundations upon which many follow-up projects were based. IoT-A](https://static.fdocuments.us/doc/165x107/5f094ed07e708231d42634f6/tagitsmart-ecosystems-of-connected-objects-grant-agreement-iot-a-1-was-a-pioneer.jpg)