
TAG MANAGEMENT ARCHITECTURE AND...
164
TAG MANAGEMENT ARCHITECTURE AND POLICIES FOR HARDWARE-MANAGED TRANSLATION LOOKASIDE BUFFERS IN VIRTUALIZED PLATFORMS By GIRISH VENKATASUBRAMANIAN A DISSERTATION PRESENTED TO THE GRADUATE SCHOOL OF THE UNIVERSITY OF FLORIDA IN PARTIAL FULFILLMENT OF THE REQUIREMENTS FOR THE DEGREE OF DOCTOR OF PHILOSOPHY UNIVERSITY OF FLORIDA 2011
Transcript of TAG MANAGEMENT ARCHITECTURE AND...

TAG MANAGEMENT ARCHITECTURE AND POLICIES FOR HARDWARE-MANAGEDTRANSLATION LOOKASIDE BUFFERS IN VIRTUALIZED PLATFORMS
By
GIRISH VENKATASUBRAMANIAN
A DISSERTATION PRESENTED TO THE GRADUATE SCHOOLOF THE UNIVERSITY OF FLORIDA IN PARTIAL FULFILLMENT
OF THE REQUIREMENTS FOR THE DEGREE OFDOCTOR OF PHILOSOPHY
UNIVERSITY OF FLORIDA
2011

c⃝ 2011 Girish Venkatasubramanian
2

ACKNOWLEDGMENTS
My heartfelt gratitude and thanks are due to my advisor Dr. Renato J. Figueiredo
for supporting, encouraging and guiding me in my academic journey culminating in the
PhD degree. His patience and guidance, especially during the initial years, gave me the
confidence to persevere. Learning from him about computer architecture and systems,
virtualization, the art of research, techniques for good writing and strategies for creating
good presentations has been a wonderful experience. I am privileged to have him as my
advisor and mentor.
I thank Dr. P. Oscar Boykin for teaching me techniques of analytical modeling and
for the invigorating discussions on applying engineering principles to solve real-world
problems. I am grateful to Dr. Jose Fortes for giving me an opportunity to be a part of
the ACIS Lab at the University of Florida and for sharing his insight and perspective
on research and the PhD process. I also thank Dr. Tao Li and Dr. Prabhat Mishra for
serving on my committee and for their insightful questions and suggestions which have
enhanced this dissertation.
A good portion of my computer architecture knowledge and simulation skills were
learned and honed during my internships at Intel Corporation. I thank Ramesh Illikkal,
Greg Regnier, Donald Newell and Dr. Ravi Iyer for giving me these opportunities and
Nilesh Jain, Jaideep Moses, Dr. Omesh Tickoo and Paul M.Stillwell Jr for helping me
complete these internships successfully. I also thank the members of the SoC Platform
and Architecture group at Intel Labs for their ideas and perspectives on my research.
I am especially thankful to Dr. Omesh Tickoo for being a wonderful mentor during and
after my internship.
I would also like to thank my past and present colleagues at ACIS Labs and at
University of Florida including Priya Bhat, Dr. Vineet Chadha, Dr. Arijit Ganguly, Dr.
Clay Hughes, Selvi Kadirvel, Dr. Andrea Matsunaga, Dr. James M. Poe II, Prapaporn
Rattanatamrong, Pierre St. Juste, Dr. Mauricio Tsuagawa and David Wolinsky for their
3
help and feedback on my work and for the many intellectual discussions on computer
architecture, computer networks, modeling and simulation. This work was funded in
part by the National Science Foundation under CRI collaborative awards 0751112,
0750847, 0750851, 0750852, 0750860, 0750868, 0750884, and 0751091 and by a
grant from Intel Corporation. I would also like to acknowledge the University of Florida
High-Performance Computing Center for computation resources. I also thank Virtutech
for their support in using Simics and Naveen Neelakantam from the University of Illinois
at Urbana-Champaign for his help with using FeS2.
My motivation to obtain a PhD was inspired by my parents, Dr. N. K. Venkatasubramanian
and Prabhavathy Venkatasubramanian, and my uncle Vaidyanathan. They, along with
my sister Dr. Chitra Venkatasubramanian and my brother-in-law Murthy S. Krishna, have
been a source of encouragement and support without which this dissertation would not
have been completed. I thank them and dedicate this dissertation to them.
4
TABLE OF CONTENTS
page
ACKNOWLEDGMENTS . . . . . . . . . . . . . . . . . . . . . . . . . . . . . . . . . . 3
LIST OF TABLES . . . . . . . . . . . . . . . . . . . . . . . . . . . . . . . . . . . . . . 8
LIST OF FIGURES . . . . . . . . . . . . . . . . . . . . . . . . . . . . . . . . . . . . . 9
ABSTRACT . . . . . . . . . . . . . . . . . . . . . . . . . . . . . . . . . . . . . . . . . 11
CHAPTER
1 INTRODUCTION . . . . . . . . . . . . . . . . . . . . . . . . . . . . . . . . . . . 13
1.1 Hardware-Managed TLBs in Virtualized Environments . . . . . . . . . . . 141.2 Contributions of the Dissertation . . . . . . . . . . . . . . . . . . . . . . . 15
1.2.1 Simulation-Based Analysis of the TLB Performance on VirtualizedPlatforms . . . . . . . . . . . . . . . . . . . . . . . . . . . . . . . . 16
1.2.2 Tag Manager Table for Process-Specific Tagging of the TLB . . . . 171.2.3 Mechanisms and Policies for TLB Usage Control . . . . . . . . . . 18
1.3 Outline of the Dissertation . . . . . . . . . . . . . . . . . . . . . . . . . . . 19
2 BACKGROUND: VIRTUAL MEMORY AND PLATFORM VIRTUALIZATION . . 21
2.1 Virtual Memory in Non-Virtualized Systems . . . . . . . . . . . . . . . . . 222.1.1 Implementing Virtual Memory Using Paging . . . . . . . . . . . . . 232.1.2 Address Translation in x86 with Page Address Extension Enabled . 24
2.2 Translation Lookaside Buffer . . . . . . . . . . . . . . . . . . . . . . . . . 262.3 Virtual Memory in Virtualized Systems . . . . . . . . . . . . . . . . . . . . 28
2.3.1 Full-System Virtualization and Shadow Page Tables . . . . . . . . 292.3.2 Paravirtualization and Page Tables . . . . . . . . . . . . . . . . . . 302.3.3 Hardware Virtualization and Two-Level Page Tables . . . . . . . . . 31
2.4 Summary . . . . . . . . . . . . . . . . . . . . . . . . . . . . . . . . . . . . 33
3 A SIMULATION FRAMEWORK FOR THE ANALYSIS OF TLB PERFORMANCE 34
3.1 Survey of Simulation Frameworks Used in TLB-Related Research . . . . 353.2 Developing the Simulation Framework . . . . . . . . . . . . . . . . . . . . 36
3.2.1 Using Simics and FeS2 as Foundation . . . . . . . . . . . . . . . . 373.2.2 TLB Functional Model . . . . . . . . . . . . . . . . . . . . . . . . . 383.2.3 Validation of the TLB Functional Model . . . . . . . . . . . . . . . . 393.2.4 TLB Timing Model . . . . . . . . . . . . . . . . . . . . . . . . . . . 403.2.5 Validating the TLB Timing Model . . . . . . . . . . . . . . . . . . . 42
3.3 Selection and Preparation of Workloads . . . . . . . . . . . . . . . . . . . 453.3.1 Workload Applications . . . . . . . . . . . . . . . . . . . . . . . . . 463.3.2 Consolidated Workloads . . . . . . . . . . . . . . . . . . . . . . . . 463.3.3 Multiprocessor Workloads . . . . . . . . . . . . . . . . . . . . . . . 47
5
3.3.4 Checkpointing Workloads . . . . . . . . . . . . . . . . . . . . . . . 483.4 Evaluation of the Simulation Framework . . . . . . . . . . . . . . . . . . . 483.5 Using the Framework to Investigate TLB Behavior in Virtualized Platforms 51
3.5.1 Increase in TLB Flushes on Virtualization . . . . . . . . . . . . . . 533.5.2 Increase in TLB Miss Rate on Virtualization . . . . . . . . . . . . . 543.5.3 Decrease in Workload Performance on Virtualization . . . . . . . . 56
3.5.3.1 I/O-intensive workloads . . . . . . . . . . . . . . . . . . . 573.5.3.2 Memory-intensive workloads . . . . . . . . . . . . . . . . 603.5.3.3 Consolidated workloads . . . . . . . . . . . . . . . . . . . 61
3.5.4 Impact of Architectural Parameters on TLB Performance . . . . . . 633.6 Summary . . . . . . . . . . . . . . . . . . . . . . . . . . . . . . . . . . . . 65
4 A TLB TAG MANAGEMENT FRAMEWORK FOR VIRTUALIZED PLATFORMS 66
4.1 Current State of the Art in Improving TLB Performance . . . . . . . . . . . 664.2 Architecture of the Tag Manager Table . . . . . . . . . . . . . . . . . . . . 68
4.2.1 Avoiding Flushes Using the Tag Manager Table . . . . . . . . . . . 704.2.2 TLB Lookup and Miss Handling Using the Tag Manager Table . . . 72
4.3 Modeling the Tag Manager Table . . . . . . . . . . . . . . . . . . . . . . . 744.4 Impact of the Tag Manager Table . . . . . . . . . . . . . . . . . . . . . . . 74
4.4.1 Reduction in TLB Flushes Due to the TMT . . . . . . . . . . . . . . 744.4.2 Reduction in TLB Miss Rate Due to the TMT . . . . . . . . . . . . . 794.4.3 Increase in Workload Performance Due to the TMT . . . . . . . . . 82
4.5 Architectural and Workload Parameters Affecting the Impact of the TMT . 884.5.1 Architectural Parameters . . . . . . . . . . . . . . . . . . . . . . . . 884.5.2 Workload Parameters . . . . . . . . . . . . . . . . . . . . . . . . . 88
4.5.2.1 Effect of larger memory footprint . . . . . . . . . . . . . . 894.5.2.2 Effect of the number of processes in the workload . . . . 91
4.5.3 Sensitivity Analysis . . . . . . . . . . . . . . . . . . . . . . . . . . . 944.6 Comparison of Process-Specific and Domain-Specific Tags . . . . . . . . 964.7 Using the Tag Manager Table on Non-Virtualized Platforms . . . . . . . . 974.8 Enabling Shared Last Level TLBs Using the Tag Manager Table . . . . . . 99
4.8.1 Using the TMT as the Tagging Framework . . . . . . . . . . . . . . 1004.8.2 Architecture of the Shared LLTLB . . . . . . . . . . . . . . . . . . . 1014.8.3 Miss Rate Improvement Due to Shared Last Level TLBs . . . . . . 104
4.9 Summary . . . . . . . . . . . . . . . . . . . . . . . . . . . . . . . . . . . . 106
5 CONTROLLED SHARING OF HARDWARE-MANAGED TLB . . . . . . . . . . 107
5.1 Motivation . . . . . . . . . . . . . . . . . . . . . . . . . . . . . . . . . . . . 1095.2 Architecture of the CShare TLB . . . . . . . . . . . . . . . . . . . . . . . . 1115.3 Experimental Framework . . . . . . . . . . . . . . . . . . . . . . . . . . . 1155.4 Performance Isolation using CShare Architecture . . . . . . . . . . . . . . 1155.5 Performance Enhancement Using CShare Architecture . . . . . . . . . . 119
5.5.1 Classification of TLB Usage Patterns . . . . . . . . . . . . . . . . . 1195.5.2 Performance Improvement With Static TLB Usage Control . . . . . 122
6

5.5.3 Selective Performance Improvement With Static TLB Usage Control1275.5.4 Performance Improvement With Dynamic TLB Usage Control . . . 131
5.6 Summary . . . . . . . . . . . . . . . . . . . . . . . . . . . . . . . . . . . . 134
6 CONCLUSION AND FUTURE WORK . . . . . . . . . . . . . . . . . . . . . . . 136
APPENDIX
A FULL FACTORIAL EXPERIMENT . . . . . . . . . . . . . . . . . . . . . . . . . 139
B FULL FACTORIAL EXPERIMENTS USING THE SIMULATION FRAMEWORK 141
C USING THE TAG MANAGER TABLE FOR TAGGING I/O TLB . . . . . . . . . . 142
C.1 Architecture of VMA . . . . . . . . . . . . . . . . . . . . . . . . . . . . . . 143C.2 Prototyping and Simulating the VMA Architecture . . . . . . . . . . . . . . 144C.3 Using the Tag Manager Table in VMA Architecture . . . . . . . . . . . . . 151C.4 Functional Verification of the Use of TMT in VMA . . . . . . . . . . . . . . 152C.5 Summary . . . . . . . . . . . . . . . . . . . . . . . . . . . . . . . . . . . . 153
REFERENCES . . . . . . . . . . . . . . . . . . . . . . . . . . . . . . . . . . . . . . . 154
BIOGRAPHICAL SKETCH . . . . . . . . . . . . . . . . . . . . . . . . . . . . . . . . 164
7

LIST OF TABLES
Table page
3-1 Pseudocode of the micro benchmark for TLB timing model validation . . . . . . 43
3-2 Throughput of the simulation framework for multiprocessor x86 simulations . . 52
3-3 Simulation parameters for investigating TLB behavior on virtualized platforms . 53
3-4 Impact of Page Walk Latency on TLB-induced performance reduction RIPC . . 63
4-1 Flush profile for SPECjbb-based workloads with varying heap sizes . . . . . . 90
4-2 Flush Profile for TPCC-UVa based workloads with varying number of processesand varying TMT sizes . . . . . . . . . . . . . . . . . . . . . . . . . . . . . . . . 93
4-3 Factors and their levels for the sensitivity analysis . . . . . . . . . . . . . . . . . 95
4-4 Factors with significant influence on the Reduction in TLB miss rates due toCR3 tagging . . . . . . . . . . . . . . . . . . . . . . . . . . . . . . . . . . . . . 96
5-1 Algorithms for selection of victim SID . . . . . . . . . . . . . . . . . . . . . . . . 114
8

LIST OF FIGURES
Figure page
2-1 Page walk for a 4KB page with PAE enabled . . . . . . . . . . . . . . . . . . . . 26
2-2 Translation Lookaside Buffer . . . . . . . . . . . . . . . . . . . . . . . . . . . . 27
2-3 Memory virtualization in a virtualized platform . . . . . . . . . . . . . . . . . . . 29
3-1 Simulation framework for analyzing TLB performance . . . . . . . . . . . . . . 38
3-2 Timing flow in the simulation framework . . . . . . . . . . . . . . . . . . . . . . 40
3-3 Validation of the TLB timing model . . . . . . . . . . . . . . . . . . . . . . . . . 44
3-4 Screenshot of the simulation framework in use . . . . . . . . . . . . . . . . . . 49
3-5 Throughput of the simulation framework for uniprocessor x86 simulations . . . 50
3-6 Increase in TLB flushes on virtualization . . . . . . . . . . . . . . . . . . . . . . 54
3-7 Increase in TLB miss rate on virtualization . . . . . . . . . . . . . . . . . . . . . 55
3-8 Decrease in single-domain workload performance on virtualization . . . . . . . 58
3-9 Decrease in consolidated workload performance on virtualization . . . . . . . . 62
3-10 Impact of the pipeline fetch width (FW) on TLB-induced performance reduction 64
4-1 TLB flush behavior with the Tag Manager Table . . . . . . . . . . . . . . . . . . 70
4-2 TLB lookup behavior with the Tag Manager Table . . . . . . . . . . . . . . . . . 72
4-3 Reduction in TLB flushes using an 8-entry TMT . . . . . . . . . . . . . . . . . . 75
4-4 Effect of Tag Manager Table size on the reduction in number of flushes . . . . . 78
4-5 Reduction in TLB miss rate using an 8-entry TMT . . . . . . . . . . . . . . . . . 80
4-6 Effect of TLB associativity on the reduction in miss rate . . . . . . . . . . . . . 82
4-7 Increase in workload performance using an 8-entry TMT . . . . . . . . . . . . . 85
4-8 Effect of the Page Walk Latency on the improvement in performance . . . . . . 87
4-9 Effect of workload memory footprint on the reduction in TLB miss rate . . . . . 91
4-10 Effect of the number of workload processes on the reduction in ITLB miss rate 94
4-11 Comparison of the performance improvement due to process-specific andVM-specific tagging . . . . . . . . . . . . . . . . . . . . . . . . . . . . . . . . . 97
4-12 Performance impact of TMT on non-virtualized platforms . . . . . . . . . . . . . 98
9
4-13 Using the TMT for Shared Last Level TLBs . . . . . . . . . . . . . . . . . . . . 102
4-14 Reduction in DTLB miss rate due to Shared Last Level TLB . . . . . . . . . . . 105
5-1 Performance improvement for consolidated workloads with uncontrolled TLBsharing . . . . . . . . . . . . . . . . . . . . . . . . . . . . . . . . . . . . . . . . 110
5-2 Controlled TLB usage using CShare architecture . . . . . . . . . . . . . . . . . 112
5-3 Effect of varying TLB reservation on miss rate . . . . . . . . . . . . . . . . . . . 117
5-4 Miss rate isolation using the TMT architecture . . . . . . . . . . . . . . . . . . . 118
5-5 Classification of TLB usage patterns . . . . . . . . . . . . . . . . . . . . . . . . 121
5-6 Overall miss rate improvement for consolidated workload with static TLB usagecontrol . . . . . . . . . . . . . . . . . . . . . . . . . . . . . . . . . . . . . . . . . 124
5-7 Overall performance improvement for consolidated workload with static TLBusage control . . . . . . . . . . . . . . . . . . . . . . . . . . . . . . . . . . . . . 126
5-8 Selective performance improvement for consolidated workload with static TLBusage control . . . . . . . . . . . . . . . . . . . . . . . . . . . . . . . . . . . . . 128
5-9 Dynamic TLB Usage Control . . . . . . . . . . . . . . . . . . . . . . . . . . . . 132
5-10 Selective performance improvement for consolidated workload with dynamicTLB usage control . . . . . . . . . . . . . . . . . . . . . . . . . . . . . . . . . . 133
C-1 Architecture and simulation-based prototype of VMA . . . . . . . . . . . . . . . 145
C-2 IPMMU and I/O TLB . . . . . . . . . . . . . . . . . . . . . . . . . . . . . . . . . 150
C-3 Functional validation of the use of TMT in VMA . . . . . . . . . . . . . . . . . . 152
10

Abstract of Dissertation Presented to the Graduate Schoolof the University of Florida in Partial Fulfillment of theRequirements for the Degree of Doctor of Philosophy
TAG MANAGEMENT ARCHITECTURE AND POLICIES FOR HARDWARE-MANAGEDTRANSLATION LOOKASIDE BUFFERS IN VIRTUALIZED PLATFORMS
By
Girish Venkatasubramanian
August 2011
Chair: Renato J. FigueiredoMajor: Electrical and Computer Engineering
The use of virtualization to effectively harness the power of multi-core processors
has emerged as a viable solution to meet the growing demand for computing resources,
especially in the server segment of the computing industry. However, two significant
issues in using virtualization for performance-critical workloads are: 1. the overhead of
virtualization, which adversely impacts the performance of such virtualized workloads,
and 2. the ”noise” or variation in the performance of these virtualized workloads due to
the platform resources being shared amongst multiple virtual machines (VMs) . Thus,
improving the performance of virtualized workloads and reducing the performance
variations introduced by the sharing of platform resources are two challenges in
the field of virtualization. Meeting these challenges, specifically in the context of
hardware-managed Translation Lookaside Buffers (TLBs), forms the theme of this
dissertation.
To understand the performance impact of the TLB and to investigate the performance
improvement due to various architectural modifications, a suitable simulation framework
is imperative. Hence, the first contribution of this dissertation is developing a full-system
execution-driven simulation framework supporting the x86 ISA and detailed TLB
functional and timing models. Using this framework, it is observed that the performance
of typical server workloads are reduced by as much as 8% to 35% due to the TLB
misses on virtualized platforms, compared to the 1% to 5% reduction on non-virtualized
11
single-O/S platforms. This clearly motivates the need for improving the TLB performance
for virtualized workloads.
The second part of this dissertation proposes the Tag Manager Table (TMT)
for generating and managing process-specific tags for hardware-managed TLBs,
in a software-transparent manner. By tagging the TLB entries with process-specific
identifiers, multiple processes can share the TLB, thereby avoiding TLB flushes that are
triggered during context switches. Using the TMT reduces the TLB miss rates by 65%
to 90% and the TLB-induced delay by 50% to 80% compared to a TLB without tags,
thereby improving workload performance by 4.5% to 25%. The effect of various factors
including the TLB and TMT design parameters, the workload characteristics and the
TLB miss penalty on the benefit of using the TMT is explored. The use of the TMT in
enabling shared Last Level TLBs is also investigated. Furthermore, the use of the TMT
to tag I/O TLBs, in scenarios where address translation services and TLBs in the I/O
fabric allow I/O devices to operate in virtual address space, is also explored.
While the TMT enables multiple processes to share a TLB, this results in the
TLB becoming a potential resource of contention. The third part of this dissertation
investigates the performance implications of such TLB contention and proposes the
CShare TLB architecture to isolate the TLB behavior of virtualized workloads from one
another using a TLB Sharing Table (TST) along with the TMT. The use of the CShare
TLB in increasing the overall performance of consolidated workloads involving streaming
applications with poor TLB usage as well as in selectively increasing the performance
of a high priority workload by restricting the TLB usage of low priority workloads is
explored. It is observed that the increase in the performance of a high priority workload
due to using the TMT without controlled sharing can be further improved by 1.4× using
such TLB usage restrictions. The use of dynamic usage control policies to achieve this
selective performance increase while minimizing the performance reduction of the low
priority workloads is also investigated.
12

CHAPTER 1INTRODUCTION
The current paradigm of computing in the server industry is undergoing rapid
changes. On one hand, the demand for computing resources has been growing,
especially in the server segment. This growth is driven by the expansion of online
service providers including cloud computing and social networking services, in addition
to the traditional server-oriented high-performance computing and banking sectors.
Facebook, a major social network provider, has increased the number of servers it uses
from 10, 000 to 30, 000 in 2009 [1]. Cloud service providers including Amazon EC2,
Rackspace and GoGrid have experienced increasing computing requirements in the
past year [2].
On the other hand, Chip Multi Processor (CMP) architectures, with an ever
increasing number of processors on a single die, have emerged as the architectural
solution for powerful servers [3]. Processors with 8 hardware threads are already being
used and 16 thread processors have been demonstrated [4].
Virtualization has emerged as one of the key technologies allowing to tap the
power of CMPs to meet the computing demands of the server segment in a flexible
manner [5]. By encapsulating applications with their Operating System (O/S) and
software stack in virtual machines (VMs), multiple applications can be consolidated on
a single physical platform. Moreover, with the rising emphasis on ”green” server rooms
and low-cost autonomic management, virtualization has emerged as a convenient way
to manage Quality of Service (QoS) and resource sharing among the consolidated
applications. Virtualization is also being explored for ensuring application portability in
High Performance Computing (HPC) systems by virtualizing different HPC systems with
disparate architectures into a standardized platform abstraction [6, 7].
Estimates by Gartner [8, 9], predicting that Hosted Virtual Desktop market will
surpass $65 billion in 2013 and the Software as a Service (SaaS) model using
13

virtualization will account for 20% of email services by 2012, clearly highlight the
importance of virtualization in the server domain. Similarly, the recent virtualization
of Sandia National Lab’s Red Storm supercomputer using a specially designed
hypervisor [10] is a testament to the applicability of virtualization in HPC domains.
However, the benefit of using virtualization for performance critical server and HPC
applications is accompanied by two significant challenges.
1.1 Hardware-Managed TLBs in Virtualized Environments
Full-system virtualization may be viewed as providing an environment where
multiple applications, each belonging to different users and having different requirements
(such as the software stack on which it runs), can coexist [11]. Typically, the application
running in a VM is not aware of this fact and behaves in exactly the same way as it
would on a real machine except for timing considerations. In this scenario, it is important
to shield the state of one VM from the actions of another VM which runs on the same
physical platform. To ensure this, Popek and Goldberg [12, 13] mandated that attempts
to execute privileged instructions inside the VM should trap to the Virtual Machine
Monitor (VMM).
Satisfying this requirement causes a performance overhead for virtualized
workloads. Specifically, an entry into the VMM or an exit from the VMM involves
changing the CPU mode to the privileged mode and saving and restoring state related
information. Apart from the apparent overhead, these switches also pose an additional
demand on the CPU caches and thereby pollute them, posing further performance
overheads. Reducing such performance degradation is a significant challenge in the
area of platform virtualization. Another challenge on virtualized platforms is the need to
shield the performance of the workload running in one VM from the ”noise” or variation
due to the resource consumption of other VMs which share platform resources. While
this is not strictly required to maintain correctness of virtualization, performance isolation
is imperative to achieve predictable performance and for ensuring that the performance
14
of a high priority workload is not reduced due to the resource requirement of low priority
workloads.
When considering these performance related challenges, the most expensive
CPU cache is the Translation Lookaside Buffer (TLB) [14]. The TLB caches the
translations from the virtual to the physical address space and is in the critical path
of memory operations. Hardware-managed TLBs, which are typical in most virtualized
platforms [15], are flushed on every context switch to ensure that one process’s TLB
entries are not used for other processes. This flushing however, ensures that every
process which is switched into context experiences a large number of TLB misses until
the required entries are brought back into the TLB. Thus, the flushing of the TLB and
the subsequent TLB misses and page walks to service these misses constitute a delay
which slows down the performance of the process.
While typically tolerable in the case of non-virtualized systems, this performance
slowdown is quite high in virtualized consolidated scenarios due to the large number of
address spaces and the frequent switches between these address spaces as well as
the switching between the VM and the VMM. It is vital to reduce this TLB-induced delay
in virtualized platforms especially for performance critical applications. Many solutions
attempt to reduce this TLB-induced performance penalty, as explained in Chapter 4, by
sharing the TLB amongst multiple address spaces across context switch boundaries.
This, however, makes the hardware-managed TLB a shared resource and yet another
source of performance noise, necessitating TLB performance isolation solutions. Solving
these performance improvement and performance isolation challenges in the context of
the hardware-managed TLB forms the focus of this dissertation.
1.2 Contributions of the Dissertation
This dissertation makes three major contributions towards solving the challenges
outlined in Section 1.1. A brief outline of the contributions are presented here.
15

1.2.1 Simulation-Based Analysis of the TLB Performance on Virtualized Plat-forms
In order to understand the performance degradation caused by the high-frequency
TLB flushing on virtualized platforms and to investigate the impact of various schemes
that are proposed to reduce the TLB-induced delay, simulation frameworks supporting
detailed and customizable performance and timing models for the TLB are needed.
In fact, most works studying hardware-managed TLBs have used miss rates as the
metric for measuring the impact of the TLB [16–18] due to the lack of suitable simulation
frameworks supporting TLB timing models. While the reduction in miss rate is a suitable
initial metric, the true impact of the TLBs on the system performance can be obtained
only by using timing-based metrics.
In addition to satisfying the requirement for TLB models, simulation frameworks that
are used for studying virtualized scenarios should be full-system and execution-driven
to capture the interaction between the hardware, VMM, VM and applications. Moreover,
such simulation frameworks should support the simulation of x86 ISA since that is one of
the most popular virtualized platforms [15]. However, simulating x86 is difficult due to the
complex architecture and the fact that every x86 instruction is broken down into micro
operations (µops) which have to be simulated.
A survey of currently available simulators, as conducted in Chapter 3, clearly show
that there are few academic simulators that satisfy all these requirements. To address
this issue, a full-system simulation framework supporting x86 ISA and TLB models is
developed, validated and used to experimentally evaluate the performance implications
of the TLB in virtualized environments. This framework uses two existing simulators
(Simics and FeS2) as its foundation and incorporates a TLB timing model. This is the
only academic simulation framework that provides a detailed timing model for the TLB
and simulates the walking of page tables on a TLB miss. Moreover, this framework is
capable of simulating multiprocessor multi-domain workloads, which makes it uniquely
16
suitable for studying virtualized platforms. Using this framework, the TLB behavior
of I/O-intensive and memory-intensive virtualized workloads is characterized and
contrasted with their non-virtualized equivalents. It is shown that, unlike non-virtualized
single-O/S scenarios, the adverse impact of the TLB on the workload performance is
significant on virtualized platforms. Using the developed simulation framework, it is
shown that this performance reduction for virtualized workloads is as much as 35%
due to the TLB misses which are caused by the repeated flushing of the TLB and the
subsequent page walks to service these misses.
1.2.2 Tag Manager Table for Process-Specific Tagging of the TLB
To address this issue of TLB-induced performance reduction, this dissertation
proposes a novel microarchitectural approach called the Tag Manager Table (TMT). The
TMT approach involves tagging the TLB entries with tags that are process-specific, thus
associating them with the process which owns them. By tagging the TLB entries, TLB
flushes can be avoided during context switches, as well as during switches between
the VMM and the VM. This results in a reduction in the TLB miss rate. The TMT is a
small, fast, fully associative cache which is implemented at the same level as the TLB.
Every TLB has an associated TMT. Each entry in the TMT captures the context of a
process and stores a unique tag associated with this process which is used to tag the
TLB entries of this process. The TMT is designed to generate and manage these tags in
a software-transparent fashion while ensuring low latency of TLB lookups and imposing
a small area overhead.
The benefit of using the TMT and process-specific tagged TLB in virtual platforms is
estimated using the developed simulation framework. It is found that using process-specific
tags reduces the TLB miss rate by about 65% to 90% for typical server workloads
compared to using no tags. This reduction in miss rate effectively reduces the
TLB-induced delay by about 50% to 80% which, depending on the TLB miss penalty,
translates into a 4.5% to 25% improvement in the performance of the workloads. The
17
effectiveness of the TMT approach depends on microarchitectural factors including
the size of the TLB and TMT, the page walk latency and the workload characteristics,
including the number of processes and the working set size of the workload. On the
other hand, the associativity and replacement policy of the TLB play little role in deciding
the impact of the TMT. These various architectural and workload-related factors are
prioritized according to their impact on the benefit obtained from using the TMT.
The primary motivation for the Tag Manager Table is avoiding TLB flushes by
tagging the contents of the TLB with process-specific identifiers and thereby enabling
multiple processes to share a TLB. Since the tags are generated at a process-level
granularity and are not tied to any virtualization-specific aspect, the TMT may be used
to avoid TLB flushes in non-virtualized scenarios as well. In addition, sharing across
multiple per-core private TLBs using a hierarchical design with a shared Last Level TLB
(LLTLB) in order to exploit inter-TLB sharing [19], is made possible on platforms with
hardware-managed TLBs using the Tag Manager Table. This dissertation also shows
that, even for two unrelated workloads with little scope for inter-TLB sharing, shared
LLTLBs result in reducing the miss rate compared to private LLTLBs occupying the same
on-chip area by 15% to 28% due to a better usage of the TLB space. Another scenario
in which the TMT may be used is in tagging I/O TLBs, in scenarios where address
translation services and TLBs in the I/O fabric allow I/O devices to operate in virtual
address space, and synchronizing the I/O TLB flushes with the core TLB flushes. These
scenarios are investigated in this dissertation.
1.2.3 Mechanisms and Policies for TLB Usage Control
One of the advantages of virtualization is that, by consolidating applications which
stress different parts of the system, the average utilization of the entire system can be
increased. However, even completely disparate applications will share core platform
resources and influence the performance of one another depending on the consumption
of these core resources. Since the TMT enables the sharing of the TLB among multiple
18
workloads, it makes the TLB one such shared resource and renders the performance of
an application in one VM susceptible to variations due to the TLB usage of other VMs
sharing the TLB. This necessitates mechanisms and policies for controlling the use of
the TLB.
The third part of this dissertation addresses this need. First, the TLB space
utilization of consolidated workloads, with more than one VM running on the same
physical platform is characterized in order to understand the performance noise due to
shared TLBs and to motivate the need for explicitly controlling the usage by different
workloads sharing the TLB. Then, the CShare TLB architecture, consisting of the TMT
with a TLB Sharing Table (TST) to control the usage of the shared TLB, is proposed. It
is shown that the TLB behavior of a workload running in a VM can be isolated from the
TLB usage of other VMs running on the same platform by assigning fixed slices of the
shared TLB space using the TST to the various VMs. The use of the TST in improving
the overall performance of consolidated workloads or in selectively improving the
performance of a high priority workload by restricting the TLB usage of other low priority
workloads is explored. This dissertation shows that the performance improvement for
the high priority workload that is achieved by using the TMT without usage control can
be further increased by 1.4× by restricting the TLB usage of low priority workloads
using the TST. The cost of such selective performance enhancement for various types
of workloads and the use of dynamic usage control policies for minimizing this cost are
also investigated in this dissertation.
1.3 Outline of the Dissertation
The remaining part of this dissertation is organized as follows. Relevant background
information about virtual memory, TLBs and memory management in virtualized
systems is presented in Chapter 2. The design and validation of the full-system
simulation framework with the TLB timing model is described in Chapter 3 along with
an analysis of the TLB-induced performance degradation in virtualized workloads. The
19

architecture and functionality of the Tag Manager Table and the performance benefit
of using it is presented in Chapter 4. The use of the TMT in enabling shared LLTLBs is
also discussed in this chapter. The need for usage management policies in the TLB is
motivated in Chapter 5 and the use of the CShare TLB for achieving usage control with
static and dynamic policies is discussed in depth. The leveraging of the TMT to tag I/O
TLBs is proposed, simulated and validated in Appendix C. The conclusions from this
dissertation are summarized in Chapter 6.
20

CHAPTER 2BACKGROUND: VIRTUAL MEMORY AND PLATFORM VIRTUALIZATION
Virtualization can be viewed as the successor to emulation [20]. In the case
of computer systems, emulation is the process of duplicating the functions of a
target system using a different source system, so that the source system behaves
like the target system. The target system is usually emulated at the functional level.
Virtualization takes this concept to the next level by allowing a host system to behave
like multiple different guest systems [20].
Platform virtualization or full-system virtualization, one of the common types of
virtualization, is defined as the hiding of the physical characteristics of a computing
platform from users and showing an abstract computing platform. The abstraction thus
exposed is called a Virtual Machine. The virtual machine monitor (VMM) or hypervisor
acts as the control and translation system between the VMs and the physical platform
hardware. A VM behaves is the exact same way as a physical machine and, except for
timing considerations, is indistinguishable from a physical machine. The software stack
running inside a VM is unaware that it is not directly running on a physical machine.
Since the level at which the abstraction is provided tends to be the Instruction Set
Architecture (ISA), such virtualization is also known as full-system virtualization or ISA
level virtualization.
In addition server consolidation for harnessing the power of CMPs, as mentioned in
Chapter 1, virtualization has many advantages:
• In a server environment, virtualization reduces the cost of infrastructure bymaximizing the utilization of the resources and enhancing the managementcapabilities.
• Desktop Virtualization [21], the concept of using a thin and inexpensive client toaccess a virtual desktop running on powerful backend servers, enables simplerand inexpensive provisioning of desktops and lowers the costs for managingsecurity and deploying new software by the system administrator.
21
• Hosted virtual machines, wherein the VM runs as an application on the hostplatform along with several host-level non-virtualized applications, can be used toprovide an effective isolated sandbox for software testing and development [22].
• Virtualization enables utility computing and cloud computing [23]. Using servicemodels such as Infrastructure as a Service (IaaS) and Applications as a Service(AaaS), virtualization can provide economical and secure utility computing withguarantees of privacy and isolation of data and performance.
• Virtualization enables computing grids spanning widely distributed resources. Byproviding different users with virtual machine images [24, 25] which can scavengecomputing cycles from their resources, it becomes possible to create a pool ofcomputing power which can be used for large scale computing.
While virtualization provides better resource utilization and new paradigms of
computing, virtualizing a computer system is challenging. Specifically, in the case of the
memory subsystem, it is important to realize that memory is already virtualized even
on non-virtualized single-O/S systems. Platform virtualization adds yet another layer of
abstraction to this already-virtualized memory. Creating and managing these levels of
abstraction makes memory virtualization challenging. Since the work in this dissertation
lies in the domain of memory virtualization, some relevant background about memory
virtualization in non-virtualized platforms as well as virtualized platforms is presented in
this chapter.
2.1 Virtual Memory in Non-Virtualized Systems
Memory virtualization is a concept whereby an application is provided with an
abstraction of an address space that is different from the actual physical memory. This
abstracted address space is termed as virtual memory, virtual address space or linear
address space. By virtualizing memory and providing processes with unique virtual
address spaces, multiple processes can share the physical memory [20]. Using this
abstraction, applications can be written assuming a contiguous address space without
the programmer having to consider issues such as the size of the physical memory
and the range of addressable locations. Using virtual memory, a program can use
absolute addressing modes and can be easily ported from one machine to another
22

without needing any change. Memory virtualization may also be used for providing the
application with a memory space that may be in excess of the actual physical memory
available. Moreover, virtual memory may be used to enforce memory isolation amongst
multiple processes and restrict the type of accesses allowed on different memory
locations based on the semantics of the data stored at those locations.
2.1.1 Implementing Virtual Memory Using Paging
Memory is typically virtualized by paging. Here, the available physical memory is
partitioned as multiple regular-sized blocks called page frames. The virtual memory is
composed of blocks termed as pages, whose size is the same as the frames. Whenever
a certain virtual address needs to be accessed, the page containing that address is
fit on to a page frame in physical memory by mapping the virtual page to the physical
frame address. The page table stores the details of the virtual to physical mapping.
The process of converting a virtual address to a physical address, in order to access
memory, is known as address translation. Since address translation is a high frequency
operation in the critical path of all memory accesses, it is usually implemented in the
Memory Management Unit (MMU) hardware.
Address translation
Address translation consists of looking up the virtual to physical address mapping
from the page tables and this process is termed as the page walk. Since the page
table also contains information such as the types of operations permitted on the page,
address translation also provides some measure of isolation and protection. If the page
is not currently mapped in memory, a page fault is raised and handled by the system
software by mapping the virtual address page onto a free physical memory frame
or evicting an existing page from its frame and reusing the frame for the new page.
The page table for the new page as well as the evicted victim page are updated. The
contents of the page which has been evicted from physical memory is maintained in the
virtual memory disk cache.
23

A flat page table, which stores all the page mapping information in a single-level
table, is conceptually simple. But, the physical memory requirements for such a flat
table makes it prohibitively expensive. Hence multi-level page tables are used. Here,
the starting address of the first level page tables is usually stored in a register called
the Page Table Base Register (PTBR). In conjunction with the PTBR, a part of the
virtual address is used to index the first level of page tables. The contents of the indexed
location in the first level page table points to the start of the second level of page tables.
Along with the next part of the virtual address, this is used to index the second level
page table. This process is continued till the last level page table is indexed and the
physical address corresponding to the virtual address is obtained.
The set of hierarchical page tables may also be paged, i.e., parts of the hierarchical
page tables may reside in disk and can be brought into physical memory when needed.
In such cases the upper levels of the hierarchical page table are always maintained
in memory to avoid deadlocks. It should be noted that most systems allows the
existence of more than one page size. By using large pages, where a larger block of
contiguous physical memory is mapped to a single page, the size of the page tables can
be reduced. Such large pages are also termed as super pages or big pages.
2.1.2 Address Translation in x86 with Page Address Extension Enabled
Since x86 is the most popular virtualized architecture, the details of the address
translation process on x86 are warranted a close examination. Specifically, since the
system simulated in this work uses PAE addressing mode and most virtualization
solutions on 32-bit x86 use PAE addressing mode, the address translation in PAE mode
is described in detail in this section.
32-bit x86 has several different modes of paging, one of which is Physical Address
Extension (PAE) virtual addressing mode. With a 32 bit physical address, the maximum
addressable physical space is 4GB (232 bytes). Page Address Extension is feature of
the x86 architecture that allows access to more than 4 GB of RAM, if the operating
24
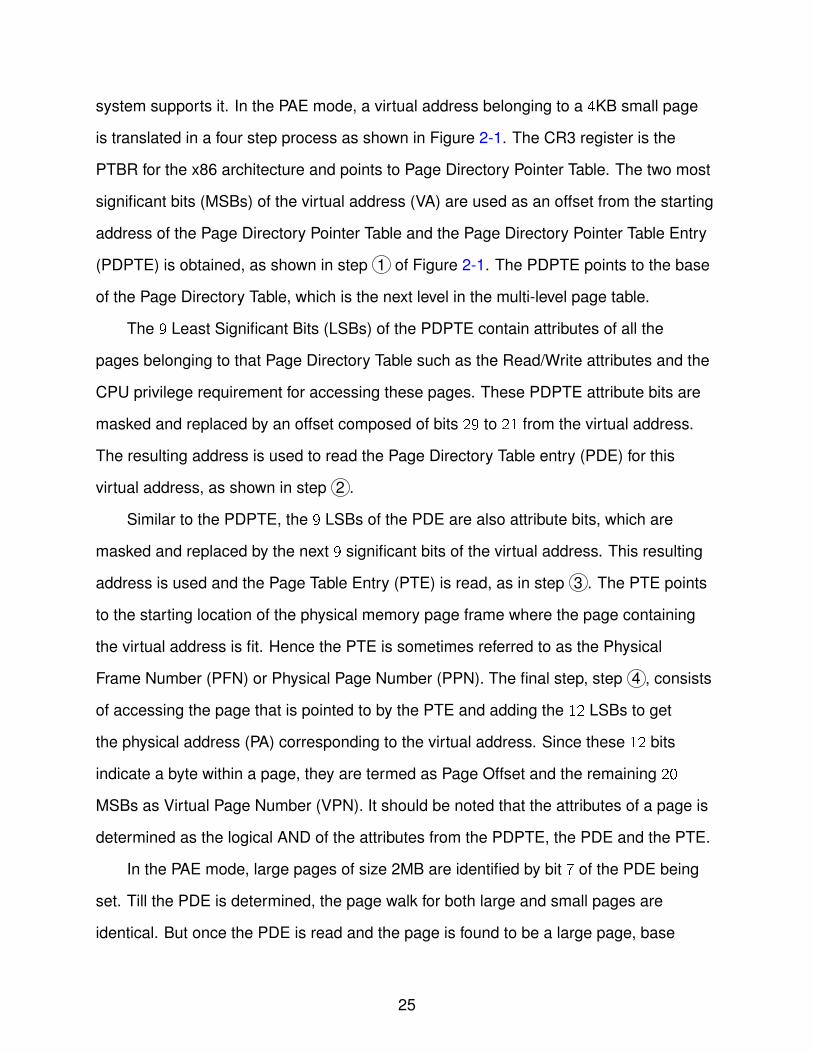
system supports it. In the PAE mode, a virtual address belonging to a 4KB small page
is translated in a four step process as shown in Figure 2-1. The CR3 register is the
PTBR for the x86 architecture and points to Page Directory Pointer Table. The two most
significant bits (MSBs) of the virtual address (VA) are used as an offset from the starting
address of the Page Directory Pointer Table and the Page Directory Pointer Table Entry
(PDPTE) is obtained, as shown in step ..1 of Figure 2-1. The PDPTE points to the base
of the Page Directory Table, which is the next level in the multi-level page table.
The 9 Least Significant Bits (LSBs) of the PDPTE contain attributes of all the
pages belonging to that Page Directory Table such as the Read/Write attributes and the
CPU privilege requirement for accessing these pages. These PDPTE attribute bits are
masked and replaced by an offset composed of bits 29 to 21 from the virtual address.
The resulting address is used to read the Page Directory Table entry (PDE) for this
virtual address, as shown in step ..2 .
Similar to the PDPTE, the 9 LSBs of the PDE are also attribute bits, which are
masked and replaced by the next 9 significant bits of the virtual address. This resulting
address is used and the Page Table Entry (PTE) is read, as in step ..3 . The PTE points
to the starting location of the physical memory page frame where the page containing
the virtual address is fit. Hence the PTE is sometimes referred to as the Physical
Frame Number (PFN) or Physical Page Number (PPN). The final step, step ..4 , consists
of accessing the page that is pointed to by the PTE and adding the 12 LSBs to get
the physical address (PA) corresponding to the virtual address. Since these 12 bits
indicate a byte within a page, they are termed as Page Offset and the remaining 20
MSBs as Virtual Page Number (VPN). It should be noted that the attributes of a page is
determined as the logical AND of the attributes from the PDPTE, the PDE and the PTE.
In the PAE mode, large pages of size 2MB are identified by bit 7 of the PDE being
set. Till the PDE is determined, the page walk for both large and small pages are
identical. But once the PDE is read and the page is found to be a large page, base
25

CR3
Page
Directory
Pointer
Table
Page
Directory
Page
Table
Page
PTEPDE
PDPTE
2 9 9 12
32
2 9 9 12
36 36 36
32 bit Virtual Address
36 bit Physical Address
DATA
1
23
4
Figure 2-1. Page walk for a 4KB page with PAE enabled
address of the large page, and not the PTE, is determined by using PDE. Then, the
remaining 21 bits of the virtual address are used as an index to the large page to access
the physical address corresponding to the virtual address.
2.2 Translation Lookaside Buffer
To speed up the page walk process, a small associative cache called the Translation
Lookaside Buffer (TLB) is used for caching the translations for the recently accessed
pages. The structure of a typical TLB is shown in Figure 2-2. Every entry in the TLB
contains three fields:
• The Virtual Page Number (VPN).
• The Physical Page Number (PPN) corresponding to the VPN.
• The attributes of the page indicating the write permissions for the page (R/W), theCPU mode required to access the page (S/U), the cacheability of the page and thetype of physical memory (MTRR, PAT) as well as the accessed and dirty state forthe page table entries corresponding to this translation.
26

Whenever an address translation is required, the TLB is first looked up to check if the
translation is cached, as shown in Figure 2-2. If the lookup hits in the TLB, the page
offset from the virtual address is used along with the PPN from the TLB entry to get the
physical address without having to go through the entire page walk. On a TLB miss,
however, the page tables are walked and the address translation is obtained. Depending
on the replacement policy, a victim is evicted from the TLB and that slot is populated
with the VPN, PPN and attributes obtained from the page walk.
VPN PPN
VIRTUAL ADDRESS
MEMORY
HIT
VPN PAGE OFFSET
Figure 2-2. Translation Lookaside Buffer for caching the recently used virtual to physicaladdress translations.
TLBs can be broadly classified into Software-Managed TLBs or Architected TLBs,
such as in SPARC and ALPHA [26, 27] and Hardware-Managed TLBs, such as in
x86 [28], depending on the behavior on a TLB miss. In software managed TLBs,
the TLB raises a fault on a TLB miss which is handled in a fashion similar to any
general interrupt. The pipeline gets flushed [29] and the page walk is performed by
the O/S. Once the page walk is completed, the TLB is populated and then the pipeline
is restarted. The advantage of the software managed TLB is that the O/S may use
intelligent schemes to populate the TLB and redefine the organization of the page table
to suit the new schemes. However, the time taken for the page walk is significantly
higher than in hardware-managed TLBs and the page walk process may pollute the
instruction cache.
27
In hardware-managed TLBs, the structure of the page table and the format of the
page table entries are defined by the ISA and are fixed. When a TLB miss occurs, a
hardware state machine walks the page tables, determines the translation and populates
the TLB. This mechanism is much faster than a software managed TLB [30], since the
page walk happens entirely in hardware. Moreover, it does not stall the pipeline and
instructions which are not dependent on this particular translation can be executed out
of order [31]. The disadvantage of hardware-managed TLBs is during a context switch.
When there is a context switch from one process to another, the hardware-managed
TLB gets flushed to avoid using the TLB entries of the first process for the second
process. In software managed TLBs, however, most operating systems tag the contents
of the TLB with some ID which relates the entries to the process to which they belong
and thereby avoid flushing the TLB on context switches. Thus, with hardware-managed
TLBs, every process which is switched into context experiences a large number of TLB
misses until the required entries are brought back into the TLB.
2.3 Virtual Memory in Virtualized Systems
As seen in the previous section, a non-virtualized system has two levels of memory:
the physical memory and the virtual memory which is an abstraction of the physical
memory and which gets exposed as a unique address space to every process. With
platform virtualization, the virtual memory is abstracted by the VMM and is presented as
physical memory to the VM. This memory is further virtualized by the guest O/S running
on the VM. To avoid ambiguity, this level of memory is referred to as ”real memory”.
The three different levels of memories in a virtualized platform are clearly indicated in
Figure 2-3.
In the three-level memory architecture of a virtualized platform, the page tables
maintained by the guest O/S contain translations between virtual memory and real
memory. Similarly, the page tables maintained by the VMM contain the mapping
between real memory and physical memory. It is this abstraction of the physical
28

PHYSICAL PLATFORM
VMM
VM VM
VIRT
CPUREAL
MEMORY
VIRT
I/O
GUEST OS GUEST OS
APPLICATION
VIRTUAL
MEMORY
APPLICATION
VIRTUAL
MEMORY
APPLICATION
PHYSICAL
CPU
PHYSICAL
MEMORY
GUEST
PAGE
TABLES
SHADOW
PAGE
TABLES
PHYSICAL I/O
Figure 2-3. Memory virtualization in a virtualized platform
memory into real memory that achieves the goal of virtualizing memory at the VM-VMM
interface. Because of this three-level memory abstraction, the virtual address seen by an
application inside a VM has to be translated to the real memory domain using the page
tables of the VM. Then, this real address has to be translated by the VMM to physical
memory and the required data should be accessed. However, while maintaining two
sets of page tables is conceptually simple, it is rarely used due to the cost involved in
maintaining two sets of page tables. Rather, this is handled in one of the following three
ways.
2.3.1 Full-System Virtualization and Shadow Page Tables
Full-system virtualization solutions such as VMware uses the concept of shadow
page tables [32]. The VMM maintains a set of shadow page tables (SPTs), one for every
process in every guest VM. These SPTs are invisible to the guest O/S and map the
virtual memory pages directly to physical memory. By using the SPTs, one set of page
walks can be eliminated, thereby making the address translation process faster.
29
To achieve this, the Page Table Base Register (PTBR) is virtualized. When starting
a guest, the VMM populates the physical PTBR with the location of the shadow page
tables and the virtual PTBR with the real memory location of the guest O/S’s page
tables. Whenever the guest attempts to read or write the PTBR, the instruction traps to
the VMM. If this a write attempt, which may be caused by a context switch inside the
guest, the virtual PTBR is updated with the real memory address pointing the page
tables of the new process. The physical PTBR is then updated by the VMM to point to
the physical memory location which contains the shadow page table of the new process
of the guest VM. If the attempt is a read attempt, the VMM returns the virtual PTBR
value to the guest O/S.
While the SPT effectively eliminates one level of memory indirection, it introduces
the need to maintain consistency between SPTs and guest page tables. For instance,
if a certain virtual page is not mapped to the real memory according to the guest page
tables, then the shadow page tables for that process should not contain a mapping. This
is needed in order to ensure that the occurrence of page faults is consistent, irrespective
of whether the application is running in a guest O/S or on a non-virtualized platform.
Thus, page table management becomes a source of virtualization overhead.
2.3.2 Paravirtualization and Page Tables
In a traditional VMM, the virtualized abstraction that is exposed as VM is identical
to the underlying physical machine [33, 34]. Hence, operating systems need not be
modified to run in a guest VM. However, the cost of maintaining this abstraction of
identical hardware is high.
Xen [35] takes the approach of presenting the guest with a similar but nonidentical
abstraction of the real hardware using a technique called paravirtualization. Due to
the differences between real and virtual hardware, the O/S has to be patched to run in
the paravirtualized VM (which are referred to as domain or dom in Xen terminology).
30

However, only the O/S requires patching and unmodified binaries can still be run on this
patched O/S inside the doms.
Xen handles memory virtualization by allowing guests to directly view the physical
memory and thereby eliminating the intermediate real memory [35]. The configuration
file for a user domain (domU) includes a request for a certain amount of memory. If
sufficient physical memory is available, Xen allocates the requested amount of physical
memory and reserves it for domU. Such a reservation allows the guests to directly
view their allocated physical memory and imposes strong isolation from other domains.
Whenever a modified guest O/S needs memory, it allocates a page from its reserved
pool of physical memory and registers this allocation with the Xen hypervisor.
The page tables for the processes, which are maintained by the guest, are made
unwritable by the guest. Whenever the guest O/S desires to update the page table, it
does so by issuing a hypercall. Xen verifies that the write request from the guest O/S
is valid and makes the requested changes in the page tables. To improve performance,
multiple such hypercalls may be batched and issued by the guest O/S to avoid frequent
switching between the VM and the hypervisor.
Eliminating the real memory removes the need to maintain shadow page tables.
However, this poses a conflict with the contiguous physical address space model that is
assumed by most guest O/S. Xen handles this by provides a pseudo-physical memory,
which may be thought of as an analog to real memory, and by rewriting the parts of the
guest O/S which depend on physical memory contiguity to use this pseudo-physical
memory.
2.3.3 Hardware Virtualization and Two-Level Page Tables
While Xen avoids the overhead of shadow page table management, which may
be as high as 75% of the total execution time of an application [36], it still does not
completely eliminate the memory virtualization overheads. The need for the hypervisor
during page table updates and for providing pseudo-physical memory are two instances
31
of virtualization overhead in Xen. To avoid these overheads associated with software
methods of virtualizing the memory, both Intel [37] and AMD [36] have developed
hardware solutions by extending the MMU of the x86-64 and amd-64 architectures
respectively. These solutions, involving two levels of page tables, are known as Nested
Page Tables (NPT) and Extended Page Tables (EPT) by AMD and Intel respectively.
NPTs and EPTs provide two levels of page tables. The first level of page tables,
called guest page tables (GPTs) are similar to regular page tables and are used to map
virtual addresses to real addresses. The second level of page tables, called Host page
tables, are maintained by the hypervisor and contain the mappings between real and
physical address spaces and are managed by the VMM. Both the guest and the VMM
have their own copies of the PTBR (CR3). The guest CR3 points to the start of the guest
page tables and the host CR3 points to the base of the EPT/NPT.
When a virtual address has to be translated to physical address, a two-dimensional
page walk takes place. The guest CR3, along with the MSBs of the virtual address,
indicate the address of the first-level page table entry in real memory. This address is
translated to the physical memory domain by walking the host page tables using the
host CR3. The translated physical address is used to read the first-level page table
entry of the guest page tables, which is then translated from real to physical memory.
By repeating this process, the physical address corresponding to the linear address is
obtained.
By allowing the guests to manage their page tables, the need for trapping MMU
related instructions is avoided. This reduces the overhead of memory virtualization.
It should be noted that, even with nested page tables, the TLB still caches virtual to
physical address translations rather than virtual to real address translations. Moreover,
the cost of a TLB miss increases significantly compared to non-nested page tables when
NPTs/EPTs are used, further increasing the need to reduce the TLB misses.
32
2.4 Summary
The background information about memory virtualization in non-virtualized and
virtualized systems presented in this chapter clearly demonstrate the complexities of
virtualizing memory. In addition to this complexity, many of the strategies that have been
used to reduce the latency of page table management, such as using EPT/NPT, as well
as the switches between the VM and the VMM necessitated by page table management
operations, have implications on the behavior of the Translation Lookaside Buffer. These
implications, the performance delay caused by the TLB and avoiding this performance
delay forms the focus of the remainder of this dissertation.
33
CHAPTER 3A SIMULATION FRAMEWORK FOR THE ANALYSIS OF TLB PERFORMANCE
The growing use of virtualization for server consolidation on CMP platforms [5,
24, 38] has emerged as a new paradigm in the high-end server computing industry.
However, one issue with such virtualization-based resource consolidation is the
performance degradation of virtualized workloads. In fact, improving the performance of
virtualized workloads to near-native levels has been the focus of much research [6, 39–
45]. The x86 architecture, which is one of the most popular virtualized platforms [15],
has also been modified with hardware virtualization extensions to improve the
performance of virtual machines. Starting with the VT extensions [46], there have
been many changes in this direction including Intel VT for Connectivity and Intel VT
Directed I/O [47]. Similar developments from AMD include the AMD-V virtualization
technology [36] and the Direct Connect Architecture [48].
As mentioned in Chapter 1, the TLB is critical in determining the performance of
virtualized workloads [14]. Hence, it is no surprise that the most recent virtualization
extensions to the x86 architecture have focussed on the TLB. Specifically, the TLB
architecture has been modified by the addition of tags as a part of the TLB entry and
by providing hardware primitives for rapid tag comparison [36, 37, 48]. Due to these
changes in the TLB architecture, there is a need for reexamining and understanding the
TLB behavior of workloads in virtualized settings in order to solve issues involving tag
generation and management. Furthermore, the optimum tagged TLB architecture, in
terms of size and associativity, should be explored.
One way of obtaining this understanding is by conducting a simulation-based study
wherein the effect of various architectural and workload related parameters on the TLB
performance can be explored. Moreover, using such a simulation-based approach
will facilitate understanding the impact of the TLB on the performance of virtualized
34

workloads and will allow the comparison of various TLB-related performance-enhancing
ideas.
3.1 Survey of Simulation Frameworks Used in TLB-Related Research
The Translation Lookaside Buffer has been the target of many research works.
TLB prefetching [49–51] has been explored to increase the TLB hit ratio. Chadha et
al. [52, 53] have used functional models with SoftSDV [54] simulator to study the TLB
behavior of I/O-intensive virtualized workloads. Tickoo et al. [18] have explored TLB
tagging in their qTLB approach. Ekman et al. [55] estimate the TLB to be responsible
for up to 40% of the power consumption in caches. Various circuit-level and architectural
techniques [16, 56–59] as well as compiler-level code transformation [60] have
been explored to reduce the TLB power consumption. However, these previous
studies involving the hardware-managed TLB (such as the x86 TLB) have used
SimpleScalar [61] or custom-built trace-driven simulators [62] and not TLB timing models
in a full-system environment, thereby ignoring the interaction of the workload with the
O/S/VMM. Even in cases where full-system simulation has been used, the TLB timing
has not been modeled [52, 53] or the x86 architecture has not been simulated [50, 51].
A possible reason why the studies involving hardware-managed TLBs on x86 have
not used timing-based metrics, or use simplified simulators which are not full-system
simulators and tend to ignore hypervisor effects, may be the lack of simulator support.
Commonly used x86 simulators are either not full-system simulators or do not model the
timing behavior of the TLB. Zesto [63], which supports cycle-accurate simulation for x86
and models the TLB cannot boot an O/S and does not support full-system simulation.
PTLSim/X [64] is a full-system simulator for x86 that can simulate an entire O/S and the
binaries running inside it, by running the O/S as a guest on top of a modified version
of Xen. However, it is not capable of simulating the hypervisor itself, which makes it
unsuitable for full-system studies on virtualized platforms. SimOS [65] supports the x86
architecture, but it does not support running a virtual machine monitor. M5 [66], while
35
providing full-system support and timing models, does not support x86 architecture.
Simics [67] is a full-system simulator that is capable of booting and running Xen and
multiple guest O/S, but requires extensions to support timing studies. GEMS [68]
provides one such timing framework, however it does not support the simulation of
the x86 ISA. FeS2 [69] is an accurate execution-driven timing model that includes a
cache hierarchy, branch predictors and a superscalar out-of-order core. It supports x86
and can be plugged into Simics. COTSon [70] is a similar timing simulator that can be
plugged into AMD SimNow [71]. But neither FeS2 nor COTSon provide timing models
for the TLB.
Thus, there is a clear need for a simulation framework for simulating the behavior of
hardware-managed TLBs on virtualized platforms that meets the following requirements:
• The framework should support configurable TLB functional and timing models.Since recent hardware-managed TLBs incorporate tags as apart of the TLB entry,the functional TLB model should support the simulation of tagged TLB functionalityas well.
• As x86 is the most common virtualized platform, the simulator should support thesimulation of x86 ISA. It is also desirable that the framework simulates the x86 ISAat the micro-operations (µops) granularity.
• To capture the interaction between the hardware, the VMM, the VM and theapplication, it is imperative that the simulator be a full-system execution-drivenframework.
Developing such a simulation framework forms the focus of this chapter.
3.2 Developing the Simulation Framework
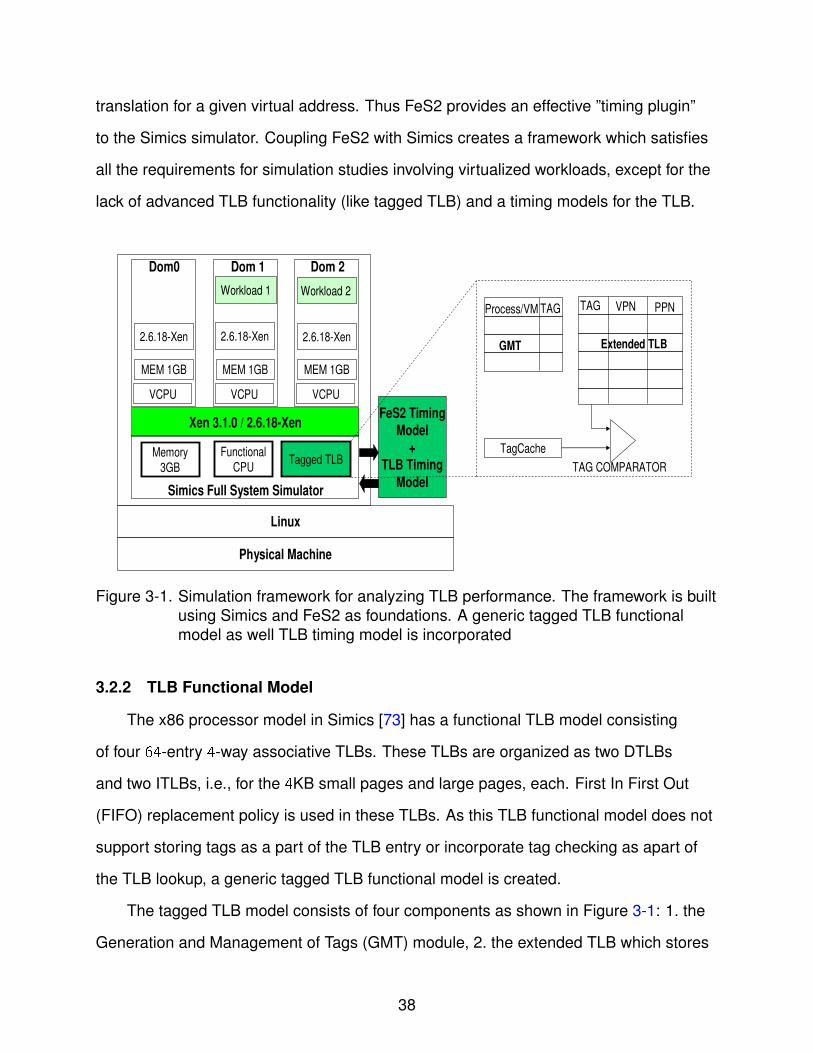
The full-system simulation framework developed for analyzing the TLB behavior
on virtualized platforms uses Simics [67] and FeS2 [72] as foundations. The basic
functional TLB model in Simics is replaced with a generic tagged TLB model. TLB
timing models are also developed and incorporated into the timing flow of FeS2. These
components of the simulation framework are described in this section.
36

3.2.1 Using Simics and FeS2 as Foundation
The simulation framework, shown in Figure 3-1, consists of Virtutech Simics [67]
(version 3.0.1), a full-system simulation platform capable of simulating high-end
target systems with sufficient fidelity and speed to boot and run operating systems
and workloads. Simics uses a functional CPU model with atomic and sequential
execution of instructions, wherein the execution of every instruction takes exactly one
cycle. The processor model is non-pipelined and only x86 CPUs without hardware
virtualization support are modeled. Simics also provides a rich set of microarchitectural
components including the cache and TLB which can be incorporated with the CPU. In
such simulations, the execution time for an instruction is increased by any stalls that may
be caused by the memory subsystem for that instruction, but the execution model is still
sequential. Moreover, only the caches and the memory can stall an instruction and the
hit and miss latencies associated with the TLB are ignored.
Simics also provides the capability to install callback functions and associate these
with the occurrence of specific events such as TLB misses and context switches. While
Simics provides a microarchitectural interface (MAI) timing model, which emulates a
pipeline and out of order execution, it does not simulate at the granularity of x86 micro
operations (µops).
To support timing-based analysis, a timing model based on the FeS2 [69] simulator
is used. FeS2 works on a timing-first methodology, where the functional correctness is
provided by Simics and the timing information by FeS2. An x86 instruction is fetched,
decoded in µops, using the decoder from PTLSim [64], which are then executed and
retired. During the retirement phase, the corresponding x86 instruction is allowed to
execute in Simics. Then, the state of the system maintained by FeS2 is compared to the
functionally-correct state maintained by Simics. In case of these states not matching up,
the FeS2 pipeline is flushed and restarted at the next instruction. FeS2 relies on Simics
to supply the functional data such as the contents at a given memory location and the
37
translation for a given virtual address. Thus FeS2 provides an effective ”timing plugin”
to the Simics simulator. Coupling FeS2 with Simics creates a framework which satisfies
all the requirements for simulation studies involving virtualized workloads, except for the
lack of advanced TLB functionality (like tagged TLB) and a timing models for the TLB.
Xen 3.1.0 / 2.6.18-Xen
Physical Machine
Linux
Simics Full System Simulator
Memory3GB
FunctionalCPU
FeS2 Timing
Model
+
TLB Timing
Model
Dom 2
MEM 1GB
2.6.18-Xen
Workload 2
VCPU
Dom 1
Workload 1
MEM 1GB
2.6.18-Xen
VCPU
Dom0
MEM 1GB
2.6.18-Xen
VCPU
Tagged TLB
TAGProcess/VM
GMT
TAG
Extended TLB
VPN PPN
TagCache
TAG COMPARATOR
Figure 3-1. Simulation framework for analyzing TLB performance. The framework is builtusing Simics and FeS2 as foundations. A generic tagged TLB functionalmodel as well TLB timing model is incorporated
3.2.2 TLB Functional Model
The x86 processor model in Simics [73] has a functional TLB model consisting
of four 64-entry 4-way associative TLBs. These TLBs are organized as two DTLBs
and two ITLBs, i.e., for the 4KB small pages and large pages, each. First In First Out
(FIFO) replacement policy is used in these TLBs. As this TLB functional model does not
support storing tags as a part of the TLB entry or incorporate tag checking as apart of
the TLB lookup, a generic tagged TLB functional model is created.
The tagged TLB model consists of four components as shown in Figure 3-1: 1. the
Generation and Management of Tags (GMT) module, 2. the extended TLB which stores
38
a tag as a part of every entry, 3. the TagCache which stores the current tag and 4. a
tag comparator for comparing the tags during TLB lookup. Depending on details of the
specific tagged TLB solution being modeled one or more of these components may not
be needed. For instance, when modeling a tagged TLB solution where the assignment
of tags is done by the system software, the GMT need not be simulated. However,
creating models for all these components makes this tagged TLB model flexible enough
to simulate any tagging solution.
To add the tagging functionality, the GMT, TagCache and comparator are added
as model extensions to Simics, similar to the AntFarm extension by Jones [74]. The
GMT is implemented in such a manner that it is capable of examining the state of
the CPU of which it is a part. The Simics TLB model is extended by adding tags as a
part of the data structure for every entry. In addition to the FIFO replacement policy,
an LRU replacement policy with the timestamps based on the Simics clock is added.
The TagCache is modeled as a register which is wide enough to cache one entry of
the GMT. The comparator functionality is implemented by looking up the current tag
from the TagCache and using this a part of the TLB lookup logic. APIs to facilitate
communication between the GMT and the TLB are also implemented. Every time a TLB
flush is triggered by writing a new value to the CR3 register, the extended TLB module
communicates this new value to the GMT module using these APIs. The GMT makes
the appropriate changes and updates the TagCache. The GMT then, depending on the
functionality being simulated, indicates if the TLB flush can be avoided or not. If the TLB
flush cannot be avoided, the extended TLB’s contents are flushed.
3.2.3 Validation of the TLB Functional Model
The validation of the TLB functional model consists of verifying that the TLB is
functionally correct when the tags are used to avoid TLB flushes. Any error in the
functionality will result in retaining stale entries which are inconsistent with the page
tables. Hence, verifying the consistency of the TLB entries serves to validate the
39

tagged TLB implementation. For this, a Functional Check mode is implemented. In
this mode, whenever there is a hit in the tagged TLB, a page walk is performed to
get the translation TransPW consisting of the physical address corresponding to the
linear address and all the page attributes such as the read/write bit, the global bit, the
page mode bit, the PAT and the MTRR bits. This translation is then compared to the
translation TransTLB present in the tagged TLB. If these translations do not match, an
inconsistency is declared. It should be noted that Functional Check mode severely slows
down the speed of simulation and is used only for validation of the TLB functional model.
3.2.4 TLB Timing Model
FUNCTIONAL
SIMULATOR
FunctionalMemory
FunctionalCPU
FunctionalITLB
FunctionalDTLB
Fetc
hA
nd
Deco
de
Ren
am
e
Ex
ecu
te
Co
mp
lete
Co
mm
it
Tim
ing
ITL
BM
od
el
Tim
ing
DT
LB
Mo
del
TIMING FLOW FUNCTIONAL DATA FLOW FOR TLB MODEL
TIMING
SIMULATOR
TaggingFramework
(GMT, TagCache)
1
1 2 3 4
4 A D FUNCTIONAL DATA FLOW FOR FeS2
E
A
B
C
D
E
Figure 3-2. Timing flow in the simulation framework. FeS2 plugging into Simics and theTLB timing models plugging into FeS2 are shown. The flow of timing duringa TLB lookup is illustrated.
FeS2 does not implement either the instruction or the data TLB. Whenever an
address translation is needed, FeS2 queries Simics using a Simics-provided API. This
API returns the translation irrespective of whether it is present in the Simics functional
TLB or not. If the functional TLB does not contain the needed translation, Simics walks
40

the page table, computes the translation, populates the TLB and returns the translation,
completely transparent to FeS2. Moreover, the details of any cache misses caused by
the page walk are also not communicated to FeS2 by this API. Thus, FeS2 is unable
to account for different execution times for a µop depending on whether the lookup it
triggered hit or missed in the TLB and, in case of miss, whether there were any cache
misses.
This behavior of FeS2 is modified by implementing timing models for ITLB and
DTLB and integrating them into FeS2 as shown in Figure 3-2. After the addition of
these models, the fetch-and-decode stage queries the timing model, instead of using
Simics API, whenever an address translation is needed. This path is shown by the arrow
labeled ..1 in the Figure 3-2. The timing model queries the functional TLB model as
shown by arrow ..A . If the translation is not present in the functional TLB, the timing
model reads the CR3 value and calculates the first address to be looked up in the page
walk process. It then inserts a lookup for this address in the cache hierarchy maintained
by FeS2. Once this lookup returns, the actual value stored at this address is obtained
from the Simics functional memory, as shown by arrow ..B , and used to calculate
the next address in the page walk process. This process is repeated until the entire
translation is computed. Once computed, the functional TLB is populated using this
translation as shown in Figure 3-2 by arrow ..A . If the functional model is simulating a
tagged TLB, the populated entry is tagged with the corresponding tag and timestamped.
Then, the instruction which has been stalled during this process is released as shown by
arrow ..2 .
Similarly the DTLB timing model is queried if an address translation is needed for
a Load or a Store instruction in the execute stage and returns after a certain latency
shown by arrows ..3 and ..4 respectively. The flow of the functional data between the
DTLB timing model and the functional TLB is shown by arrow ..C . In case of the lookup
missing in the DTLB and triggering a page walk, the data flow between the DTLB timing
41
model and the memory is shown by arrows ..D in Figure 3-2. After this lookup returns,
the execution of the µop which was stalled is allowed to continue.
The latency of a TLB lookup depends on whether the required information is found
in the functional TLB. If it is a miss, then the page walk latency (PW) determines time
for which the corresponding instruction or µop is stalled. This page walk latency (also
referred to in this dissertation as TLB Miss Penalty) is the minimum number of stall
cycles experienced by a µop due to a TLB miss whose page walk does not miss in
the L1 cache. If there are any cache misses in the page walk, the µop will be stalled
for the latency of those misses in addition to this page walk latency. Thus, a proper
choice of the page walk latency is important. To determine these values for the TLB, the
RightMark Memory Analyzer (RMMA) [75] is utilized. RMMA allows the estimation of
vital low level system characteristics including the latency and bandwidth of the RAM,
the average and minimal latencies along with the size and associativity of different levels
of cache and the TLB. The RMMA test suite is run on a 64 bit Intel Core2 Duo CPU
running 32 bit Windows XP. From the results of this experiment, a default page walk
latency of 60 cycles is chosen.
3.2.5 Validating the TLB Timing Model
As described in Section 3.2.1, this simulation framework is built on top of well
documented and established simulators i.e. Simics and FeS2. Hence the validation
process is confined to the TLB timing model that has been developed in this work.
Validation of the timing part of the simulation framework consists of ensuring that
the behavior of the TLB timing model is as expected. For this validation, a simplified
pipeline, with the width of every stage set to one, is considered. This ensures that a
stall in one particular µop will stall the entire pipeline and no out-of order execution is
possible. It should be noted that this simplification is only for the validation process
and an un-simplified pipeline with out-of-order execution capability is used for the
experiments discussed in the remainder of this dissertation. The size of the L1 and the
42

Table 3-1. Pseudocode of the micro benchmark for TLB timing model validation
/*
* Pseudocode of the micro benchmark with well defined TLB behavior
*/
int main ()
/* Step 1 */
allocate_contiguous_pages(64);
/* Step 2 - Warmup */
touch_first_pages(64);
/* Step 3 - TLB Miss Producing Section */
/* The number of misses produced by Step 3 is a function of the
* TLB size and the number of pages being touched T.
*/
touch_first_pages(T);
return 0;
L2 caches are set to large values of 2 MB, thereby ensuring that the page tables are
cached and the stalls due to page walk related cache misses are minimized. Thus, in
this simplified scenario, the primary cause of memory subsystem stalls are the TLB
misses and the ensuing page walks.
Then, a micro-benchmark with a well defined TLB behavior, for which the number of
TLB misses for a given TLB size is predictable, is created. This pseudo-code is shown
in the listing in Table 3-1. The micro-benchmark consists of three steps. In the first step,
a contiguous block of N pages, each of size 4KB, is allocated. In step 2, the first byte of
each of these N pages are accessed to warm up the TLB and cache with the necessary
page tables entries. Then, in step 3, the first T of these N pages are accessed and
some value is written into these pages.
If the TLB is large enough to hold all the N translations (along with the required
O/S/VMM translations) which were looked up in step 2, then step 3 will not cause any
43
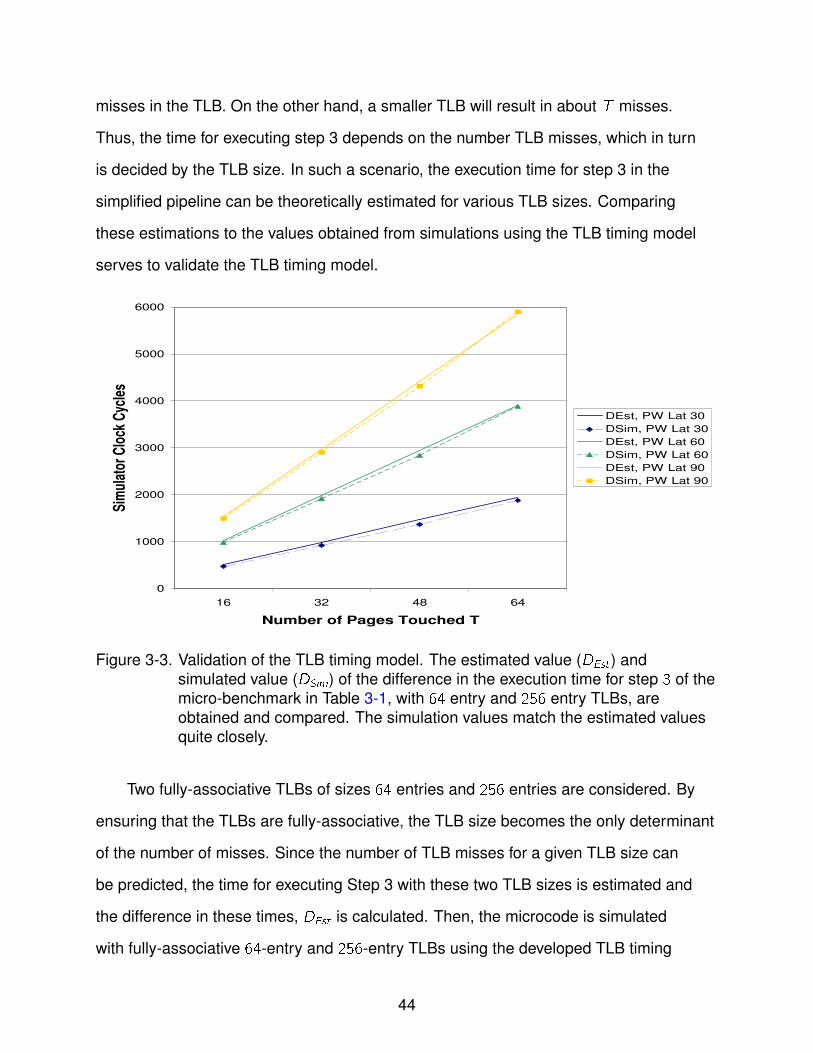
misses in the TLB. On the other hand, a smaller TLB will result in about T misses.
Thus, the time for executing step 3 depends on the number TLB misses, which in turn
is decided by the TLB size. In such a scenario, the execution time for step 3 in the
simplified pipeline can be theoretically estimated for various TLB sizes. Comparing
these estimations to the values obtained from simulations using the TLB timing model
serves to validate the TLB timing model.
0
1000
2000
3000
4000
5000
6000
16 32 48 64
Number of Pages Touched T
Sim
ulat
or C
lock
Cyc
les
DEst, PW Lat 30
DSim, PW Lat 30
DEst, PW Lat 60
DSim, PW Lat 60
DEst, PW Lat 90
DSim, PW Lat 90
Figure 3-3. Validation of the TLB timing model. The estimated value (DEst) andsimulated value (DSim) of the difference in the execution time for step 3 of themicro-benchmark in Table 3-1, with 64 entry and 256 entry TLBs, areobtained and compared. The simulation values match the estimated valuesquite closely.
Two fully-associative TLBs of sizes 64 entries and 256 entries are considered. By
ensuring that the TLBs are fully-associative, the TLB size becomes the only determinant
of the number of misses. Since the number of TLB misses for a given TLB size can
be predicted, the time for executing Step 3 with these two TLB sizes is estimated and
the difference in these times, DEst is calculated. Then, the microcode is simulated
with fully-associative 64-entry and 256-entry TLBs using the developed TLB timing
44
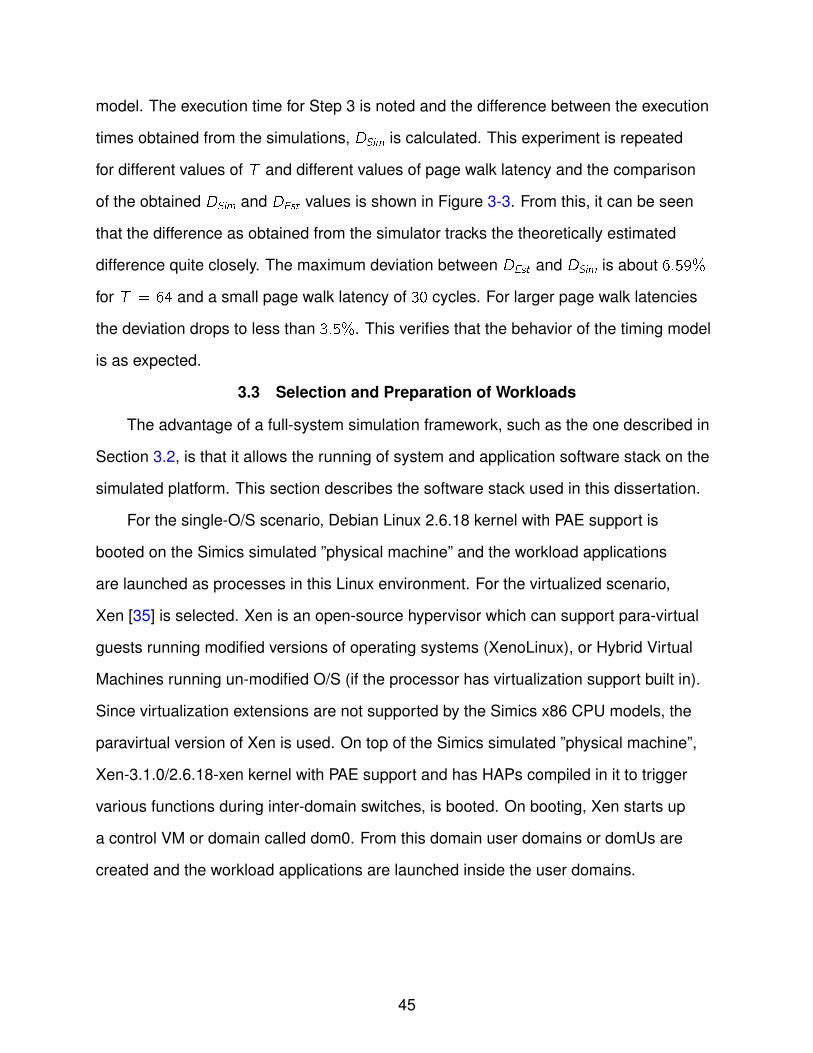
model. The execution time for Step 3 is noted and the difference between the execution
times obtained from the simulations, DSim is calculated. This experiment is repeated
for different values of T and different values of page walk latency and the comparison
of the obtained DSim and DEst values is shown in Figure 3-3. From this, it can be seen
that the difference as obtained from the simulator tracks the theoretically estimated
difference quite closely. The maximum deviation between DEst and DSim is about 6.59%
for T = 64 and a small page walk latency of 30 cycles. For larger page walk latencies
the deviation drops to less than 3.5%. This verifies that the behavior of the timing model
is as expected.
3.3 Selection and Preparation of Workloads
The advantage of a full-system simulation framework, such as the one described in
Section 3.2, is that it allows the running of system and application software stack on the
simulated platform. This section describes the software stack used in this dissertation.
For the single-O/S scenario, Debian Linux 2.6.18 kernel with PAE support is
booted on the Simics simulated ”physical machine” and the workload applications
are launched as processes in this Linux environment. For the virtualized scenario,
Xen [35] is selected. Xen is an open-source hypervisor which can support para-virtual
guests running modified versions of operating systems (XenoLinux), or Hybrid Virtual
Machines running un-modified O/S (if the processor has virtualization support built in).
Since virtualization extensions are not supported by the Simics x86 CPU models, the
paravirtual version of Xen is used. On top of the Simics simulated ”physical machine”,
Xen-3.1.0/2.6.18-xen kernel with PAE support and has HAPs compiled in it to trigger
various functions during inter-domain switches, is booted. On booting, Xen starts up
a control VM or domain called dom0. From this domain user domains or domUs are
created and the workload applications are launched inside the user domains.
45

3.3.1 Workload Applications
One common workload which is used to benchmark virtualized platforms is
VMMark [76]. Here, common server applications including Outlook Mail server, Apache
webserver, Oracle database server, SPECjbb and dbench are put together to form
a consolidated workload. Due to licensing issues in using VMMark, a similar suite of
applications is created in order to have varied workloads. The applications included in
this suite are:
• TPCC-UVa [77], an open source implementation of the TPC-C benchmarkstandard, which represents typical database transaction processing serverworkloads. It uses the PostgreSQL database system and a simple transactionmonitor to measure the performance of systems and forks off one client processper warehouse. In all the simulations in this dissertation, the number of warehousesis set to 4.
• dbench[78], a disk I/O-intensive file server. Similar to TPCC-UVa, dbench is anI/O-intensive workload. However, the I/O component in dbench is much more thanTPCC-UVa.
• SPECjbb 2005 [79], another OLTP class workload. SPECjbb differs fromTPCC-UVa as it emulates only the server side of an OLTP system [79], whereasTPCC-UVa emulates both client and server operations. Moreover, SPECjbb2005has a significantly large memory requirement [80, 81] as its entire database is heldin memory, whereas TPCC-UVa stores its database on disk and accesses it asneeded. In all the simulations conducted in this research, the heap size of the JVMin which SPECjbb is set at 256MB.
• Vortex [82, 83], a database manipulation workload from the SPEC CPU 2000 suiteof benchmark. This workload, similar to SPECjbb, also uses significant amount ofmemory.
3.3.2 Consolidated Workloads
Consolidated workloads consist of multiple applications constituting the effective
workload. Consolidated workloads are created by running every application as
different processes in Linux. To generate such consolidated workloads on Xen,
the first application is run on its domain and paused using the Xen management
tools [84], when the point of interest is reached. The point of interest is the phase
46

where the warmup phase, like reading the database into memory for typical database
transaction processing workloads, is completed and the long-running service phase
begins execution. By repeating this process for all the applications, multiple virtual
machines with the applications running inside them are brought up. All the paused
VMs are then resumed at the same time, ensuring that all applications contribute and
influence the behavior of the consolidated workload.
3.3.3 Multiprocessor Workloads
Both uniprocessor and multiprocessor simulations may be performed using the
developed simulation framework. In multiprocessor scenarios, Xen allows pinning [84] of
virtual CPUs (VCPUs) to physical CPUs. Pinning is a concept wherein a certain VCPU
is associated with one or more physical CPUs. This restricts the scheduling of the VCPU
to one of the physical CPUs to which it is pinned. By an intelligent use of the pinning
mechanism, long running domains can be given their own CPUs to ensure uninterrupted
performance.
The terminology used in this dissertation to describe pinned configurations is
illustrated considering an example setup with the simulated ”physical” machine having
two x86 CPUs is considered. Xen is booted on this machine and dom0 is started with
two VCPUs. In addition to dom0, two virtual machines with one VCPU each, dom1 and
dom2, are created. The workload running on both the user domains is TPCC-UVa. This
configuration is termed as ”TPCC-TPCC-nopin” as no domain is explicitly pinned to any
CPU.
Then, using the pining commands of Xen, the dom0 VCPUs are restricted to run
only on ”physical” CPU0 and the VCPUs of dom1 and dom2 are bound to ”physical”
CPU1. Since, only dom0 can be scheduled on CPU0 and only dom1 and dom2 can be
scheduled on CPU1, this pinning configuration is termed as ”TPCC-TPCC-0012”. In the
case of uniprocessor simulations, pinning makes no difference as there is only one CPU
47
on which all the VCPUs are scheduled. Hence the nopin/pin annotation is ignored for
single processor scenarios.
3.3.4 Checkpointing Workloads
A typical usage model for low-throughput high-fidelity simulators is checkpointing. In
such cases, the simulation is run till a certain point in a mode where the simulation
throughput is quite high. Invariably, the data obtained during this phase is small
and is ignored. Once the point of interest has been reached, the simulation state is
checkpointed. Then the simulation is restarted in a low throughput mode where the
fidelity of simulation and the quality of data obtained is high. Such a usage scenario is
possible using this developed framework. Simics [67] supports checkpointing where
the entire state of the system, including memory and I/O subsystems in the form of
compressed files. These files can be copied from one machine to another and used
without any loss of data. Using this method, checkpoints of the single and multi-domain
workloads are prepared. A screenshot of a simulated machine running 6 domains
is shown in Figure 3-4. Further details of using these checkpoints for long running
parametric sweep type simulations in batch mode are discussed in Appendix B.
3.4 Evaluation of the Simulation Framework
One of the biggest disadvantages of a full-system simulation framework is that the
speed of simulation is much lower compared to trace-driven simulators. This is indeed
one reason why trace driven simulators are preferred when only one subsystem is under
consideration. In this section, the speed of the simulation framework with and without
timing models is examined. The speed of various simulation modes is characterized
by the throughput of the simulation framework calculated, as shown in Equation 3–1,
as the number of x86 instructions simulated using the framework in a given second
of wall clock time. The results from these investigations will help understand the time
requirements involved in simulation-based analysis and plan accordingly. Such an
understanding is important, when simulations are performed on shared resources
48

Figure 3-4. Screenshot of the simulation framework in use. The uniprocessor simulatedmachine has six user domains (domU) and one control domain (dom0). Fiveof the six user domains are paused, while dom1 is running TPCC-UVa
using schedulers such as Maui [85] and Torque [86], where the user has to provide the
anticipated time for the simulation to aid in scheduling the jobs properly.
Throughput =Simulated x86 instructions
Wall Clock Time(3–1)
To evaluate the speed of simulation when the TLB timing model is used, a 3GB
1-CPU x86 ”physical machine” is simulated using Simics. The TLB is configured to be
fully associative with a size of 1024 entries and page walk latency of 60 cycles. Xen is
booted on this ”physical machine” and TPCC-UVa, running on a domU, is simulated in
three different simulator configurations, 1. Just Simics without FeS2 or the timing TLB
model (Only Simics) 2. Simics with FeS2 plugged in, but without the TLB timing model
(Simics + FeS2) and 3. Simics with FeS2 and the TLB timing model (Simics + FeS2 +
TLB Timing Model). The length of the simulation is varied from 1 million to 1 billion x86
instructions. These simulations are run on an IBM system X tower server with two Intel
49
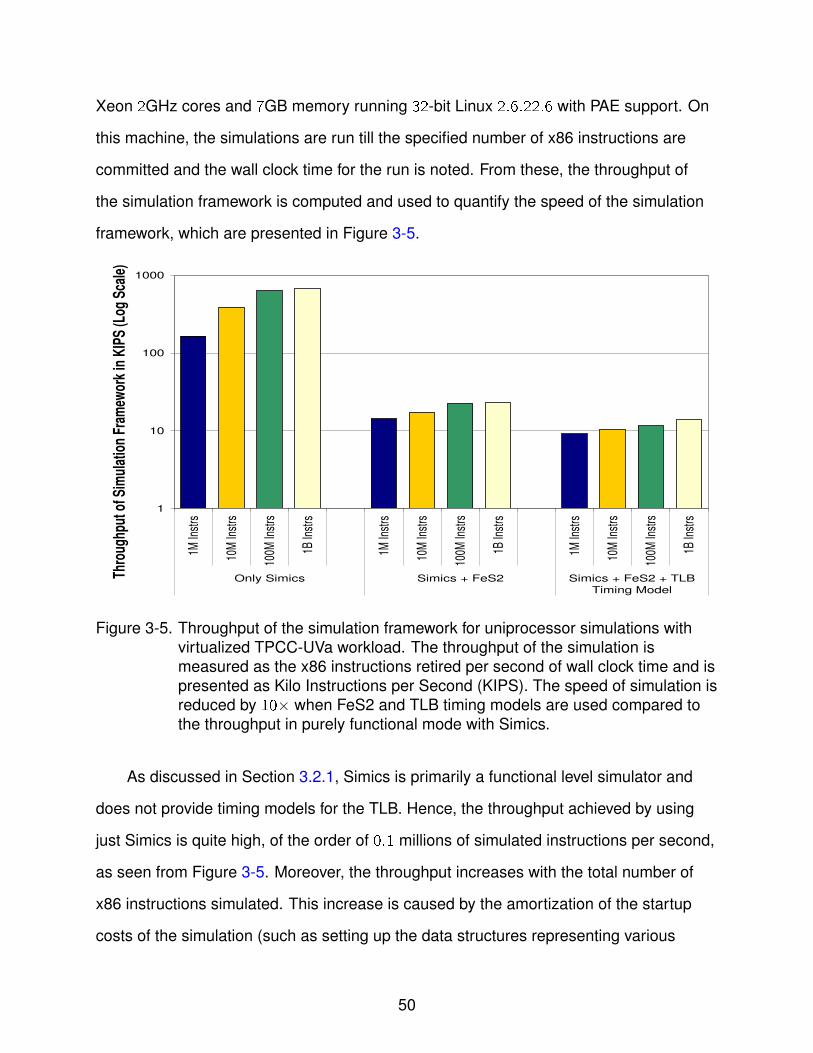
Xeon 2GHz cores and 7GB memory running 32-bit Linux 2.6.22.6 with PAE support. On
this machine, the simulations are run till the specified number of x86 instructions are
committed and the wall clock time for the run is noted. From these, the throughput of
the simulation framework is computed and used to quantify the speed of the simulation
framework, which are presented in Figure 3-5.
1
10
100
1000
1M In
strs
10M
Inst
rs
100M
Inst
rs
1B In
strs
1M In
strs
10M
Inst
rs
100M
Inst
rs
1B In
strs
1M In
strs
10M
Inst
rs
100M
Inst
rs
1B In
strs
Only Simics Simics + FeS2 Simics + FeS2 + TLB
Timing Model
Thro
ughp
ut o
f Sim
ulat
ion
Fram
ewor
k in
KIP
S (L
og S
cale
)
Figure 3-5. Throughput of the simulation framework for uniprocessor simulations withvirtualized TPCC-UVa workload. The throughput of the simulation ismeasured as the x86 instructions retired per second of wall clock time and ispresented as Kilo Instructions per Second (KIPS). The speed of simulation isreduced by 10× when FeS2 and TLB timing models are used compared tothe throughput in purely functional mode with Simics.
As discussed in Section 3.2.1, Simics is primarily a functional level simulator and
does not provide timing models for the TLB. Hence, the throughput achieved by using
just Simics is quite high, of the order of 0.1 millions of simulated instructions per second,
as seen from Figure 3-5. Moreover, the throughput increases with the total number of
x86 instructions simulated. This increase is caused by the amortization of the startup
costs of the simulation (such as setting up the data structures representing various
50

microarchitectural components), which do not contribute towards the throughput, over
the longer runs. For simulations involving 1 billion instructions and more, the throughput
achieved is close to 0.7 million instructions per second.
The slowdown in the throughput by using FeS2 is considerable, even when the TLB
timing model is not used (Simics + FeS2), as can be seen from Figure 3-5. Even for long
running simulations of 1 billion instructions, this slowdown is as much as 30 times and
the throughput achieved is only about 23000 x86 instructions per second. This slowdown
is further compounded when the TLB timing model is used and lowers the throughput to
about 12000 x86 instructions per second.
The throughput of the simulation framework for multiprocessors simulations, where
the simulated machine has more than one CPU, is also examined by simulating an
x86 machine with 3 GB of memory and two user domains running TPCC-UVa and
Vortex. The number of CPUs in this simulated machine is varied between 2 and 8.
For greater fidelity of simulation, Simics is set to simulate 1 x86 instruction on a CPU
before it switches to the next in round robin fashion. The throughput of these simulations
are presented in Table 3-2. For brevity, only the speeds for long running (1 billion x86
instructions) are presented.
The high-frequency switching between the simulated CPUs causes a high overhead
degrading the throughput on increasing the number of CPUs, even when FeS2 and the
TLB timing model are not used. For instance, the speed of a 2 CPU simulation is only
a third of the 1 CPU simulation. When FeS2 and the TLB timing model are used, the
simulation speed further reduces and is about 10× smaller than the speed without FeS2.
3.5 Using the Framework to Investigate TLB Behavior in Virtualized Platforms
One of the motivating factors for developing the simulation framework is to
understand the TLB behavior in virtualized scenarios and quantify the impact of the
TLB on the performance of virtualized workloads. To achieve this, consolidated and
unconsolidated workloads consisting of the applications described in Section 3.3.1
51
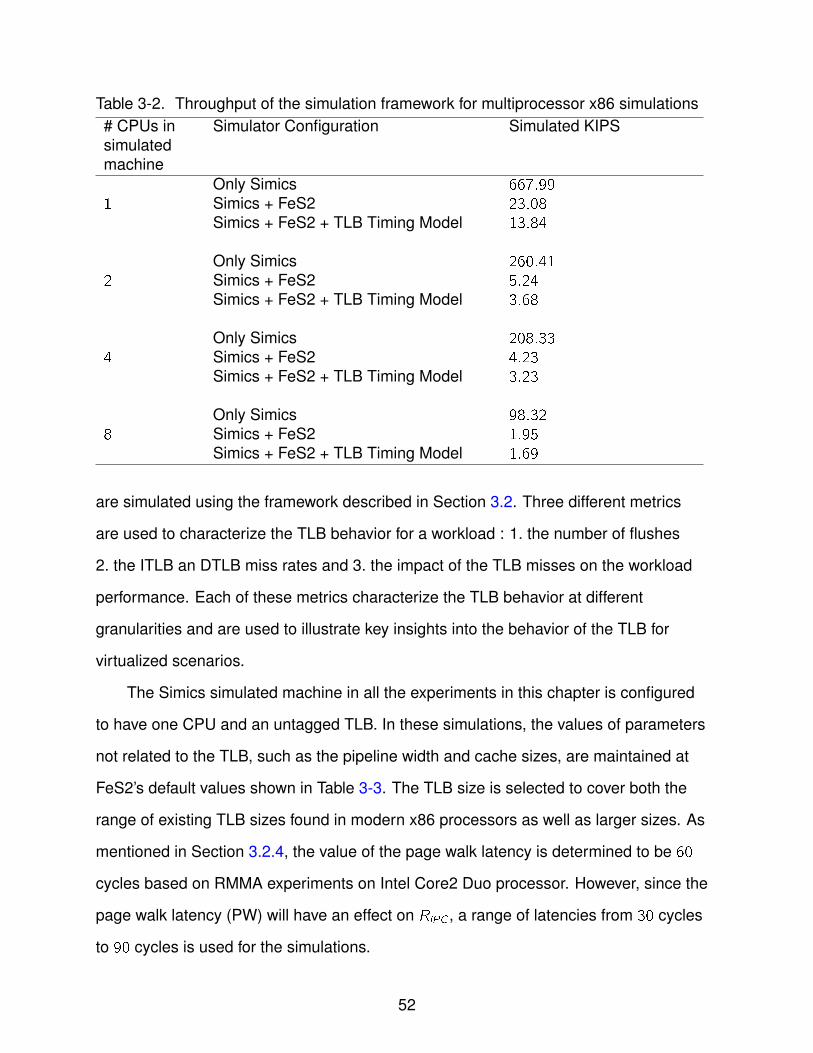
Table 3-2. Throughput of the simulation framework for multiprocessor x86 simulations# CPUs insimulatedmachine
Simulator Configuration Simulated KIPS
1Only Simics 667.99Simics + FeS2 23.08Simics + FeS2 + TLB Timing Model 13.84
2Only Simics 260.41Simics + FeS2 5.24Simics + FeS2 + TLB Timing Model 3.68
4Only Simics 208.33Simics + FeS2 4.23Simics + FeS2 + TLB Timing Model 3.23
8Only Simics 98.32Simics + FeS2 1.95Simics + FeS2 + TLB Timing Model 1.69
are simulated using the framework described in Section 3.2. Three different metrics
are used to characterize the TLB behavior for a workload : 1. the number of flushes
2. the ITLB an DTLB miss rates and 3. the impact of the TLB misses on the workload
performance. Each of these metrics characterize the TLB behavior at different
granularities and are used to illustrate key insights into the behavior of the TLB for
virtualized scenarios.
The Simics simulated machine in all the experiments in this chapter is configured
to have one CPU and an untagged TLB. In these simulations, the values of parameters
not related to the TLB, such as the pipeline width and cache sizes, are maintained at
FeS2’s default values shown in Table 3-3. The TLB size is selected to cover both the
range of existing TLB sizes found in modern x86 processors as well as larger sizes. As
mentioned in Section 3.2.4, the value of the page walk latency is determined to be 60
cycles based on RMMA experiments on Intel Core2 Duo processor. However, since the
page walk latency (PW) will have an effect on RIPC , a range of latencies from 30 cycles
to 90 cycles is used for the simulations.
52
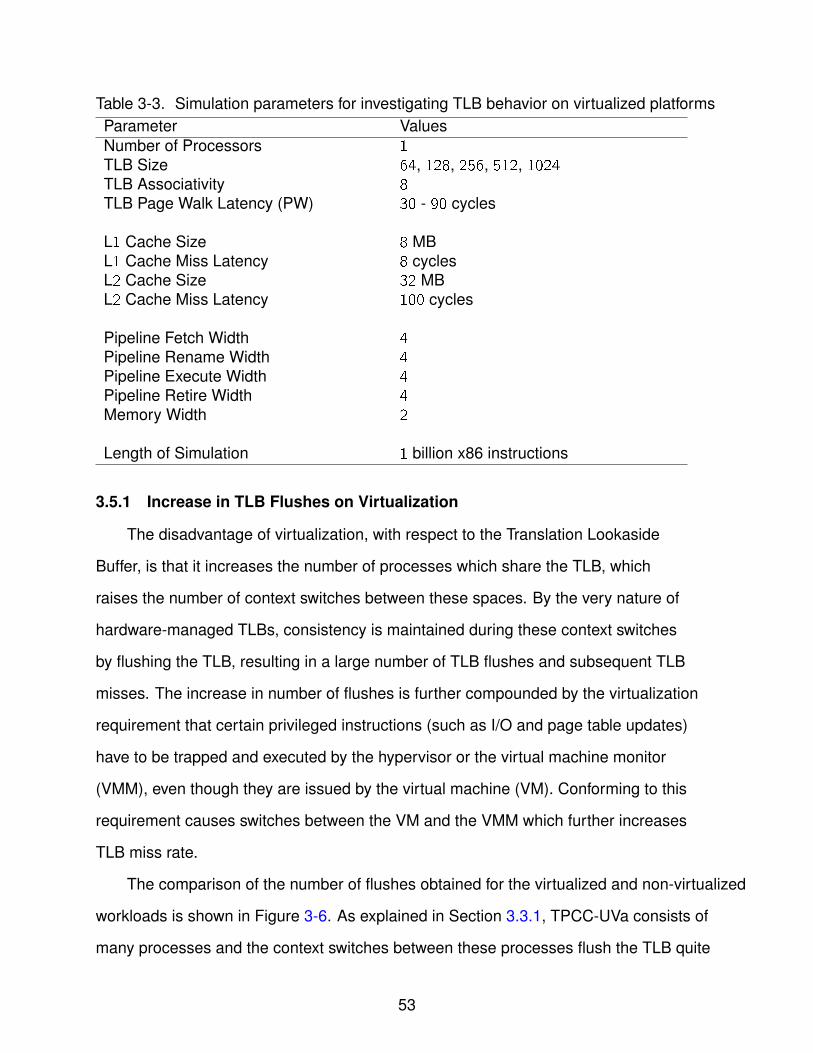
Table 3-3. Simulation parameters for investigating TLB behavior on virtualized platformsParameter ValuesNumber of Processors 1TLB Size 64, 128, 256, 512, 1024TLB Associativity 8TLB Page Walk Latency (PW) 30 - 90 cycles
L1 Cache Size 8 MBL1 Cache Miss Latency 8 cyclesL2 Cache Size 32 MBL2 Cache Miss Latency 100 cycles
Pipeline Fetch Width 4Pipeline Rename Width 4Pipeline Execute Width 4Pipeline Retire Width 4Memory Width 2
Length of Simulation 1 billion x86 instructions
3.5.1 Increase in TLB Flushes on Virtualization
The disadvantage of virtualization, with respect to the Translation Lookaside
Buffer, is that it increases the number of processes which share the TLB, which
raises the number of context switches between these spaces. By the very nature of
hardware-managed TLBs, consistency is maintained during these context switches
by flushing the TLB, resulting in a large number of TLB flushes and subsequent TLB
misses. The increase in number of flushes is further compounded by the virtualization
requirement that certain privileged instructions (such as I/O and page table updates)
have to be trapped and executed by the hypervisor or the virtual machine monitor
(VMM), even though they are issued by the virtual machine (VM). Conforming to this
requirement causes switches between the VM and the VMM which further increases
TLB miss rate.
The comparison of the number of flushes obtained for the virtualized and non-virtualized
workloads is shown in Figure 3-6. As explained in Section 3.3.1, TPCC-UVa consists of
many processes and the context switches between these processes flush the TLB quite
53

0
1
2
3
4
5
6
7
8
Linux Xen Linux Xen Linux Xen Linux Xen
TPCC dbench SPECjbb Vortex
TLB
Flu
shes
per
Mill
ion
Inst
ruct
ions
Figure 3-6. Increase in TLB flushes on virtualization. Comparing the TLB flushes innon-virtualized and virtualized platforms reveals a 7× to 10× increase in thenumber of flushes for virtualized workloads.
frequently. Hence, TPCC-UVa exhibits a large number of flushes per instructions, even
when it runs in a non-virtualized system. But the frequency of TLB flushes increases
by almost 10× on virtualization. A similar behavior is seen for the dbench workload, as
that is I/O intensive in nature as well. This behavior is due to the I/O component of these
benchmarks which requires switching between the dom on which the application runs
and dom0 which contains the I/O back end drivers. On the other hand, when SPECjbb
and Vortex are considered, the number of flushes, while still larger on virtualized
platforms than on Linux, is smaller compared to the I/O-intensive TPCC-UVa or dbench.
In these applications, the ratio of the flushes on virtualized and non-virtualized scenarios
is smaller than the I/O-intensive benchmarks.
3.5.2 Increase in TLB Miss Rate on Virtualization
The effect of the TLB being flushed more frequently is that the lifespan of the TLB
entries reduce to the order of a few hundred thousand cycles, causing a big barrier for
54

0
0.5
1
1.5
2
2.5
3
3.5
4
Lin
ux
Xe
n
Lin
ux
Xe
n
Lin
ux
Xe
n
Lin
ux
Xe
n
Lin
ux
Xe
n
Lin
ux
Xe
n
Lin
ux
Xe
n
Lin
ux
Xe
n
Lin
ux
Xe
n
Lin
ux
Xe
n
64-
entry
TLB
128-
entry
TLB
256-
entry
TLB
512-
entry
TLB
1024-entry
TLB
64-
entry
TLB
128-
entry
TLB
256-
entry
TLB
512-
entry
TLB
1024-
entry
TLB
TPCC dbench
Mis
se
s p
er T
ho
us
an
d I
ns
tru
ctio
ns
(M
PK
I)
A DTLB Miss rate for I/O-intensive workloads
0
0.5
1
1.5
2
2.5
3
3.5
4
4.5
Lin
ux
Xe
n
Lin
ux
Xe
n
Lin
ux
Xe
n
Lin
ux
Xe
n
Lin
ux
Xe
n
Lin
ux
Xe
n
Lin
ux
Xe
n
Lin
ux
Xe
n
Lin
ux
Xe
n
Lin
ux
Xe
n
64-
entry
TLB
128-
entry
TLB
256-
entry
TLB
512-
entry
TLB
1024-entry
TLB
64-
entry
TLB
128-
entry
TLB
256-
entry
TLB
512-
entry
TLB
1024-
entry
TLB
SPECjbb VortexM
iss
es
pe
r T
ho
us
an
d I
ns
tru
ctio
ns
(M
PK
I)
B DTLB Miss rate for memory-intensive work-loads
0
0.2
0.4
0.6
0.8
1
1.2
1.4
1.6
Lin
ux
Xe
n
Lin
ux
Xe
n
Lin
ux
Xe
n
Lin
ux
Xe
n
Lin
ux
Xe
n
Lin
ux
Xe
n
Lin
ux
Xe
n
Lin
ux
Xe
n
Lin
ux
Xe
n
Lin
ux
Xe
n
64-
entry
TLB
128-
entry
TLB
256-
entry
TLB
512-
entry
TLB
1024-entry
TLB
64-
entry
TLB
128-
entry
TLB
256-
entry
TLB
512-
entry
TLB
1024-
entry
TLB
TPCC dbench
Mis
se
s p
er T
ho
us
an
d I
ns
tru
ctio
ns
(M
PK
I)
C ITLB Miss rate for I/O-intensive workloads
0
0.1
0.2
0.3
0.4
0.5
0.6
0.7
0.8
Lin
ux
Xe
n
Lin
ux
Xe
n
Lin
ux
Xe
n
Lin
ux
Xe
n
Lin
ux
Xe
n
Lin
ux
Xe
n
Lin
ux
Xe
n
Lin
ux
Xe
n
Lin
ux
Xe
n
Lin
ux
Xe
n
64-
entry
TLB
128-
entry
TLB
256-
entry
TLB
512-
entry
TLB
1024-entry
TLB
64-
entry
TLB
128-
entry
TLB
256-
entry
TLB
512-
entry
TLB
1024-
entry
TLB
SPECjbb Vortex
Mis
se
s p
er T
ho
us
an
d In
stru
ctio
ns
(M
PK
I)
D ITLB Miss rate for memory-intensive work-loads
Figure 3-7. Increase in TLB miss rate on virtualization. Comparing TLB miss rates innon-virtualized and virtualized platforms shows significantly larger miss ratesfor the virtualized workloads.
55

improved VM performance [14]. The impact of this increased number of flushes can
be understood by examining the miss rates for the non-virtualized applications and
contrasting them to their virtualized counterparts. In Figure 3-7, the number of TLB
misses per thousand instructions (MPKI) for all four workloads, both virtualized and
non-virtualized scenarios, are presented. When the change miss rates with increasing
TLB sizes is observed, it is seen that the DTLB miss rates for TPCC-UVa on Xen
reduces till about 256 entry TLB and then become constant at 0.5577 misses per
thousand instructions. On the other hand, the virtualized SPECjbb and Vortex show a
constantly reducing trend in the DTLB miss rates with increase in TLB sizes. It is also
clear that the DTLB miss rate on Xen is 1.5× to 5× larger than on Linux for a large
TLB of size 1024 entries. This virtualization-driven increase in ITLB miss rates is even
larger, and for SPECjbb and Vortex, is as large as 70× for 1024 entry TLB. Thus, this
experiment clearly shows the significantly larger TLB misses on a virtualized platform.
Depending on whether the page walk hist or misses in the cache, the cost of every TLB
miss may be the time taken for a few RAM accesses, i.e., upwards of a few hundred
cycles.
3.5.3 Decrease in Workload Performance on Virtualization
To estimate the impact of the TLB on the performance of a workload, the workload
is simulated in two different configurations. In the first configuration, Simics is configured
to use FeS2 but not the TLB timing model, thereby capturing the behavior of an
”ideal TLB” with zero latency for TLB lookups and a 100% TLB hit rate. The workload
Instructions per Cycle (IPC) obtained from this simulation corresponds to an ”ideal IPC”
where the TLB is not realistically modeled. This IPC value represents the maximum IPC
that could potentially be achieved by any improved TLB design. Then, the framework is
configured to run Simics with FeS2 and the ”regular TLB timing model” (finite capacity
and non-zero page walk latency) and the ”realistic IPC” of the workload is obtained. The
56

difference in the IPC values of both these configurations gives an estimate of the TLB’s
influence in determining the performance of the workload.
The metric RIPC shown in Equation 3–2, which is a ratio of the difference in the
realistic and ideal IPCs to the ideal IPC, expressed as percentage value, is used to
gauge the impact of the TLB timing model. The higher the value of RIPC , the farther
the IPC obtained using the realistic TLB timing model deviates from the ideal IPC
value. Hence, the RIPC captures the TLB-induced delay in the performance of the
workload. Any improvement in the TLB architecture which reduces the TLB-induced
delay will lower the RIPC value and therefore, RIPC may also be used as a figure of merit
to compare various TLB improvement schemes. Moreover, RIPC may also be used as
an estimation of the deviation of IPC from a realistic IPC, when simulation frameworks
are used to study the characteristics of virtualized workload without accounting for TLB
timing. Thus, a large RIPC for a workload emphasizes the criticality of modeling the
TLB behavior for accurately characterizing the performance of the workload. The RIPC
values from these simulations are shown in Figure 3-8 and Figure 3-9 for single and
consolidated workloads respectively.
RIPC = 100×(1− IPCRegular TLB
IPCIdeal TLB
)(3–2)
3.5.3.1 I/O-intensive workloads
TPCC-UVa uses a PostgreSQL database, which it reads from the disk as needed.
Thus, TPCC-UVa causes some disk I/O activity. The I/O drivers in Xen use a split
architecture, where the front-end driver on the domU uses the privileged back end
driver on dom0 to perform I/O. As a result, there are a large number of flushes caused
by the context switches between the domains. These I/O related context switches
causes TPCC-UVa on Xen to have a high TLB miss rate and, therefore, a large RIPC ,
as seen from Figure 3-8A. The RIPC is especially high at smaller TLB sizes, as seen
57

0
2
4
6
8
10
12
14
Lin
ux
Xe
n
Lin
ux
Xe
n
Lin
ux
Xe
n
Lin
ux
Xe
n
Lin
ux
Xe
n
Lin
ux
Xe
n
Lin
ux
Xe
n
Lin
ux
Xe
n
Lin
ux
Xe
n
Lin
ux
Xe
n
Lin
ux
Xe
n
Lin
ux
Xe
n
Lin
ux
Xe
n
Lin
ux
Xe
n
Lin
ux
Xe
n
PW
30
PW
60
PW
90
PW
30
PW
60
PW
90
PW
30
PW
60
PW
90
PW
30
PW
60
PW
90
PW
30
PW
60
PW
90
64-entry TLB 128-entry TLB 256-entry TLB 512-entry TLB 1024-entry TLB
RIP
C (
%)
A RIPC for TPCC-UVa
0
5
10
15
20
25
30
Lin
ux
Xe
n
Lin
ux
Xe
n
Lin
ux
Xe
n
Lin
ux
Xe
n
Lin
ux
Xe
n
Lin
ux
Xe
n
Lin
ux
Xe
n
Lin
ux
Xe
n
Lin
ux
Xe
n
Lin
ux
Xe
n
Lin
ux
Xe
n
Lin
ux
Xe
n
Lin
ux
Xe
n
Lin
ux
Xe
n
Lin
ux
Xe
n
PW
30
PW
60
PW
90
PW
30
PW
60
PW
90
PW
30
PW
60
PW
90
PW
30
PW
60
PW
90
PW
30
PW
60
PW
90
64-entry TLB 128-entry TLB 256-entry TLB 512-entry TLB 1024-entry TLB
RIP
C (
%)
B RIPC for dbench
0
5
10
15
20
25
30
Lin
ux
Xe
n
Lin
ux
Xe
n
Lin
ux
Xe
n
Lin
ux
Xe
n
Lin
ux
Xe
n
Lin
ux
Xe
n
Lin
ux
Xe
n
Lin
ux
Xe
n
Lin
ux
Xe
n
Lin
ux
Xe
n
Lin
ux
Xe
n
Lin
ux
Xe
n
Lin
ux
Xe
n
Lin
ux
Xe
n
Lin
ux
Xe
n
PW
30
PW
60
PW
90
PW
30
PW
60
PW
90
PW
30
PW
60
PW
90
PW
30
PW
60
PW
90
PW
30
PW
60
PW
90
64-entry TLB 128-entry TLB 256-entry TLB 512-entry TLB 1024-entry TLB
RIP
C (
%)
C RIPC for SPECjbb
0
5
10
15
20
25
30
35
40
Lin
ux
Xe
n
Lin
ux
Xe
n
Lin
ux
Xe
n
Lin
ux
Xe
n
Lin
ux
Xe
n
Lin
ux
Xe
n
Lin
ux
Xe
n
Lin
ux
Xe
n
Lin
ux
Xe
n
Lin
ux
Xe
n
Lin
ux
Xe
n
Lin
ux
Xe
n
Lin
ux
Xe
n
Lin
ux
Xe
n
Lin
ux
Xe
n
PW
30
PW
60
PW
90
PW
30
PW
60
PW
90
PW
30
PW
60
PW
90
PW
30
PW
60
PW
90
PW
30
PW
60
PW
90
64-entry TLB 128-entry TLB 256-entry TLB 512-entry TLB 1024-entry TLB
RIP
C (
%)
D RIPC for Vortex
Figure 3-8. Decrease in single-domain workload performance on virtualization.Performance is expressed using IPC and the decrease in performance usingRIPC . The RIPC for virtualized workloads is significantly larger, especially atlarger TLB sizes.
58

from its value of 8.5% and 12% for a 64-entry TLB with PW values of 60 an 90 cycles
respectively.
One advantage of a full-system simulator, such as the one presented in this work, is
that the O/S and the software stack is simulated in addition to the workload application.
Hence, access to performance monitoring tools like top [87, 88] is readily available.
Using top, the memory usage of TPCC-UVa is estimated to be about 50MB memory.
Thus, in addition to the TLB misses driven by the I/O related context switches, some
of the TLB misses are also caused by this memory footprint and the lack of sufficient
space in the TLB to accommodate all the entries. When the change in RIPC with TLB
size is observed, it can be seen that increasing the TLB size up to 256 entries from 64
entries reduces RIPC from 8.5% to 5.5%, a 35% reduction in the TLB-induced delay. This
is because a larger TLB is able to accommodate more entries, thereby avoiding the TLB
misses and page walk delays which arise due to the lack of TLB capacity. However,
increasing the TLB size beyond 256 entries does not reduce the RIPC significantly.
Beyond 256 entries, the dominant cause for TLB misses is the repeated flushing of the
TLB and not TLB size limitations.
On comparing the RIPC values for Linux and Xen, a nine-fold increase in RIPC is
observed in the virtualized scenario, primarily due to the I/O activity of TPCC-UVa.
At a TLB size of 1024 entries, the RIPC for TPCC-UVa on Linux is between 0.35%
and 0.9% depending on the value of the page walk latency. Corresponding values for
the virtualized TPCC-UVa lie in the range of 3.6% to 8%. This clearly underlines the
increased impact of the TLB on the workload performance in virtualized scenarios
and the importance of modeling the TLB timing behavior when simulating virtualized
workloads.
The trend of very large RIPC values for the virtualized version of the workload is
observed for dbench also, as dbench is another I/O-intensive workload. In fact, since
dbench is the most I/O-intensive of all four workloads, it exhibits the highest increase
59

in RIPC as a result of virtualization. The RIPC on Xen for a 64 entry TLB is more than
10× that of dbench running on Linux. Similar to TPCC-UVa, increasing the TLB size till
256 entries lowers the TLB misses and thereby the RIPC of virtualized dbench to some
extent. Beyond this point, however, the reduction in RIPC is limited, for the same reasons
as TPCC-UVa, i.e., flushing of the TLB becomes the dominant cause of TLB misses.
While the trend is similar to TPCC-UVa, the actual RIPC values are larger for any given
TLB size and page walk latency than TPCC-UVa. It is also instructive to see that, on
increasing the size of the TLB, the RIPC values for Linux do not change significantly and
reduce only by 9%. This is in contrast to the 60% reduction shown by dbench on Xen.
3.5.3.2 Memory-intensive workloads
The values and the trends of RIPC for SPECjbb on Linux is quite different from both
TPCC-UVa and dbench, as seen in Figure 3-8C. Even when SPECjbb runs on Linux,
it runs inside a Java virtual machine which has a large heap size of 256MB. Moreover,
as explained in Section 3.3, SPECjbb caches the database in memory causing a wide
spread in the pattern of the memory pages it accesses. Both these factors cause
SPECjbb to exhibit high TLB miss rates, as reported by Shuf et al. [80]. Thus, even in
non-virtualized scenario, there is a significant RIPC for SPECjbb. In fact, at smaller TLB
sizes, the RIPC in Linux is close to that in Xen. For instance, with a 64 entry TLB, RIPC in
Linux is almost 80% that of Xen for 60 cycle page walk latency.
On increasing the TLB size, however, the additional RIPC due to virtualization
becomes pronounced. This is due to the inability of increasing TLB sizes to cope with
virtualization related context switches and the resulting TLB flushes. Even in a workload
like SPECjbb which is not predominantly I/O-intensive, the RIPC for 1024 entry TLB and
60 cycle page walk latency increases by two fold, compared to Linux.
Compared to TPCC-UVa and dbench, another notable difference is the scaling of
the RIPC values on increasing the TLB size, even beyond 256-entry TLB size. In fact,
compared to the value at 256 entries, the RIPC value for the virtualized SPECjbb reduces
60
by 11% for a 512 entry TLB and 16% for 1024 entry TLB. This behavior is due to the
memory-intensive nature of the workload. At these large TLB sizes, the contribution
of the TLB misses due to a lack of capacity in the TLB is still quite significant and
the workload is able to benefit from increased space in the TLB. Moreover, since
virtualization driven TLB flushes are not present in Linux, it can be observed that the
reduction in RIPC is more for Linux than for Xen.
Vortex, in spite of being a part of CPU intensive benchmark suite, also has a
significant memory usage of about 75MB. While the amount of memory it uses is lesser
than SPECjbb, its spread pattern of accessing pages causes it to have a miss rate
comparable to many Java based workloads [83]. Hence, the trend of the RIPC values
is similar to SPECjbb. The impact of virtualization is small at small TLB sizes, as seen
by the RIPC value on Linux which is about 90% of the value on Xen. As the TLB size
increases, the reduction of RIPC on Linux is much steeper than on Xen. At a TLB size
of 1024 entries, Vortex on Xen has an RIPC which is almost four fold that of Linux, for 60
cycle page walk latency.
While the trend in RIPC values are similar for SPECjbb and Vortex, one notable
difference is the magnitude by which they reduce on scaling up the size of the TLB.
Even for virtualized Vortex, the RIPC reduces by 70% on scaling the TLB size from 64
entries to 1024 entries, compared to the 40% reduction for virtualized SPECjbb.
3.5.3.3 Consolidated workloads
To study the TLB behavior for consolidated multi-domain workloads, two consolidated
workloads TPCC-UVA SPECjbb and TPCC-UVA dbench are created, using the method
outlined in Section 3.3.2. In these workloads, both component applications time share a
single CPU for the length of the simulation, i.e., 1 billion instructions. These workloads
are simulated using FeS2, and the RIPCs are plotted, as shown in Figure 3-9.
From Figure 3-9A, it can be seen that the values and the trends of the RIPCs
for TPCC-UVA SPECjbb are a combination of the individual values and trends for
61

0
5
10
15
20
25
Lin
ux
Xe
n
Lin
ux
Xe
n
Lin
ux
Xe
n
Lin
ux
Xe
n
Lin
ux
Xe
n
Lin
ux
Xe
n
Lin
ux
Xe
n
Lin
ux
Xe
n
Lin
ux
Xe
n
Lin
ux
Xe
n
Lin
ux
Xe
n
Lin
ux
Xe
n
Lin
ux
Xe
n
Lin
ux
Xe
n
Lin
ux
Xe
n
PW
30
PW
60
PW
90
PW
30
PW
60
PW
90
PW
30
PW
60
PW
90
PW
30
PW
60
PW
90
PW
30
PW
60
PW
90
64-entry TLB 128-entry TLB 256-entry TLB 512-entry TLB 1024-entry TLB
RIP
C (
%)
A RIPC for TPCC-UVa consolidated withSPECjbb
0
5
10
15
20
25
Lin
ux
Xe
n
Lin
ux
Xe
n
Lin
ux
Xe
n
Lin
ux
Xe
n
Lin
ux
Xe
n
Lin
ux
Xe
n
Lin
ux
Xe
n
Lin
ux
Xe
n
Lin
ux
Xe
n
Lin
ux
Xe
n
Lin
ux
Xe
n
Lin
ux
Xe
n
Lin
ux
Xe
n
Lin
ux
Xe
n
Lin
ux
Xe
n
PW
30
PW
60
PW
90
PW
30
PW
60
PW
90
PW
30
PW
60
PW
90
PW
30
PW
60
PW
90
PW
30
PW
60
PW
90
64-entry TLB 128-entry TLB 256-entry TLB 512-entry TLB 1024-entry TLBR
IPC (
%)
B RIPC for TPCC-UVa consolidated with dbench
Figure 3-9. Decrease in consolidated workload performance on virtualization.Performance is expressed using IPC and the decrease in performance usingRIPC . The RIPC for virtualized workloads is significantly larger. The trend inRIPC for consolidated workload is a combination of the values and trends ofthe RIPC of the component applications.
TPCC-UVa and SPECjbb. As an example, at a TLB size of 64 entries and a page walk
latency of 60 cycles, the increase in RIPC due to virtualization is 1.45×, 8.66× and 1.26×
for the consolidated workload, TPCC-UVa and SPECjbb respectively. This behavior
is due to the fact that, because of equal priorities in the scheduler, these applications
time share the TLB causing the resulting behavior to be a combination of both the
individual applications. It can also be seen that the actual values of the TLB RIPCs are
between those of component applications for all TLB sizes and page walk latencies.
A similar behavior is seen for TPCC-UVa dbench as shown in Figure 3-9B. Since all
the workloads are I/O-intensive, the increase in RIPC due to virtualization is quite large,
irrespective of TLB size. In fact, the ratio of RIPC values on Xen and Linux is in the range
62
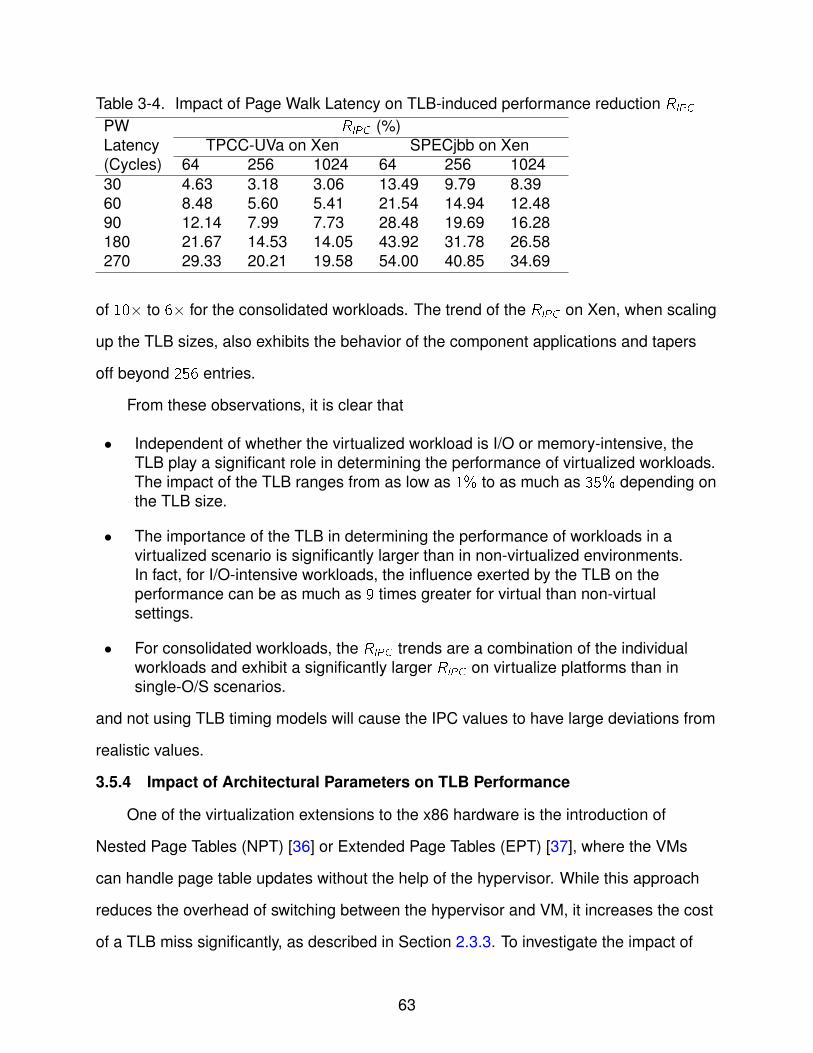
Table 3-4. Impact of Page Walk Latency on TLB-induced performance reduction RIPC
PW RIPC (%)Latency TPCC-UVa on Xen SPECjbb on Xen(Cycles) 64 256 1024 64 256 102430 4.63 3.18 3.06 13.49 9.79 8.3960 8.48 5.60 5.41 21.54 14.94 12.4890 12.14 7.99 7.73 28.48 19.69 16.28180 21.67 14.53 14.05 43.92 31.78 26.58270 29.33 20.21 19.58 54.00 40.85 34.69
of 10× to 6× for the consolidated workloads. The trend of the RIPC on Xen, when scaling
up the TLB sizes, also exhibits the behavior of the component applications and tapers
off beyond 256 entries.
From these observations, it is clear that
• Independent of whether the virtualized workload is I/O or memory-intensive, theTLB play a significant role in determining the performance of virtualized workloads.The impact of the TLB ranges from as low as 1% to as much as 35% depending onthe TLB size.
• The importance of the TLB in determining the performance of workloads in avirtualized scenario is significantly larger than in non-virtualized environments.In fact, for I/O-intensive workloads, the influence exerted by the TLB on theperformance can be as much as 9 times greater for virtual than non-virtualsettings.
• For consolidated workloads, the RIPC trends are a combination of the individualworkloads and exhibit a significantly larger RIPC on virtualize platforms than insingle-O/S scenarios.
and not using TLB timing models will cause the IPC values to have large deviations from
realistic values.
3.5.4 Impact of Architectural Parameters on TLB Performance
One of the virtualization extensions to the x86 hardware is the introduction of
Nested Page Tables (NPT) [36] or Extended Page Tables (EPT) [37], where the VMs
can handle page table updates without the help of the hypervisor. While this approach
reduces the overhead of switching between the hypervisor and VM, it increases the cost
of a TLB miss significantly, as described in Section 2.3.3. To investigate the impact of
63
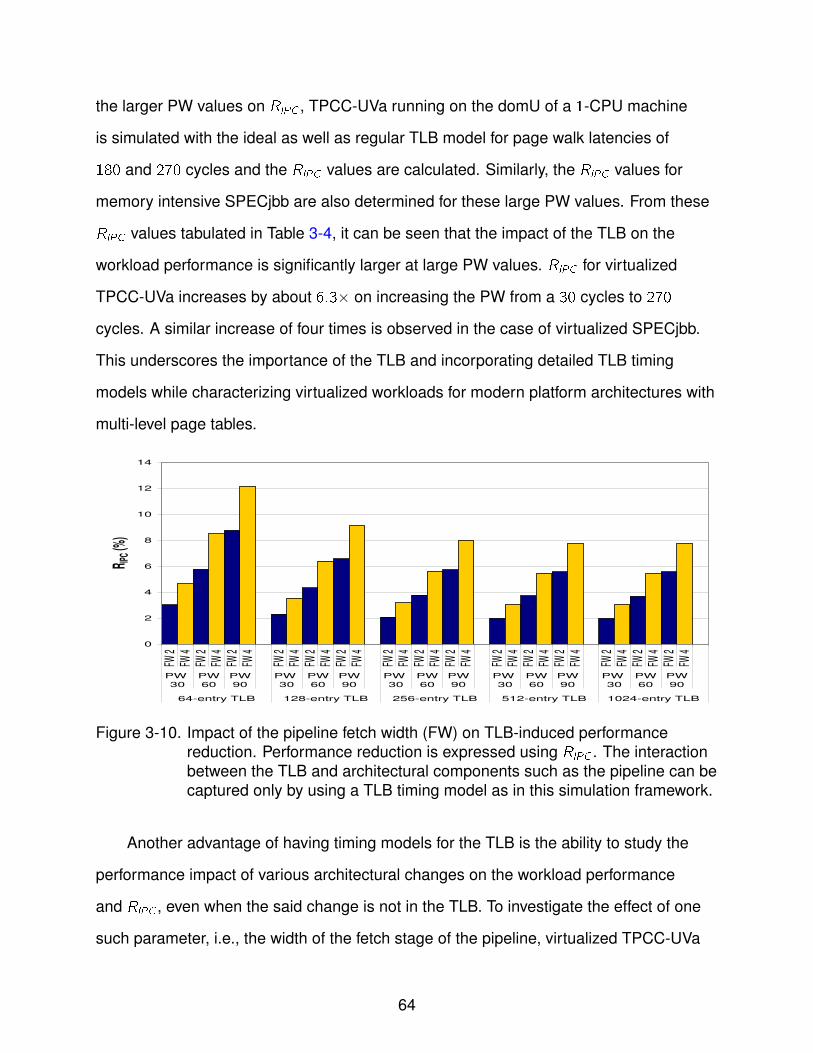
the larger PW values on RIPC , TPCC-UVa running on the domU of a 1-CPU machine
is simulated with the ideal as well as regular TLB model for page walk latencies of
180 and 270 cycles and the RIPC values are calculated. Similarly, the RIPC values for
memory intensive SPECjbb are also determined for these large PW values. From these
RIPC values tabulated in Table 3-4, it can be seen that the impact of the TLB on the
workload performance is significantly larger at large PW values. RIPC for virtualized
TPCC-UVa increases by about 6.3× on increasing the PW from a 30 cycles to 270
cycles. A similar increase of four times is observed in the case of virtualized SPECjbb.
This underscores the importance of the TLB and incorporating detailed TLB timing
models while characterizing virtualized workloads for modern platform architectures with
multi-level page tables.
0
2
4
6
8
10
12
14
FW 2
FW 4
FW 2
FW 4
FW 2
FW 4
FW 2
FW 4
FW 2
FW 4
FW 2
FW 4
FW 2
FW 4
FW 2
FW 4
FW 2
FW 4
FW 2
FW 4
FW 2
FW 4
FW 2
FW 4
FW 2
FW 4
FW 2
FW 4
FW 2
FW 4
PW
30
PW
60
PW
90
PW
30
PW
60
PW
90
PW
30
PW
60
PW
90
PW
30
PW
60
PW
90
PW
30
PW
60
PW
90
64-entry TLB 128-entry TLB 256-entry TLB 512-entry TLB 1024-entry TLB
R IPC (
%)
Figure 3-10. Impact of the pipeline fetch width (FW) on TLB-induced performancereduction. Performance reduction is expressed using RIPC . The interactionbetween the TLB and architectural components such as the pipeline can becaptured only by using a TLB timing model as in this simulation framework.
Another advantage of having timing models for the TLB is the ability to study the
performance impact of various architectural changes on the workload performance
and RIPC , even when the said change is not in the TLB. To investigate the effect of one
such parameter, i.e., the width of the fetch stage of the pipeline, virtualized TPCC-UVa
64

is simulated with two different fetch widths of 2 and 4 for multiple TLB sizes and page
walk latencies. The IPCs from these simulations are used to determine the RIPCs which
are shown in Figure 3-10. From this, it can be seen that narrowing the fetch part of
the pipeline reduces RIPC quite significantly. With a narrower stream of instructions,
there is reduced pressure on the TLB, and thereby smaller number of TLB related
stall cycles. For instance, the RIPC for 64 entry TLB and 60 cycle page walk latency is
almost a third smaller for 2-wide fetch stage than for a 4-wide fetch stage. This trend
is seen irrespective of the TLB size. It is also interesting to note that the reduction in
RIPC by narrowing the fetch stage is less pronounced at larger page walk latencies as,
the TLB-induced delay increase in comparison with the stall cycles caused by the rest
of the system at large PW values. Thus, it is clear that using a timing model will help
understand the impact of various non-TLB architectural parameters on the TLB behavior
workloads.
3.6 Summary
In this chapter, a full-system simulation framework based on Simics and FeS2
and incorporating detailed TLB functional and timing models is developed and used to
investigate the TLB-induced delay for I/O-intensive, memory-intensive and consolidated
workloads. The impact of the TLB on workload performance is found to depend on the
TLB size as well as the value of the page walk latency. For typical server workloads,
the performance of the workloads is reduced by 8% to 35% due to the increased
TLB flushes and misses on virtualized platforms. It is also seen that the TLB-induced
performance degradation, especially for TPCC-UVa and dbench, are as much as 7× to
8× for the virtualized workload, compared to non-virtualized scenarios.
65

CHAPTER 4A TLB TAG MANAGEMENT FRAMEWORK FOR VIRTUALIZED PLATFORMS
While virtualization based server consolidation offers advantages such as
effective, flexible and controllable use of server resources, the workloads running in
such virtualized platforms experience lower performance than their non-virtualized
counterparts. One significant source of this performance degradation, as seen in
Chapter 3, is the high frequency context switch-related flushing of the Translation
Lookaside Buffer which increases the TLB miss rate and page walks to service these
misses, thereby reducing the performance of the virtualized workloads. Reducing this
TLB-induced performance degradation is an important challenge in virtualization.
4.1 Current State of the Art in Improving TLB Performance
Hardware managed TLBs , such as the x86 TLB, get completely flushed on context
switches to ensure consistency of the entries and prevent the entries of one process’s
address space being used for another process. This repeated flushing causes TLB
lookups to miss, necessitating high-latency page walks and thereby reduces the
workload performance. However, if the TLB entries are identified as belonging to a
specific address space by using a tag, then the TLB need not be flushed on context
switches.
Avoiding TLB flushes by tagging the entries with address space identifiers is a
well-established technique in software managed TLBs [26, 27, 89]. The use of TLB tags
on Itanium [90] as well as on PowerPC [91–93] have also been investigated. Prior to
the advent of virtualization, however, tagging of the entries in the hardware-managed
x86 TLB was not exhaustively studied. This was primarily due to the reason that the
frequency of the hardware-managed x86 TLB being flushed is small in non-virtualized
cases, about once every million cycles, and is not a major source of performance
degradation.
66

On the other hand, TLB flushes and the resultant TLB-induced delay cannot be
ignored on virtualized systems as evident from Section 3.5. The introduction of TLB
tags and a hardware-based tag-checking mechanism as a part of the virtualization
extensions, such as AMD-SVM [36, 48] and Intel VPID [37], is clearly a nod to the
importance of the TLB on virtualized platforms. In AMD-SVM [48], each TLB entry has
a 6 bit Address Space ID (ASID) as a part of its entry. Currently, Xen on AMD-SVM [94]
uses ASID 0 for the hypervisor or the Host mode. As long as the CPU is in Host mode,
the TLB entries are tagged with ASID 0. When the CPU switches to Guest mode, the
TLB is not flushed, but the ASID is changed from 0 to the ASID of the guest VM. Thus,
any TLB entry belonging to the hypervisor will not be declared a hit for a Guest-initiated
TLB lookup, as the ASID tags will not match. Avoiding TLB flushes using ASID tags
is found to have about 11% reduction in the overall runtime of kernbench, a kernel
compiling workload [94]. Similarly, in the Intel Nehalem [37], the TLB entries are
tagged with a per-VM Virtual Processor Identifier (VPID). Intel platforms such as the
Westmere [28] support PCID, a process-specific tag which is assigned and managed by
the system software. Tickoo et al. [18] also explore TLB tagging in their qTLB approach,
where the TLB entries belonging to the hypervisor, which are global within a domain, are
not flushed during a switch from one domain to another.
The primary intent of these efforts is to make the switching between VMs more
efficient by avoiding a TLB flush. However, using VM-specific tags1 can avoid only a
subset of the context switch related TLB flushes compared to using process-specific
tagging. In addition to this, while a software-transparent hardware-only scheme is
desirable for hardware-managed TLBs to keep in line with the ”hardware-managed”
1 In this dissertation VM-specific tags are alternatively referred to as domain-specifictags, dom-specific tags, per-VM tags or per-domain tags
67
design philosophy, the system software is involved in avoiding TLB flushes in all these
approaches including the PCID architecture [28].
To meet these requirements, the Tag Manager Table (TMT) is proposed in this
dissertation. The TMT is a low-latency architecture which derives a tag from the
PTBR (CR3 register in x86) in a software-transparent manner and uses it to tag the
TLB entries. Such an approach significantly reduces TLB miss rates and the number
of TLB flushes, compared to using only VM-specific tags. The impact of the TMT is
investigated, in terms of the reduction in TLB flushes, TLB miss rate and TLB-induced
performance reduction using the full-system simulation framework developed in
Chapter 3. The influence of various hardware design parameters and workload
characteristics on this impact of using the TMT is analyzed. The use of the TMT in
enabling shared Last Level TLBs is also presented.
4.2 Architecture of the Tag Manager Table
VM-specific TLB tagging, as seen in qTLB [18], is aimed at avoiding the hypervisor
entries being flushed when there is a context switch between two VMs, termed as
Inter-VM switch. However, these tags do not prevent the TLB being flushed if there is
a context switch between two processes within the same VM, i.e., an Intra-VM switch.
By choosing tags that associate the TLB entries with a particular process’s address
space rather than a particular VM, it is possible to avoid TLB flushes triggered due
to all types of context switches. Furthermore, it is important that the tagging solution
for hardware-managed TLBs preserves the hardware-based TLB management with
minimal or no software involvement. These two requirements dictate the design of the
Tag Manager Table.
One potential tag which conforms to these requirement is the Page Table Base
Register (PTBR) which is stored in a hardware register (CR3 register in the case of
the x86 architecture). Since every process has a unique set of page tables, the value
in CR3 register is unique for every address space and the contents of the CR3 can be
68
obtained without a high latency interaction with the system software stack. Hence, the
TLB entries may be tagged with the CR3 value to identify the process or virtual address
space to which they belong. However, the size of the CR3 register is quite large (32 or
64 bits); tagging the TLB entry with the CR3 increases the die area as well as the energy
expenditure for the TLB lookup. Hence, the Tag Manager Table (TMT) is proposed to
achieve this software-transparent process-specific tagging with minimal overheads.
The TMT, shown in Figure 4-1, is a small, fast, cache implemented at the same level
as the TLB. Every TLB in the platform has an associated TMT. Each entry in the TMT
represents the context of a process and has three fields:
• The CR3 field, which contains the value of the CR3 register, a per-process uniquepointer to the page tables for the process.
• The Virtual Address Space Identifier (VASI), which stores a unique identifierassociated with the address space of the process. The VASI is generated asa function of the CR3 in a software-transparent manner. Any function whichguarantees that all entries in the TMT have different VASIs, such as a perfecthash or the CR3 masked with an appropriate bitmask, can be used. In the workpresented here, the position of the entry in the TMT is used as the VASI. Forinstance, the VASI for the first entry in the TMT is 0, the second entry is 1 andso on. This simple scheme eliminates the need for a complex hash function or abitmask while guaranteeing a unique VASI for every TMT entry.
• The Sharing ID (SID) field, which stores the identifier of the sharing class to whichthe process belongs. The SID is needed only for controlling the sharing of theTLB and can be left unassigned in the case of uncontrolled sharing as in all theexperiments performed in this chapter. The selection of the sharing classes andthe use of the SID are discussed in detail in Chapter 5.
The SID and the VASI together constitute the ”CR3 tag”2 . Tagging the TLB entries
with the CR3 tag instead of the CR3 itself results in a lower area overhead. For instance,
with an 8-entry TMT and a 3-bit SID, the CR3 tag is only 6 bits compared to the 32 or 64
bit CR3. The TMT architecture also consists of a Current Context Register (CCR). The
2 In this dissertation the CR3 tag is also referred to as process-specific tag orper-process tag.
69

CCR is a register with the same size as the Tag Manager Table entry, which caches the
CR3, SID and the VASI for the current context.
CR3
TAG
CR3
CR3 SIDTAG
MANAGER
TABLE
CR3 SID
VASI
VASI
VASISID
TLB
VPN
CCR
PPN
MOV CR3
TRIGGERS
FLUSH
1
LOOKUP NEW
CR3 IN TMT2
3
2LOOKUP NEW
CR3 IN CCR
TLB FLUSHED ONLY IF NO
FREE SLOT IN TMT OR FOR
CONSISTENCY FLUSH
VIRTUAL ADDRESS
PAGE OFFSETVPN
Figure 4-1. TLB flush behavior with the Tag Manager Table. In step ..1 a value is writtenin CR3 prompting a flush. In step ..2 , the TMT is searched for the new CR3.Simultaneously the new CR3 is compared to the current CR3 in the CCR.The TLB and the TMT are flushed if the new CR3 matches with the CCR, orif the new CR3 is inserted into the TMT after evicting an exiting entry. This isshown in step ..3 .
4.2.1 Avoiding Flushes Using the Tag Manager Table
Whenever there is a context switch from process P1 to P2, a TLB flush is triggered
by the ”MOV CR3” instruction which updates the value of the CR3 register, as shown
in step ..1 of Figure 4-1. On the triggering of the TLB flush, the TMT is searched
to determine if the CR3 value of P2 already exists as shown in Figure 4-1, step ..2 .
Simultaneously, the new value being written into the CR3 is compared with the current
CR3 value from the CCR. If the new CR3 value is different from the current CR3 value,
it is deduced that the TLB flush was triggered by a context switch. The TMT is searched
for the new CR3 value. If it exists in the TMT, that TMT entry is copied into the Current
70

Context Register. On the other hand, if the CR3 value of P2 is not found in the TMT, it
is inserted into a free slot in the TMT and a VASI assigned to it. Then, this TMT entry is
copied into the CCR. Once the CCR is populated with the CR3 and the tags of P2, any
TLB lookup will hit only if the TLB entry belongs to P2 and matches the tags in the CCR.
Thus, in both these cases, updating of the CCR is equivalent to flushing the TLB and the
actual TLB flush can be avoided.
A situation may arise during a context switch from P1 to P2 where the CR3 of P2 is
not in the TMT and, due to limited capacity, there are no free entries in the TMT. In this
case a victim TMT entry, (CR33,SID3,VASI3) belonging to P3, in accordance with First
In First Out (FIFO) replacement policy. The CR3 and SID values of P2 replace CR33 and
SID3 while VASI3 is reused for P2. To avoid the TLB entries of P3 being used for P2, the
entries with the VASI3 are flushed, as seen in Figure 4-1, step ..3 . This flush, caused by
the lack of capacity in the Tag Manager Table, is termed a Capacity Flush.
Since the latency for examining every TLB entry and flushing only those entries
with tag VASI3 may be prohibitive, the capacity flush is implemented as a full TLB flush.
However, the downside of such an implementation is the eviction of TLB entries whose
tags are not VASI3, thereby potentially increasing the TLB miss rate. Moreover, ISA
extensions [28] for flushing entries with a specific tag and the hardware to implement
this instruction without a prohibitive latency are being introduced in modern processors.
With such extensions, the capacity flush may be implemented as a selective flush and
not result in the entire TLB being flushed.
Apart from context switches, TLB flushes may also be triggered by changes in the
page tables. Whenever page tables are modified, any entry cached in the TLB which
is affected by this change should be flushed from the TLB to maintain consistency
between the TLB and the page tables. In both non-virtualized (Linux) and virtualized
(Xen) systems, consistency is maintained by flushing the entire TLB. On examining the
source code of both Linux and Xen, it is found that this flush is effected by a two step
71
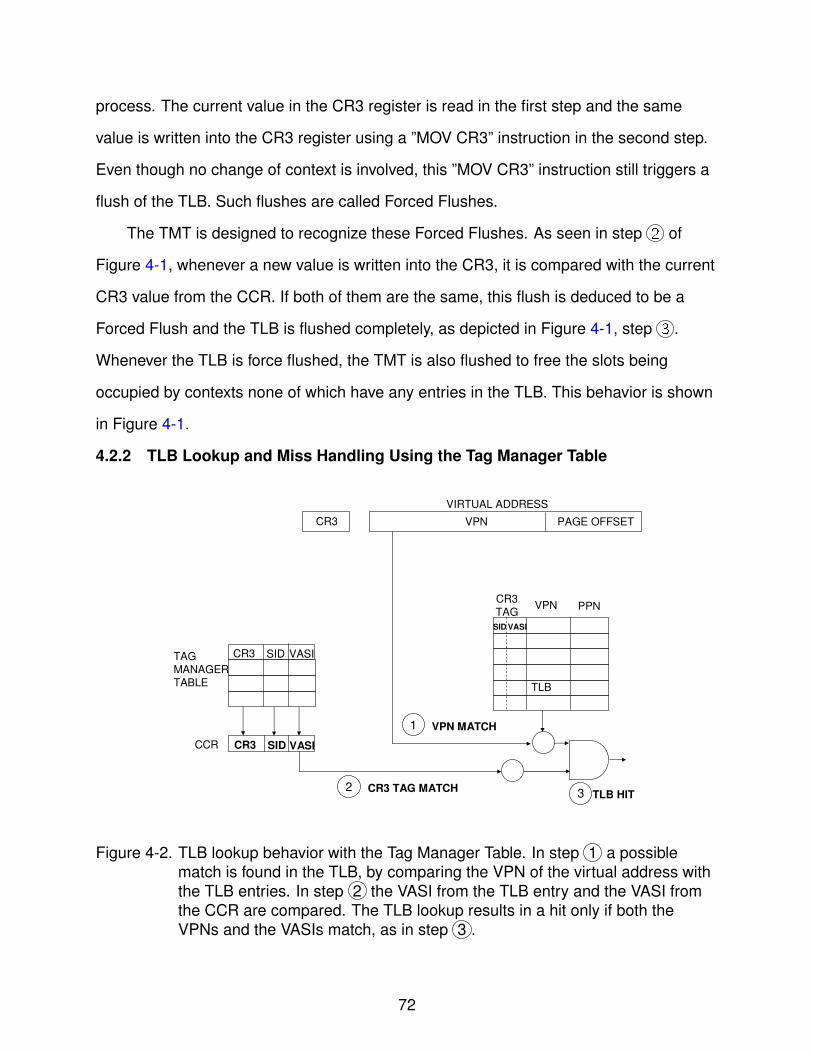
process. The current value in the CR3 register is read in the first step and the same
value is written into the CR3 register using a ”MOV CR3” instruction in the second step.
Even though no change of context is involved, this ”MOV CR3” instruction still triggers a
flush of the TLB. Such flushes are called Forced Flushes.
The TMT is designed to recognize these Forced Flushes. As seen in step ..2 of
Figure 4-1, whenever a new value is written into the CR3, it is compared with the current
CR3 value from the CCR. If both of them are the same, this flush is deduced to be a
Forced Flush and the TLB is flushed completely, as depicted in Figure 4-1, step ..3 .
Whenever the TLB is force flushed, the TMT is also flushed to free the slots being
occupied by contexts none of which have any entries in the TLB. This behavior is shown
in Figure 4-1.
4.2.2 TLB Lookup and Miss Handling Using the Tag Manager Table
CR3
CR3 SIDTAG
MANAGER
TABLE
CR3 SID
VASI
VASICCR
VPN MATCH1
2 CR3 TAG MATCH3 TLB HIT
VIRTUAL ADDRESS
PAGE OFFSETVPN
CR3
TAG
VASISID
TLB
VPN PPN
Figure 4-2. TLB lookup behavior with the Tag Manager Table. In step ..1 a possiblematch is found in the TLB, by comparing the VPN of the virtual address withthe TLB entries. In step ..2 the VASI from the TLB entry and the VASI fromthe CCR are compared. The TLB lookup results in a hit only if both theVPNs and the VASIs match, as in step ..3 .
72

The TLB lookup happens as shown in Figure 4-2. The TLB is searched for any
entry which has the same VPN as the virtual address. Simultaneously, the VASI of the
current context is looked up from the CCR. The entry is declared as a hit only when its
VASI matches the VASI in the CCR and the VPN is the same as the VPN in the virtual
address being looked up. Since the CCR is dedicated register, the VASI can be looked
up with minimum latency. It should be noted that the comparison of the VASI happens in
parallel with the VPN comparison, as shown in Figure 4-1. Thus no additional latency is
imposed by the TMT in the critical TLB lookup path. If the lookup results in a miss, the
page walk proceeds to determine the physical address from the page tables. Once this
translation is obtained, it is added in the TLB along with the CR3 tag (SID and VASI) of
the current context.
One issue with enabling TLB sharing, as with caches which are indexed using
virtual addresses, is aliasing [95]. Aliasing is the situation where the same translation
may be cached once for every process’s address space, thus creating multiple copies of
the same entry. Such situations arise typically with Global entries which are translations
for virtual addresses in the 3GB-4GB range belonging to the kernel. For instance, the
entries corresponding to the high memory range in Linux are valid in all process address
spaces and are marked using the Global bit in the TLB entries. To avoid multiple copies
of such Global entries with different VASI tags to exist, the TLB lookup logic is modified
to ”hit” when either the VASI of the entry matches with the VASI in the CCR or the if
the Global bit in the entry is set. This ensures that only one copy of Global entries are
cached in the tagged TLB.
While the preceding explanation of the TMT is for x86 processors without hardware
virtualization support, it can be used for processors with Extended/Nested page tables
(EPT/NPT) [36, 37, 48] with minor modifications. In a processor with EPT/NPT support,
as described in Section 2.3.3, both the guest and host CR3 values are cached in the
TMT entry ensuring that the CR3 tag will still be unique per process address space.
73

4.3 Modeling the Tag Manager Table
The TMT and the process-specific tagged TLB are modeled using the generic
tagged TLB simulation model described in Section 3.2. The functionality of the TMT
is mapped to the GMT module. Thus, the TLB flush on every MOV CR3 instruction is
intercepted by the GMT module which performs the necessary changes in the TMT and
uses the TMT functionality to decide whether this flush should be carried out or avoided.
Similarly, the CCR is mapped to the TagCache which gets updated on every MOV CR3
instruction. Since the TMT is designed to perform the tag comparison without imposing
any additional delay during the TLB lookup, the TLB lookup latencies are maintained at
the same values when simulating the regular TLB and the tagged TLB. The modeling of
the TMT is validated using the Functional Check mode described in Section 3.2.
4.4 Impact of the Tag Manager Table
In this section, the benefit of using the Tag Manager Table is evaluated using three
metrics, similar to those used in Section 3.5, namely: 1. the number of flushes 2. the
ITLB and DTLB miss rates, and 3. the increase in workload performance.
4.4.1 Reduction in TLB Flushes Due to the TMT
In a generic cache memory, the size of the cache is the main determinant of the
miss rate. When a workload begins to execute, there will be a few misses as the data is
brought into the cache for the very first time. Such misses are termed as cold misses.
Beyond this warmup phase, for an infinitely large cache, all the required data will be
contained in the cache and the hit rate will asymptotically reach 100%. However, the
situation is not the same for TLBs.
Apart from the size, one of the main determinants for the TLB hit rate is the
frequency at which the TLB is flushed. In TLBs where no tags are used, the hit rate
in the TLB is limited, because of shortened life span of the entries. Even in the case of
TLBs with unlimited size, the hit rate is still limited due to the periodic purging of the TLB.
The benefit of using an identifier to tag the TLB is in avoiding flushes and lowering the
74
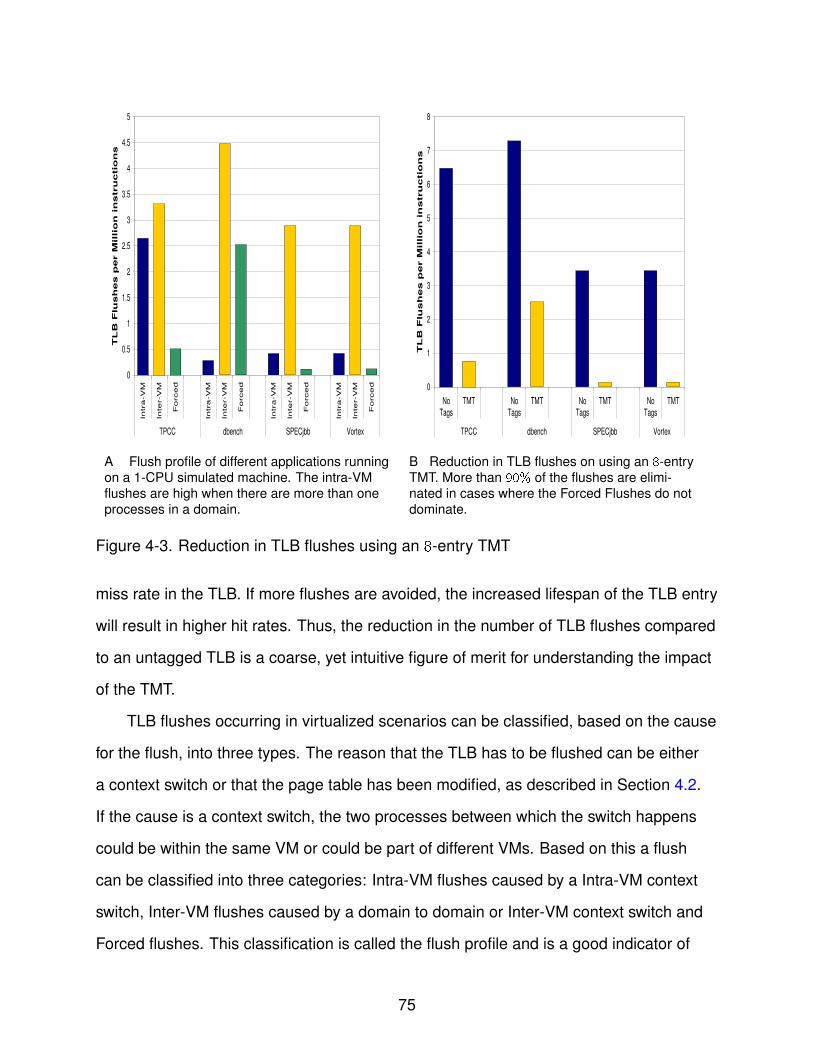
0
0.5
1
1.5
2
2.5
3
3.5
4
4.5
5
Intr
a-V
M
Inte
r-V
M
Fo
rce
d
Intr
a-V
M
Inte
r-V
M
Fo
rce
d
Intr
a-V
M
Inte
r-V
M
Fo
rce
d
Intr
a-V
M
Inte
r-V
M
Fo
rce
d
TPCC dbench SPECjbb Vortex
TL
B F
lush
es p
er M
illi
on
in
stru
ctio
ns
A Flush profile of different applications runningon a 1-CPU simulated machine. The intra-VMflushes are high when there are more than oneprocesses in a domain.
0
1
2
3
4
5
6
7
8
No
Tags
TMT No
Tags
TMT No
Tags
TMT No
Tags
TMT
TPCC dbench SPECjbb Vortex
TL
B F
lus
he
s p
er M
illi
on
in
stru
ctio
ns
B Reduction in TLB flushes on using an 8-entryTMT. More than 90% of the flushes are elimi-nated in cases where the Forced Flushes do notdominate.
Figure 4-3. Reduction in TLB flushes using an 8-entry TMT
miss rate in the TLB. If more flushes are avoided, the increased lifespan of the TLB entry
will result in higher hit rates. Thus, the reduction in the number of TLB flushes compared
to an untagged TLB is a coarse, yet intuitive figure of merit for understanding the impact
of the TMT.
TLB flushes occurring in virtualized scenarios can be classified, based on the cause
for the flush, into three types. The reason that the TLB has to be flushed can be either
a context switch or that the page table has been modified, as described in Section 4.2.
If the cause is a context switch, the two processes between which the switch happens
could be within the same VM or could be part of different VMs. Based on this a flush
can be classified into three categories: Intra-VM flushes caused by a Intra-VM context
switch, Inter-VM flushes caused by a domain to domain or Inter-VM context switch and
Forced flushes. This classification is called the flush profile and is a good indicator of
75

the gain that can be achieved by using a tagged TLB. For instance, if the forced flushes
dominate, then, irrespective of whether process-specific tags or domain-specific tags
are used, the TLB will still be frequently flushed. In such cases, the number of flushes
that can be avoided will be small, leading to smaller gains from using tagged TLBs. On
the other hand, using tags will reap significant benefits when the context switch flushes,
which can be avoided, dominate.
The flush profiles of the four workloads mentioned in Section 3.3.1, running on a
simulated x86 machine with one CPU and one domU, are presented in Figure 4-3A. It
can be observed that TPCC-UVa, which is a typical server workload, has a significant
number of context switch flushes, about 92%. Out of these, the number of intra-VM
and inter-VM context switch flushes are almost equal. However, in the case of
single-process workloads such as SPECjbb and Vortex, inter-VM flushes dominate
the profile compared to intra-VM flushes. Moreover, since the only activity performed by
dbench is file reads and writes, it is more I/O-intensive than TPCC-UVa. Hence, most of
the flushes it experiences are due to the transitions between domU and dom0 for access
to the privilege device drivers residing on dom0 and due to the forced flushes resulting
from the actual transfer of data to/from the disk. Thus, the intra-VM flushes constitute
only 2.5% of the total flushes for dbench.
The advantage of using the TMT and process-specific tags is that, both inter-VM
and intra-VM flushes can be avoided. From the reduction in the TLB flushes for these
workloads using an 8-entry TMT as shown in Figure 4-3B, it is seen that about 96%
of the flushes for SPECjbb and Vortex are avoided, even though the inter-VM flushes
dominate for these workloads. In cases where there are a substantial number of
intra-VM flushes, as in TPCC-UVa, almost 90% of the flushes are eliminated. If, on the
other hand, domain-specific tags were used, only about 50% of the flushed would have
been eliminated. The reduction in the TLB flushes is smaller only for dbench, where 35%
76
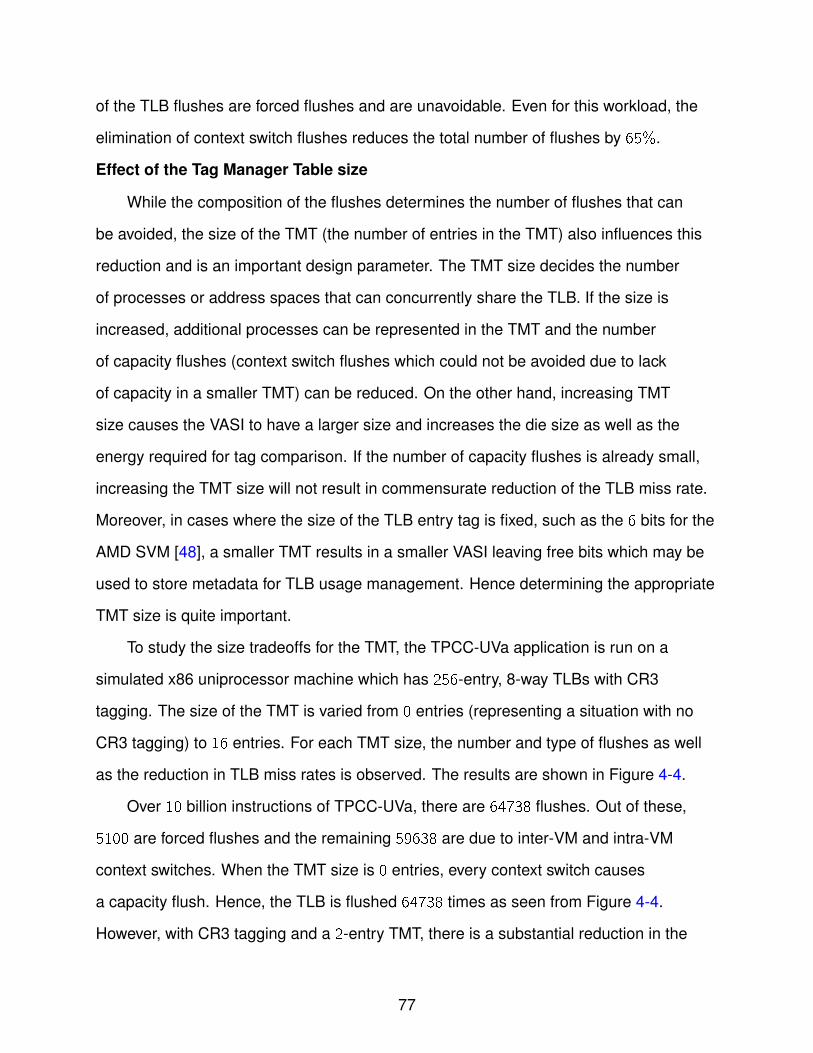
of the TLB flushes are forced flushes and are unavoidable. Even for this workload, the
elimination of context switch flushes reduces the total number of flushes by 65%.
Effect of the Tag Manager Table size
While the composition of the flushes determines the number of flushes that can
be avoided, the size of the TMT (the number of entries in the TMT) also influences this
reduction and is an important design parameter. The TMT size decides the number
of processes or address spaces that can concurrently share the TLB. If the size is
increased, additional processes can be represented in the TMT and the number
of capacity flushes (context switch flushes which could not be avoided due to lack
of capacity in a smaller TMT) can be reduced. On the other hand, increasing TMT
size causes the VASI to have a larger size and increases the die size as well as the
energy required for tag comparison. If the number of capacity flushes is already small,
increasing the TMT size will not result in commensurate reduction of the TLB miss rate.
Moreover, in cases where the size of the TLB entry tag is fixed, such as the 6 bits for the
AMD SVM [48], a smaller TMT results in a smaller VASI leaving free bits which may be
used to store metadata for TLB usage management. Hence determining the appropriate
TMT size is quite important.
To study the size tradeoffs for the TMT, the TPCC-UVa application is run on a
simulated x86 uniprocessor machine which has 256-entry, 8-way TLBs with CR3
tagging. The size of the TMT is varied from 0 entries (representing a situation with no
CR3 tagging) to 16 entries. For each TMT size, the number and type of flushes as well
as the reduction in TLB miss rates is observed. The results are shown in Figure 4-4.
Over 10 billion instructions of TPCC-UVa, there are 64738 flushes. Out of these,
5100 are forced flushes and the remaining 59638 are due to inter-VM and intra-VM
context switches. When the TMT size is 0 entries, every context switch causes
a capacity flush. Hence, the TLB is flushed 64738 times as seen from Figure 4-4.
However, with CR3 tagging and a 2-entry TMT, there is a substantial reduction in the
77
1
10
100
1000
10000
100000
0-entry TMT 2-entry TMT 4-entry TMT 8-entry TMT 16-entry TMT
Num
ber
of F
lush
es p
er 1
0B in
stru
ctio
ns (L
og
Sca
le)
0
5
10
15
20
25
30
35
40
45
50
Red
uctio
n (%
)
Capacity Flushes Forced Flushes DTLB MPKI Reduction ITLB MPKI Reduction
Figure 4-4. Effect of Tag Manager Table size on the reduction in number of flushes. Thenumber of flushes for TPCC-UVa for 10 billion x86 instructions is shown inthe left Y axis using a log scale. The reduction in DTLB and ITLB miss ratesfor a 256-entry 8-way TLB is shown in the right Y axis. While increasing theTMT size till 8 entries reduces the total number of flushes and the miss rate,further increase does not reduce the total number of flushes significantly andtherefore does not reduce the miss rate.
number of flushes from 64738 to 29484, as the number of capacity flushes reduce by
more than 50%. This reduces the miss rate, by about 25% for the DTLB and 30% for the
ITLB. Further scaling up the TMT size, however, gives diminishing returns and any size
beyond 8 entries does not substantially reduce the miss rate, even though the capacity
flushes are reduced. This is because, at TMT sizes larger than 8 entries, the dominant
type of flush is the forced flush and not the capacity flush. Even if the capacity flushes
are reduced by having a larger TMT, the forced flushes still periodically flush the TLB
limiting the lifetime of the entries. The simulations are repeated with SPECjbb, Vortex
and dbench. In all the cases, it is found that an 8-entry Tag Manager Table is sufficient to
ensure that the number of capacity flushes is much smaller than the forced flushes.
78
4.4.2 Reduction in TLB Miss Rate Due to the TMT
While the reduction in the number of flushes is a coarse metric and provides some
insight into the advantage of using process-specific tags, it is not sufficient to investigate
the benefit of the TMT thoroughly. For instance, if the flush profile for a workload is
such that it experiences no intra-VM flushes, using either process-specific tags or
domain-specific tags will avoid the same number of flushes. However, domain-specific
tagging solutions such as qTLB [18] can retain only the hypervisor’s TLB entries across
context switches. Using process-specific tags such as the CR3 tags can retain all
entries. Thus, though the same number of flushes are avoided, using process-specific
tags may result in lower TLB miss rate.
In order to capture such difference, the reduction in TLB miss rate when using the
TMT compared to using untagged TLB is used. This metric is quantified as Reduction,
as shown in Equation 4–1, and is expressed as a percentage of the untagged TLB miss
rate. The advantage of using Reduction is its high sensitivity to any TLB or TMT related
changes and insensitivity to changes in other architectural subsystems such as the
cache.
Reduction (%) = 100×(1− TLB miss rate with tags
TLB miss rate without tags
)(4–1)
The benefit of not flushing the TLB when switching from process P1 to P2 depends
on the amount of TLB that is being used by P2. If P2 requires a large TLB space, any
of P1’s entries which survived the TLB flush will still be evicted to make space for P2’s
entries. In such cases, the reduction in the TLB miss rate due to tagging will be very
small. Thus, the maximum benefit from tagging can be obtained when the TLB is large
enough to accommodate the entries of both P1 and P2. On the other hand, a large TLB
will consume valuable chip real estate which may be utilized better by other subsystems,
such as a larger L1 cache. Thus, the TLB size should be made sufficiently large to
optimize the reduction of the miss rate due to CR3 tagging, but no larger.
79
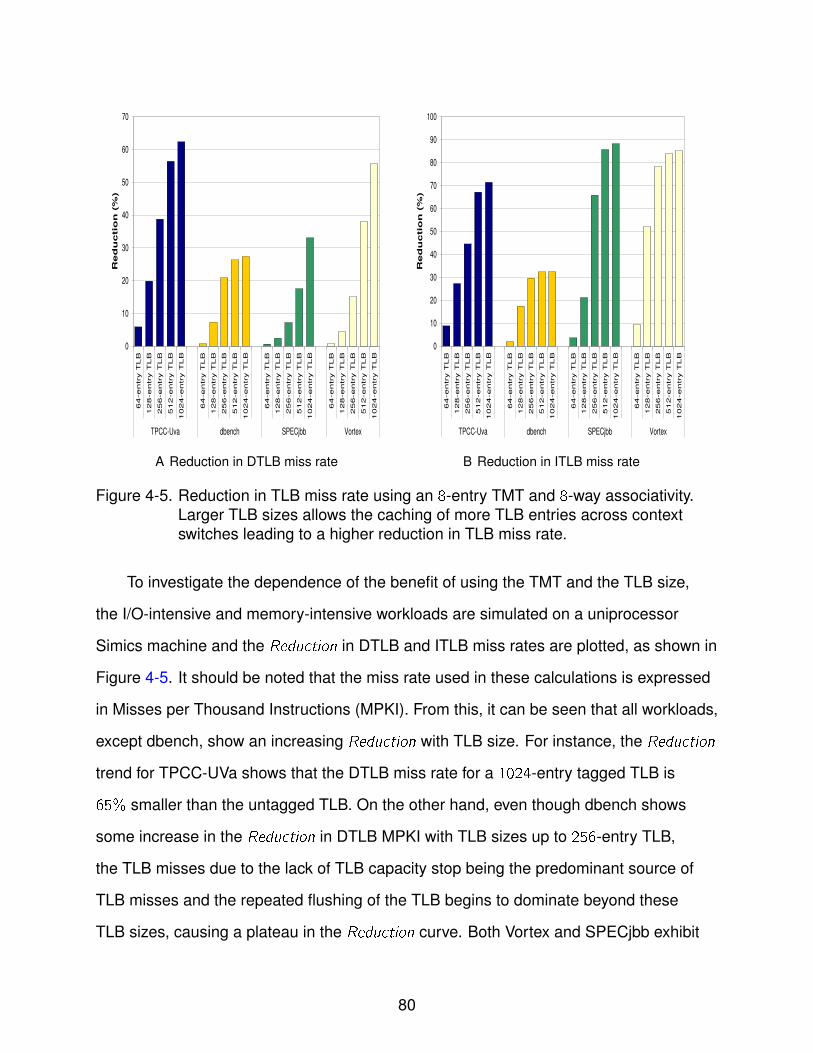
0
10
20
30
40
50
60
70
64
-e
ntr
y T
LB
12
8-e
ntr
y T
LB
25
6-e
ntr
y T
LB
51
2-e
ntr
y T
LB
10
24
-e
ntr
y T
LB
64
-e
ntr
y T
LB
12
8-e
ntr
y T
LB
25
6-e
ntr
y T
LB
51
2-e
ntr
y T
LB
10
24
-e
ntr
y T
LB
64
-e
ntr
y T
LB
12
8-e
ntr
y T
LB
25
6-e
ntr
y T
LB
51
2-e
ntr
y T
LB
10
24
-e
ntr
y T
LB
64
-e
ntr
y T
LB
12
8-e
ntr
y T
LB
25
6-e
ntr
y T
LB
51
2-e
ntr
y T
LB
10
24
-e
ntr
y T
LB
TPCC-Uva dbench SPECjbb Vortex
Red
uctio
n (
%)
A Reduction in DTLB miss rate
0
10
20
30
40
50
60
70
80
90
100
64
-e
ntr
y T
LB
12
8-e
ntr
y T
LB
25
6-e
ntr
y T
LB
51
2-e
ntr
y T
LB
10
24
-e
ntr
y T
LB
64
-e
ntr
y T
LB
12
8-e
ntr
y T
LB
25
6-e
ntr
y T
LB
51
2-e
ntr
y T
LB
10
24
-e
ntr
y T
LB
64
-e
ntr
y T
LB
12
8-e
ntr
y T
LB
25
6-e
ntr
y T
LB
51
2-e
ntr
y T
LB
10
24
-e
ntr
y T
LB
64
-e
ntr
y T
LB
12
8-e
ntr
y T
LB
25
6-e
ntr
y T
LB
51
2-e
ntr
y T
LB
10
24
-e
ntr
y T
LB
TPCC-Uva dbench SPECjbb Vortex
Red
uctio
n (
%)
B Reduction in ITLB miss rate
Figure 4-5. Reduction in TLB miss rate using an 8-entry TMT and 8-way associativity.Larger TLB sizes allows the caching of more TLB entries across contextswitches leading to a higher reduction in TLB miss rate.
To investigate the dependence of the benefit of using the TMT and the TLB size,
the I/O-intensive and memory-intensive workloads are simulated on a uniprocessor
Simics machine and the Reduction in DTLB and ITLB miss rates are plotted, as shown in
Figure 4-5. It should be noted that the miss rate used in these calculations is expressed
in Misses per Thousand Instructions (MPKI). From this, it can be seen that all workloads,
except dbench, show an increasing Reduction with TLB size. For instance, the Reduction
trend for TPCC-UVa shows that the DTLB miss rate for a 1024-entry tagged TLB is
65% smaller than the untagged TLB. On the other hand, even though dbench shows
some increase in the Reduction in DTLB MPKI with TLB sizes up to 256-entry TLB,
the TLB misses due to the lack of TLB capacity stop being the predominant source of
TLB misses and the repeated flushing of the TLB begins to dominate beyond these
TLB sizes, causing a plateau in the Reduction curve. Both Vortex and SPECjbb exhibit
80

Reduction curves with a high slope, even for 1024-entry TLB, indicating that further
increase in the TLB size may achieve even lower DTLB miss rate.
The Reduction trends for ITLB miss rate, shown in Figure 4-5B is markedly different
from the DTLB Reduction trends. The space required in the ITLB is smaller than the
DTLB space requirements due to the instruction memory footprint for these workloads
being smaller than the data memory footprint. As a result, the major difference from
the DTLB trend is that the reduction in ITLB miss rate is significantly larger for any
given TLB size that the reduction in the DTLB miss rate. Moreover, while the Reduction
in DTLB is low for SPECjbb and Vortex due to their memory-intensive nature, the
Reduction in ITLB miss rate is significantly high. It can also be observed that, in spite of
the small instruction memory footprint, the repeated forced flushing of the TLB causes
the Reduction in ITLB miss rate for dbench to be limited.
TLB associativity
Another important TLB design parameter is the associativity. Increasing the
associativity will reduce the conflict misses in the TLB. However, larger associativity
values necessitate more comparators in the TLB lookup hardware to match the
VPN, thereby increasing the area and power requirements. Hence, it is important to
understand the effect that the TLB associativity has on the reduction in miss rate due to
CR3 tagging.
On simulating TPCC-UVa, with an 8-entry TMT and tagged TLB of varying
associativity values, and plotting the Reduction trend, as shown in Figure 4-6A and
Figure 4-6B, it can be observed that the associativity has little effect on the Reduction.
There is some additional Reduction in the miss rate when the associativity is changed
from 4-way to 8-way, but any further increase in the set size does not vary the Reduction
by a large value. This analysis is also performed for the other workloads and similar
response to changing associativity is observed. Thus, by setting the associativity value
81

0
10
20
30
40
50
60
70
64-entry TLB 128-entry TLB 256-entry TLB 512-entry TLB 1024-entry TLB
Re
du
ctio
n (
%)
4-way 8-way 16-way 32-way 64-way Fully-associative
A Reduction in DTLB miss rate
0
10
20
30
40
50
60
70
80
64-entry TLB 128-entry TLB 256-entry TLB 512-entry TLB 1024-entry TLBR
ed
uctio
n (
%)
4-way 8-way 16-way 32-way 64-way Fully-associative
B Reduction in ITLB miss rate
Figure 4-6. Effect of TLB associativity on the reduction in miss rate with an 8-entry TMT.While increasing the associativity from 4-way to 8-way shows someadditional increase in the reduction in TLB miss rates, higher associativityvalues do not make a significant difference.
at 8, the benefit of using the TMT can be obtained without a high area and power
overhead.
4.4.3 Increase in Workload Performance Due to the TMT
The most important end result of using the TMT is the improvement in the
performance of virtualized workloads. However, Reduction is not sufficient to understand
this improvement. To quantify this performance improvement, workloads are first run
on the framework described in Section 3.2 with an untagged regular TLB model, and
the Instructions per Cycle (IPC) (IPCRegular TLB) from this simulation is noted. Then, the
workloads are simulated using the tagged TLB model augmented with the TMT and
the IPC (IPCTMT TLB) is noted. The reduction in TLB misses on using the tagged TLB
is reflected in IPCTMT TLB being higher than the IPCRegular TLB and this Increase in IPC
82

(IIPC ), as shown in Equation 4–2, gives the impact of the TMT on the performance of
the workloads. The greater the number of TLB misses avoided by the TMT, larger is the
value of IIPC .
The theoretical maximum value of IIPC may be obtained when the TLB behaves
like an ideal TLB, as explained in Section 3.5.3, and experiences no TLB misses. In
this case, the TLB-induced delay, i.e., the latency due to TLB misses and subsequent
page walks, is completely eliminated. By simulating the workloads with an ideal TLB
model (no TLB misses and no latency due to page walks) and observing the IPC, this
maximum achievable IIPC (IPCIdeal TLB) can be obtained. Expressing the IIPC achieved
using the tagged TLB as a percentage of this maximum achievable IIPC , as shown in
Equation 4–2, gives the Impact Factor IF of the TMT. This IF gives an insight into the
performance benefit of the TMT architecture. For instance, an IF of 50% implies that
the TMT improves the IIPC by 50% of the increase achievable by any TLB architecture
(including the ideal TLB), or that the impact of the TLB delay on overall performance has
been reduced by 50%.
IIPC = 100×(
IPCTMT TLB
IPCRegular TLB
− 1
)IF = 100×
(IPCTMT TLB − IPCRegular TLB
IPCIdeal TLB − IPCRegular TLB
)(4–2)
Using IPC based metrics to understand the performance impact of TMT has the
advantage of being applicable to all types of workloads, especially when it is not feasible
to run the workload benchmarks to completion. Moreover, avoiding TLB misses will
reduce the time spent by the CPU waiting for page walks to complete and using IPC
is appropriate for estimating this reduction. However, it is also important to understand
the implications of using the TMT with user-observable performance metrics. For
this, SPECjbb is instrumented to indicate the completion of every transaction. This
83

number of transactions is used to estimate the throughput of SPECjbb and measure the
improvement in SPECjbb’s performance when the TMT is used.
To understand the improvement in performance due to the TMT, a single-CPU x86
machine is simulated using the framework described in Section 3.2 and the virtualized
workload is run on this x86 machine with either the ideal TLB, the regular TLB or the
tagged TLB with an 8-entry TMT. The IF and IIPC values for various TLB sizes and 8-way
associativity are calculated and presented in Figure 4-7.
As seen from Section 4.4.1, TPCC-UVa experiences approximately equal number
of inter-VM and intra-VM flushes and a much smaller number of forced flushes. Avoiding
these flushes using the TMT reduces the TLB miss rate and improves the IPC value, as
seen from Figure 4-7. Two factors which determine the TLB miss rate, and therefore the
delay due to TLB misses, are the TLB size and the frequency of TLB flushing. Figure 4-7
shows that scaling up the TLB size initially increases the IF and IIPC values due to a
reduction in the capacity misses in the TLB. For instance, IF for the 128-entry TLB is
almost four times that of the IF for the 64-entry TLB. However, the IF for 4096-entry TLB
is almost the same as for 1024-entry TLB. At these large TLB sizes, most of the required
translations are cached in the TLB and the dominant reason for the TLB-induced delay
is the TLB misses due to TLB flushes which does not change on increasing the TLB
size. Hence, the IF and IIPC do not vary significantly at these sizes. It is also clear that
the trend in IF is different from the Reduction trends for ITLB and DTLB miss rates.
dbench, as seen from Figure 4-7, shows an IF trend similar to TPCC-UVa, i.e.,
increasing rapidly for smaller TLB sizes and showing smaller increments at larger TLB
sizes. The significant difference is in the actual values of the Impact Factor IF . For
instance, the IF for dbench with a 1024 entry TLB and 60-cycle page walk latency is
22.04%, which is less than half of the 49.65% seen for TPCC-UVa. The reason for
this behavior is the flush profile of these workloads. Over a simulation run of 10 billion
x86 instructions, with CR3 tagging, dbench experiences 25263 flushes, all of which
84

0
1
2
3
4
5
6
7
8
64-e
ntry
TLB
128-
entry
TLB
256-
entry
TLB
512-
entry
TLB
1024
-ent
ry T
LB
4096
-ent
ry T
LB
64-e
ntry
TLB
128-
entry
TLB
256-
entry
TLB
512-
entry
TLB
1024
-ent
ry T
LB
4096
-ent
ry T
LB
64-e
ntry
TLB
128-
entry
TLB
256-
entry
TLB
512-
entry
TLB
1024
-ent
ry T
LB
4096
-ent
ry T
LB
64-e
ntry
TLB
128-
entry
TLB
256-
entry
TLB
512-
entry
TLB
1024
-ent
ry T
LB
4096
-ent
ry T
LB
TPCC-Uva dbench SPECjbb Vortex
I IPC (%
)
A Increase in IPC IIPC
0
10
20
30
40
50
60
70
80
90
64-e
ntry
TLB
128-
entry
TLB
256-
entry
TLB
512-
entry
TLB
1024
-ent
ry T
LB
4096
-ent
ry T
LB
64-e
ntry
TLB
128-
entry
TLB
256-
entry
TLB
512-
entry
TLB
1024
-ent
ry T
LB
4096
-ent
ry T
LB
64-e
ntry
TLB
128-
entry
TLB
256-
entry
TLB
512-
entry
TLB
1024
-ent
ry T
LB
4096
-ent
ry T
LB
64-e
ntry
TLB
128-
entry
TLB
256-
entry
TLB
512-
entry
TLB
1024
-ent
ry T
LB
4096
-ent
ry T
LB
TPCC-Uva dbench SPECjbb Vortex
IF (%
)
B Impact Factor IF
Figure 4-7. Increase in workload performance using an 8-entry TMT at PW of 60 cyclesand 8-way associativity. Using the TMT eliminates a significant fraction of theTLB-induced delay, except for dbench. The impact is limited for dbench dueto the predominance of forced flushes.
85
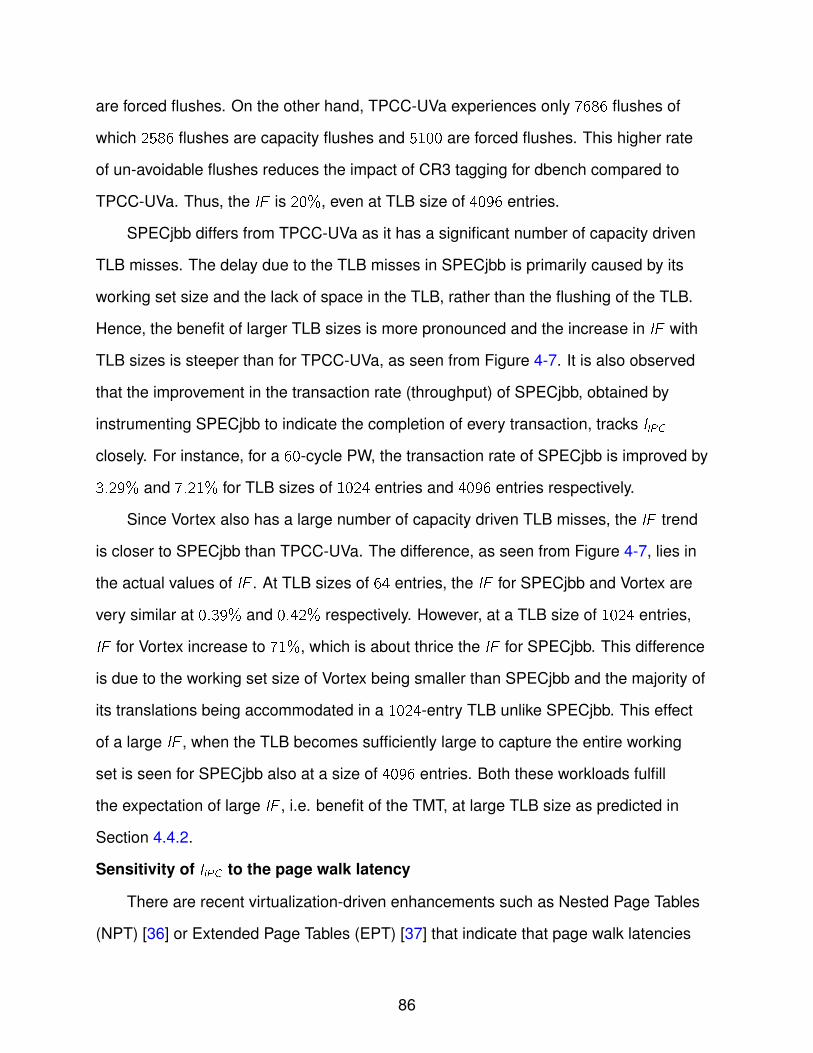
are forced flushes. On the other hand, TPCC-UVa experiences only 7686 flushes of
which 2586 flushes are capacity flushes and 5100 are forced flushes. This higher rate
of un-avoidable flushes reduces the impact of CR3 tagging for dbench compared to
TPCC-UVa. Thus, the IF is 20%, even at TLB size of 4096 entries.
SPECjbb differs from TPCC-UVa as it has a significant number of capacity driven
TLB misses. The delay due to the TLB misses in SPECjbb is primarily caused by its
working set size and the lack of space in the TLB, rather than the flushing of the TLB.
Hence, the benefit of larger TLB sizes is more pronounced and the increase in IF with
TLB sizes is steeper than for TPCC-UVa, as seen from Figure 4-7. It is also observed
that the improvement in the transaction rate (throughput) of SPECjbb, obtained by
instrumenting SPECjbb to indicate the completion of every transaction, tracks IIPC
closely. For instance, for a 60-cycle PW, the transaction rate of SPECjbb is improved by
3.29% and 7.21% for TLB sizes of 1024 entries and 4096 entries respectively.
Since Vortex also has a large number of capacity driven TLB misses, the IF trend
is closer to SPECjbb than TPCC-UVa. The difference, as seen from Figure 4-7, lies in
the actual values of IF . At TLB sizes of 64 entries, the IF for SPECjbb and Vortex are
very similar at 0.39% and 0.42% respectively. However, at a TLB size of 1024 entries,
IF for Vortex increase to 71%, which is about thrice the IF for SPECjbb. This difference
is due to the working set size of Vortex being smaller than SPECjbb and the majority of
its translations being accommodated in a 1024-entry TLB unlike SPECjbb. This effect
of a large IF , when the TLB becomes sufficiently large to capture the entire working
set is seen for SPECjbb also at a size of 4096 entries. Both these workloads fulfill
the expectation of large IF , i.e. benefit of the TMT, at large TLB size as predicted in
Section 4.4.2.
Sensitivity of IIPC to the page walk latency
There are recent virtualization-driven enhancements such as Nested Page Tables
(NPT) [36] or Extended Page Tables (EPT) [37] that indicate that page walk latencies
86
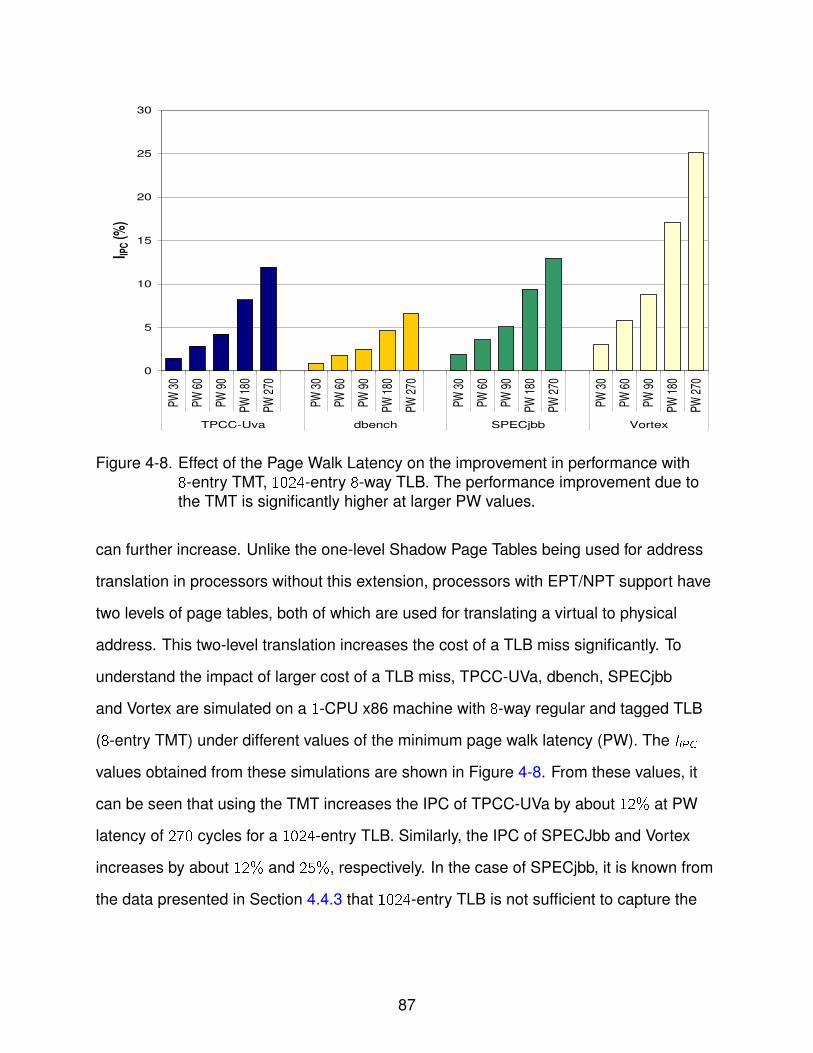
0
5
10
15
20
25
30
PW 3
0
PW 6
0
PW 9
0
PW 1
80
PW 2
70
PW 3
0
PW 6
0
PW 9
0
PW 1
80
PW 2
70
PW 3
0
PW 6
0
PW 9
0
PW 1
80
PW 2
70
PW 3
0
PW 6
0
PW 9
0
PW 1
80
PW 2
70
TPCC-Uva dbench SPECjbb Vortex
I IPC (%
)
Figure 4-8. Effect of the Page Walk Latency on the improvement in performance with8-entry TMT, 1024-entry 8-way TLB. The performance improvement due tothe TMT is significantly higher at larger PW values.
can further increase. Unlike the one-level Shadow Page Tables being used for address
translation in processors without this extension, processors with EPT/NPT support have
two levels of page tables, both of which are used for translating a virtual to physical
address. This two-level translation increases the cost of a TLB miss significantly. To
understand the impact of larger cost of a TLB miss, TPCC-UVa, dbench, SPECjbb
and Vortex are simulated on a 1-CPU x86 machine with 8-way regular and tagged TLB
(8-entry TMT) under different values of the minimum page walk latency (PW). The IIPC
values obtained from these simulations are shown in Figure 4-8. From these values, it
can be seen that using the TMT increases the IPC of TPCC-UVa by about 12% at PW
latency of 270 cycles for a 1024-entry TLB. Similarly, the IPC of SPECJbb and Vortex
increases by about 12% and 25%, respectively. In the case of SPECjbb, it is known from
the data presented in Section 4.4.3 that 1024-entry TLB is not sufficient to capture the
87
entire working set size. Though not shown in Figure 4-8, at PW of 270-cycles and a TLB
size of 4096 entries, the IIPC for SPECjbb increases to about 28%.
4.5 Architectural and Workload Parameters Affecting the Impact of the TMT
The impact of the Tag Manager Table is in reducing the TLB-induced delay and
thereby improving the performance of the virtualized workload. However, this impact
depends on a few hardware parameters and workload factors. These factors and their
influence on the improvement due to the TMT are presented in this section. These
factors and parameters are also prioritized depending on the significance of their
influence. It should be noted that, for the simulations presented in this section, Reduction
is used as the figure of merit as it is more sensitive than IIPC .
4.5.1 Architectural Parameters
While the architectural parameters that affect the TLB behavior and the benefit
of using the TMT are discussed in depth in Section 4.4, they are summarized in this
section.
• The size of the Tag Manager Table decides the number of context switch relatedTLB flushes that cannot be avoided due to lack of capacity in the TMT.
• The size of the TLB controls the number of TLB entries of different processes thatare retained across context switch boundaries when the associated TLB flushesare avoided.
• The associativity of the TLB, beyond 8-way set size, does not play a significantimpact on the benefit of using the TMT.
• The value of the minimum page walk latency (PW) influences the cost of TLBmisses, and therefore the benefit that is obtained from avoiding these misses usingthe TMT.
4.5.2 Workload Parameters
From the discussion in Section 4.4.2, it is evident that the TLB size is an important
parameter which affect the benefit that can be obtained from tagging. A small TLB will
experience capacity misses irrespective of whether tags are used to avoid flushes or
not. However, whether the size of the TLB is ”small” or ”large” depends on the workload
88
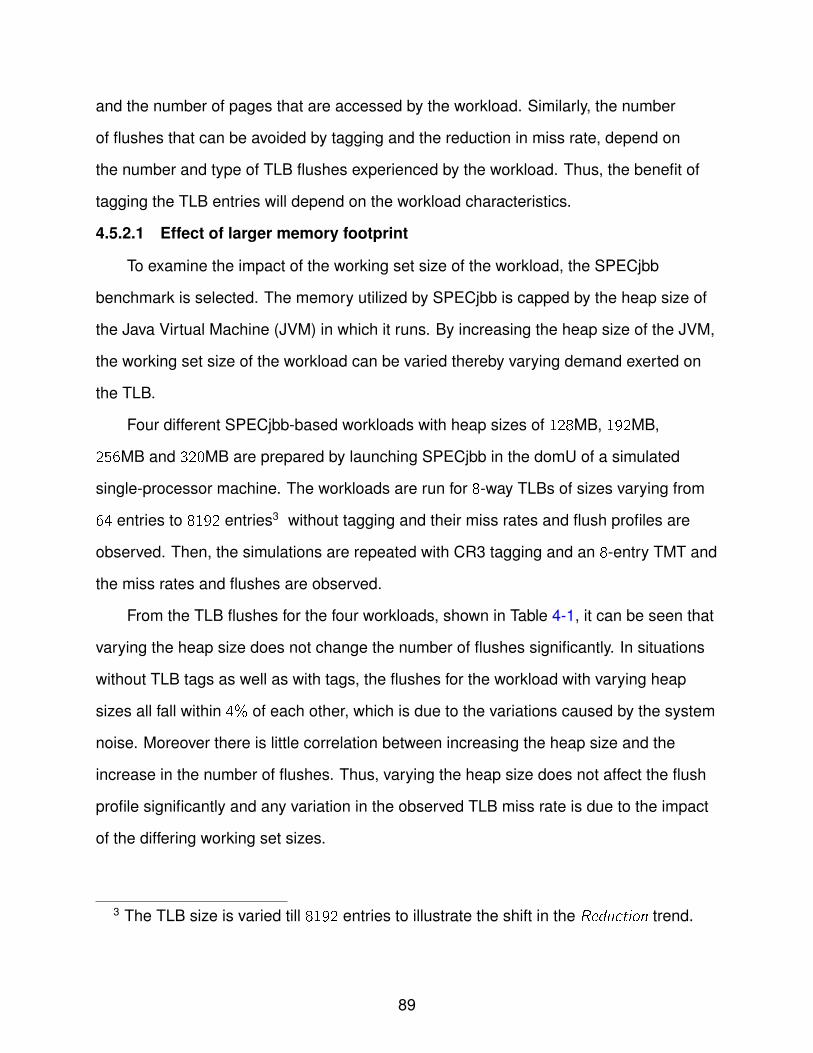
and the number of pages that are accessed by the workload. Similarly, the number
of flushes that can be avoided by tagging and the reduction in miss rate, depend on
the number and type of TLB flushes experienced by the workload. Thus, the benefit of
tagging the TLB entries will depend on the workload characteristics.
4.5.2.1 Effect of larger memory footprint
To examine the impact of the working set size of the workload, the SPECjbb
benchmark is selected. The memory utilized by SPECjbb is capped by the heap size of
the Java Virtual Machine (JVM) in which it runs. By increasing the heap size of the JVM,
the working set size of the workload can be varied thereby varying demand exerted on
the TLB.
Four different SPECjbb-based workloads with heap sizes of 128MB, 192MB,
256MB and 320MB are prepared by launching SPECjbb in the domU of a simulated
single-processor machine. The workloads are run for 8-way TLBs of sizes varying from
64 entries to 8192 entries3 without tagging and their miss rates and flush profiles are
observed. Then, the simulations are repeated with CR3 tagging and an 8-entry TMT and
the miss rates and flushes are observed.
From the TLB flushes for the four workloads, shown in Table 4-1, it can be seen that
varying the heap size does not change the number of flushes significantly. In situations
without TLB tags as well as with tags, the flushes for the workload with varying heap
sizes all fall within 4% of each other, which is due to the variations caused by the system
noise. Moreover there is little correlation between increasing the heap size and the
increase in the number of flushes. Thus, varying the heap size does not affect the flush
profile significantly and any variation in the observed TLB miss rate is due to the impact
of the differing working set sizes.
3 The TLB size is varied till 8192 entries to illustrate the shift in the Reduction trend.
89
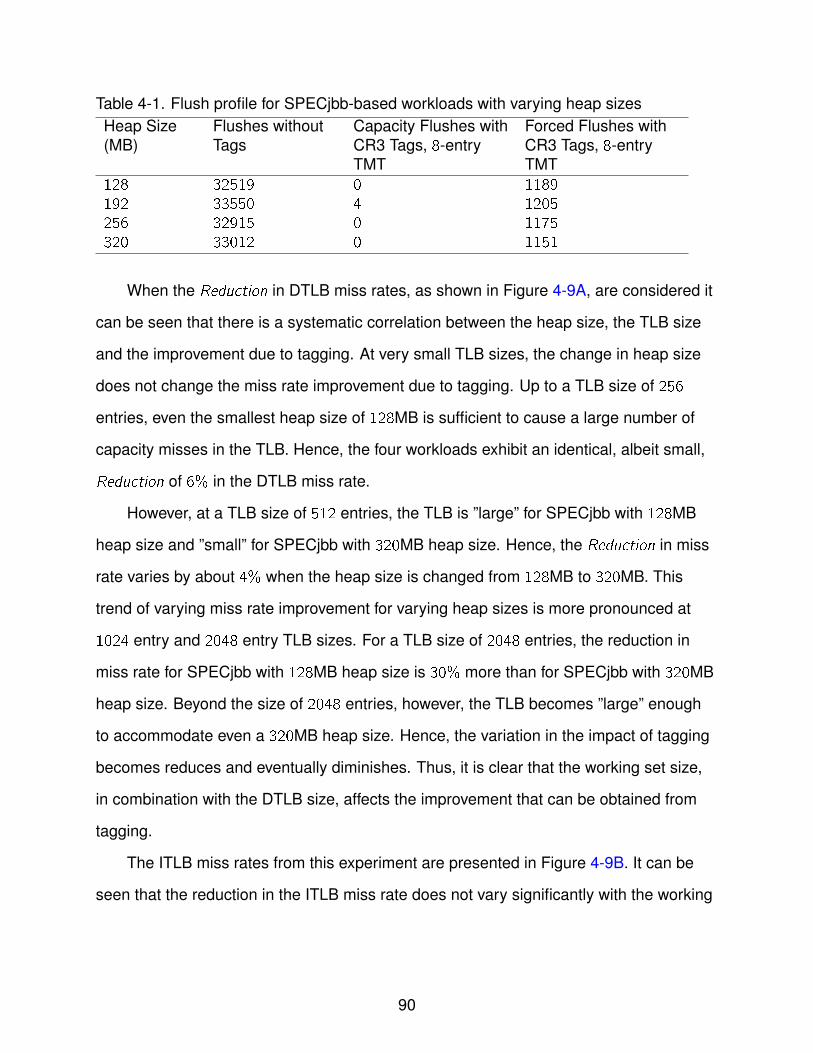
Table 4-1. Flush profile for SPECjbb-based workloads with varying heap sizesHeap Size(MB)
Flushes withoutTags
Capacity Flushes withCR3 Tags, 8-entryTMT
Forced Flushes withCR3 Tags, 8-entryTMT
128 32519 0 1189192 33550 4 1205256 32915 0 1175320 33012 0 1151
When the Reduction in DTLB miss rates, as shown in Figure 4-9A, are considered it
can be seen that there is a systematic correlation between the heap size, the TLB size
and the improvement due to tagging. At very small TLB sizes, the change in heap size
does not change the miss rate improvement due to tagging. Up to a TLB size of 256
entries, even the smallest heap size of 128MB is sufficient to cause a large number of
capacity misses in the TLB. Hence, the four workloads exhibit an identical, albeit small,
Reduction of 6% in the DTLB miss rate.
However, at a TLB size of 512 entries, the TLB is ”large” for SPECjbb with 128MB
heap size and ”small” for SPECjbb with 320MB heap size. Hence, the Reduction in miss
rate varies by about 4% when the heap size is changed from 128MB to 320MB. This
trend of varying miss rate improvement for varying heap sizes is more pronounced at
1024 entry and 2048 entry TLB sizes. For a TLB size of 2048 entries, the reduction in
miss rate for SPECjbb with 128MB heap size is 30% more than for SPECjbb with 320MB
heap size. Beyond the size of 2048 entries, however, the TLB becomes ”large” enough
to accommodate even a 320MB heap size. Hence, the variation in the impact of tagging
becomes reduces and eventually diminishes. Thus, it is clear that the working set size,
in combination with the DTLB size, affects the improvement that can be obtained from
tagging.
The ITLB miss rates from this experiment are presented in Figure 4-9B. It can be
seen that the reduction in the ITLB miss rate does not vary significantly with the working
90

0
10
20
30
40
50
60
70
80
12
8 M
B1
92
MB
25
6 M
B3
20
MB
12
8 M
B1
92
MB
25
6 M
B3
20
MB
12
8 M
B1
92
MB
25
6 M
B3
20
MB
12
8 M
B1
92
MB
25
6 M
B3
20
MB
12
8 M
B1
92
MB
25
6 M
B3
20
MB
12
8 M
B1
92
MB
25
6 M
B3
20
MB
12
8 M
B1
92
MB
25
6 M
B3
20
MB
12
8 M
B1
92
MB
25
6 M
B3
20
MB
64-entry
TLB
128-entry
TLB
256-entry
TLB
512-entry
TLB
1024-entry
TLB
2048-entry
TLB
4096-entry
TLB
8192-
entry
TLB
Red
uctio
n (
%)
A Reduction in DTLB miss rate
0
10
20
30
40
50
60
70
80
90
100
12
8 M
B1
92
MB
25
6 M
B3
20
MB
12
8 M
B1
92
MB
25
6 M
B3
20
MB
12
8 M
B1
92
MB
25
6 M
B3
20
MB
12
8 M
B1
92
MB
25
6 M
B3
20
MB
12
8 M
B1
92
MB
25
6 M
B3
20
MB
12
8 M
B1
92
MB
25
6 M
B3
20
MB
12
8 M
B1
92
MB
25
6 M
B3
20
MB
12
8 M
B1
92
MB
25
6 M
B3
20
MB
64-entry
TLB
128-entry
TLB
256-entry
TLB
512-entry
TLB
1024-entry
TLB
2048-entry
TLB
4096-entry
TLB
8192-
entry
TLBR
ed
uctio
n (
%)
B Reduction in ITLB miss rate
Figure 4-9. Effect of scaling the memory footprint on the reduction in TLB miss rate withan 8-entry TMT. The reduction in DTLB miss rate is affected by the memoryfootprint of the workload when the TLB size is between 512 entries and 2048entries. Outside this range, the TLB is either too small or large enough to notbe influenced by the memory footprint. The reduction in ITLB miss rate is notsignificantly affected by the memory footprint of the workload.
set size as increasing the heap size does not affect instruction footprint and the ITLB
usage significantly.
4.5.2.2 Effect of the number of processes in the workload
While varying the heap size changes the pressure exerted on the DTLB, it does not
stress the ITLB. However, on increasing the number of processes in a workload, each
of these processes will require a share in the ITLB and thereby increase the demand for
space in the ITLB. Thus, varying the number of processes in a multi-process application
will create different workloads which are suitable for investigating the relation between
the workload characteristics and the impact of the TMT in reducing the ITLB miss rate.
91
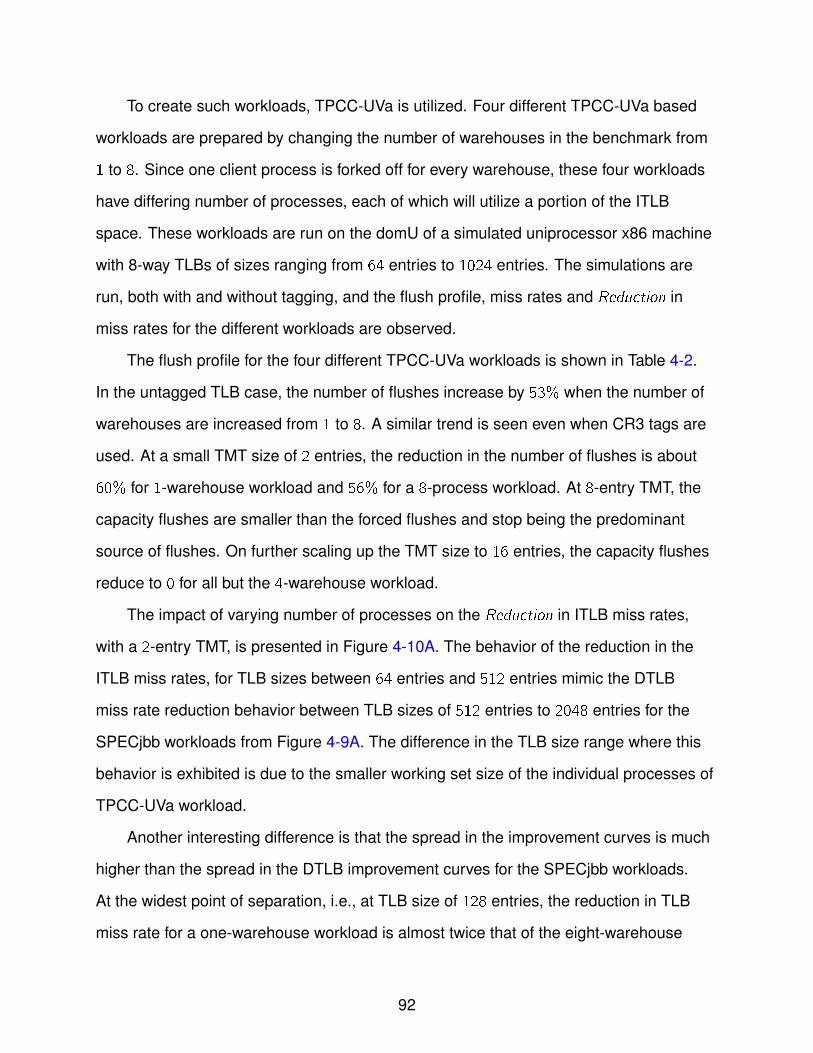
To create such workloads, TPCC-UVa is utilized. Four different TPCC-UVa based
workloads are prepared by changing the number of warehouses in the benchmark from
1 to 8. Since one client process is forked off for every warehouse, these four workloads
have differing number of processes, each of which will utilize a portion of the ITLB
space. These workloads are run on the domU of a simulated uniprocessor x86 machine
with 8-way TLBs of sizes ranging from 64 entries to 1024 entries. The simulations are
run, both with and without tagging, and the flush profile, miss rates and Reduction in
miss rates for the different workloads are observed.
The flush profile for the four different TPCC-UVa workloads is shown in Table 4-2.
In the untagged TLB case, the number of flushes increase by 53% when the number of
warehouses are increased from 1 to 8. A similar trend is seen even when CR3 tags are
used. At a small TMT size of 2 entries, the reduction in the number of flushes is about
60% for 1-warehouse workload and 56% for a 8-process workload. At 8-entry TMT, the
capacity flushes are smaller than the forced flushes and stop being the predominant
source of flushes. On further scaling up the TMT size to 16 entries, the capacity flushes
reduce to 0 for all but the 4-warehouse workload.
The impact of varying number of processes on the Reduction in ITLB miss rates,
with a 2-entry TMT, is presented in Figure 4-10A. The behavior of the reduction in the
ITLB miss rates, for TLB sizes between 64 entries and 512 entries mimic the DTLB
miss rate reduction behavior between TLB sizes of 512 entries to 2048 entries for the
SPECjbb workloads from Figure 4-9A. The difference in the TLB size range where this
behavior is exhibited is due to the smaller working set size of the individual processes of
TPCC-UVa workload.
Another interesting difference is that the spread in the improvement curves is much
higher than the spread in the DTLB improvement curves for the SPECjbb workloads.
At the widest point of separation, i.e., at TLB size of 128 entries, the reduction in TLB
miss rate for a one-warehouse workload is almost twice that of the eight-warehouse
92

Table 4-2. Flush Profile for TPCC-UVa based workloads with varying number ofprocesses and varying TMT sizes
TMT Size Number ofWarehousesprocesses
Flusheswithout Tags
CapacityFlushes withCR3 tags
ForcedFlusheswith CR3 tags
2
1 49692 18944 19152 54521 20876 26724 63480 24222 36708 76338 29327 4654
4
1 49692 4302 19152 54521 4928 26724 63480 6134 36708 76338 4654 4654
8
1 49692 400 19152 54521 610 26724 63480 959 36708 76338 1872 4654
16
1 49692 0 19152 54521 0 26724 63480 1 36708 76338 0 4654
workload. This is caused because, in addition to the variation caused by the differing
TLB demands, the number of flushes also varies significantly for the different workloads.
Thus, in addition to the TLB size, the TMT size is another parameter which may be
”large” or ”small” depending on the workload.
Increasing the TMT size will result in further reduction of the TLB miss rates. This
is shown in Figure 4-10B, where the reduction in ITLB miss rate for two extreme TMT
sizes of 2 entries and 16 entries is shown. From Table 4-2, it is clear that a 16 entry TMT
eliminates all but forced flushes. This is reflected in the miss rate of the 1-warehouse
workload for a 64 entry TLB reducing by 17% with an 16 entry TMT as compared to 14%
for a 2 entry TMT. This disparity increases as the TLB size increases and at 1024 entries
the one-warehouse TPCC-UVa’s reduction with 16 entry TMT is almost twice that with 2
entry TMT.
93
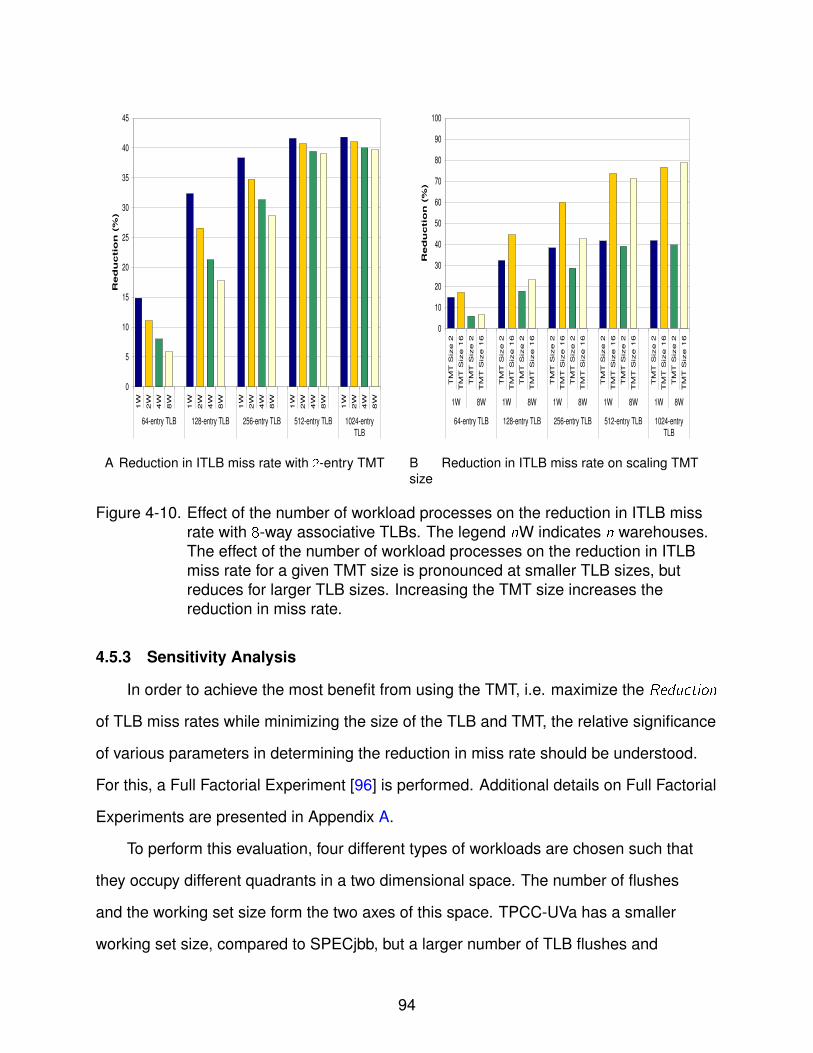
0
5
10
15
20
25
30
35
40
45
1W
2W
4W
8W
1W
2W
4W
8W
1W
2W
4W
8W
1W
2W
4W
8W
1W
2W
4W
8W
64-entry TLB 128-entry TLB 256-entry TLB 512-entry TLB 1024-entry
TLB
Red
uctio
n (
%)
A Reduction in ITLB miss rate with 2-entry TMT
0
10
20
30
40
50
60
70
80
90
100
TM
T S
ize
2
TM
T S
ize
16
TM
T S
ize
2
TM
T S
ize
16
TM
T S
ize
2
TM
T S
ize
16
TM
T S
ize
2
TM
T S
ize
16
TM
T S
ize
2
TM
T S
ize
16
TM
T S
ize
2
TM
T S
ize
16
TM
T S
ize
2
TM
T S
ize
16
TM
T S
ize
2
TM
T S
ize
16
TM
T S
ize
2
TM
T S
ize
16
TM
T S
ize
2
TM
T S
ize
16
1W 8W 1W 8W 1W 8W 1W 8W 1W 8W
64-entry TLB 128-entry TLB 256-entry TLB 512-entry TLB 1024-entry
TLBR
ed
uctio
n (
%)
B Reduction in ITLB miss rate on scaling TMTsize
Figure 4-10. Effect of the number of workload processes on the reduction in ITLB missrate with 8-way associative TLBs. The legend nW indicates n warehouses.The effect of the number of workload processes on the reduction in ITLBmiss rate for a given TMT size is pronounced at smaller TLB sizes, butreduces for larger TLB sizes. Increasing the TMT size increases thereduction in miss rate.
4.5.3 Sensitivity Analysis
In order to achieve the most benefit from using the TMT, i.e. maximize the Reduction
of TLB miss rates while minimizing the size of the TLB and TMT, the relative significance
of various parameters in determining the reduction in miss rate should be understood.
For this, a Full Factorial Experiment [96] is performed. Additional details on Full Factorial
Experiments are presented in Appendix A.
To perform this evaluation, four different types of workloads are chosen such that
they occupy different quadrants in a two dimensional space. The number of flushes
and the working set size form the two axes of this space. TPCC-UVa has a smaller
working set size, compared to SPECjbb, but a larger number of TLB flushes and
94
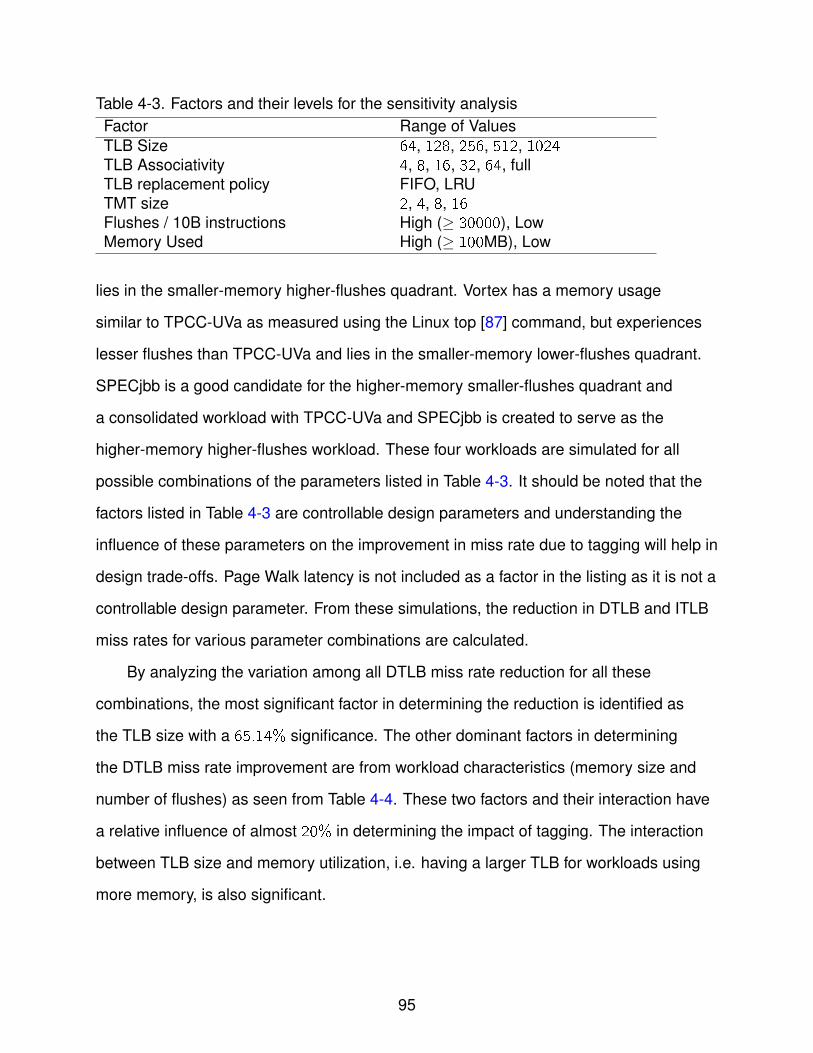
Table 4-3. Factors and their levels for the sensitivity analysisFactor Range of ValuesTLB Size 64, 128, 256, 512, 1024TLB Associativity 4, 8, 16, 32, 64, fullTLB replacement policy FIFO, LRUTMT size 2, 4, 8, 16Flushes / 10B instructions High (≥ 30000), LowMemory Used High (≥ 100MB), Low
lies in the smaller-memory higher-flushes quadrant. Vortex has a memory usage
similar to TPCC-UVa as measured using the Linux top [87] command, but experiences
lesser flushes than TPCC-UVa and lies in the smaller-memory lower-flushes quadrant.
SPECjbb is a good candidate for the higher-memory smaller-flushes quadrant and
a consolidated workload with TPCC-UVa and SPECjbb is created to serve as the
higher-memory higher-flushes workload. These four workloads are simulated for all
possible combinations of the parameters listed in Table 4-3. It should be noted that the
factors listed in Table 4-3 are controllable design parameters and understanding the
influence of these parameters on the improvement in miss rate due to tagging will help in
design trade-offs. Page Walk latency is not included as a factor in the listing as it is not a
controllable design parameter. From these simulations, the reduction in DTLB and ITLB
miss rates for various parameter combinations are calculated.
By analyzing the variation among all DTLB miss rate reduction for all these
combinations, the most significant factor in determining the reduction is identified as
the TLB size with a 65.14% significance. The other dominant factors in determining
the DTLB miss rate improvement are from workload characteristics (memory size and
number of flushes) as seen from Table 4-4. These two factors and their interaction have
a relative influence of almost 20% in determining the impact of tagging. The interaction
between TLB size and memory utilization, i.e. having a larger TLB for workloads using
more memory, is also significant.
95
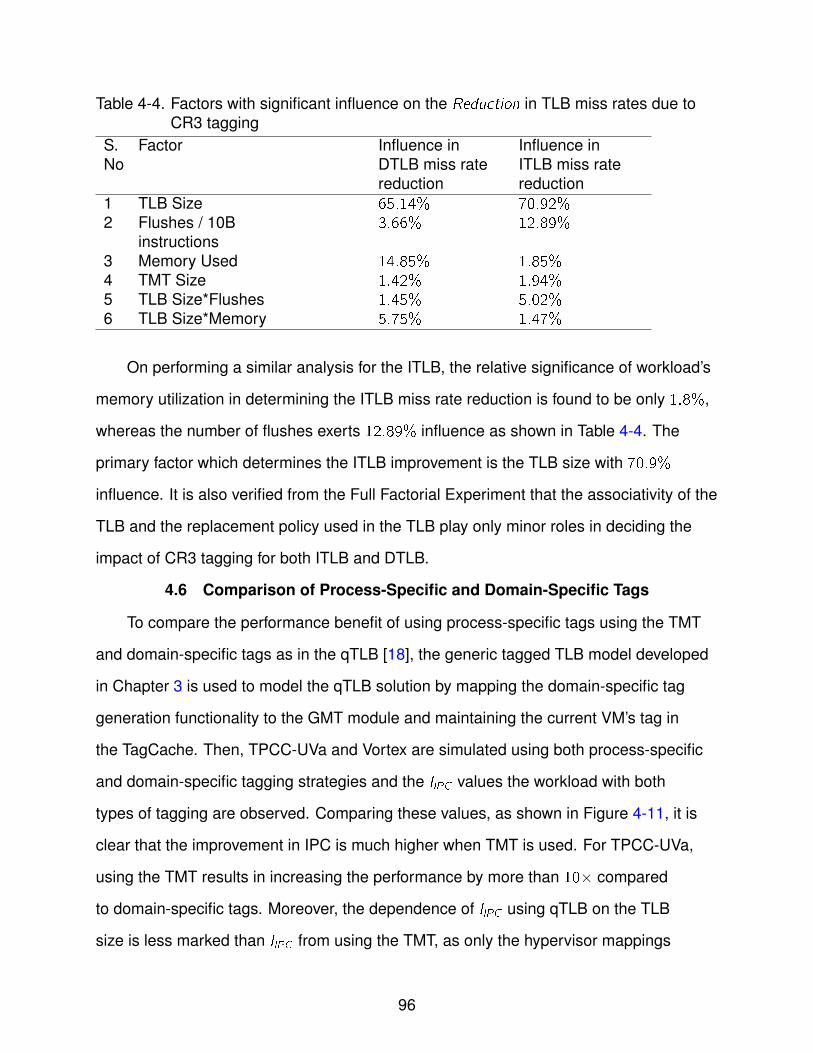
Table 4-4. Factors with significant influence on the Reduction in TLB miss rates due toCR3 tagging
S.No
Factor Influence inDTLB miss ratereduction
Influence inITLB miss ratereduction
1 TLB Size 65.14% 70.92%2 Flushes / 10B
instructions3.66% 12.89%
3 Memory Used 14.85% 1.85%4 TMT Size 1.42% 1.94%5 TLB Size*Flushes 1.45% 5.02%6 TLB Size*Memory 5.75% 1.47%
On performing a similar analysis for the ITLB, the relative significance of workload’s
memory utilization in determining the ITLB miss rate reduction is found to be only 1.8%,
whereas the number of flushes exerts 12.89% influence as shown in Table 4-4. The
primary factor which determines the ITLB improvement is the TLB size with 70.9%
influence. It is also verified from the Full Factorial Experiment that the associativity of the
TLB and the replacement policy used in the TLB play only minor roles in deciding the
impact of CR3 tagging for both ITLB and DTLB.
4.6 Comparison of Process-Specific and Domain-Specific Tags
To compare the performance benefit of using process-specific tags using the TMT
and domain-specific tags as in the qTLB [18], the generic tagged TLB model developed
in Chapter 3 is used to model the qTLB solution by mapping the domain-specific tag
generation functionality to the GMT module and maintaining the current VM’s tag in
the TagCache. Then, TPCC-UVa and Vortex are simulated using both process-specific
and domain-specific tagging strategies and the IIPC values the workload with both
types of tagging are observed. Comparing these values, as shown in Figure 4-11, it is
clear that the improvement in IPC is much higher when TMT is used. For TPCC-UVa,
using the TMT results in increasing the performance by more than 10× compared
to domain-specific tags. Moreover, the dependence of IIPC using qTLB on the TLB
size is less marked than IIPC from using the TMT, as only the hypervisor mappings
96

0
0.5
1
1.5
2
2.5
3
3.5
4
4.5
Q P Q P Q P Q P Q P Q P Q P Q P Q P Q P Q P Q P Q P Q P Q P
PW30
PW60
PW90
PW30
PW60
PW90
PW30
PW60
PW90
PW30
PW60
PW90
PW30
PW60
PW90
64-entry TLB 128-entryTLB
256-entryTLB
512-entryTLB
1024-entryTLB
I IP
C (
%)
A IIPC comparison for TPCC-UVa
0
1
2
3
4
5
6
7
8
9
10
Q P Q P Q P Q P Q P Q P Q P Q P Q P Q P Q P Q P Q P Q P Q P
PW30
PW60
PW90
PW30
PW60
PW90
PW30
PW60
PW90
PW30
PW60
PW90
PW30
PW60
PW90
64-entry TLB 128-entryTLB
256-entryTLB
512-entryTLB
1024-entryTLB
I IP
C (
%)
B IIPC comparison for vortex
Figure 4-11. Comparison of the performance improvement due to process-specific andVM-specific tagging. Process-specific tagging with an 8-entry TMT (legendP) increases the IPC significantly more than VM-specific tagging usingqTLB approach [18] (legend Q) as it can avoid all types of context switchrelated flushes. The advantage of process-specific tagging is even morepronounced in non I/O-intensive Vortex where there is little inter-domaincontext switches.
are retained on domain switches in the qTLB. Once the TLB grows large enough to
accommodate all the hypervisor entries (256 entries in the case of TPCC-UVa), the gain
from further increasing the TLB size is minimal. The ratio of IIPC values with CR3 tagging
to domain-specific tagging is even more pronounced for Vortex due to the significantly
smaller number of inter-domain switches in Vortex. These results clearly show the
benefit of using process-specific tags over domain-specific tags.
4.7 Using the Tag Manager Table on Non-Virtualized Platforms
While the TMT is motivated by the need to reduce TLB-induced performance
degradation on virtualized platforms, it achieves this by avoiding TLB flushes using a tag
to associate every TLB entry with the process to which it belongs. Since the generation
and management of the VASI is not tied to any particular aspect of virtualization, the
97

TMT may also be used on non-virtualized platforms without requiring any change to the
system software. As a result, the same hardware platform may be used in a virtualized
or non-virtualized manner transparent to the software stack running on it.
To estimate the performance implications of using the TMT on non-virtualized
single-O/S platforms, an x86 single-core machine is simulated using the experimental
framework developed in Chapter 3. Debian Linux 2.6.18-pae kernel is booted on this
simulated platform and I/O-intensive TPCC-UVa as well as memory-intensive vortex
are run on it. The IPC for these workloads, with either a regular 8-way TLB and tagged
8-way TLB and 8-entry TMT and a 60-cycle PW, is observed. The simulations are
repeated for varying TLB sizes and the IIPC as well as the IF for these workloads are
calculated from these simulations. These values are presented in Figure 4-12.
0
0.2
0.4
0.6
0.8
1
1.2
1.4
1.6
64
-en
try T
LB
12
8-e
ntr
y T
LB
25
6-e
ntr
y T
LB
51
2-e
ntr
y T
LB
10
24
-en
try T
LB
64
-en
try T
LB
12
8-e
ntr
y T
LB
25
6-e
ntr
y T
LB
51
2-e
ntr
y T
LB
10
24
-en
try T
LB
64
-en
try T
LB
12
8-e
ntr
y T
LB
25
6-e
ntr
y T
LB
51
2-e
ntr
y T
LB
10
24
-en
try T
LB
64
-en
try T
LB
12
8-e
ntr
y T
LB
25
6-e
ntr
y T
LB
51
2-e
ntr
y T
LB
10
24
-en
try T
LB
TPCC-Uva Vortex TPCC-Uva Vortex
Improvement in IPC Impact Factor
I IP
C (
%)
0
10
20
30
40
50
60
70
80
90
100
IF (
%)
Figure 4-12. Performance impact of TMT on non-virtualized platforms with 60-cycle PWand 8-way TLB. The IIPC is presented on the left Y axis and the IF ispresented on the right Y axis. The TMT is quite effective at eliminatingTLB-induced delays for workloads running on non-virtualized platformseven if the performance implications are not highly significant.
98
From Section 3.5.1, it is clear that the number of flushes is much smaller in a
single-O/S scenario than on a virtualized platform. Given this low flush rate, the
predominant cause for TLB flushes is the lack of TLB space. As expected, Figure 4-12
shows an increasing trend in the IIPC values with TLB size. It is observed that the IIPC
due to the TMT on non-virtualized platforms is quite small. For instance, even for a
1024-entry TLB and for Vortex, the IIPC is only about 1.6%, compared to the 5.9% for the
virtualized Vortex as presented in Figure 4-7A. However, since the TLB-induced delay
is small on single-O/S platforms, this improvement in IPC translates to an IF of 75%.
Similarly, using the TMT for TPCC-UVa results in an IIPC of about 0.5% and an IF of
89%. Thus, the TMT is quite effective at eliminating TLB-induced delays for workloads
running on non-virtualized platforms even if the performance implications are not highly
significant. However, the most important observation from these simulations is that the
TMT can be used with no change in design for non-virtualized scenarios.
4.8 Enabling Shared Last Level TLBs Using the Tag Manager Table
A well known principle of data caching is the reduction in miss rate, and therefore
the stalls due to the cache misses, on increasing the size of the cache. However, the
purpose of caching the data, i.e. reducing the time taken to access the data by finding it
in the cache rather than the main memory, is defeated when the cache size increases to
large values. For instance, it has been estimated that the ”hit time” for 1MB cache, using
35nm technology is about 6ns [97]. A well known solution to this problem is creating a
hierarchy of caches, with the smaller and faster caches closer to the CPU and the larger
and slower caches closer to the memory. By having such multi-level caches, any miss
in the first level cache which finds the data in the second level cache pays a smaller
penalty than accessing the data from the main memory.
When such hierarchical cache organizations in current CMP platforms are
considered, the last level cache (LLC) is usually shared amongst multiple cores
and serves the cache misses from the private cache hierarchies of each of these
99
cores. Such shared LLCs are especially beneficial for workloads which share data.
Even in workloads that do not have significant sharing, aggregating the on-chip area
allocation for the last level caches as a shared LLC instead of multiple per-core private
LLCs has been shown to result in a lower miss rate [98] due to the better utilization
of the shared cache space, even when there is little sharing between the different
processes which share the cache. Moreover, by caching a block in the last level of a
fully-inclusive hierarchy, the need for snooping among the upper level caches of the
different processors can be avoided [99].
Due to increasing importance of the TLB on current platforms, the hierarchical
design is being extended to TLBs as well4 . AMD Athlon processors [48] support two
levels of instruction and data TLBs, with a 512-entry L2 ITLB and a 640-entry L2 DTLB.
Similarly, Intel Nehalem processors [4] have a 512-entry L2 instruction and data TLBs.
However, these multi-level TLBs are organized as private per-core hierarchies with no
shared Last Level TLB (LLTLB). Previous work has shown that having a Shared Last
Level TLB will exploit inter-core sharing where a specific entry brought into the LLTLB
may be used by all other cores, thereby avoiding TLB misses and page walks for those
cores [19].
4.8.1 Using the TMT as the Tagging Framework
The primary requirement for sharing the Last Level TLBs, in hardware-managed
TLBs such as on the x86 platform, is the need to distinguish the TLB entries of one
process from the entries of another process. This may be achieved using process-specific
tags which are generated and managed using the Tag Manager Table.
4 Even though there are two levels, it should be noted that both levels of the TLB areused store the virtual to physical address translations, even in virtualized scenarios withtwo-level page tables, and not virtual to real or real to physical address translations.
100

When using the TMT, as discussed in Section 4.2, every TLB is provided with
its own TMT. As a result the CR3-to-VASI mapping in one TLB may be different from
the mapping established in another TMT, and the TLB entries of the same process
address space may be tagged with different VASIs in different TLBs. Such an approach
is satisfactory even in multi-level TLBs provided there is no shared TLBs. However, in
the case of shared TLBs, it is important to have a consistent process-to-tag mapping
in all TLBs to ensure that an entry in the shared TLB can be used by any core which
shares this TLB. Thus, establishing this consistent process-to-tag mapping is the second
requirement for enabling shared LLTLBs. One way of satisfying this requirement is to
have one global TMT which generates and manages the tags for all per-core private TLB
hierarchies which share the LLTLB.
4.8.2 Architecture of the Shared LLTLB
The architecture of the shared Last Level TLB using the Tag Manager Table
is illustrated in Figure 4-13. The platform illustrated in Figure 4-13 consists of two
processors, CPU0 and CPU1 with a two-level TLB hierarchy for each core. It should
be noted that, though the architecture is explained considering a dual-core platform, a
similar architecture may be envisioned for sharing the LLTLB among a larger number
of processors. L0 − TLB0 and L0 − TLB1 are the private per-core TLBs of CPU0 and
CPU1 respectively. The second level TLB, indicated as L1 − TLBS in Figure 4-13, is
the LLTLB which is shared among these cores. One global TMT is used to generate
and manages tags for all three TLBs. However, every core is provided with its own CCR
register to ensure that no additional latency is imposed by that tagging framework on the
critical TLB lookup path.
TLB lookup and miss handling with shared Last Level TLBs
The TLB lookup process in the shared LLTLB scenario happens as shown in
Figure 4-13. A process P0 running on CPU0 with the tag VASI0 may require a
translation for virtual address VA0. If this translation is not available in L0 − TLB0,
101
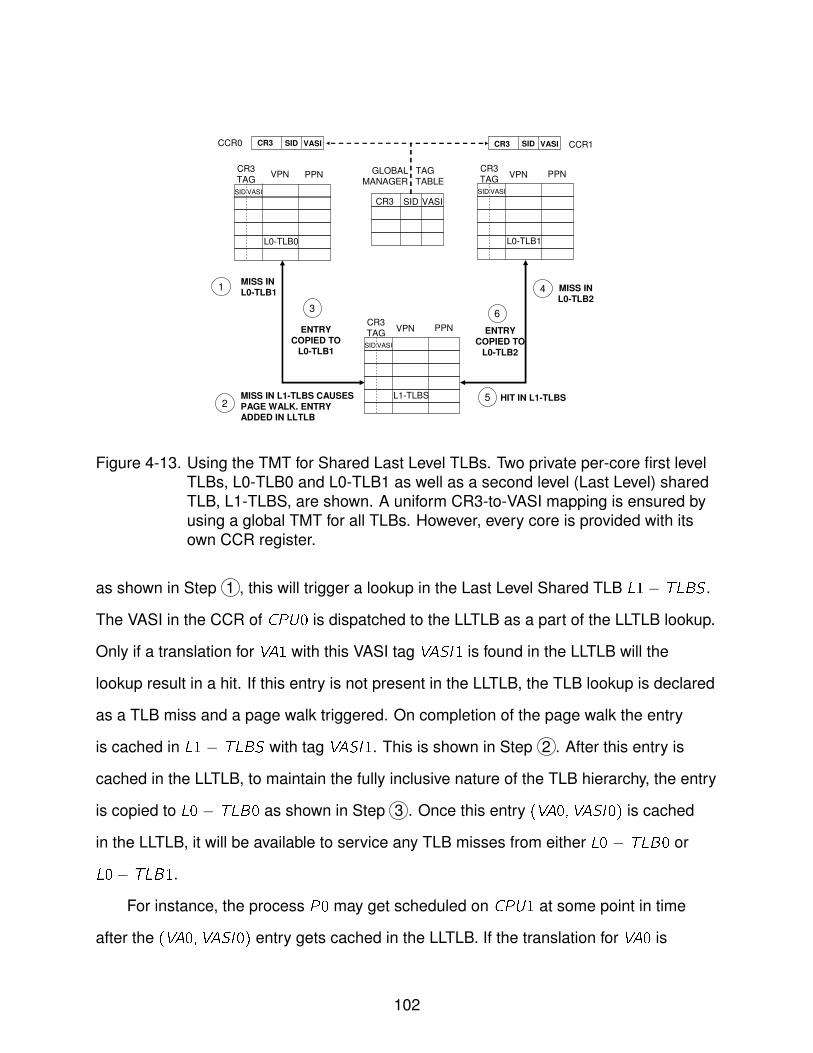
CR3
TAG
VASI
L0-TLB1
VPN PPNCR3
TAG
VASI
L0-TLB0
VPN PPN
CR3 SID
GLOBAL TAG
MANAGER TABLE
VASI
CCR0
CR3
TAG
VASI
L1-TLBS
VPN PPN
CR3 SID VASI
1 4
MISS IN L1-TLBS CAUSES
PAGE WALK. ENTRY
ADDED IN LLTLB
2
ENTRY
COPIED TO
L0-TLB1
3
MISS IN
L0-TLB2
5 HIT IN L1-TLBS
ENTRY
COPIED TO
L0-TLB2
6
CR3 SID VASI CCR1
SIDSID
SID
MISS IN
L0-TLB1
Figure 4-13. Using the TMT for Shared Last Level TLBs. Two private per-core first levelTLBs, L0-TLB0 and L0-TLB1 as well as a second level (Last Level) sharedTLB, L1-TLBS, are shown. A uniform CR3-to-VASI mapping is ensured byusing a global TMT for all TLBs. However, every core is provided with itsown CCR register.
as shown in Step ..1 , this will trigger a lookup in the Last Level Shared TLB L1 − TLBS .
The VASI in the CCR of CPU0 is dispatched to the LLTLB as a part of the LLTLB lookup.
Only if a translation for VA1 with this VASI tag VASI1 is found in the LLTLB will the
lookup result in a hit. If this entry is not present in the LLTLB, the TLB lookup is declared
as a TLB miss and a page walk triggered. On completion of the page walk the entry
is cached in L1 − TLBS with tag VASI1. This is shown in Step ..2 . After this entry is
cached in the LLTLB, to maintain the fully inclusive nature of the TLB hierarchy, the entry
is copied to L0 − TLB0 as shown in Step ..3 . Once this entry (VA0,VASI0) is cached
in the LLTLB, it will be available to service any TLB misses from either L0 − TLB0 or
L0− TLB1.
For instance, the process P0 may get scheduled on CPU1 at some point in time
after the (VA0,VASI0) entry gets cached in the LLTLB. If the translation for VA0 is
102

required by P0 and it is not found in L0 − TLB1 as shown in Step ..4 , the lookup will hit
in L1 − TLBS and avoid an expensive TLB miss as depicted in Step ..5 and Step ..6 . In
addition to P0 being rescheduled on CPU1, threads of a multi-threaded workload which
share the address space will benefit from such a shared LLTLB. It should be noted that,
while this discussion focusses on fully-inclusive TLB hierarchies, the use of the TMT to
enable shared LLTLBs is equally applicable in the case of exclusive TLB hierarchies as
well.
TLB flush handling with shared Last Level TLBs
One implication of using a global TMT is the generation of ”false” TLB flushes. A
situation may arise during a context switch from P1 to P2 (on CPU1) where the CR3
of P2 is not in the TMT and, due to limited capacity, there are no free entries in the
TMT. In this case, depending on the replacement policy, the victim entry in global TMT,
(CR33,SID3,VASI3), belonging to P3 is chosen. The CR3 and SID values of P2 replace
CR33 and SID3 while VASI3 is reused for P2. To avoid the TLB entries of P3 being used
for P2, the per-core private TLB hierarchy of CPU1 is flushed with a capacity flush.
However, in shared LLTLB scenarios, this capacity flush will also have to flush all TLB
hierarchies that share the LLTLB with CPU1’s TLB hierarchy including the shared LLTLB.
This is required to ensure that no entry belonging to P3 is cached in any of these TLBs
with the tag VASI3. Thus, the capacity flushes experienced by the shared LLTLB is the
sum of the capacity flushes experienced by the private last level hierarchies it replaces.
However, the number of slots in the Global TMT can be set as the sum of the number
of slots in all the per-TLB TMT it replaces, thereby reducing the occurrence of capacity
flushes.
Forced flushes, on the other hand, are propagated to all TLB hierarchies using
mechanisms such as Inter-processor interrupts [53] even in existing platforms. Hence
the number of forced flushes experienced by the LLTLB remains constant irrespective of
whether the it is shared or not.
103

4.8.3 Miss Rate Improvement Due to Shared Last Level TLBs
In addition to the benefit for workloads which share address spaces, using shared
LLTLBs will result in a better utilization of the TLB space. Thus, allocating a fixed amount
of TLB space as a shared TLB rather than as two private TLBs will result in reducing the
TLB miss rate. To understand the reduction in miss rate that can be achieved using the
shared LLTLB for virtualized workloads, a two-processor x86 machine is simulated using
the experimental framework described in Section 3.2. The tagged TLB model developed
in Section 3.2.2 is modified to include an interface to facilitate communication between
two levels of a TLB hierarchy. Using this tagged TLB model, both CPUs in the simulated
platform are configured with a two-level private per-core TLB hierarchy with no sharing
of the last level TLB.
Xen is booted on this platform and the pinned workloads TPCC-Vortex-0102 and
TPCC-SPECjbb-01025 are created. Pinning the workloads in this fashion ensures that
dom1 running TPCC-UVa is the only workload domain to be scheduled on CPU0 and
dom2 running Vortex or SPECjbb gets scheduled only on CPU1. These workloads
are run on the simulated platform with a 64-entry first level TLB and varying last level
TLB sizes with an 8-entry per-core TMT and the miss rates for the various TLBs are
observed. Then, the second level TLB of both the private per-core hierarchies are
replaced with a shared TLB and the 8-entry TMTs are replaced with a 16-entry global
TMT. The simulations are repeated for varying shared LLTLB sizes and the miss rates
for the various TLBs are observed.
The DTLB miss rates for the private and shared LLTLBs from these simulations
are compared in Figure 4-14. It should be noted that the miss rates for a private LLTLB
of a certain size is compared to the miss rate of the shared LLTLB of twice the size.
5 The details of creating the pinned workloads and their nomenclature are explainedin Section 3.3.3
104
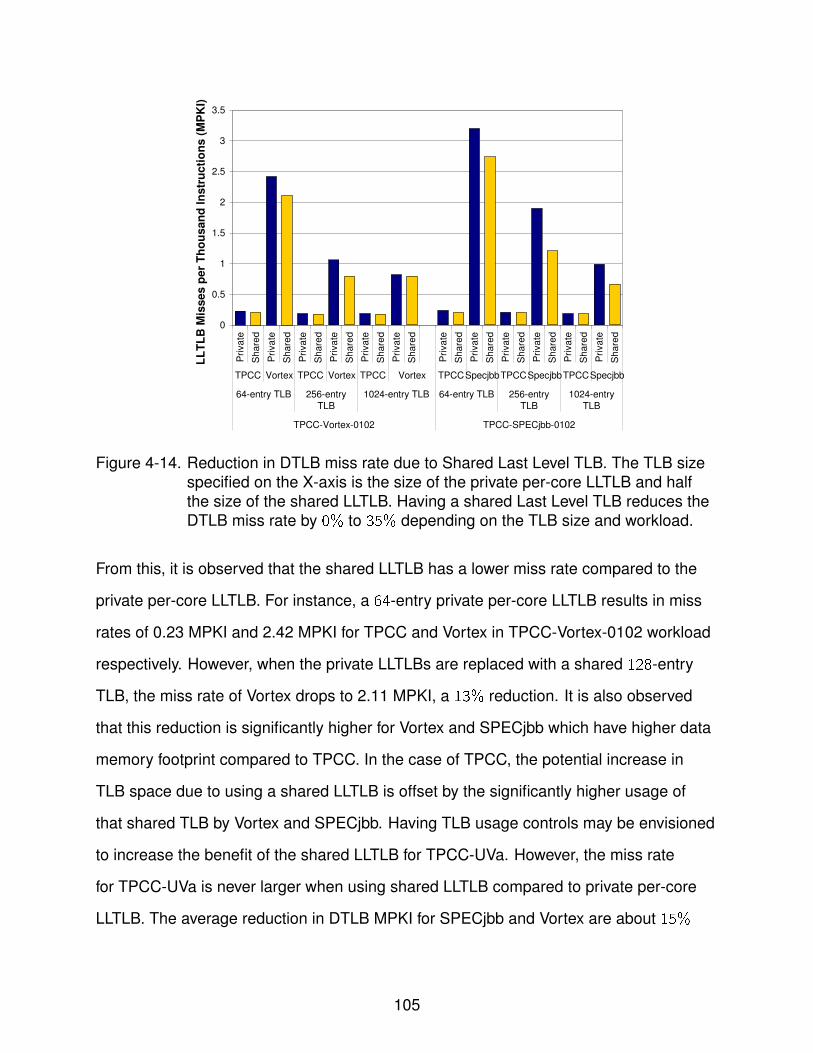
0
0.5
1
1.5
2
2.5
3
3.5
Pri
va
te
Sh
are
d
Pri
va
te
Sh
are
d
Pri
va
te
Sh
are
d
Pri
va
te
Sh
are
d
Pri
va
te
Sh
are
d
Pri
va
te
Sh
are
d
Pri
va
te
Sh
are
d
Pri
va
te
Sh
are
d
Pri
va
te
Sh
are
d
Pri
va
te
Sh
are
d
Pri
va
te
Sh
are
d
Pri
va
te
Sh
are
d
TPCC Vortex TPCC Vortex TPCC Vortex TPCCSpecjbbTPCCSpecjbbTPCCSpecjbb
64-entry TLB 256-entry
TLB
1024-entry TLB 64-entry TLB 256-entry
TLB
1024-entry
TLB
TPCC-Vortex-0102 TPCC-SPECjbb-0102
LL
TL
B M
isses p
er
Th
ou
san
d I
nstr
ucti
on
s (
MP
KI)
Figure 4-14. Reduction in DTLB miss rate due to Shared Last Level TLB. The TLB sizespecified on the X-axis is the size of the private per-core LLTLB and halfthe size of the shared LLTLB. Having a shared Last Level TLB reduces theDTLB miss rate by 0% to 35% depending on the TLB size and workload.
From this, it is observed that the shared LLTLB has a lower miss rate compared to the
private per-core LLTLB. For instance, a 64-entry private per-core LLTLB results in miss
rates of 0.23 MPKI and 2.42 MPKI for TPCC and Vortex in TPCC-Vortex-0102 workload
respectively. However, when the private LLTLBs are replaced with a shared 128-entry
TLB, the miss rate of Vortex drops to 2.11 MPKI, a 13% reduction. It is also observed
that this reduction is significantly higher for Vortex and SPECjbb which have higher data
memory footprint compared to TPCC. In the case of TPCC, the potential increase in
TLB space due to using a shared LLTLB is offset by the significantly higher usage of
that shared TLB by Vortex and SPECjbb. Having TLB usage controls may be envisioned
to increase the benefit of the shared LLTLB for TPCC-UVa. However, the miss rate
for TPCC-UVa is never larger when using shared LLTLB compared to private per-core
LLTLB. The average reduction in DTLB MPKI for SPECjbb and Vortex are about 15%
105
and 28% respectively. These results clearly demonstrate the benefit of using shared
Last Level TLBs.
4.9 Summary
The Tag Manager Table is proposed in this chapter to generate and manage
process-specific TLB tags in a software-independent manner for hardware-managed
TLBs. The design and working of the TMT is discussed and the reduction the TLB
miss rate and TLB-induced delay due to the TMT is analyzed. The various hardware
and workload-related factors that influence the benefit of the TMT are investigated and
prioritized. It is found that using the TMT for typical transaction-processing and CPU
intensive workloads reduces the delay due to TLB misses by as much as 50%-70%
compared to untagged TLBs and improves the IPC by as much as 12%-25% for large
TLB sizes and page walk latencies. The use of the TMT in non-virtualized platforms as
well as to enable shared Last Level TLBs is also explored.
106
CHAPTER 5CONTROLLED SHARING OF HARDWARE-MANAGED TLB
Resource consolidation using virtualization has emerged as a viable way to share
the resources of chip multicore processors among multiple workloads which have
different operating system (O/S) requirements. By consolidating different workloads on
the same platform, the utilization of the platform resources can be increased. This has
made virtualization extremely attractive to the server industry.
In a consolidated environment, the performance of one virtual machine (VM)
will be susceptible to the utilization of shared resources by other VMs. In addition,
”system noise”, i.e. the operating system carrying out vital functions such as memory
management and task scheduling, also causes variation as well as degradation in the
performance of virtualized workloads. This interference manifests as consumption of
resources by other VM or system processes, which could have been otherwise devoted
to increasing the performance of user applications, and is a major limiting factor in
the performance of applications in large-scale systems [100, 101]. Hence, there is
a need for controlling and managing the usage of shared resources. Such resource
management techniques are vital for providing scalable and deterministic performance
in future architectures such as Datacenter-on-chip [102].
Resource management in CMP platforms for providing Quality of Service, especially
in the memory subsystem, has been the focus of many research efforts. Kim, Chandra
and Solihin [103] explore the sharing of caches for providing a fair share of the cache
to different hardware threads. Iyer et al. [104] and Hsu et al. [105] present different
types of cache-sharing policies for the last level cache for varied system-level goals,
including maximizing the system throughput and ensuring uniform throughput for each
of the threads. Chang and Sohi [106] discuss adaptively increasing the cache space
allocated to a thread in the short run, while maintaining fairness in the long run. Qureshi
and Patt [107] investigate the capability of different workloads to use the cache with
107
varying degrees of efficiency and use this information to decide the cache allocation.
Srikantaiah et al. [108] explore the pollution in the cache due to multiple cores sharing
the last level cache and propose schemes to reduce this pollution by modifying the
cache eviction policies. Architectural support for O/S-level cache management has been
investigated by Rafique, Lim and Thottethodi [109]. Selective replication [110] to improve
the performance of selected applications has been proposed by Beckmann, Marty and
Wood.
However, since only one process could use the TLB at a given time before the
advent of tagged TLBs for reducing the virtualization overhead, research on usage
control in hardware-managed TLBs is limited to the qTLB work [18]. This assumption of
a process owning the entire TLB, however, is changed in the context of tagged TLBs.
While the TMT enables the sharing1 of the TLB among multiple workloads, thereby
improving the performance of these workloads, it also makes the TLB a shared resource
and the performance of an application in one VM will vary depending on the TLB usage
of other VMs which run on the same core. This necessitates mechanisms and policies
for managing the use of the TLB.
To address this issue, the CShare (Controlled-Share) hardware-managed TLB
is proposed in this dissertation. At the core of the CShare TLB is the use of a TLB
Sharing Table (TST), in conjunction with TMT-generated process-specific tags for
sharing the TLB between multiple processes and for controlling the TLB space used
by these processes. By assigning various VMs a fixed slice of the shared TLB space
using the TST, the TLB behavior of a workload running in a VM can be isolated from the
TLB usage of other VMs running on the same platform. The TST can also be used to
1 The sharing of a single TLB by multiple processes is the main focus of this chapter.However, the architectures developed and analysis performed here are viable in thecontext of sharing across multiple TLBs, such as shared Last Level TLBs.
108
selectively improve the performance of a high priority workload by restricting the TLB
usage of other low priority workloads running on the same platform. In such scenarios,
the performance improvement for the high priority workload that is achieved using
the TMT can be further increased by 1.4× by restricting the TLB usage of low priority
workloads. The cost of this selective performance enhancement for various types of
workloads is analyzed and the use of dynamic usage control policies for minimizing this
cost and improving the overall performance of the consolidated workload is explored.
5.1 Motivation
Typical usage of virtualized platforms involve launching multiple workloads on a
platform, each in their VM, and having these VMs share resources. Thus it is important
to investigate the behavior of the tagged TLB for such consolidated workloads, in
addition with stand-alone workloads. To understand this, consolidated workloads are
created by launching two applications, TPCC-UVa and Vortex for instance, on dom1
and dom2. Though no application is launched on dom0, the interactions between domU
and the physical machine (such as I/O requests for TPCC-UVa) are served by the
drivers residing on dom0 and instructions are executed on this domain as well [35].
These consolidated workloads are run on a 1-CPU x86 simulated machine, using the
framework outlined in Section 3.2, and the IIPC due to the tagged TLB (without any
explicit usage control) is observed. In addition to the IIPC for the entire consolidated
workload, the details of the domain switches are obtained by instrumenting the Xen
kernel and are used to classify executed instructions on a per-dom basis, thus enabling
the calculation of IIPC on a per-domain basis. These IIPC values are shown in Figure 5-1.
From these simulation results, the following observations can be made:
• While dom0 does not run any actual workload, its IPC shows definite benefit fromincreasing the TLB size. In fact, even at large TLB sizes of 512 entries, furtherscaling up of the TLB size results in further increasing dom0’s IPC. This behavioris observed because, in all three workloads, dom0 is scheduled for less than 8% ofthe total running time. As a result, the TLB entries cached by dom0 get evicted bythe entries of dom1 and dom2, before they can be significantly reused.
109

0
1
2
3
4
5
6
7
8
9
DO
M0
DO
M1
DO
M2
DO
M0
DO
M1
DO
M2
DO
M0
DO
M1
DO
M2
DO
M0
DO
M1
DO
M2
DO
M0
DO
M1
DO
M2
DO
M0
DO
M1
DO
M2
64-entryTLB
128-entryTLB
256-entryTLB
512-entryTLB
1024-entryTLB
4096-entryTLB
I IP
C (
%)
A IIPC for TPCC(dom1)-Vortex(dom2)
0
1
2
3
4
5
6
7
8
DO
M0
DO
M1
DO
M2
DO
M0
DO
M1
DO
M2
DO
M0
DO
M1
DO
M2
DO
M0
DO
M1
DO
M2
DO
M0
DO
M1
DO
M2
DO
M0
DO
M1
DO
M2
64-entryTLB
128-entryTLB
256-entryTLB
512-entryTLB
1024-entryTLB
4096-entryTLB
I IP
C (
%)
B IIPC for TPCC(dom1)-Specjbb(dom2)
0
1
2
3
4
5
6
7
8
9
10
DO
M0
DO
M1
DO
M2
DO
M0
DO
M1
DO
M2
DO
M0
DO
M1
DO
M2
DO
M0
DO
M1
DO
M2
DO
M0
DO
M1
DO
M2
DO
M0
DO
M1
DO
M2
64-entryTLB
128-entryTLB
256-entryTLB
512-entryTLB
1024-entryTLB
4096-entryTLB
I IP
C (
%)
C IIPC for Vortex(dom1)-Specjbb(dom2)
Figure 5-1. Performance improvement for consolidated workloads with uncontrolled TLBsharing with 8-entry TMT and PW of 60 cycles. The performanceimprovement due to tagging for a domain clearly depends on the otherdomains which share the TLB.
110
• The effect of sharing the TLB is also apparent on considering the IIPC forTPCC-UVa (dom1) in TPCC-SPECjbb and TPCC-Vortex workloads as seenin Figures 5-1B and 5-1A respectively. In these workloads, dom1 is scheduledfor about 35% and 42% of the total execution time, for TPCC-SPECjbb andTPCC-Vortex respectively. Thus, it uses only a part of the TLB space and, unlikethe IIPC trend for TPCC-UVa when it is run alone (as seen in Figure 4-7A), theincrease in IIPC does not taper off with increase in TLB size beyond 256 entries.Even beyond this size, the TLB space used by TPCC is not sufficient to hold all itstranslations, as it has to be shared with the other workload.
• The higher TLB utilization of SPECjbb compared to Vortex, as discussedin Section 4.4.3, lowers TPCC-UVa’s IIPC in TPCC-SPECjbb compared toTPCC-Vortex for any given TLB size. Thus it is clear that the shared TLB usage isheavily influenced by the nature of the workloads which share it.
These observations clearly indicate that, in the absence of explicit controls, the
amount of shared TLB space used by a domain depends on the time for which the
domain is scheduled on a CPU, the working set size of the workload running in the
domain, and the workloads running on other domains which share the TLB. Clearly,
with even more VMs sharing the TLB, ”noise” in the performance of the workloads
will increase. This motivates the need for controlling the usage of the shared TLB by
different workload VMs as well as dom0.
5.2 Architecture of the CShare TLB
The CShare TLB architecture consists of the regular hardware-managed TLB with
two additional hardware tables: the Tag Manager Table (TMT), and the TLB Share Table
(TST). The TMT is responsible for enabling multiple address spaces to share the TLB
and has been discussed in depth in Chapter 4. The TST is used to control the shared
TLB usage amongst the different sharers.
The TLB Share Table (TST) is used for controlling the TLB usage, on a per-TLB
set basis, by choosing the victim during TLB replacement depending upon the current
usage of the different sharing classes. The sharing classes are the granularity at which
the TLB usage is controlled, and each class may consist of a process, a VM (as in this
work) or a collection of VMs. In this work we use the virtual machine as the sharing
111

class. Each entry of the TST, representing one sharing class, contains the TLB usage
restrictions for that class and has four fields:
• The SID field, which has the identifier of the sharing class. The use of SIDsprovides the flexibility of changing the granularity of the sharing classes whileincluding this SID as a part of the TMT entry provides a convenient mappingbetween the different processes and their sharing classes.
• The PRIORITY field, indicates the priority of the sharing class and is used todetermine the victim in situations where no sharing class has exceeded its usagelimits.
• The SHARE field, indicates the maximum number of entries per TLB set which canbe used by the sharing class.
• The CNT field, is used to store the number of entries in a set that are occupiedby the Sharing ID. Unlike the previous three fields, which are programmed by theVMM, the CNT field is updated by the hardware.
CR3
TAG
VITUAL ADDRESS
OFFSETCR3
CR3 SIDTAG
MANAGER
TABLE
1
CR3 SID
VA TAG
VASI
VASI
VASISID
TLB
LOOKUP
TRANSLATION
VA
TAG
PAGE
TABLE
VA TAG
VA TAG PHY
ADDR
CCR
PHY
ADDR
PHY
ADDR
SID SHARETLB
SHARE
TABLE
PRI
VICTIM SET
1
GET PER-SID
CNT FOR
THIS SET
2
USE PER-SID
SHARE, CNT
AND PRI TO
GET V-SID
3 LOOKUP CR3 TAG
4SELECT
VICTIM AND
REPLACE
CNT
Figure 5-2. Controlled TLB usage using CShare architecture. The victim evicted fromthe TLB is chosen depending on the allocations and current usages for thedifferent sharing classes.
The TLB Share Table is looked up only in the case of a TLB miss, as shown in
Figure 5-2, and, similar to the TMT, is not in the critical path of TLB lookups. The virtual
112

address is used to calculate the TLB set (victim set) in which the translation (new
entry) will be stored. The per-SID (per-VM) usage information of this set is obtained,
as shown in step ..1 of Figure 5-2, by counting the number of entries in that set and
storing it in the CNT fields of the appropriate sharing class in the TST. Based on these
CNT and SHARE values for the different classes, the SID to which the victim should
belong (V-SID) is calculated as shown in step ..2 of Figure 5-2. It should be noted that,
since the CNT and SHARE information are computed on a per-set basis, the time for
selecting the V-SID is small and can be overlapped with the page walk. Once the V-SID
is determined, a victim belonging to this sharing class is chosen from the victim set
using the regular TLB replacement heuristic (e.g. LRU). On completion of the page
walk, which proceeds in parallel to the selection of the victim, the obtained translation is
tagged with the CR3 tag of the current process from the CCR, as shown in Step ..3 of
Figure 5-2. The chosen victim is replaced with this translation as depicted in step ..4 .
The actual algorithm used in selection of V-SID depends on the motivation behind
controlling the usage of the TLB (performance isolation or performance enhancement).
When performance isolation is the goal, the TLB can be effectively partitioned among
the VMs by assigning a fixed number of TLB slots (SHARE values) to each VM, such
that the sum of these SHARE values does not exceed the total number of slots in the
TLB set. With such partitioning, any VM whose CNT value for a particular victim set is
less than its SHARE value is guaranteed to find at least one free slot in the set since
other VMs would not have exceeded their allotted SHAREs. That free slot is used for
caching the new entry. On the other hand, if CNT of VM1 is equal to the SHARE of VM1,
one of VM1’s entries in the set is evicted and that slot is used for caching the new entry.
Such a strict enforcement of the SHARE for different VMs, however, may not be
suitable when the motivation behind using CShare TLB is improving the performance of
a high priority workload and is not enforcing TLB isolation through TLB partitioning. For
instance, when the VM running the high priority workload has used all of its reserved
113
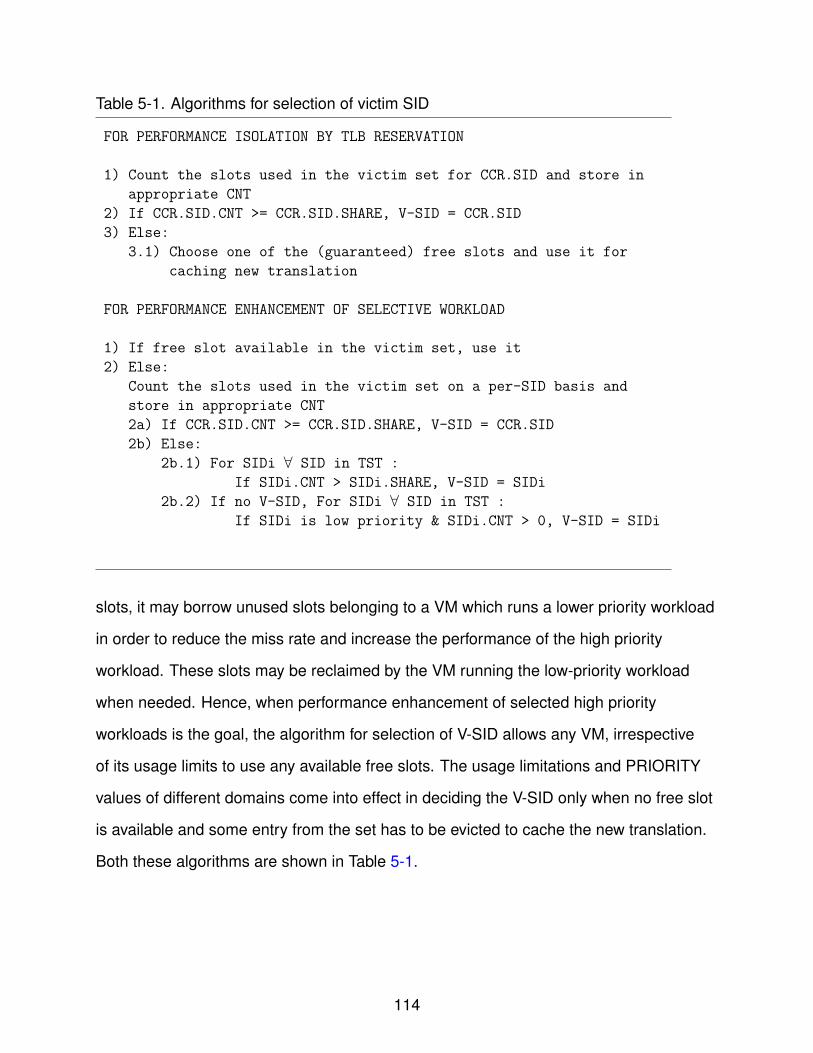
Table 5-1. Algorithms for selection of victim SID
FOR PERFORMANCE ISOLATION BY TLB RESERVATION
1) Count the slots used in the victim set for CCR.SID and store in
appropriate CNT
2) If CCR.SID.CNT >= CCR.SID.SHARE, V-SID = CCR.SID
3) Else:
3.1) Choose one of the (guaranteed) free slots and use it for
caching new translation
FOR PERFORMANCE ENHANCEMENT OF SELECTIVE WORKLOAD
1) If free slot available in the victim set, use it
2) Else:
Count the slots used in the victim set on a per-SID basis and
store in appropriate CNT
2a) If CCR.SID.CNT >= CCR.SID.SHARE, V-SID = CCR.SID
2b) Else:
2b.1) For SIDi ∀ SID in TST :
If SIDi.CNT > SIDi.SHARE, V-SID = SIDi
2b.2) If no V-SID, For SIDi ∀ SID in TST :
If SIDi is low priority & SIDi.CNT > 0, V-SID = SIDi
slots, it may borrow unused slots belonging to a VM which runs a lower priority workload
in order to reduce the miss rate and increase the performance of the high priority
workload. These slots may be reclaimed by the VM running the low-priority workload
when needed. Hence, when performance enhancement of selected high priority
workloads is the goal, the algorithm for selection of V-SID allows any VM, irrespective
of its usage limits to use any available free slots. The usage limitations and PRIORITY
values of different domains come into effect in deciding the V-SID only when no free slot
is available and some entry from the set has to be evicted to cache the new translation.
Both these algorithms are shown in Table 5-1.
114

5.3 Experimental Framework
The CShare TLB is modeled by augmenting the TMT model, described in
Section 4.3, with the TST. The size of the TST is set to match the number of entries
in the TMT. The functionality of the TST is verified by using a Functional Check mode
wherein, the number of TLB slots used by each SID is counted and ensured to be within
the specified limits during every TLB replacement.
The metrics used to study the impact of controlling TLB usage with the TST, are
similar to the metrics used in Chapter 3 and Chapter 4 and are presented here for
reference.
• Number of TLB flushes
• DTLB and ITLB miss rate and the Reduction in miss rate, where
Reduction (%) = 100×(1− TLB miss rate with tags
TLB miss rate without tags
)(5–1)
• Instructions per Cycle (IPC) and RIPC , IIPC and IF , where
RIPC = 100×(1− IPCRegular TLB
IPCIdeal TLB
)IIPC = 100×
(IPCCShare TLB
IPCRegular TLB
− 1
)IF = 100×
(IPCCShare TLB − IPCRegular TLB
IPCIdeal TLB − IPCRegular TLB
)(5–2)
5.4 Performance Isolation using CShare Architecture
In this section, the effect of using the CShare architecture to enforce partitions in the
TLB is investigated. The workloads used for this investigation are the TPCC-TPCC-0012
and TPCC-Vortex-0012. These workloads are created by simulating a two-processor
x86 machine using the experimental framework described in Section 3.2. Xen is
booted on this machine and two user domains (domUs) are created, with one virtual
CPU (VCPU) per domain . TPCC-UVa is run in the first domU (dom1) and, once the
application reaches its working phase, the domain is paused. Then, depending on
115

the required workload, TPCC-UVa or Vortex is launched in the second domU (dom2)
and allowed to reach its working phase. Then, dom1 is resumed and the VCPUs of
both dom1 and dom2 pinned to CPU1 of the Simics simulated machine. In addition the
VCPUs of dom0 are pinned to CPU0 of the simulated machine. Pinning the VCPUs in
this fashion ensures that only dom1 and dom2 are scheduled on CPU1 of the simulated
machine. Thus only the workloads on these domains will share the TLB of CPU1.
The performance isolation usage control policy, outlined in Table 5-1 is used to
partition TLB1 into two and allocate these partitions to dom1 and dom2 explicitly.
TPCC-TPCC-0012 is simulated using the framework described in Section 5.3 for various
TLB sizes and various TLB partition sizes. The DTLB and ITLB miss rates, expressed
as Misses per Thousand Instructions (MPKI), for 64-entry TLB and 512-entry TLB as
obtained from these simulations are presented in Figure 5-3. The miss rate is used as
the metric since it depends only on the shared TLB, which is being controlled using
CShare architecture, while the IPC depends on many other factors including the cache
and memory utilization of the workloads which are not being controlled.
From this figure, it is observed that the DTLB miss rate, has a strong dependence
on the size of the TLB space allocated to the domains. For instance, when 10% of the
TLB is reserved for dom1, its miss rate is almost 8× times the miss rate of dom2. The
lowest miss rate for both the domains is achieved when the share the TLB equally, as
both domains run the same workload and show similar TLB usage requirements. A
similar behavior is observed in the case of the ITLB miss rates. It should be noted that,
while both 64-entry TLB and 512-entry TLB are insufficient to capture the working set
size of TPCC-UVa and Vortex combined as seen from Section 4.4, the smaller size of
the 64-entry TLB cause the MPKI variation with partition sizes to be larger in magnitude
and smoother than the MPKI trends for 512-entry TLB. Thus, it is clear that the TST
serves as good control knob for controlling the TLB usage on a per-domain basis.
116

0
0.5
1
1.5
2
2.5
3
3.5
4
4.5
0 10 20 30 40 50 60 70 80 90 100
Mis
ses p
er T
ho
usan
d I
nstru
ctio
ns (
MP
KI)
dom1 (TPCC) dom2 (TPCC)
A DTLB miss rate for 64-entry TLB
0
0.2
0.4
0.6
0.8
1
1.2
1.4
1.6
0 10 20 30 40 50 60 70 80 90 100M
isses p
er T
ho
usan
d I
nstru
ctio
ns (
MP
KI)
dom1 (TPCC) dom2 (TPCC)
B ITLB miss rate for 64-entry TLB
0
0.05
0.1
0.15
0.2
0.25
0 10 20 30 40 50 60 70 80 90 100
Mis
ses p
er T
ho
usan
d I
nstru
ctio
ns (
MP
KI)
dom1 (TPCC) dom2 (TPCC)
C DTLB miss rate for 512-entry TLB
0
0.01
0.02
0.03
0.04
0.05
0.06
0.07
0.08
0.09
0 10 20 30 40 50 60 70 80 90 100
Mis
ses p
er T
ho
usan
d I
nstru
ctio
ns (
MP
KI)
dom1 (TPCC) dom2 (TPCC)
D ITLB miss rate for 512-entry TLB
Figure 5-3. Effect of varying TLB reservation on miss rate is shown by plotting the TLBmiss rate for TPCC-TPCC-0012 for varying allocation of the TLB space foreach domain. The miss rates of domains show a strong correlation with theirallocations.
117

0
1
2
3
4
5
6
7
TPC
C (d
om1)
in T
-T
TPC
C (d
om1)
in T
-V
TPC
C (d
om2)
in T
-T
Vorte
x (d
om2)
in T
-V
TPC
C (d
om1)
in T
-T
TPC
C (d
om1)
in T
-V
TPC
C (d
om2)
in T
-T
Vorte
x (d
om2)
in T
-V
TPC
C (d
om1)
in T
-T
TPC
C (d
om1)
in T
-V
TPC
C (d
om2)
in T
-T
Vorte
x (d
om2)
in T
-V
TPC
C (d
om1)
in T
-T
TPC
C (d
om1)
in T
-V
TPC
C (d
om2)
in T
-T
Vorte
x (d
om2)
in T
-V
TPC
C (d
om1)
in T
-T
TPC
C (d
om1)
in T
-V
TPC
C (d
om2)
in T
-T
Vorte
x (d
om2)
in T
-V
dom1 = 50% dom1 = 40% dom1 = 30% dom1 = 20% dom1 = 10%
Mis
ses
per
Thou
sand
Inst
ruct
ions
(MP
KI)
Figure 5-4. Miss rate isolation using the TMT architecture is shown by plotting theper-domain miss rates on a 64-entry CShare TLB for TPCC-TPCC-0012(T-T) and TPCC-Vortex-0012 (T-V). Despite the different demands on theTLB by dom2, the miss rate of dom1 is isolated from the influence of dom2.
To show that the usage ”control knob” property of the TST can be used to isolate
the TLB miss rates of workloads, the simulations are repeated for TPCC-Vortex-0012
workload. The per-domain DTLB miss rates for a 64-entry TLB for both TPCC-TPCC-0012
and TPCC-Vortex-0012 for a range of partition sizes, as obtained from these simulations,
are shown in Figure 5-4. When the per-domain miss rates are considered for TPCC-TPCC-0012,
since both domains run the same workload, they exhibit similar miss rates of about 0.61
MPKI when allocated equal shares in the TLB (dom1=50%). On reducing the TLB
usage limit for dom1 and allocating a larger share of the TLB for dom2, the miss rates
for these domains begin to show differing trends. At dom1=10%, with dom2 allowed
90%, the miss rate of TPCC-UVa on dom1 is 4.07 MPKI which is almost an order of
magnitude greater than the miss rate of TPCC-UVa on dom2. A similar trend is seen for
the consolidated workload TPCC-Vortex with the main difference being that, the miss
118

rate for Vortex is much larger than the miss rate for TPCC-UVa even when it is allocated
a larger portion of the TLB due to its memory intensive behavior.
Since Vortex is more ”TLB hungry” than TPCC-UVa, the miss rate of TPCC-UVa will
be increased when it is consolidated with Vortex in the absence of any usage control.
However, from Figure 5-4, it is seen that the miss rate of TPCC-UVa running on dom1
in both the consolidated workloads is very close and depends only on the portion of
the TLB that is reserved for it. It is also seen that the miss rate of dom1 is independent
of the workload running on dom2, clearly indicating the efficacy of the CShare TLB in
isolating the TLB miss rate of one domain from the influence of other domains.
5.5 Performance Enhancement Using CShare Architecture
In addition to isolating the TLB behavior of an application running on a VM from
other VMs running on the same platform, the CShare architecture may also be used
to further improve the performance increase achieved by using the TMT. Different
applications with varying working set sizes and memory access patterns exhibit
correspondingly varying patterns in the usage of the TLB space. By controlling the
TLB space and regulating the amount of TLB space used by every VM based on its
memory access pattern, it becomes possible to achieve a lower TLB miss rate and
improve the performance of the workloads.
5.5.1 Classification of TLB Usage Patterns
Typical multimedia application exhibit a ”streaming” memory access pattern, where
the data accessed from the main memory show regularity in the stride of access [111].
In such applications, the number of data accesses per instruction is typically very high,
and there is little reuse in the accessed data. Applications which exhibit such memory
behavior are termed as ”streaming applications” in this dissertation.
To understand the TLB implications of streaming applications, several workload
applications are simulated on the domU of a uniprocessor x86 machine with the CShare
119

TLB, without explicit TLB usage control and an 8-entry TMT, using the framework
described in Chapter 3. The selected applications are:
• Vortex: a memory intensive database manipulation workload [77].
• TPCC-UVa: an I/O intensive implementation of the TPC-C benchmark from theSPEC CPU 2000 suite of benchmarks [82].
• Apsi: a weather prediction program which reads a 112 × 112 × 112 array of dataand iterates over 70 timesteps [112].
• Art: A neural network program used for object recognition in thermal imagery [113].
• Lucas: A program to check the primality of Mersenne numbers of the form 2n −1 [114].
• Swim: a compute intensive floating point program for shallow water modeling witha 1335× 1335 array of input data [115].
The DTLB miss rates for the domU running these applications is observed for
varying TLB sizes. These miss rates, normalized to the miss rate for a 64-entry TLB,
is presented in Figure 5-5A. From this, it can be seen that increasing the TLB size
does not reduce the TLB miss rate to the same extent in all applications. For instance,
TPCC-UVa and Vortex show significant benefit from the increase in TLB size. However,
Apsi and Art show smaller reduction in DTLB miss rate of about 20% till a TLB size of
256 entries and 512 entries respectively. Beyond these TLB sizes, the TLB miss rate
rapidly reduces to less than 5% of the 64-entry TLB miss rate. Yet another trend of the
TLB miss rates is exhibited by Swim and Lucas. In these workloads, there is little benefit
of scaling up the TLB size and even at a large TLB size of 1024-entries, the DTLB miss
rate is not highly reduced. For instance, at this TLB size, the miss rate of Swim is 98.8%
of the 64-entry DTLB miss rate. From this trend, the applications can be classified, in a
manner similar to previous works [18], into three categories:
• Type 1 Applications such as TPCC-UVa and Vortex, which have a smaller workingset size and show good reuse in the access pattern. These workloads arecharacterized by a concave parabolic response of the normalized DTLB missrate to increasing TLB sizes. In such applications, increasing the TLB size reduces
120
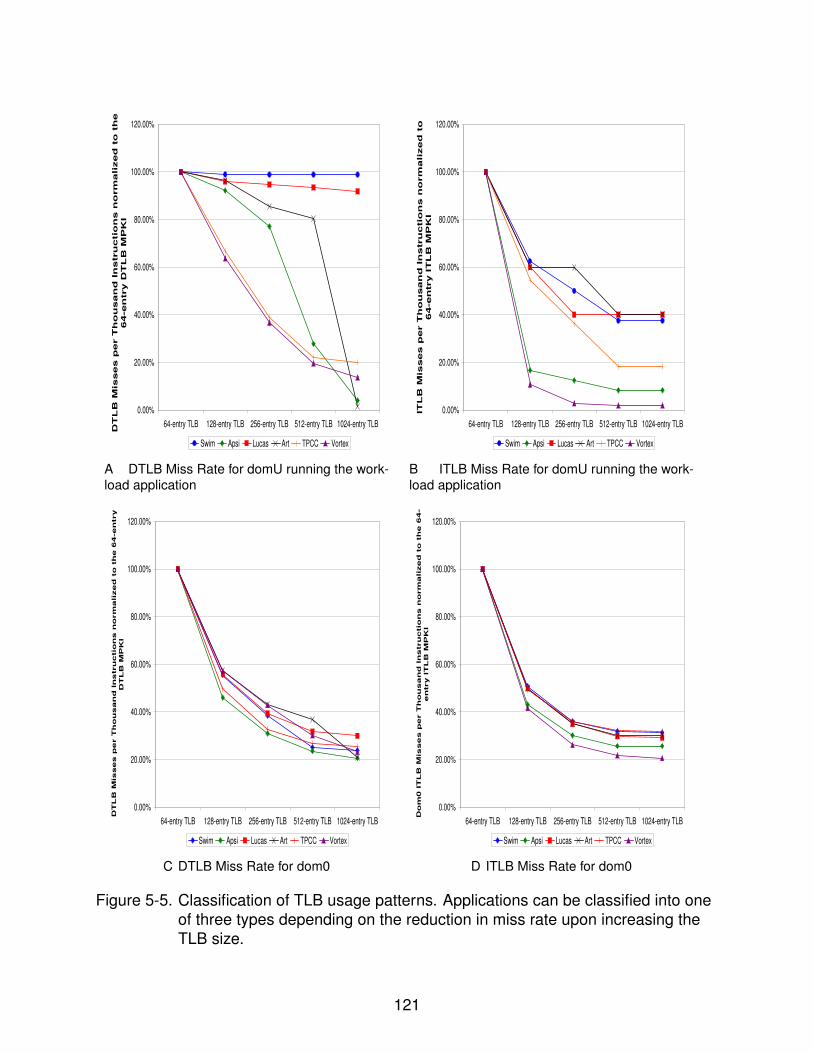
0.00%
20.00%
40.00%
60.00%
80.00%
100.00%
120.00%
64-entry TLB 128-entry TLB 256-entry TLB 512-entry TLB 1024-entry TLB
DT
LB
Mis
ses p
er T
ho
usan
d I
nstru
ctio
ns n
orm
ali
zed
to
th
e
64-en
try D
TL
B M
PK
I
Swim Apsi Lucas Art TPCC Vortex
A DTLB Miss Rate for domU running the work-load application
0.00%
20.00%
40.00%
60.00%
80.00%
100.00%
120.00%
64-entry TLB 128-entry TLB 256-entry TLB 512-entry TLB 1024-entry TLBIT
LB
Mis
ses p
er T
ho
usan
d I
nstru
ctio
ns n
orm
ali
zed
to
64-en
try I
TL
B M
PK
I
Swim Apsi Lucas Art TPCC Vortex
B ITLB Miss Rate for domU running the work-load application
0.00%
20.00%
40.00%
60.00%
80.00%
100.00%
120.00%
64-entry TLB 128-entry TLB 256-entry TLB 512-entry TLB 1024-entry TLB
DT
LB
Mis
se
s p
er T
ho
us
an
d I
ns
tru
ctio
ns
no
rm
ali
ze
d t
o t
he
64
-e
ntry
DT
LB
MP
KI
Swim Apsi Lucas Art TPCC Vortex
C DTLB Miss Rate for dom0
0.00%
20.00%
40.00%
60.00%
80.00%
100.00%
120.00%
64-entry TLB 128-entry TLB 256-entry TLB 512-entry TLB 1024-entry TLB
Do
m0
IT
LB
Mis
se
s p
er T
ho
us
an
d I
ns
tru
ctio
ns
no
rm
ali
ze
d t
o t
he
64
-
en
try
IT
LB
MP
KI
Swim Apsi Lucas Art TPCC Vortex
D ITLB Miss Rate for dom0
Figure 5-5. Classification of TLB usage patterns. Applications can be classified into oneof three types depending on the reduction in miss rate upon increasing theTLB size.
121

the miss rate even when he size is insufficient to accommodate the entire workingset size.
• Type 2 Applications such as Apsi and Art, which have a small to medium workingset size, but show relatively less reuse in the access pattern. The normalizedDTLB miss rates of these applications show a convex parabolic trend to increasingthe TLB size. As long as the TLB size is not sufficient to accommodate the workingset size, there is little benefit to increasing the TLB size since the reuse of entriesis not very high. However, once the TLB size is large enough to capture the entireworking set size, the DTLB miss rate reduces significantly.
• Type 3 Applications such as Swim and Lucas which are streaming applications.Any increase in the TLB size does not significantly reduce the DTLB miss rate.
The ITLB miss rate, on the other hand, for all these applications exhibit similar
response to increasing the TLB size, as seen from Figure 5-5B. Simply doubling the
TLB size from 64 entries to 128 entries reduces the ITLB miss rate of all the applications
by at least 40%. In the case of Vortex and Apsi, this reduction is as high as 90% and
80% respectively. Intuitively, while the instruction footprint of different applications may
vary, the behavior of the memory access for fetching instructions is similar across
applications. Thus, as far as the ITLB is concerned, all applications exhibit Type 1
behavior. Similarly, the DTLB and ITLB miss rates for dom0 also exhibit Type 1 behavior
as both the code and data working set sizes on dom0, which are due to the backend
drivers, are small and show good reuse.
From these observations, it is clear that the benefit of awarding more TLB space
to an application or the penalty of withholding TLB space from an application is highly
dependent on the TLB usage pattern of the workload application.
5.5.2 Performance Improvement With Static TLB Usage Control
The idea behind improving the performance of workloads using TLB usage control
is to give a larger TLB space to those workloads which make better use of the awarded
space and to restrict the TLB space for those applications which do not make good
use of the TLB space. The TLB usage by different domains is controlled using the
TLB usage control policy for performance enhancement listed in Table 5-1. The usage
122
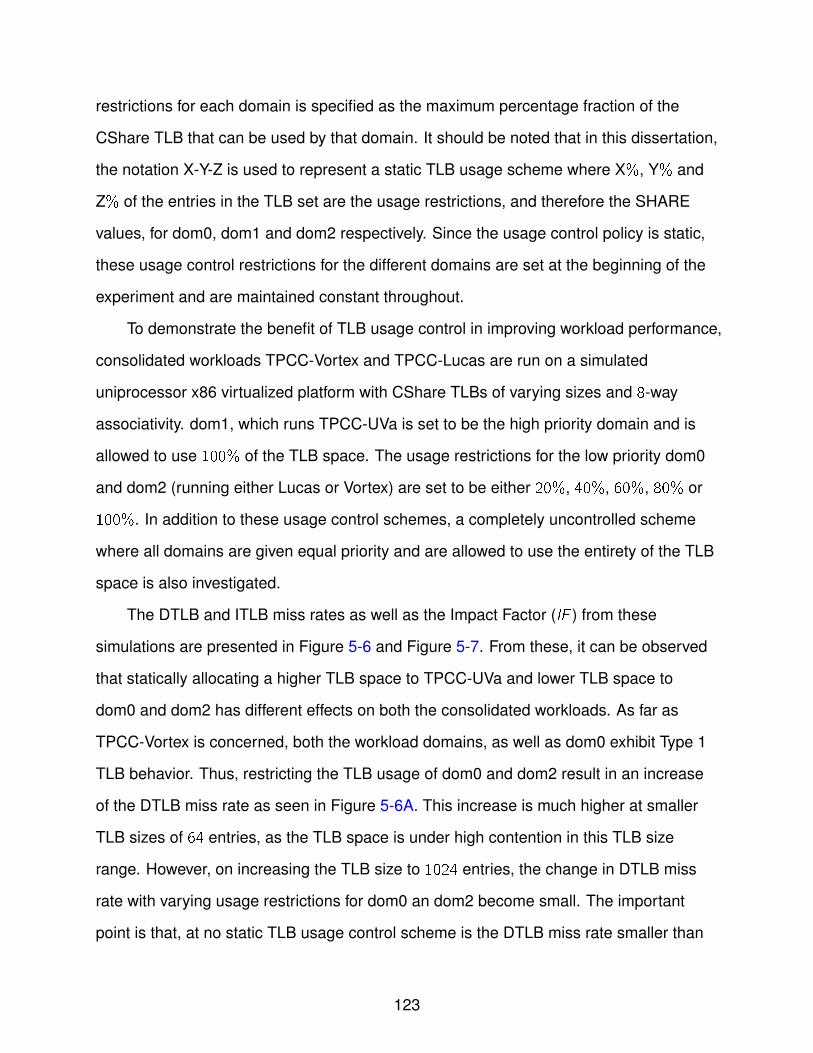
restrictions for each domain is specified as the maximum percentage fraction of the
CShare TLB that can be used by that domain. It should be noted that in this dissertation,
the notation X-Y-Z is used to represent a static TLB usage scheme where X%, Y% and
Z% of the entries in the TLB set are the usage restrictions, and therefore the SHARE
values, for dom0, dom1 and dom2 respectively. Since the usage control policy is static,
these usage control restrictions for the different domains are set at the beginning of the
experiment and are maintained constant throughout.
To demonstrate the benefit of TLB usage control in improving workload performance,
consolidated workloads TPCC-Vortex and TPCC-Lucas are run on a simulated
uniprocessor x86 virtualized platform with CShare TLBs of varying sizes and 8-way
associativity. dom1, which runs TPCC-UVa is set to be the high priority domain and is
allowed to use 100% of the TLB space. The usage restrictions for the low priority dom0
and dom2 (running either Lucas or Vortex) are set to be either 20%, 40%, 60%, 80% or
100%. In addition to these usage control schemes, a completely uncontrolled scheme
where all domains are given equal priority and are allowed to use the entirety of the TLB
space is also investigated.
The DTLB and ITLB miss rates as well as the Impact Factor (IF ) from these
simulations are presented in Figure 5-6 and Figure 5-7. From these, it can be observed
that statically allocating a higher TLB space to TPCC-UVa and lower TLB space to
dom0 and dom2 has different effects on both the consolidated workloads. As far as
TPCC-Vortex is concerned, both the workload domains, as well as dom0 exhibit Type 1
TLB behavior. Thus, restricting the TLB usage of dom0 and dom2 result in an increase
of the DTLB miss rate as seen in Figure 5-6A. This increase is much higher at smaller
TLB sizes of 64 entries, as the TLB space is under high contention in this TLB size
range. However, on increasing the TLB size to 1024 entries, the change in DTLB miss
rate with varying usage restrictions for dom0 an dom2 become small. The important
point is that, at no static TLB usage control scheme is the DTLB miss rate smaller than
123
0
0.5
1
1.5
2
2.52
0%
40
%
60
%
80
%
10
0%
20
%
40
%
60
%
80
%
10
0%
20
%
40
%
60
%
80
%
10
0%
256-entry TLB 512-entry TLB 1024-entry TLB
Dom0 Limit
DT
LB
Mis
ses p
er T
ho
usan
d I
nstru
ctio
ns (
MP
KI)
Dom2 Limit
20%
40%
60%
80%
100%
Uncontrolled usage, No limits and priority for any Dom
A DTLB miss rate for TPCC-Vortex
1
1.05
1.1
1.15
1.2
1.25
1.3
1.35
1.4
1.45
1.5
20
%
40
%
60
%
80
%
10
0%
20
%
40
%
60
%
80
%
10
0%
20
%
40
%
60
%
80
%
10
0%
256-entry TLB 512-entry TLB 1024-entry TLB
Dom0 Limit
DT
LB
Mis
ses p
er T
ho
usan
d I
nstru
ctio
ns (
MP
KI)
Dom2 Limit
20%
40%
60%
80%
100%
Uncontrolled usage, No limits and priority for any Dom
B DTLB miss rate TPCC-Lucas
0
0.05
0.1
0.15
0.2
0.25
0.3
20
%
40
%
60
%
80
%
10
0%
20
%
40
%
60
%
80
%
10
0%
20
%
40
%
60
%
80
%
10
0%
256-entry TLB 512-entry TLB 1024-entry TLB
Dom0 Limit
ITL
B M
isses p
er T
ho
usan
d I
nstru
ctio
ns (
MP
KI)
Dom2 Limit
20%
40%
60%
80%
100%
Uncontrolled usage, No limits and priority for any Dom
C ITLB miss rate for TPCC-Vortex
0
0.02
0.04
0.06
0.08
0.1
0.12
0.14
20
%
40
%
60
%
80
%
10
0%
20
%
40
%
60
%
80
%
10
0%
20
%
40
%
60
%
80
%
10
0%
256-entry TLB 512-entry TLB 1024-entry TLB
Dom0 Limit
ITL
B M
isses p
er T
ho
usan
d I
nstru
ctio
ns (
MP
KI)
Dom2 Limit
20%
40%
60%
80%
100%
Uncontrolled, No limits and priority for any Dom
D ITLB miss rate for TPCC-Lucas
Figure 5-6. Overall miss rate improvement for consolidated workload with static TLBusage control. Except for the curve marked uncontrolled usage, dom1 is setat high priority with 100% usage limit.
124
the uncontrolled usage scheme wherein each domain uses as much TLB space as it
needs by evicting the older entries belonging to other domains. Even when all domains
are allowed to use 100% of the TLB space, the effective replacement policy is not purely
LRU but LRU weighted with the priorities of the various domains. Thus the DTLB miss
rate at 100% − 100% − 100% is smaller than the uncontrolled usage scenario. It is also
interesting to note that, at 512-entry and 1024-entry TLB sizes, increasing the usage limit
for dom0 while maintaining the limit for dom2, increases the miss rate. This is an artefact
of the usage control policy, especially Step 2b in the algorithm in Table 5-1.
A similar phenomenon of the uncontrolled usage resulting in lower miss rate than
any static usage control scheme is seen in the ITLB miss rates, as shown in Figure,
since all ITLB trends exhibit Type 1 behavior. Thus, due to the trends in both TLB and
ITLB miss rates, the IF is highest for the uncontrolled unmanaged usage control policy
than for any other static reservation policy, as seen from Figure 5-7A. In fact, for 64-entry
TLB and 512-entry TLB, the IF , which is a measure of the TLB delay as explained in
Section 4.4.3, falls to as much as −100%, indicating that the TLB delay is doubled at
those usage control settings.
The impact of usage control on TPCC-Lucas workload, on the other hand, is quite
different from the impact on TPCC-Vortex. As Lucas is a Type 3 streaming workload,
as far as the DTLB is concerned, withholding TLB space from it does not significantly
increase the TLB miss rate. Thus, at usage control schemes where the limit for dom2
is set to low values such as 20% and 40%, dom0 and dom1 benefit from this additional
TLB space and show a lower DTLB miss rate than the uncontrolled usage scheme
as seen from Figure 5-6B. The result of this behavior is reflected in the IF trends for
TPCC-Lucas, where setting a 20% restriction for Lucas results in increasing the IF from
20% to 25% for a 512-entry TLB. The ITLB miss rate trends displayed in Figure 5-6D,
however, are the same as for TPCC-Vortex.
125
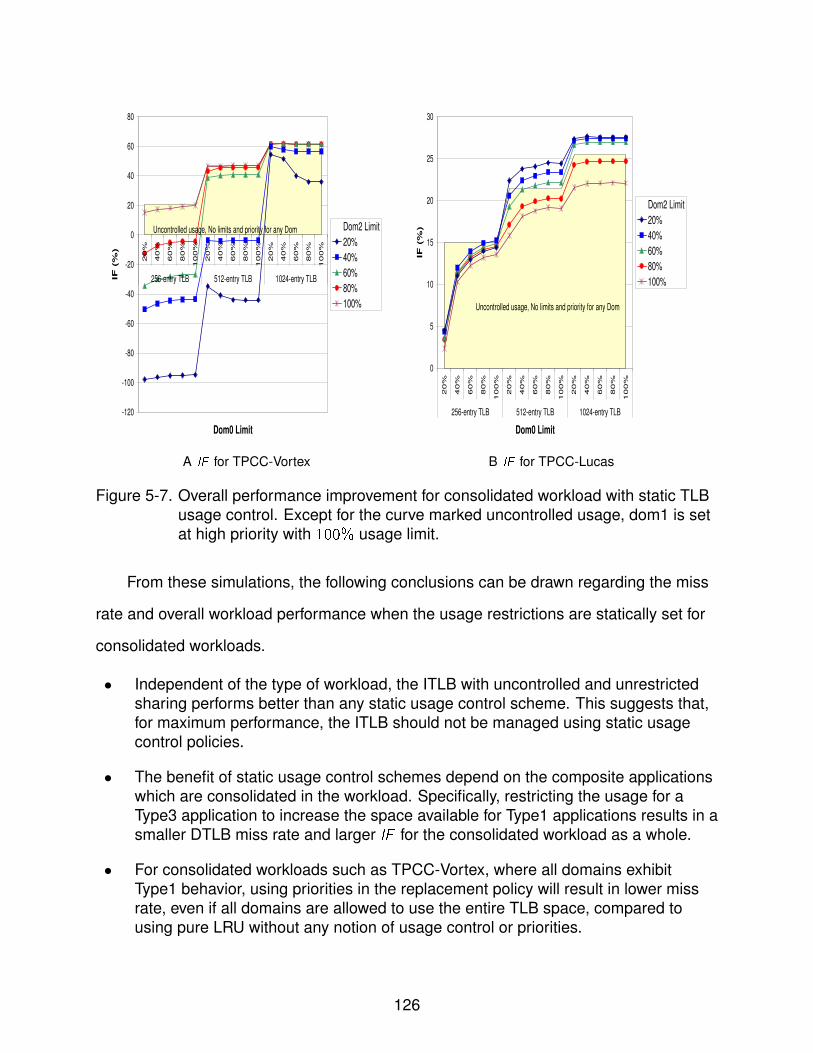
-120
-100
-80
-60
-40
-20
0
20
40
60
80
20
%
40
%
60
%
80
%
10
0%
20
%
40
%
60
%
80
%
10
0%
20
%
40
%
60
%
80
%
10
0%
256-entry TLB 512-entry TLB 1024-entry TLB
Dom0 Limit
IF (
%)
Dom2 Limit
20%
40%
60%
80%
100%
Uncontrolled usage, No limits and priority for any Dom
A IF for TPCC-Vortex
0
5
10
15
20
25
30
20
%
40
%
60
%
80
%
10
0%
20
%
40
%
60
%
80
%
10
0%
20
%
40
%
60
%
80
%
10
0%
256-entry TLB 512-entry TLB 1024-entry TLB
Dom0 LimitIF
(%
)
Dom2 Limit
20%
40%
60%
80%
100%
Uncontrolled usage, No limits and priority for any Dom
B IF for TPCC-Lucas
Figure 5-7. Overall performance improvement for consolidated workload with static TLBusage control. Except for the curve marked uncontrolled usage, dom1 is setat high priority with 100% usage limit.
From these simulations, the following conclusions can be drawn regarding the miss
rate and overall workload performance when the usage restrictions are statically set for
consolidated workloads.
• Independent of the type of workload, the ITLB with uncontrolled and unrestrictedsharing performs better than any static usage control scheme. This suggests that,for maximum performance, the ITLB should not be managed using static usagecontrol policies.
• The benefit of static usage control schemes depend on the composite applicationswhich are consolidated in the workload. Specifically, restricting the usage for aType3 application to increase the space available for Type1 applications results in asmaller DTLB miss rate and larger IF for the consolidated workload as a whole.
• For consolidated workloads such as TPCC-Vortex, where all domains exhibitType1 behavior, using priorities in the replacement policy will result in lower missrate, even if all domains are allowed to use the entire TLB space, compared tousing pure LRU without any notion of usage control or priorities.
126

5.5.3 Selective Performance Improvement With Static TLB Usage Control
The previous section examined the effect of static TLB usage control on the
performance improvement of consolidated workloads. From Figure 5-7, it was evident
that, as far as the IF for the entire consolidated workload was concerned, static usage
control policies were beneficial only when one of the restricted domains was a TLB
insensitive streaming workload. However, the motivation behind TLB usage control could
be to improve the performance of one selected high priority workload domain and not
the entire consolidated workload. The use of the CShare architecture to achieve this is
explored in this section.
To examine this, the consolidated workloads TPCC-Vortex and TPCC-Lucas are
simulated on a 1-cpu x86 machine with a CShare TLB of varying sizes and the V-SID
selection for performance enhancement algorithm shown in Table 5-1 used during TLB
misses. The same static usage control schemes explored in the previous section are
utilized here. In each of these schemes, except for the uncontrolled usage scheme,
dom0 and dom2 are set as the low priority domains while dom1 running TPCC-UVa is
set as the high priority domain. The per-domain IIPC for the workloads are observed from
these simulations. The IIPC trends for TPCC-Vortex and TPCC-Lucas for 512-entry TLB
as well as 1024-entry TLB sizes are presented in Figure 5-8.
When the IIPC variation for dom0 is considered, there is marked change in the IIPC
with the TLB usage limit imposed upon it. This trend in IIPC for various usage control
schemes is independent of the workload running on dom2, as dom0 mainly runs the
code for servicing TPCC-UVa’s I/O requests. When dom0’s usage is restricted to a
maximum of 20% of the total TLB space (20− 100− 20), the IIPC decreases by a factor of
0.83× for TPCC-Vortex and 0.81× for TPCC-Lucas. Moreover, since the V-SID selection
algorithm is not geared for performance isolation, the impact of altering the usage
limitations on dom2 is reflected in the IIPC values of dom0, as seen from the reduction
127
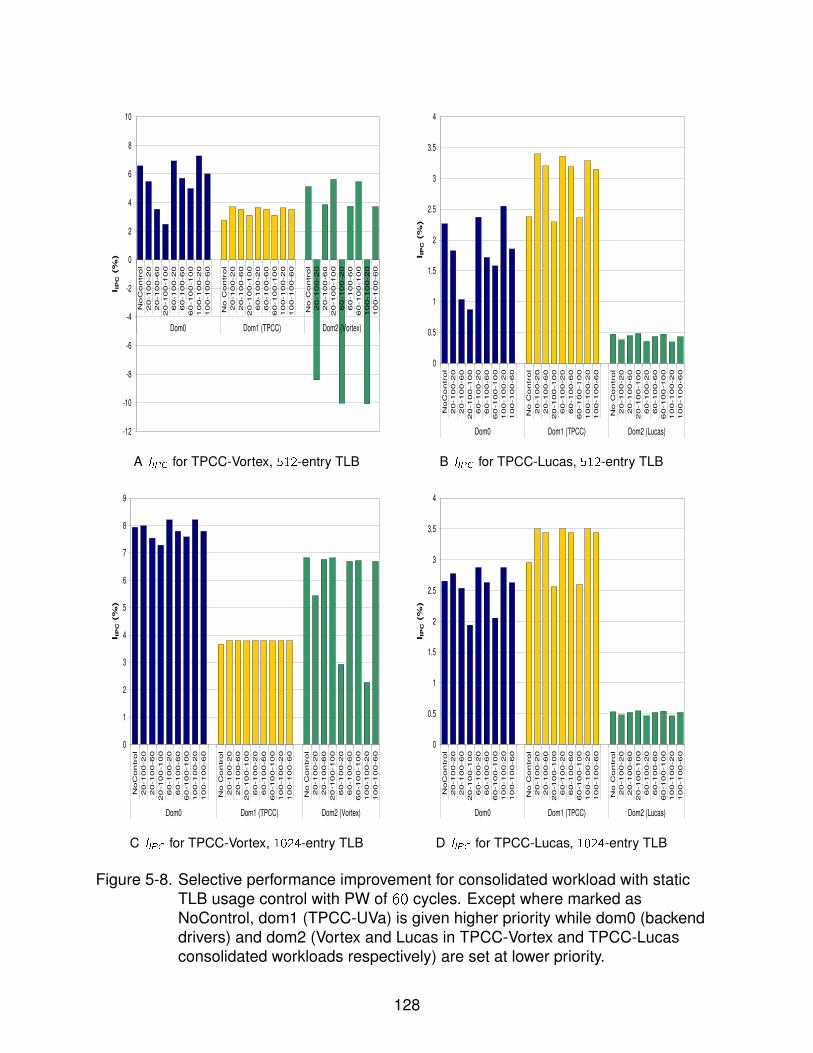
-12
-10
-8
-6
-4
-2
0
2
4
6
8
10
No
Co
ntr
ol
20
-1
00
-2
0
20
-1
00
-6
0
20
-1
00
-1
00
60
-1
00
-2
0
60
-1
00
-6
0
60
-1
00
-1
00
10
0-1
00
-2
0
10
0-1
00
-6
0
No
Co
ntr
ol
20
-1
00
-2
0
20
-1
00
-6
0
20
-1
00
-1
00
60
-1
00
-2
0
60
-1
00
-6
0
60
-1
00
-1
00
10
0-1
00
-2
0
10
0-1
00
-6
0
No
Co
ntr
ol
20
-1
00
-2
0
20
-1
00
-6
0
20
-1
00
-1
00
60
-1
00
-2
0
60
-1
00
-6
0
60
-1
00
-1
00
10
0-1
00
-2
0
10
0-1
00
-6
0
Dom0 Dom1 (TPCC) Dom2 (Vortex)
I IP
C (
%)
A IIPC for TPCC-Vortex, 512-entry TLB
0
0.5
1
1.5
2
2.5
3
3.5
4
No
Co
ntr
ol
20
-1
00
-2
0
20
-1
00
-6
0
20
-1
00
-1
00
60
-1
00
-2
0
60
-1
00
-6
0
60
-1
00
-1
00
10
0-1
00
-2
0
10
0-1
00
-6
0
No
Co
ntr
ol
20
-1
00
-2
0
20
-1
00
-6
0
20
-1
00
-1
00
60
-1
00
-2
0
60
-1
00
-6
0
60
-1
00
-1
00
10
0-1
00
-2
0
10
0-1
00
-6
0
No
Co
ntr
ol
20
-1
00
-2
0
20
-1
00
-6
0
20
-1
00
-1
00
60
-1
00
-2
0
60
-1
00
-6
0
60
-1
00
-1
00
10
0-1
00
-2
0
10
0-1
00
-6
0
Dom0 Dom1 (TPCC) Dom2 (Lucas)
I IP
C (
%)
B IIPC for TPCC-Lucas, 512-entry TLB
0
1
2
3
4
5
6
7
8
9
No
Co
ntr
ol
20
-1
00
-2
0
20
-1
00
-6
0
20
-1
00
-1
00
60
-1
00
-2
0
60
-1
00
-6
0
60
-1
00
-1
00
10
0-1
00
-2
0
10
0-1
00
-6
0
No
Co
ntr
ol
20
-1
00
-2
0
20
-1
00
-6
0
20
-1
00
-1
00
60
-1
00
-2
0
60
-1
00
-6
0
60
-1
00
-1
00
10
0-1
00
-2
0
10
0-1
00
-6
0
No
Co
ntr
ol
20
-1
00
-2
0
20
-1
00
-6
0
20
-1
00
-1
00
60
-1
00
-2
0
60
-1
00
-6
0
60
-1
00
-1
00
10
0-1
00
-2
0
10
0-1
00
-6
0
Dom0 Dom1 (TPCC) Dom2 (Vortex)
I IP
C (
%)
C IIPC for TPCC-Vortex, 1024-entry TLB
0
0.5
1
1.5
2
2.5
3
3.5
4
No
Co
ntr
ol
20
-1
00
-2
0
20
-1
00
-6
0
20
-1
00
-1
00
60
-1
00
-2
0
60
-1
00
-6
0
60
-1
00
-1
00
10
0-1
00
-2
0
10
0-1
00
-6
0
No
Co
ntr
ol
20
-1
00
-2
0
20
-1
00
-6
0
20
-1
00
-1
00
60
-1
00
-2
0
60
-1
00
-6
0
60
-1
00
-1
00
10
0-1
00
-2
0
10
0-1
00
-6
0
No
Co
ntr
ol
20
-1
00
-2
0
20
-1
00
-6
0
20
-1
00
-1
00
60
-1
00
-2
0
60
-1
00
-6
0
60
-1
00
-1
00
10
0-1
00
-2
0
10
0-1
00
-6
0
Dom0 Dom1 (TPCC) Dom2 (Lucas)
I IP
C (
%)
D IIPC for TPCC-Lucas, 1024-entry TLB
Figure 5-8. Selective performance improvement for consolidated workload with staticTLB usage control with PW of 60 cycles. Except where marked asNoControl, dom1 (TPCC-UVa) is given higher priority while dom0 (backenddrivers) and dom2 (Vortex and Lucas in TPCC-Vortex and TPCC-Lucasconsolidated workloads respectively) are set at lower priority.
128
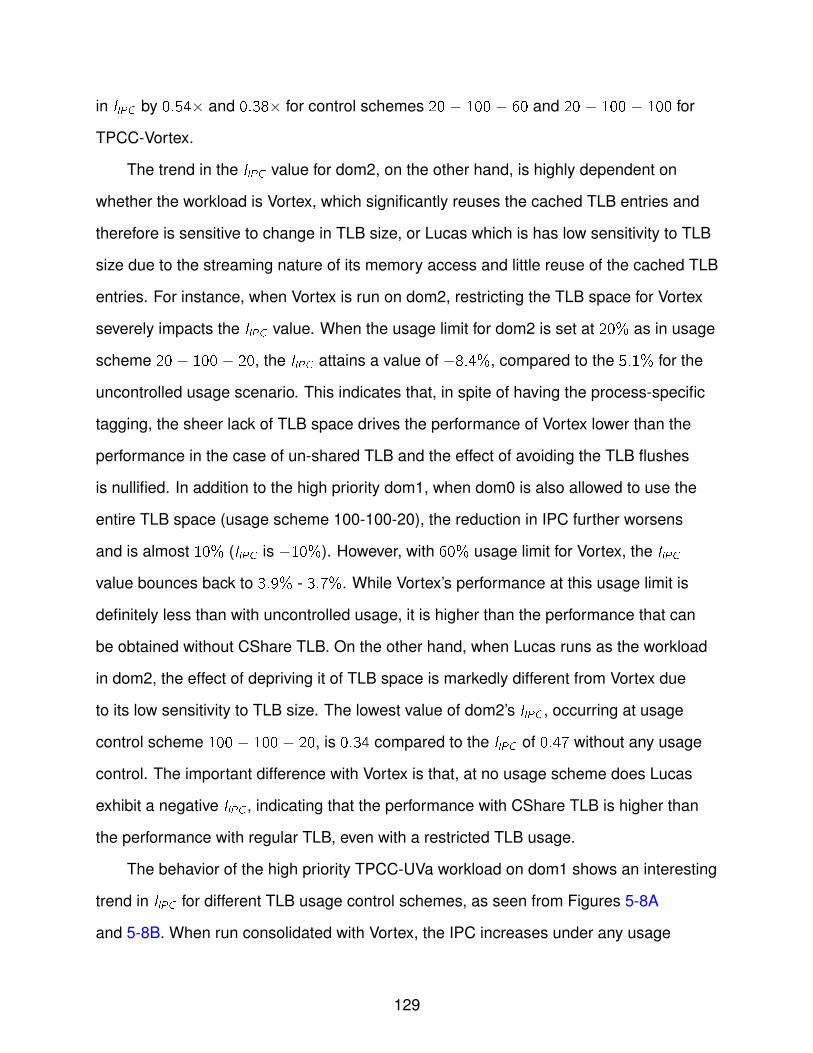
in IIPC by 0.54× and 0.38× for control schemes 20 − 100 − 60 and 20 − 100 − 100 for
TPCC-Vortex.
The trend in the IIPC value for dom2, on the other hand, is highly dependent on
whether the workload is Vortex, which significantly reuses the cached TLB entries and
therefore is sensitive to change in TLB size, or Lucas which is has low sensitivity to TLB
size due to the streaming nature of its memory access and little reuse of the cached TLB
entries. For instance, when Vortex is run on dom2, restricting the TLB space for Vortex
severely impacts the IIPC value. When the usage limit for dom2 is set at 20% as in usage
scheme 20 − 100 − 20, the IIPC attains a value of −8.4%, compared to the 5.1% for the
uncontrolled usage scenario. This indicates that, in spite of having the process-specific
tagging, the sheer lack of TLB space drives the performance of Vortex lower than the
performance in the case of un-shared TLB and the effect of avoiding the TLB flushes
is nullified. In addition to the high priority dom1, when dom0 is also allowed to use the
entire TLB space (usage scheme 100-100-20), the reduction in IPC further worsens
and is almost 10% (IIPC is −10%). However, with 60% usage limit for Vortex, the IIPC
value bounces back to 3.9% - 3.7%. While Vortex’s performance at this usage limit is
definitely less than with uncontrolled usage, it is higher than the performance that can
be obtained without CShare TLB. On the other hand, when Lucas runs as the workload
in dom2, the effect of depriving it of TLB space is markedly different from Vortex due
to its low sensitivity to TLB size. The lowest value of dom2’s IIPC , occurring at usage
control scheme 100 − 100 − 20, is 0.34 compared to the IIPC of 0.47 without any usage
control. The important difference with Vortex is that, at no usage scheme does Lucas
exhibit a negative IIPC , indicating that the performance with CShare TLB is higher than
the performance with regular TLB, even with a restricted TLB usage.
The behavior of the high priority TPCC-UVa workload on dom1 shows an interesting
trend in IIPC for different TLB usage control schemes, as seen from Figures 5-8A
and 5-8B. When run consolidated with Vortex, the IPC increases under any usage
129

scheme compared to the uncontrolled sharing scheme. The highest IIPC is seen
when the usage of both dom0 and dom1 are restricted to 20%. In this scheme,
TPCC-UVa’s IIPC increases by a factor of 1.4× compared to uncontrolled usage scheme.
However, especially in the case of TPCC-Vortex, setting a usage control scheme of
20 − 100 − 20 proves extremely expensive on the performance of Vortex. Increasing
dom2’s usage limit to 60% reduces the penalty imposed on dom2’s performance while
ensuring that the IPC of TPCC-UVa on dom1 is still higher than uncontrolled sharing.
With TPCC-Lucas, on the other hand, TPCC-UVa’s IIPC is actually smaller than the
uncontrolled sharing scheme when Lucas is allowed to use the entire TLB , due to the
streaming nature of Lucas’ memory access.
It can also be observed that usage control on the IIPC of dom1 significantly reduces
at larger TLB size of 1024-entry for TPCC-Vortex, however is still pronounced for
TPCC-Lucas. At this TLB size, the working set size of both TPCC-UVa as well as Vortex
can be accommodated in the TLB and awarding a larger share of the TLB for dom1
does not pay significant dividends. On the other hand, even a 1024-entry TLB is not
sufficient to hold its working set when consolidated with TPCC-UVa. Restricting Lucas’s
TLB usage, even at a large TLB size of 1024 entries, improves IIPC , and therefore the
performance, of TPCC-UVa.
From these simulations, it is observed that a usage control setting of 20 − 100 − 60
for TPCC-Vortex with a 512 entry TLB causes an IF of 62% for TPCC-UVa, implying
that 62% of the TLB-induced delay in TPCC-UVa can be eliminated by using the
CShare TLB. Similarly, for TPCC-UVa in TPCC-Lucas, an IF of 52% is observed for
512-entry TLB under this usage control scheme. These IFs translate to an increase in
TPCC-UVa’s IPC by about 3.5% at PW latency of 60 cycles and 16.5% at PW latency of
270 cycles.
From these analysis, the following observations can be deduced about controlled
TLB sharing using the CShare architecture for selective performance enhancement:
130

• The impact of usage control is pronounced as long as the TLB is insufficient tocapture the working set of all the workloads which share it, i.e. when the TLB is aresource of contention.
• When the TLB behavior of the low-priority workload is dependent on the size of theTLB, such as Vortex, restricting its TLB usage reduces its IPC by a larger value,than it increases the IPC of the high-priority application
• When the low-priority application exhibits streaming type of memory access,with low reuse of the cached TLB . entries, limiting the TLB space for thisapplication increases the IPC of the high priority application by a larger valuethan the reduction in the low-priority application’s IPC.
5.5.4 Performance Improvement With Dynamic TLB Usage Control
From Section 5.5.3, it is evident that the cost of selectively enhancing the performance
of a high priority workload, i.e. the reduction in the performance of the low priority
workload, depends on the nature of the workload. For workloads such as Lucas, the
cost is smaller than the increase in the high priority workload performance. However, for
TLB sensitive applications such as Vortex, the cost outstrips the performance benefit.
As a result, the overall performance of the consolidated workload reduces as seen from
Figure 5-7A.
However, the TLB usage of many TLB-sensitive applications have distinct phases:
some where the pressure exerted on the TLB is quite high and some phases where
the TLB usage is low. Unlike a static usage control policy, as used in Section 5.5, a
dynamic usage control policy will be able to exploit these different phases by temporarily
allocating a larger share of the TLB for the low-priority application when it is in a high
TLB usage phase and restricting the TLB usage only in low TLB usage phases.
In order to implement such dynamic usage policies, a phase analyzer functionality
is added to the CShare TLB as shown in Figure 5-9. The phase analyzer architecture
consists of a bank of registers, similar to the performance monitoring units (PMUs).
These registers are used to track the miss rate of the TLB on a per-SID basis, in a
fashion similar to the PMUs for tracking cache statistics in current processors [28], as
shown in step ..1 . It also consists of a countdown timer which can be used to set the
131

SID
TLB MISS CNTSID
PHASE
ANALYZER
COUNTDOWN TIMER
VASISID
TLB
VPN PPN
SID SHARE
TLB SHARE TABLE
PRI CNT
CR3 SID
TAG
MANAGER
TABLE
CR3
VASI
VASI
CCR
2PHASE ANALYZER
FUNCTIONALITY
IS INVOKED
1
TLB MISSES
ARE TRACKED
3SHARE FOR
SID IS RESET
Figure 5-9. Dynamic TLB Usage Control with a Phase Analyzer. TLB misses are trackedas shown in step ..1 . When the phase analyzer functionality is invoked atprogrammed intervals, as shown in step ..2 , the miss rate over the pastinterval is calculated and used to adjust the SHARE value for the sharingclasses, as shown in step ..3 .
frequency at which the phase analyzer functionality is invoked. This timer is set to the
desired value and is decremented on every clock tick. Once the timer reaches zero, and
the next capacity or forced flush occurs, the phase analyzer functionality is triggered.
The idea behind incorporating the phase analysis functionality as a part of the TLB flush
behavior is to avoid the gratuitous flushing of the TLB after reallocation.
On invocation, as shown in step 2 of Figure 5-9, the phase analyzer examines the
current usage of the TLB by calculating the TLB miss rate since the last invocation. It
then uses this miss rate and the past history of the miss rate change the TLB usage
limit of the low priority domain s shown in step ..3 . For instance, If the trend in the miss
rate is increasing, the SHARE value of the low priority workload domain is increased
compared to the current allocation. If the miss rate of the current phase, however, is
lower than the previous phase, the usage of the low priority workload domain is further
132
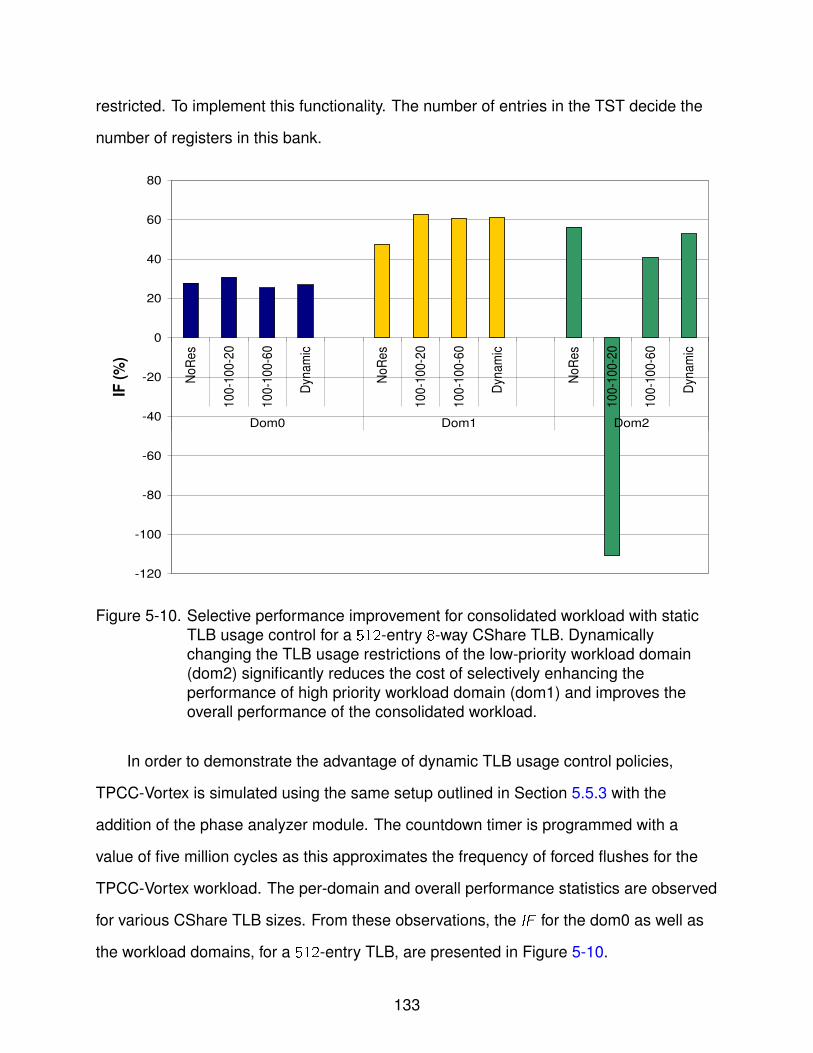
restricted. To implement this functionality. The number of entries in the TST decide the
number of registers in this bank.
-120
-100
-80
-60
-40
-20
0
20
40
60
80N
oR
es
10
0-1
00
-20
10
0-1
00
-60
Dyn
am
ic
No
Re
s
10
0-1
00
-20
10
0-1
00
-60
Dyn
am
ic
No
Re
s
10
0-1
00
-20
10
0-1
00
-60
Dyn
am
ic
Dom0 Dom1 Dom2
IF (
%)
Figure 5-10. Selective performance improvement for consolidated workload with staticTLB usage control for a 512-entry 8-way CShare TLB. Dynamicallychanging the TLB usage restrictions of the low-priority workload domain(dom2) significantly reduces the cost of selectively enhancing theperformance of high priority workload domain (dom1) and improves theoverall performance of the consolidated workload.
In order to demonstrate the advantage of dynamic TLB usage control policies,
TPCC-Vortex is simulated using the same setup outlined in Section 5.5.3 with the
addition of the phase analyzer module. The countdown timer is programmed with a
value of five million cycles as this approximates the frequency of forced flushes for the
TPCC-Vortex workload. The per-domain and overall performance statistics are observed
for various CShare TLB sizes. From these observations, the IF for the dom0 as well as
the workload domains, for a 512-entry TLB, are presented in Figure 5-10.
133

From this figure, it can be clearly seen that dynamically managing the TLB usage
of Vortex running on dom2 significantly reduces the cost of selective performance
enhancement. For instance, at a static usage restriction of 100 − 100 − 20, where the
lower priority dom2 is restricted to use only 20% of the TLB while the higher priority
workload dom1 running TPCC-UVa as well as the driver domain dom0 are allowed to
use the entire TLB space, the IF of TPCC-UVa increases from 47% to 63%. However,
the cost of this increase is an IF of −110% for dom2. In other words, the delay due
to the TLB misses and page walks for dom2 when such a static restriction is used is
more than twice the delay of the untagged TLB. The benefit of using the tagged TLB,
which is a lowering of the TLB delay by 56% in the uncontrolled case, is more than
offset with static usage restrictions. Even at 60% usage restriction for dom2, the cost in
terms of the lowering of IF compared to the uncontrolled case is about 15%. However,
with dynamic control using the phase analyzer, the cost is reduced to 4% which the
benefit in terms of the IF for dom1 increases by 14% from the uncontrolled case.
These translate into IIPC values of 3.59% and 4.87% for dom0 and dom1 respectively,
about 1.3× and 0.96× the IIPC without explicit TLB usage controls. Moreover, while
not shown in the figure, the IF of the overall consolidated workload increases by
about 2%. Thus, with dynamic usage control it becomes possible to achieve selective
performance enhancement for TPCC-UVa running on dom1 without significantly
lowering the performance of the lower priority dom2.
5.6 Summary
In this chapter, the CShare TLB is proposed for enabling the sharing of the
TLB using process-specific tagging in a controlled manner. The TLB usage control
mechanism in the CShare TLB can be used for isolating the TLB performance of various
domains which share a TLB by explicitly reserving portions of the TLB for different
domains. Moreover, by statically partitioning the TLB space to restrict the TLB usage
for a low priority domain, the performance of the high priority domain can be increased.
134

This is accompanied by an increase in the overall consolidated workload performance
if the low priority domain being restricted exhibits a TLB-insensitive streaming usage
pattern. However, if the low priority domain is TLB sensitive, the cost of restricting its
TLB usage can be significant, even to the extent of reducing the overall performance
of the consolidated workload. This cost can be reduced by using dynamic TLB usage
control policies to restrict the TLB usage of the low priority domain only during phases
where the TLB usage is not high. Using such usage control, the performance increase
for a high priority workload domain achieved by using an uncontrolled process-specific
tagged TLB can be selectively increased by about 1.4×.
135
CHAPTER 6CONCLUSION AND FUTURE WORK
Improving the performance of virtualized workloads and managing the sharing
of resources among the component applications of consolidated workloads are two
challenges in virtualization. Meeting these challenges, specifically in the context of
hardware-managed Translation Lookaside Buffers (TLBs), forms the theme of this
dissertation.
In order to understand the performance degradation caused by the high-frequency
TLB flushing on virtualized platforms and to investigate the impact of various schemes
that are proposed to reduce the TLB-induced delay, simulation frameworks supporting
detailed and customizable performance and timing models for the TLB are needed. To
address this issue, a full-system simulation framework supporting x86 ISA and TLB
models is developed, validated and used to experimentally evaluate the performance
implications of the TLB in virtualized environments. The tagged TLB model developed
in this work is designed to be generic enough to support the simulation of both
process-specific as well as VM-specific tagging. This is the only academic simulation
framework that provides a detailed timing model for the TLB and simulates the walking
of page tables on a TLB miss. Moreover, this framework is capable of simulating
multiprocessor multi-domain workloads, which makes it uniquely suitable for studying
virtualized platforms. Using this framework, the TLB behavior of I/O-intensive and
memory-intensive virtualized workloads is characterized and contrasted with their
non-virtualized equivalents. It is shown that, unlike non-virtualized single-O/S scenarios,
the adverse impact of the TLB on the workload performance is significant on virtualized
platforms. Using the developed simulation framework, it is shown that this performance
reduction for virtualized workloads is as much as 35% due to the TLB misses which are
caused by the repeated flushing of the TLB and the subsequent page walks to service
these misses.
136

This dissertation proposes a novel microarchitectural approach called the Tag
Manager Table (TMT) to reduce the TLB-induced performance delay for virtualized
workloads. The TMT approach involves tagging the TLB entries with tags that are
process-specific, thus associating them with the process which owns them. By tagging
the TLB entries, TLB flushes can be avoided during context switches. The TMT is
designed to generate and manage these tags in a software-transparent fashion
while ensuring low-latency of TLB lookups and imposing a small area overhead.
Using the simulation framework developed in this dissertation, It is found that using
process-specific tags reduces the TLB miss rate by about 65% to 90% which, depending
on the TLB miss penalty, translates into a 4.5% to 25% improvement in the performance
of the workloads. The architectural parameters and workload dependent factors that
influence the performance benefit of using the TMT are investigated and prioritized on
the basis of the significance of their influence.
Since the tags are generated at a process-level granularity and are not tied to
any virtualization-specific aspect, the TMT may be used to avoid TLB flushes in
non-virtualized scenarios as well. Moreover, the TMT may also be used to enable
TLB sharing across multiple per-core private TLBs using a hierarchical design with a
shared Last Level TLB (LLTLB), which reduces the TLB miss rate by 15% to 28% due to
a better utilization of the TLB space. The use of the Tag Manager Table in tagging I/O
TLBs is proposed and validated using a full-system simulation-based prototype.
The third part of this dissertation addresses the issue of usage control in the tagged
TLB which, because of the tagging, is shared amongst multiple processes. The CShare
TLB architecture is proposed to control the TLB sharing. The TLB usage of different
applications is analyzed and classified depending on how well they use the TLB space.
Based on this, the performance improvement due to the TMT without any explicit usage
controls is further increased by using the CShare architecture to provide a larger TLB
space to those applications which have a higher priority and to restrict the TLB usage
137
of TLB-insensitive applications. The use of dynamic TLB usage control policies to
provide this further performance improvement, even when the restricted workload is
TLB sensitive, is investigated. Using such control, the performance increase for a high
priority workload domain achieved by using an uncontrolled process-specific tagged
TLB can be selectively increased by about 1.4×. The use of the CShare architecture
in ensuring TLB performance isolation amongst domains which share the TLB is also
explored.
While the Tag Manager Table is motivated by the need to improve performance in
virtualized scenario, process-specific tagging of the TLB entries is key to enabling many
architectural features which are common on RISC architectures with software-managed
TLBs and which depend on the ability to associate TLB entries with the address space
for which they are valid. Using the TMT-generated process-specific tags creates these
associations in platforms with hardware-managed TLBs, like x86, and enable the
adoption of ideas such as coherent TLBs and virtual caches on these platforms. The
work presented in this dissertation forms the foundation for such future exploratory
research.
138
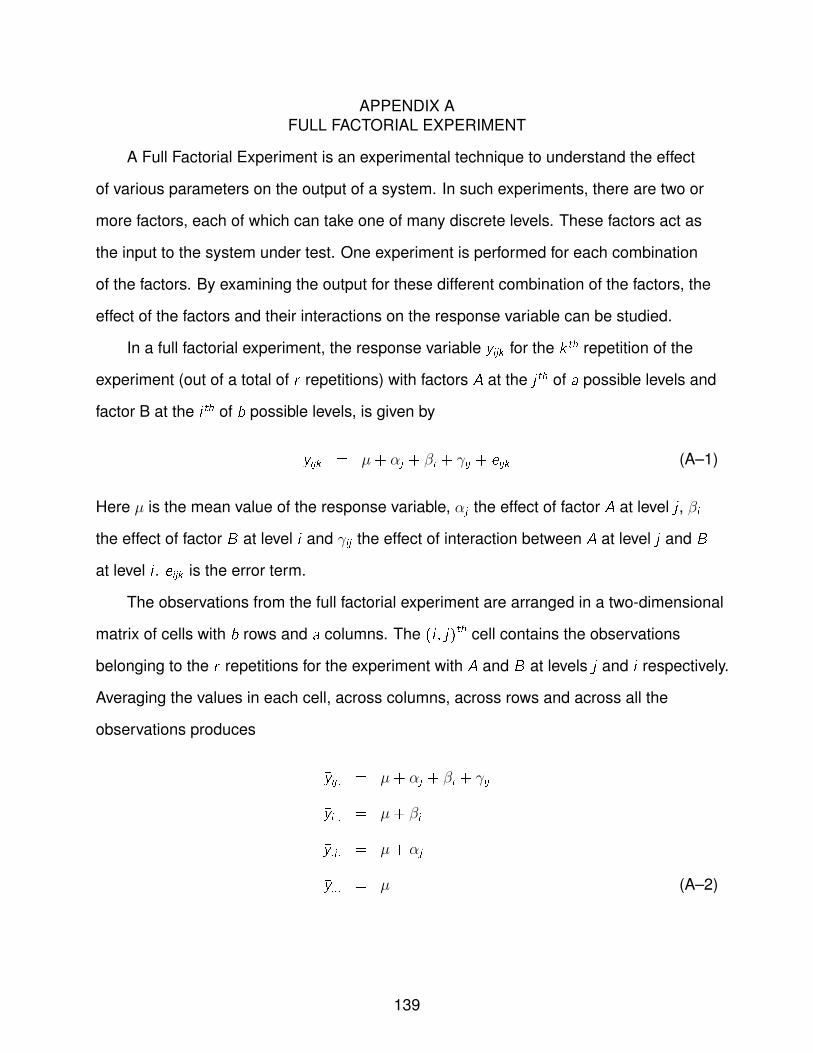
APPENDIX AFULL FACTORIAL EXPERIMENT
A Full Factorial Experiment is an experimental technique to understand the effect
of various parameters on the output of a system. In such experiments, there are two or
more factors, each of which can take one of many discrete levels. These factors act as
the input to the system under test. One experiment is performed for each combination
of the factors. By examining the output for these different combination of the factors, the
effect of the factors and their interactions on the response variable can be studied.
In a full factorial experiment, the response variable yijk for the k th repetition of the
experiment (out of a total of r repetitions) with factors A at the j th of a possible levels and
factor B at the i th of b possible levels, is given by
yijk = µ+ αj + βi + γij + eijk (A–1)
Here µ is the mean value of the response variable, αj the effect of factor A at level j , βi
the effect of factor B at level i and γij the effect of interaction between A at level j and B
at level i . eijk is the error term.
The observations from the full factorial experiment are arranged in a two-dimensional
matrix of cells with b rows and a columns. The (i , j)th cell contains the observations
belonging to the r repetitions for the experiment with A and B at levels j and i respectively.
Averaging the values in each cell, across columns, across rows and across all the
observations produces
�yij . = µ+ αj + βi + γij
�yi .. = µ+ βi
�y.j . = µ+ αj
�y... = µ (A–2)
139

From these equations, the effects can be calculated as
µ = �y...
αj = �y.j . − �y...
βi = �yi .. − �y...
γij = �yij . − �yi .. − �y.j . + �y...
eijk = yijk − �yij . (A–3)
The variation of the output variable can be allocated among the two factors and their
interaction by squaring both sides of Equation A–1, and assigning the different terms the
notations shown in Equation A–4
∑ijk
y 2
ijk = abrµ2 + brσjα2
j + arσiβ2
i + rσijγ2
ij + σijke2
ijk
SSY = SS0 + SSA+ SSB + SSAB + SSE (A–4)
From these values, the percentage variation due to factors A and B, the interaction
AB as well as an unexplained part due to experimental errors are calculated as shown
in Equation A–5
SST = SSY − SS0
= SSA+ SSB + SSAB + SSE
%VariationA = 100× SSA
SST
%VariationB = 100× SSB
SST
%VariationAB = 100× SSAB
SST
%VariationErr = 100× SSE
SST(A–5)
When the number of factors involved become large, as in Chapter 4, the estimation
of the significance of each factor can be computed using statistical software such as
SAS [116].
140

APPENDIX BFULL FACTORIAL EXPERIMENTS USING THE SIMULATION FRAMEWORK
A typical form of simulation-based studies is parametric sweeps. Such studies,
similar to the experiments detailed in Section 4.4, consist of running a large number of
long running simulations with varying key parameters for each simulation run. Typically
such large running simulation jobs are performed on dedicated cluster resources or on
distributed grids. This appendix provides the details of setting up the simulation runs on
a typical cluster as well as on a wide area grid.
The dedicated cluster on which the simulations are run is the University of Florida
High Performance Computing Cluster [117]. The HPC consists of a centralized Linux
cluster, two large-scale shared file systems, and a dedicated high speed network.
To set up a parametric sweep in this environment, checkpoints are created using the
methods outlined in Section 3.3.4 and transferred to the $HOME directory of the user
in HPC. From here, a submission script is written for each simulation which specifies
the parameters such as the estimated time for the simulation, using the results from
Section 3.4. The script also contains commands which starts the simulation in batch
mode, configures the appropriate parameters such as the page walk latency, proceeds
with the simulation and archives the results on completion of the job.
To conduct large scale simulation studies, wide-area grid resource in Archer [25] is
also used. Archer is an open infrastructure for simulation-based computer architecture
research. Archer consists of a few hundred cores, each with Simics installed in it,
connected through a wide area P2P network. It also has a cluster wide NFS which
facilitates the sharing of files on a node seamlessly throughout the cluster. Using this
infrastructure one or more nodes are populated with the checkpoints of the workloads.
Using this node as a repository for the checkpoints, many simulations are started off and
configured to run in parallel with different parameter values for each run.
141
APPENDIX CUSING THE TAG MANAGER TABLE FOR TAGGING I/O TLB
Power and performance considerations for high throughput computing platforms are
leading to a situation wherein simpler CPU cores are becoming the processor of choice
even for high throughput platforms. A case in point is the trend of the Intel Atom family
of processors being increasingly preferred, in spite of their lower processing capability,
in high throughput servers over power hungry but more capable processor variants
such as Xeon [118, 119]. To fill this gap in advanced and specialized functionalities, the
high throughput platforms with low-power processors need to either execute these
functionalities in software, on the main processor cores, or integrate specialized
hardware units or accelerators which offer these functionalities for offload. Various
power/performance tradeoffs dictate the later as the approach of choice [118]. Even in
cases where more complex processor architectures are employed, there are significant
power savings to be obtained by employing specialized accelerators designed for
common compute intensive functions and offloading such functions from the complex
processor to these accelerators.
Traditional approaches for integrating such specialized accelerators and for
offloading jobs to them view the accelerator as a device and rely on a software
device driver for interfacing. This approach works well when the execution time on
the accelerator is of a magnitude bigger than the overheads incurred in offloading a task.
However, for the case in point i.e. High performance systems with very fine-grain
functionality offload, a generic interface specification that reduces performance
overheads and allows seamless portability of programs across platforms with varying
degrees of hardware support is needed [120–122]. Several approaches including
allowing the accelerator to operate in the application domain’s virtual memory space,
making applications offload aware and achieving tight integration between CPUS
and accelerators have been proposed. However, in order to allow the accelerator to
142
operate in the same address space as the process, the accelerator has to be aware
that the offloaded data is being specified by an address in the virtual address domain.
Moreover, the virtual address should be translated to the physical address before the
data can be accessed from memory. Thus, for performance considerations, an I/O TLB
is needed to cache the virtual to physical translations used by the accelerator. Since
multiple processes may offload jobs to the accelerator in an interleaved fashion, this
TLB should be capable of being shared by multiple process’s address spaces [120].
The Tag Manager Table may be used in this scenario. In this dissertation, one specific
accelerator interfacing scheme, Virtual Memory Accelerator (VMA) [120], is considered
and the use of the TMT in this VMA architecture is demonstrated.
C.1 Architecture of VMA
The two major objectives of VMA are 1. establishing a low-latency interface with
minimum software overheads for improved performance and 2. allowing user-mode
data offload for programmability and seamless portability of the application across
platforms with varying degrees of hardware support. VMA achieves this by allowing the
accelerators to work in the same address space domain as the process which offload
to it and by providing an extended ISA for offloading the task to the accelerator. The
architecture of VMA, as shown in Figure C-1, has four components:
• Extended ISA for offloading: The offloading infrastructure consists of themechanism in which the user application offloads a task to the accelerator.The information which has to be passed to the accelerator, typically includes asource buffer with the data, a destination buffer to store the processed resultsand a command word which informs the accelerator on how the data shouldbe processed. This is implemented by extending the ISA with two instructionsPUTTXN and GETTXN. The PUTTXN instruction provides a process an atomicmethod to send data and command word to the accelerator. This instructionreturns a unique transaction ID that the process can use to query the hardware forcompletion status. The GETTXN instruction provides a process with a method forquerying the hardware for completion status for a given transaction.
• Virtual memory aware accelerators: Hardware accelerators can be made ”virtualmemory aware” by providing them with an application context at the time of offload,by including a ”context ID” as a part of the offloaded functionality. This context id
143
is then provided by the accelerator as a part of every memory transaction that itissues, in order to identify the process address space in which it operates and tofacilitate mapping from this address space to the physical memory space.
• IPMMU for I/O virtual to physical address translations: The IP (IntellectualProperty) memory management unit (IPMMU) is provided in the interconnectionfabric and offers address translation services to the accelerators so that they canexecute in virtual memory domain. This also allows the programs to access theaccelerator functions directly from the user space and communicate using virtualmemory addresses. When the accelerator tries to access application memorywith a virtual address, the Accelerator Memory Management Unit (IPMMU) willintercept the request and automatically translate the virtual address into thecorresponding physical address. For address translation efficiency, IPMMUcontains a TLB to cache the recent address translations. This I/O TLB is similarin structure and organization to the core TLB with the addition of a tag whichidentifies the entry in a TLB with the context of the application for whose addressspace the translation is valid.
• Page Fault Handling: Similar to page faults caused during the address translationon the core, memory accesses initiated by the accelerator and intercepted bythe IPMMU may fail in the address translation. VMA implements a fault reportingmechanism which delivers this I/O page fault to the software stack running on thesystem and a fault handling mechanism consisting of software modules to handlethese page faults.
C.2 Prototyping and Simulating the VMA Architecture
In order to model the hardware and software components of VMA, Virtutech
Simics, which has been discussed in detail in Section 3.2.1, is chosen as the simulation
framework for developing the VMA prototype. Using Simics, a platform consisting of
an Intel Xeon CPU with an X58 chipset and ICH10 Southbridge is simulated and 64-bit
Linux2.6.28 is booted on this platform. This platform, shown in Figure C-1, is used for
modeling and simulating the VMA prototype.
Extending the ISA with offload instructions
In order to simulate the PUTTXN and GETTXN instructions for enabling fine-grained
instruction based offload, the Magic Instruction capability of Simics is used. The magic
instruction, for x86 models, is the xchg bx, bx instruction. When this is executed by
the software stack running in the simulated platform, Simics stops the simulation and
144
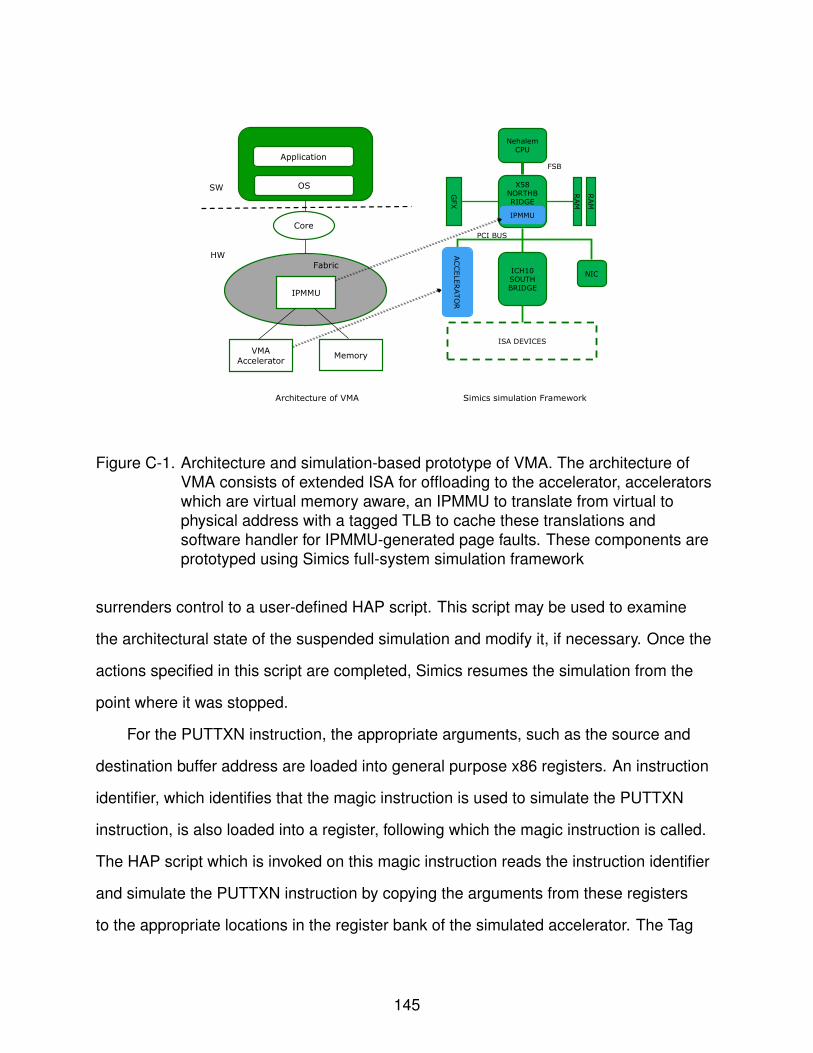
Application
OS
Fabric
IPMMU
VMA
AcceleratorMemory
SW
HW
Core
Nehalem CPU
X58 NORTHBRIDGE
RAM
GFX
NIC
RAM
PCI BUS
FSB
ISA DEVICES
ICH10 SOUTHBRIDGE
IPMMU
ACCELERATOR
Architecture of VMA Simics simulation Framework
Figure C-1. Architecture and simulation-based prototype of VMA. The architecture ofVMA consists of extended ISA for offloading to the accelerator, acceleratorswhich are virtual memory aware, an IPMMU to translate from virtual tophysical address with a tagged TLB to cache these translations andsoftware handler for IPMMU-generated page faults. These components areprototyped using Simics full-system simulation framework
surrenders control to a user-defined HAP script. This script may be used to examine
the architectural state of the suspended simulation and modify it, if necessary. Once the
actions specified in this script are completed, Simics resumes the simulation from the
point where it was stopped.
For the PUTTXN instruction, the appropriate arguments, such as the source and
destination buffer address are loaded into general purpose x86 registers. An instruction
identifier, which identifies that the magic instruction is used to simulate the PUTTXN
instruction, is also loaded into a register, following which the magic instruction is called.
The HAP script which is invoked on this magic instruction reads the instruction identifier
and simulate the PUTTXN instruction by copying the arguments from these registers
to the appropriate locations in the register bank of the simulated accelerator. The Tag
145
Manager Table is also queried and the VASI from the CCR of the CPU on which the
offloading application is executing is also provided to the accelerator as the context id.
This script also generates a transaction id and updates both the accelerator as well as
the general purpose register in which the source buffer address was specified with this
transaction id. The script also provides the Software Trigger to the accelerator to initiate
the offload. On resuming the simulation, the accelerator begins to process the offloaded
task by issuing PCI transactions for accessing the data from the source buffer. The
offloading application reads the transaction id from the general purpose register which
was populated by the HAP script.
The GETTXN instruction is simulated in a similar fashion using the magic instruction
by loading the identifier for the GETTXN instruction as well as the transaction id into
general purpose registers and then executing the magic instruction. The script invoked
on the execution of the magic instruction checks the completion bit in the hardware
accelerator and copy this value into the EAX register. On resuming the simulation, the
value which has been loaded in the EAX register is read by the user application to check
the completion status of the offloaded task.
It should be noted that the use of the general purpose registers is an artefact of
simulation. In reality, a location in memory can be used to offload the task and to read
the transaction id. The accelerator may be made aware of this memory location during
the boot-up initialization.
Prototyping the virtual memory aware accelerator
The sample accelerator prototyped in this research is a PCI based image
processing accelerator with fine grain functionality offloads1 . A PCI based accelerator
1 It should be noted that the fine granularity refers to the functionality that is offloadedand not to granularity of the data size. One example of such fine-grained functionalityis the SIMD extensions such as SSE and AVX which operate on 128-byte wide and
146
is chosen due to the ease of modeling such devices and integrating the model with the
simulated machine in Simics.
Similar to most PCI Type 0 device, the configuration space of the accelerator model
is implemented as a bank of registers which are programmed by the O/S during device
discovery and enumeration and can map up to six functional regions into the address
space of the CPU. The accelerator also implements a 4KB internal buffer used for the
internal computation of the accelerator which is not mapped into the processor address
space. The accelerator utilizes two of the six functional regions, FN0 and FN1. Each
of these functional regions consists of a bank of registers, which can be addressed as
Memory-mapped I/O (MMIO) addresses after device enumeration.
FN0 implements a simple Sum-of-Products (SOP) functionality. A SOP computation
can be offloaded to the accelerator by writing the address of the source buffer
which contains the elements of the row and column along with the dimension of the
row/column as well as the destination buffer to the appropriate registers in FN0. Once
these buffer addresses are provided, the computation of the SOP is initiated by writing
to the ”Software Trigger” register in the FN0 register bank. On receiving the trigger, the
accelerator reads the contents from the source buffer using PCI-to-memory transactions,
computes the SOP and writes the result to the specified destination buffer. Then, it
sets a completion bit in its register bank. The completion of the offloaded task may be
notified to the software stack by either converting the setting of the completion bit to an
I/O interrupt or by polling the completion bit in this register bank at regular intervals. FN1
implements a pixel manipulation functionality. Given an image and the transformation
matrix, FN1 multiplies each of the pixel by the transformation matrix and writes the
transformed image into the specified destination buffer. A user application can offload
256-byte wide data and perform fine-grained operations such as floating point arithmeticon these data
147
an image manipulation functionality to the accelerator by writing to FN1’s registers in a
manner similar to the FN0 offload. These functionalities are chosen as they are quite
important in image processing and are ideal candidates for acceleration [123].
The accelerator is made Virtual Memory Aware by providing the context information
(VASI tag) as apart of the offload. The accelerator then includes this context id as a part
of every PCI to memory transaction. In order to achieve this, the format of the PCI bus
TLP header is changed and the context information field is added to it. Moreover, by
incorporating the context id as apart of the PCI transaction, the accelerator is able to
support offloads from multiple user processes with different contexts and process these
in an interleaved and pipelined fashion.
Handling IPMMU-generated page faults
When the IPMMU walks the page tables to translate the virtual address belonging
to a particular process to its physical equivalent, this page walk may result in a page
due to mismatch in the access permissions for the page (Read/Write permissions or
User/Supervisor privileges) and the desired type of access. However, a more common
reason for page faults is the lack of a physical page corresponding to the virtual address
being accessed. For instance, in Linux, typical allocations of user space buffers are lazy
in nature (i.e.), the physical memory for the buffers are not assigned when the buffers
are created. When the program running on the core attempts to access the buffer, this
results in a demand page fault. The O/S page fault handler allocates the page and
updates the page table and then restarts the faulting instruction.
In the VMA architecture, since the accelerator also works in the same virtual
address space as the user application, the transactions it issues may also cause
such demand paging faults. In addition, swapping out of the physical pages page
corresponding to a user-space buffer (due to memory limitations) before that buffer
can be accessed by the accelerator may also generate page faults. Whenever a page
fault is caused by the IPMMU walking the page tables, the cause of that page fault is
148

determined. If it is due to a mismatch in the permissions or privilege bits, this is treated
as an unrecoverable error and the PCI read/write transaction is terminated with an
explicit error indication, as mandated by the PCI standards [124]. The accelerator,
on such terminated PCI requests, waits for a certain retry period and then reissues
the transaction. This retry period can be effectively hidden by the accelerator issuing
memory requests of another offloaded task while it is waiting. After a certain number
of retries, if the PCI transaction cannot be completed, the accelerator terminates the
offloaded job by setting the completion bit and indicates the unsuccessful completion of
the task by setting an error bit.
For page faults caused by the lack of an entry in the page tables, the IPMMU
raises an interrupt using the IPMMU Fault Reporting Mechanism (FRM). The FRM
is similar to the VT-d fault reporting mechanism [125]. It consists of a bank of Fault
Recording Registers (FRR), as shown in Figure C-2, with each register having fields
for storing the faulting address and the process context in which the fault occurred. The
IPMMU populates one of these registers with the faulting information and raises an
interrupt. Then, it terminates the PCI transaction with an explicit error indication. The
IPMMU software fault handler catches the interrupt and verifies that the interrupt was
raised due to a page fault. It then reads the faulting address and context from the Fault
Recording Register, allocates physical memory and maps the faulting virtual address
to the allocated memory by updating the page tables. The IPMMU fault handler then
clears the Fault Recording Register and terminates. Subsequently, when the faulting
PCI transaction is reissued by the accelerator, the page walk results in a successful
translation of the virtual to physical address and the transaction successfully completes.
Simulating the IPMMU and the I/O TLB
The IPMMU is implemented on the Simics simulated platform in the Northbridge,
as shown in Figure C-2. It is designed to intercept all traffic between the accelerators
(I/O devices) and memory, in order to provide translation for requests from VM aware
149

accelerators. On intercepting a PCI-to-memory transaction, the IPMMU examines the
context id field of the TLP header. The presence of a non-zero context id indicates that
the device which originated the transaction is a VMA device and the target address
specified in the transaction is a virtual address.
CPU
NORTHBRIDGE
RAM
PCI BUS
FSB
IPMMU
CORE
TLB
IPMMU
TLB
IPMMU
FRR
PW
FUNCTIONALITY
Figure C-2. IPMMU and I/O TLB
Using the supplied context id, the IPMMU first checks to see if the translation
is cached in the IPMMU Translation Lookaside Buffer (I/O TLB). This IPMMU TLB
is a tagged TLB, similar to the architecture described in Section 4.2. Every entry is
annotated with the context id of the offloading user application. Such a tagged design
allows the translations of multiple processes to coexist in the TLB and allows the IPMMU
to handle translation requests from multiple user applications in an interleaved fashion. If
the required virtual to physical translation for the context id of the PCI transaction being
currently processed is not found in the IPMMU TLB, the IPMMU initiates an address
translation process by walking the O/S page tables of the user application. Once the
page walk is completed, and the physical address corresponding to the virtual address
150

is obtained, the IPMMU reprograms the PCI transaction with this physical address and
allows it to access the data from that physical address. This translation is also added
to the TLB and tagged with the context id of the offloading user application to which it
belongs.
C.3 Using the Tag Manager Table in VMA Architecture
Since multiple processes may offload tasks to the multiple accelerators, and since
these may be executed in an interleaved fashion, the IPMMU will have to perform
address translations for multiple address spaces in an interleaved fashion. Given this, it
is imperative to tag the I/O TLB entries and thereby ensure that multiple process entries
may be cached concurrently. The Tag Manager Table may be used for generating this
process-specific tag.
In this work, the I/O TLB is designed to have a separate TMT. The CR3 value of
the offloading process itself is used as the context id. The TMT establishes unique
CR3-to-VASI mappings and uses these VASIs to tag the TLB entries. The IPMMU,
on intercepting a memory access from the accelerator, uses the TMT to get the
CR3-to-VASI mapping and looks up the tagged TLB using this VASI for the required
translation. If this translation is not present, the page walk is performed and the
computed translation is annotated with the VASI and cached in the TLB. A simple
TLB synchronization scheme, wherein every core TLB flush also flushes the I/O TLB, is
used. However, it is also possible to use a core tagged TLB and a global Tag Manager
Table, as in Section 4.8, and to have the same process-to-VASI mapping used in both
the core and I/O TLB. In such a design, the I/O TLB, similar to the core TLB, will be
flushed only during capacity flushes and forced flushes. Thus, the number of I/O TLB
flushes may be significantly reduced. In addition, if the context id being used is not
the CR3 value of the offloading process, a CR3-to-context id mapping should also be
maintained for every offloading process.
151

A Lena before conversion using VMA accel-erator
B Lena after conversion using VMA acceler-ator
Figure C-3. Functional validation of the use of TMT in VMA
C.4 Functional Verification of the Use of TMT in VMA
In order to verify the working of the VMA architecture in conjunction with the Tag
Manager Table, a simple image-manipulation test application is created. This application
reads in an image from a file, allocates source and destination buffer and populates the
source buffer with the pixels from the image. It should be noted that these buffers are
created using lazy memory allocation. Since the image is read into the source buffer,
demand paging and the conventional O/S page fault handler takes care of allocating
physical memory for the source buffer. On the other hand, since the destination buffer
is not accessed by the user application before offload, there is no physical memory
allocated for this buffer. This application offloads the pixels of the image, along with a
transformation matrix for converting the image to grayscale, to the accelerator by writing
the source and destination buffers to the registers of FN1 using the PUTTXN instruction.
After this it spins in a loop polling for the completion of the offload using the GETTXN
instruction. It should be noted that the data granularity of the offload is fixed at 4KB,
resulting in the application offloading the pixels on a page-by-page basis till all the pixels
are converted to grayscale.
152
The image chosen for this simulation was a 512 × 512 sized version of the standard
image ”Lena” [126]. Converting this image to a 32bits per pixel representation resulted
in a source buffer size of 1MB. Since no compression was used to store the grayscale
output, the destination buffer was also 1MB. Dictated by the 4KB size of the offload data
granularity, the source buffer was offloaded in 4KB chunks resulting in 256 offloads to
the hardware accelerator. Since the destination buffer was created using lazy memory
allocation, the very first PCI write to the destination buffer on each of these 256 offloads
caused an IPMMU page fault. Each of these faults raised interrupts which were caught
and handled by the IPMMU page fault handler. It was also observed that a maximum
of three retries with 10s retry period was sufficient to ensure that the IPMMU page
fault was serviced and the PCI write transaction successfully completed. Moreover,
for this simulation, a 99.90% hit rate in the IPMMU TLB was observed. The original
and converted images are shown in Figure C-3. This validates the working of the VMA
architecture with the TMT.
C.5 Summary
While the majority of this dissertation investigates the use of the Tag Manager
Table for improving the performance of virtualized workloads, the TMT is a generic
tagging framework that uses process-specific tags and can be used for non-virtualized
scenarios as well. This appendix proposes the use of the TMT for tagging I/O TLBs
in non-virtualized platforms. Specifically, the incorporation of the TMT as a tagging
framework in Virtual Memory Accelerators, an architecture involving I/O accelerators
operating in virtual address domain with an IPMMU and I/O TLB for providing the virtual
to physical translations, is examined. Using a simulation-based prototype of VMA, the
proposed use of the TMT is functionally validated.
153
REFERENCES
[1] R. Miller. (2010, April) Facebook Now Has 30,000 Servers. [Online].Available: http://www.datacenterknowledge.com/archives/2009/10/13/facebook-now-has-30000-servers/
[2] Avanade. (2010, April) Global Survey of Cloud Computing. [Online].Available: http://www.avanade.com/Documents/Research%20and%20Insights/fy10cloudcomputingexecutivesummaryfinal314006.pdf
[3] K. Olukotun et al., “The case for a single-chip multiprocessor,” SIGPLAN Notices,vol. 31, no. 9, pp. 2–11, 1996.
[4] I. Corporation. (2010, April) First the Tick, Now the Tock: NextGeneration Intel Microarchitecture (Nehalem). [Online]. Available: http://www.intel.com/technology/architecture-silicon/next-gen/whitepaper.pdf
[5] M. R. Marty and M. D. Hill, “Virtual hierarchies to support server consolidation,”SIGARCH Computer Architecture News, vol. 35, no. 2, pp. 46–56, 2007.
[6] M. F. Mergen et al., “Virtualization for high-performance computing,” SIGOPSOperating Systems Review, vol. 40, pp. 8–11, 2006.
[7] L. Youseff et al., “Paravirtualization effect on single- and multi-threadedmemory-intensive linear algebra software,” Cluster Computing, vol. 12, pp.101–122, 2009.
[8] Gartner. (2010, April) Gartner says Worldwide Hosted Virtual DesktopMarket to Surpass 65 Billion in 2013. [Online]. Available: http://www.gartner.com/it/page.jsp?id=920814
[9] ——. (2010, April) Gartner Says 20 Percent of Commercial E-Mail MarketWill Be Using a SaaS Platform By the End of 2012. [Online]. Available:http://www.gartner.com/it/page.jsp?id=931215
[10] J. Lange et al., “Palacios and Kitten: New High Performance Operating Systemsfor Scalable Virtualized and Native Supercomputing,” in Parallel DistributedProcessing (IPDPS), 2010 IEEE International Symposium on, 2010, pp. 1–12.
[11] J. Smith and R. Nair, Virtual Machines: Versatile Platforms for Systems andProcesses. Morgan Kaufmann Publishers Inc., 2005.
[12] R. Goldberg, “Survey of Virtual Machine Research,” Computer, vol. 7, no. 6, pp.34–45, 1974.
[13] G. Amdahl, G. Blaauw, and F. Brooks, “Architecture of IBM System/360,” IBMJournal of Research and Development, vol. 8, no. 2, pp. 87–101, 1964.
154
[14] U. Drepper, “The Cost of Virtualization,” ACM Queue, vol. 6, no. 1, pp. 28–35,2008.
[15] Gartner. (2010, April) Market Share: x86 Virtualization Market, Worldwide, 2008.[Online]. Available: http://www.gartner.com/it/page.jsp?id=1211813
[16] I. Kadayif et al., “Optimizing instruction TLB energy using software and hardwaretechniques,” ACM Transactions on Design Automation of Electronic Systems,vol. 10, no. 2, pp. 229–257, 2005.
[17] C. McCurdy, A. L. Cox, and J. Vetter, “Investigating the TLB Behavior of High-endScientific Applications on Commodity Microprocessors,” in Proc. IEEE InternationalSymposium on Performance Analysis of Systems and software, 2008, pp. 95–104.
[18] O. Tickoo et al., “qTLB: Looking inside the Look-aside buffer,” in Proc. The 14thInternational Conference on High Performance Computing, 2007, pp. 107–118.
[19] A. Bhattacharjee, D. Lustig, and M. Martonosi, “Shared last-level TLBs for chipmultiprocessors,” in Proc. The 17th International Symposium on High PerformanceComputer Architecture, 2011, pp. 359–370.
[20] D. Chisnall, The Definitive Guide to the Xen Hypervisor (Prentice Hall OpenSource Software Development Series). Prentice Hall PTR, 2007.
[21] VMware Inc. (2010, April) VMware Virtual Desktop Infrastructure (VDI) datasheet.[Online]. Available: http://www.vmware.com/files/pdf/vdi datasheet.pdf
[22] I. Krsul et al., “VMPlants: Providing and Managing Virtual Machine ExecutionEnvironments for Grid Computing,” in Proc. The 2004 ACM/IEEE conference onSupercomputing, 2004, p. 7.
[23] A. Weiss, “Computing in the clouds,” netWorker, vol. 11, no. 4, pp. 16–25, 2007.
[24] R. Figueiredo, P. Dinda, and J. Fortes, “Guest Editors’ Introduction: ResourceVirtualization Renaissance,” Computer, vol. 38, no. 5, pp. 28–31, 2005.
[25] R. J. O. Figueiredo et al., “Archer: A Community Distributed ComputingInfrastructure for Computer Architecture Research and Education,” CollaborativeComputing: Networking, Applications and Worksharing, vol. 10, no. 2, pp.181–192, 2009.
[26] SPARC International, Inc, The SPARC Architecture Manual Version 9. PTRPrentice Hall, 1993.
[27] Compaq Computer Corporation, ALPHA Architecture Reference Manual. CompaqComputer Corporation, 2002.
[28] Intel Corporation, Intel 64 and IA-32 Architectures Software Developer’s Manuals.Intel Corporation, 2010.
155

[29] B. Jacob and T. Mudge, “Virtual memory in contemporary microprocessors,” IEEEMicro, vol. 18, no. 4, pp. 60–75, 1998.
[30] ——, “A look at several memory management units, TLB-refill mechanisms, andpage table organizations,” SIGOPS Operating Systems Review, vol. 32, no. 5, pp.295–306, 1998.
[31] B. Jacob. (2010, April) Virtual Memory Systems and TLB Structures. [Online].Available: http://www.ece.umd.edu/∼blj/papers/CEH-chapter.pdf
[32] C. A. Waldspurger, “Memory resource management in VMware ESX server,”SIGOPS Operating Systems Review, vol. 36, no. SI, pp. 181–194, 2002.
[33] R. A. MacKinnon, “The changing virtual machine environment: Interfaces to realhardware, virtual hardware, and other virtual machines,” IBM Systems Journal,vol. 18, no. 1, pp. 18–46, 1979.
[34] L. H. Seawright and R. A. MacKinnon, “VM/370: a study of multiplicity andusefulness,” IBM Systems Journal, vol. 18, no. 1, pp. 4–17, 1979.
[35] P. Barham et al., “Xen and the art of virtualization,” in Proc. The nineteenth ACMsymposium on Operating systems principles, 2003, pp. 164–177.
[36] Advanced Micro Devices. (July 2010, April) AMD-V Nested Paging. [Online].Available: http://developer.amd.com/assets/NPT-WP-1%201-final-TM.pdf
[37] G. Neiger et al., “Intel Virtualization Technology: Hardware Support for EfficientProcessor Virtualization,” Intel Technology Journal, vol. 10, no. 3, pp. 167–178,2006.
[38] N. Jerger, D. Vantrease, and M. Lipasti, “An Evaluation of Server ConsolidationWorkloads for Multi-Core Designs,” in Proc. 10th International Symposium onWorkload Characterization, 2007, pp. 47–56.
[39] L. Cherkasova, D. Gupta, and A. Vahdat, “Comparison of the three CPU schedulersin Xen,” SIGMETRICS Performance Evaluation Review, vol. 35, no. 2, pp. 42–51,2007.
[40] D. Gupta et al., “Enforcing performance isolation across virtual machines in Xen,”in Proc. The ACM/IFIP/USENIX 2006 International Conference on Middleware,2006, pp. 342–362.
[41] J. R. Santos et al., “Bridging the gap between software and hardware techniquesfor I/O virtualization,” in Proc. USENIX 2008 Annual Technical Conference, 2008,pp. 29–42.
[42] W. Huang et al., “A case for high performance computing with virtual machines,”in Proc. The 20th annual international conference on Supercomputing, 2006, pp.125–134.
156

[43] L. Cherkasova and R. Gardner, “Measuring CPU overhead for I/O processing inthe Xen virtual machine monitor,” in Proc. USENIX Annual Technical Conference,2005, pp. 24–24.
[44] A. Menon et al., “Diagnosing performance overheads in the xen virtual machineenvironment,” in Proc. The 1st ACM/USENIX international conference on Virtualexecution environments, 2005, pp. 13–23.
[45] S. Thibault and T. Deegan, “Improving performance by embedding hpc applicationsin lightweight xen domains,” in Proc. The 2nd workshop on System-levelvirtualization for high performance computing, ser. HPCVirt ’08, 2008, pp. 9–15.
[46] R. Uhlig et al., “Intel Virtualization Technology,” Computer, vol. 38, no. 5, pp. 48–56,2005.
[47] D. Abramson et al., “Intel Virtualization Technology for Directed I/O,” IntelTechnology Journal, vol. 10, no. 03, pp. 179–192, 2006.
[48] Advanced Micro Devices, AMD Secure Virtual Machine Architecture ReferenceManual. Advanced Micro Devices, 2010.
[49] G. B. Kandiraju and A. Sivasubramaniam, “Going the distance for TLB prefetching:an application-driven study,” in Proc. The 29th annual international symposium onComputer architecture, 2002, pp. 195–206.
[50] A. Bhattacharjee and M. Martonosi, “Inter-Core cooperative TLB prefetchers forchip multiprocessors,” in Proc. The 15th international conference on Architecturalsupport for programming languages and operating systems, 2010, pp. 359–370.
[51] ——, “Characterizing the TLB Behavior of Emerging Parallel Workloads on ChipMultiprocessors,” in Proc. International Conference on Parallel Architectures andCompilation Techniques, 2009, pp. 29–40.
[52] V. Chadha et al., “I/O processing in a virtualized platform: a simulation-drivenapproach,” in Proc. The 3rd international conference on Virtual execution environ-ments, 2007, pp. 116–125.
[53] V. Chadha, “Provisioning wide-area virtual environments through I/O interposition:The redirect-on-write file system and characterization of i/o overheads in avirtualized platform,” Ph.D. dissertation, University of Florida, 2008.
[54] R. Uhlig et al., “SoftSDV: A Presilicon Software Development Environment for theIA-64 Architecture,” Intel Technology Journal, vol. 3, no. 4, pp. 1–14, 1999.
[55] M. Ekman, P. Stenstrom, and F. Dahlgren, “TLB and snoop energy-reduction usingvirtual caches in low-power chip-multiprocessors,” in Proc. The 2002 internationalsymposium on Low power electronics and design, 2002, pp. 243–246.
157

[56] S. Manne et al., “Low Power TLB Design for High Performance Microprocessors,”University of Colorado at Boulder, CO, Tech. Rep. CU-CS-834-97, 1997.
[57] J.-H. Lee et al., “A banked-promotion translation lookaside buffer system,” Journalof Systems Architecture, vol. 47, no. 14-15, pp. 1065–1078, 2002.
[58] A. Ballesil, L. Alarilla, and L. Alarcon, “A Study of Power Trade-offs in TranslationLookaside Buffer Structures,” in Proc. 2006 IEEE Region 10 Conference, 2006, pp.1–4.
[59] L. T. Clark, B. Choi, and M. Wilkerson, “Reducing translation lookaside buffer activepower,” in Proc. The 2003 international symposium on Low power electronics anddesign, 2003, pp. 10–13.
[60] R. Jeyapaul, S. Marathe, and A. Shrivastava, “Code Transformations for TLB PowerReduction,” in Proc. The 22nd International Conference on VLSI Design, 2009, pp.413–418.
[61] T. Austin, E. Larson, and D. Ernst, “SimpleScalar: an infrastructure for computersystem modeling,” Computer, vol. 35, no. 2, pp. 59–67, 2002.
[62] R. Bhargava et al., “Accelerating two-dimensional page walks for virtualizedsystems,” in Proc. The 13th international conference on Architectural support forprogramming languages and operating systems, 2008, pp. 26–35.
[63] G. Loh, S. Subramaniam, and Y. Xie, “Zesto: A cycle-level simulator for highlydetailed microarchitecture exploration,” in Proc. IEEE International Symposium onPerformance Analysis of Systems and Software, 2009, pp. 53–64.
[64] M. Yourst, “PTLsim: A Cycle Accurate Full System x86-64 MicroarchitecturalSimulator,” in Proc. IEEE International Symmposium onPerformance Analysis ofSystems and Software, 2007, pp. 23–34.
[65] M. Rosenblum et al., “Using the SimOS machine simulator to study complexcomputer systems,” ACM Transactions on Modeling and Computer Simulation,vol. 7, no. 1, pp. 78–103, 1997.
[66] N. L. Binkert et al., “The M5 Simulator: Modeling Networked Systems,” IEEE Micro,vol. 26, no. 4, pp. 52–60, 2006.
[67] P. S. Magnusson et al., “Simics: A full system simulation platform,” Computer,vol. 35, no. 2, pp. 50–58, 2002.
[68] M. M. K. Martin et al., “Multifacet’s general execution-driven multiprocessorsimulator (GEMS) toolset,” SIGARCH Computer Architecture News, vol. 33, no. 4,pp. 92–99, 2005.
[69] Naveen Neelakantam . (2010, April) FeS2: A Full-system Execution-drivenSimulator for x86. [Online]. Available: http://fes2.cs.uiuc.edu/
158

[70] E. Argollo et al., “COTSon: infrastructure for full system simulation,” SIGOPSOperating Systems Review, vol. 43, no. 1, pp. 52–61, 2009.
[71] Advanced Micro Devices Inc, SimNow Simulator Users Manual. Advanced MicroDevices Inc, 2009.
[72] L. Baugh, N. Neelakantam, and C. Zilles, “Using Hardware Memory Protectionto Build a High-Performance, Strongly-Atomic Hybrid Transactional Memory,”SIGARCH Computer Architecture News, vol. 36, no. 3, pp. 115–126, 2008.
[73] Virtutech Inc, Simics Reference Manual. Virtutech Inc, 2007.
[74] S. T. Jones, A. C. Arpaci-Dusseau, and R. H. Arpaci-Dusseau, “Antfarm: trackingprocesses in a virtual machine environment,” in Proc. USENIX ’06 AnnualTechnical Conference, 2006, pp. 1–1.
[75] CPU RightMark . (2010, April) RightMark Memory Analyzer. [Online]. Available:http://cpu.rightmark.org/products/rmma.shtml
[76] V. Makhija et al., “VMmark: A Scalable Benchmark for Virtualized Systems,”VMware Inc, CA, Tech. Rep. VMware-TR-2006-002, September 2006.
[77] D. R. Llanos, “TPCC-UVa: an open-source TPC-C implementation for globalperformance measurement of computer systems,” SIGMOD Record, vol. 35, no. 4,pp. 6–15, 2006.
[78] A. Tridge. (2010, April) dbench benchmark. [Online]. Available: http://samba.org/ftp/tridge/dbench/
[79] M. Karlsson et al., “Memory System Behavior of Java-Based Middleware,” inProceedings of the 9th International Symposium on High-Performance ComputerArchitecture, 2003, pp. 217–228.
[80] Y. Shuf et al., “Characterizing the memory behavior of Java workloads: a structuredview and opportunities for optimizations,” in Proc. The 2001 ACM SIGMETRICSinternational conference on Measurement and modeling of computer systems,2001, pp. 194–205.
[81] A. Adamson, D. Dagastine, and S. Sarne, “SPECjbb2005 - A Year in the Life of aBenchmark,” in Proc. The 2007 SPEC Benchmark Workshop, 2007.
[82] Standard Performance Evaluation Corporation. (2010, April) 255.vortexSPEC CPU2000 Benchmark Description File. [Online]. Available:http://www.spec.org/cpu2000/CINT2000/255.vortex/docs/255.vortex.html
[83] A. Georges, L. Eeckhout, and K. D. Bosschere, “Comparing Low-Level Behavior ofSPEC CPU and Java Workloads,” Advances in Computer Systems Architecture,vol. 3740, pp. 669–679, 2005.
159

[84] S. Dague, D. Stekloff, and R. Sailer. (2010, April) xm(1) - Linux man page. [Online].Available: http://linux.die.net/man/1/xm
[85] N. Andersson. (2010, April) The Maui Scheduler. [Online]. Available:http://www.nsc.liu.se/systems/retiredsystems/grendel/maui.html
[86] G. Staples, “Torque resource manager,” in Proc. The 2006 ACM/IEEE conferenceon Supercomputing, 2006.
[87] J. Warner. (2010, April) top(1) - Linux man page. [Online]. Available:http://linux.die.net/man/1/top
[88] A. Cahalan. (2010, April) pmap(1) - Linux man page. [Online]. Available:http://linux.die.net/man/1/pmap
[89] Silicon Graphics, Inc, MIPS R4000 Microprocessor User’s Manual. PTR PrenticeHall, 1993.
[90] X. Zhang et al., “A hash-TLB approach for MMU virtualization in xen/IA64,” in Proc.IEEE International Symposium on Parallel and Distributed Processing, 2008, pp.1–8.
[91] Motorola Inc, PowerPC 601 RISC Microprocessor User’s Manual. Motorola Inc,2002.
[92] J. Liedtke, “Improved Address-Space Switching on Pentium Processors byTransparently Multiplexing User Address Spaces,” German National ResearchCenter for Information Technology, Tech. Rep. 993, 1995.
[93] V. Uhlig et al., “Performance of address-space multiplexing on the Pentium,”University of Karlsruhe, Tech. Rep. 2002-1, 2002.
[94] S. Biemeuller. (2010, April) ASID Management in Xen AMD-V. [Online]. Available:xen.xensource.com/xensummit/xensummit spring 2007.html
[95] J. L. Hennessy and D. A. Patterson, Computer architecture: a quantitativeapproach. Morgan Kaufmann Publishers Inc., 2002.
[96] R. Jain, The Art of Computer Systems Performance Analysis: Techniques forExperimental Design, Measurement, Simulation, and Modeling. Wiley, 1991.
[97] R. Min et al., “Partial tag comparison: a new technology for power-efficientset-associative cache designs,” in Proc. 17th International Conference on VLSIDesign, 2004, pp. 183 – 188.
[98] A. Jaleel, M. Mattina, and B. Jacob, “Last level cache (LLC) performance of datamining workloads on a CMP - a case study of parallel bioinformatics workloads,”in Proc. The Twelfth International Symposium on High-Performance ComputerArchitecture, 2006, pp. 88 – 98.
160
[99] L. Zhao et al., “Towards hybrid last level caches for chip-multiprocessors,”SIGARCH Computer Architecture News, vol. 36, pp. 56–63, 2008.
[100] K. B. Ferreira, P. Bridges, and R. Brightwell, “Characterizing application sensitivityto OS interference using kernel-level noise injection,” in Proc. The 2008 ACM/IEEEconference on Supercomputing, 2008, pp. 19:1–19:12.
[101] R. Gioiosa, S. A. McKee, and M. Valero, “Designing OS for HPC Applications:Scheduling,” in Proc. IEEE International Conference on Cluster Computing, 2010,pp. 78–87.
[102] R. Iyer et al., “Datacenter-on-chip architectures: Tera-scale opportunities andchallenges in intel’s manufacturing environment,” Intel Technology Journal, vol. 11,no. 3, pp. 227–237, 2007.
[103] S. Kim, D. Chandra, and Y. Solihin, “Fair Cache Sharing and Partitioning in aChip Multiprocessor Architecture,” in Proc. The 13th International Conference onParallel Architectures and Compilation Techniques, 2004, pp. 111–122.
[104] R. Iyer et al., “QoS policies and architecture for cache/memory in CMP platforms,”SIGMETRICS Performance Evaluation Review, vol. 35, no. 1, pp. 25–36, 2007.
[105] L. R. Hsu et al., “Communist, utilitarian, and capitalist cache policies on CMPs:caches as a shared resource,” in Proc. The 15th international conference onParallel architectures and compilation techniques, 2006, pp. 13–22.
[106] J. Chang and G. S. Sohi, “Cooperative cache partitioning for chip multiprocessors,”in Proc. The 21st annual international conference on Supercomputing, 2007, pp.242–252.
[107] M. K. Qureshi and Y. N. Patt, “Utility-Based Cache Partitioning: A Low-Overhead,High-Performance, Runtime Mechanism to Partition Shared Caches,” in Proc. The39th Annual IEEE/ACM International Symposium on Microarchitecture, 2006, pp.423–432.
[108] S. Srikantaiah, M. Kandemir, and M. J. Irwin, “Adaptive set pinning: managingshared caches in chip multiprocessors,” in Proc. The 13th international conferenceon Architectural support for programming languages and operating systems, 2008,pp. 135–144.
[109] N. Rafique, W.-T. Lim, and M. Thottethodi, “Architectural support for operatingsystem-driven CMP cache management,” in Proc. The 15th internationalconference on Parallel architectures and compilation techniques, 2006, pp. 2–12.
[110] B. M. Beckmann, M. R. Marty, and D. A. Wood, “ASR: Adaptive SelectiveReplication for CMP Caches,” in Proc. The 39th Annual IEEE/ACM InternationalSymposium on Microarchitecture, 2006, pp. 443–454.
161

[111] J. Lee, C. Park, and S. Ha, “Memory access pattern analysis and stream cachedesign for multimedia applications,” in Proceedings of the 2003 Asia and SouthPacific Design Automation Conference, ser. ASP-DAC ’03, 2003, pp. 22–27.
[112] Standard Performance Evaluation Corporation. (2010, April) 301.apsiSPEC CPU2000 Benchmark Description File. [Online]. Available:http://www.spec.org/cpu2000/CFP2000/301.apsi/docs/301.apsi.html
[113] ——. (2010, April) 179.art SPEC CPU2000 Benchmark Description File. [Online].Available: http://www.spec.org/cpu2000/CFP2000/179.art/docs/179.art.html
[114] ——. (2010, April) 255.vortex SPEC CPU2000 Benchmark Description File.[Online]. Available: http://www.spec.org/cpu2000/CFP2000/189.lucas/docs/189.lucas.html
[115] ——. (2010, April) 171.swim SPEC CPU2000 Benchmark Description File. [Online].Available: http://www.spec.org/cpu2000/CFP2000/171.swim/docs/171.swim.html
[116] SAS. (2010, April) SAS: Statistical Analysis Software. [Online]. Available:http://www.sas.com/
[117] (2010, April) The University of Florida High-Performance Computing Center.[Online]. Available: http://www.hpc.ufl.edu/index.php?body=about
[118] D. Eadline, “Low cost/power hpc,” Linux Magazine, 2010.
[119] SeaMicro. (2011, January) SeaMicro to Demonstrate SM10000. [Online].Available: http://www.seamicro.com/
[120] P. Stillwell et al., “HiPPAI: High Performance Portable Accelerator Interface forSoCs,” in Proc. International Conference on High Performance Computing 2009,2009, pp. 109–118.
[121] F. E. Powers, Jr. and G. Alaghband, “Introducing the hydra parallel programmingsystem,” in Proceedings of the eighteenth annual ACM symposium on Parallelismin algorithms and architectures, ser. SPAA ’06, 2006, pp. 116–116.
[122] H. Wong et al., “Pangaea: a tightly-coupled IA32 heterogeneous chipmultiprocessor,” in Proceedings of the 17th international conference on Paral-lel architectures and compilation techniques, ser. PACT ’08, 2008, pp. 52–61.
[123] H. Bay, T. Tuytelaars, and L. Van Gool, “SURF: Speeded Up Robust Features,”Lecture Notes in Computer Science, vol. 3951, pp. 404–417, 2006.
[124] R. Budruk, D. Anderson, and T. Shanley, PCI Express System Architecture.Addison-Wesley Professional, 2003.
162

[125] I. Corporation. (2011, January) Intel Virtualization Technology for Directed I/O.[Online]. Available: ftp://download.intel.com/technology/computing/vptech/Intel%28r%29 VT for Direct IO.pdf
[126] M. Wakin. (2011, January) Standard Test Images. [Online]. Available:http://www.ece.rice.edu/∼wakin/images/
163
BIOGRAPHICAL SKETCH
Girish Venkatasubramanian was born in Coimbatore, India in 1981. He attended
GRG Matriculation and Higher Secondary School, India and graduated with the ”Best
Outgoing Student” award in 1999. He obtained his Bachelor of Engineering degree (First
Class with Distinction) in Electrical and Electronics Engineering from PSG College of
Technology, India. During this time he received the ”Deans Letter of Commendation for
Academic Performance” twice.
Girish was accepted to the Department of Electrical and Computer Engineering
at University of Florida in 2003, from where he graduated with a Master of Science
degree in 2005 (4.0 GPA) and a Doctor of Philosophy degree in 2011 (4.0 GPA).
During his PhD, he received the University of Florida International Center’s ”Certificate
of Achievement for Outstanding Academic Performance” and was selected as an
”Outstanding International Student”.
At the University of Florida, Girish joined the Advanced Computing and Information
Systems (ACIS) Lab and conducted research in areas including computer architecture,
operating systems, virtualization and full-system modeling and simulation. To complement
his academic skills, he also completed internships with Intel Corporation and VMware.
After graduation, Girish plans to take up a full-time position at Intel and work in areas
related to virtualization.
164