TABOR Summary
14
Measuring the Impact of Tax and Expenditure Limits on Public School Finance in Colorado [Research Summary] Working Paper WP15PR1 Phyllis Resnick Lead Economist, Colorado Futures Center Colorado State University Charles Brown Director, Colorado Futures Center Colorado State University Deborah Godshall Lead School Finance Analyst, Colorado Futures Center, Colorado State University AUGUST 2015 The findings and conclusions of this Working Paper reflect the views of the author(s) and have not been subject to a detailed review by the staff of the Lincoln Institute of Land Policy. Contact the Lincoln Institute with questions or requests for permission to reprint this paper. [email protected] © 2015 Lincoln Institute of Land Policy
-
Upload
educationnc -
Category
Education
-
view
380 -
download
0
Transcript of TABOR Summary
Measuring the Impact of Tax and Expenditure Limits on Public School Finance in Colorado [Research Summary] Working Paper WP15PR1
Phyllis Resnick Lead Economist, Colorado Futures Center Colorado State University Charles Brown Director, Colorado Futures Center Colorado State University Deborah Godshall Lead School Finance Analyst, Colorado Futures Center, Colorado State University
AUGUST 2015 The findings and conclusions of this Working Paper reflect the views of the author(s) and have not been subject to a detailed review by the staff of the Lincoln Institute of Land Policy. Contact the Lincoln Institute with questions or requests for permission to reprint this paper. [email protected] © 2015 Lincoln Institute of Land Policy
Measuring the Impacts of Tax and Expenditure Limits on Public School Finance in Colorado [Research Summary]
Tax and expenditure limitations such as Colorado’s Taxpayers’ Bill of Rights (TABOR) matter. In this study, supported by the Lincoln Institute of Land Policy, we explore the household and district level distortions that have resulted from the interaction of Colorado’s TABOR amendment and the state’s system of funding public schools. We find that many of the impacts are distributional; TABOR’s local property tax limit has collided with the state’s school finance act to significantly alter the local property tax levies and burdens in a subset of the state’s 178 school districts. This has left approximately 12 percent of the districts with artificially low property taxes while the remainder of the districts in the state face significantly higher levies. Specifically, in the wake of TABOR, these distributional impacts can be summarized by the key findings from this research:
• As measured by effective tax rates, local property taxes to support base school programs have become more unequal since the passage of TABOR. That is, the effective rates on the most highly burdened districts have increased while the rates on the least burdened districts have decreased.
• Also as measured by effective tax rates, the local property tax that supports base school
programs has become more regressive.
• District level funding disparities increased as the use of local override levies became increasingly prevalent in districts with falling effective property tax rates for base school programs. These falling rates were in part a result of the local property tax and mill levy limits imposed by TABOR. Local override levies are additional property taxes subject to a vote and provide a mechanism to supplement base school budgets. The unequal use of overrides, facilitated by the unequal effect of the limits in TABOR, results in district level funding disparities.
• As a result of TABOR, taxpayers in 74 of the state’s 178 school districts currently pay
more in school property taxes than they would if TABOR was never enacted. These 74 districts contain 81% of the state’s population.
What Is the Mechanism by Which This Has Occurred?
In Colorado, public schools are paid for with a combination of the local property tax and support from the state budget. From the perspective of balancing the required expenditures for education with the revenue available to support those expenditures, this system worked relatively well until the 1992 passage of TABOR. However, since the passage of TABOR, school finance is now governed by separate and at times conflicting and uncoordinated formulas and limits for spending and revenue.
1
Spending is mandated by the school finance act which establishes a base level of support for every child attending school in one of the 178 school districts in Colorado. This level of support is guaranteed regardless of the local economic conditions in the district. This general principle has not changed since 1992. Both before and after the passage of TABOR, spending for schools was governed by a legislatively enacted school finance act. The difference since 1992 is with respect to revenue. Prior to the passage of TABOR, state lawmakers were better able to balance the expenditure needs for the state’s public schools with the revenue available from the combined local property tax and state general fund. However, the limits contained within TABOR, particularly the local property tax limit, placed a separate and uncoordinated limit on the local property tax for schools. The practical result has been that in some districts, while the requirement for per pupil spending has been increasing, the local property tax levy and thus the local revenue available from the property tax has been limited and ultimately not able to grow at a rate commensurate with the increase in mandated spending. As a result, local property tax rates and burdens plummeted in those districts resulting in a reduced reliance on the local property tax and an increased one on state aid. In effect, for these districts, TABOR transferred the burden of funding schools from the local residents to all Coloradans who pay state taxes. This mechanism is the source of all the distributional distortions identified by this research. While there are myriad economic and demographic circumstances causing declining local levies and the resulting shift in burdens, the following taxonomy captures the most common circumstances:
• Some districts have fluctuating enrollments which increase in some years but decline in others. During periods of decline the TABOR property tax revenue limit is correspondingly reduced, so the district mill levy must be reduced in order to avoid violating the district’s property tax limit. Once the mill levy is reduced, it cannot be increased without a vote even if the district experiences enrollment increases in subsequent years. As a result, in subsequent years, shortfalls in per pupil funding are made up with state aid.
• Some districts have periods of large assessed value increases. This is fairly common in
districts that have significant property value associated with natural resource production. In years when production is increasing, the district’s mill levy must be reduced to comply with the TABOR property tax revenue limit. In years when production declines and assessed value decreases, the mill levy cannot be increased due to the mill levy limit in TABOR. Once again, when the mill levy is reduced, it is permanently “ratcheted” down and any subsequent shortfalls are made up by state aid.
• Some districts experience significant economic development not associated with
enrollment increases (which would allow the property tax limit to increase), such as the enactment of limited stakes gaming in Gilpin and Teller Counties, construction of new major public utilities, new oil and gas facilities, and recreational developments in mountain communities. In most cases, the precipitous growth of assessed value from these activities forces mill levies to be reduced to a fraction of the rates paid by other districts.
2
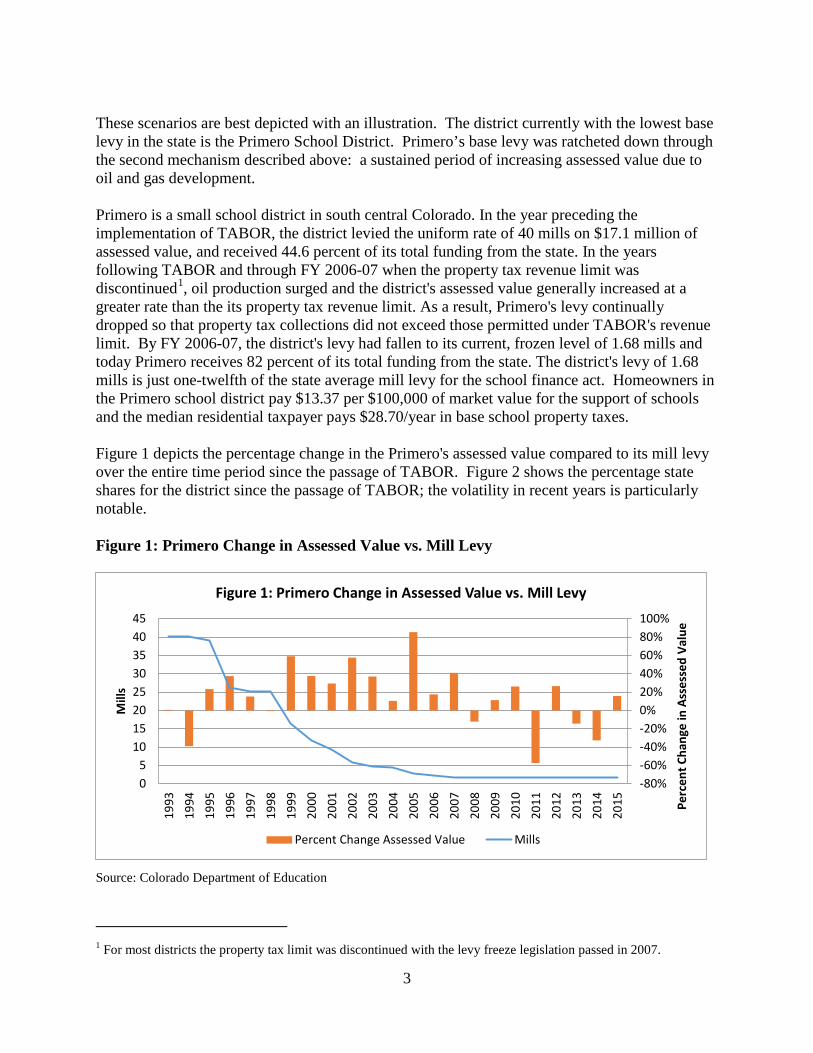
These scenarios are best depicted with an illustration. The district currently with the lowest base levy in the state is the Primero School District. Primero’s base levy was ratcheted down through the second mechanism described above: a sustained period of increasing assessed value due to oil and gas development. Primero is a small school district in south central Colorado. In the year preceding the implementation of TABOR, the district levied the uniform rate of 40 mills on $17.1 million of assessed value, and received 44.6 percent of its total funding from the state. In the years following TABOR and through FY 2006-07 when the property tax revenue limit was discontinued1, oil production surged and the district's assessed value generally increased at a greater rate than the its property tax revenue limit. As a result, Primero's levy continually dropped so that property tax collections did not exceed those permitted under TABOR's revenue limit. By FY 2006-07, the district's levy had fallen to its current, frozen level of 1.68 mills and today Primero receives 82 percent of its total funding from the state. The district's levy of 1.68 mills is just one-twelfth of the state average mill levy for the school finance act. Homeowners in the Primero school district pay $13.37 per $100,000 of market value for the support of schools and the median residential taxpayer pays $28.70/year in base school property taxes. Figure 1 depicts the percentage change in the Primero's assessed value compared to its mill levy over the entire time period since the passage of TABOR. Figure 2 shows the percentage state shares for the district since the passage of TABOR; the volatility in recent years is particularly notable. Figure 1: Primero Change in Assessed Value vs. Mill Levy
Source: Colorado Department of Education
1 For most districts the property tax limit was discontinued with the levy freeze legislation passed in 2007.
-80%-60%-40%-20%0%20%40%60%80%100%
05
1015202530354045
1993
1994
1995
1996
1997
1998
1999
2000
2001
2002
2003
2004
2005
2006
2007
2008
2009
2010
2011
2012
2013
2014
2015 Pe
rcen
t Cha
nge
in A
sses
sed
Valu
e
Mill
s
Figure 1: Primero Change in Assessed Value vs. Mill Levy
Percent Change Assessed Value Mills
3
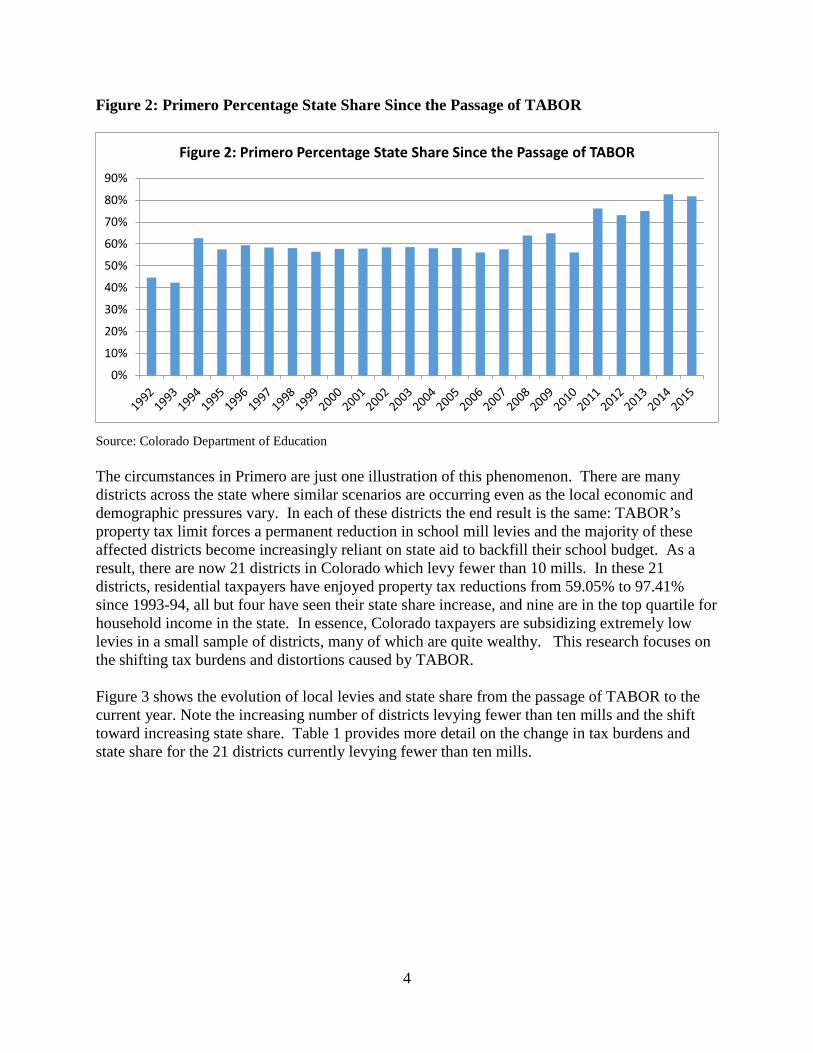
Figure 2: Primero Percentage State Share Since the Passage of TABOR
Source: Colorado Department of Education The circumstances in Primero are just one illustration of this phenomenon. There are many districts across the state where similar scenarios are occurring even as the local economic and demographic pressures vary. In each of these districts the end result is the same: TABOR’s property tax limit forces a permanent reduction in school mill levies and the majority of these affected districts become increasingly reliant on state aid to backfill their school budget. As a result, there are now 21 districts in Colorado which levy fewer than 10 mills. In these 21 districts, residential taxpayers have enjoyed property tax reductions from 59.05% to 97.41% since 1993-94, all but four have seen their state share increase, and nine are in the top quartile for household income in the state. In essence, Colorado taxpayers are subsidizing extremely low levies in a small sample of districts, many of which are quite wealthy. This research focuses on the shifting tax burdens and distortions caused by TABOR. Figure 3 shows the evolution of local levies and state share from the passage of TABOR to the current year. Note the increasing number of districts levying fewer than ten mills and the shift toward increasing state share. Table 1 provides more detail on the change in tax burdens and state share for the 21 districts currently levying fewer than ten mills.
0%
10%
20%
30%
40%
50%
60%
70%
80%
90%
Figure 2: Primero Percentage State Share Since the Passage of TABOR
4
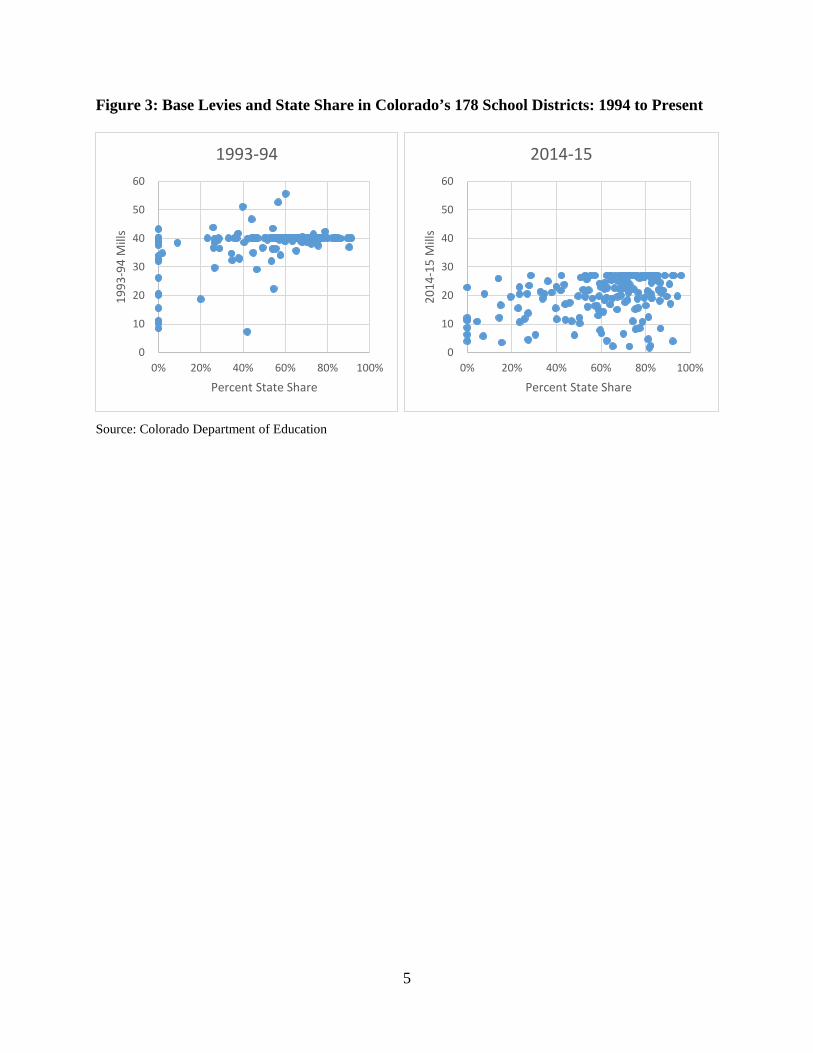
Figure 3: Base Levies and State Share in Colorado’s 178 School Districts: 1994 to Present
Source: Colorado Department of Education
0
10
20
30
40
50
60
0% 20% 40% 60% 80% 100%
1993
-94
Mill
s
Percent State Share
1993-94
0
10
20
30
40
50
60
0% 20% 40% 60% 80% 100%
2014
-15
Mill
s
Percent State Share
2014-15
5
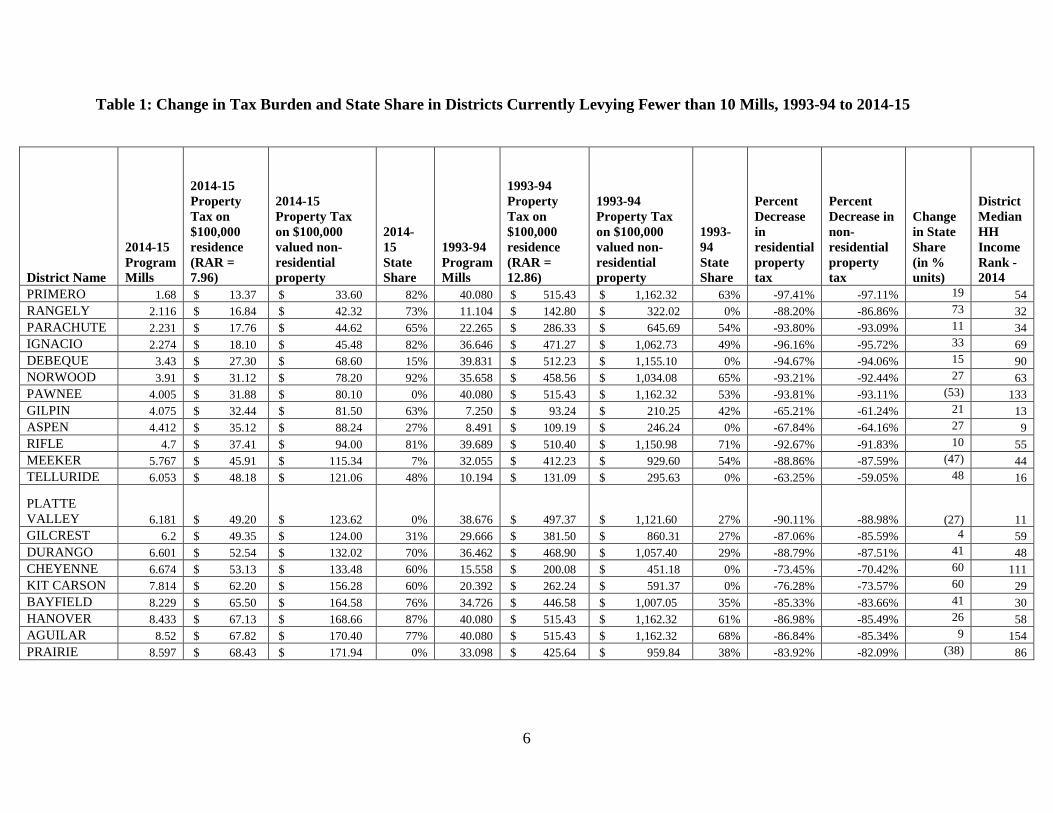
Table 1: Change in Tax Burden and State Share in Districts Currently Levying Fewer than 10 Mills, 1993-94 to 2014-15
District Name
2014-15 Program Mills
2014-15 Property Tax on $100,000 residence (RAR = 7.96)
2014-15 Property Tax on $100,000 valued non-residential property
2014-15 State Share
1993-94 Program Mills
1993-94 Property Tax on $100,000 residence (RAR = 12.86)
1993-94 Property Tax on $100,000 valued non-residential property
1993-94 State Share
Percent Decrease in residential property tax
Percent Decrease in non-residential property tax
Change in State Share (in % units)
District Median HH Income Rank - 2014
PRIMERO 1.68 $ 13.37 $ 33.60 82% 40.080 $ 515.43 $ 1,162.32 63% -97.41% -97.11% 19 54 RANGELY 2.116 $ 16.84 $ 42.32 73% 11.104 $ 142.80 $ 322.02 0% -88.20% -86.86% 73 32 PARACHUTE 2.231 $ 17.76 $ 44.62 65% 22.265 $ 286.33 $ 645.69 54% -93.80% -93.09% 11 34 IGNACIO 2.274 $ 18.10 $ 45.48 82% 36.646 $ 471.27 $ 1,062.73 49% -96.16% -95.72% 33 69 DEBEQUE 3.43 $ 27.30 $ 68.60 15% 39.831 $ 512.23 $ 1,155.10 0% -94.67% -94.06% 15 90 NORWOOD 3.91 $ 31.12 $ 78.20 92% 35.658 $ 458.56 $ 1,034.08 65% -93.21% -92.44% 27 63 PAWNEE 4.005 $ 31.88 $ 80.10 0% 40.080 $ 515.43 $ 1,162.32 53% -93.81% -93.11% (53) 133 GILPIN 4.075 $ 32.44 $ 81.50 63% 7.250 $ 93.24 $ 210.25 42% -65.21% -61.24% 21 13 ASPEN 4.412 $ 35.12 $ 88.24 27% 8.491 $ 109.19 $ 246.24 0% -67.84% -64.16% 27 9 RIFLE 4.7 $ 37.41 $ 94.00 81% 39.689 $ 510.40 $ 1,150.98 71% -92.67% -91.83% 10 55 MEEKER 5.767 $ 45.91 $ 115.34 7% 32.055 $ 412.23 $ 929.60 54% -88.86% -87.59% (47) 44 TELLURIDE 6.053 $ 48.18 $ 121.06 48% 10.194 $ 131.09 $ 295.63 0% -63.25% -59.05% 48 16
PLATTE VALLEY 6.181 $ 49.20 $ 123.62 0% 38.676 $ 497.37 $ 1,121.60 27% -90.11% -88.98%
(27) 11 GILCREST 6.2 $ 49.35 $ 124.00 31% 29.666 $ 381.50 $ 860.31 27% -87.06% -85.59% 4 59 DURANGO 6.601 $ 52.54 $ 132.02 70% 36.462 $ 468.90 $ 1,057.40 29% -88.79% -87.51% 41 48 CHEYENNE 6.674 $ 53.13 $ 133.48 60% 15.558 $ 200.08 $ 451.18 0% -73.45% -70.42% 60 111 KIT CARSON 7.814 $ 62.20 $ 156.28 60% 20.392 $ 262.24 $ 591.37 0% -76.28% -73.57% 60 29 BAYFIELD 8.229 $ 65.50 $ 164.58 76% 34.726 $ 446.58 $ 1,007.05 35% -85.33% -83.66% 41 30 HANOVER 8.433 $ 67.13 $ 168.66 87% 40.080 $ 515.43 $ 1,162.32 61% -86.98% -85.49% 26 58 AGUILAR 8.52 $ 67.82 $ 170.40 77% 40.080 $ 515.43 $ 1,162.32 68% -86.84% -85.34% 9 154 PRAIRIE 8.597 $ 68.43 $ 171.94 0% 33.098 $ 425.64 $ 959.84 38% -83.92% -82.09% (38) 86
6
Before TABOR’s limits began affecting the local property tax, most districts in the state had base levies at or very close to the uniform levy of 40 mills. As Figure 3 shows, in 1993-94 only two districts levied fewer than ten mills and the majority of the districts which levied fewer than 40 mills received little or, in most cases, no state aid for their school budgets. This is not an accident. The intent of the equalization provisions in the school finance acts was to achieve this sort of funding distribution. However, in 1992 when TABOR passed, its separate limits on the local property tax and mill levies severed the relationship between revenue and spending for schools. From 1992 on, local revenues for schools were governed by limits that were uncoordinated with the spending demands for those same schools. And the results are dramatic. Today 21 districts levy fewer than 10 mills, and the statewide funding trend is away from the local property tax and to increasing reliance on state aid. This is depicted in the second panel of Figure 3. But the impacts don’t end with the statewide trends. TABOR has affected local property tax revenues in different magnitudes in each of the state’s 178 school districts. As a result, there are household and district level distortions and distributional effects from TABOR. At the household level, TABOR has rendered the system of funding public schools less equal and more regressive. It has resulted in uneven use of override levies which has contributed to increasing disparities in district funding. And most improbably, the distributional effects of TABOR on school finance have meant that today 81 percent of Coloradans are paying more in local school property taxes than they would if the limits had never been enacted.
Research Findings Finding 1. As measured by effective tax rates, local property taxes to support base school programs have become more unequal since the passage of TABOR. The best way to measure comparative tax burden across economically and demographically diverse geographies is to use effective tax burdens. The effective tax burden, calculated as taxes paid divided by income, is a normalized measure that accounts for income disparities and allows for consistent comparisons. In this research, all effective tax burdens were calculated at the median. That is, they were calculated as the taxes paid on the median priced home owned by a taxpayer with income at the median for the district. The data for all medians were collected from the Census and the American Community Survey for the respective years. Median effective tax rates fell in the majority of the districts between 2000 and 2014. However, the median taxpayers in 27 of the state’s districts saw their effective tax rates increase over that same period. Figure 4 shows the distribution of the change in effective rates on the median taxpayer.
7
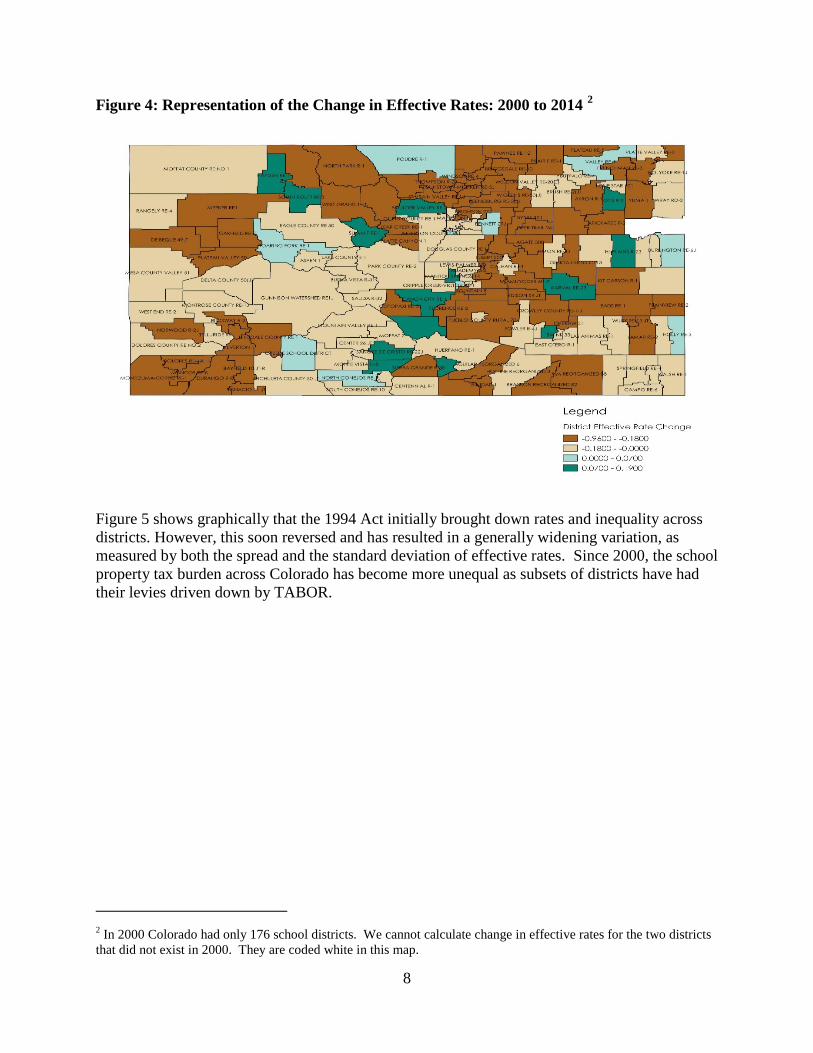
Figure 4: Representation of the Change in Effective Rates: 2000 to 2014 2
Figure 5 shows graphically that the 1994 Act initially brought down rates and inequality across districts. However, this soon reversed and has resulted in a generally widening variation, as measured by both the spread and the standard deviation of effective rates. Since 2000, the school property tax burden across Colorado has become more unequal as subsets of districts have had their levies driven down by TABOR.
2 In 2000 Colorado had only 176 school districts. We cannot calculate change in effective rates for the two districts that did not exist in 2000. They are coded white in this map.
8
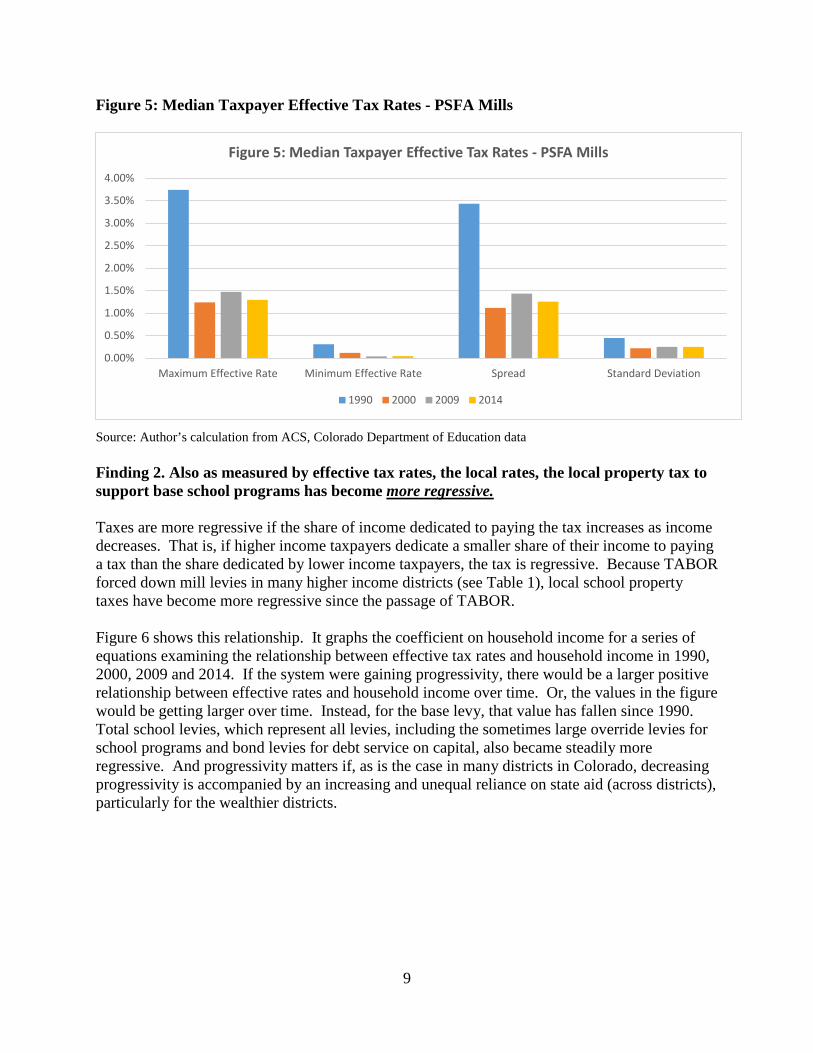
Figure 5: Median Taxpayer Effective Tax Rates - PSFA Mills
Source: Author’s calculation from ACS, Colorado Department of Education data Finding 2. Also as measured by effective tax rates, the local rates, the local property tax to support base school programs has become more regressive. Taxes are more regressive if the share of income dedicated to paying the tax increases as income decreases. That is, if higher income taxpayers dedicate a smaller share of their income to paying a tax than the share dedicated by lower income taxpayers, the tax is regressive. Because TABOR forced down mill levies in many higher income districts (see Table 1), local school property taxes have become more regressive since the passage of TABOR. Figure 6 shows this relationship. It graphs the coefficient on household income for a series of equations examining the relationship between effective tax rates and household income in 1990, 2000, 2009 and 2014. If the system were gaining progressivity, there would be a larger positive relationship between effective rates and household income over time. Or, the values in the figure would be getting larger over time. Instead, for the base levy, that value has fallen since 1990. Total school levies, which represent all levies, including the sometimes large override levies for school programs and bond levies for debt service on capital, also became steadily more regressive. And progressivity matters if, as is the case in many districts in Colorado, decreasing progressivity is accompanied by an increasing and unequal reliance on state aid (across districts), particularly for the wealthier districts.
0.00%
0.50%
1.00%
1.50%
2.00%
2.50%
3.00%
3.50%
4.00%
Maximum Effective Rate Minimum Effective Rate Spread Standard Deviation
Figure 5: Median Taxpayer Effective Tax Rates - PSFA Mills
1990 2000 2009 2014
9
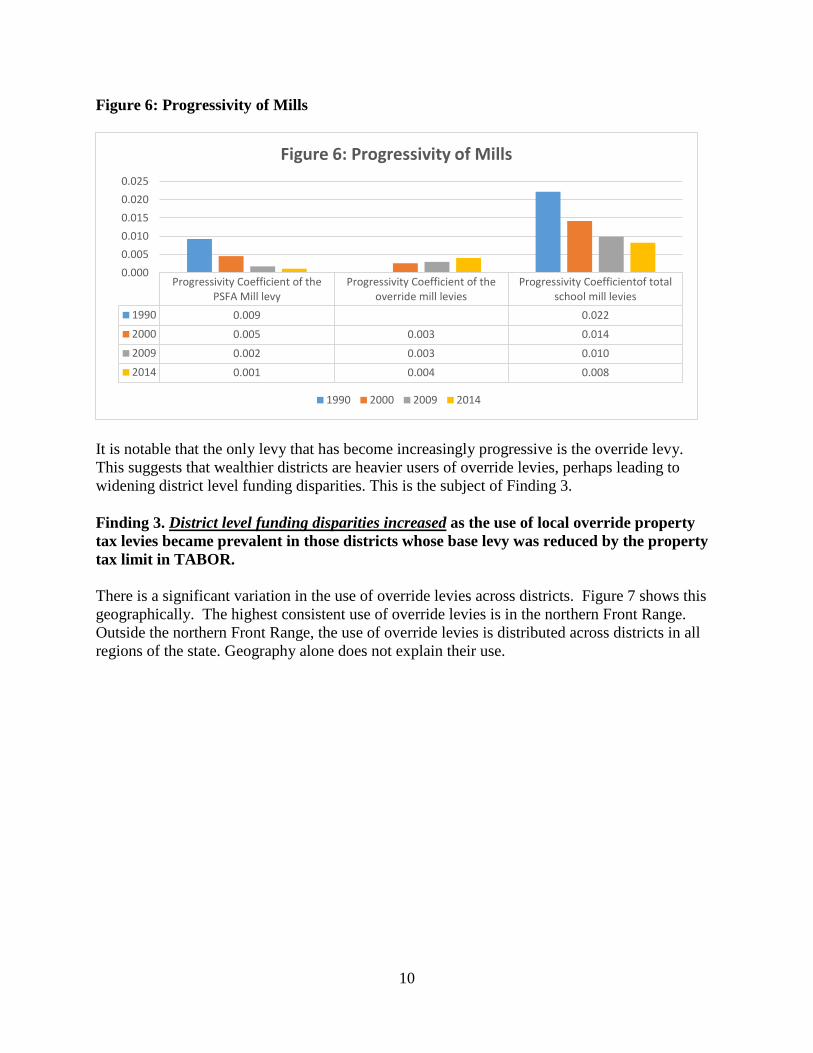
Figure 6: Progressivity of Mills
It is notable that the only levy that has become increasingly progressive is the override levy. This suggests that wealthier districts are heavier users of override levies, perhaps leading to widening district level funding disparities. This is the subject of Finding 3. Finding 3. District level funding disparities increased as the use of local override property tax levies became prevalent in those districts whose base levy was reduced by the property tax limit in TABOR. There is a significant variation in the use of override levies across districts. Figure 7 shows this geographically. The highest consistent use of override levies is in the northern Front Range. Outside the northern Front Range, the use of override levies is distributed across districts in all regions of the state. Geography alone does not explain their use.
Progressivity Coefficient of thePSFA Mill levy
Progressivity Coefficient of theoverride mill levies
Progressivity Coefficientof totalschool mill levies
1990 0.009 0.0222000 0.005 0.003 0.0142009 0.002 0.003 0.0102014 0.001 0.004 0.008
0.0000.0050.0100.0150.0200.025
Figure 6: Progressivity of Mills
1990 2000 2009 2014
10
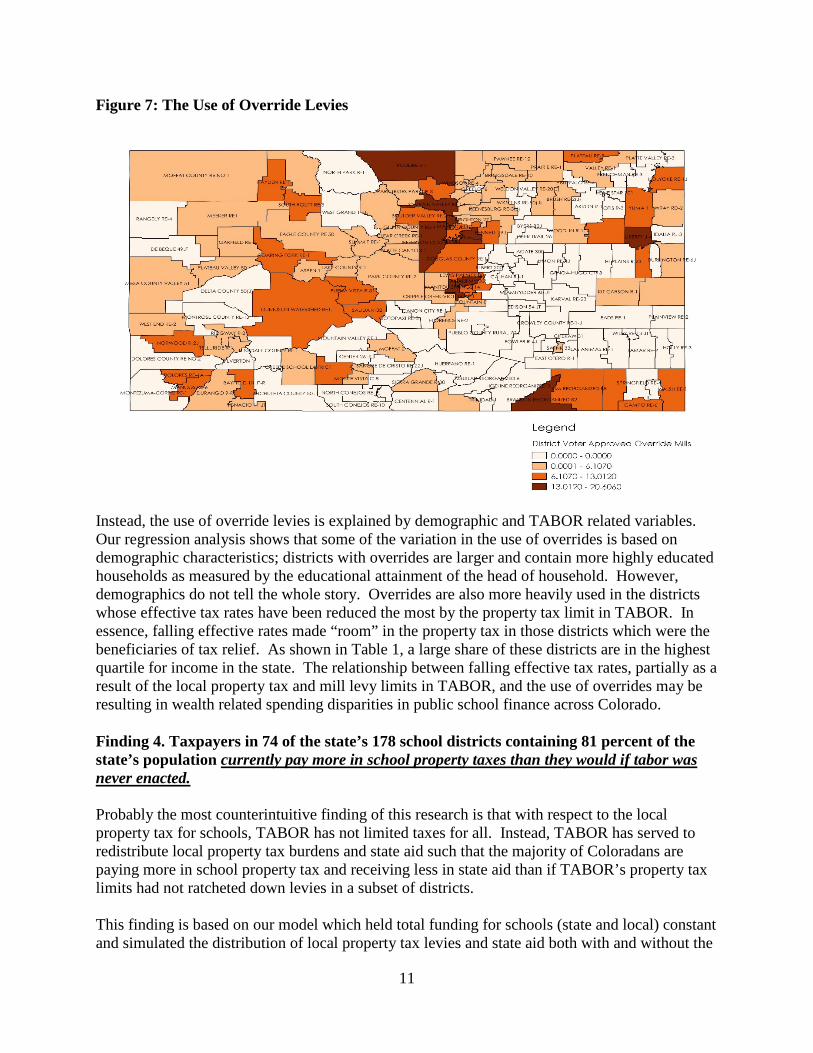
Figure 7: The Use of Override Levies
Instead, the use of override levies is explained by demographic and TABOR related variables. Our regression analysis shows that some of the variation in the use of overrides is based on demographic characteristics; districts with overrides are larger and contain more highly educated households as measured by the educational attainment of the head of household. However, demographics do not tell the whole story. Overrides are also more heavily used in the districts whose effective tax rates have been reduced the most by the property tax limit in TABOR. In essence, falling effective rates made “room” in the property tax in those districts which were the beneficiaries of tax relief. As shown in Table 1, a large share of these districts are in the highest quartile for income in the state. The relationship between falling effective tax rates, partially as a result of the local property tax and mill levy limits in TABOR, and the use of overrides may be resulting in wealth related spending disparities in public school finance across Colorado. Finding 4. Taxpayers in 74 of the state’s 178 school districts containing 81 percent of the state’s population currently pay more in school property taxes than they would if tabor was never enacted. Probably the most counterintuitive finding of this research is that with respect to the local property tax for schools, TABOR has not limited taxes for all. Instead, TABOR has served to redistribute local property tax burdens and state aid such that the majority of Coloradans are paying more in school property tax and receiving less in state aid than if TABOR’s property tax limits had not ratcheted down levies in a subset of districts. This finding is based on our model which held total funding for schools (state and local) constant and simulated the distribution of local property tax levies and state aid both with and without the
11
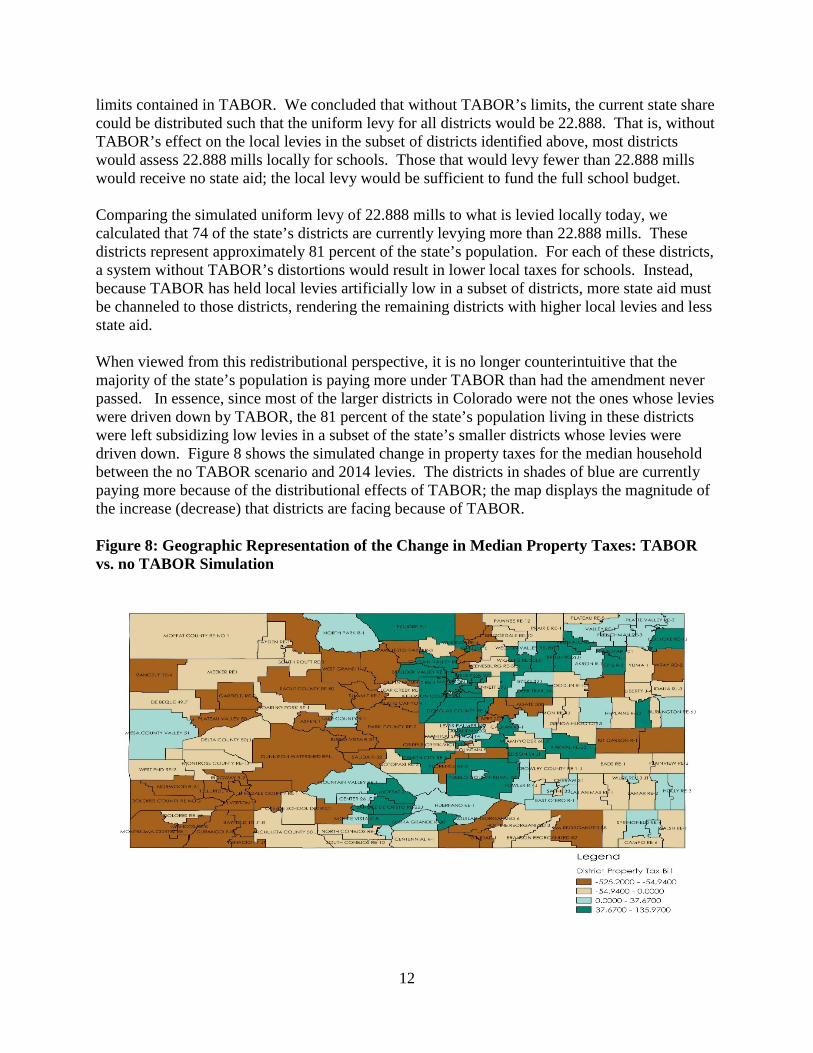
limits contained in TABOR. We concluded that without TABOR’s limits, the current state share could be distributed such that the uniform levy for all districts would be 22.888. That is, without TABOR’s effect on the local levies in the subset of districts identified above, most districts would assess 22.888 mills locally for schools. Those that would levy fewer than 22.888 mills would receive no state aid; the local levy would be sufficient to fund the full school budget. Comparing the simulated uniform levy of 22.888 mills to what is levied locally today, we calculated that 74 of the state’s districts are currently levying more than 22.888 mills. These districts represent approximately 81 percent of the state’s population. For each of these districts, a system without TABOR’s distortions would result in lower local taxes for schools. Instead, because TABOR has held local levies artificially low in a subset of districts, more state aid must be channeled to those districts, rendering the remaining districts with higher local levies and less state aid. When viewed from this redistributional perspective, it is no longer counterintuitive that the majority of the state’s population is paying more under TABOR than had the amendment never passed. In essence, since most of the larger districts in Colorado were not the ones whose levies were driven down by TABOR, the 81 percent of the state’s population living in these districts were left subsidizing low levies in a subset of the state’s smaller districts whose levies were driven down. Figure 8 shows the simulated change in property taxes for the median household between the no TABOR scenario and 2014 levies. The districts in shades of blue are currently paying more because of the distributional effects of TABOR; the map displays the magnitude of the increase (decrease) that districts are facing because of TABOR. Figure 8: Geographic Representation of the Change in Median Property Taxes: TABOR vs. no TABOR Simulation
12
Conclusion: Lessons Learned In the area of school finance, TABOR has had profound effects. Our research team previously documented the pressure TABOR places on the general fund budget as a result of its property tax limits shifting the responsibility for funding a majority of school programs to the state. This study goes further and explores specific household and district level distortions, both to funding and tax burden. Property taxes in Colorado have become more unequal and less progressive, and somewhat improbably 81 percent of the state’s population is paying more in property tax than if TABOR had not passed and begun distorting school funding. Finally, the unequal use of override levies, facilitated in certain districts by TABOR’s distortion of the base levy, has contributed to larger funding disparities across school districts. Colorado’s experience with TABOR provides a learning opportunity for Coloradans and those in other states potentially considering limits. While it is never possible to a priori anticipate all of the potential effects of tax and expenditure limits, some lessons clearly emerge from a study of Colorado’s quarter century experience with TABOR and school finance. Among the most salient lessons are the following:
• Recognize that statutory enactments allow for necessary revision; constitutional enactments generally do not.
• Acknowledge the unique state/local relationships embodied in school finance. • Consider the varied impacts of tax rate limits. • Take care when exempting new taxable value from limits. • Anticipate perverse incentives. • Don’t enact static solutions in a dynamic world.
Colorado remains a laboratory for the study of the effects of TELs on all aspects of public finance. While this research answered some very important questions about the distributional effects of TELs, there is more to learn. Specifically:
• Have the TEL induced district level distortions undermined the state’s mandate for a through and uniform system of public schools?
• Have the TEL induced district level distortions affected school performance across districts?
• What options are available to Colorado to restore the productivity of the local school property tax which has been eroded by TABOR?
• What options are available to Colorado to undo the de facto policy that the first dollars of state aid are used to backfill low levies in the districts most impacted by TABOR’s property tax limit?
• To what extent are similar distortions occurring on other states whose school finance systems are operating under the restrictions of TELs?
These questions and others will form the basis for our continued exploration of school finance under TELs.
13