Taboola - Native Advertising Campaign from Scratch - Ebook
23
Benchmark Report PUBLISHER Worldwide, General & Local News How to Maximize Revenue and Engagement by Balancing Editorial and Sponsored Content
Transcript of Taboola - Native Advertising Campaign from Scratch - Ebook
Benchmark ReportPUBLISHERWorldwide, General & Local News
How to Maximize Revenue and Engagement by Balancing Editorial and Sponsored Content

PU
BL
IS
HE
R
BE
NC
HM
AR
K
RE
PO
RT
2
TABLE OF CONTENTS
Introduction 3
How We Pulled the Numbers 4
Enterprise Publishers: Data-Driven UX Recommendations by Traffic Source 5
Desktop Traffic 7
Mobile Traffic 8
SMB Publishers: Data-Driven UX Recommendations by Traffic Source 10
Desktop Traffic 11
Mobile Traffic 12
Creative Strategies for Recirculating Editorial Content 14
Image Best Practices by CTR 15
Headline Best Practices by CTR 17
Editorial Content Examples 19
Ad Formats for Circulating Sponsored Content 20
Nielsen Uses Eye Tracking and Brain Waves to Discover Most Favorable Ads 22
INTRODUCTION
PU
BL
IS
HE
R
BE
NC
HM
AR
K
RE
PO
RT
3
There’s no question about it—publishers are the ones with the expertise
on providing valuable content to their audiences, and recent events in
2020 have drawn more attention to content from local and general news
publishers than ever before.
When events like these arise, there’s an opportunity for publishers like
you to capture more revenue and more long-term engaged website
visitors—but to do that, you’ll need more than just valuable content.
You’ll need a customized user experience that balances editorial and
sponsored content to provide the best outcome for your bottom line.
• Are users highly engaged? Show them more editorial content and
nurture them down the path to subscriptions.
• Are users likely to bounce? Show them more sponsored content to
capture a revenue opportunity, since they’re likely not coming back.
Answering these questions requires insights into:
• Where users are coming from, meaning their traffic source
• Where users are engaging, meaning their device of choice
• Whether or not they’re sticking around to read more, or
bouncing right away
• What types of creatives encourage them to read more
editorial content, if they’re sticking around to read more
• What types ad formats are likely to capture clicks, if
they’re just going to bounce anyway
• How much traffic your publication gets
We’re breaking down insights from 10,000+ publisher
partners and digital properties in the Taboola network to
bring you our recommendations for how to customize your
user experience for each traffic source.
PU
BL
IS
HE
R
BE
NC
HM
AR
K
RE
PO
RT
4
We work with our network of publisher partners and digital properties
in a variety of ways—we help them circulate editorial content, circulate
sponsored content, optimize their pages and distribute their content
effectively.
This activity provides the big picture into how and where people are finding
publisher content, and how they’re responding once they get there.
The basis of our analysis focused on these traffic sources:
Direct when users type the URL directly into the browser or clicked on
a bookmark
Search traffic originating from search engines such as Google, Bing,
and Yahoo
Share traffic from open web link clicks, direct messages and emails
between audiences
Social traffic from social platforms like Facebook, Twitter, Instagram,
LinkedIn, etc.
Each of these sources of traffic brings with it its own unique impact on
revenue and engagement. For each, we ran the numbers by device,
publisher size, traffic, unique visits and revenue over a 90-day window to
determine the best user experience for that traffic source.
We’re going beyond just the benchmarks and highlighting the best
opportunities to maximize revenue and engaged traffic to your site.
HOW WE PULLED THE NUMBERS

PU
BL
IS
HE
R
BE
NC
HM
AR
K
RE
PO
RT
5
ENTERPRISE PUBLISHERS:
Data-driven insights by device, traffic source, revenue, page views and unique visits for well-known publishers.
Data-Driven UX Recommendations by Traffic Source

GET THE TABOOLA FEED
S T A R T N O W
PU
BL
IS
HE
R
BE
NC
HM
AR
K
RE
PO
RT
7
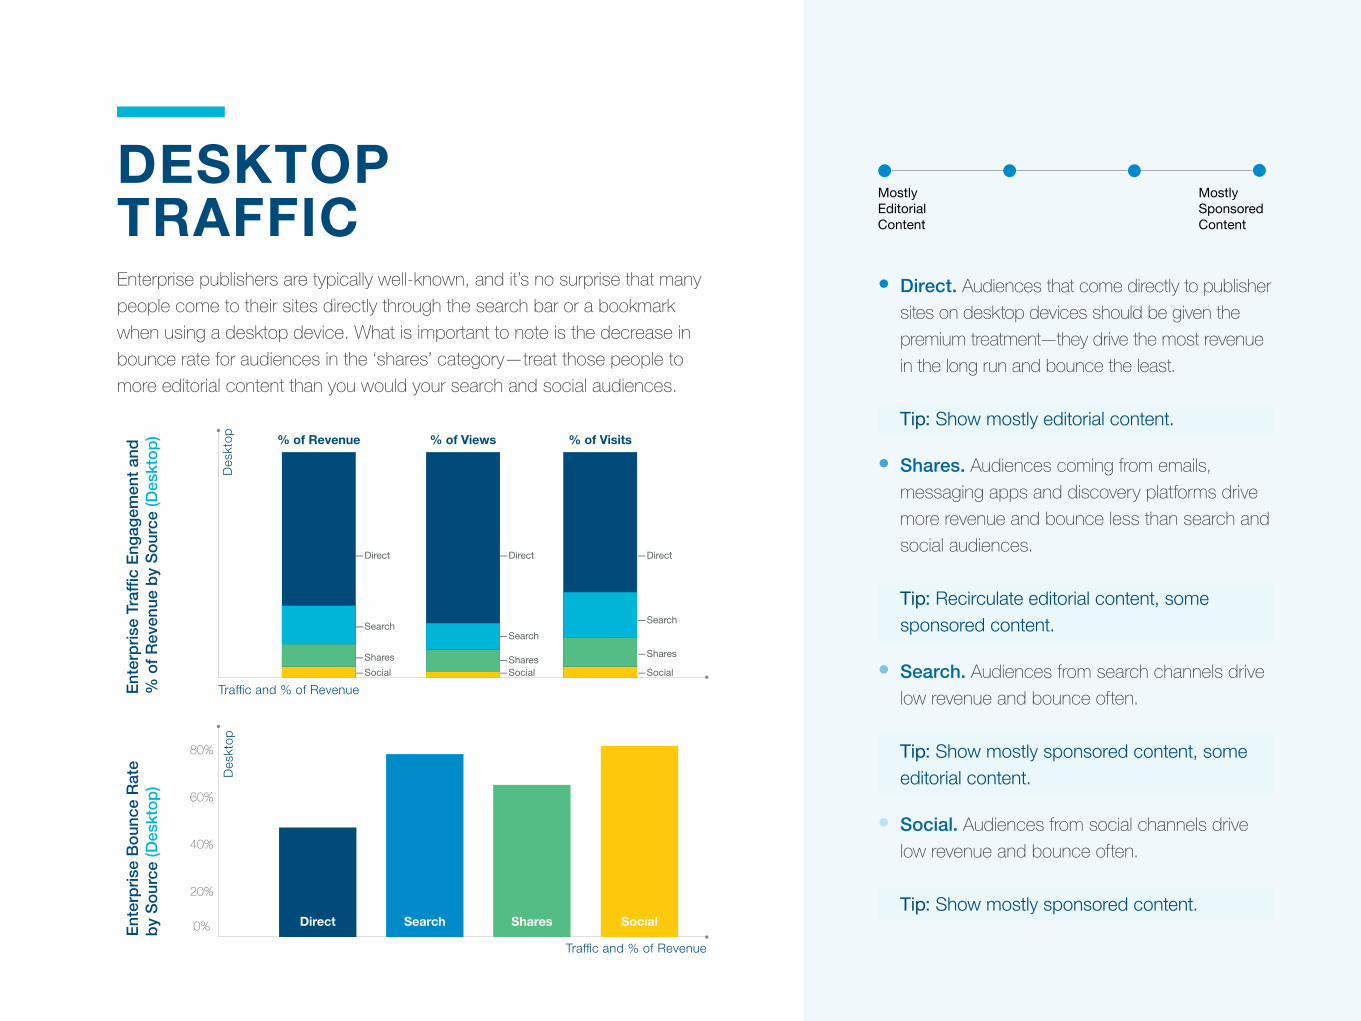
Enterprise publishers are typically well-known, and it’s no surprise that many
people come to their sites directly through the search bar or a bookmark
when using a desktop device. What is important to note is the decrease in
bounce rate for audiences in the ‘shares’ category—treat those people to
more editorial content than you would your search and social audiences.
DESKTOP TRAFFIC
Ent
erp
rise
Tra
ffic
Eng
agem
ent
and
% o
f R
even
ue b
y S
our
ce (D
eskt
op
)E
nter
pri
se B
oun
ce R
ate
by
So
urce
(Des
kto
p)
Traffic and % of Revenue
Des
ktop
80%
60%
40%
20%
0% Direct Search Shares Social
Traffic and % of Revenue
Des
ktop % of Revenue % of Views % of Visits
—Direct
—Search
—Shares
—Social
—Direct
—Search
—Shares—Social
—Direct
—Search
—Shares
—Social
Mostly Sponsored Content
Mostly Editorial Content
• Direct. Audiences that come directly to publisher
sites on desktop devices should be given the
premium treatment—they drive the most revenue
in the long run and bounce the least.
Tip: Show mostly editorial content.
• Shares. Audiences coming from emails,
messaging apps and discovery platforms drive
more revenue and bounce less than search and
social audiences.
Tip: Recirculate editorial content, some sponsored content.
• Search. Audiences from search channels drive
low revenue and bounce often.
Tip: Show mostly sponsored content, some editorial content.
• Social. Audiences from social channels drive
low revenue and bounce often.
Tip: Show mostly sponsored content.

PU
BL
IS
HE
R
BE
NC
HM
AR
K
RE
PO
RT
8
When we look at mobile devices, the difference in revenue and engagement
opportunity between the four traffic sources decreases drastically—here, all
audiences are on a more even ground. Direct traffic still deserves the most
premium treatment, and search leads the way in traffic that bounces the most.
MOBILE TRAFFIC
Ent
erp
rise
Tra
ffic
Eng
agem
ent
and
%
of
Rev
enue
by
So
urce
(M
ob
ile)
Ent
erp
rise
Bo
unce
Rat
e b
y S
our
ce (M
ob
ile)
Traffic and % of Revenue
Des
ktop
80%
60%
40%
20%
0% Direct Search Shares Social
Traffic and % of Revenue
Des
ktop % of Revenue % of Views % of Visits
—Direct
—Search
—Shares
—Social
—Direct
—Search
—Shares
—Social
—Direct
—Search
—Shares
—Social
Mostly Sponsored Content
Mostly Editorial Content
• Direct. Audiences that come directly to
publisher sites on mobile devices should still see
more editorial content than sponsored.
Tip: Show mostly editorial content, some sponsored content.
• Shares. Audiences coming from emails,
messaging apps and discovery platforms drive
less revenue than search but bounce the least.
Tip: Show some editorial content, some sponsored content.
• Search. Audiences from search channels drive
high revenue and engagement, but bounce
often.
Tip: Show some editorial content, mostly sponsored content.
• Social. Audiences from social channels drive
the least amount of revenue and engagement
and bounce the most often.
Tip: Show mostly sponsored content.

PU
BL
IS
HE
R
BE
NC
HM
AR
K
RE
PO
RT
9
SMB PUBLISHERS:
Data-driven insights by device, traffic source, revenue, page views and unique visits for smaller, niche publishers.
Data-Driven UX Recommendations by Traffic Source

GET THE TABOOLA FEED
S T A R T N O W
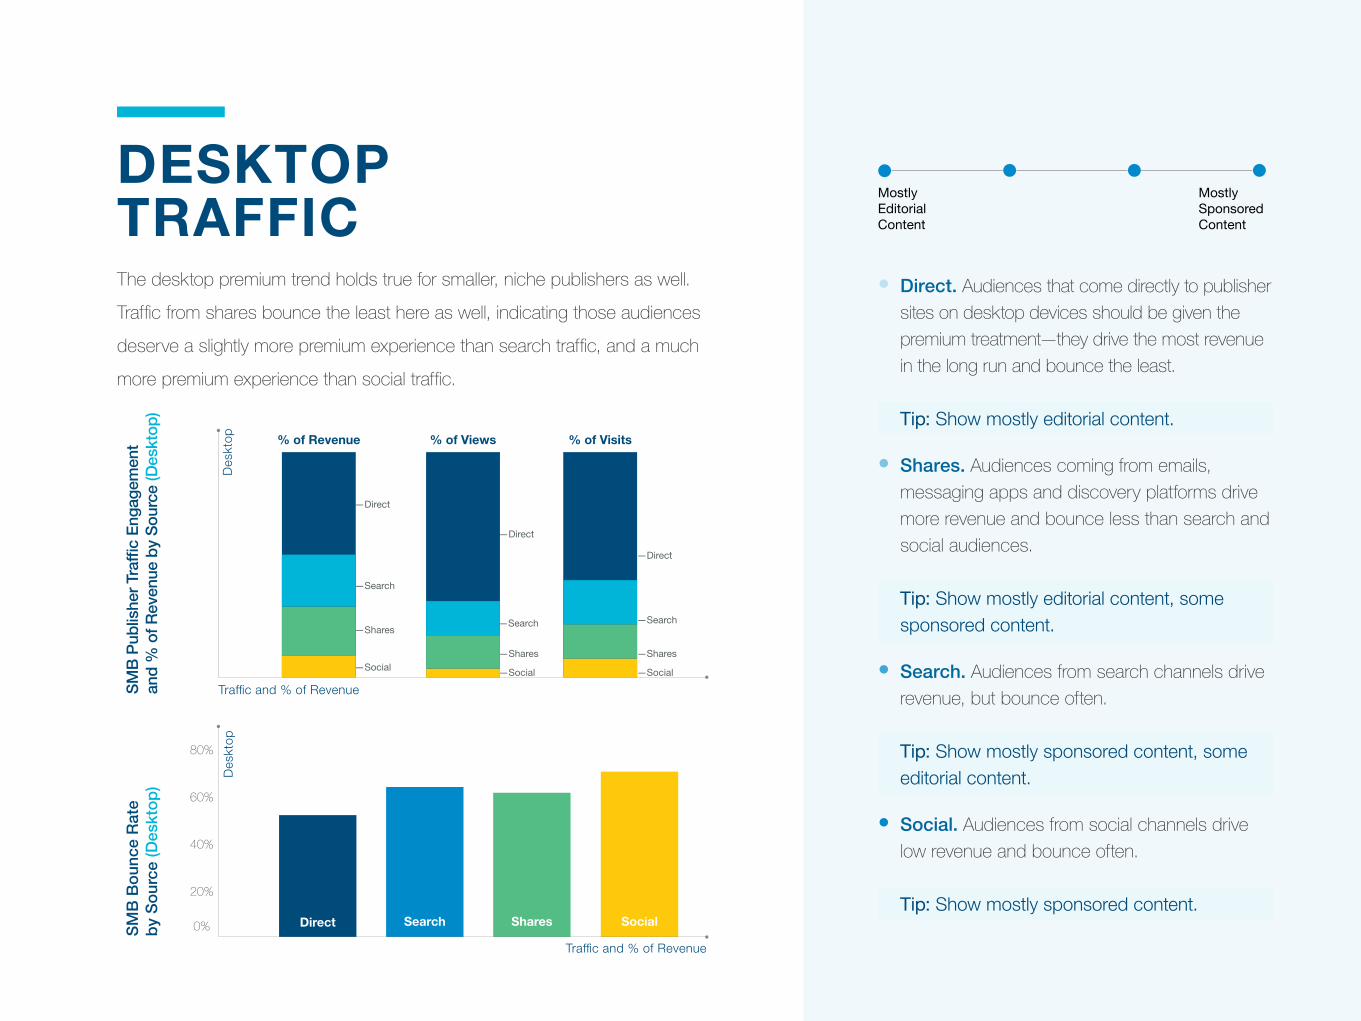
The desktop premium trend holds true for smaller, niche publishers as well.
Traffic from shares bounce the least here as well, indicating those audiences
deserve a slightly more premium experience than search traffic, and a much
more premium experience than social traffic.
DESKTOP TRAFFIC
SM
B P
ublis
her
Traf
fic E
ngag
emen
tan
d %
of R
even
ue b
y S
ourc
e (D
eskt
op)
SM
B B
oun
ce R
ate
by
So
urce
(Des
kto
p)
Traffic and % of Revenue
Des
ktop
80%
60%
40%
20%
0% Direct Search Shares Social
Traffic and % of Revenue
Des
ktop % of Revenue % of Views % of Visits
—Direct
—Search
—Shares
—Social
—Direct
—Search
—Shares
—Social
—Direct
—Search
—Shares
—Social
• Direct. Audiences that come directly to publisher
sites on desktop devices should be given the
premium treatment—they drive the most revenue
in the long run and bounce the least.
Tip: Show mostly editorial content.
• Shares. Audiences coming from emails,
messaging apps and discovery platforms drive
more revenue and bounce less than search and
social audiences.
Tip: Show mostly editorial content, some sponsored content.
• Search. Audiences from search channels drive
revenue, but bounce often.
Tip: Show mostly sponsored content, some editorial content.
• Social. Audiences from social channels drive
low revenue and bounce often.
Tip: Show mostly sponsored content.
Mostly Sponsored Content
Mostly Editorial Content

• Shares. Audiences coming from emails,
messaging apps and discovery platforms drive
some revenue and engagement, but bounce
less than search and social audiences.
Tip: Show mostly editorial content, some sponsored content.
• Direct. Audiences that come directly to sites
on mobile devices don’t drive much revenue or
engagement, but bounce the least
Tip: Show some editorial content, some sponsored content.
• Search. Audiences from search channels drive
a lot of revenue or engagement, but bounce
often.
Tip: Show mostly sponsored content, some editorial content.
• Social. Audiences from social channels drive a
lot of revenue or engagement, but bounce often.
Tip: Show mostly sponsored content, some editorial content.
Direct traffic falls from grace on mobile devices for smaller, niche publishers
and digital properties. Here, traffic from shares is king, driving the highest
amount of revenue and engagement, while also bouncing slightly less than
audiences from search and social channels.
MOBILE TRAFFIC
SM
B B
oun
ce R
ate
by
So
urce
(Mo
bile
)
Traffic and % of Revenue
Des
ktop
80%
60%
40%
20%
0% Direct Search Shares Social
Traffic and % of Revenue
Des
ktop % of Revenue % of Views % of Visits
—Direct
—Search
—Shares
—Social
—Direct
—Search
—Shares
—Social
—Direct
—Search
—Shares
—Social
SM
B P
ublis
her
Traf
fic E
ngag
emen
tan
d %
of R
even
ue b
y S
ourc
e (M
obile
)
Mostly Sponsored Content
Mostly Editorial Content

PU
BL
IS
HE
R
BE
NC
HM
AR
K
RE
PO
RT
1 3
CREATIVE STRATEGIES For Recirculating Editorial Content
Headline and thumbnail best practices, with examples

GET THE TABOOLA FEED
S T A R T N O W
PU
BL
IS
HE
R
BE
NC
HM
AR
K
RE
PO
RT
1 5
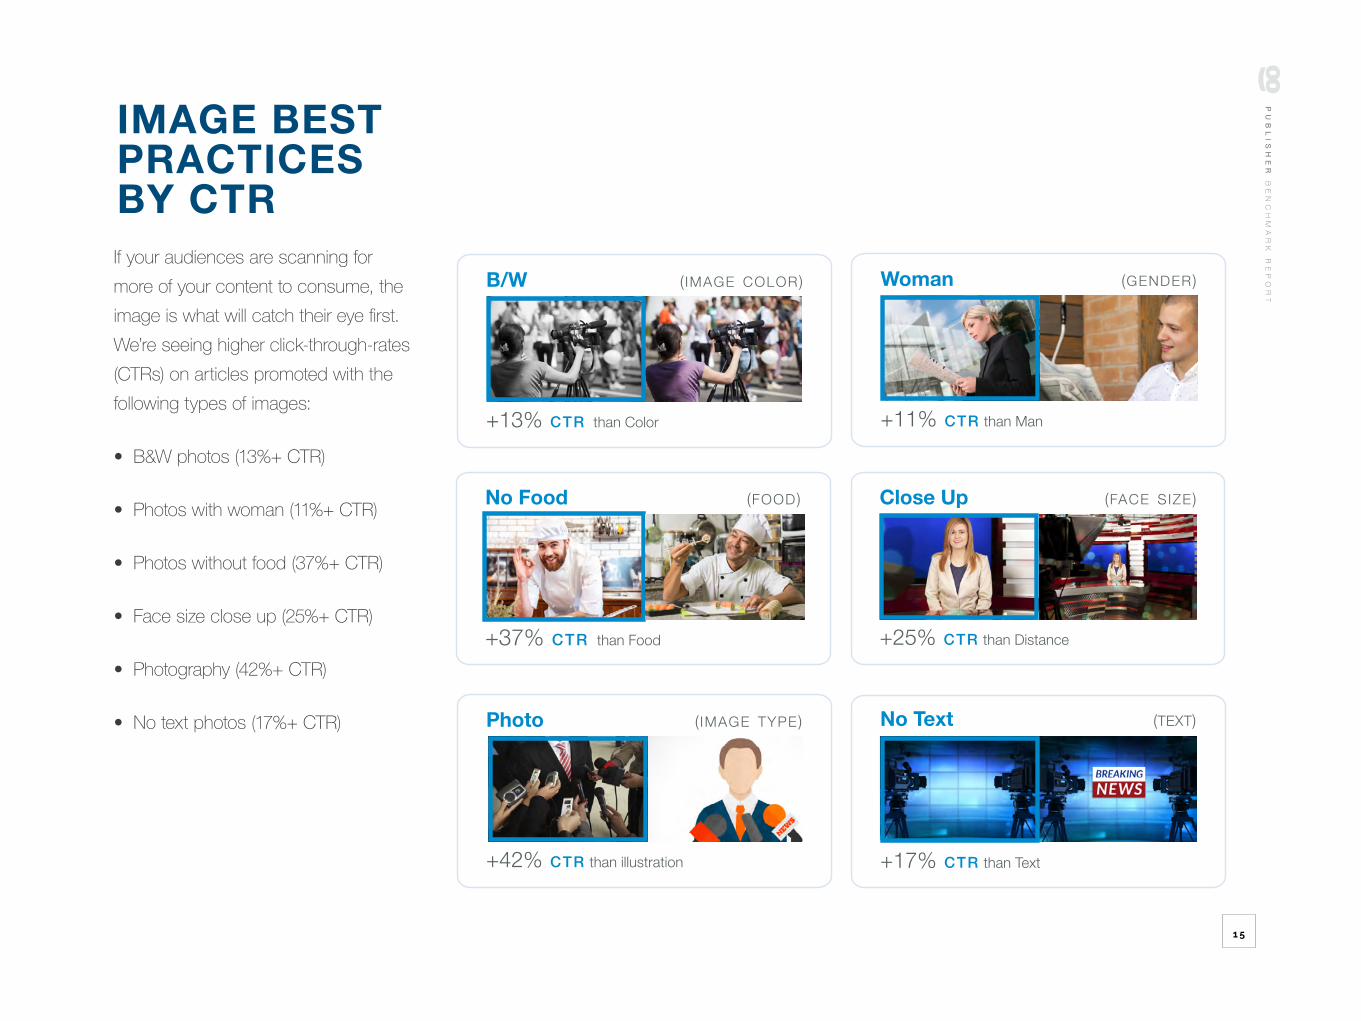
B/W ( image color)
+13% ctr than Color
IMAGE BEST PRACTICES BY CTR
Photo ( image type)
+42% ctr than illustration
No Food (food)
+37% ctr than Food
Close Up (face size)
+25% ctr than Distance
If your audiences are scanning for more of your content to consume, the image is what will catch their eye first. We’re seeing higher click-through-rates (CTRs) on articles promoted with the following types of images:
• B&W photos (13%+ CTR)
• Photos with woman (11%+ CTR)
• Photos without food (37%+ CTR)
• Face size close up (25%+ CTR)
• Photography (42%+ CTR)
• No text photos (17%+ CTR)
Woman (gender)
+11% ctr than Man
No Text (text)
+17% ctr than Text

PU
BL
IS
HE
R
BE
NC
HM
AR
K
RE
PO
RT
1 6
Person (subject)
+20% ctr than No Person
IMAGE BEST PRACTICES BY CTR• Photos with Person (20%+ CTR)
• Photos with Animals (22%+ CTR)
• Outdoor (15%+ CTR)
Animals (subject)
+22% ctr than no Animals
Outdoor (location)
+15% ctr than Indoor
PU
BL
IS
HE
R
BE
NC
HM
AR
K
RE
PO
RT
1 7
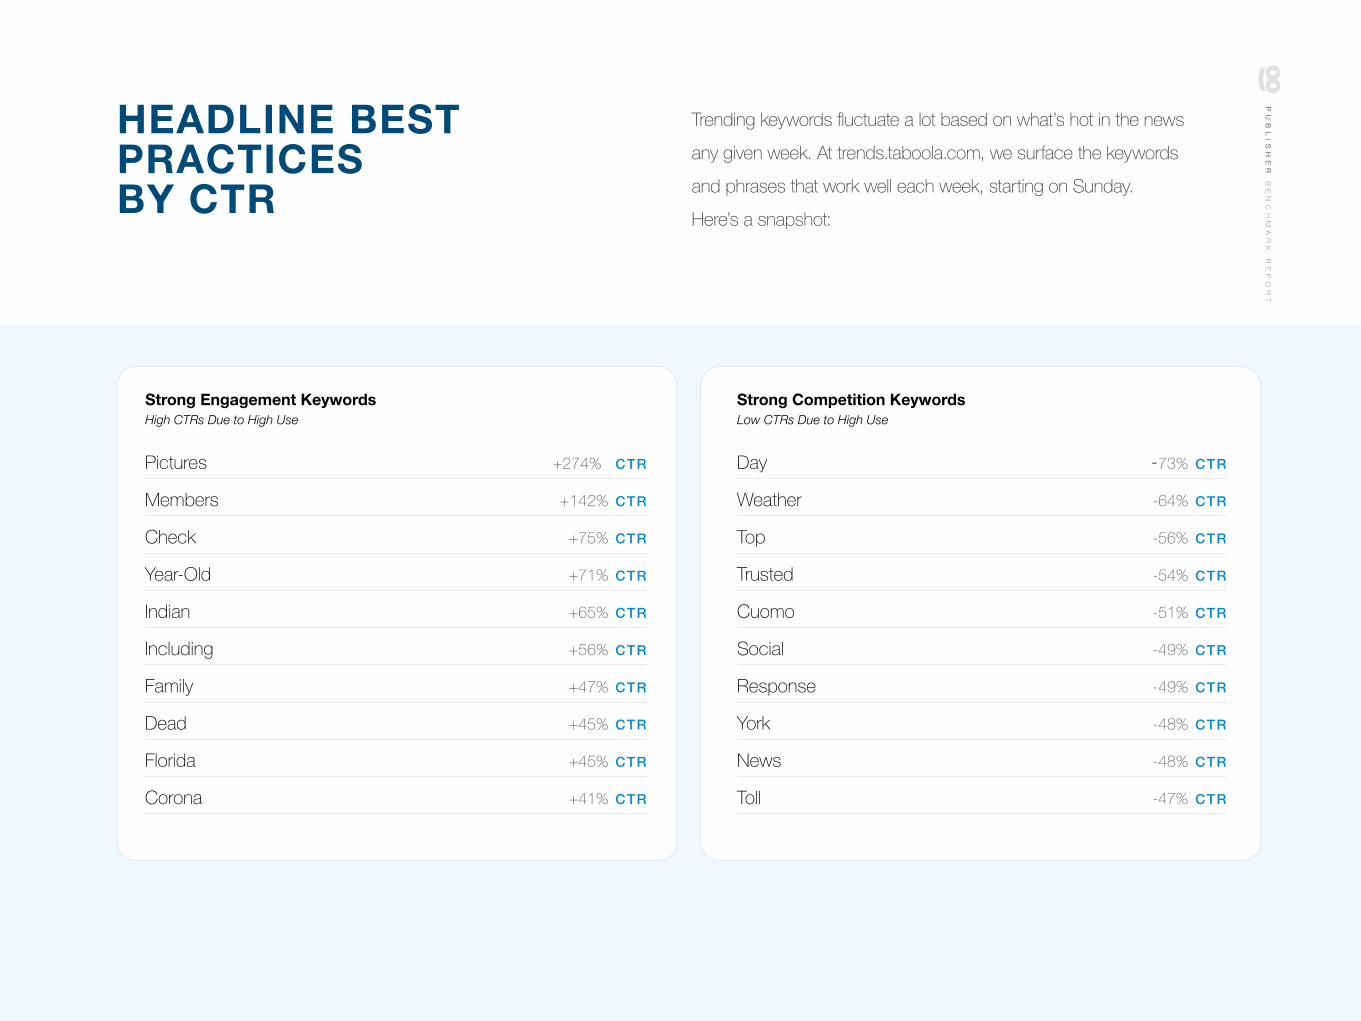
Trending keywords fluctuate a lot based on what’s hot in the news
any given week. At trends.taboola.com, we surface the keywords
and phrases that work well each week, starting on Sunday.
Here’s a snapshot:
Pictures +274% ctr
Members +142% ctr
Check +75% ctr
Year-Old +71% ctr
Indian +65% ctr
Including +56% ctr
Family +47% ctr
Dead +45% ctr
Florida +45% ctr
Corona +41% ctr
Day -73% ctr
Weather -64% ctr
Top -56% ctr
Trusted -54% ctr
Cuomo -51% ctr
Social -49% ctr
Response -49% ctr
York -48% ctr
News -48% ctr
Toll -47% ctr
Strong Engagement KeywordsHigh CTRs Due to High Use
Strong Competition KeywordsLow CTRs Due to High Use
HEADLINE BEST PRACTICES BY CTR

PU
BL
IS
HE
R
BE
NC
HM
AR
K
RE
PO
RT
1 8
Trending keywords fluctuate a lot based on what’s hot in the news
any given week. At trends.taboola.com, we surface the keywords
and phrases that work well each week, starting on Sunday.
Here’s a snapshot:
HEADLINE BEST PRACTICES BY CTR
Opportunity KeywordsHigh CTRs, but Low Use
Sudden +183% ctr
Jong-Un +183% ctr
Influencer +183% ctr
Licked +183% ctr
Bowl +183% ctr
Accepts +181% ctr
Pune +181% ctr
Youth +181% ctr
Cases +180% ctr
Cluster +180% ctr
Transmission +180% ctr
Community +180% ctr
Places +179% ctr
Outfit +178% ctr
Athiya +178% ctr
Huballi +178% ctr
Shetty's +178% ctr
Prayagraj +177% ctr
Comfort +176% ctr
Tragic +176% ctr
PU
BL
IS
HE
R
BE
NC
HM
AR
K
RE
PO
RT
1 9
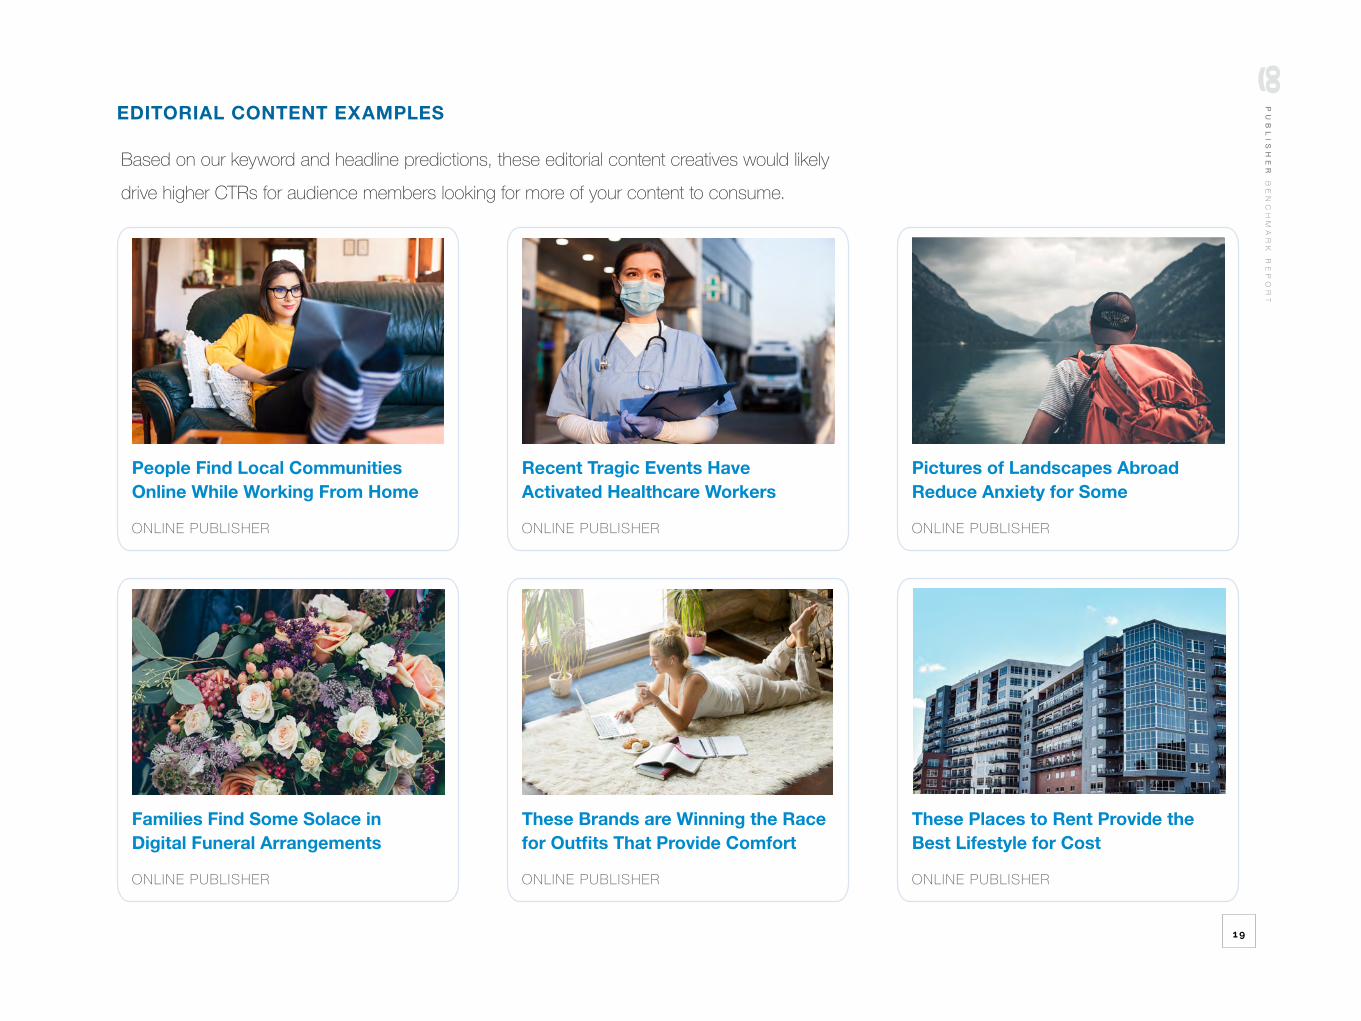
EDITORIAL CONTENT EXAMPLES
Based on our keyword and headline predictions, these editorial content creatives would likely
drive higher CTRs for audience members looking for more of your content to consume.
People Find Local Communities Online While Working From Home
ONLINE PUBLISHER
Families Find Some Solace in Digital Funeral Arrangements
ONLINE PUBLISHER
Recent Tragic Events Have Activated Healthcare Workers
ONLINE PUBLISHER
These Brands are Winning the Race for Outfits That Provide Comfort
ONLINE PUBLISHER
Pictures of Landscapes Abroad Reduce Anxiety for Some
ONLINE PUBLISHER
These Places to Rent Provide the Best Lifestyle for Cost
ONLINE PUBLISHER
PU
BL
IS
HE
R
BE
NC
HM
AR
K
RE
PO
RT
2 0
ADS FORMATS Circulating Sponsored Content
Research reveals the ad formats that drive the most clicks on the open web

GET THE TABOOLA FEED
S T A R T N O W

For those audiences that you’re showing more sponsored content—how and
where should that content appear? Taboola and Nielsen used BrainVu’s AI
platform to find out. We tested people’s attentiveness and emotional response
while in different mobile contexts, using different biomarkers like eye-tracking,
brainwaves and more to measure whether or not those ads had an impact.
Research was conducted in the U.S. with 60 participants. Here’s what we found:
They’re more likely to click an ad at
the bottom of the article, after they’ve
finished reading what they came for.
The longer they scrolled, the more
likely it was they’d click.
NIELSEN USES EYE TRACKING AND BRAIN WAVESto Discover Most Favorable Ads
Readers are 8% More Open Minded in the ‘Moment of Next’
When scrolling
through a feed
environment,
readers were
more likely to be
engaged.
Readers Paid Attention 20%+ and Were 17%+ Emotional About Ads in a Feed
The More Readers Scrolled, the More Likely They Were to Click
Articles Moments of Next
8%
0 1 2 3 4 5 6
74%

Taboola enables nearly half the world's connected population to discover what’s
interesting and new at the moments they’re most ready to explore. Powered by
Deep Learning, AI, and a massive dataset, Taboola’s Discovery platform creates new
monetization, engagement, and audience opportunities for digital properties.
Taboola Feed
Bring the non-disruptive scrolling
news feed experience of social
networks right to your pages.
Mobile SDK and AMP Pages
Bring the full scope of Taboola’s
publisher platform capabilities to
the mobile environment.
Taboola Newsroom
Reach customers closer to the
point of sale— target people
who are more likely to convert.
Powered by Taboola’s predictive engine and massive data set of over 1B internet
users, Taboola Newsroom helps writers, editors and special-interest teams make
informed decisions to increase readership.
That’s not all. Taboola has all of the targeting options you need for a successful
discovery campaign—location, demographic, creative and more.
GET STARTED WITH TABOOLA
We’ve Got the Tools to Help You
Get the Taboola Feed Today S T A R T N O W