TABLE SNR08. Incidence rates of nonfatal … ..... 311514 20.9 – – – 11.2 – Ice cream and...
32
TABLE SNR08. Incidence rates 1 of nonfatal occupational illness, by industry and category of illness, 2014 Industry 2 NAICS code 3 Incidence rates per 10,000 full-time workers Total cases Skin diseases or disorders Respiratory conditions Poisonings Hearing loss All other illnesses All industries including state and local government 4 ..................................................... 17.5 2.6 1.6 0.2 1.9 11.1 Private industry 4 ................................................ 15.3 2.3 1.3 .2 1.9 9.6 Goods-producing 4 ................................................. 26.0 3.3 1.2 .2 7.2 14.2 Natural resources and mining 4,5 ............................... 20.5 5.5 2.4 .4 1.6 10.6 Agriculture, forestry, fishing and hunting 4 ........................ 11 31.1 9.7 2.3 .7 1.2 17.2 Crop production 4 .................................................................. 111 34.5 13.7 1.0 .8 – 18.9 Oilseed and grain farming 4 .............................................. 1111 – – – – – – Vegetable and melon farming 4 ......................................... 1112 37.6 13.3 – – – 22.1 Fruit and tree nut farming 4 ............................................... 1113 27.9 7.2 – 1.3 – 18.7 Greenhouse, nursery, and floriculture production 4 .......... 1114 41.1 20.0 – – – 19.3 Other crop farming 4 .......................................................... 1119 32.7 – – – – 20.6 Animal production and aquaculture 4 .................................... 112 27.2 10.5 1.5 .9 1.4 12.8 Cattle ranching and farming 4 ........................................... 1121 18.1 9.7 – – – 5.7 Beef cattle ranching and farming, including feedlots 4 .. 11211 9.5 – – – – – Dairy cattle and milk production 4 ................................. 11212 20.5 11.3 – – – 6.6 Hog and pig farming 4 ....................................................... 1122 44.0 6.2 – – 8.2 – Poultry and egg production 4 ............................................. 1123 39.0 7.1 – – – 31.5 Aquaculture 4 .................................................................... 1125 – – – – – – Other animal production 4 ................................................. 1129 58.8 43.9 – – – – Forestry and logging ............................................................ 113 19.9 – – – 8.5 5.4 Logging ............................................................................ 1133 12.9 – – – 9.4 – Fishing, hunting and trapping ............................................... 114 – – – – – – Fishing .............................................................................. 1141 – – – – – – Support activities for agriculture and forestry ....................... 115 31.9 5.4 4.9 – .9 20.5 Support activities for crop production ............................... 1151 31.5 5.3 2.7 – 1.0 22.3 Support activities for crop production ........................... 11511 31.5 5.3 2.7 – 1.0 22.3 Soil preparation, planting, and cultivating ................ 115112 – – – – – – Crop harvesting, primarily by machine ..................... 115113 24.5 16.3 – – – – Postharvest crop activities (except cotton ginning) .. 115114 15.4 2.5 – – 3.3 7.7 Farm labor contractors and crew leaders ................. 115115 44.9 7.1 1.4 – – 36.4 Farm management services ..................................... 115116 63.0 – – – – 36.8 Support activities for animal production ........................... 1152 – – – – – – Support activities for forestry ............................................ 1153 37.9 17.7 – – – – Mining, quarrying, and oil and gas extraction 5 ................. 21 9.3 1.1 2.5 – 2.0 3.7 Oil and gas extraction .......................................................... 211 7.8 – – – 2.0 – Oil and gas extraction ...................................................... 2111 7.8 – – – 2.0 – Oil and gas extraction .................................................. 21111 7.8 – – – 2.0 – See footnotes at end of table.
Transcript of TABLE SNR08. Incidence rates of nonfatal … ..... 311514 20.9 – – – 11.2 – Ice cream and...

TABLE SNR08. Incidence rates1 of nonfatal occupational illness, by industry and category of illness, 2014
Industry2 NAICScode3
Incidence rates per 10,000 full-time workers
Totalcases
Skindiseases
ordisorders
Respiratoryconditions Poisonings Hearing loss All other
illnesses
All industries including state and localgovernment4 ..................................................... 17.5 2.6 1.6 0.2 1.9 11.1
Private industry4 ................................................ 15.3 2.3 1.3 .2 1.9 9.6
Goods-producing4 ................................................. 26.0 3.3 1.2 .2 7.2 14.2
Natural resources and mining4,5 ............................... 20.5 5.5 2.4 .4 1.6 10.6
Agriculture, forestry, fishing and hunting4 ........................ 11 31.1 9.7 2.3 .7 1.2 17.2Crop production4 .................................................................. 111 34.5 13.7 1.0 .8 – 18.9
Oilseed and grain farming4 .............................................. 1111 – – – – – –Vegetable and melon farming4 ......................................... 1112 37.6 13.3 – – – 22.1Fruit and tree nut farming4 ............................................... 1113 27.9 7.2 – 1.3 – 18.7Greenhouse, nursery, and floriculture production4 .......... 1114 41.1 20.0 – – – 19.3Other crop farming4 .......................................................... 1119 32.7 – – – – 20.6
Animal production and aquaculture4 .................................... 112 27.2 10.5 1.5 .9 1.4 12.8Cattle ranching and farming4 ........................................... 1121 18.1 9.7 – – – 5.7
Beef cattle ranching and farming, including feedlots4 .. 11211 9.5 – – – – –Dairy cattle and milk production4 ................................. 11212 20.5 11.3 – – – 6.6
Hog and pig farming4 ....................................................... 1122 44.0 6.2 – – 8.2 –Poultry and egg production4 ............................................. 1123 39.0 7.1 – – – 31.5Aquaculture4 .................................................................... 1125 – – – – – –Other animal production4 ................................................. 1129 58.8 43.9 – – – –
Forestry and logging ............................................................ 113 19.9 – – – 8.5 5.4Logging ............................................................................ 1133 12.9 – – – 9.4 –
Fishing, hunting and trapping ............................................... 114 – – – – – –Fishing .............................................................................. 1141 – – – – – –
Support activities for agriculture and forestry ....................... 115 31.9 5.4 4.9 – .9 20.5Support activities for crop production ............................... 1151 31.5 5.3 2.7 – 1.0 22.3
Support activities for crop production ........................... 11511 31.5 5.3 2.7 – 1.0 22.3Soil preparation, planting, and cultivating ................ 115112 – – – – – –Crop harvesting, primarily by machine ..................... 115113 24.5 16.3 – – – –Postharvest crop activities (except cotton ginning) .. 115114 15.4 2.5 – – 3.3 7.7Farm labor contractors and crew leaders ................. 115115 44.9 7.1 1.4 – – 36.4Farm management services ..................................... 115116 63.0 – – – – 36.8
Support activities for animal production ........................... 1152 – – – – – –Support activities for forestry ............................................ 1153 37.9 17.7 – – – –
Mining, quarrying, and oil and gas extraction5 ................. 21 9.3 1.1 2.5 – 2.0 3.7Oil and gas extraction .......................................................... 211 7.8 – – – 2.0 –
Oil and gas extraction ...................................................... 2111 7.8 – – – 2.0 –Oil and gas extraction .................................................. 21111 7.8 – – – 2.0 –
See footnotes at end of table.

TABLE SNR08. Incidence rates1 of nonfatal occupational illness, by industry and category of illness, 2014 — Continued
Industry2 NAICScode3
Incidence rates per 10,000 full-time workers
Totalcases
Skindiseases
ordisorders
Respiratoryconditions Poisonings Hearing loss All other
illnesses
Crude petroleum and natural gas extraction ............ 211111 8.0 – – – 2.0 –Natural gas liquid extraction ..................................... 211112 – – – – – –
Mining (except oil and gas)6 ................................................. 212 22.9 – 9.4 – 6.0 6.9Coal mining6 ..................................................................... 2121 45.6 – 24.7 – 10.8 10.1
Coal mining6 ................................................................. 21211 45.6 – 24.7 – 10.8 10.1Bituminous coal and lignite surface mining6 ............ 212111 15.1 – 6.0 – 4.4 4.7Bituminous coal underground mining6 ..................... 212112 68.7 – 39.2 – 15.6 13.9Anthracite mining6 .................................................... 212113 – – – – – –
Metal ore mining6 ............................................................. 2122 14.4 – – – – 9.8Iron ore mining6 ............................................................ 21221 34.3 – – – – 28.3Gold ore and silver ore mining6 .................................... 21222 10.8 – – – – –
Gold ore mining6 ...................................................... 212221 – – – – – –Silver ore mining6 ..................................................... 212222 – – – – – –
Copper, nickel, lead, and zinc mining6 ......................... 21223 11.9 – – – – –Lead ore and zinc ore mining6 ................................. 212231 – – – – – –Copper ore and nickel ore mining6 ........................... 212234 – – – – – –
Other metal ore mining6 ............................................... 21229 – – – – – –Uranium-radium-vanadium ore mining6 ................... 212291 – – – – – –All other metal ore mining6 ....................................... 212299 – – – – – –
Nonmetallic mineral mining and quarrying6 ..................... 2123 7.3 – – – 3.2 3.0Stone mining and quarrying6 ........................................ 21231 7.6 – – – 3.1 3.3
Dimension stone mining and quarrying6 .................. 212311 – – – – – –Crushed and broken limestone mining andquarrying6 ............................................................... 212312 6.1 – – – – –
Crushed and broken granite mining and quarrying6 212313 – – – – – –Other crushed and broken stone mining andquarrying6 ............................................................... 212319 – – – – – –
Sand, gravel, clay, and ceramic and refractoryminerals mining and quarrying6 ................................. 21232 5.0 – – – – –Construction sand and gravel mining6 ..................... 212321 5.8 – – – – –Kaolin and ball clay mining6 ..................................... 212324 – – – – – –Clay and ceramic and refractory minerals mining6 .. 212325 – – – – – –
Other nonmetallic mineral mining and quarrying6 ........ 21239 11.9 – – – – –Potash, soda, and borate mineral mining6 ............... 212391 – – – – – –Phosphate rock mining6 ........................................... 212392 – – – – – –Other chemical and fertilizer mineral mining6 .......... 212393 – – – – – –All other nonmetallic mineral mining6 ....................... 212399 – – – – – –
Support activities for mining ................................................. 213 3.4 1.3 – – – 2.0Support activities for mining ............................................. 2131 3.4 1.3 – – – 2.0
Support activities for mining ......................................... 21311 3.4 1.3 – – – 2.0Drilling oil and gas wells ........................................... 213111 3.8 – – – – 2.7Support activities for oil and gas operations ............ 213112 3.3 – – – – 1.9
Construction ............................................................... 8.2 2.0 .7 .1 .3 5.1
See footnotes at end of table.

TABLE SNR08. Incidence rates1 of nonfatal occupational illness, by industry and category of illness, 2014 — Continued
Industry2 NAICScode3
Incidence rates per 10,000 full-time workers
Totalcases
Skindiseases
ordisorders
Respiratoryconditions Poisonings Hearing loss All other
illnesses
Construction ..................................................................... 23 8.2 2.0 0.7 0.1 0.3 5.1Construction of buildings ...................................................... 236 6.6 1.3 1.7 – .3 3.3
Residential building construction ...................................... 2361 6.3 .4 2.0 – – 3.6Nonresidential building construction ................................ 2362 7.0 2.0 – – – 3.1
Heavy and civil engineering construction ............................. 237 8.0 1.4 .6 – .5 5.5Utility system construction ................................................ 2371 7.3 2.1 .5 – – 4.6
Water and sewer line and related structuresconstruction ................................................................ 23711 7.8 1.8 – – – 5.2
Oil and gas pipeline and related structuresconstruction ................................................................ 23712 1.2 – – – – –
Power and communication line and related structuresconstruction ................................................................ 23713 12.4 – – – – 7.7
Land subdivision .............................................................. 2372 – – – – – –Highway, street, and bridge construction ......................... 2373 7.5 .8 – – 1.5 4.3Other heavy and civil engineering construction ............... 2379 13.0 – – – – 12.5
Specialty trade contractors ................................................... 238 8.9 2.4 .5 .2 .3 5.6Foundation, structure, and building exterior contractors .. 2381 9.0 .9 .3 – – 7.0
Poured concrete foundation and structure contractors 23811 6.0 – – – – 2.9Structural steel and precast concrete contractors ....... 23812 3.0 – – – – 3.0Framing contractors ..................................................... 23813 11.5 – – – – –Masonry contractors ..................................................... 23814 4.4 – – – – 1.6Glass and glazing contractors ...................................... 23815 3.3 – – – – –Roofing contractors ...................................................... 23816 7.9 – – – – 7.3Siding contractors ........................................................ 23817 – – – – – –Other foundation, structure, and building exteriorcontractors ................................................................. 23819 – – – – – –
Building equipment contractors ........................................ 2382 8.6 2.7 .6 .2 .3 4.9Electrical contractors and other wiring installationcontractors ................................................................. 23821 5.3 1.8 .4 – – 3.0
Plumbing, heating, and air-conditioning contractors .... 23822 11.5 3.5 .8 .2 – 6.6Other building equipment contractors .......................... 23829 9.9 3.1 – – – 4.5
Building finishing contractors ........................................... 2383 8.5 4.4 .4 – – 3.7Drywall and insulation contractors ............................... 23831 3.9 – – – – 2.5Painting and wall covering contractors ......................... 23832 14.6 9.7 – – – 4.9Flooring contractors ..................................................... 23833 – – – – – –Tile and terrazzo contractors ........................................ 23834 31.2 – – – – –Finish carpentry contractors ......................................... 23835 – – – – – –Other building finishing contractors .............................. 23839 4.4 – – – – –
Other specialty trade contractors ..................................... 2389 9.8 – – – – 8.2Site preparation contractors ......................................... 23891 6.6 – – – – 6.3All other specialty trade contractors ............................. 23899 13.3 – – – – 10.2
Manufacturing ............................................................ 35.0 3.6 1.2 .1 11.2 18.9
See footnotes at end of table.
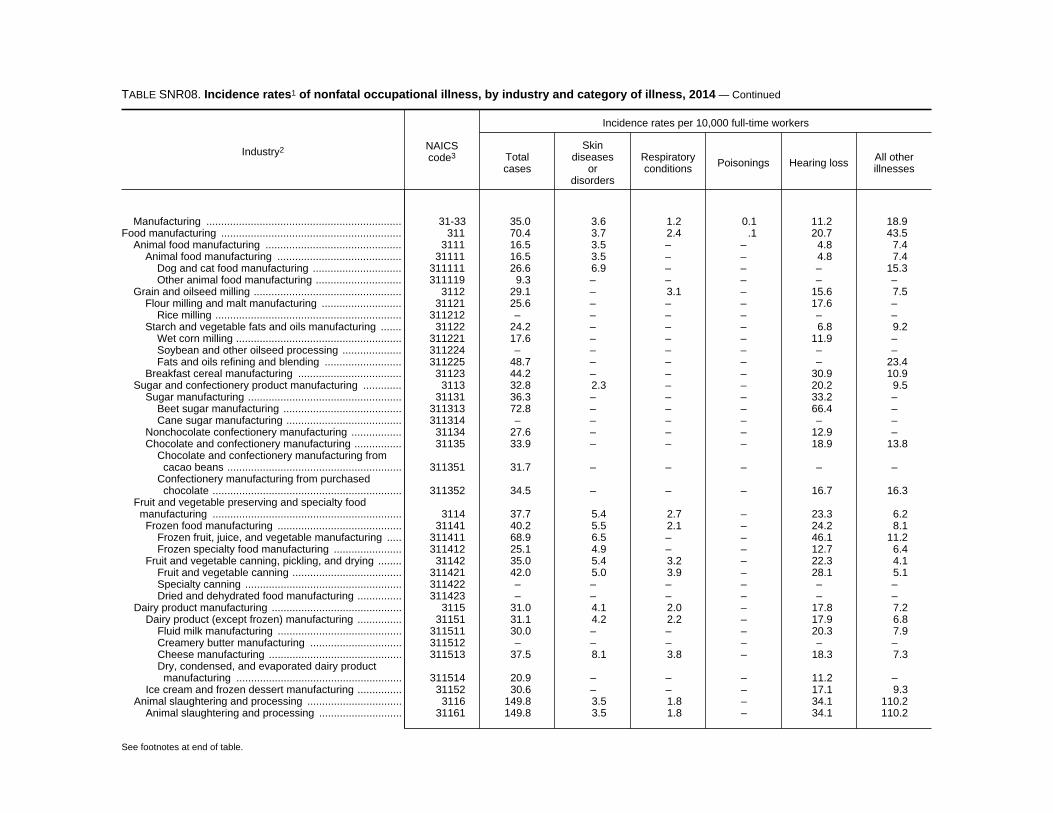
TABLE SNR08. Incidence rates1 of nonfatal occupational illness, by industry and category of illness, 2014 — Continued
Industry2 NAICScode3
Incidence rates per 10,000 full-time workers
Totalcases
Skindiseases
ordisorders
Respiratoryconditions Poisonings Hearing loss All other
illnesses
Manufacturing .................................................................. 31-33 35.0 3.6 1.2 0.1 11.2 18.9Food manufacturing ............................................................. 311 70.4 3.7 2.4 .1 20.7 43.5
Animal food manufacturing .............................................. 3111 16.5 3.5 – – 4.8 7.4Animal food manufacturing .......................................... 31111 16.5 3.5 – – 4.8 7.4
Dog and cat food manufacturing .............................. 311111 26.6 6.9 – – – 15.3Other animal food manufacturing ............................. 311119 9.3 – – – – –
Grain and oilseed milling .................................................. 3112 29.1 – 3.1 – 15.6 7.5Flour milling and malt manufacturing ........................... 31121 25.6 – – – 17.6 –
Rice milling ............................................................... 311212 – – – – – –Starch and vegetable fats and oils manufacturing ....... 31122 24.2 – – – 6.8 9.2
Wet corn milling ........................................................ 311221 17.6 – – – 11.9 –Soybean and other oilseed processing .................... 311224 – – – – – –Fats and oils refining and blending .......................... 311225 48.7 – – – – 23.4
Breakfast cereal manufacturing ................................... 31123 44.2 – – – 30.9 10.9Sugar and confectionery product manufacturing ............. 3113 32.8 2.3 – – 20.2 9.5
Sugar manufacturing .................................................... 31131 36.3 – – – 33.2 –Beet sugar manufacturing ........................................ 311313 72.8 – – – 66.4 –Cane sugar manufacturing ....................................... 311314 – – – – – –
Nonchocolate confectionery manufacturing ................. 31134 27.6 – – – 12.9 –Chocolate and confectionery manufacturing ................ 31135 33.9 – – – 18.9 13.8
Chocolate and confectionery manufacturing fromcacao beans ........................................................... 311351 31.7 – – – – –
Confectionery manufacturing from purchasedchocolate ................................................................ 311352 34.5 – – – 16.7 16.3
Fruit and vegetable preserving and specialty foodmanufacturing ................................................................ 3114 37.7 5.4 2.7 – 23.3 6.2
Frozen food manufacturing .......................................... 31141 40.2 5.5 2.1 – 24.2 8.1Frozen fruit, juice, and vegetable manufacturing ..... 311411 68.9 6.5 – – 46.1 11.2Frozen specialty food manufacturing ....................... 311412 25.1 4.9 – – 12.7 6.4
Fruit and vegetable canning, pickling, and drying ........ 31142 35.0 5.4 3.2 – 22.3 4.1Fruit and vegetable canning ..................................... 311421 42.0 5.0 3.9 – 28.1 5.1Specialty canning ..................................................... 311422 – – – – – –Dried and dehydrated food manufacturing ............... 311423 – – – – – –
Dairy product manufacturing ............................................ 3115 31.0 4.1 2.0 – 17.8 7.2Dairy product (except frozen) manufacturing ............... 31151 31.1 4.2 2.2 – 17.9 6.8
Fluid milk manufacturing .......................................... 311511 30.0 – – – 20.3 7.9Creamery butter manufacturing ............................... 311512 – – – – – –Cheese manufacturing ............................................. 311513 37.5 8.1 3.8 – 18.3 7.3Dry, condensed, and evaporated dairy productmanufacturing ........................................................ 311514 20.9 – – – 11.2 –
Ice cream and frozen dessert manufacturing ............... 31152 30.6 – – – 17.1 9.3Animal slaughtering and processing ................................ 3116 149.8 3.5 1.8 – 34.1 110.2
Animal slaughtering and processing ............................ 31161 149.8 3.5 1.8 – 34.1 110.2
See footnotes at end of table.
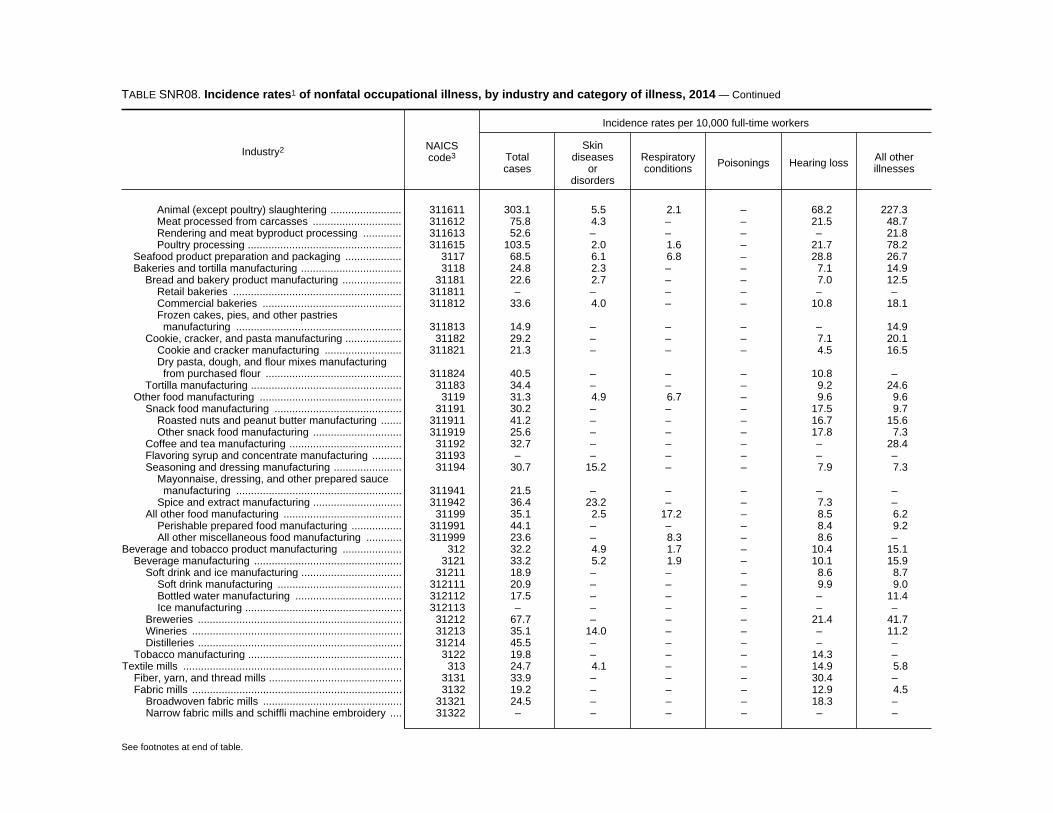
TABLE SNR08. Incidence rates1 of nonfatal occupational illness, by industry and category of illness, 2014 — Continued
Industry2 NAICScode3
Incidence rates per 10,000 full-time workers
Totalcases
Skindiseases
ordisorders
Respiratoryconditions Poisonings Hearing loss All other
illnesses
Animal (except poultry) slaughtering ........................ 311611 303.1 5.5 2.1 – 68.2 227.3Meat processed from carcasses .............................. 311612 75.8 4.3 – – 21.5 48.7Rendering and meat byproduct processing ............. 311613 52.6 – – – – 21.8Poultry processing .................................................... 311615 103.5 2.0 1.6 – 21.7 78.2
Seafood product preparation and packaging ................... 3117 68.5 6.1 6.8 – 28.8 26.7Bakeries and tortilla manufacturing .................................. 3118 24.8 2.3 – – 7.1 14.9
Bread and bakery product manufacturing .................... 31181 22.6 2.7 – – 7.0 12.5Retail bakeries ......................................................... 311811 – – – – – –Commercial bakeries ............................................... 311812 33.6 4.0 – – 10.8 18.1Frozen cakes, pies, and other pastriesmanufacturing ........................................................ 311813 14.9 – – – – 14.9
Cookie, cracker, and pasta manufacturing ................... 31182 29.2 – – – 7.1 20.1Cookie and cracker manufacturing .......................... 311821 21.3 – – – 4.5 16.5Dry pasta, dough, and flour mixes manufacturingfrom purchased flour .............................................. 311824 40.5 – – – 10.8 –
Tortilla manufacturing ................................................... 31183 34.4 – – – 9.2 24.6Other food manufacturing ................................................ 3119 31.3 4.9 6.7 – 9.6 9.6
Snack food manufacturing ........................................... 31191 30.2 – – – 17.5 9.7Roasted nuts and peanut butter manufacturing ....... 311911 41.2 – – – 16.7 15.6Other snack food manufacturing .............................. 311919 25.6 – – – 17.8 7.3
Coffee and tea manufacturing ...................................... 31192 32.7 – – – – 28.4Flavoring syrup and concentrate manufacturing .......... 31193 – – – – – –Seasoning and dressing manufacturing ....................... 31194 30.7 15.2 – – 7.9 7.3
Mayonnaise, dressing, and other prepared saucemanufacturing ........................................................ 311941 21.5 – – – – –
Spice and extract manufacturing .............................. 311942 36.4 23.2 – – 7.3 –All other food manufacturing ........................................ 31199 35.1 2.5 17.2 – 8.5 6.2
Perishable prepared food manufacturing ................. 311991 44.1 – – – 8.4 9.2All other miscellaneous food manufacturing ............ 311999 23.6 – 8.3 – 8.6 –
Beverage and tobacco product manufacturing .................... 312 32.2 4.9 1.7 – 10.4 15.1Beverage manufacturing .................................................. 3121 33.2 5.2 1.9 – 10.1 15.9
Soft drink and ice manufacturing .................................. 31211 18.9 – – – 8.6 8.7Soft drink manufacturing .......................................... 312111 20.9 – – – 9.9 9.0Bottled water manufacturing .................................... 312112 17.5 – – – – 11.4Ice manufacturing ..................................................... 312113 – – – – – –
Breweries ..................................................................... 31212 67.7 – – – 21.4 41.7Wineries ....................................................................... 31213 35.1 14.0 – – – 11.2Distilleries ..................................................................... 31214 45.5 – – – – –
Tobacco manufacturing .................................................... 3122 19.8 – – – 14.3 –Textile mills .......................................................................... 313 24.7 4.1 – – 14.9 5.8
Fiber, yarn, and thread mills ............................................. 3131 33.9 – – – 30.4 –Fabric mills ....................................................................... 3132 19.2 – – – 12.9 4.5
Broadwoven fabric mills ............................................... 31321 24.5 – – – 18.3 –Narrow fabric mills and schiffli machine embroidery .... 31322 – – – – – –
See footnotes at end of table.

TABLE SNR08. Incidence rates1 of nonfatal occupational illness, by industry and category of illness, 2014 — Continued
Industry2 NAICScode3
Incidence rates per 10,000 full-time workers
Totalcases
Skindiseases
ordisorders
Respiratoryconditions Poisonings Hearing loss All other
illnesses
Nonwoven fabric mills .................................................. 31323 17.2 – – – – –Knit fabric mills ............................................................. 31324 – – – – – –
Textile and fabric finishing and fabric coating mills .......... 3133 25.5 – – – – 11.2Textile and fabric finishing mills ................................... 31331 20.6 – – – – 14.4Fabric coating mills ...................................................... 31332 – – – – – –
Textile product mills ............................................................. 314 16.4 2.0 – – 7.4 6.1Textile furnishings mills .................................................... 3141 15.5 – – – 4.6 7.3
Carpet and rug mills ..................................................... 31411 19.3 – – – 7.4 8.2Curtain and linen mills .................................................. 31412 9.4 – – – – –
Other textile product mills ................................................. 3149 17.1 – – – 9.9 5.0Textile bag and canvas mills ........................................ 31491 7.1 – – – – –All other textile product mills ........................................ 31499 23.9 – – – 16.5 6.4
Rope, cordage, twine, tire cord, and tire fabric mills 314994 130.7 – – – 94.4 36.4All other miscellaneous textile product mills ............. 314999 – – – – – –
Apparel manufacturing ......................................................... 315 12.0 – – – 1.8 8.8Apparel knitting mills ........................................................ 3151 22.7 – – – 18.4 –
Hosiery and sock mills ................................................. 31511 29.6 – – – 29.6 –Other apparel knitting mills ........................................... 31519 – – – – – –
Cut and sew apparel manufacturing ................................ 3152 8.4 – – – – 7.2Cut and sew apparel contractors ................................. 31521 – – – – – –Men’s and boys’ cut and sew apparel manufacturing .. 31522 10.0 – – – – 9.6Women’s, girls’, and infants’ cut and sew apparelmanufacturing ............................................................ 31524 – – – – – –
Other cut and sew apparel manufacturing ................... 31528 – – – – – –Apparel accessories and other apparel manufacturing .... 3159 34.8 – – – – 30.5
Leather and allied product manufacturing ............................ 316 60.8 – – – 14.2 42.8Leather and hide tanning and finishing ............................ 3161 127.3 – – – – 96.9Footwear manufacturing .................................................. 3162 89.5 – – – 25.0 60.1Other leather and allied product manufacturing ............... 3169 – – – – – –
Other leather and allied product manufacturing ........... 31699 – – – – – –All other leather good and allied productmanufacturing ........................................................ 316998 – – – – – –
Wood product manufacturing ............................................... 321 47.3 1.5 .8 – 27.5 17.1Sawmills and wood preservation ...................................... 3211 42.1 – – – 28.5 10.2
Sawmills and wood preservation .................................. 32111 42.1 – – – 28.5 10.2Sawmills ................................................................... 321113 43.0 – – – 27.8 11.2Wood preservation ................................................... 321114 34.3 – – – 34.3 –
Veneer, plywood, and engineered wood productmanufacturing ................................................................ 3212 21.7 – – – 11.3 5.6
Veneer, plywood, and engineered wood productmanufacturing ............................................................ 32121 21.7 – – – 11.3 5.6
Hardwood veneer and plywood manufacturing ........ 321211 41.7 – – – 20.4 –Softwood veneer and plywood manufacturing ......... 321212 31.1 – – – 20.3 –
See footnotes at end of table.

TABLE SNR08. Incidence rates1 of nonfatal occupational illness, by industry and category of illness, 2014 — Continued
Industry2 NAICScode3
Incidence rates per 10,000 full-time workers
Totalcases
Skindiseases
ordisorders
Respiratoryconditions Poisonings Hearing loss All other
illnesses
Engineered wood member (except truss)manufacturing ........................................................ 321213 – – – – – –
Truss manufacturing ................................................ 321214 12.0 – – – – –Reconstituted wood product manufacturing ............. 321219 15.4 – – – 12.1 –
Other wood product manufacturing .................................. 3219 59.2 .9 – – – 24.5Millwork ........................................................................ 32191 26.4 – – – 14.5 9.3
Wood window and door manufacturing .................... 321911 35.5 – – – 18.2 14.2Cut stock, resawing lumber, and planing ................. 321912 – – – – – –Other millwork (including flooring) ............................ 321918 20.6 – – – 11.1 6.4
Wood container and pallet manufacturing .................... 32192 – – – – – 5.3All other wood product manufacturing .......................... 32199 – – – – 5.1 –
Manufactured home (mobile home) manufacturing 321991 – – – – – –Prefabricated wood building manufacturing ............. 321992 – – – – – –All other miscellaneous wood productmanufacturing ........................................................ 321999 – – – – – –
Paper manufacturing ............................................................ 322 18.5 .9 – – 11.4 5.9Pulp, paper, and paperboard mills ................................... 3221 26.1 – – – 15.3 9.6
Paper mills ................................................................... 32212 29.6 – – – 17.8 10.9Paper (except newsprint) mills ................................. 322121 32.0 – – – 19.0 12.1Newsprint mills ......................................................... 322122 – – – – – –
Paperboard mills .......................................................... 32213 17.5 – – – 13.3 –Converted paper product manufacturing .......................... 3222 15.5 1.2 – – 9.8 4.5
Paperboard container manufacturing ........................... 32221 17.7 – – – 12.1 5.3Corrugated and solid fiber box manufacturing ......... 322211 14.4 – – – 9.2 5.0Folding paperboard box manufacturing ................... 322212 24.6 – – – 17.0 7.0Other paperboard container manufacturing ............. 322219 22.2 – – – 17.3 –
Paper bag and coated and treated papermanufacturing ............................................................ 32222 14.9 4.1 – – 7.6 2.7
Stationery product manufacturing ................................ 32223 25.0 – – – 14.9 8.6Other converted paper product manufacturing ............ 32229 5.0 – – – – –
Sanitary paper product manufacturing ..................... 322291 7.9 – – – – –All other converted paper product manufacturing .... 322299 – – – – – –
Printing and related support activities .................................. 323 12.4 3.0 1.6 – 4.9 2.9Printing and related support activities .............................. 3231 12.4 3.0 1.6 – 4.9 2.9
Printing ......................................................................... 32311 12.8 3.1 1.7 – 5.0 3.0Commercial printing (except screen and books) ..... 323111 13.1 3.3 1.3 – 5.5 3.0Commercial screen printing ..................................... 323113 12.6 3.4 – – – –Books printing .......................................................... 323117 10.2 – – – – –
Support activities for printing ........................................ 32312 – – – – – –Petroleum and coal products manufacturing ........................ 324 9.2 – – – 3.1 4.7
Petroleum and coal products manufacturing .................... 3241 9.2 – – – 3.1 4.7Petroleum refineries ..................................................... 32411 6.7 – – – 2.9 2.5Asphalt paving, roofing, and saturated materialsmanufacturing ............................................................ 32412 – – – – – –
See footnotes at end of table.
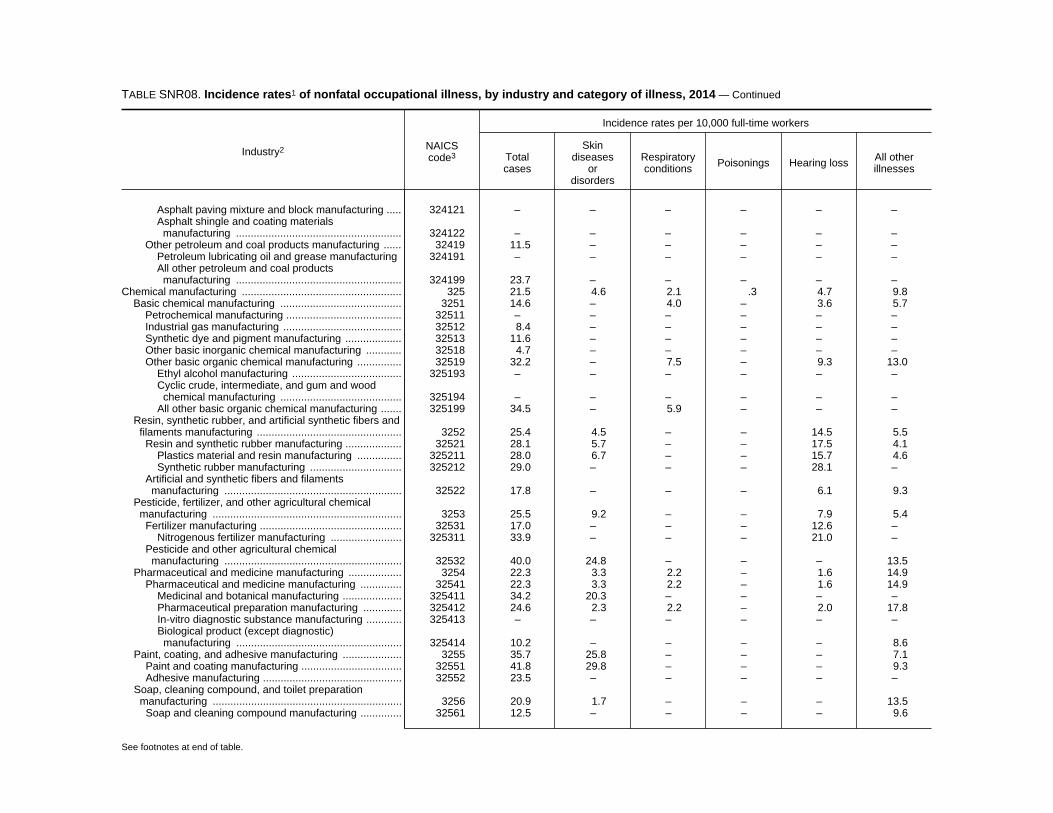
TABLE SNR08. Incidence rates1 of nonfatal occupational illness, by industry and category of illness, 2014 — Continued
Industry2 NAICScode3
Incidence rates per 10,000 full-time workers
Totalcases
Skindiseases
ordisorders
Respiratoryconditions Poisonings Hearing loss All other
illnesses
Asphalt paving mixture and block manufacturing ..... 324121 – – – – – –Asphalt shingle and coating materialsmanufacturing ........................................................ 324122 – – – – – –
Other petroleum and coal products manufacturing ...... 32419 11.5 – – – – –Petroleum lubricating oil and grease manufacturing 324191 – – – – – –All other petroleum and coal productsmanufacturing ........................................................ 324199 23.7 – – – – –
Chemical manufacturing ...................................................... 325 21.5 4.6 2.1 .3 4.7 9.8Basic chemical manufacturing ......................................... 3251 14.6 – 4.0 – 3.6 5.7
Petrochemical manufacturing ....................................... 32511 – – – – – –Industrial gas manufacturing ........................................ 32512 8.4 – – – – –Synthetic dye and pigment manufacturing ................... 32513 11.6 – – – – –Other basic inorganic chemical manufacturing ............ 32518 4.7 – – – – –Other basic organic chemical manufacturing ............... 32519 32.2 – 7.5 – 9.3 13.0
Ethyl alcohol manufacturing ..................................... 325193 – – – – – –Cyclic crude, intermediate, and gum and woodchemical manufacturing ......................................... 325194 – – – – – –
All other basic organic chemical manufacturing ....... 325199 34.5 – 5.9 – – –Resin, synthetic rubber, and artificial synthetic fibers andfilaments manufacturing ................................................. 3252 25.4 4.5 – – 14.5 5.5
Resin and synthetic rubber manufacturing ................... 32521 28.1 5.7 – – 17.5 4.1Plastics material and resin manufacturing ............... 325211 28.0 6.7 – – 15.7 4.6Synthetic rubber manufacturing ............................... 325212 29.0 – – – 28.1 –
Artificial and synthetic fibers and filamentsmanufacturing ............................................................ 32522 17.8 – – – 6.1 9.3
Pesticide, fertilizer, and other agricultural chemicalmanufacturing ................................................................ 3253 25.5 9.2 – – 7.9 5.4
Fertilizer manufacturing ................................................ 32531 17.0 – – – 12.6 –Nitrogenous fertilizer manufacturing ........................ 325311 33.9 – – – 21.0 –
Pesticide and other agricultural chemicalmanufacturing ............................................................ 32532 40.0 24.8 – – – 13.5
Pharmaceutical and medicine manufacturing .................. 3254 22.3 3.3 2.2 – 1.6 14.9Pharmaceutical and medicine manufacturing .............. 32541 22.3 3.3 2.2 – 1.6 14.9
Medicinal and botanical manufacturing .................... 325411 34.2 20.3 – – – –Pharmaceutical preparation manufacturing ............. 325412 24.6 2.3 2.2 – 2.0 17.8In-vitro diagnostic substance manufacturing ............ 325413 – – – – – –Biological product (except diagnostic)manufacturing ........................................................ 325414 10.2 – – – – 8.6
Paint, coating, and adhesive manufacturing .................... 3255 35.7 25.8 – – – 7.1Paint and coating manufacturing .................................. 32551 41.8 29.8 – – – 9.3Adhesive manufacturing ............................................... 32552 23.5 – – – – –
Soap, cleaning compound, and toilet preparationmanufacturing ................................................................ 3256 20.9 1.7 – – – 13.5
Soap and cleaning compound manufacturing .............. 32561 12.5 – – – – 9.6
See footnotes at end of table.

TABLE SNR08. Incidence rates1 of nonfatal occupational illness, by industry and category of illness, 2014 — Continued
Industry2 NAICScode3
Incidence rates per 10,000 full-time workers
Totalcases
Skindiseases
ordisorders
Respiratoryconditions Poisonings Hearing loss All other
illnesses
Soap and other detergent manufacturing ................. 325611 15.4 – – – – 12.8Polish and other sanitation good manufacturing ...... 325612 10.2 – – – – –Surface active agent manufacturing ......................... 325613 – – – – – –
Toilet preparation manufacturing ................................. 32562 29.9 – – – – 17.7Other chemical product and preparation manufacturing .. 3259 16.2 2.9 – – 8.0 3.8
Printing ink manufacturing ............................................ 32591 – – – – – –Explosives manufacturing ............................................ 32592 – – – – – –All other chemical product and preparationmanufacturing ............................................................ 32599 19.6 3.6 – – 9.8 4.4
Custom compounding of purchased resins .............. 325991 – – – – – –Photographic film, paper, plate, and chemicalmanufacturing ........................................................ 325992 16.7 – – – – –
All other miscellaneous chemical product andpreparation manufacturing ..................................... 325998 26.6 – – – 17.7 –
Plastics and rubber products manufacturing ........................ 326 24.4 2.9 1.2 – 10.0 10.2Plastics product manufacturing ........................................ 3261 23.9 2.7 1.2 – 10.0 9.9
Plastics packaging materials and unlaminated film andsheet manufacturing ................................................... 32611 19.8 – – – 7.6 11.6
Plastics bag and pouch manufacturing .................... 326111 36.0 – – – 11.0 23.2Plastics packaging film and sheet (includinglaminated) manufacturing ....................................... 326112 – – – – – –
Unlaminated plastics film and sheet (exceptpackaging) manufacturing ...................................... 326113 15.5 – – – 8.2 –
Plastics pipe, pipe fitting, and unlaminated profileshape manufacturing .................................................. 32612 35.1 3.5 – – 20.1 9.7
Unlaminated plastics profile shape manufacturing ... 326121 40.1 – – – 18.1 14.7Plastics pipe and pipe fitting manufacturing ............. 326122 30.6 – – – – –
Laminated plastics plate, sheet (except packaging),and shape manufacturing ........................................... 32613 48.1 – – – 41.3 –
Polystyrene foam product manufacturing ..................... 32614 24.0 – – – – 7.4Urethane and other foam product (except polystyrene)manufacturing ............................................................ 32615 19.8 – – – 7.5 9.3
Plastics bottle manufacturing ....................................... 32616 18.6 – – – 14.0 –Other plastics product manufacturing .......................... 32619 22.9 3.4 1.5 – 6.8 11.0
Plastics plumbing fixture manufacturing ................... 326191 – – – – – –All other plastics product manufacturing .................. 326199 23.6 3.4 1.6 – 7.0 11.5
Rubber product manufacturing ......................................... 3262 26.3 3.4 – – 10.2 11.6Tire manufacturing ....................................................... 32621 36.8 – – – 18.4 16.1
Tire manufacturing (except retreading) .................... 326211 40.5 – – – 21.0 18.3Tire retreading .......................................................... 326212 – – – – – –
Rubber and plastics hoses and belting manufacturing 32622 12.2 – – – – –Other rubber product manufacturing ............................ 32629 22.3 5.0 – – 4.4 11.1
Rubber product manufacturing for mechanical use 326291 24.2 5.2 – – – 15.6All other rubber product manufacturing .................... 326299 20.1 – – – 9.5 5.9
See footnotes at end of table.
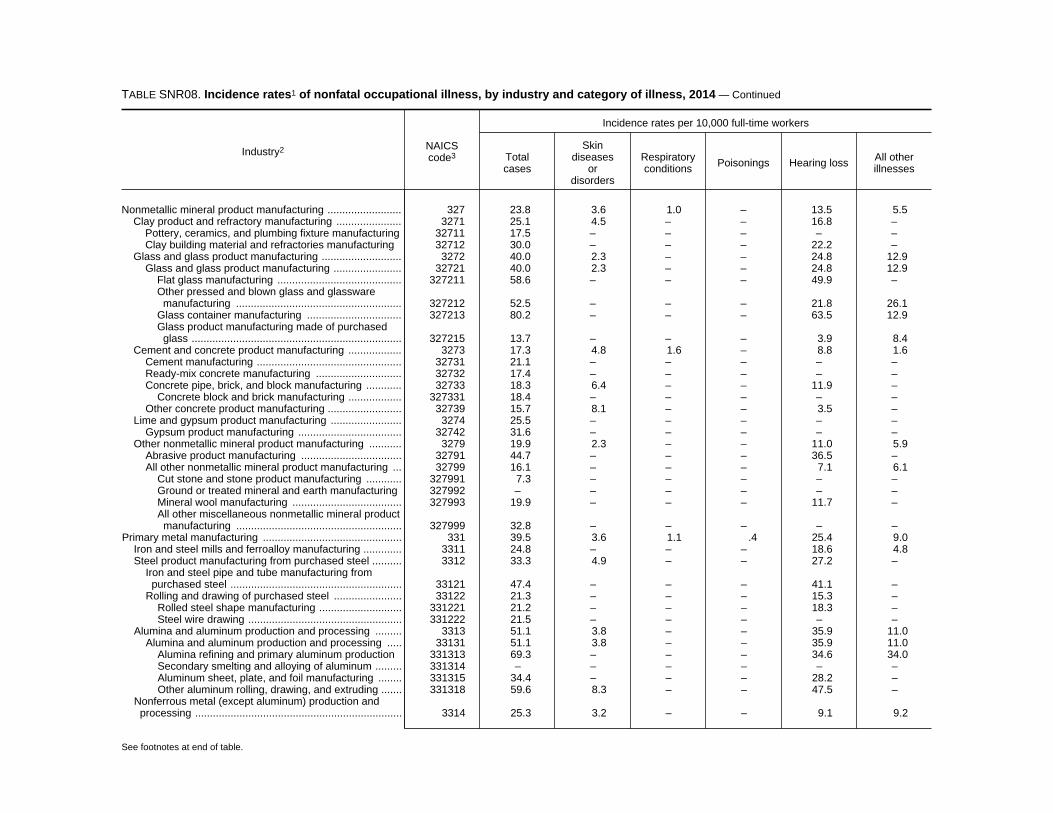
TABLE SNR08. Incidence rates1 of nonfatal occupational illness, by industry and category of illness, 2014 — Continued
Industry2 NAICScode3
Incidence rates per 10,000 full-time workers
Totalcases
Skindiseases
ordisorders
Respiratoryconditions Poisonings Hearing loss All other
illnesses
Nonmetallic mineral product manufacturing ......................... 327 23.8 3.6 1.0 – 13.5 5.5Clay product and refractory manufacturing ...................... 3271 25.1 4.5 – – 16.8 –
Pottery, ceramics, and plumbing fixture manufacturing 32711 17.5 – – – – –Clay building material and refractories manufacturing 32712 30.0 – – – 22.2 –
Glass and glass product manufacturing ........................... 3272 40.0 2.3 – – 24.8 12.9Glass and glass product manufacturing ....................... 32721 40.0 2.3 – – 24.8 12.9
Flat glass manufacturing .......................................... 327211 58.6 – – – 49.9 –Other pressed and blown glass and glasswaremanufacturing ........................................................ 327212 52.5 – – – 21.8 26.1
Glass container manufacturing ................................ 327213 80.2 – – – 63.5 12.9Glass product manufacturing made of purchasedglass ....................................................................... 327215 13.7 – – – 3.9 8.4
Cement and concrete product manufacturing .................. 3273 17.3 4.8 1.6 – 8.8 1.6Cement manufacturing ................................................. 32731 21.1 – – – – –Ready-mix concrete manufacturing ............................. 32732 17.4 – – – – –Concrete pipe, brick, and block manufacturing ............ 32733 18.3 6.4 – – 11.9 –
Concrete block and brick manufacturing .................. 327331 18.4 – – – – –Other concrete product manufacturing ......................... 32739 15.7 8.1 – – 3.5 –
Lime and gypsum product manufacturing ........................ 3274 25.5 – – – – –Gypsum product manufacturing ................................... 32742 31.6 – – – – –
Other nonmetallic mineral product manufacturing ........... 3279 19.9 2.3 – – 11.0 5.9Abrasive product manufacturing .................................. 32791 44.7 – – – 36.5 –All other nonmetallic mineral product manufacturing ... 32799 16.1 – – – 7.1 6.1
Cut stone and stone product manufacturing ............ 327991 7.3 – – – – –Ground or treated mineral and earth manufacturing 327992 – – – – – –Mineral wool manufacturing ..................................... 327993 19.9 – – – 11.7 –All other miscellaneous nonmetallic mineral productmanufacturing ........................................................ 327999 32.8 – – – – –
Primary metal manufacturing ............................................... 331 39.5 3.6 1.1 .4 25.4 9.0Iron and steel mills and ferroalloy manufacturing ............. 3311 24.8 – – – 18.6 4.8Steel product manufacturing from purchased steel .......... 3312 33.3 4.9 – – 27.2 –
Iron and steel pipe and tube manufacturing frompurchased steel .......................................................... 33121 47.4 – – – 41.1 –
Rolling and drawing of purchased steel ....................... 33122 21.3 – – – 15.3 –Rolled steel shape manufacturing ............................ 331221 21.2 – – – 18.3 –Steel wire drawing .................................................... 331222 21.5 – – – – –
Alumina and aluminum production and processing ......... 3313 51.1 3.8 – – 35.9 11.0Alumina and aluminum production and processing ..... 33131 51.1 3.8 – – 35.9 11.0
Alumina refining and primary aluminum production 331313 69.3 – – – 34.6 34.0Secondary smelting and alloying of aluminum ......... 331314 – – – – – –Aluminum sheet, plate, and foil manufacturing ........ 331315 34.4 – – – 28.2 –Other aluminum rolling, drawing, and extruding ....... 331318 59.6 8.3 – – 47.5 –
Nonferrous metal (except aluminum) production andprocessing ...................................................................... 3314 25.3 3.2 – – 9.1 9.2
See footnotes at end of table.

TABLE SNR08. Incidence rates1 of nonfatal occupational illness, by industry and category of illness, 2014 — Continued
Industry2 NAICScode3
Incidence rates per 10,000 full-time workers
Totalcases
Skindiseases
ordisorders
Respiratoryconditions Poisonings Hearing loss All other
illnesses
Copper rolling, drawing, extruding, and alloying .......... 33142 20.1 – – – 12.5 5.5Nonferrous metal (except copper and aluminum)rolling, drawing, extruding, and alloying ..................... 33149 31.0 – – – 6.4 13.0
Nonferrous metal (except copper and aluminum)rolling, drawing, and extruding ............................... 331491 24.0 – – – 11.7 –
Secondary smelting, refining, and alloying ofnonferrous metal (except copper and aluminum) ... 331492 39.3 – – – – 21.6
Foundries ......................................................................... 3315 55.0 5.8 1.8 – 32.6 14.8Ferrous metal foundries ............................................... 33151 55.8 4.2 – – 36.4 14.3
Iron foundries ........................................................... 331511 58.7 4.1 – – 34.9 18.2Steel investment foundries ....................................... 331512 46.6 – – – 35.6 –Steel foundries (except investment) ......................... 331513 54.7 – – – 40.5 –
Nonferrous metal foundries .......................................... 33152 54.1 8.0 3.0 – 27.6 15.5Nonferrous metal die-casting foundries ................... 331523 58.1 11.3 – – 22.9 18.8Aluminum foundries (except die-casting) ................. 331524 40.1 – – – 16.7 17.0Other nonferrous metal foundries (exceptdie-casting) ............................................................. 331529 65.1 – – – 53.1 –
Fabricated metal product manufacturing .............................. 332 26.6 4.7 .7 – 12.6 8.5Forging and stamping ...................................................... 3321 38.4 3.5 – – 29.3 4.8
Forging and stamping .................................................. 33211 38.4 3.5 – – 29.3 4.8Iron and steel forging ............................................... 332111 29.3 – – – 26.2 –Nonferrous forging ................................................... 332112 21.9 – – – – –Custom roll forming .................................................. 332114 – – – – – –Powder metallurgy part manufacturing .................... 332117 41.4 – – – – –Metal crown, closure, and other metal stamping(except automotive) ................................................ 332119 48.8 3.6 – – 38.9 5.0
Cutlery and handtool manufacturing ................................ 3322 46.1 11.4 – – 15.2 19.5Cutlery and handtool manufacturing ............................ 33221 46.1 11.4 – – 15.2 19.5
Metal kitchen cookware, utensil, cutlery, andflatware (except precious) manufacturing .............. 332215 61.8 – – – – 37.5
Saw blade and handtool manufacturing ................... 332216 41.6 11.9 – – 15.4 14.3Architectural and structural metals manufacturing ........... 3323 24.2 1.5 .5 – 11.0 10.9
Plate work and fabricated structural productmanufacturing ............................................................ 33231 25.5 1.7 – – 11.5 12.0
Prefabricated metal building and componentmanufacturing ........................................................ 332311 – – – – – –
Fabricated structural metal manufacturing ............... 332312 20.2 – – – 12.5 6.6Plate work manufacturing ......................................... 332313 48.4 4.0 – – – 28.3
Ornamental and architectural metal productsmanufacturing ............................................................ 33232 23.1 1.4 .8 – 10.4 9.8
Metal window and door manufacturing .................... 332321 40.4 – – – 20.6 16.9Sheet metal work manufacturing .............................. 332322 19.4 1.6 – – 7.0 9.0Ornamental and architectural metal workmanufacturing ........................................................ 332323 6.8 – – – 4.3 –
See footnotes at end of table.
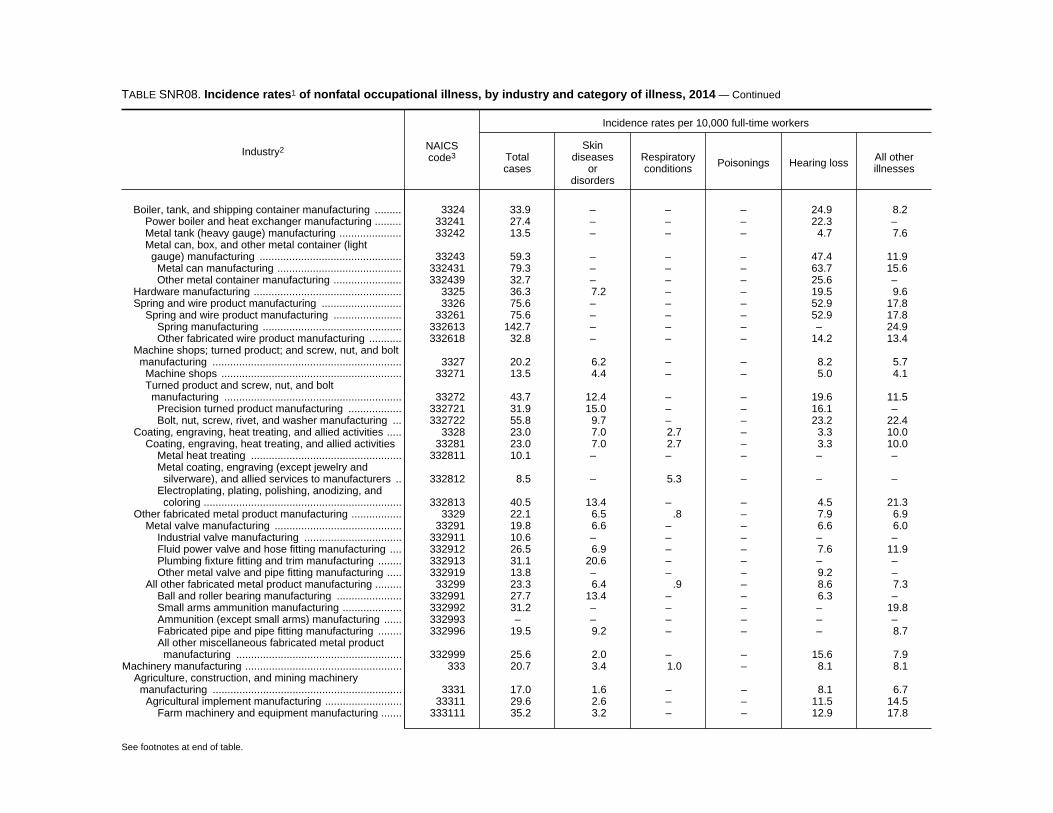
TABLE SNR08. Incidence rates1 of nonfatal occupational illness, by industry and category of illness, 2014 — Continued
Industry2 NAICScode3
Incidence rates per 10,000 full-time workers
Totalcases
Skindiseases
ordisorders
Respiratoryconditions Poisonings Hearing loss All other
illnesses
Boiler, tank, and shipping container manufacturing ......... 3324 33.9 – – – 24.9 8.2Power boiler and heat exchanger manufacturing ......... 33241 27.4 – – – 22.3 –Metal tank (heavy gauge) manufacturing ..................... 33242 13.5 – – – 4.7 7.6Metal can, box, and other metal container (lightgauge) manufacturing ................................................ 33243 59.3 – – – 47.4 11.9
Metal can manufacturing .......................................... 332431 79.3 – – – 63.7 15.6Other metal container manufacturing ....................... 332439 32.7 – – – 25.6 –
Hardware manufacturing .................................................. 3325 36.3 7.2 – – 19.5 9.6Spring and wire product manufacturing ........................... 3326 75.6 – – – 52.9 17.8
Spring and wire product manufacturing ....................... 33261 75.6 – – – 52.9 17.8Spring manufacturing ............................................... 332613 142.7 – – – – 24.9Other fabricated wire product manufacturing ........... 332618 32.8 – – – 14.2 13.4
Machine shops; turned product; and screw, nut, and boltmanufacturing ................................................................ 3327 20.2 6.2 – – 8.2 5.7
Machine shops ............................................................. 33271 13.5 4.4 – – 5.0 4.1Turned product and screw, nut, and boltmanufacturing ............................................................ 33272 43.7 12.4 – – 19.6 11.5
Precision turned product manufacturing .................. 332721 31.9 15.0 – – 16.1 –Bolt, nut, screw, rivet, and washer manufacturing ... 332722 55.8 9.7 – – 23.2 22.4
Coating, engraving, heat treating, and allied activities ..... 3328 23.0 7.0 2.7 – 3.3 10.0Coating, engraving, heat treating, and allied activities 33281 23.0 7.0 2.7 – 3.3 10.0
Metal heat treating ................................................... 332811 10.1 – – – – –Metal coating, engraving (except jewelry andsilverware), and allied services to manufacturers .. 332812 8.5 – 5.3 – – –
Electroplating, plating, polishing, anodizing, andcoloring ................................................................... 332813 40.5 13.4 – – 4.5 21.3
Other fabricated metal product manufacturing ................. 3329 22.1 6.5 .8 – 7.9 6.9Metal valve manufacturing ........................................... 33291 19.8 6.6 – – 6.6 6.0
Industrial valve manufacturing ................................. 332911 10.6 – – – – –Fluid power valve and hose fitting manufacturing .... 332912 26.5 6.9 – – 7.6 11.9Plumbing fixture fitting and trim manufacturing ........ 332913 31.1 20.6 – – – –Other metal valve and pipe fitting manufacturing ..... 332919 13.8 – – – 9.2 –
All other fabricated metal product manufacturing ......... 33299 23.3 6.4 .9 – 8.6 7.3Ball and roller bearing manufacturing ...................... 332991 27.7 13.4 – – 6.3 –Small arms ammunition manufacturing .................... 332992 31.2 – – – – 19.8Ammunition (except small arms) manufacturing ...... 332993 – – – – – –Fabricated pipe and pipe fitting manufacturing ........ 332996 19.5 9.2 – – – 8.7All other miscellaneous fabricated metal productmanufacturing ........................................................ 332999 25.6 2.0 – – 15.6 7.9
Machinery manufacturing ..................................................... 333 20.7 3.4 1.0 – 8.1 8.1Agriculture, construction, and mining machinerymanufacturing ................................................................ 3331 17.0 1.6 – – 8.1 6.7
Agricultural implement manufacturing .......................... 33311 29.6 2.6 – – 11.5 14.5Farm machinery and equipment manufacturing ....... 333111 35.2 3.2 – – 12.9 17.8
See footnotes at end of table.
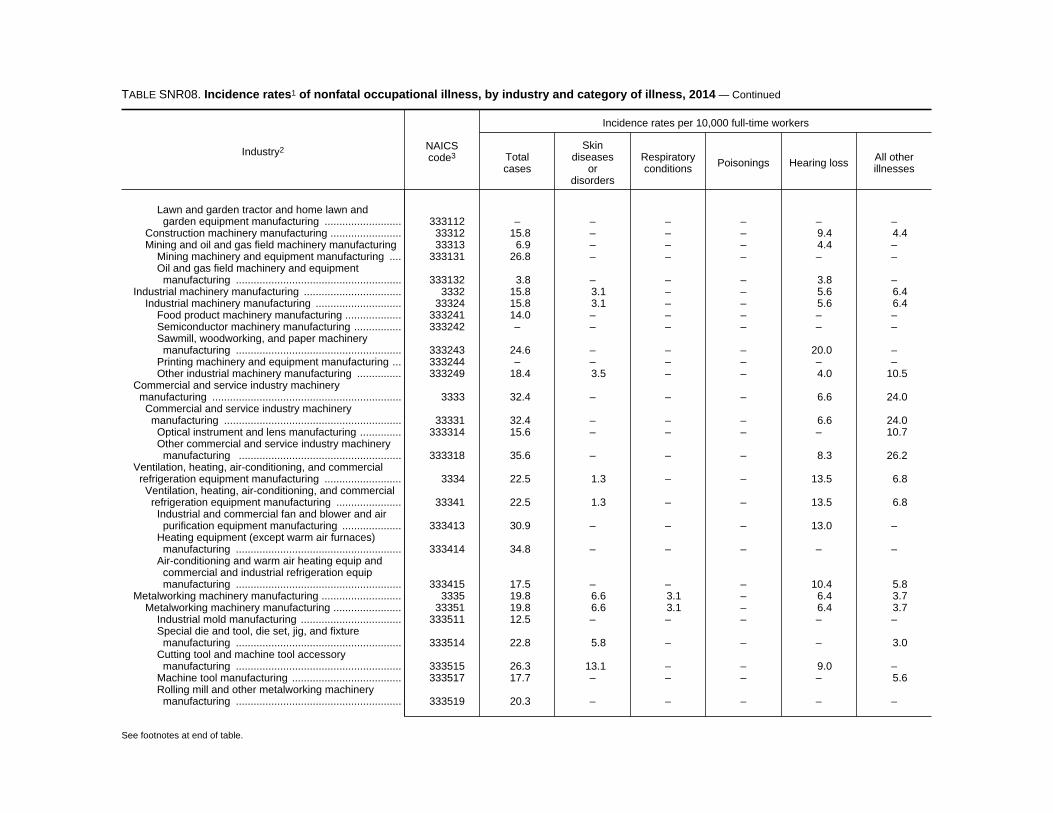
TABLE SNR08. Incidence rates1 of nonfatal occupational illness, by industry and category of illness, 2014 — Continued
Industry2 NAICScode3
Incidence rates per 10,000 full-time workers
Totalcases
Skindiseases
ordisorders
Respiratoryconditions Poisonings Hearing loss All other
illnesses
Lawn and garden tractor and home lawn andgarden equipment manufacturing .......................... 333112 – – – – – –
Construction machinery manufacturing ........................ 33312 15.8 – – – 9.4 4.4Mining and oil and gas field machinery manufacturing 33313 6.9 – – – 4.4 –
Mining machinery and equipment manufacturing .... 333131 26.8 – – – – –Oil and gas field machinery and equipmentmanufacturing ........................................................ 333132 3.8 – – – 3.8 –
Industrial machinery manufacturing ................................. 3332 15.8 3.1 – – 5.6 6.4Industrial machinery manufacturing ............................. 33324 15.8 3.1 – – 5.6 6.4
Food product machinery manufacturing ................... 333241 14.0 – – – – –Semiconductor machinery manufacturing ................ 333242 – – – – – –Sawmill, woodworking, and paper machinerymanufacturing ........................................................ 333243 24.6 – – – 20.0 –
Printing machinery and equipment manufacturing ... 333244 – – – – – –Other industrial machinery manufacturing ............... 333249 18.4 3.5 – – 4.0 10.5
Commercial and service industry machinerymanufacturing ................................................................ 3333 32.4 – – – 6.6 24.0Commercial and service industry machinerymanufacturing ............................................................ 33331 32.4 – – – 6.6 24.0Optical instrument and lens manufacturing .............. 333314 15.6 – – – – 10.7Other commercial and service industry machinerymanufacturing ....................................................... 333318 35.6 – – – 8.3 26.2
Ventilation, heating, air-conditioning, and commercialrefrigeration equipment manufacturing .......................... 3334 22.5 1.3 – – 13.5 6.8Ventilation, heating, air-conditioning, and commercialrefrigeration equipment manufacturing ...................... 33341 22.5 1.3 – – 13.5 6.8Industrial and commercial fan and blower and airpurification equipment manufacturing .................... 333413 30.9 – – – 13.0 –
Heating equipment (except warm air furnaces)manufacturing ........................................................ 333414 34.8 – – – – –
Air-conditioning and warm air heating equip andcommercial and industrial refrigeration equipmanufacturing ........................................................ 333415 17.5 – – – 10.4 5.8
Metalworking machinery manufacturing ........................... 3335 19.8 6.6 3.1 – 6.4 3.7Metalworking machinery manufacturing ....................... 33351 19.8 6.6 3.1 – 6.4 3.7
Industrial mold manufacturing .................................. 333511 12.5 – – – – –Special die and tool, die set, jig, and fixturemanufacturing ........................................................ 333514 22.8 5.8 – – – 3.0
Cutting tool and machine tool accessorymanufacturing ........................................................ 333515 26.3 13.1 – – 9.0 –
Machine tool manufacturing ..................................... 333517 17.7 – – – – 5.6Rolling mill and other metalworking machinerymanufacturing ........................................................ 333519 20.3 – – – – –
See footnotes at end of table.

TABLE SNR08. Incidence rates1 of nonfatal occupational illness, by industry and category of illness, 2014 — Continued
Industry2 NAICScode3
Incidence rates per 10,000 full-time workers
Totalcases
Skindiseases
ordisorders
Respiratoryconditions Poisonings Hearing loss All other
illnesses
Engine, turbine, and power transmission equipmentmanufacturing ................................................................ 3336 32.4 7.6 1.9 – 9.1 13.2Engine, turbine, and power transmission equipmentmanufacturing ............................................................ 33361 32.4 7.6 1.9 – 9.1 13.2Turbine and turbine generator set unitsmanufacturing ........................................................ 333611 26.8 14.4 – – – –
Speed changer, industrial high-speed drive, andgear manufacturing ................................................ 333612 51.2 – – – – 41.0
Mechanical power transmission equipmentmanufacturing ........................................................ 333613 22.5 – – – – –
Other engine equipment manufacturing ................... 333618 33.2 – – – 17.4 10.9Other general purpose machinery manufacturing ............ 3339 17.9 3.0 – – 7.8 6.9
Pump and compressor manufacturing ......................... 33391 16.4 2.8 – – 6.0 7.2Pump and pumping equipment manufacturing ........ 333911 20.7 – – – 5.6 –Air and gas compressor manufacturing ................... 333912 6.8 – – – – –Measuring and dispensing pump manufacturing ..... 333913 – – – – – –
Material handling equipment manufacturing ................ 33392 27.7 2.4 – – 15.2 9.8Elevator and moving stairway manufacturing .......... 333921 – – – – – –Conveyor and conveying equipment manufacturing 333922 17.3 – – – 12.7 –Overhead traveling crane, hoist, and monorailsystem manufacturing ............................................ 333923 25.1 – – – – 16.1
Industrial truck, tractor, trailer, and stackermachinery manufacturing ....................................... 333924 50.1 – – – 30.8 15.9
All other general purpose machinery manufacturing .... 33399 13.0 3.4 – – 4.3 5.1Power-driven handtool manufacturing ..................... 333991 20.8 – – – – –Welding and soldering equipment manufacturing .... 333992 15.8 – – – – 11.1Packaging machinery manufacturing ....................... 333993 – – – – – –Industrial process furnace and oven manufacturing 333994 – – – – – –Fluid power cylinder and actuator manufacturing .... 333995 25.9 10.6 – – 9.6 –Fluid power pump and motor manufacturing ............ 333996 21.8 9.7 – – – –All other miscellaneous general purpose machinerymanufacturing ........................................................ 333999 7.9 – – – – –
Computer and electronic product manufacturing ................. 334 16.8 2.5 .4 – 2.1 11.9Computer and peripheral equipment manufacturing ........ 3341 5.4 – – – – 4.7
Computer and peripheral equipment manufacturing .... 33411 5.4 – – – – 4.7Electronic computer manufacturing .......................... 334111 4.0 – – – – 3.2Computer storage device manufacturing ................. 334112 9.5 – – – – 9.0Computer terminal and other computer peripheralequipment manufacturing ...................................... 334118 6.4 – – – – 6.0
Communications equipment manufacturing ..................... 3342 4.9 – – – – 4.9Telephone apparatus manufacturing ........................... 33421 – – – – – –Radio and television broadcasting and wirelesscommunications equipment manufacturing ................ 33422 – – – – – –
Other communications equipment manufacturing ........ 33429 – – – – – –
See footnotes at end of table.
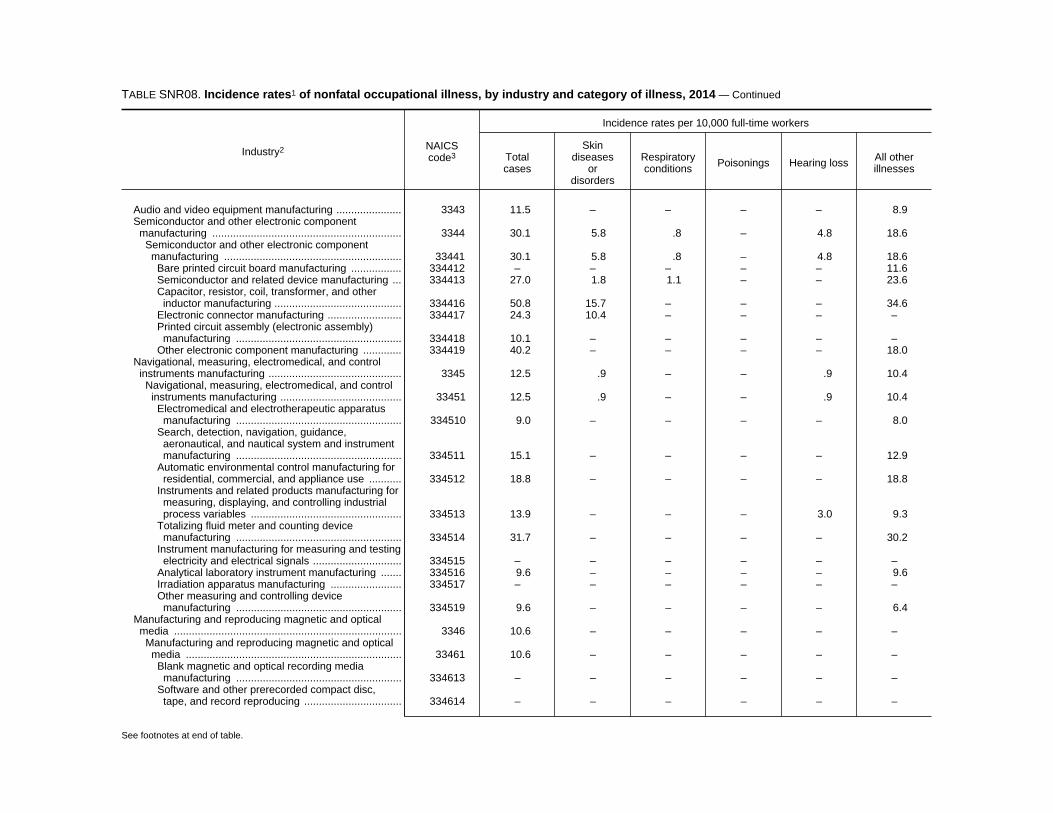
TABLE SNR08. Incidence rates1 of nonfatal occupational illness, by industry and category of illness, 2014 — Continued
Industry2 NAICScode3
Incidence rates per 10,000 full-time workers
Totalcases
Skindiseases
ordisorders
Respiratoryconditions Poisonings Hearing loss All other
illnesses
Audio and video equipment manufacturing ...................... 3343 11.5 – – – – 8.9Semiconductor and other electronic componentmanufacturing ................................................................ 3344 30.1 5.8 .8 – 4.8 18.6
Semiconductor and other electronic componentmanufacturing ............................................................ 33441 30.1 5.8 .8 – 4.8 18.6
Bare printed circuit board manufacturing ................. 334412 – – – – – 11.6Semiconductor and related device manufacturing ... 334413 27.0 1.8 1.1 – – 23.6Capacitor, resistor, coil, transformer, and otherinductor manufacturing ........................................... 334416 50.8 15.7 – – – 34.6
Electronic connector manufacturing ......................... 334417 24.3 10.4 – – – –Printed circuit assembly (electronic assembly)manufacturing ........................................................ 334418 10.1 – – – – –
Other electronic component manufacturing ............. 334419 40.2 – – – – 18.0Navigational, measuring, electromedical, and controlinstruments manufacturing ............................................. 3345 12.5 .9 – – .9 10.4
Navigational, measuring, electromedical, and controlinstruments manufacturing ......................................... 33451 12.5 .9 – – .9 10.4
Electromedical and electrotherapeutic apparatusmanufacturing ........................................................ 334510 9.0 – – – – 8.0
Search, detection, navigation, guidance,aeronautical, and nautical system and instrumentmanufacturing ........................................................ 334511 15.1 – – – – 12.9
Automatic environmental control manufacturing forresidential, commercial, and appliance use ........... 334512 18.8 – – – – 18.8
Instruments and related products manufacturing formeasuring, displaying, and controlling industrialprocess variables ................................................... 334513 13.9 – – – 3.0 9.3
Totalizing fluid meter and counting devicemanufacturing ........................................................ 334514 31.7 – – – – 30.2
Instrument manufacturing for measuring and testingelectricity and electrical signals .............................. 334515 – – – – – –
Analytical laboratory instrument manufacturing ....... 334516 9.6 – – – – 9.6Irradiation apparatus manufacturing ........................ 334517 – – – – – –Other measuring and controlling devicemanufacturing ........................................................ 334519 9.6 – – – – 6.4
Manufacturing and reproducing magnetic and opticalmedia ............................................................................. 3346 10.6 – – – – –
Manufacturing and reproducing magnetic and opticalmedia ......................................................................... 33461 10.6 – – – – –
Blank magnetic and optical recording mediamanufacturing ........................................................ 334613 – – – – – –
Software and other prerecorded compact disc,tape, and record reproducing ................................. 334614 – – – – – –
See footnotes at end of table.
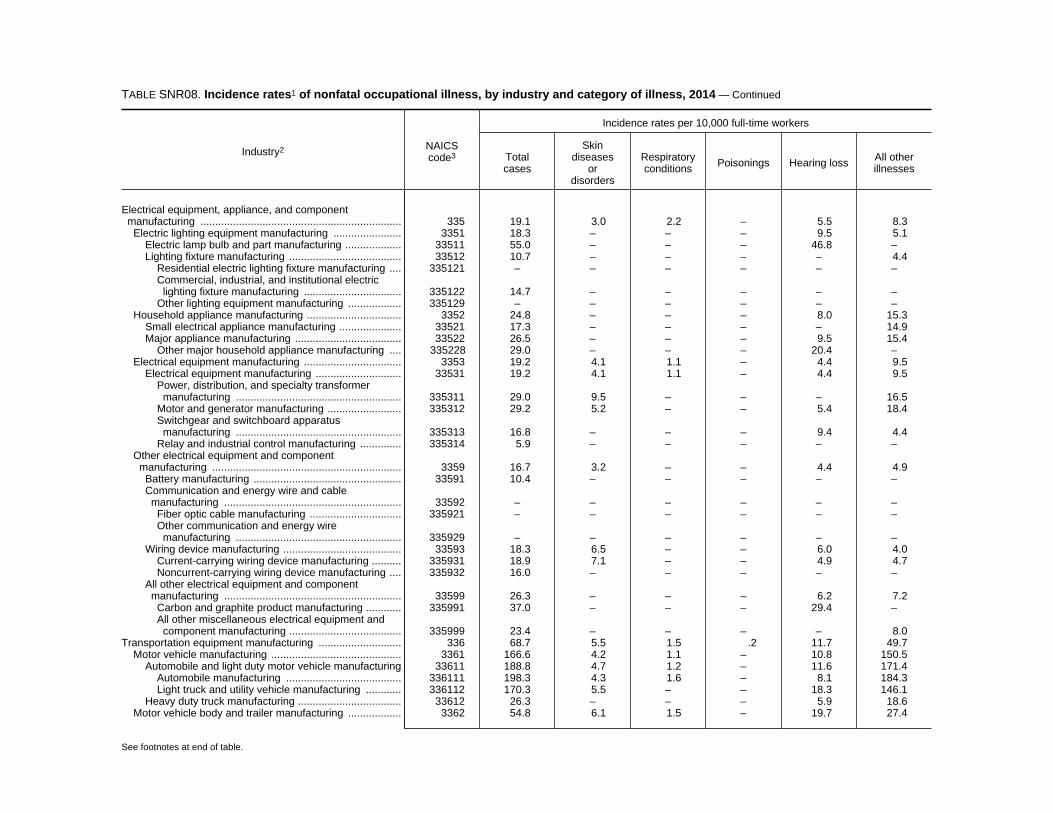
TABLE SNR08. Incidence rates1 of nonfatal occupational illness, by industry and category of illness, 2014 — Continued
Industry2 NAICScode3
Incidence rates per 10,000 full-time workers
Totalcases
Skindiseases
ordisorders
Respiratoryconditions Poisonings Hearing loss All other
illnesses
Electrical equipment, appliance, and componentmanufacturing .................................................................... 335 19.1 3.0 2.2 – 5.5 8.3Electric lighting equipment manufacturing ....................... 3351 18.3 – – – 9.5 5.1
Electric lamp bulb and part manufacturing ................... 33511 55.0 – – – 46.8 –Lighting fixture manufacturing ...................................... 33512 10.7 – – – – 4.4
Residential electric lighting fixture manufacturing .... 335121 – – – – – –Commercial, industrial, and institutional electriclighting fixture manufacturing ................................. 335122 14.7 – – – – –
Other lighting equipment manufacturing .................. 335129 – – – – – –Household appliance manufacturing ................................ 3352 24.8 – – – 8.0 15.3
Small electrical appliance manufacturing ..................... 33521 17.3 – – – – 14.9Major appliance manufacturing .................................... 33522 26.5 – – – 9.5 15.4
Other major household appliance manufacturing .... 335228 29.0 – – – 20.4 –Electrical equipment manufacturing ................................. 3353 19.2 4.1 1.1 – 4.4 9.5
Electrical equipment manufacturing ............................. 33531 19.2 4.1 1.1 – 4.4 9.5Power, distribution, and specialty transformermanufacturing ........................................................ 335311 29.0 9.5 – – – 16.5
Motor and generator manufacturing ......................... 335312 29.2 5.2 – – 5.4 18.4Switchgear and switchboard apparatusmanufacturing ........................................................ 335313 16.8 – – – 9.4 4.4
Relay and industrial control manufacturing .............. 335314 5.9 – – – – –Other electrical equipment and componentmanufacturing ................................................................ 3359 16.7 3.2 – – 4.4 4.9Battery manufacturing .................................................. 33591 10.4 – – – – –Communication and energy wire and cablemanufacturing ............................................................ 33592 – – – – – –Fiber optic cable manufacturing ............................... 335921 – – – – – –Other communication and energy wiremanufacturing ........................................................ 335929 – – – – – –
Wiring device manufacturing ........................................ 33593 18.3 6.5 – – 6.0 4.0Current-carrying wiring device manufacturing .......... 335931 18.9 7.1 – – 4.9 4.7Noncurrent-carrying wiring device manufacturing .... 335932 16.0 – – – – –
All other electrical equipment and componentmanufacturing ............................................................ 33599 26.3 – – – 6.2 7.2Carbon and graphite product manufacturing ............ 335991 37.0 – – – 29.4 –All other miscellaneous electrical equipment andcomponent manufacturing ...................................... 335999 23.4 – – – – 8.0
Transportation equipment manufacturing ............................ 336 68.7 5.5 1.5 .2 11.7 49.7Motor vehicle manufacturing ............................................ 3361 166.6 4.2 1.1 – 10.8 150.5
Automobile and light duty motor vehicle manufacturing 33611 188.8 4.7 1.2 – 11.6 171.4Automobile manufacturing ....................................... 336111 198.3 4.3 1.6 – 8.1 184.3Light truck and utility vehicle manufacturing ............ 336112 170.3 5.5 – – 18.3 146.1
Heavy duty truck manufacturing ................................... 33612 26.3 – – – 5.9 18.6Motor vehicle body and trailer manufacturing .................. 3362 54.8 6.1 1.5 – 19.7 27.4
See footnotes at end of table.

TABLE SNR08. Incidence rates1 of nonfatal occupational illness, by industry and category of illness, 2014 — Continued
Industry2 NAICScode3
Incidence rates per 10,000 full-time workers
Totalcases
Skindiseases
ordisorders
Respiratoryconditions Poisonings Hearing loss All other
illnesses
Motor vehicle body and trailer manufacturing .............. 33621 54.8 6.1 1.5 – 19.7 27.4Motor vehicle body manufacturing ........................... 336211 28.1 7.7 – – 9.1 11.0Truck trailer manufacturing ...................................... 336212 49.5 – – – 31.8 11.9Travel trailer and camper manufacturing ................. 336214 26.2 6.7 – – 6.2 10.5
Motor vehicle parts manufacturing ................................... 3363 52.8 6.0 1.9 – 13.1 31.6Motor vehicle gasoline engine and engine partsmanufacturing ............................................................ 33631 70.5 8.7 5.2 – 13.6 42.6
Motor vehicle electrical and electronic equipmentmanufacturing ............................................................ 33632 45.0 3.3 – – 2.9 36.4
Motor vehicle steering and suspension components(except spring) manufacturing .................................... 33633 55.6 12.5 – – 9.3 32.2
Motor vehicle brake system manufacturing .................. 33634 30.7 – – – 12.7 11.5Motor vehicle transmission and power train partsmanufacturing ............................................................ 33635 46.6 5.7 – – 8.5 31.6
Motor vehicle seating and interior trim manufacturing 33636 41.3 3.8 – – 4.8 31.8Motor vehicle metal stamping ...................................... 33637 93.6 6.9 2.1 – 34.5 49.6Other motor vehicle parts manufacturing ..................... 33639 36.5 4.9 1.9 – 11.5 18.2
Aerospace product and parts manufacturing ................... 3364 61.0 5.4 .8 .4 6.9 47.6Aerospace product and parts manufacturing ............... 33641 61.0 5.4 .8 .4 6.9 47.6
Aircraft engine and engine parts manufacturing ...... 336412 25.0 4.6 – – 4.0 15.8Other aircraft parts and auxiliary equipmentmanufacturing ........................................................ 336413 29.8 13.0 – – 5.1 11.1
Guided missile and space vehicle manufacturing .... 336414 6.8 – – – – 5.6Guided missile and space vehicle propulsion unitand propulsion unit parts manufacturing ................ 336415 – – – – – –
Railroad rolling stock manufacturing ................................ 3365 27.8 – – – 18.0 6.2Ship and boat building ...................................................... 3366 61.4 7.2 3.6 – 18.0 32.0
Ship and boat building .................................................. 33661 61.4 7.2 3.6 – 18.0 32.0Ship building and repairing ....................................... 336611 60.3 3.9 4.6 – 18.6 33.2Boat building ............................................................ 336612 65.0 18.4 – – 16.1 27.9
Other transportation equipment manufacturing ................ 3369 14.7 – – – – 10.1Other transportation equipment manufacturing ............ 33699 14.7 – – – – 10.1
Motorcycle, bicycle, and parts manufacturing .......... 336991 – – – – – –Military armored vehicle, tank, and tank componentmanufacturing ........................................................ 336992 – – – – – –
All other transportation equipment manufacturing ... 336999 18.6 – – – – 14.6Furniture and related product manufacturing ....................... 337 27.2 1.7 .6 – 11.2 13.8
Household and institutional furniture and kitchen cabinetmanufacturing ................................................................ 3371 20.7 2.2 – – 9.6 8.2
Wood kitchen cabinet and countertop manufacturing .. 33711 21.7 2.9 – – 8.2 9.9Household and institutional furniture manufacturing .... 33712 19.9 1.7 – – 10.7 6.9
Upholstered household furniture manufacturing ...... 337121 25.7 – – – 14.6 8.4Nonupholstered wood household furnituremanufacturing ........................................................ 337122 14.1 – – – 8.2 –
See footnotes at end of table.
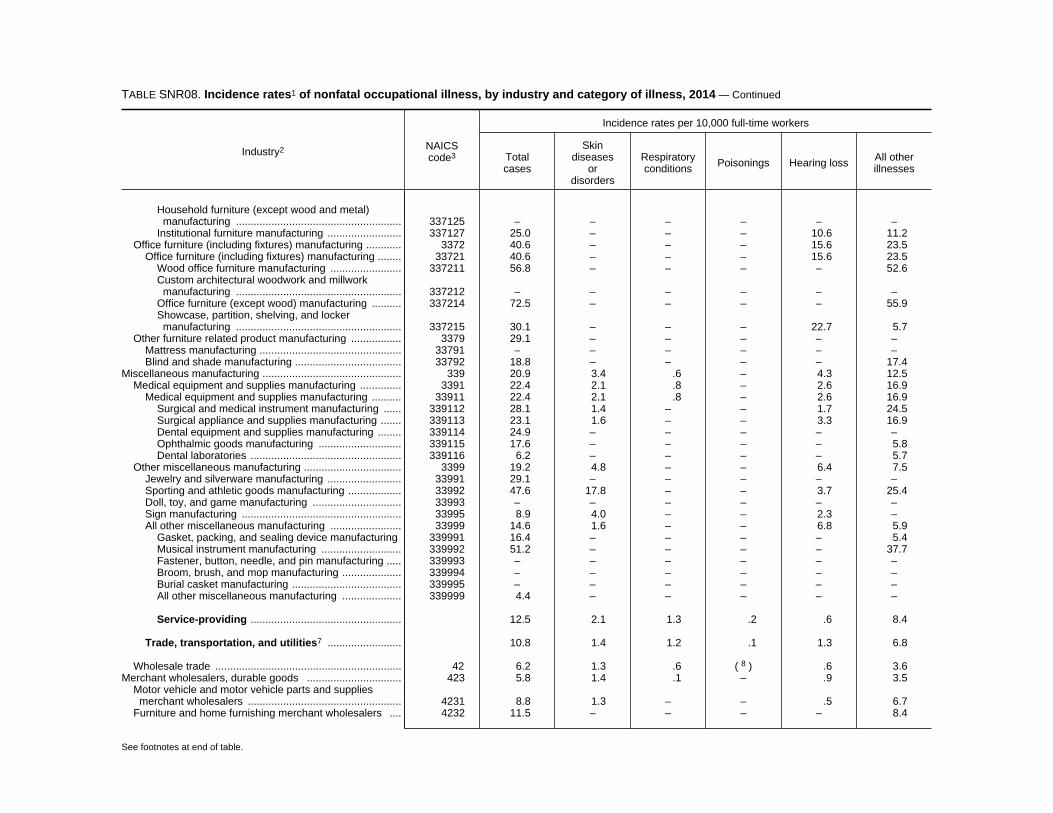
TABLE SNR08. Incidence rates1 of nonfatal occupational illness, by industry and category of illness, 2014 — Continued
Industry2 NAICScode3
Incidence rates per 10,000 full-time workers
Totalcases
Skindiseases
ordisorders
Respiratoryconditions Poisonings Hearing loss All other
illnesses
Household furniture (except wood and metal)manufacturing ........................................................ 337125 – – – – – –
Institutional furniture manufacturing ......................... 337127 25.0 – – – 10.6 11.2Office furniture (including fixtures) manufacturing ............ 3372 40.6 – – – 15.6 23.5
Office furniture (including fixtures) manufacturing ........ 33721 40.6 – – – 15.6 23.5Wood office furniture manufacturing ........................ 337211 56.8 – – – – 52.6Custom architectural woodwork and millworkmanufacturing ........................................................ 337212 – – – – – –
Office furniture (except wood) manufacturing .......... 337214 72.5 – – – – 55.9Showcase, partition, shelving, and lockermanufacturing ........................................................ 337215 30.1 – – – 22.7 5.7
Other furniture related product manufacturing ................. 3379 29.1 – – – – –Mattress manufacturing ................................................ 33791 – – – – – –Blind and shade manufacturing .................................... 33792 18.8 – – – – 17.4
Miscellaneous manufacturing ............................................... 339 20.9 3.4 .6 – 4.3 12.5Medical equipment and supplies manufacturing .............. 3391 22.4 2.1 .8 – 2.6 16.9
Medical equipment and supplies manufacturing .......... 33911 22.4 2.1 .8 – 2.6 16.9Surgical and medical instrument manufacturing ...... 339112 28.1 1.4 – – 1.7 24.5Surgical appliance and supplies manufacturing ....... 339113 23.1 1.6 – – 3.3 16.9Dental equipment and supplies manufacturing ........ 339114 24.9 – – – – –Ophthalmic goods manufacturing ............................ 339115 17.6 – – – – 5.8Dental laboratories ................................................... 339116 6.2 – – – – 5.7
Other miscellaneous manufacturing ................................. 3399 19.2 4.8 – – 6.4 7.5Jewelry and silverware manufacturing ......................... 33991 29.1 – – – – –Sporting and athletic goods manufacturing .................. 33992 47.6 17.8 – – 3.7 25.4Doll, toy, and game manufacturing .............................. 33993 – – – – – –Sign manufacturing ...................................................... 33995 8.9 4.0 – – 2.3 –All other miscellaneous manufacturing ........................ 33999 14.6 1.6 – – 6.8 5.9
Gasket, packing, and sealing device manufacturing 339991 16.4 – – – – 5.4Musical instrument manufacturing ........................... 339992 51.2 – – – – 37.7Fastener, button, needle, and pin manufacturing ..... 339993 – – – – – –Broom, brush, and mop manufacturing .................... 339994 – – – – – –Burial casket manufacturing ..................................... 339995 – – – – – –All other miscellaneous manufacturing .................... 339999 4.4 – – – – –
Service-providing ................................................... 12.5 2.1 1.3 .2 .6 8.4
Trade, transportation, and utilities7 ......................... 10.8 1.4 1.2 .1 1.3 6.8
Wholesale trade ............................................................... 42 6.2 1.3 .6 8( ) .6 3.6Merchant wholesalers, durable goods ................................ 423 5.8 1.4 .1 – .9 3.5
Motor vehicle and motor vehicle parts and suppliesmerchant wholesalers .................................................... 4231 8.8 1.3 – – .5 6.7
Furniture and home furnishing merchant wholesalers .... 4232 11.5 – – – – 8.4
See footnotes at end of table.
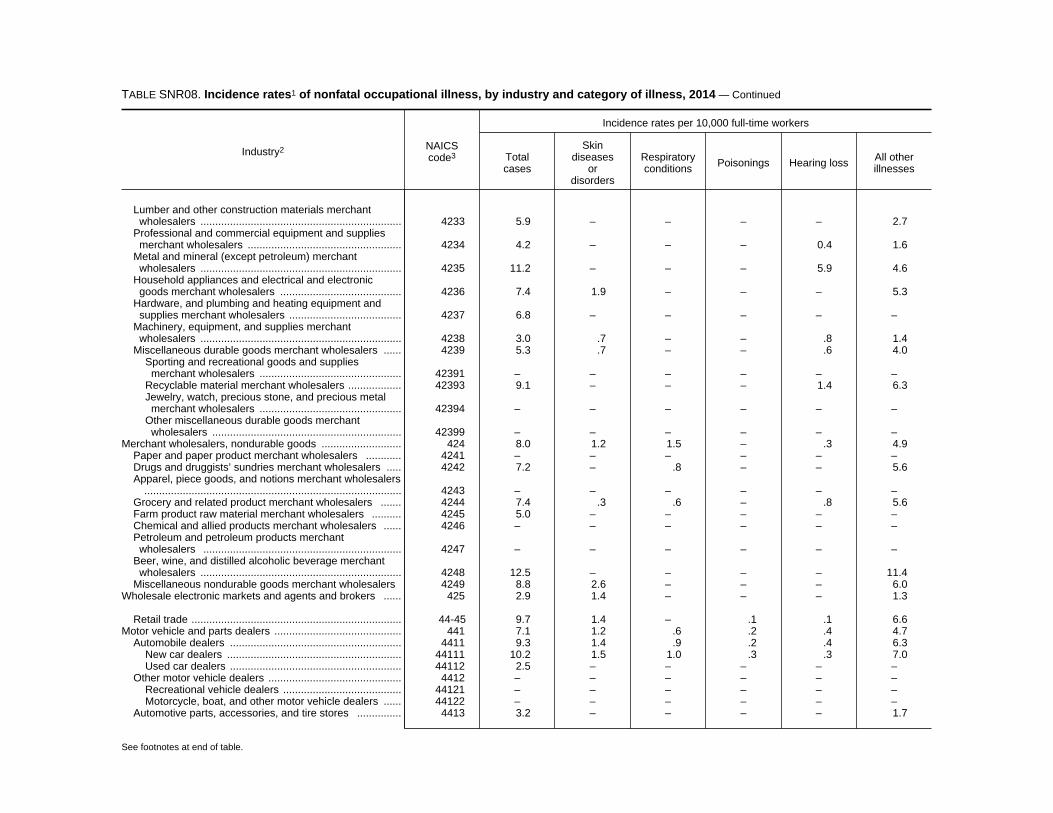
TABLE SNR08. Incidence rates1 of nonfatal occupational illness, by industry and category of illness, 2014 — Continued
Industry2 NAICScode3
Incidence rates per 10,000 full-time workers
Totalcases
Skindiseases
ordisorders
Respiratoryconditions Poisonings Hearing loss All other
illnesses
Lumber and other construction materials merchantwholesalers .................................................................... 4233 5.9 – – – – 2.7
Professional and commercial equipment and suppliesmerchant wholesalers .................................................... 4234 4.2 – – – 0.4 1.6
Metal and mineral (except petroleum) merchantwholesalers .................................................................... 4235 11.2 – – – 5.9 4.6
Household appliances and electrical and electronicgoods merchant wholesalers ......................................... 4236 7.4 1.9 – – – 5.3
Hardware, and plumbing and heating equipment andsupplies merchant wholesalers ...................................... 4237 6.8 – – – – –
Machinery, equipment, and supplies merchantwholesalers .................................................................... 4238 3.0 .7 – – .8 1.4
Miscellaneous durable goods merchant wholesalers ...... 4239 5.3 .7 – – .6 4.0Sporting and recreational goods and suppliesmerchant wholesalers ................................................ 42391 – – – – – –
Recyclable material merchant wholesalers .................. 42393 9.1 – – – 1.4 6.3Jewelry, watch, precious stone, and precious metalmerchant wholesalers ................................................ 42394 – – – – – –
Other miscellaneous durable goods merchantwholesalers ................................................................ 42399 – – – – – –
Merchant wholesalers, nondurable goods ........................... 424 8.0 1.2 1.5 – .3 4.9Paper and paper product merchant wholesalers ............ 4241 – – – – – –Drugs and druggists’ sundries merchant wholesalers ..... 4242 7.2 – .8 – – 5.6Apparel, piece goods, and notions merchant wholesalers
....................................................................................... 4243 – – – – – –Grocery and related product merchant wholesalers ....... 4244 7.4 .3 .6 – .8 5.6Farm product raw material merchant wholesalers .......... 4245 5.0 – – – – –Chemical and allied products merchant wholesalers ...... 4246 – – – – – –Petroleum and petroleum products merchantwholesalers ................................................................... 4247 – – – – – –
Beer, wine, and distilled alcoholic beverage merchantwholesalers .................................................................... 4248 12.5 – – – – 11.4
Miscellaneous nondurable goods merchant wholesalers 4249 8.8 2.6 – – – 6.0Wholesale electronic markets and agents and brokers ...... 425 2.9 1.4 – – – 1.3
Retail trade ....................................................................... 44-45 9.7 1.4 – .1 .1 6.6Motor vehicle and parts dealers ........................................... 441 7.1 1.2 .6 .2 .4 4.7
Automobile dealers .......................................................... 4411 9.3 1.4 .9 .2 .4 6.3New car dealers ........................................................... 44111 10.2 1.5 1.0 .3 .3 7.0Used car dealers .......................................................... 44112 2.5 – – – – –
Other motor vehicle dealers ............................................. 4412 – – – – – –Recreational vehicle dealers ........................................ 44121 – – – – – –Motorcycle, boat, and other motor vehicle dealers ...... 44122 – – – – – –
Automotive parts, accessories, and tire stores ............... 4413 3.2 – – – – 1.7
See footnotes at end of table.

TABLE SNR08. Incidence rates1 of nonfatal occupational illness, by industry and category of illness, 2014 — Continued
Industry2 NAICScode3
Incidence rates per 10,000 full-time workers
Totalcases
Skindiseases
ordisorders
Respiratoryconditions Poisonings Hearing loss All other
illnesses
Automotive parts and accessories stores .................... 44131 1.7 – – – – 1.7Tire dealers .................................................................. 44132 5.8 – – – – –
Furniture and home furnishings stores ................................. 442 – 1.3 – – – 2.5Furniture stores ................................................................ 4421 3.2 – – – – 2.1Home furnishings stores .................................................. 4422 – – – – – 3.0
Floor covering stores .................................................... 44221 6.1 – – – – –Other home furnishings stores ..................................... 44229 – – – – – 3.4
Electronics and appliance stores ......................................... 443 3.2 – – – – 3.0Electronics and appliance stores ..................................... 4431 3.2 – – – – 3.0
Electronics and appliance stores ................................. 44314 3.2 – – – – 3.0Household appliance stores ..................................... 443141 – – – – – –Electronics stores ..................................................... 443142 3.1 – – – – 2.9
Building material and garden equipment and suppliesdealers ............................................................................... 444 7.9 2.6 .9 – – 4.1
Building material and supplies dealers ............................ 4441 7.3 2.6 1.0 – – 3.3Home centers ............................................................... 44411 5.1 2.0 .8 – – 2.1Other building material dealers .................................... 44419 11.1 – – – – 3.1
Lawn and garden equipment and supplies stores ............ 4442 13.2 2.1 – – – 10.8Outdoor power equipment stores ................................. 44421 – – – – – –Nursery, garden center, and farm supply stores .......... 44422 16.5 2.4 – – – 13.8
Food and beverage stores ................................................... 445 8.6 1.1 1.2 – – 6.3Grocery stores .................................................................. 4451 7.9 1.1 .6 – – 6.3
Supermarkets and other grocery (exceptconvenience) stores ................................................... 44511 8.4 1.1 .6 – – 6.7
Convenience stores ..................................................... 44512 – – – – – –Specialty food stores ........................................................ 4452 5.8 – – – – –
Fruit and vegetable markets ......................................... 44523 – – – – – –Other specialty food stores .......................................... 44529 – – – – – –
Health and personal care stores .......................................... 446 3.5 – – – – 2.0Health and personal care stores ...................................... 4461 3.5 – – – – 2.0
Pharmacies and drug stores ........................................ 44611 4.4 – – – – 2.3Cosmetics, beauty supplies, and perfume stores ........ 44612 2.8 – – – – 2.8Other health and personal care stores ......................... 44619 – – – – – –
Gasoline stations .................................................................. 447 1.3 – – – – 1.0Gasoline stations .............................................................. 4471 1.3 – – – – 1.0
Gasoline stations with convenience stores .................. 44711 1.1 – – – – .8Other gasoline stations ................................................ 44719 2.6 – – – – 2.3
Clothing and clothing accessories stores ............................. 448 5.7 – – – – 4.8Clothing stores ................................................................. 4481 7.5 – – – – 6.4
Women’s clothing stores .............................................. 44812 – – – – – –Children’s and infants’ clothing stores .......................... 44813 – – – – – –Family clothing stores .................................................. 44814 5.1 – – – – 4.1Clothing accessories stores ......................................... 44815 28.2 – – – – 17.5Other clothing stores .................................................... 44819 – – – – – –
See footnotes at end of table.

TABLE SNR08. Incidence rates1 of nonfatal occupational illness, by industry and category of illness, 2014 — Continued
Industry2 NAICScode3
Incidence rates per 10,000 full-time workers
Totalcases
Skindiseases
ordisorders
Respiratoryconditions Poisonings Hearing loss All other
illnesses
Shoe stores ...................................................................... 4482 – – – – – –Jewelry, luggage, and leather goods stores .................... 4483 – – – – – –
Jewelry stores .............................................................. 44831 – – – – – –Luggage and leather goods stores ............................... 44832 – – – – – –
Sporting goods, hobby, book, and music stores .................. 451 1.2 – – – – .7Sporting goods, hobby, and musical instrument stores .. 4511 1.2 – – – – .8
Sporting goods stores .................................................. 45111 1.6 – – – – –Hobby, toy, and game stores ....................................... 45112 – – – – – –Sewing, needlework, and piece goods stores .............. 45113 – – – – – –Musical instrument and supplies stores ....................... 45114 – – – – – –
Book stores and news dealers ........................................ 4512 – – – – – –Book stores and news dealers ..................................... 45121 – – – – – –
Book stores .............................................................. 451211 – – – – – –General merchandise stores ................................................ 452 21.1 2.5 2.2 .2 – 16.2
Department stores ............................................................ 4521 14.7 1.9 1.6 – – 11.2Other general merchandise stores ................................... 4529 25.2 2.9 2.6 .3 – 19.4
Warehouse clubs and supercenters ............................. 45291 26.7 3.4 2.5 .2 – 20.5All other general merchandise stores ........................... 45299 – – – – – –
Miscellaneous store retailers ................................................ 453 11.1 3.1 2.9 – – 5.1Florists .............................................................................. 4531 – – – – – –Office supplies, stationery, and gift stores ...................... 4532 6.7 – – – – 5.1
Office supplies and stationery stores ........................... 45321 14.3 – – – – 10.9Gift, novelty, and souvenir stores ................................. 45322 – – – – – –
Used merchandise stores ................................................ 4533 24.3 8.3 – – – 12.8Other miscellaneous store retailers .................................. 4539 9.4 – – – – –
Pet and pet supplies stores .......................................... 45391 21.8 – – – – –Manufactured (mobile) home dealers .......................... 45393 – – – – – –All other miscellaneous store retailers ......................... 45399 – – – – – –
Nonstore retailers ................................................................. 454 5.5 – – – – 4.7Electronic shopping and mail-order houses ..................... 4541 6.5 – – – – 5.3
Electronic shopping and mail-order houses ................. 45411 6.5 – – – – 5.3Electronic shopping .................................................. 454111 2.6 – – – – 2.2Electronic auctions ................................................... 454112 – – – – – –Mail-order houses .................................................... 454113 11.5 – – – – 9.1
Vending machine operators ............................................. 4542 – – – – – –Direct selling establishments ............................................ 4543 – – – – – –
Fuel dealers ................................................................. 45431 – – – – – –Other direct selling establishments .............................. 45439 – – – – – –
Transportation and warehousing7 .................................... 48-49 18.4 1.0 1.2 .2 4.5 11.4Air transportation .................................................................. 481 45.8 .4 1.5 – 28.0 15.6
Scheduled air transportation ............................................ 4811 50.2 .5 1.6 – 31.1 16.9Scheduled air transportation ........................................ 48111 50.2 .5 1.6 – 31.1 16.9
Scheduled passenger air transportation .................. 481111 51.8 .5 1.6 – 32.1 17.4
See footnotes at end of table.

TABLE SNR08. Incidence rates1 of nonfatal occupational illness, by industry and category of illness, 2014 — Continued
Industry2 NAICScode3
Incidence rates per 10,000 full-time workers
Totalcases
Skindiseases
ordisorders
Respiratoryconditions Poisonings Hearing loss All other
illnesses
Scheduled freight air transportation ......................... 481112 – – – – – –Nonscheduled air transportation ...................................... 4812 6.0 – – – – 4.3
Rail transportation7 .............................................................. 482 7.8 – – – 3.6 3.7Water transportation ............................................................. 483 13.0 – – – – 10.1
Deep sea, coastal, and great lakes water transportation 4831 5.0 – – – – –Deep sea, coastal, and great lakes watertransportation ............................................................. 48311 5.0 – – – – –
Deep sea freight transportation ................................ 483111 – – – – – –Deep sea passenger transportation ......................... 483112 – – – – – –Coastal and great lakes passenger transportation ... 483114 – – – – – –
Inland water transportation ............................................... 4832 24.2 – – – – –Inland water transportation ........................................... 48321 24.2 – – – – –
Inland water freight transportation ............................ 483211 10.2 – – – – –Truck transportation ............................................................. 484 7.6 .9 1.1 .3 .3 5.0
General freight trucking .................................................... 4841 8.5 .6 1.3 .3 .4 5.9General freight trucking, local ...................................... 48411 9.4 – – – – 8.0General freight trucking, long-distance ........................ 48412 8.2 .8 1.7 .3 .2 5.2
Specialized freight trucking .............................................. 4842 5.5 1.6 .5 – – 3.0Used household and office goods moving ................... 48421 4.4 – – – – –Specialized freight (except used goods) trucking, local 48422 4.6 1.5 – – – 2.3Specialized freight (except used goods) trucking,long-distance .............................................................. 48423 7.5 1.7 – – – 4.5
Transit and ground passenger transportation ...................... 485 11.7 1.6 2.3 – – 7.2Urban transit systems ...................................................... 4851 14.8 – – – – 12.4Interurban and rural bus transportation ............................ 4852 67.4 13.0 15.8 – – 31.1Taxi and limousine service ............................................... 4853 3.4 – – – – –
Taxi service .................................................................. 48531 – – – – – –Limousine service ........................................................ 48532 6.0 – – – – –
School and employee bus transportation ......................... 4854 5.3 – – – – 3.0Charter bus industry ......................................................... 4855 8.5 – – – – 6.9Other transit and ground passenger transportation ......... 4859 15.6 2.4 3.0 – – 10.2
Pipeline transportation ......................................................... 486 29.7 – – – 28.9 –Pipeline transportation of natural gas ............................... 4862 46.5 – – – 45.3 –
Scenic and sightseeing transportation ................................. 487 – – – – – –Scenic and sightseeing transportation, land .................... 4871 – – – – – –Scenic and sightseeing transportation, water .................. 4872 – – – – – –Scenic and sightseeing transportation, other ................... 4879 – – – – – –
Support activities for transportation ...................................... 488 16.9 2.2 1.4 – 6.6 6.6Support activities for air transportation ............................. 4881 20.8 1.1 3.6 – 8.1 7.9Support activities for rail transportation ............................ 4882 8.1 – – – – –Support activities for water transportation ........................ 4883 35.2 – – – 26.1 6.0
Marine cargo handling .................................................. 48832 61.3 – – – 54.3 4.2Navigational services to shipping ................................. 48833 19.0 – – – – 11.4Other support activities for water transportation .......... 48839 – – – – – –
See footnotes at end of table.
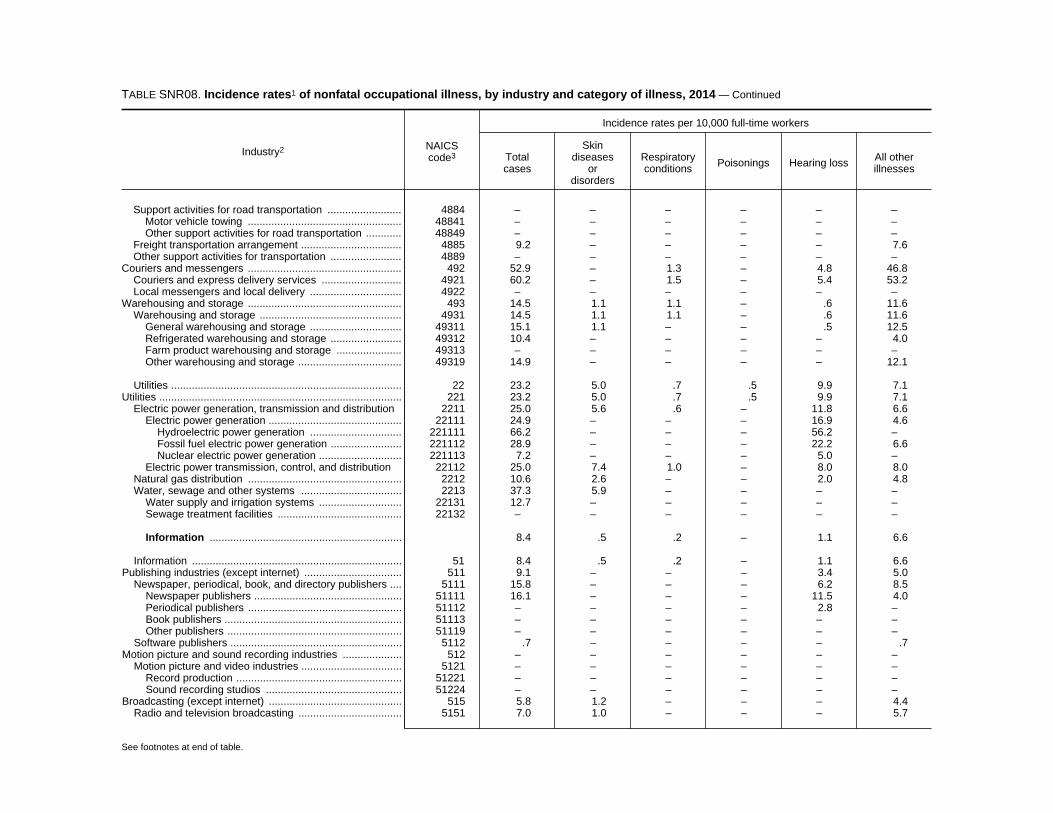
TABLE SNR08. Incidence rates1 of nonfatal occupational illness, by industry and category of illness, 2014 — Continued
Industry2 NAICScode3
Incidence rates per 10,000 full-time workers
Totalcases
Skindiseases
ordisorders
Respiratoryconditions Poisonings Hearing loss All other
illnesses
Support activities for road transportation ......................... 4884 – – – – – –Motor vehicle towing .................................................... 48841 – – – – – –Other support activities for road transportation ............ 48849 – – – – – –
Freight transportation arrangement .................................. 4885 9.2 – – – – 7.6Other support activities for transportation ........................ 4889 – – – – – –
Couriers and messengers .................................................... 492 52.9 – 1.3 – 4.8 46.8Couriers and express delivery services ........................... 4921 60.2 – 1.5 – 5.4 53.2Local messengers and local delivery ............................... 4922 – – – – – –
Warehousing and storage .................................................... 493 14.5 1.1 1.1 – .6 11.6Warehousing and storage ................................................ 4931 14.5 1.1 1.1 – .6 11.6
General warehousing and storage ............................... 49311 15.1 1.1 – – .5 12.5Refrigerated warehousing and storage ........................ 49312 10.4 – – – – 4.0Farm product warehousing and storage ...................... 49313 – – – – – –Other warehousing and storage ................................... 49319 14.9 – – – – 12.1
Utilities .............................................................................. 22 23.2 5.0 .7 .5 9.9 7.1Utilities .................................................................................. 221 23.2 5.0 .7 .5 9.9 7.1
Electric power generation, transmission and distribution 2211 25.0 5.6 .6 – 11.8 6.6Electric power generation ............................................. 22111 24.9 – – – 16.9 4.6
Hydroelectric power generation ............................... 221111 66.2 – – – 56.2 –Fossil fuel electric power generation ........................ 221112 28.9 – – – 22.2 6.6Nuclear electric power generation ............................ 221113 7.2 – – – 5.0 –
Electric power transmission, control, and distribution 22112 25.0 7.4 1.0 – 8.0 8.0Natural gas distribution .................................................... 2212 10.6 2.6 – – 2.0 4.8Water, sewage and other systems .................................. 2213 37.3 5.9 – – – –
Water supply and irrigation systems ............................ 22131 12.7 – – – – –Sewage treatment facilities .......................................... 22132 – – – – – –
Information ................................................................. 8.4 .5 .2 – 1.1 6.6
Information ....................................................................... 51 8.4 .5 .2 – 1.1 6.6Publishing industries (except internet) ................................. 511 9.1 – – – 3.4 5.0
Newspaper, periodical, book, and directory publishers .... 5111 15.8 – – – 6.2 8.5Newspaper publishers .................................................. 51111 16.1 – – – 11.5 4.0Periodical publishers .................................................... 51112 – – – – 2.8 –Book publishers ............................................................ 51113 – – – – – –Other publishers ........................................................... 51119 – – – – – –
Software publishers .......................................................... 5112 .7 – – – – .7Motion picture and sound recording industries .................... 512 – – – – – –
Motion picture and video industries .................................. 5121 – – – – – –Record production ........................................................ 51221 – – – – – –Sound recording studios .............................................. 51224 – – – – – –
Broadcasting (except internet) ............................................. 515 5.8 1.2 – – – 4.4Radio and television broadcasting ................................... 5151 7.0 1.0 – – – 5.7
See footnotes at end of table.

TABLE SNR08. Incidence rates1 of nonfatal occupational illness, by industry and category of illness, 2014 — Continued
Industry2 NAICScode3
Incidence rates per 10,000 full-time workers
Totalcases
Skindiseases
ordisorders
Respiratoryconditions Poisonings Hearing loss All other
illnesses
Television broadcasting ............................................... 51512 11.0 1.6 – – – 8.9Cable and other subscription programming ..................... 5152 – – – – – –
Telecommunications ............................................................ 517 9.7 .7 .2 – – 8.4Wired telecommunications carriers .................................. 5171 9.5 .8 – – – 7.8Wireless telecommunications carriers (except satellite) .. 5172 3.1 – – – – 2.7Other telecommunications ............................................... 5179 25.4 – – – – 25.1
Data processing, hosting, and related services ................... 518 5.4 – – – – 5.2Other information services ................................................... 519 .9 – – – – –
Other information services ............................................... 5191 .9 – – – – –News syndicates .......................................................... 51911 – – – – – –Internet publishing and broadcasting and web searchportals ........................................................................ 51913 – – – – – –
Finance, insurance, and real estate ......................... 5.4 .6 .7 – – 4.0
Finance and insurance ..................................................... 52 4.2 .1 .4 – – 3.7Monetary authorities-central bank ........................................ 521 – – – – – –Credit intermediation and related activities .......................... 522 5.9 – .5 – – 5.3
Depository credit intermediation ....................................... 5221 6.0 – .4 – – 5.6Commercial banking .................................................... 52211 5.3 – .4 – – 4.9Savings institutions ...................................................... 52212 9.9 – – – – 9.5Credit unions ................................................................ 52213 7.3 – – – – 7.1
Nondepository credit intermediation ................................. 5222 – – – – – –Credit card issuing ....................................................... 52221 3.8 – – – – 2.7Sales financing ............................................................. 52222 3.0 – – – – 2.7Other nondepository credit intermediation ................... 52229 – – – – – –
Activities related to credit intermediation .......................... 5223 4.2 – – – – 2.2Mortgage and nonmortgage loan brokers .................... 52231 3.5 – – – – –Financial transactions processing, reserve, andclearinghouse activities .............................................. 52232 2.9 – – – – 2.9
Securities, commodity contracts, and other financialinvestments and related activities ...................................... 523 .5 – – – – .5
Investment banking and securities dealing .................. 52311 – – – – – –Other financial investment activities ................................. 5239 .7 – – – – .7
Miscellaneous intermediation ....................................... 52391 – – – – – –Portfolio management .................................................. 52392 – – – – – –
Insurance carriers and related activities ............................... 524 3.8 .1 .5 – – 3.2Insurance carriers ............................................................ 5241 6.0 .2 .5 – – 5.3
Direct life, health, and medical insurance carriers ...... 52411 6.4 – .5 – – 5.6Direct insurance (ex. life, health, and medical) carriers 52412 5.7 – .5 – – 5.1Reinsurance carriers .................................................... 52413 – – – – – –
Agencies, brokerages, and other insurance relatedactivities ......................................................................... 5242 1.3 – .5 – – .7Insurance agencies and brokerages ............................ 52421 1.1 – – – – .8
See footnotes at end of table.

TABLE SNR08. Incidence rates1 of nonfatal occupational illness, by industry and category of illness, 2014 — Continued
Industry2 NAICScode3
Incidence rates per 10,000 full-time workers
Totalcases
Skindiseases
ordisorders
Respiratoryconditions Poisonings Hearing loss All other
illnesses
Other insurance related activities ................................. 52429 1.8 – 1.2 – – –
Real estate and rental and leasing ................................... 53 8.8 2.3 1.5 – – 4.9Real estate ........................................................................... 531 10.7 2.7 1.5 – – 6.3
Lessors of real estate ....................................................... 5311 16.8 3.3 2.3 – – –Lessors of residential buildings and dwellings ............. 53111 23.5 – 3.8 – – –Lessors of nonresidential buildings (exceptminiwarehouses) ........................................................ 53112 10.4 – – – – –
Lessors of other real estate property ........................... 53119 – – – – – –Offices of real estate agents and brokers ........................ 5312 3.8 – – – – 2.3Activities related to real estate ......................................... 5313 8.6 2.9 1.5 – – 4.0
Real estate property managers .................................... 53131 9.6 3.4 1.7 – – 4.2Other activities related to real estate ............................ 53139 – – – – – –
Rental and leasing services ................................................. 532 4.0 1.2 1.4 – – 1.4Automotive equipment rental and leasing ........................ 5321 2.5 – – – – 2.1
Passenger car rental and leasing ................................. 53211 2.6 – – – – 2.1Truck, utility trailer, and rv (recreational vehicle) rentaland leasing ................................................................. 53212 – – – – – –
Consumer goods rental .................................................... 5322 7.8 – 4.7 – – –Consumer electronics and appliances rental ............... 53221 – – – – – –Formal wear and costume rental .................................. 53222 – – – – – –Video tape and disc rental ............................................ 53223 – – – – – –Other consumer goods rental ....................................... 53229 7.1 – 5.8 – – –
General rental centers ...................................................... 5323 – – – – – –Commercial and industrial machinery and equipmentrental and leasing ........................................................... 5324 3.2 – – – – –
Construction, transportation, mining, and forestrymachinery and equipment rental and leasing ............ 53241 – – – – – –
Other commercial and industrial machinery andequipment rental and leasing ..................................... 53249 – – – – – –
Lessors of nonfinancial intangible assets (exceptcopyrighted works) ............................................................. 533 – – – – – –
Professional and business services ........................ 7.9 1.5 .6 .2 .4 5.2
Professional, scientific, and technical services ................ 54 – .4 .4 – .4 –Professional, scientific, and technical services .................... 541 – .4 .4 – .4 –
Legal services .................................................................. 5411 1.1 – .3 – – –Accounting, tax preparation, bookkeeping, and payrollservices .......................................................................... 5412 1.7 – – – – 1.3
Accounting, tax preparation, bookkeeping, and payrollservices ...................................................................... 54121 1.7 – – – – 1.3
Offices of certified public accountants ...................... 541211 1.1 – – – – 1.0Other accounting services ........................................ 541219 3.9 – – – – –
See footnotes at end of table.
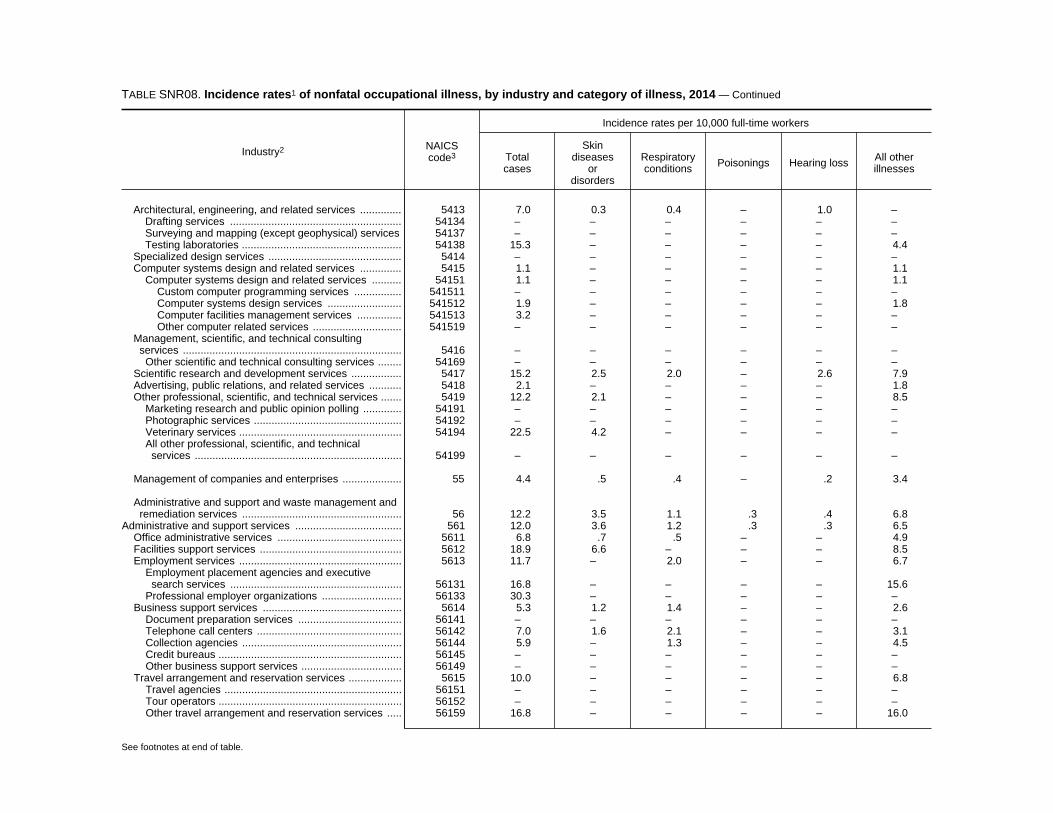
TABLE SNR08. Incidence rates1 of nonfatal occupational illness, by industry and category of illness, 2014 — Continued
Industry2 NAICScode3
Incidence rates per 10,000 full-time workers
Totalcases
Skindiseases
ordisorders
Respiratoryconditions Poisonings Hearing loss All other
illnesses
Architectural, engineering, and related services .............. 5413 7.0 0.3 0.4 – 1.0 –Drafting services .......................................................... 54134 – – – – – –Surveying and mapping (except geophysical) services 54137 – – – – – –Testing laboratories ...................................................... 54138 15.3 – – – – 4.4
Specialized design services ............................................. 5414 – – – – – –Computer systems design and related services .............. 5415 1.1 – – – – 1.1
Computer systems design and related services .......... 54151 1.1 – – – – 1.1Custom computer programming services ................ 541511 – – – – – –Computer systems design services ......................... 541512 1.9 – – – – 1.8Computer facilities management services ............... 541513 3.2 – – – – –Other computer related services .............................. 541519 – – – – – –
Management, scientific, and technical consultingservices .......................................................................... 5416 – – – – – –
Other scientific and technical consulting services ........ 54169 – – – – – –Scientific research and development services ................. 5417 15.2 2.5 2.0 – 2.6 7.9Advertising, public relations, and related services ........... 5418 2.1 – – – – 1.8Other professional, scientific, and technical services ....... 5419 12.2 2.1 – – – 8.5
Marketing research and public opinion polling ............. 54191 – – – – – –Photographic services .................................................. 54192 – – – – – –Veterinary services ....................................................... 54194 22.5 4.2 – – – –All other professional, scientific, and technicalservices ...................................................................... 54199 – – – – – –
Management of companies and enterprises .................... 55 4.4 .5 .4 – .2 3.4
Administrative and support and waste management andremediation services ...................................................... 56 12.2 3.5 1.1 .3 .4 6.8
Administrative and support services .................................... 561 12.0 3.6 1.2 .3 .3 6.5Office administrative services .......................................... 5611 6.8 .7 .5 – – 4.9Facilities support services ................................................ 5612 18.9 6.6 – – – 8.5Employment services ....................................................... 5613 11.7 – 2.0 – – 6.7
Employment placement agencies and executivesearch services .......................................................... 56131 16.8 – – – – 15.6
Professional employer organizations ........................... 56133 30.3 – – – – –Business support services ............................................... 5614 5.3 1.2 1.4 – – 2.6
Document preparation services ................................... 56141 – – – – – –Telephone call centers ................................................. 56142 7.0 1.6 2.1 – – 3.1Collection agencies ...................................................... 56144 5.9 – 1.3 – – 4.5Credit bureaus .............................................................. 56145 – – – – – –Other business support services .................................. 56149 – – – – – –
Travel arrangement and reservation services .................. 5615 10.0 – – – – 6.8Travel agencies ............................................................ 56151 – – – – – –Tour operators .............................................................. 56152 – – – – – –Other travel arrangement and reservation services ..... 56159 16.8 – – – – 16.0
See footnotes at end of table.
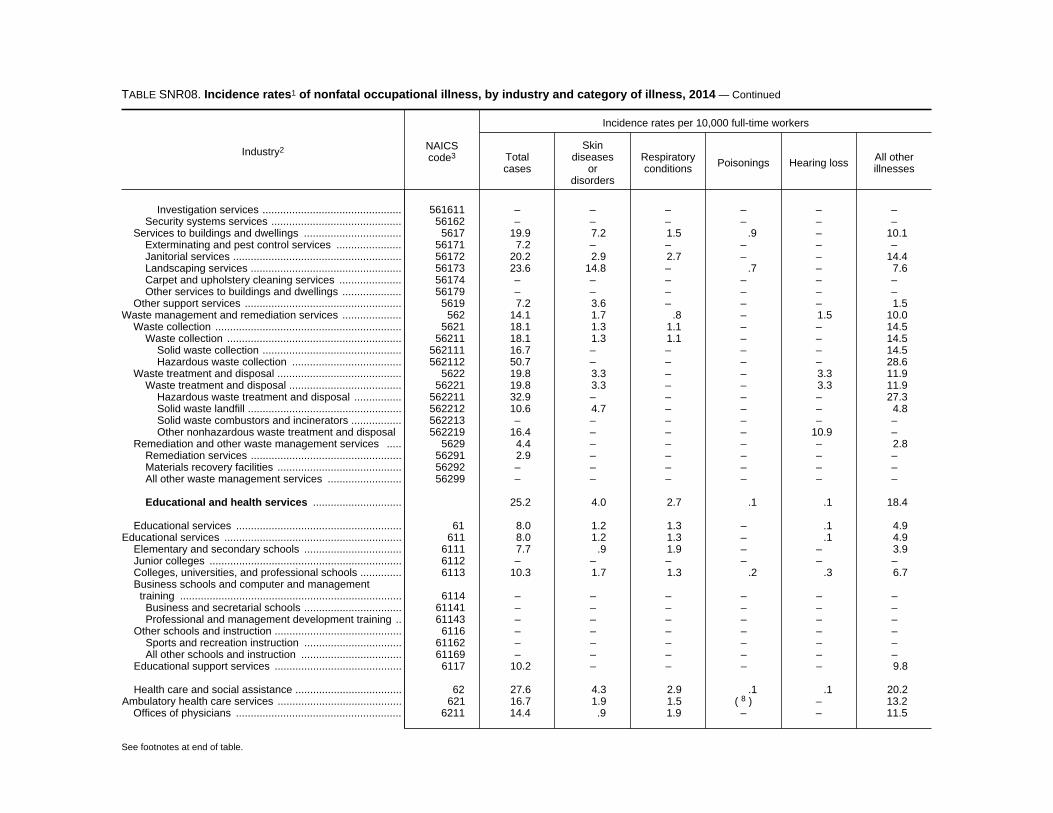
TABLE SNR08. Incidence rates1 of nonfatal occupational illness, by industry and category of illness, 2014 — Continued
Industry2 NAICScode3
Incidence rates per 10,000 full-time workers
Totalcases
Skindiseases
ordisorders
Respiratoryconditions Poisonings Hearing loss All other
illnesses
Investigation services ............................................... 561611 – – – – – –Security systems services ............................................ 56162 – – – – – –
Services to buildings and dwellings ................................. 5617 19.9 7.2 1.5 .9 – 10.1Exterminating and pest control services ...................... 56171 7.2 – – – – –Janitorial services ......................................................... 56172 20.2 2.9 2.7 – – 14.4Landscaping services ................................................... 56173 23.6 14.8 – .7 – 7.6Carpet and upholstery cleaning services ..................... 56174 – – – – – –Other services to buildings and dwellings .................... 56179 – – – – – –
Other support services ..................................................... 5619 7.2 3.6 – – – 1.5Waste management and remediation services .................... 562 14.1 1.7 .8 – 1.5 10.0
Waste collection ............................................................... 5621 18.1 1.3 1.1 – – 14.5Waste collection ........................................................... 56211 18.1 1.3 1.1 – – 14.5
Solid waste collection ............................................... 562111 16.7 – – – – 14.5Hazardous waste collection ..................................... 562112 50.7 – – – – 28.6
Waste treatment and disposal .......................................... 5622 19.8 3.3 – – 3.3 11.9Waste treatment and disposal ...................................... 56221 19.8 3.3 – – 3.3 11.9
Hazardous waste treatment and disposal ................ 562211 32.9 – – – – 27.3Solid waste landfill .................................................... 562212 10.6 4.7 – – – 4.8Solid waste combustors and incinerators ................. 562213 – – – – – –Other nonhazardous waste treatment and disposal 562219 16.4 – – – 10.9 –
Remediation and other waste management services ..... 5629 4.4 – – – – 2.8Remediation services ................................................... 56291 2.9 – – – – –Materials recovery facilities .......................................... 56292 – – – – – –All other waste management services ......................... 56299 – – – – – –
Educational and health services .............................. 25.2 4.0 2.7 .1 .1 18.4
Educational services ........................................................ 61 8.0 1.2 1.3 – .1 4.9Educational services ............................................................ 611 8.0 1.2 1.3 – .1 4.9
Elementary and secondary schools ................................. 6111 7.7 .9 1.9 – – 3.9Junior colleges ................................................................. 6112 – – – – – –Colleges, universities, and professional schools .............. 6113 10.3 1.7 1.3 .2 .3 6.7Business schools and computer and managementtraining ........................................................................... 6114 – – – – – –
Business and secretarial schools ................................. 61141 – – – – – –Professional and management development training .. 61143 – – – – – –
Other schools and instruction ........................................... 6116 – – – – – –Sports and recreation instruction ................................. 61162 – – – – – –All other schools and instruction .................................. 61169 – – – – – –
Educational support services ........................................... 6117 10.2 – – – – 9.8
Health care and social assistance .................................... 62 27.6 4.3 2.9 .1 .1 20.2Ambulatory health care services .......................................... 621 16.7 1.9 1.5 8( ) – 13.2
Offices of physicians ........................................................ 6211 14.4 .9 1.9 – – 11.5
See footnotes at end of table.
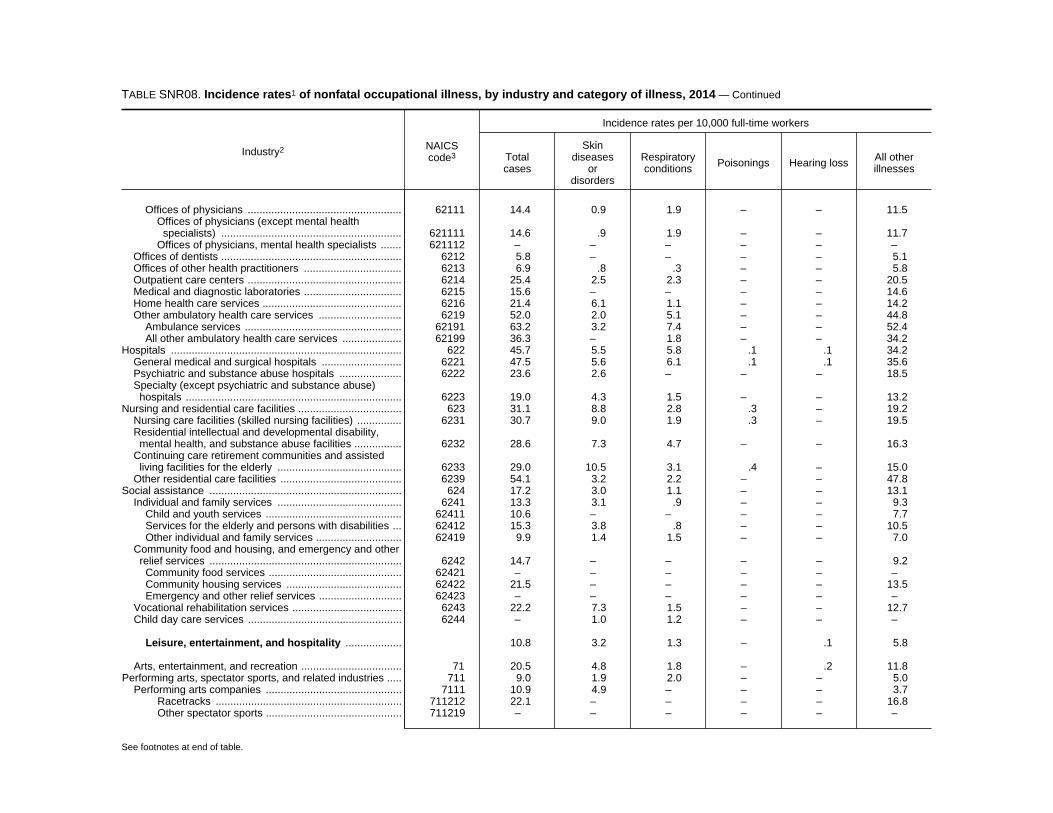
TABLE SNR08. Incidence rates1 of nonfatal occupational illness, by industry and category of illness, 2014 — Continued
Industry2 NAICScode3
Incidence rates per 10,000 full-time workers
Totalcases
Skindiseases
ordisorders
Respiratoryconditions Poisonings Hearing loss All other
illnesses
Offices of physicians .................................................... 62111 14.4 0.9 1.9 – – 11.5Offices of physicians (except mental healthspecialists) ............................................................. 621111 14.6 .9 1.9 – – 11.7
Offices of physicians, mental health specialists ....... 621112 – – – – – –Offices of dentists ............................................................. 6212 5.8 – – – – 5.1Offices of other health practitioners ................................. 6213 6.9 .8 .3 – – 5.8Outpatient care centers .................................................... 6214 25.4 2.5 2.3 – – 20.5Medical and diagnostic laboratories ................................. 6215 15.6 – – – – 14.6Home health care services ............................................... 6216 21.4 6.1 1.1 – – 14.2Other ambulatory health care services ............................ 6219 52.0 2.0 5.1 – – 44.8
Ambulance services ..................................................... 62191 63.2 3.2 7.4 – – 52.4All other ambulatory health care services .................... 62199 36.3 – 1.8 – – 34.2
Hospitals .............................................................................. 622 45.7 5.5 5.8 .1 .1 34.2General medical and surgical hospitals ........................... 6221 47.5 5.6 6.1 .1 .1 35.6Psychiatric and substance abuse hospitals ..................... 6222 23.6 2.6 – – – 18.5Specialty (except psychiatric and substance abuse)hospitals ......................................................................... 6223 19.0 4.3 1.5 – – 13.2
Nursing and residential care facilities ................................... 623 31.1 8.8 2.8 .3 – 19.2Nursing care facilities (skilled nursing facilities) ............... 6231 30.7 9.0 1.9 .3 – 19.5Residential intellectual and developmental disability,mental health, and substance abuse facilities ................ 6232 28.6 7.3 4.7 – – 16.3
Continuing care retirement communities and assistedliving facilities for the elderly .......................................... 6233 29.0 10.5 3.1 .4 – 15.0
Other residential care facilities ......................................... 6239 54.1 3.2 2.2 – – 47.8Social assistance ................................................................. 624 17.2 3.0 1.1 – – 13.1
Individual and family services .......................................... 6241 13.3 3.1 .9 – – 9.3Child and youth services .............................................. 62411 10.6 – – – – 7.7Services for the elderly and persons with disabilities ... 62412 15.3 3.8 .8 – – 10.5Other individual and family services ............................. 62419 9.9 1.4 1.5 – – 7.0
Community food and housing, and emergency and otherrelief services ................................................................. 6242 14.7 – – – – 9.2
Community food services ............................................. 62421 – – – – – –Community housing services ....................................... 62422 21.5 – – – – 13.5Emergency and other relief services ............................ 62423 – – – – – –
Vocational rehabilitation services ..................................... 6243 22.2 7.3 1.5 – – 12.7Child day care services .................................................... 6244 – 1.0 1.2 – – –
Leisure, entertainment, and hospitality ................... 10.8 3.2 1.3 – .1 5.8
Arts, entertainment, and recreation .................................. 71 20.5 4.8 1.8 – .2 11.8Performing arts, spectator sports, and related industries ..... 711 9.0 1.9 2.0 – – 5.0
Performing arts companies .............................................. 7111 10.9 4.9 – – – 3.7Racetracks ............................................................... 711212 22.1 – – – – 16.8Other spectator sports .............................................. 711219 – – – – – –
See footnotes at end of table.

TABLE SNR08. Incidence rates1 of nonfatal occupational illness, by industry and category of illness, 2014 — Continued
Industry2 NAICScode3
Incidence rates per 10,000 full-time workers
Totalcases
Skindiseases
ordisorders
Respiratoryconditions Poisonings Hearing loss All other
illnesses
Promoters of performing arts, sports, and similar events 7113 16.0 – 6.1 – – 9.3Agents and managers for artists, athletes, entertainers,and other public figures .................................................. 7114 – – – – – –
Museums, historical sites, and similar institutions ................ 712 23.3 8.6 2.4 – – 11.9Amusement, gambling, and recreation industries ................ 713 23.5 5.2 1.7 – .3 13.8
Amusement parks and arcades ....................................... 7131 84.3 10.8 2.4 – 1.3 69.8Amusement and theme parks ...................................... 71311 92.5 11.7 2.4 – 1.4 76.9Amusement arcades .................................................... 71312 – – – – – –
Gambling industries ......................................................... 7132 10.6 1.9 – – – 8.1Other amusement and recreation industries .................... 7139 15.8 5.2 2.0 – – 4.7
Golf courses and country clubs .................................... 71391 19.4 12.2 – – – 5.1Skiing facilities .............................................................. 71392 15.4 – – – – –Marinas ........................................................................ 71393 – – – – – –Fitness and recreational sports centers ....................... 71394 18.2 1.2 2.7 – – 4.5All other amusement and recreation industries ............ 71399 4.1 – 3.1 – – –
Accommodation and food services .................................. 72 9.2 3.0 1.2 .1 .1 4.9Accommodation ................................................................... 721 20.3 5.8 2.7 .2 .1 11.5
Traveler accommodation .................................................. 7211 20.3 5.9 2.8 .2 .1 11.4Hotels (except casino hotels) and motels .................... 72111 22.0 6.5 3.0 .2 – 12.2Casino hotels ............................................................... 72112 14.2 3.7 1.8 – – 8.6Other traveler accommodation ..................................... 72119 – – – – – –
Rv (recreational vehicle) parks and recreational camps .. 7212 23.4 – – – – 20.2Rv (recreational vehicle) parks and recreationalcamps ......................................................................... 72121 23.4 – – – – 20.2
Rv (recreational vehicle) parks and campgrounds ... 721211 – – – – – –Recreational and vacation camps (exceptcampgrounds) ........................................................ 721214 22.7 – – – – 18.7
Rooming and boarding houses ........................................ 7213 – – – – – –Food services and drinking places ....................................... 722 6.8 2.4 .9 .1 .1 3.4
Special food services ....................................................... 7223 10.5 3.6 1.7 – .6 4.6Drinking places (alcoholic beverages) ............................. 7224 – – – – – –Restaurants and other eating places ............................... 7225 6.8 2.4 .9 .1 – 3.4
Restaurants and other eating places ........................... 72251 6.8 2.4 .9 .1 – 3.4Full-service restaurants ............................................ 722511 5.5 1.7 .7 – – 3.0Limited-service restaurants ...................................... 722513 8.9 3.4 1.2 – – 4.3Cafeterias, grill buffets, and buffets .......................... 722514 – – – – – –Snack and nonalcoholic beverage bars ................... 722515 2.0 – – – – 1.5
Other services (except public administration) ........ 7.5 1.1 1.1 .2 .5 4.6
Other services (except public administration) .................. 81 7.5 1.1 1.1 .2 .5 4.6Repair and maintenance ...................................................... 811 5.2 .4 .3 – – 2.9
Automotive repair and maintenance ................................ 8111 5.1 .4 – – – 2.4
See footnotes at end of table.
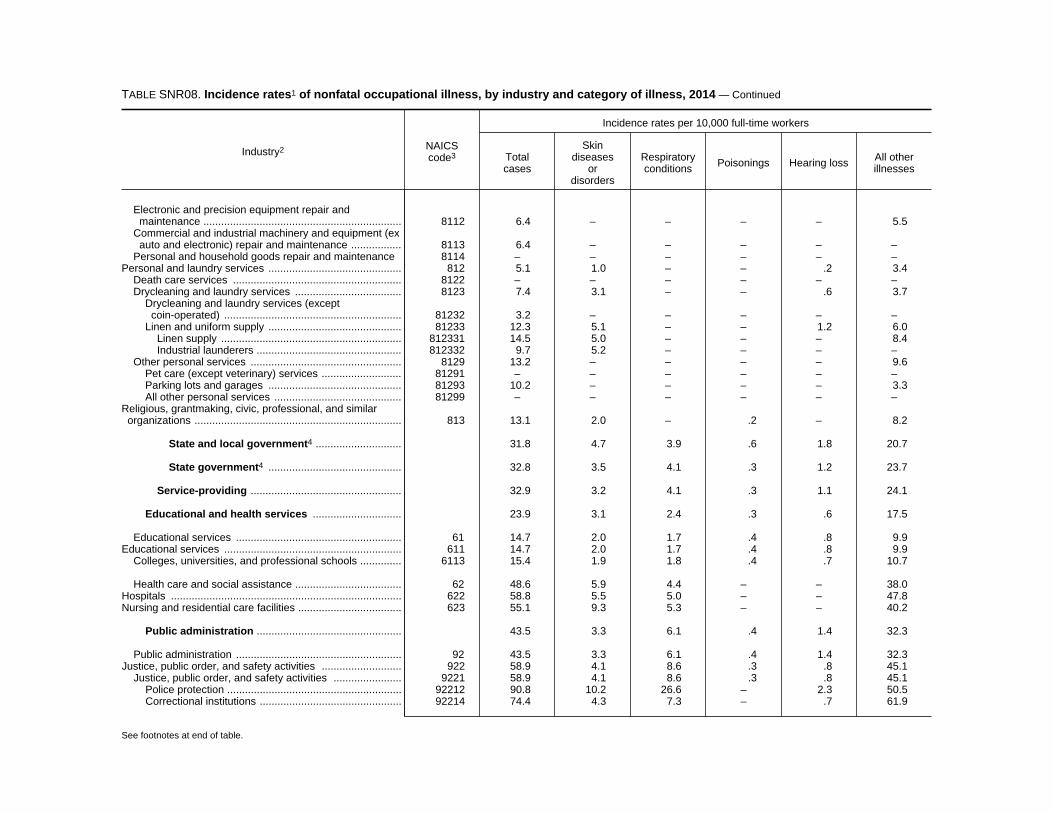
TABLE SNR08. Incidence rates1 of nonfatal occupational illness, by industry and category of illness, 2014 — Continued
Industry2 NAICScode3
Incidence rates per 10,000 full-time workers
Totalcases
Skindiseases
ordisorders
Respiratoryconditions Poisonings Hearing loss All other
illnesses
Electronic and precision equipment repair andmaintenance ................................................................... 8112 6.4 – – – – 5.5
Commercial and industrial machinery and equipment (exauto and electronic) repair and maintenance ................. 8113 6.4 – – – – –
Personal and household goods repair and maintenance 8114 – – – – – –Personal and laundry services ............................................. 812 5.1 1.0 – – .2 3.4
Death care services ......................................................... 8122 – – – – – –Drycleaning and laundry services .................................... 8123 7.4 3.1 – – .6 3.7
Drycleaning and laundry services (exceptcoin-operated) ............................................................ 81232 3.2 – – – – –
Linen and uniform supply ............................................. 81233 12.3 5.1 – – 1.2 6.0Linen supply ............................................................. 812331 14.5 5.0 – – – 8.4Industrial launderers ................................................. 812332 9.7 5.2 – – – –
Other personal services ................................................... 8129 13.2 – – – – 9.6Pet care (except veterinary) services ........................... 81291 – – – – – –Parking lots and garages ............................................. 81293 10.2 – – – – 3.3All other personal services ........................................... 81299 – – – – – –
Religious, grantmaking, civic, professional, and similarorganizations ...................................................................... 813 13.1 2.0 – .2 – 8.2
State and local government4 ............................. 31.8 4.7 3.9 .6 1.8 20.7
State government4 ............................................. 32.8 3.5 4.1 .3 1.2 23.7
Service-providing ................................................... 32.9 3.2 4.1 .3 1.1 24.1
Educational and health services .............................. 23.9 3.1 2.4 .3 .6 17.5
Educational services ........................................................ 61 14.7 2.0 1.7 .4 .8 9.9Educational services ............................................................ 611 14.7 2.0 1.7 .4 .8 9.9
Colleges, universities, and professional schools .............. 6113 15.4 1.9 1.8 .4 .7 10.7
Health care and social assistance .................................... 62 48.6 5.9 4.4 – – 38.0Hospitals .............................................................................. 622 58.8 5.5 5.0 – – 47.8Nursing and residential care facilities ................................... 623 55.1 9.3 5.3 – – 40.2
Public administration ................................................. 43.5 3.3 6.1 .4 1.4 32.3
Public administration ........................................................ 92 43.5 3.3 6.1 .4 1.4 32.3Justice, public order, and safety activities ........................... 922 58.9 4.1 8.6 .3 .8 45.1
Justice, public order, and safety activities ....................... 9221 58.9 4.1 8.6 .3 .8 45.1Police protection ........................................................... 92212 90.8 10.2 26.6 – 2.3 50.5Correctional institutions ................................................ 92214 74.4 4.3 7.3 – .7 61.9
See footnotes at end of table.

TABLE SNR08. Incidence rates1 of nonfatal occupational illness, by industry and category of illness, 2014 — Continued
Industry2 NAICScode3
Incidence rates per 10,000 full-time workers
Totalcases
Skindiseases
ordisorders
Respiratoryconditions Poisonings Hearing loss All other
illnesses
Local government4 ............................................. 31.4 5.2 3.8 0.7 2.1 19.6
Goods-producing4 ................................................. 42.2 9.7 – – – 17.6
Construction ............................................................... 42.3 9.8 – – – 17.6
Construction ..................................................................... 23 42.3 9.8 – – – 17.6Heavy and civil engineering construction ............................. 237 43.3 10.0 – – – 17.9
Service-providing ................................................... 31.3 5.1 3.8 .7 2.0 19.6
Trade, transportation, and utilities7 ......................... – 6.2 12.7 1.7 12.6 –
Transportation and warehousing7 .................................... 48-49 69.9 4.3 23.4 – 13.8 27.9Transit and ground passenger transportation ...................... 485 62.1 3.2 9.5 – 15.9 33.0
Utilities .............................................................................. 22 – 8.3 1.5 – 11.5 –Utilities .................................................................................. 221 – 8.3 1.5 – 11.5 –
Water, sewage and other systems .................................. 2213 – 8.4 1.6 – 5.1 –
Educational and health services .............................. 12.7 1.7 2.0 .2 .2 8.6
Educational services ........................................................ 61 9.2 1.5 1.3 .3 .2 6.0Educational services ............................................................ 611 9.2 1.5 1.3 .3 .2 6.0
Elementary and secondary schools ................................. 6111 9.0 1.6 1.3 .2 .2 5.8
Health care and social assistance .................................... 62 38.9 3.2 7.1 – .5 28.0Hospitals .............................................................................. 622 43.0 3.8 6.7 – .7 31.8Nursing and residential care facilities ................................... 623 11.5 – – – – 9.3
See footnotes at end of table.
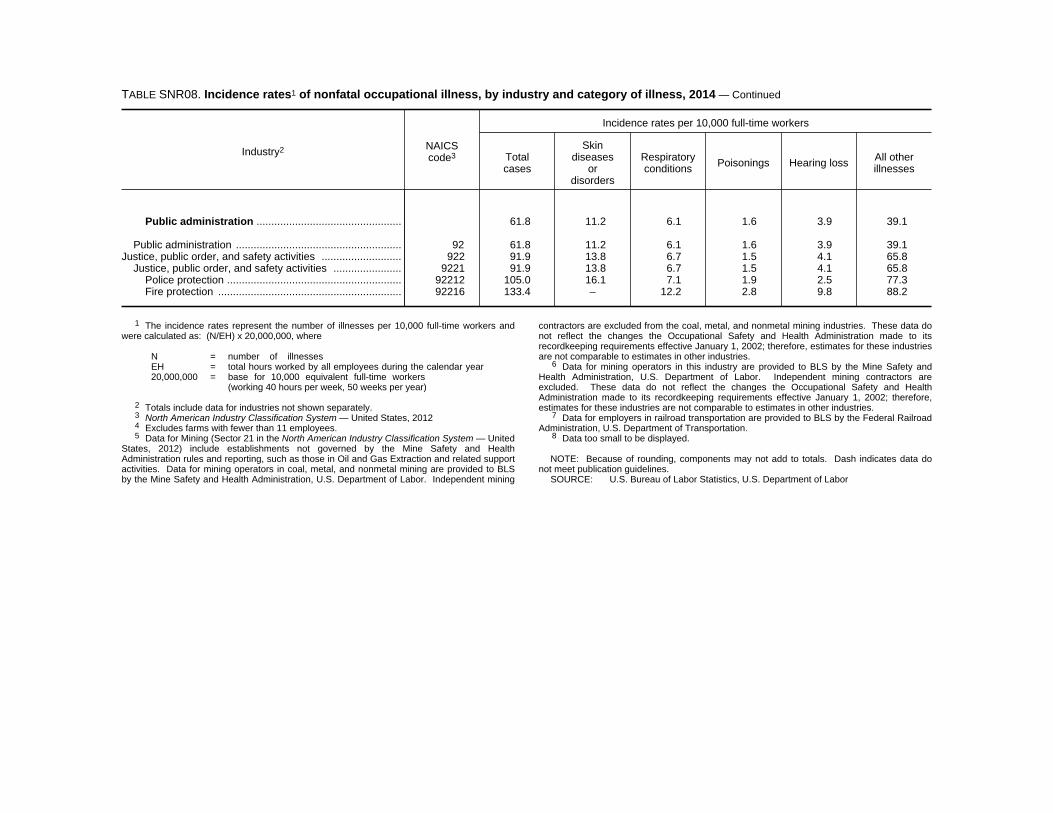
TABLE SNR08. Incidence rates1 of nonfatal occupational illness, by industry and category of illness, 2014 — Continued
Industry2 NAICScode3
Incidence rates per 10,000 full-time workers
Totalcases
Skindiseases
ordisorders
Respiratoryconditions Poisonings Hearing loss All other
illnesses
Public administration ................................................. 61.8 11.2 6.1 1.6 3.9 39.1
Public administration ........................................................ 92 61.8 11.2 6.1 1.6 3.9 39.1Justice, public order, and safety activities ........................... 922 91.9 13.8 6.7 1.5 4.1 65.8
Justice, public order, and safety activities ....................... 9221 91.9 13.8 6.7 1.5 4.1 65.8Police protection ........................................................... 92212 105.0 16.1 7.1 1.9 2.5 77.3Fire protection .............................................................. 92216 133.4 – 12.2 2.8 9.8 88.2
1 The incidence rates represent the number of illnesses per 10,000 full-time workers andwere calculated as: (N/EH) x 20,000,000, where
N = number of illnesses EH = total hours worked by all employees during the calendar year 20,000,000 = base for 10,000 equivalent full-time workers
(working 40 hours per week, 50 weeks per year)
2 Totals include data for industries not shown separately.3 North American Industry Classification System — United States, 20124 Excludes farms with fewer than 11 employees.5 Data for Mining (Sector 21 in the North American Industry Classification System — United
States, 2012) include establishments not governed by the Mine Safety and HealthAdministration rules and reporting, such as those in Oil and Gas Extraction and related supportactivities. Data for mining operators in coal, metal, and nonmetal mining are provided to BLSby the Mine Safety and Health Administration, U.S. Department of Labor. Independent mining
contractors are excluded from the coal, metal, and nonmetal mining industries. These data donot reflect the changes the Occupational Safety and Health Administration made to itsrecordkeeping requirements effective January 1, 2002; therefore, estimates for these industriesare not comparable to estimates in other industries.
6 Data for mining operators in this industry are provided to BLS by the Mine Safety andHealth Administration, U.S. Department of Labor. Independent mining contractors areexcluded. These data do not reflect the changes the Occupational Safety and HealthAdministration made to its recordkeeping requirements effective January 1, 2002; therefore,estimates for these industries are not comparable to estimates in other industries.
7 Data for employers in railroad transportation are provided to BLS by the Federal RailroadAdministration, U.S. Department of Transportation.
8 Data too small to be displayed.
NOTE: Because of rounding, components may not add to totals. Dash indicates data donot meet publication guidelines.
SOURCE: U.S. Bureau of Labor Statistics, U.S. Department of Labor