Table of Contents...Kathleen DeRosa, Gregory Pettis, Deanna Pressgrove, Andy Hall, Samantha Hawley,...
74
Transcript of Table of Contents...Kathleen DeRosa, Gregory Pettis, Deanna Pressgrove, Andy Hall, Samantha Hawley,...


Cathedral City 2013 Climate Action Plan i
Table of Contents
I. Executive Summary .............................................................................................................. 5
Energy Efficiency ........................................................................................................... 6
Climate Action Targets .................................................................................................. 6
Summary of Costs and Benefits .................................................................................... 8
II. Climate Action Planning ..................................................................................................... 10
Purpose and Compliance ............................................................................................ 10
California Leadership in Energy Efficiency .................................................................. 12
Utility Leadership ........................................................................................................ 13
The Planning Process .................................................................................................. 14
Calculating Potential Savings ...................................................................................... 16
III. 2013 Greenhouse Gas Inventory Results ........................................................................... 18
Emissions Reductions Goals ........................................................................................ 19
Portfolio of Savings Measures .................................................................................... 20
IV. Greenhouse Gas Reduction Opportunities ........................................................................ 21
Where We Live (Residential) ........................................................................ 22
Where We Work (Business) ......................................................................... 24
How We Build (Building) ............................................................................... 26
How We Get Around (Transportation) ......................................................... 28
How We Govern (Municipal) ........................................................................ 31
Where We Visit and Play (Hospitality/Recreation) ...................................... 33
Cathedral City 2013 Climate Action Plan ii
How We Teach and Learn (Education) ......................................................... 36
V. Implementation .................................................................................................................. 38
Timeline....................................................................................................................... 38
Summary of Measures by Phase ................................................................................. 38
Summary of Measures by Greenhouse Gas Sector .................................................... 38
Phase I Activities ......................................................................................................... 39
Phase II and III Activities ............................................................................................. 41
VI. Tracking Results and Measuring Progress .......................................................................... 47
Appendix A: Glossary of Terms and Abbreviations...................................................................... 49
Appendix B: Savings Measures Analysis by Cost-Effectiveness ................................................... 57
Appendix C: Savings Measures Analysis by Least Cost ................................................................ 66
Appendix D: Cathedral City 2013 Greenhouse Gas Inventory ..................................................... 73

Cathedral City 2013 Climate Action Plan iii
List of Figures
Figure 1: Cathedral City's Emissions Projections to 2020 ............................................................... 7
Figure 2: California vs. U.S. Per Capita Electricity Consumption, 1960–2004 .............................. 13
Figure 3: Cathedral City 2010 Community Emissions by Source (Tonnes CO2e) ......................... 19
Figure 4: Cathedral City Emissions Forecasted to 2020 ................................................................ 19
Figure 5: Emissions Reduction Wedges ........................................................................................ 20
List of Tables
Table 1: Cathedral City's Projected Emissions to 2020 ................................................................... 8
Table 2: Cathedral City's Projected Emissions to 2020 ................................................................. 20
Table 3: Climate Action Measure Totals by Sphere ...................................................................... 21
Table 4: Savings Measures for “Where We Live” ......................................................................... 23
Table 5: Savings Measures for “Where We Work” ....................................................................... 25
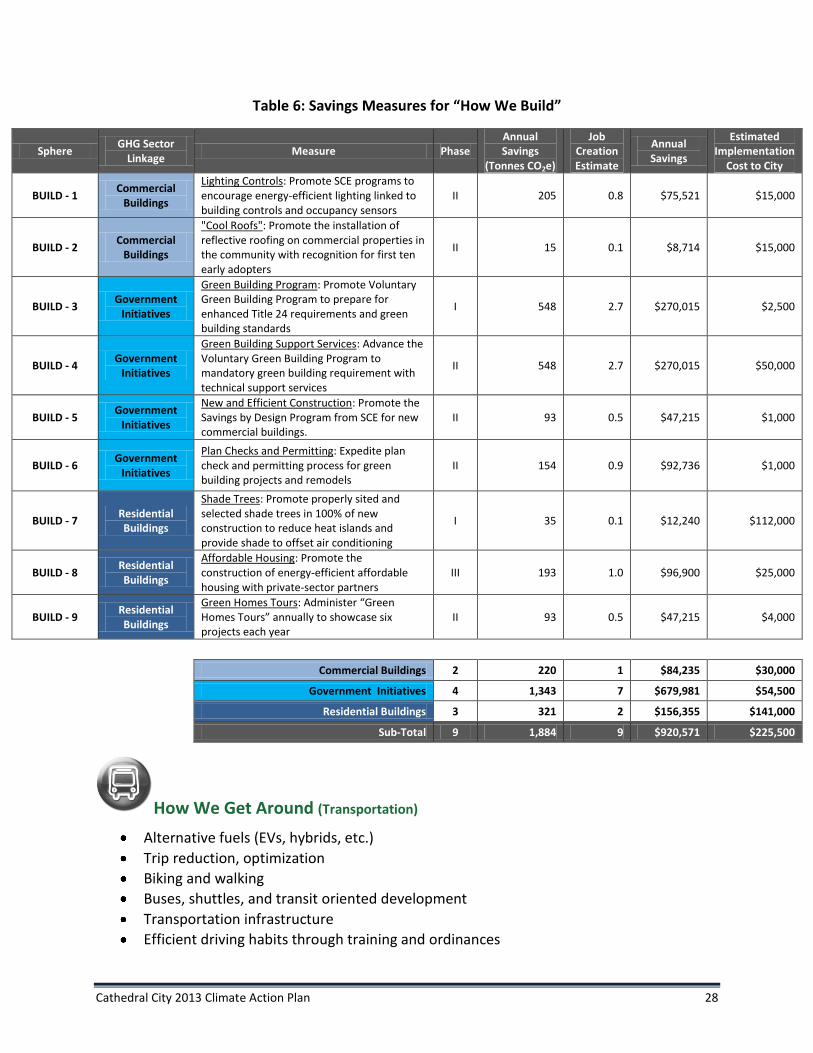
Table 6: Savings Measures for “How We Build” ........................................................................... 28
Table 7: Savings Measures for “How We Get Around” ................................................................ 29
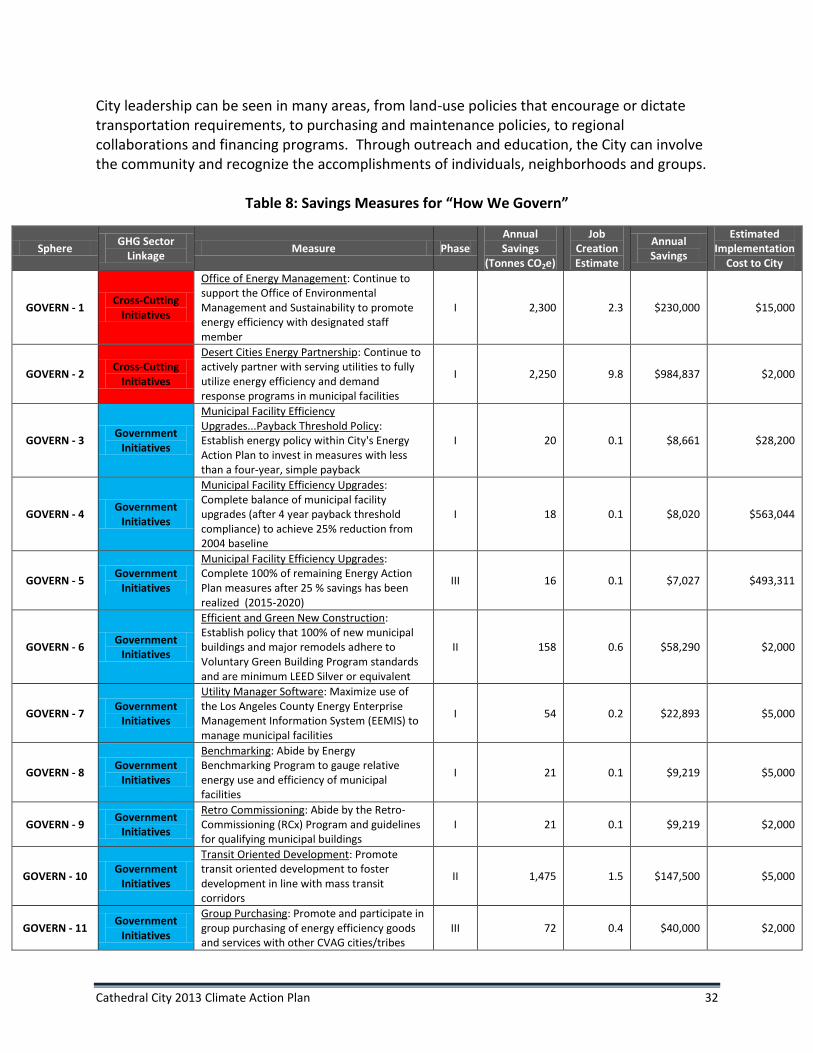
Table 8: Savings Measures for “How We Govern” ....................................................................... 32
Table 9: Savings Measures for “Where We Visit and Play” .......................................................... 35
Table 10: Savings Measures for “How We Teach and Learn” ...................................................... 37
Table 11: Phase I Measures .......................................................................................................... 39
Table 12: Phase II Measures ......................................................................................................... 42
Table 13: Phase III Measures ........................................................................................................ 45
Prepared for Cathedral City and the Coachella Valley Association of Governments by:
EcoMotion, Inc. 15375 Barranca Parkway, F-104 Irvine, California 92618 (949) 450-4155 www.EcoMotion.us
This program is funded by California utility ratepayers and administered by Southern California Edison under the auspices of the California Public Utilities Commission

Cathedral City 2013 Climate Action Plan iv
Credits
City of Cathedral City
Kathleen DeRosa, Gregory Pettis, Deanna Pressgrove, Andy Hall, Samantha Hawley, Richard Malacoff, Pat Milos, Carlos Rodriguez, Horst Schnur, Kevin Biersack, and Tami Scott
Members of the City Council and Staff
The EcoMotion Consulting Team
Aliana Lungo, Russ Flanigan, Ralph Torrie, Rick Heede, Virginia Nicols, Pat Conlon, Maria Jauregui, Jordan Garbayo, Drew Lowell-Britt, Ted Flanigan
Coachella Valley Association of Governments
Tom Kirk, Katie Barrows, Jacob Alvarez, Susan Weisbart, Michael Shoberg, Nick Peihl, Linda Rogers
Acknowledgements for Assistance
Grieg Asher Southern California Edison Jonas Conlon Desert Princess Country Club Hany Elgayar Southern California Edison Becky Estrella Southern California Gas Walton Farrar Southern California Edison Cynthia Garcia Southern California Edison Connie Garcia SunLine Transit Agency Monica Gilchrist International Council for Local Environmental Initiatives Morgan Greenwood International Council for Local Environmental Initiatives Chris Jones Cathedral Canyon Golf & Tennis Club Pong Kunakorn Southern California Edison Jesse Langley Southern California Edison Jacob Leib Southern California Association of Governments Sarah Li Coachella Valley Water District Richard Majors Desert Sands Unified School District Veronica Martinez Desert Sands Unified School District Katie Meyers Cimarron Golf Resort Mike Morrow SunLine Transit Agency Joel Parks Desert Sands Unified School District Adam Rush Riverside County, Administrative Center Jennifer Salciccioli Burrtec Arnold San Miguel Southern California Association of Governments Todd Shaw Desert Air Conditioning, Inc. David Smith Date Palm Country Club Amruta Sudhalkar International Council for Local Government Initiatives Rafael Villa South Coast Air Quality Management District Gary White Desert Sands Unified School District Jill Whynot South Coast Air Quality Management District Gary Zhou Southern California Gas
Green for Life Interns
Juan Aguilar, Salvador Aguilar, Paola Alvarez, Marcos Coronel, Jr., Maria Estrada, Alec Ferguson,
Miguel Gutierrez, Kathryn Hargreaves, Donald Henderson, J.P. Jasso, Liliana Paz, Ben Pineda,
Susanna Romig, James Tribbett, Jr., Natalee Vicencia

Cathedral City 2013 Climate Action Plan 5
I. Executive Summary
Cathedral City is proud to have completed this report, the “2013 Climate Action Plan: Leadership in Energy Efficiency.” It falls within a broader Sustainability Planning context supported by Southern California Edison (SCE) and its ratepayers in a program called “Green for Life.” With this Plan, Cathedral City is joining an increasing number of California local governments committed to addressing climate change at the local level. It is taking action now to reduce greenhouse gas emissions within its own operations and within the overall community.
The city limits of Cathedral City include Indian Reservation land. The Agua Caliente Band of Cahuilla Indians Reservation constitutes approximately 11% of the total built-out acreage within the City limits. The Agua Caliente 2013 Greenhouse Gas Inventory prepared as part of the Green for Life program describes how Reservation and Tribal emissions are accounted for in the overlap of jurisdictions.)
Cathedral City will take common-sense approaches to reduce energy use and waste, create local jobs, improve air quality, preserve our local landscape and history, and in other ways benefit the City for years to come.
The Climate Action Plan is a framework for the development and implementation of policies and programs that will reduce the City’s emissions. It addresses the major sources of emissions in seven spheres of daily life:
1. Where We Live (Residential) 2. Where We Work (Business) 3. How We Build (Building) 4. How We Get Around (Transportation)
5. How We Govern (Municipal) 6. Where We Visit and Play (Hospitality/Recreation) 7. How We Teach and Learn (Education)
For each sphere, the Plan suggests a number of programs or policies that can be implemented by Cathedral City to meet its goals. These are linked with the City’s Greenhouse Gas Inventory. A portfolio of 77 measures has been selected for implementation over eight years. Some of the measures are already planned or even in progress, and are included because of their anticipated impact. Each implementation measure includes information about anticipated results and approximate costs to the City.

Cathedral City 2013 Climate Action Plan 6
This Climate Action Plan is the root of a comprehensive suite of sustainability services including the City’s 2013 Greenhouse Gas Inventory (GHG Inventory),1 its 2013 Energy Action Plan,2 the Voluntary Green Building Policy,3 a municipal building Energy Benchmarking Practice,4 and a municipal building Commissioning/Retro-Commissioning Practice.5 Together, they support this Plan and help position the City for cost-effective energy efficiency savings and carbon footprint reductions.
Energy Efficiency
The subtitle of the Plan, “Leadership in Energy Efficiency,” helps define it. Energy efficiency provides rich opportunities for Cathedral City and taking steps to improve efficiency will lead to jobs – for example, jobs for weather-proofing houses, providing energy audits, installing new technologies or upgraded equipment. Programs that keep electricity costs low attract and keep businesses. This type of economic development is a top City priority.
This Plan achieves the win-win-win solution of creating jobs and cost savings, while reducing greenhouse gas emissions.
Many efficiency measures are simple and cost-effective: Homes that are not properly sealed in desert summers increase the need for cooling and can be drafty in the winter. They can be upgraded with significant results, as can aging appliances. Behavioral change to conserve and maximize the value of energy is nearly free and can also result in large dollar and energy savings, often at peak periods. Measures such as these are planned by Cathedral City, building on a successful track record of community-wide energy efficiency implementation.
Climate Action Targets
Based on the City’s Greenhouse Gas Inventory, if Cathedral City were to continue with “Business-as-Usual,” its carbon footprint will expand slightly as a result of population growth
1 City of Cathedral City 2013 Greenhouse Gas Inventory, prepared by EcoMotion for Cathedral City and the
Coachella Valley Association of Governments, May 2013. 2 Cathedral City 2013 Energy Action Plan, prepared EcoMotion for Cathedral City and the Coachella Valley
Association of Governments, May 2013. 3 Cathedral City Voluntary Green Building Program, Prepared by Terra Nova and Interactive Design for CVAG, June
2012. 4 Cathedral City Energy Benchmarking Practice and Procedures for Municipal Buildings, prepared by Terra Nova
and BSE Engineering for CVAG, May 2013. 5 Cathedral City Commissioning and Retro-Commissioning Practice, prepared by Terra Nova and BSE Engineering
for CVAG, May 2013.

Cathedral City 2013 Climate Action Plan 7
and increasing use of energy for comfort and convenience. With a growth rate predicted to exceed 19% between 2010 and 2020,6 the projection for City emissions to 2020 is as follows:
Figure 1: Cathedral City's Emissions Projections to 2020
Figure 1 summarizes the position of Cathedral City based on available data from 1990, 2005, and 2010. The light blue line shows the trajectory the City will follow given projected population growth and implementation of state and federal emissions reduction programs already in place. The darker green line shows the 1990 emissions levels based on 2010 backcasted estimates. The dashed line suggests the trajectory that the City will follow to achieve its target 1990 levels.
The emissions reductions goals are summarized below. The standard measurement for emissions is metric tons of carbon dioxide, or “tonnes” of CO2. Other greenhouse gases are converted to CO2 “equivalents,” or CO2e.
To achieve the AB 32 target by 2020, Cathedral City will have to cut GHG emissions by 23.4%, or 55,909 tonnes.
In 2010, Cathedral City was over its 1990 baseline emissions value by 53,439 tonnes. Given anticipated growth, stemmed in part by external factors driving down emissions, Cathedral City will have to reduce its 2020 emissions level by 55,909 tonnes, a 23.4% reduction.
6 Riverside County Population Projections 2010, Center for Demographic Research, Riverside County
Transportation and Land-Use Management Agency.
100,000
120,000
140,000
160,000
180,000
200,000
220,000
240,000
260,000
280,000
300,000
1990 1995 2000 2005 2010 2015 2020
Tota
l Em
issi
on
s (t
on
ne
s C
O2e
)
Business-as-Usual (BAU) Emissions
AB 32 Target
1990 Emissions

Cathedral City 2013 Climate Action Plan 8
Table 1: Cathedral City's Projected Emissions to 2020
Scenario Total Emissions (Tonnes CO2e)
Tonnes over 1990
% Reduction Needed
1990 Emissions Level 183,424 - -
2010 Baseline 236,863 53,439 22.6%
2020 Business-as-Usual 239,333 55,909 23.4%
The Climate Action Plan describes the steps the City and its residents can take to reach these targets by applying policies, programs, and initiatives.
Summary of Costs and Benefits
Measures suggested in this Plan represent a total cost to the City of approximately $2,084,555 over eight years leveraging annual savings of approximately $21 million in the City. The work required could create approximately 210 full-time, annual jobs.7 The savings to the community will help stimulate the economy by lowering utility bills for homes and businesses. For residents, lower utility bills will give them increased disposable income. For businesses, these efficiency measures will assist in lowering operating costs and thus increasing profitability. Visitors will become aware that the region cares deeply about the environment, increasing interest and tourism in the desert area.
Local governments benefit from these sustainability actions too. When communities are thriving with dollars being spent and jobs being created locally, local governments benefit from the increased property tax, sales tax, and economic development. This Plan will also increase opportunities for grant funding to support efficiency and sustainability measures, as granting agencies are increasingly expecting applicants to have these kinds of plans in place.
The preliminary measures presented would result in a reduction in greenhouse gas emissions of 56,087 tonnes, 100.3% the required amount. The surplus in GHG reduction measures allows future Councils flexibility and discretion in program selection and implementation.
7Jobs are conservatively estimated based on an annual full-time equivalent job created for every $100,000 of first-
year energy savings.

Cathedral City 2013 Climate Action Plan 9
Acknowledgements
Cathedral City appreciates Southern California Edison’s guidance on developing win-win energy efficiency strategies to save money and protect the environment. Through the Green for Life program administered by the Coachella Valley Association of Governments, the City has been given tools and resources to prepare for the future. Southern California Edison has supported the research and development of energy efficiency measures within this Plan. This has been especially important and responsible for the vast majority of the savings. The City views climate action in a broad context that integrates energy efficiency with waste diversion, water use, and transportation. Given the integrated planning context desired and the SCE Strategic Plan funding requirements, the Coachella Valley Association of Governments has arranged for supplemental funds from Riverside County for the research and development of the balance of the Plan’s non-energy elements. The City is grateful for this special support to make the Plan most useful in implementation.
Cathedral City 2013 Climate Action Plan 10
A Guide for
Action
to meet City’s
goals and AB 32
by 2020
II. Climate Action Planning
This City of Cathedral City 2013 Climate Action Plan is a guide for action. It takes knowledge gained from the GHG Inventory and the community, sets emissions reduction goals, and applies policies, programs, and initiatives to reach them. Sets of measures detailed later in the Plan will save energy and money, while creating jobs and cutting carbon. The City will use the Plan as a roadmap for making efficiency decisions based on getting the largest and most cost-effective emissions reductions that are in alignment with other City goals.
Purpose and Compliance
In 2006 California passed the Global Warming Solutions Act (Assembly Bill 32), which gave a new impetus to measuring and reducing energy use and emissions. The goal California set with AB 32 is to reduce emissions to 1990 levels by the year 2020. Governor Arnold Schwarzenegger’s Executive Order S-3-05 set an even more aggressive goal—80% below 1990 levels by 2050—and identified local governments as key partners in reaching these goals. Thanks to aggressive statewide programs, California’s emissions have remained relatively stable over the past 15 years. According to the Energy Information Administration of the U.S. Department of Energy, only Vermont, New York, Idaho, and Rhode Island have smaller per capita footprints than California. The California Air Resources Board (CARB) has been instructed to implement AB 32. Its Climate Change Scoping Plan was approved in 2008 and readopted in 2011 and outlines the state’s plan to achieve GHG reductions required in AB 32.8 In the Scoping Plan, CARB encourages local governments to adopt a reduction goal for municipal operations emissions and move towards establishing similar goals for community wide emissions that parallel the state’s commitment to reduce GHGs. While no directives have been issued on AB 32 implementation for local governments at this time, activity in the realm of emissions measuring and reduction is ramping up:
On January 1, 2012, California’s Cap-and-Trade regulation became effective. Part of the state’s plan to meet AB 32 targets, this plan assigns 85% of all major emitters a “cap” on emissions, and forces them to either reduce emissions to meet the cap or to buy (or “trade” for) offsets to meet their target.
8 “Climate Change Scoping Plan: A Framework for Change,” California Air Resources Board, Pursuant to AB 32: The
California Global Warming Solutions Act, December 2008.

Cathedral City 2013 Climate Action Plan 11
On June 4, 2012, separate emissions reductions targets (8% below 2005 levels) for the Southern California region (which includes Cathedral City) were approved as part of Senate Bill 375 legislation. SB 375, originally passed in 2008, seeks to limit emissions through transportation and land use planning. The California Air Resources Board and the South Coast Air Quality Management District have taken the lead on implementing action to meet SB 375 goals. The Southern California Association of Governments has prepared a Sustainable Communities Strategy consistent with SB 375 for the region including CVAG’s area.
The California Attorney General continues to monitor and actively challenge GHG inventories or other aspects of environmental impact plans that are not deemed adequate. The most recent case occurred in January 2012, when the adequacy of the Environmental Impact Report certified by the San Diego Association of Governments, for its 2050 Regional Transportation Plan, was challenged.
California Environmental Quality Act CEQA compliance has been completed as part of the consideration of this Climate Action Plan.
In an effort to stay ahead of impending regulations, this Climate Action Plan defines the City of Cathedral City’s goal of complying, at a minimum, with statewide mandates to reduce emissions. At the same time, through considered action, Cathedral City intends to:
Increase energy efficiency in local government operations and in community activities
Create new jobs associated with smart energy management
Save money now being spent for energy and establish a revolving fund whereby municipal energy savings will be available for municipal and community programs to reduce GHG emissions
Maintain or increase the comfortable desert lifestyle of residents and visitors alike
Bring the Coachella Valley Association of Governments’ jurisdictions together for effective regional climate planning
External Factors
Factors outside of the City’s control will influence emissions, often to its benefit. For example, electricity production is getting cleaner, thanks to the state’s Renewable Portfolio Standard (RPS), requiring that utility energy portfolios include ever higher percentages of

Cathedral City 2013 Climate Action Plan 12
“renewable energy.”9 The state also regulates the efficiency levels of new construction, with ever-more-stringent standards incorporated into each three-year cycle of Title 24 updates. In 2008, the California Public Utilities Commission adopted California’s first “Long Term Energy Efficiency Strategic Plan” through 2020. It offers strategies to achieve greater levels of efficiency across all electric and natural gas use, including working toward goals for all new construction. The goal for all new residential construction is to be zero net energy by 2020, and for all new commercial construction to follow by 2030. California’s Low-Carbon Fuel Standard requires that the mix of fuel sold in the Californian market meets declining targets for greenhouse gas (GHG) emissions – a reduction of at least 10 percent in carbon intensity by 2020. These factors mean that business-as-usual will be less carbon intensive. The factors are emissions benefits to local jurisdictions, while imposing no direct costs.
California Leadership in Energy Efficiency
California is the nation’s leader for energy efficiency and conservation. Its impressive track record began in 1974 with the formation of the California Energy Commission (CEC). Since then, and as depicted in the following graphic, although population has increased, per capita energy use in California has stayed relatively stable, while energy use per capita in the United States has increased 50%.10 California’s efforts have had a profoundly positive effect in terms of driving down GHG emissions and have saved Californians billions of dollars in energy costs.
9 The Renewable Portfolio Standard (RPS) defines the percentage of renewables that California’s investor-owned
utilities have to achieve by specific dates. Utilities achieved a 20% RPS by 2010 and are now directed to reach 33% with eligible renewable generation resources by 2020. 10
Integrated Energy Policy Report, Figure 2, California Energy Commission, 2007.

Cathedral City 2013 Climate Action Plan 13
Figure 2: California vs. U.S. Per Capita Electricity Consumption, 1960–2004
Concerns about GHG concentrations increasing to intolerable levels have been growing for decades. By the turn of the century, the Intergovernmental Panel on Climate Change (IPCC) had forged a broad consensus that man’s activity on earth (“anthropogenic” activity) is having an effect, and that climate patterns will change, and sea levels will rise.
California’s Emissions 2009
California emitted 452.97 million tonnes of GHG emissions in 2009, approximately 12.2 tonnes per capita.11 Of this, the largest emitters were transportation (172 million tonnes), electric power (104), residential and commercial fuel use (43), industry (81), agriculture—livestock, fertilizers, and general fuel use (32), and waste streams and landfills (7.3). Emissions were 5.8% lower in 2009 than 2008. Based on 2009 data, the state is 25 million tonnes from its 427 million tonne 1990 footprint goal.
Utility Leadership
Located within the Coachella Valley, and as a member of the Coachella Valley Association of Governments, Cathedral City has benefitted from the support of local utilities. Southern California Edison, Southern California Gas, Desert Water Agency, and the Coachella Valley
11
State of California Greenhouse Gas Emissions Inventory, California Air Resources Board, April 2012. This edition of the inventory covers the years 2000–2009.

Cathedral City 2013 Climate Action Plan 14
Water District provide programs and services that have helped their customers save resources and money.
The Planning Process
This Climate Action Plan fits within an umbrella of sustainability promoted by the Green for Life program. The program includes a number of tools to help local governments become more efficient, create savings, promote economic development and jobs, and stem the flow of dollars out of their communities and the region. The process is necessarily integrated; involving all forms of energy, water, and materials from the life cycle of source to disposal. This Climate Action Plan addresses the GHG impact of our lives in seven spheres of activity related to our daily lives. The spheres address:
1. Where We Live (Residential)
2. Where We Work (Business)
3. How We Build (Building)
4. How We Get Around (Transportation)
5. How We Govern (Municipal)
6. Where We Visit and Play (Hospitality/Recreation)
7. How We Teach and Learn (Education) For each sphere, the Plan suggests a number of policies, programs, and initiatives that can be implemented by Cathedral City to meet its reduction goals. The initiatives are also color-coded,

Cathedral City 2013 Climate Action Plan 15
and linked with the Greenhouse Gas Inventory to track progress by sector, also known as “focus areas,” as presented in the legend:
Commercial Buildings
Cross-Cutting Initiatives
Government Initiatives
Renewable Energy
Residential Buildings
Solid Waste
Special Focus Area
Transportation
Water/Wastewater
Each recommendation carries information about how the measure would impact the community and what it may cost. This Plan presents measures for immediate implementation, and which will be implemented in years to come. Phase I measures are considered short-term and will be implemented in the next two years, 2013–2014. Phase II measures follow in 2015–2017. Phase III covers the 2018–2020 timeframe.
Implementation
Phases
I II III
2018-2020 2015-2017 2013-2014

Cathedral City 2013 Climate Action Plan 16
Calculating Potential Savings
Estimating the savings results of different energy actions or savings programs is an imprecise but instructive exercise. The measures recommended in this report were approached with these questions in mind:
Has the measure been successfully implemented elsewhere? Directed research uncovers details on hundreds of programs that have been sponsored by utilities around the country and around the world. Closer to home, years of experience with both the design and the implementation of programs for Southern California Edison and Southern California Gas provides a strong basis for predicting the likely uptake of a given program in the Coachella and Palo Verde valleys as well as other desert regions. Both external and internal resources were used in predicting costs and results of the measures included in the CAP.
What special tools for measuring program results are available from the utilities? The Statewide Energy Efficiency Collaborative (SEEC) provides support to cities and counties to help reduce greenhouse gas emissions and save energy. The partnership, consisting of non-profits and California’s four investor-owned utilities, provides tools at no cost to users. SEEC’s Community GHG Forecast Assistant is a spreadsheet designed to perform business-as-usual forecasts, including the effects of statewide and federally implemented programs such as fuel economy standards and the Renewable Portfolio Standard. Cathedral City’s 2010 greenhouse gas emissions were entered into the spreadsheet, then; using growth rates projected by Riverside County Center for Demographic Research, business-as-usual emissions were estimated—with and without the impacts of federal and state programs.
How does Local Governments for Sustainability (ICLEI) help quantify these reduction measures? The GHG Inventory was completed using the Clean Air and Climate Protection (CACP) Software, the industry standard as developed by ICLEI. (The group was formed under the name International Council for Local Environmental Initiatives, and has retained the acronym.) ICLEI’s Climate and Air Pollution Planning Assistant (CAPPA) helps local governments identify and quantify potential energy and carbon-reduction measures. CAPPA provides more than 100 strategies for reducing emissions and energy. Each strategy estimates emissions savings through a set of assumptions that can be easily adjusted by the user. In the case of Cathedral City, assumptions were adjusted to reflect the climate and electricity profile of the City.
How can the results of “community outreach programs” be measured? Many utility savings programs have been measured for their effectiveness, both from the

Cathedral City 2013 Climate Action Plan 17
point of view of the utility and of the consumer. The results of any given program must consider, among other things, if an incentive is offered, how many people would have made the change anyway (“free ridership”), and the utility’s built-in bias about energy savings. (Less energy used means less revenue to the utility.) Uptake in the recommended programs and measures for this CAP was estimated based on experience and calculations; actual savings will be tracked.

Cathedral City 2013 Climate Action Plan 18
AB 32 Target- Reduce
55,909 Tonnes per/year
By 2020
Largest Community Emissions
Over 39% From Electricity
2010 Emissions
236,863 Metric Tonnes of CO2e
III. 2013 Greenhouse Gas Inventory Results
Cathedral City has completed the first formal step on the path to sustainability by developing the City of Cathedral City 2013 GHG Inventory with a baseline year of 2010. This inventory provides a detailed analysis of the City’s “carbon footprint,” showing the sources and sectors of emissions, highlighting opportunities for emissions reductions that make sense for Cathedral City. Cathedral City’s inventory is complemented by the “Briefing on Climate Action Planning for Elected Officials in the CVAG Region” prepared by EcoMotion for CVAG and its member cities and tribes.12 It compiles the results of fourteen greenhouse gas inventories prepared thus far in the Coachella and Palo Verde valleys, determining gross and net emissions and opportunities for regional climate protection.
Highlights of the Greenhouse Gas Inventory for Cathedral City are below.
Cathedral City was responsible for 183,424 tonnes of greenhouse gas emissions in 1990.
In 2010, Cathedral City emitted 236,863 metric tons (or tonnes) of CO2e.
To meet AB 32 targets, the City needs to reduce its GHG emissions by 55,909 tonnes by 2020.
In 2010, the largest percentage of emissions—over 39%—came from the electricity used to power the City’s homes, businesses, resorts, fountains, street lights, etc.
12
Briefing on Climate Action Planning for Elected Officials in the CVAG Region. Prepared by EcoMotion for the Coachella Valley Association of Governments, May 2013.

Cathedral City 2013 Climate Action Plan 19
The community’s total emissions came from a number of sources, as shown in Figure 3.
Figure 3: Cathedral City 2010 Community Emissions by Source (Tonnes CO2e)
Emissions Reductions Goals
Figure 4: Cathedral City Emissions Forecasted to 2020
Figure 4 summarizes the position of Cathedral City based on available data from 1990, 2005, and 2010. The light blue line shows the Business-as-Usual trajectory the City will follow given projected population growth and implementation of state and federal emissions reduction programs. The darker green line shows the 1990 emissions levels based on 2010 backcasted estimates. The dashed line represents the path that the City must follow to achieve 1990 emissions reduction goals, as shown below.
Electricity 39.94%
Natural Gas 17.23%
Propane 0.17%
Solid Waste 3.05%
Wastewater Treatment
0.03%
Refrigerants 8.18%
Fertilizer Application
0.12%
Transportation Fuel
31.27%
100,000
120,000
140,000
160,000
180,000
200,000
220,000
240,000
260,000
280,000
300,000
1990 1995 2000 2005 2010 2015 2020
Tota
l Em
issi
on
s (t
on
ne
s C
O2e
)
Business-as-Usual (BAU) Emissions
AB 32 Target
1990 Emissions

Cathedral City 2013 Climate Action Plan 20
Table 2: Cathedral City's Projected Emissions to 2020
Scenario Total Emissions (Tonnes CO2e)
Tonnes over 1990
% Reduction Needed
1990 Emissions Level 183,424 - -
2010 Baseline 236,863 53,439 22.6%
2020 Business-as-Usual 239,333 55,909 23.4%
Portfolio of Savings Measures
Informed by the GHG Inventory, and with goals set, the Plan presents savings measures to drop emissions as graphically represented below.
Figure 5: Emissions Reduction Wedges
The “wedges” depicts broad areas/spheres of savings measures. In the absence of federal and state programs, the emissions would be much greater. The impact of federal and state programs will reduce emissions from current levels, but not enough to reach the 1990 levels. This Climate Action Plan presents specific measures for each of three phases of implementation to reach the AB 32 goal.
2010 2011 2012 2013 2014 2015 2016 2017 2018 2019 2020
Federal and State Program Reductions
Where We Live
Where We Work
How We Build
How We Get Around
How We Govern
Where We Visit and Play
How We Teach and Learn
Business-as-Usual (BAU) Emissions
Path to AB 32 Targets
1990 Emissions

Cathedral City 2013 Climate Action Plan 21
IV. Greenhouse Gas Reduction Opportunities
Hundreds of opportunities for GHG reductions have been examined by Cathedral City and its Green for Life consultants. They cover seven spheres of daily activity, and numerous types of initiatives within each sphere. A portfolio of 77 measures is presented that represents 56,087 tonnes of annual CO2e savings, over the required 55,909 tonnes to reach compliance with AB 32 levels.
An investment of just over $2 million in eight years will leverage over $21 million in community savings, while creating 210 full-time jobs.
The measures shown in this Plan have been selected from suggestions and recommendations from interviews with City staff, from the public, and from best practices gleaned from around the country. Each measure has been chosen based on its suitability to the local climate, cost to the City, and its efficacy and “do-ability” in the current economic climate. A portfolio of measures will begin the process of meeting the City’s emissions reduction goals. Measures are color-coded to link specific measures to the focus areas within the City’s Greenhouse Gas Inventory.
Table 3: Climate Action Measure Totals by Sphere
Sphere Annual Savings (Tonnes CO2e)
Job Creation Estimate
Annual Savings Implementation
Cost to City
Live 19,275 86 $8,585,635 $159,000
Work 8,822 37 $3,713,665 $45,000
Build 1,884 9 $920,571 $225,500
Mobility 7,035 21 $2,094,706 $397,000
Govern 11,285 31 $3,072,943 $1,149,055
Recreate 4,484 9 $947,360 $75,000
Learn 3,303 17 $1,699,555 $34,000
Totals: 56,087 210 $21,034,435 $2,084,555
Assumptions for costs and for savings were developed as follows:
Costs were assumed to be those that the local government could bear (as opposed to the individual or business that might also participate in the program or take the action). In many cases, costs for measures involve only estimated level of effort for the appropriate staff person. Given stretched staff time already, the assumption is that the service would need to be subcontracted. If the City prefers to use staff time, absolute costs will be lower or possibly non-existent.

Cathedral City 2013 Climate Action Plan 22
As described earlier, savings figures (in tonnes CO2e) were calculated using different planning tools (the CACP calculator13 and the CAPPA14 tool). Data from other communities’ experience with similar programs was also used to help set uptake parameters.
Many assumptions were formulated based on the local government’s 2010 population and number of residential units. In Cathedral City, the population figure used was 51,042 and the household units figure was 17,04715.
Notes on Tables:
For each sphere of activity, a table summarizes suitable emissions mitigation measures. Later in the text, tables are presented that list measures planned for each phase of activity. Comprehensive tables ranked by the cost-effectiveness of all measures (with assumptions), and that rank initiatives’ cost to the city (as well as kWh savings) are in the Appendix.
Where We Live (Residential)
Household energy conservation and efficiency
Household water conservation and efficiency
Waste management and recycling
Renewable energy systems
Community education Cathedral City has a track record of promoting residential programs, from high efficiency pool pumps to energy efficient lighting to desert landscaping. In some instances, the City has even added its own incentives in addition to Southern California Edison incentives. Since homes alone account for a large percentage of electricity use in the community, there is still considerable opportunity for efficiency gains and GHG reductions. Cathedral City can promote simple steps for homeowners—encouraging them to replace light bulbs, to exchange old, inefficient appliances for new Energy Star varieties, and to undertake sustainable and energy efficient remodeling projects. The Voluntary Green Building Program offers valuable remodeling suggestions, including water conservation programs. A decrease in water usage is associated with electricity costs embedded in water pumping and delivery. The City can support more sophisticated steps including insulation and major heating, ventilation and air conditioning (HVAC) upgrades that make financial sense. Air conditioning is
13
CACP – Clean Air and Climate Protection software, by Local Governments for Sustainability USA (ICLEI), is a GHG accounting package specifically designed to support climate action planning. 14
CAPPA -- Climate and Air Pollution Planning Assistant, an ICLEI decision support tool designed to help U.S. local governments explore, identify, and analyze potential climate and air pollution emissions reduction opportunities. 15
2010 U.S. Census Data

Cathedral City 2013 Climate Action Plan 23
the biggest electricity use in homes in the City. The City will continue to promote retrofits that payback quickly as well as support regional Property Assessed Clean Energy (PACE) financing. Through PACE, financing is provided for energy upgrades and repaid via a property tax assessment. CVAG is leading the regional PACE initiative with participation by its member jurisdictions; it is anticipated that such a program will be operable by late 2013. Press releases and articles in the City’s newsletter can be released about residents that have invested in GHG emissions reduction activities to demonstrate the values of sustainable energy use to their neighbors and community. City staff will be trained, as part of the Green for Life program, to offer assistance to city residents regarding energy efficiency upgrades and retrofits now available. The Voluntary Green Building Program helps staff show property owners how to integrate energy efficiency and green building into a dwelling remodel, a new building, or an emergency repair or replacement. Tables that rank the cost-effectiveness of each measure, and that rank initiatives’ cost to the City are found in the Appendix.
Table 4: Savings Measures for “Where We Live”
Sphere GHG Sector
Linkage Measure Phase
Annual Savings
(Tonnes CO2e)
Job Creation Estimate
Annual Savings
Estimated Implementation
Cost to City
LIVE - 1 Residential Buildings
Pool Pumps: Promote high-efficiency, variable speed pool pumps to households at community fairs and retail outlets with a goal to achieve 1,000 pumps
II 493 3.5 $354,384 $50,000
LIVE - 2 Residential Buildings
Energy-Efficient Lighting: Work with the DCEP to acquire 12,000 compact fluorescent lamps and LEDs for giveaways to demonstrate their value in homes and leverage ten times the number in household and business applications
I 1,990 12.0 $1,202,256 $6,000
LIVE - 3 Residential Buildings
Peak Demand Reduction: Partner with SCE to provide local promotion of the residential Summer Discount Program to cut peak demand in 10% of the housing stock
I 277 2.0 $199,414 $2,000
LIVE - 4 Residential Buildings
Household Efficiency Audits: Partner with SCE and SCG to provide local promotion for the Home Energy Efficiency Survey to "self audit" homes
II 887 4.6 $464,321 $2,500
LIVE - 5 Residential Buildings
Plan Checking and Permitting: Expedite plan check and permitting process for energy-efficiency measures, energy efficient remodels, and renewable energy installations to reduce carbon emissions
II 254 1.4 $144,419 $2,000
LIVE - 6 Residential Buildings
Residential PACE: Partner and aggressively promote Residential PACE Program with a goal to reach 25% of homes with property-secured funding for 100% of the cost of energy upgrades and renewable energy systems in eight years
I 8,792 46.7 $4,667,952 $16,000
Cathedral City 2013 Climate Action Plan 24
Sphere GHG Sector
Linkage Measure Phase
Annual Savings
(Tonnes CO2e)
Job Creation Estimate
Annual Savings
Estimated Implementation
Cost to City
LIVE - 7 Residential Buildings
On-Bill Finance/Repayment: Partner with SCE and SCG to locally promote on-bill financing/repayment for residential energy efficiency retrofits in 15% of housing stock
II 1,616 4.1 $406,686 $2,000
LIVE - 8 Solid Waste Solid Waste Diversion: Increase solid waste diversion to achieve an average annual goal of 55% through 2015
I 1,525 0.0 $5,000
LIVE - 9 Solid Waste Solid Waste Diversion: Increase solid waste diversion to achieve an average annual goal of 65% through 2020
III 2,545 0.0 $5,000
LIVE - 10 Solid Waste Solid Waste Pick-Up: Restructure and coordinate bulky and regular waste pick-up to maximize efficiency and reduce VMT
I 14 1.3 $133,920 $1,000
LIVE - 11 Water Landscaper Certification: Require all licensed landscapers to be certified by CVAG
I 156 2.0 $195,600 $5,000
LIVE - 12 Water Water Conservation Ordinance: Build on and exceed current CVWD water conservation ordinance by 15% community-wide by 2020
I 508 8.2 $816,657 $5,000
LIVE - 13 Water
Gray water-Ready Ordinance: Require all new residential development to be constructed for easy implementation of gray water systems that redirect water from wash basins, showers, and tubs
II 3 0.0 $26 $2,500
LIVE - 14 Water
Drought Tolerant Planting: Promote and augment City, DWA and CVWD rebates for drought tolerant planting, turf replacement and buy-back
II 215 0.0 $55,000
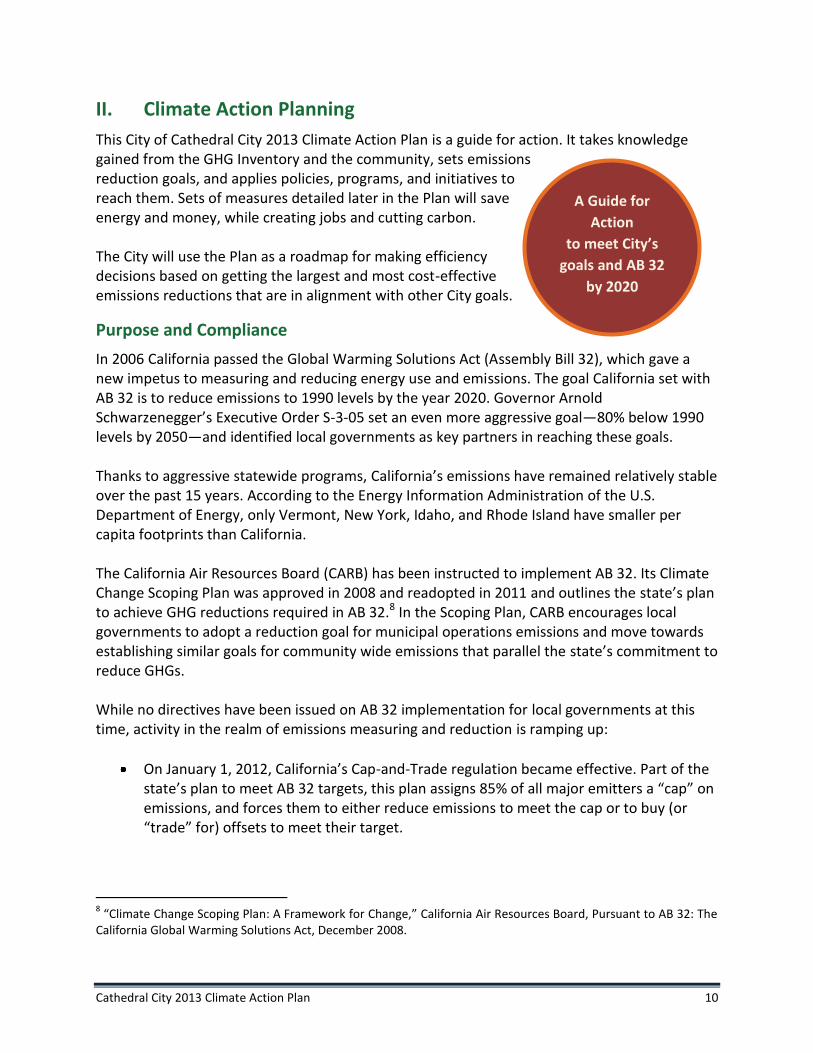
Residential Buildings 7 14,309 74 $7,439,432 $80,500
Solid Waste 3 4,084 1 $133,920 $11,000
Water 4 882 10 $1,012,283 $67,500
Sub-Total 14 19,275 86 $8,585,635 $159,000
Where We Work (Business)
Workplace energy conservation and efficiency
Workplace water conservation and efficiency
Materials management and recycling
Transportation and telecommuting The City of Cathedral City is committed to creating healthy office and work environments as an important part of a sustainable lifestyle in the community. Given the percent of time that many residents spend at work, the focus on “Where We Work” will have multiple benefits. For Cathedral City, continual business improvement is essential in creating jobs and supporting ongoing economic development. Programs that reduce the stress of commuting, for example,

Cathedral City 2013 Climate Action Plan 25
add to employee satisfaction, improve productivity, and cut transportation emissions. Studies show that green building upgrades can cut operating costs, lead to decreased illnesses and absenteeism and longer-term tenants and, again, to increased productivity. The City can have an impact on the way supplies and raw materials are delivered, and on how excess or waste materials are disposed of. For example, Cathedral City is planning to implement pilot restaurant composting program.
Table 5: Savings Measures for “Where We Work”
Sphere GHG Sector
Linkage Measure Phase
Annual Savings
(Tonnes CO2e)
Job Creation Estimate
Annual Savings
Estimated Implementation
Cost to City
WORK - 1 Commercial
Buildings
Commercial Energy Audits: Work with DCEP to promote energy audits for 1,000,000 square feet of commercial buildings and confirm replacement/upgrade schedules
III 730 2.5 $245,658 $12,000
WORK - 2 Commercial
Buildings
Peak Demand Reduction: Collaborate with SCE and encourage 200 businesses to enroll in Energy Efficiency and Demand Response programs such as the Summer Discount Program
I 482 2.4 $244,000 $2,000
WORK - 3 Commercial
Buildings
Energy-Efficient, Commercial-Sector Lighting: With DCEP promote and leverage existing incentives for efficient lighting with special local focus on building owner education and action with goal to eliminate any remaining T-12 lamps in commercial buildings
II 704 2.6 $258,930 $5,000
WORK - 4 Commercial
Buildings
"The Temperature Club:" Promote community partnership through policies to adjust indoor temperatures to save/degree
I 97 0.5 $48,450 $2,000
WORK - 5 Commercial
Buildings
Commercial On-Bill Financing/Repayment: Encourage On-Bill Financing/Repayment through SCE, SCG with green messaging and teamwork in the community
II 1,440 6.1 $608,230 $2,000
WORK - 6 Government
Initiatives
Commercial PACE Program: Partner and aggressively promote commercial PACE program to provide commercial property owners —from retail to resorts—with property-secured funding for 100% of the cost of energy efficiency upgrades/renewable energy installations
II 5,129 21.3 $2,128,440 $5,000
WORK - 7 Solid Waste
Food Waste Composting at Restaurants: Restaurant composting program for food waste with a goal to reach all restaurants that serve more than 100 meals a day
I 47 0.5 $51,200 $5,000
WORK - 8 Transportation
Car-Pooling and Mass Transit: Promote "Shared Vehicle at Work" programs with a goal to increase carpooling and mass transit by 20% with a "guaranteed-ride home"
II 114 0.2 $22,652 $2,000
WORK - 9 Water
Water Conservation Ordinance: Build on ordinance with goal to exceed current commercial-sector water conservation ordinance by 20% community-wide by 2020
II 79 1.1 $106,105 $10,000

Cathedral City 2013 Climate Action Plan 26
Date Palm Drive Corridor Compass Blueprint Project
Sphere GHG Sector
Linkage Measure Phase
Annual Savings
(Tonnes CO2e)
Job Creation Estimate
Annual Savings
Estimated Implementation
Cost to City
Commercial Buildings 5 3,453 14 $1,405,268 $23,000
Government Initiatives 1 5,129 21 $2,128,440 $5,000
Solid Waste 1 47 1 $51,200 $5,000
Transportation 1 114 0 $22,652 $2,000
Water 1 79 1 $106,105 $10,000
Sub-Total 9 8,822 37 $3,713,665 $45,000
How We Build (Building)
Green building materials
Codes and standards
Land use policy
Lighting, HVAC systems, etc.
Renewable energy system integration Given the extreme desert conditions, “How We Build” is of great importance to Cathedral City and this Climate Action Plan.
“Building it right the first time” makes sense from all kinds of standpoints. While California has the nation’s leading building standards—thanks to Title 24—there are still ways for Cathedral City to make buildings healthier and more sustainable. The Green for Life voluntary Green Building Program serves as a catalyst in the process of creating win-win-win solutions between costs, health, and security. It prepares Valley builders and buyers for the benefits of green and highly efficient building.
Starting in 2010, new development in Cathedral City slowed, and it continues to remain below historical levels. Based on Riverside County projections, however, Cathedral City can anticipate growth of approximately 20% over the next 10 years. Whether this is realized or not, the City has the opportunity now to set new neighborhood development requirements and higher standards for buildings as part of the Green for Life Voluntary Green Building Program, in preparation for new statewide standards scheduled to take effect in 2014. As an example of this leadership, the “Date Palm Drive Corridor Plan” states, “the plan aims to highlight

Cathedral City 2013 Climate Action Plan 27
Cathedral City’s many assets, support the improved performance of existing businesses, and establish a competitive advantage to attract new vitality to the Date Palm Drive Corridor in the near future. The biggest opportunities for building energy efficiency lie with existing buildings. As with residential buildings, commercial and city buildings can benefit from efficiency upgrades and better energy management. They may also be able to contribute renewable sources of electricity by way of solar or wind installations, thereby reducing emissions from carbon-based sources. The City will continue to fully collaborate with local utilities and county or state programs to help offset the costs of building upgrades and to promote on-bill financing and repayment. It will also support the development of a regional PACE program for both residential and commercial retrofits. Cathedral City is a participant in the Coachella Valley Multiple Species Habitat Conservation Plan (CVMSHCP) which conserves open space and habitat, while effectively focusing development in less sensitive areas, thus limiting sprawl and reducing vehicle miles traveled (SB 375 requires vehicle miles traveled reductions). This visionary plan is another example that how and where we build can promote GHG emissions reductions.
Cathedral City 2013 Climate Action Plan 28
Table 6: Savings Measures for “How We Build”
Sphere GHG Sector
Linkage Measure Phase
Annual Savings
(Tonnes CO2e)
Job Creation Estimate
Annual Savings
Estimated Implementation
Cost to City
BUILD - 1 Commercial
Buildings
Lighting Controls: Promote SCE programs to encourage energy-efficient lighting linked to building controls and occupancy sensors
II 205 0.8 $75,521 $15,000
BUILD - 2 Commercial
Buildings
"Cool Roofs": Promote the installation of reflective roofing on commercial properties in the community with recognition for first ten early adopters
II 15 0.1 $8,714 $15,000
BUILD - 3 Government
Initiatives
Green Building Program: Promote Voluntary Green Building Program to prepare for enhanced Title 24 requirements and green building standards
I 548 2.7 $270,015 $2,500
BUILD - 4 Government
Initiatives
Green Building Support Services: Advance the Voluntary Green Building Program to mandatory green building requirement with technical support services
II 548 2.7 $270,015 $50,000
BUILD - 5 Government
Initiatives
New and Efficient Construction: Promote the Savings by Design Program from SCE for new commercial buildings.
II 93 0.5 $47,215 $1,000
BUILD - 6 Government
Initiatives
Plan Checks and Permitting: Expedite plan check and permitting process for green building projects and remodels
II 154 0.9 $92,736 $1,000
BUILD - 7 Residential Buildings
Shade Trees: Promote properly sited and selected shade trees in 100% of new construction to reduce heat islands and provide shade to offset air conditioning
I 35 0.1 $12,240 $112,000
BUILD - 8 Residential Buildings
Affordable Housing: Promote the construction of energy-efficient affordable housing with private-sector partners
III 193 1.0 $96,900 $25,000
BUILD - 9 Residential Buildings
Green Homes Tours: Administer “Green Homes Tours” annually to showcase six projects each year
II 93 0.5 $47,215 $4,000
Commercial Buildings 2 220 1 $84,235 $30,000
Government Initiatives 4 1,343 7 $679,981 $54,500
Residential Buildings 3 321 2 $156,355 $141,000
Sub-Total 9 1,884 9 $920,571 $225,500
How We Get Around (Transportation)
Alternative fuels (EVs, hybrids, etc.)
Trip reduction, optimization
Biking and walking
Buses, shuttles, and transit oriented development
Transportation infrastructure
Efficient driving habits through training and ordinances

Cathedral City 2013 Climate Action Plan 29
In Cathedral City, emissions from transportation and “How We Get Around” represent the second largest source of emissions, behind electricity. “How We Get Around” shapes the community, and has a major footprint. Thanks to state and regional manufacturing standards and technologies, tailpipe emissions are largely invisible. But because of its location to the east of Los Angeles, prevailing winds drive pollution into the Valley on a daily basis. Air quality and local and regional pollution remain a key issue in the Coachella Valley. Transportation covers a wide swath of opportunity. It tackles fundamental issues such as the driving patterns associated with land use, the efficiency of vehicles, as well as the use of alternative fuels and alternative methods of getting around. The City of Cathedral City has already made a number of changes in the way it manages its roadways and fleet. Now it considers additional measures. CVAG is planning a regional transportation alternative called CV-Link that will have significant health and wellness benefits. The CV-Link would extend along the Whitewater River and connect all nine Coachella Valley cities with a trail system for walkers, bikes, and neighborhood electric vehicles. Such a system will create opportunities for recreational activities while reducing vehicle reliance and harmful emissions. Cathedral City will work with regional planners to carefully consider and map out local access points to the proposed trail system as well as potential charging station locations for plug-in electric and neighborhood electric vehicles.
Table 7: Savings Measures for “How We Get Around”
Sphere GHG Sector
Linkage Measure Phase
Annual Savings
(Tonnes CO2e)
Job Creation Estimate
Annual Savings
Estimated Implementation
Cost to City
MOBILITY – 1 Transportation
Electric Vehicles: Promote the lease and purchase of electric vehicles in the community with recognition and preferential parking for participants. Goal of 250 vehicles
III 1,994 4.4 $444,164 $40,000
MOBILITY - 2 Transportation
Hybrid Vehicles: Promote the purchase of hybrid vehicles in the community with recognition and preferential parking for participants. Goal of 600 vehicles
III 1,974 7.3 $732,900 $100,000
MOBILITY - 3 Transportation "Golf Cars:" Craft and implement a “golf cars” ordinance to achieve minimum goal of 250 registered vehicles by 2020
II 287 1.1 $106,600 $2,000
MOBILITY - 4 Transportation
Charging Stations: Foster public/private partnerships to promote 10 additional public access EV charging stations for existing EV and NEV fleets
II 22 0.1 $8,358 $12,500

Cathedral City 2013 Climate Action Plan 30
Sphere GHG Sector
Linkage Measure Phase
Annual Savings
(Tonnes CO2e)
Job Creation Estimate
Annual Savings
Estimated Implementation
Cost to City
MOBILITY - 5 Transportation
Eco-Conscious Driving: Promote eco-conscious driving behavior to increase fuel efficiency by 5 - 10% and minimize emissions and maintenance. Aka "hyper-miling."
II 94 0.4 $35,000 $5,000
MOBILITY - 6 Transportation
Buses: Promote the benefits of buses with a goal to increase ridership by 1,000 daily riders, provide promotions and incentives for new riders
II 556 1.5 $151,449 $7,500
MOBILITY - 7 Transportation Biking and Walking: Expand bikeways, trails, and walking paths connecting residential neighborhoods and commerce
II 24 0.0 $4,620 $200,000
MOBILITY - 8 Transportation
Bike, Walking, NEV "Parkway:" Support Parkway 1e11 as a Valley amenity and means to alternative forms of transportation and to promote health in Cathedral City
III 25 0.0 $4,620 $5,000
MOBILITY - 9 Transportation White Bikes: Provide bicycles for daily trips using public/private partnership model
III 17 0.1 $6,485 $2,000
MOBILITY - 10 Transportation Bike Distribution: Provide 50 bikes to local residents during annual distribution for three years and part of an existing city program
I 39 0.1 $14,592 $1,000
MOBILITY - 11 Transportation
"Walking School Bus:" Collaborate with school district and neighborhood officials to create a Safe Routes to School ("Walking School Bus") program to increase walking to school by 10%
III 68 0.3 $25,137 $2,000
MOBILITY - 12 Transportation
Bus Route Maximization: Collaborate with SunLine officials to reform routes to promote smaller buses with more routes and frequencies with a goal to increase ridership by 1,500 riders
II 834 2.3 $227,172 $5,000
MOBILITY - 13 Transportation Van Pools: Partner and recognize all CC major employers with over 50 employees for van pools
III 287 1.1 $106,599 $5,000
MOBILITY - 14 Transportation
Senior Vehicle Tune-Ups: Introduce and implement "Senior Vehicle Diagnostic Program" to target and incentivize seniors to tune and maintain their vehicles on a regular basis
II 235 0.1 $11,655 $5,000
MOBILITY - 15 Transportation
Car Sharing: Promote ZIP and/or other Car Share programs through preferential parking and promotion with signage with a goal to serve 5% of existing drivers who each reduce their driving by 25%
II 579 2.2 $215,356 $5,000
Transportation 15 7,035 21 $2,094,706 $397,000
Sub-Total 15 7,035 21 $2,094,706 $397,000

Cathedral City 2013 Climate Action Plan 31
How We Govern (Municipal)
Energy management
Policies, codes, and ordinances
Economic development
Regional collaboration The City of Cathedral City’s operations are responsible for only 1.6% of total community emissions. Nevertheless, the City recognizes its disproportionately important role as a leader within the community. Cities can control the programs and policies they set for their own employees. City facilities can often be used as test beds for new technologies and pilot programs. Through leadership, Cathedral City intends to continue to set an example for the community and throughout the Coachella Valley. In conjunction with this Climate Action Plan, an Energy Action Plan for the City of Cathedral City has been adopted. This is a roadmap detailing steps the City can take to reduce its own, government operations. The following policies are measures that are directly under the City’s control to engage savings and to reduce emissions. For instance, the City can implement a “Solar Ready” ordinance that would require all new construction to be prepared for solar, including pre-wiring while roof joists and walls are exposed. These are presented in greater detail in the Exhibits.
List of Potential Ordinances to Affect Sustainability
Expedite plan checking for green and efficient new construction/major remodels
o Residential, Commercial
Waive permit fees for green and energy-efficient new construction/major remodels
o Residential, Commercial
Pass more restrictive water conservation ordinance
o Residential, Commercial
Mandate landscaper certification
Food waste composting ordinance for restaurants
Mandatory Green Building Program
Anti-Idling ordinance for commercial vehicles
Mandate that all municipal buildings are LEED Silver or better
Solar Ready ordinance for new construction
o Residential, Commercial
Cathedral City 2013 Climate Action Plan 32
City leadership can be seen in many areas, from land-use policies that encourage or dictate transportation requirements, to purchasing and maintenance policies, to regional collaborations and financing programs. Through outreach and education, the City can involve the community and recognize the accomplishments of individuals, neighborhoods and groups.
Table 8: Savings Measures for “How We Govern”
Sphere GHG Sector
Linkage Measure Phase
Annual Savings
(Tonnes CO2e)
Job Creation Estimate
Annual Savings
Estimated Implementation
Cost to City
GOVERN - 1 Cross-Cutting
Initiatives
Office of Energy Management: Continue to support the Office of Environmental Management and Sustainability to promote energy efficiency with designated staff member
I 2,300 2.3 $230,000 $15,000
GOVERN - 2 Cross-Cutting
Initiatives
Desert Cities Energy Partnership: Continue to actively partner with serving utilities to fully utilize energy efficiency and demand response programs in municipal facilities
I 2,250 9.8 $984,837 $2,000
GOVERN - 3 Government
Initiatives
Municipal Facility Efficiency Upgrades...Payback Threshold Policy: Establish energy policy within City's Energy Action Plan to invest in measures with less than a four-year, simple payback
I 20 0.1 $8,661 $28,200
GOVERN - 4 Government
Initiatives
Municipal Facility Efficiency Upgrades: Complete balance of municipal facility upgrades (after 4 year payback threshold compliance) to achieve 25% reduction from 2004 baseline
I 18 0.1 $8,020 $563,044
GOVERN - 5 Government
Initiatives
Municipal Facility Efficiency Upgrades: Complete 100% of remaining Energy Action Plan measures after 25 % savings has been realized (2015-2020)
III 16 0.1 $7,027 $493,311
GOVERN - 6 Government
Initiatives
Efficient and Green New Construction: Establish policy that 100% of new municipal buildings and major remodels adhere to Voluntary Green Building Program standards and are minimum LEED Silver or equivalent
II 158 0.6 $58,290 $2,000
GOVERN - 7 Government
Initiatives
Utility Manager Software: Maximize use of the Los Angeles County Energy Enterprise Management Information System (EEMIS) to manage municipal facilities
I 54 0.2 $22,893 $5,000
GOVERN - 8 Government
Initiatives
Benchmarking: Abide by Energy Benchmarking Program to gauge relative energy use and efficiency of municipal facilities
I 21 0.1 $9,219 $5,000
GOVERN - 9 Government
Initiatives
Retro Commissioning: Abide by the Retro-Commissioning (RCx) Program and guidelines for qualifying municipal buildings
I 21 0.1 $9,219 $2,000
GOVERN - 10 Government
Initiatives
Transit Oriented Development: Promote transit oriented development to foster development in line with mass transit corridors
II 1,475 1.5 $147,500 $5,000
GOVERN - 11 Government
Initiatives
Group Purchasing: Promote and participate in group purchasing of energy efficiency goods and services with other CVAG cities/tribes
III 72 0.4 $40,000 $2,000

Cathedral City 2013 Climate Action Plan 33
Sphere GHG Sector
Linkage Measure Phase
Annual Savings
(Tonnes CO2e)
Job Creation Estimate
Annual Savings
Estimated Implementation
Cost to City
GOVERN - 12 Government
Initiatives
Public/Private Partnerships: Explore private-public partnerships for renewable energy installations and energy-efficiency upgrades on municipal facilities (performance-based contracts and power purchase agreements).
III 3,098 5.1 $505,890 $10,000
GOVERN - 13 Renewable
Energy
Solar Ready Ordinance: Develop and implement an ordinance requiring 100% of new homes be solar ready (PV)
II 1,284 8.6 $863,587 $10,000
GOVERN - 14 Solid Waste
Recyclable Take-Out Containers: Promote/mandate take-out alternative containers with a goal to eliminate the use of polystyrene packaging
III 20 0.0 $5,000
GOVERN - 15 Transportation
Plug In Electric Vehicle Charging Stations: Seek grant funding to install 10 EV charging stations on public and private property and promote Plug In Electric Vehicles for public use
II 478 1.8 $177,800 $1,500
Cross-Cutting Initiatives 2 4,550 12 $1,214,837 $17,000
Government Initiatives 10 4,953 8 $816,719 $1,115,555
Renewable Energy 1 1,284 9 $863,587 $10,000
Solid Waste 1 20 0 $0 $5,000
Transportation 1 478 2 $177,800 $1,500
Sub-Total 15 11,285 31 $3,072,943 $1,149,055
Where We Visit and Play (Hospitality/Recreation)
Spa resorts, hotels, and restaurants
Golf courses and parks
Desert-appropriate landscaping
Water efficiency
Enhanced visitor transportation
The City of Cathedral City takes great pride in the quality of life within its borders and beyond. It’s a great place to visit and a great place to live. City leaders are focused on more of the same, if not better! No one wants sustainability to negatively impact the quality of life in Cathedral City.
This Climate Action Plan highlights ways that Cathedral City can at once enhance the visitor experience and lifestyle while becoming more sustainable. Gorgeous desert landscaping exemplifies this, as does elegant passive solar design that keeps buildings shaded and cool. This Plan finds win-win solutions, for instance making our buildings

Cathedral City 2013 Climate Action Plan 34
more comfortable, while more efficient; making our communities more livable while reducing our footprint. Cathedral City thrives on visitors, and recognizes the value of golf courses, resorts, hotels, clubs and special events to the City. These amenities will continue to be key elements in the sustainability program. The goal of this Plan is to promote efficiency, cut costs, and reduce emissions without impacting the visitor experience. A supporting objective will be to educate visitors to value a more sustainable desert experience.

Cathedral City 2013 Climate Action Plan 35
Table 9: Savings Measures for “Where We Visit and Play”
Sphere GHG Sector
Linkage Measure Phase
Annual Savings
(Tonnes CO2e)
Job Creation Estimate
Annual Savings
Estimated Implementation
Cost to City
RECREATE - 1 Commercial
Buildings
Net Zero Special Events: Build on Sustainability Coordinator's work and continue to work with the hospitality sector and require special purpose events to be sustainable with net zero energy and waste requirements
II 3 0.0 $1,000 $1,000
RECREATE - 2 Commercial
Buildings
Green Conferences: Build on Sustainability Coordinator's work and continue to work with hospitality sector to define and promote “green” conference venues, hotels, etc.
II 11 0.2 $20,000 $2,000
RECREATE - 3 Cross-Cutting
Initiatives
Comprehensive Pool Efficiency: Promote comprehensive pool efficiency including variable speed pool pumps, covers, wind breaks, and solar heating for 1,000 pools
II 493 3.5 $354,384 $4,000
RECREATE - 4 Government
Initiatives
Ball field Lighting Timers: Promote the installation of timers for all ball field or other recreational lighting at schools and city facilities
II 60 0.2 $22,076 $10,000
RECREATE - 5 Transportation
Visitor Shuttles: Collaborate with local hotels and resorts to support and establish effective point-to-point transportation for visitors, e.g. shuttles to airport, hotels, business district
I 3,496 1.6 $155,483 $50,000
RECREATE - 6 Transportation
Neighborhood Electric Vehicles: Design and promote Neighborhood Electric Vehicle program with a goal to achieve minimum of 50 NEVs for Valley residents and visitors
II 120 0.4 $44,450 $1,000
RECREATE - 7 Water Irrigation System Controls: Promote the installation of irrigation control sensors at parks and golf courses
II 102 1.3 $127,140 $1,000
RECREATE - 8 Water
Drought-Tolerant Landscaping: Promote reduced need for golf course irrigation through design and use of drought-tolerant plants
II 30 0.1 $10,927 $1,000
RECREATE - 9 Water
Golf Course Water Management Recognition: Promote highly efficient irrigation sensors, water pumping and delivery for golf courses with Council recognition
II 169 2.1 $211,900 $5,000
Commercial Buildings 2 14 0 $21,000 $3,000
Cross-Cutting Initiatives 1 493 4 $354,384 $4,000
Government Initiatives 1 60 0 $22,076 $10,000
Transportation 2 3,616 2 $199,933 $51,000
Water 3 301 3 $349,967 $7,000
Sub-Total 9 4,484 9 $947,360 $75,000

Cathedral City 2013 Climate Action Plan 36
How We Teach and Learn (Education)
Student education
Community centers and youth programs
Workforce development
Demonstration projects and community outreach Cathedral City recognizes that today’s students are tomorrow’s consumers. How we educate youth has a profound impact on the sustainability of Cathedral City, the region, state and even the planet. Cathedral City also recognizes its unique location at the center of solar, wind, and geothermal potential. The Coachella Valley already has a strong foundation in green certifications. The City will continue to support workforce development from a young age or through retraining the existing workforce. Cathedral City will support the continuum of training, starting in elementary schools with California teaching standards, augmented in local high schools thanks to the programs sponsored by the Coachella Valley Economic Partnership, and continuing at local institutions of higher learning: College of the Desert, California State University San Bernardino, and University of California Riverside Palm Desert. In addition to this, the Coachella Valley iHub, comprised of the Cities of Palm Springs, Cathedral City and Desert Hot Springs, works to provide “a wide variety of programs, services and incentives to start-up businesses focused on creating and developing clean technology. Training also takes place in homes and businesses throughout the community, as residents become aware of new opportunities and often, new incentives. The City understands its role in raising awareness and understanding of the benefits of sustainability. The City’s website will be used to further outreach to its residents and business owners and will be coupled with the efforts of the Green for Life website which has up-to-date information on green building and the further “greening” of the Southern California desert region.
While emissions reductions resulting from educational programs are inherently difficult to measure and laced with assumptions and scientific estimates, there is no doubt that ingrained, community-wide efforts can be more substantial and longer-lived than any short-term outside incentive program. Cathedral City values education and will continue to educate its residents of all ages about ways to “go green” for its multiple benefits.

Cathedral City 2013 Climate Action Plan 37
Table 10: Savings Measures for “How We Teach and Learn”
Sphere GHG Sector
Linkage Measure Phase
Annual Savings
(Tonnes CO2e)
Job Creation Estimate
Annual Savings
Estimated Implementation
Cost to City
LEARN - 1 Cross-Cutting
Initiatives
Save a Ton Campaign: Work with CVAG to develop and locally market the Save a Ton campaign, unlocking energy, dollar, and carbon savings in 30% of the housing stock
I 2,127 12.7 $1,269,914 $2,000
LEARN - 2 Cross-Cutting
Initiatives
Commercial Sector Green Business: Target and work with a minimum goal of 200 businesses for Green Business Program
III 1,052 3.7 $367,604 $10,000
LEARN - 3 Cross-Cutting
Initiatives
Green Building Lectures and Continuing Education: Provide lectures, seminars and training on green building based on guide and training materials emphasizing desert conditions and opportunities
II 91 0.5 $47,595 $5,000
LEARN - 4 Cross-Cutting
Initiatives
Community Energy Champions: Solicit nominations and promote a Community Energy Champion each year to show value of efficiency and its energy, dollar, and carbon savings
III 25 0.1 $14,442 $2,000
LEARN - 5 Cross-Cutting
Initiatives
Internships: Provide student internships in city government each year to focus on updates to the GHG inventory and the climate action plan and to promote energy efficiency in Cathedral City
III 4 0.0 $5,000
LEARN - 6 Cross-Cutting
Initiatives
Workforce Development: Promote workforce development in partnership with College of the Desert, UCR, and CSUSB to achieve 1,000 "green careers" by 2020
II 4 0.0 $10,000
Cross-Cutting Initiatives 6 3,303 17 $1,699,555 $34,000
Sub-Total 6 3,303 17 $1,699,555 $34,000

Cathedral City 2013 Climate Action Plan 38
V. Implementation
Timeline
This 2013 Climate Action Plan presents a course of action for the next eight years. Naturally measures will shift in implementation priority.
Phase I activities will be completed in calendar years 2013 and 2014.
Phase II activities will be implemented in the years 2015, 2016, and 2017.
Phase III activities will take place in 2018, 2019, and 2020.
Through a robust set of Phase I activities, the City can reduce its footprint by 24,817 tonnes annually by leveraging a variety of resources and partnerships.
The 77 measures and 3 phases represent a challenging,
but plausible and cost-effective scenario for emissions reductions. The following table presents a scenario for eight-year implementation, leveraging large community benefits in the process.
Summary of Measures by Phase
Phase # Measures Emissions Reduced
(Tonnes CO2e) Estimated Cost
to City Community
Savings
I 22 24,817 $836,744 $10,554,542
II 39 19,150 $524,500 $7,882,468
III 16 12,120 $723,311 $2,597,426
Totals: 77 56,087 $2,084,555 $21,034,435
The Summary of Measures by Greenhouse Gas Sector table below shows that the biggest emissions reductions will come from transportation and residential buildings, followed by government initiatives.
Summary of Measures by Greenhouse Gas Sector
GHG Sector Linkage #
Measures Annual Savings (Tonnes CO2e)
Job Creation Estimate
Annual Savings Estimated
Implementation Cost to City
Commercial Buildings 9 3,687 15 $1,510,503 $56,000
Cross-Cutting Initiatives 9 8,346 33 $3,268,776 $55,000
Government Initiatives 16 11,485 36 $3,647,216 $1,185,055
Renewable Energy 1 1,284 9 $863,587 $10,000
Residential Buildings 10 14,630 76 $7,595,787 $221,500
Solid Waste 5 4,151 2 $185,120 $21,000
Transportation 19 11,243 25 $2,495,091 $451,500
Water/Wastewater 8 1,262 15 $1,468,355 $84,500
GRAND TOTAL OF EMISSION MEASURES 77 56,087 210 $21,034,435 $2,084,555

Cathedral City 2013 Climate Action Plan 39
Phase I Activities
The table below presents a menu of suitable savings measures for Phase I implementation. Twenty-two (22) measures are included to achieve an emissions reduction of 24,817 tonnes at a gross cost of $836,744.
The 22 Phase I activities will achieve 24,817 tonnes of emissions reductions, 44% of the target.
These activities primarily rely on ordinances, public education, utility programs, regional financing, and public/private partnerships, rather than on direct outlays by the City, to achieve the goals.
Table 11: Phase I Measures
Sphere GHG Sector
Linkage Measure Phase
Annual Savings
(Tonnes CO2e)
Job Creation Estimate
Annual Savings
Estimated Implementation
Cost to City
WORK – 2 Commercial
Buildings
Peak Demand Reduction: Collaborate with SCE and encourage 200 businesses to enroll in Energy Efficiency and Demand Response programs such as the Summer Discount Program
I 482 2.4 $244,000 $2,000
WORK – 4 Commercial
Buildings
"The Temperature Club:" Promote community partnership through policies to adjust indoor temperatures to save/degree
I 97 0.5 $48,450 $2,000
GOVERN – 1 Cross-Cutting
Initiatives
Office of Energy Management: Continue to support the Office of Environmental Management and Sustainability to promote energy efficiency with designated staff member
I 2,300 2.3 $230,000 $15,000
GOVERN - 2 Cross-Cutting
Initiatives
Desert Cities Energy Partnership: Continue to actively partner with serving utilities to fully utilize energy efficiency and demand response programs in municipal facilities
I 2,250 9.8 $984,837 $2,000
LEARN - 1 Cross-Cutting
Initiatives
Save a Ton Campaign: Work with CVAG to develop and locally market the Save a Ton campaign, unlocking energy, dollar, and carbon savings in 30% of the housing stock
I 2,127 12.7 $1,269,914 $2,000
BUILD - 3 Government
Initiatives
Green Building Program: Adopt Voluntary Green Building Program to prepare for enhanced Title 24 requirements and green building standards
I 548 2.7 $270,015 $2,500
GOVERN - 3 Government
Initiatives
Municipal Facility Efficiency Upgrades...Payback Threshold Policy: Establish energy policy within City's Energy Action Plan to invest in measures with less than a four-year, simple payback
I 20 0.1 $8,661 $28,200
GOVERN - 4 Government
Initiatives
Municipal Facility Efficiency Upgrades: Complete balance of municipal facility upgrades (after 4 year payback threshold compliance) to achieve 25% reduction from 2004 baseline
I 18 0.1 $8,020 $563,044

Cathedral City 2013 Climate Action Plan 40
Sphere GHG Sector
Linkage Measure Phase
Annual Savings
(Tonnes CO2e)
Job Creation Estimate
Annual Savings
Estimated Implementation
Cost to City
GOVERN - 7 Government
Initiatives
Utility Manager Software: Maximize use of the Los Angeles County Energy Enterprise Management Information System (EEMIS) to manage municipal facilities
I 54 0.2 $22,893 $5,000
GOVERN - 8 Government
Initiatives
Benchmarking: Abide by Energy Benchmarking Program to gauge relative energy use and efficiency of municipal facilities
I 21 0.1 $9,219 $5,000
GOVERN - 9 Government
Initiatives
Retro Commissioning: Abide by the Retro-Commissioning (RCx) Program and guidelines for qualifying municipal buildings
I 21 0.1 $9,219 $2,000
LIVE - 2 Residential Buildings
Energy-Efficient Lighting: Work with the DCEP to acquire 12,000 compact fluorescent lamps and LEDs for giveaways to demonstrate their value in homes and leverage ten times the number in household and business applications
I 1,990 12.0 $1,202,256 $6,000
LIVE - 3 Residential Buildings
Peak Demand Reduction: Partner with SCE to provide local promotion of the residential Summer Discount Program to cut peak demand in 10% of the housing stock
I 277 2.0 $199,414 $2,000
LIVE - 6 Residential Buildings
Residential PACE: Partner and aggressively promote Residential PACE Program with a goal to reach 25% of homes with property-secured funding for 100% of the cost of energy upgrades and renewable energy systems in eight years
I 8,792 46.7 $4,667,952 $16,000
BUILD - 7 Residential Buildings
Shade Trees: Promote properly sited and selected shade trees in 100% of new construction to reduce heat islands and provide shade to offset air conditioning
I 35 0.1 $12,240 $112,000
LIVE - 8 Solid Waste Solid Waste Diversion: Increase solid waste diversion to achieve an average annual goal of 55% through 2015
I 1,525 0.0 $5,000
LIVE - 10 Solid Waste Solid Waste Pick-Up: Restructure and coordinate bulky and regular waste pick-up to maximize efficiency and reduce VMT
I 14 1.3 $133,920 $1,000
WORK - 7 Solid Waste
Food Waste Composting at Restaurants: Restaurant composting program for food waste with a goal to reach all restaurants that serve more than 100 meals a day
I 47 0.5 $51,200 $5,000
MOBILITY - 10 Transportation Bike Distribution: Provide 50 bikes to local residents during annual distribution for three years and part of an existing city program
I 39 0.1 $14,592 $1,000
RECREATE - 5 Transportation
Visitor Shuttles: Collaborate with local hotels and resorts to support and establish effective point-to-point transportation for visitors, e.g. shuttles to airport, hotels, business district
I 3,496 1.6 $155,483 $50,000
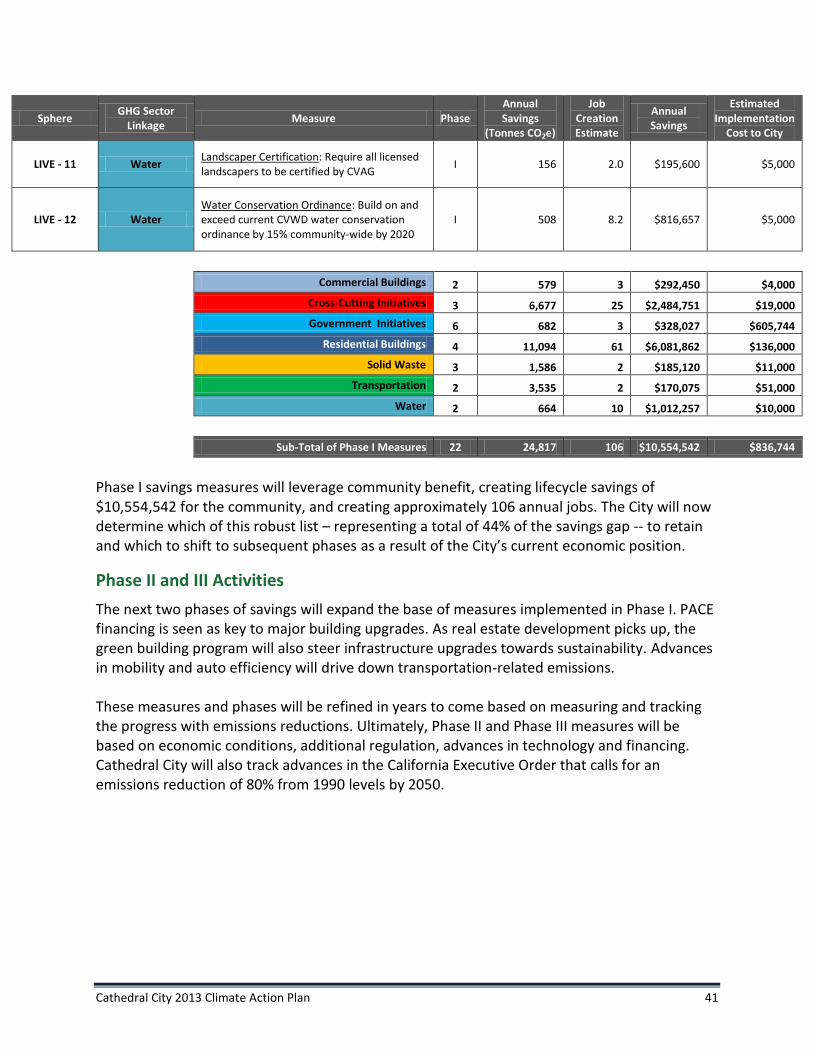
Cathedral City 2013 Climate Action Plan 41
Sphere GHG Sector
Linkage Measure Phase
Annual Savings
(Tonnes CO2e)
Job Creation Estimate
Annual Savings
Estimated Implementation
Cost to City
LIVE - 11 Water Landscaper Certification: Require all licensed landscapers to be certified by CVAG
I 156 2.0 $195,600 $5,000
LIVE - 12 Water Water Conservation Ordinance: Build on and exceed current CVWD water conservation ordinance by 15% community-wide by 2020
I 508 8.2 $816,657 $5,000
Commercial Buildings 2 579 3 $292,450 $4,000
Cross-Cutting Initiatives 3 6,677 25 $2,484,751 $19,000
Government Initiatives 6 682 3 $328,027 $605,744
Residential Buildings 4 11,094 61 $6,081,862 $136,000
Solid Waste 3 1,586 2 $185,120 $11,000
Transportation 2 3,535 2 $170,075 $51,000
Water 2 664 10 $1,012,257 $10,000
Sub-Total of Phase I Measures 22 24,817 106 $10,554,542 $836,744
Phase I savings measures will leverage community benefit, creating lifecycle savings of $10,554,542 for the community, and creating approximately 106 annual jobs. The City will now determine which of this robust list – representing a total of 44% of the savings gap -- to retain and which to shift to subsequent phases as a result of the City’s current economic position.
Phase II and III Activities
The next two phases of savings will expand the base of measures implemented in Phase I. PACE financing is seen as key to major building upgrades. As real estate development picks up, the green building program will also steer infrastructure upgrades towards sustainability. Advances in mobility and auto efficiency will drive down transportation-related emissions. These measures and phases will be refined in years to come based on measuring and tracking the progress with emissions reductions. Ultimately, Phase II and Phase III measures will be based on economic conditions, additional regulation, advances in technology and financing. Cathedral City will also track advances in the California Executive Order that calls for an emissions reduction of 80% from 1990 levels by 2050.

Cathedral City 2013 Climate Action Plan 42
Table 12: Phase II Measures
Sphere GHG Sector
Linkage Measure Phase
Annual Savings
(Tonnes CO2e)
Job Creation Estimate
Annual Savings
Estimated Implementation
Cost to City
WORK - 3 Commercial
Buildings
Energy-Efficient, Commercial-Sector Lighting: With DCEP promote and leverage existing incentives for efficient lighting with special local focus on building owner education and action with goal to eliminate any remaining T-12 lamps in commercial buildings
II 704 2.6 $258,930 $5,000
WORK - 5 Commercial
Buildings
Commercial On-Bill Financing/Repayment: Encourage On-Bill Financing/Repayment through SCE, SCG with green messaging and teamwork in the community
II 1,440 6.1 $608,230 $2,000
BUILD - 1 Commercial
Buildings
Lighting Controls: Promote SCE programs to encourage energy-efficient lighting linked to building controls and occupancy sensors
II 205 0.8 $75,521 $15,000
BUILD - 2 Commercial
Buildings
"Cool Roofs": Promote the installation of reflective roofing on commercial properties in the community with recognition for first ten early adopters
II 15 0.1 $8,714 $15,000
RECREATE - 1 Commercial
Buildings
Net Zero Special Events: Build on Sustainability Coordinator's work and continue to work with the hospitality sector and require special purpose events to be sustainable with net zero energy and waste requirements
II 3 0.0 $1,000 $1,000
RECREATE - 2 Commercial
Buildings
Green Conferences: Build on Sustainability Coordinator's work and continue to work with hospitality sector to define and promote “green” conference venues, hotels, etc.
II 11 0.2 $20,000 $2,000
RECREATE - 3 Cross-Cutting
Initiatives
Comprehensive Pool Efficiency: Promote comprehensive pool efficiency including variable speed pool pumps, covers, wind breaks, and solar heating for 1,000 pools
II 493 3.5 $354,384 $4,000
LEARN - 3 Cross-Cutting
Initiatives
Green Building Lectures and Continuing Education: Provide lectures, seminars and training on green building based on guide and training materials emphasizing desert conditions and opportunities
II 91 0.5 $47,595 $5,000
LEARN - 6 Cross-Cutting
Initiatives
Workforce Development: Promote workforce development in partnership with College of the Desert, UCR, and CSUSB to achieve 1,000 "green careers" by 2020
II 4 0.0 $10,000
WORK - 6 Government
Initiatives
Commercial PACE Program: Partner and aggressively promote commercial PACE program to provide commercial property owners —from retail to resorts—with property-secured funding for 100% of the cost of energy efficiency upgrades/renewable energy installations
II 5,129 21.3 $2,128,440 $5,000
BUILD - 4 Government
Initiatives
Green Building Support Services: Advance the Voluntary Green Building Program to mandatory green building requirement with technical support services
II 548 2.7 $270,015 $50,000

Cathedral City 2013 Climate Action Plan 43
Sphere GHG Sector
Linkage Measure Phase
Annual Savings
(Tonnes CO2e)
Job Creation Estimate
Annual Savings
Estimated Implementation
Cost to City
BUILD - 5 Government
Initiatives
New and Efficient Construction: Promote the Savings by Design Program from SCE for new commercial buildings.
II 93 0.5 $47,215 $1,000
BUILD - 6 Government
Initiatives
Plan Checks and Permitting: Expedite plan check and permitting process for green building projects and remodels
II 154 0.9 $92,736 $1,000
GOVERN - 6 Government
Initiatives
Efficient and Green New Construction: Establish policy that 100% of new municipal buildings and major remodels adhere to Voluntary Green Building Program standards and are minimum LEED Silver or equivalent
II 158 0.6 $58,290 $2,000
GOVERN - 10 Government
Initiatives
Transit Oriented Development: Promote transit oriented development to foster development in line with mass transit corridors
II 1,475 1.5 $147,500 $5,000
RECREATE - 4 Government
Initiatives
Ball field Lighting Timers: Promote the installation of timers for all ball field or other recreational lighting at schools and city facilities
II 60 0.2 $22,076 $10,000
GOVERN - 13 Renewable
Energy
Solar Ready Ordinance: Develop and implement an ordinance requiring 100% of new homes be solar ready (PV)
II 1,284 8.6 $863,587 $10,000
LIVE - 1 Residential Buildings
Pool Pumps: Promote high-efficiency, variable speed pool pumps to households at community fairs and retail outlets with a goal to achieve 1,000 pumps
II 493 3.5 $354,384 $50,000
LIVE - 4 Residential Buildings
Household Efficiency Audits: Partner with SCE and SCG to provide local promotion for the Home Energy Efficiency Survey to "self audit" homes
II 887 4.6 $464,321 $2,500
LIVE - 5 Residential Buildings
Plan Checking and Permitting: Expedite plan check and permitting process for energy-efficiency measures, energy efficient remodels, and renewable energy installations to reduce carbon emissions
II 254 1.4 $144,419 $2,000
LIVE - 7 Residential Buildings
On-Bill Finance/Repayment: Partner with SCE and SCG to locally promote on-bill financing/repayment for residential energy efficiency retrofits in 15% of housing stock
II 1,616 4.1 $406,686 $2,000
BUILD - 9 Residential Buildings
Green Homes Tours: Administer “Green Homes Tours” annually to showcase six projects each year
II 93 0.5 $47,215 $4,000
WORK - 8 Transportation
Car-Pooling and Mass Transit: Promote "Shared Vehicle at Work" programs with a goal to increase carpooling and mass transit by 20% with a "guaranteed-ride home"
II 114 0.2 $22,652 $2,000
MOBILITY - 3 Transportation "Golf Cars:" Craft and implement a “golf cars” ordinance to achieve minimum goal of 250 registered vehicles by 2020
II 287 1.1 $106,600 $2,000
MOBILITY - 4 Transportation
Charging Stations: Foster public/private partnerships to promote 10 additional public access EV charging stations for existing EV and NEV fleets
II 22 0.1 $8,358 $12,500

Cathedral City 2013 Climate Action Plan 44
Sphere GHG Sector
Linkage Measure Phase
Annual Savings
(Tonnes CO2e)
Job Creation Estimate
Annual Savings
Estimated Implementation
Cost to City
MOBILITY - 5 Transportation
Eco-Conscious Driving: Promote eco-conscious driving behavior to increase fuel efficiency by 5 - 10% and minimize emissions and maintenance. Aka "hyper-miling."
II 94 0.4 $35,000 $5,000
MOBILITY - 6 Transportation
Buses: Promote the benefits of buses with a goal to increase ridership by 1,000 daily riders, provide promotions and incentives for new riders
II 556 1.5 $151,449 $7,500
MOBILITY - 7 Transportation Biking and Walking: Expand bikeways, trails, and walking paths connecting residential neighborhoods and commerce
II 24 0.0 $4,620 $200,000
MOBILITY - 12 Transportation
Bus Route Maximization: Collaborate with SunLine officials to reform routes to promote smaller buses with more routes and frequencies with a goal to increase ridership by 1,500 riders
II 834 2.3 $227,172 $5,000
MOBILITY - 14 Transportation
Senior Vehicle Tune-Ups: Introduce and implement "Senior Vehicle Diagnostic Program" to target and incentivize seniors to tune and maintain their vehicles on a regular basis
II 235 0.1 $11,655 $5,000
MOBILITY - 15 Transportation
Car Sharing: Promote ZIP and/or other Car Share programs through preferential parking and promotion with signage with a goal to serve 5% of existing drivers who each reduce their driving by 25%
II 579 2.2 $215,356 $5,000
GOVERN - 15 Transportation
Plug In Electric Vehicle Charging Stations: Seek grant funding to install 10 EV charging stations on public and private property and promote Plug In Electric Vehicles for public use
II 478 1.8 $177,800 $1,500
RECREATE - 6 Transportation
Neighborhood Electric Vehicles: Design and promote Neighborhood Electric Vehicle program with a goal to achieve minimum of 50 NEVs for Valley residents and visitors
II 120 0.4 $44,450 $1,000
LIVE - 13 Water
Gray water-Ready Ordinance: Require all new residential development to be constructed for easy implementation of gray water systems that redirect water from wash basins, showers, and tubs
II 3 0.0 $26 $2,500
LIVE - 14 Water
Drought Tolerant Planting: Promote and augment City, DWA and CVWD rebates for drought tolerant planting, turf replacement and buy-back
II 215 0.0 $55,000
WORK - 9 Water
Water Conservation Ordinance: Build on ordinance with goal to exceed current commercial-sector water conservation ordinance by 20% community-wide by 2020
II 79 1.1 $106,105 $10,000
RECREATE - 7 Water Irrigation System Controls: Promote the installation of irrigation control sensors at parks and golf courses
II 102 1.3 $127,140 $1,000
RECREATE - 8 Water
Drought-Tolerant Landscaping: Promote reduced need for golf course irrigation through design and use of drought-tolerant plants
II 30 0.1 $10,927 $1,000
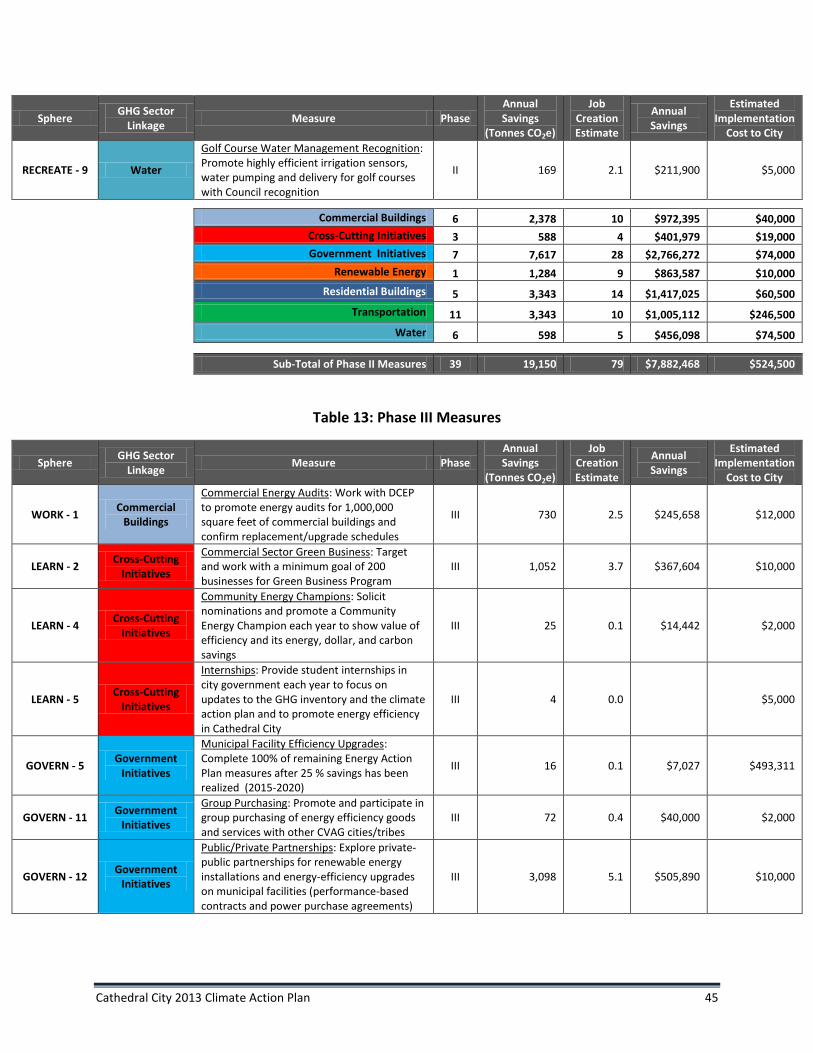
Cathedral City 2013 Climate Action Plan 45
Sphere GHG Sector
Linkage Measure Phase
Annual Savings
(Tonnes CO2e)
Job Creation Estimate
Annual Savings
Estimated Implementation
Cost to City
RECREATE - 9 Water
Golf Course Water Management Recognition: Promote highly efficient irrigation sensors, water pumping and delivery for golf courses with Council recognition
II 169 2.1 $211,900 $5,000
Commercial Buildings 6 2,378 10 $972,395 $40,000
Cross-Cutting Initiatives 3 588 4 $401,979 $19,000
Government Initiatives 7 7,617 28 $2,766,272 $74,000
Renewable Energy 1 1,284 9 $863,587 $10,000
Residential Buildings 5 3,343 14 $1,417,025 $60,500
Transportation 11 3,343 10 $1,005,112 $246,500
Water 6 598 5 $456,098 $74,500
Sub-Total of Phase II Measures 39 19,150 79 $7,882,468 $524,500
Table 13: Phase III Measures
Sphere GHG Sector
Linkage Measure Phase
Annual Savings
(Tonnes CO2e)
Job Creation Estimate
Annual Savings
Estimated Implementation
Cost to City
WORK - 1 Commercial
Buildings
Commercial Energy Audits: Work with DCEP to promote energy audits for 1,000,000 square feet of commercial buildings and confirm replacement/upgrade schedules
III 730 2.5 $245,658 $12,000
LEARN - 2 Cross-Cutting
Initiatives
Commercial Sector Green Business: Target and work with a minimum goal of 200 businesses for Green Business Program
III 1,052 3.7 $367,604 $10,000
LEARN - 4 Cross-Cutting
Initiatives
Community Energy Champions: Solicit nominations and promote a Community Energy Champion each year to show value of efficiency and its energy, dollar, and carbon savings
III 25 0.1 $14,442 $2,000
LEARN - 5 Cross-Cutting
Initiatives
Internships: Provide student internships in city government each year to focus on updates to the GHG inventory and the climate action plan and to promote energy efficiency in Cathedral City
III 4 0.0 $5,000
GOVERN - 5 Government
Initiatives
Municipal Facility Efficiency Upgrades: Complete 100% of remaining Energy Action Plan measures after 25 % savings has been realized (2015-2020)
III 16 0.1 $7,027 $493,311
GOVERN - 11 Government
Initiatives
Group Purchasing: Promote and participate in group purchasing of energy efficiency goods and services with other CVAG cities/tribes
III 72 0.4 $40,000 $2,000
GOVERN - 12 Government
Initiatives
Public/Private Partnerships: Explore private-public partnerships for renewable energy installations and energy-efficiency upgrades on municipal facilities (performance-based contracts and power purchase agreements)
III 3,098 5.1 $505,890 $10,000

Cathedral City 2013 Climate Action Plan 46
Sphere GHG Sector
Linkage Measure Phase
Annual Savings
(Tonnes CO2e)
Job Creation Estimate
Annual Savings
Estimated Implementation
Cost to City
BUILD - 8 Residential Buildings
Affordable Housing: Promote the construction of energy-efficient affordable housing with private-sector partners
III 193 1.0 $96,900 $25,000
LIVE - 9 Solid Waste Solid Waste Diversion: Increase solid waste diversion to achieve an average annual goal of 65% through 2020
III 2,545 0.0 $5,000
GOVERN - 14 Solid Waste
Recyclable Take-Out Containers: Promote/mandate take-out alternative containers with a goal to eliminate the use of polystyrene packaging
III 20 0.0 $5,000
MOBILITY - 1 Transportation
Electric Vehicles: Promote the lease and purchase of electric vehicles in the community with recognition and preferential parking for participants. Goal of 250 vehicles
III 1,994 4.4 $444,164 $40,000
MOBILITY - 2 Transportation
Hybrid Vehicles: Promote the purchase of hybrid vehicles in the community with recognition and preferential parking for participants. Goal of 600 vehicles
III 1,974 7.3 $732,900 $100,000
MOBILITY - 8 Transportation
Bike, Walking, NEV "Parkway:" Support Parkway 1e11 as a Valley amenity and means to alternative forms of transportation and to promote health in Cathedral City
III 25 0.0 $4,620 $5,000
MOBILITY - 9 Transportation White Bikes: Provide bicycles for daily trips using public/private partnership model
III 17 0.1 $6,485 $2,000
MOBILITY - 11 Transportation
"Walking School Bus:" Collaborate with school district and neighborhood officials to create a Safe Routes to School ("Walking School Bus") program to increase walking to school by 10%
III 68 0.3 $25,137 $2,000
MOBILITY - 13 Transportation Van Pools: Partner and recognize all CC major employers with over 50 employees for van pools
III 287 1.1 $106,599 $5,000
Commercial Buildings 1 730 2 $245,658 $12,000
Cross-Cutting Initiatives 3 1,081 4 $382,046 $17,000
Government Initiatives 3 3,186 6 $552,917 $505,311
Residential Buildings 1 193 1 $96,900 $25,000
Solid Waste 2 2,565 0 $0 $10,000
Transportation 6 4,365 13 $1,319,905 $154,000
Sub-Total of Phase III Measures 16 12,120 26 $2,597,426 $723,311

Cathedral City 2013 Climate Action Plan 47
VI. Tracking Results and Measuring Progress
The practice of reducing GHG emissions is new to most California cities and tribes. While many of the policies, programs, and initiatives are familiar – they address electric efficiency, water use, our mobility, etc. – they are presented in this Climate Action Plan in a new way and with a new focus. Many assumptions are made, making the practice of measuring actual results all the more important to direct mid-course programmatic changes as need be. The City of Cathedral City will diligently track climate action results to verify reductions and to gauge the savings measures’ impacts toward the goals set. Progress reports will be provided quarterly to the Council by a designated staff member, with an annual report of greater depth flagging overall progress, key accomplishments and lessons, as well as challenges to successful implementation. Each year, the Planning Department, with the support of staff and consultants as need be, will review the progress toward the City’s climate protection goals. The potential for interns to assist in this process is being evaluated. Metrics that will be tracked for both municipal operations and community-wide include resource savings, economic savings, job creation, and carbon reductions: Resource Savings
Kilowatt-hour savings
Therms of natural gas savings
Gasoline and other transportation fuel savings
Water savings
Recycling diversion rate Economic Savings
Electricity bill savings
Natural gas bill savings
Water efficiency savings
Other resource savings Job Creation
Types of jobs
Number of jobs
Economic development value

Cathedral City 2013 Climate Action Plan 48
GHG Savings
Source of emissions reductions
Tonnes of emissions reductions
Cost per tonne of avoided emissions
Percentage of reduction goal achieved in each period Economic values will be considered and analyzed to track discrepancies with the Plan, and to update the Plan accordingly. Which programs are successful? Which areas need additional support? What new opportunities are on the horizon? A working draft will be maintained with quarterly updates; every two years the Climate Action Plan will be updated and reissued. Finally, Cathedral City will make the Climate Action Plan easily accessible to its members and stakeholders. The City will provide mechanisms for comments from citizens and staff using on-line survey tools and hard copy input sheets. Every two years, Cathedral City will plan and provide a community forum for interested stakeholders to keep them apprised of the work the City is doing and the progress that is being made and to solicit updated input for prioritization of actions.

Cathedral City 2013 Climate Action Plan 49
Appendix A: Glossary of Terms and Abbreviations
This glossary contains definitions for terms and abbreviations used in this Plan. The definitions were adapted from a number of sources including the U.S. Environmental Protection Agency, the California Air Quality Board website, Merriam-Webster Online, and Wikipedia. AB 32: See California Assembly Bill 32, the Global Warming Solutions Act of 2006. Adaptation: The ability of a system to adjust to the potential impacts of climate change or other environmental disturbances. Compare to “Mitigation,” which means the ability to reduce the amount of emissions caused by an activity. Alternative Fuels: Substitutes for traditional fossil-fuel-derived liquid motor vehicle fuels like gasoline and diesel. Alternative fuels include biodiesel, hydrogen, electricity, compressed natural gas, methanol, ethanol, and mixtures of alcohol-based fuels with gasoline. Alternative Fuel Vehicle: A vehicle powered by an alternative fuel as opposed to traditional gasoline or diesel. Anthropogenic: Refers to greenhouse gas emissions or reductions that are a direct result of human activities. Assembly Bill 32 (AB 32): The Global Warming Solutions Act of 2006 is the law that set the State of California’s 2020 greenhouse gas emissions reduction target of reducing greenhouse gas emissions to 1990 levels. It also directed the California Air Resources Board to develop a Scoping Plan to outline how best to reach the 2020 target. Atmosphere: The blanket of air surrounding the earth that supports life. The atmosphere absorbs energy from the sun and retains heat. It also recycles water and other chemicals and protects the earth from high-energy radiation and the frigid vacuum of space. Baseline Emissions: The amount of greenhouse gas emissions released in a designated year against which future changes in emissions levels are measured. For Green for Life jurisdictions, the baseline year is 2010, selected at the year for which the best data were available. Business as Usual (BAU): What to expect in the normal course of events. Biodiesel: A form of diesel fuel manufactured from vegetable oils (used or new) or animal fats. Biodiesel can be used in its pure form (B100) or blended with petroleum diesel in varying proportions. Building Envelope: The physical separation between the interior and the exterior of a building – made up of the walls and insulation, windows and doors, roof, foundation, etc. The envelope

Cathedral City 2013 Climate Action Plan 50
serves as the outer shell (sometimes called the skin) of the building, and allows for control of the indoor environment (e.g., heating, cooling, moisture control, air pressure). California Public Utilities Commission (CPUC): Regulates privately owned electric, natural gas, telecommunications, water, railroad, rail transit, and passenger transportation companies. Its purpose is to “protect consumers and ensure the provision of safe, reliable utility service and infrastructure at reasonable rates, with a commitment to environmental enhancement and a healthy California economy.” Carbon Dioxide (CO2): The greenhouse gas whose concentration is being most affected by human activities. CO2 also serves as the reference to compare all other greenhouse gases (see Carbon Dioxide Equivalencies). The major source of CO2 emissions is fossil fuel combustion. Significant CO2 emissions are also produced by forest clearing, biomass burning, and non-energy production processes such as cement production. Carbon Dioxide Equivalent (CO2e): A metric used to compare emissions of various greenhouse gases. The greenhouse gas inventory process converts all other gases to their carbon dioxide equivalents by multiplying the mass of the gas by its global warming potential. Carbon Footprint: The total set of greenhouse gas emissions caused directly and indirectly by an individual, organization, event, or product. The Green for Life Greenhouse Gas Inventory measures the carbon footprint of local government operations as well as of the entire community. Climate: The average weather (usually taken over a 30-year time period) for a particular region and time period. Climate is not the same as weather. It is the average pattern of weather for a particular region. Climatic elements include average annual temperature, humidity, sunshine, wind speed, precipitation, and other measures of atmospheric conditions. Climate Action Plan: A plan that is set in place for a city or other jurisdiction to follow in order to control and improve its energy use and emissions. Coachella Valley Association of Governments (CVAG): The regional planning agency coordinating government services in the Coachella Valley, providing solutions to common issues of the local governments and tribes that are members. Demand Response: Actions or programs offered by the local utility to induce ratepayers to temporarily reduce or shift electrical consumption when so requested. These requests would typically be in response to either a constrained electrical grid or suddenly increasing electrical prices. Emissions: Pollution (including noise, heat, radiation, and greenhouse gases) discharged into the atmosphere by individual, residential, commercial, and industrial activities and facilities. A greenhouse inventory measures emissions from a variety of sources (for example, from the

Cathedral City 2013 Climate Action Plan 51
burning of natural gas or of transportation fuels) and sectors (such as from industrial or residential buildings). Emissions Coefficients: The greenhouse gas “impact” that comes from a given utility’s fuel mix. Every electric utility, for example, generates power from a “portfolio” of power sources: natural gas plants, nuclear plants, dams, etc. That utility’s emissions coefficients are determined by its specific mix. The coefficients change year-to-year. Energy Conservation: Reducing energy consumption. Energy conservation can be achieved by behavioral change, for instance turning off appliances and idle equipment, slightly raising temperatures, etc. Versus “energy efficiency” that is based on advanced technologies and getting the most productivity from each unit of energy. Energy Efficiency: Using less energy to provide the same level of service or complete the same task. For example, a more efficient light will use less electricity to provide the same amount of illumination. California Executive Order S-03-05: on June 1, 2005, Governor Schwarzenegger signed Executive Order S-3-05 which established the climate change emission reduction targets for California: By 2010, reduce emissions to 2000 levels; by 2020, reduce emissions to 1990 levels; and by 2050, reduce emissions to 80 percent below 1990 levels. Flexible Work Arrangements: Work arrangements that allow employees to deviate from a set schedule or location. This could include options for telecommuting, working a compressed work week, and starting or ending the workday at times other than conventional shift times. Fuel Efficiency: The distance a vehicle can travel on an amount of fuel. This is most often measured in miles traveled per gallon of fuel. A higher-efficiency vehicle travels farther on a gallon of fuel than similar vehicles. Fuel Mix: Every electric utility generates power from a “portfolio” of power sources: natural gas plants, nuclear plants, dams, etc. That utility’s fuel mix determines its emissions rate per kWh of electricity produced. In California, the Renewable Portfolio Standard regulates the utility fuel mix. Fugitive Emissions: Miscellaneous emissions released from a given activity, like refrigerants released as a result of leaks, fertilizers from golf courses, etc. General Plan: A long-range policy document to guide land use decisions about physical, economic, and environmental growth. California State law requires counties and cities to have a General Plan which contains seven elements: Land Use; Transportation; Housing; Open Space; Conservation; Safety; and Noise. County general plans cover unincorporated areas.

Cathedral City 2013 Climate Action Plan 52
Global Protocol for Community-Scale GHG Emissions (GPC): A tool to assist local governments to develop community-scale inventories, developed by C40 Cities Climate Leadership Group and ICLEI Local Governments for Sustainability In collaboration with: World Bank, UNEP, UN-HABITAT, World Resources Institute. Global Warming: An increase in the near-surface temperature of the Earth. Global warming has occurred in the distant past as the result of natural influences, but the term is most often used to refer to the warming occurring now or predicted to occur as a result of increased emissions of greenhouse gases due to human activity. Global Warming Potential: A value that is used to compare the abilities of different greenhouse gases to trap heat in the atmosphere. GWPs are based on the heat-absorbing ability of each gas relative to that of carbon dioxide (CO2), as well as the decay rate of each gas (the amount removed from the atmosphere over a given number of years). For example, methane has a global warming potential of 21. Green Building: A structure constructed using materials and building practices that reduce its impact on the environment throughout its entire life (siting, design, construction, operations, and deconstruction). Green buildings are resource efficient, using less energy, water, and other materials. Green Infrastructure: The network of trees, plants, and natural ecosystems in a community. These provide services to a community, such as decreasing rainwater runoff, providing healthy soils, removing air pollutants and greenhouse gases from atmosphere, and providing shade and beautification. Greenhouse Effect: Carbon dioxide and other atmospheric gases warm the surface of the planet by trapping heat close to the surface of the earth. In a natural state, the greenhouse effect warms the planet, making it habitable by humans. However, human activities have increased the amount of carbon dioxide and other greenhouse gases in the atmosphere. Higher levels of greenhouse gases trap more heat, causing temperatures to rise. Greenhouse Gas (GHG): A gas, including water vapor, carbon dioxide (CO2), methane (CH4), and nitrous oxide (N2O) among others, which traps heat close to the surface of the earth, contributing to global warming and climate change.
Greenhouse Gas Inventory (GHG Inventory): The EPA defines a GHG Inventory as follows: “A greenhouse gas inventory is an accounting of greenhouse gases (GHGs) emitted to or removed from the atmosphere over a period of time. Policy makers use inventories to establish a baseline for tracking emission trends, developing mitigation strategies and policies, and assessing progress. An inventory is usually the first step taken by entities that want to reduce their GHG emissions.”

Cathedral City 2013 Climate Action Plan 53
Infrastructure: The basic shared physical structures needed for an urban area to function in an efficient, safe manner. The term typically refers to items such as roads, drinking water systems, sewers, energy systems, and telecommunication systems in a community.
Grid: The transmission and distribution system for electricity made up of a network of synchronized power providers and operated by one or more control centers. The United States mainland has three grids: the Eastern Interconnect, the Western Interconnect, and the Texas Interconnect.
International Council for Local Government Initiatives, now known as Local Governments for Sustainability USA (ICLEI): International organization at the forefront of measuring greenhouse gases and developed the first GHG inventories starting in 1990. Today, members come from 70 countries and represent more than 569,885,000 people. ICLEI provides technical consulting, training, and information services to build capacity, share knowledge, and support local government in the implementation of sustainable development at the local level. Intergovernmental Panel on Climate Change (IPCC): The leading international body for the assessment of climate change. It was established by the United Nations Environment Programme (UNEP) and the World Meteorological Organization (WMO) in 1988 to provide the world with a clear scientific view on the current state of knowledge in climate change and its potential environmental and socio-economic impacts. Local Government Operations Protocol (LGOP): A standard set of guidelines developed by ICLEI, the World Resources Institute and the California Air Quality Board, aimed at assisting local governments to develop their greenhouse gas inventories. Kilowatt (kW): A unit of power equal to one thousand watts. The amount of power that a power source has the capacity to generate is typically measured in terms of kW or, in the case of larger systems, in terms of megawatts (MW). Kilowatt-hour (kWh), by contrast, is a measure of how much energy is actually used or generated over a specific period of time. Kilowatt-hour (kWh): An amount of electricity equivalent to the use of one kilowatt for one hour. A one hundred watt light bulb that is on for 10 hours uses one kilowatt-hour of electricity (100 watts x 10 hours = 1,000 watt-hours = 1 kilowatt-hour).
Kyoto Protocol: A treaty negotiated in December 1997 at the City of Kyoto, Japan. It committed its signatories to reduce their collective emissions of greenhouse gases by 5.2% compared to the year 1990. Some 37 industrialized countries and the European Community signed the treaty, which provided for a number of flexible mechanisms to reach the reductions goals. The United States did not sign the treaty, and Canada withdrew from the treaty in 2011.
Leadership in Energy and Environmental Design (LEED): A building certification program, run under the auspices of the U.S. Green Building Council (USGBC). LEED concentrates its efforts on

Cathedral City 2013 Climate Action Plan 54
improving performance across five key areas of environmental and human health: energy efficiency, indoor environmental quality, materials selection, sustainable site development and water savings. Measures: The primary component of the Climate Action Plan. The measures are specific short and long-term policies, programs, and actions that the jurisdiction will carry out to reduce its greenhouse gas emissions. Megawatt (MW): One million watts. A typical power plant generates 500 - 1,000 MW of power. Methane (CH4): A greenhouse gas that traps 21 times the amount of heat as carbon dioxide. Methane is produced through the decomposition of waste in landfills, animal digestion, decomposition of animal wastes, incomplete fossil fuel combustion, and the production and distribution of natural gas, oil, and coal. Metric Ton (or tonne): Common international measurement for the quantity of greenhouse gas emissions. A metric ton is equal to 2,205 lbs. or 1.1 short tons. It is the common form of ton used in the United States. Mitigation: A human intervention to either reduce the amount of greenhouse gases being emitted into the atmosphere or remove previously emitted gases from the atmosphere. Nitrous Oxide (N2O): A powerful greenhouse gas with the ability to trap 310 times the amount of heat as a molecule of CO2. Major sources of nitrous oxide include soil cultivation practices, especially the use of commercial and organic fertilizers, fossil fuel combustion, nitric acid production, and biomass burning. Off-Peak: The opposite of Peak (see below), that is, the time or hours of the day when demand for electricity is at its lowest and thus prices are also lower. Property Assessed Clean Energy financing (PACE): PACE financing, first enabled in California by AB 811 (2008) and then spreading across the country, makes it possible for financing of energy upgrades to be repaid via a property tax assessment. PACE programs may be set up, funded and administered by local governments or by third parties. Peak Usage Period or Peak Demand: The time period during which the maximum level of demand for electricity occurs. Peak demand may be measured daily, monthly, seasonally or yearly, but for a utility it is typically the single half hour or hour representing the highest point of customer consumption of electricity on a given day. Photovoltaic (PV): Refers to the effect of sunlight (photons) generating electricity without mechanical conversion. Typically used in conjunction with the equipment associated with a solar electric system, such as “PV panels” or “PV system.”

Cathedral City 2013 Climate Action Plan 55
Renewable Energy/Power: Energy generated from sources that are naturally replenished or not used up in the course of providing power (e.g., wind, solar, biomass, and geothermal). This is in contrast to the burning of fossil fuels, which destroys the fuel source and thereby depletes the overall amount of fuel available. Renewable Portfolio Standard (RPS): Each electric utility generates power through a “portfolio” of sources: natural gas power plants, nuclear plants, large hydroelectric plants, etc. In California, the make-up of the portfolio is regulated by the Renewable Portfolio Standard. In 2010 the standard was raised to require 33% of all energy be from “renewable sources” by 2020. Senate Bill 375 (SB 375): The Sustainable Communities and Climate Protection Act, passed in 2008, was drafted and adopted to reduce vehicle emissions by integrating land use with transportation planning. Sequestration: The uptake and storage of carbon from the atmosphere. Most commonly refers to trees and plants absorbing carbon dioxide through photosynthesis. Smart Grid: An electricity system that utilizes two-way communication between power suppliers and consumers. This allows for adjustments to a facility’s operations to save energy, reduce cost, and increase the reliability of the power supply. A smart grid includes a monitoring system at facilities that can turn off or adjust systems to reduce demand at peak times when power is more expensive. For example, a smart grid could temporarily turn off selected appliances, such as washing machines, or adjust a building temperature by a few degrees to save power. Smart Meter: An electrical meter that tracks power consumption in real-time, communicates with the local utility company for monitoring and billing purposes, and (if connected to a smart grid) can adjust a building’s energy use automatically to reduce demand on the power grid at peak use times. Solar Panel: A photovoltaic cell that can convert light directly into electricity. Typical solar cells use semiconductors made from silicon. Solar Thermal: Refers to devices that use the heat from the sun to heat water. Strategies: Groups of similar emissions reduction measures included in the Climate Action Plan. Sustainability: In a broad sense, the capacity to endure. In ecology, the word describes how biological systems remain diverse and productive over time. For human society, it is the potential for long-term maintenance of well-being, which in turn depends on the well-being of the natural world and the responsible use of natural resources. Sustainability has multiple facets: environmental, economic, and social.

Cathedral City 2013 Climate Action Plan 56
Therm(s): A unit of measurement of natural gas. It is approximately the energy equivalent of burning 100 cubic feet of natural gas. It is equivalent to 100,000 British thermal units (BTU) or 29.3 kilowatt-hours of electrical energy.
Title 24: California Code of Regulations (CCR), Title 24, is also known as the California Building Standards Code. It is a compilation of building criteria that is updated every three years.
Tonne: see Metric Ton.
United Nations World Commission on Environment and Development (WCED): This group published “Our Common Future,” also known as the Brundtland Report, in 1987. It is most famous for focusing on environmental threats as “elements of a single crisis of the whole.” The Brundtland Report also coined an often-quoted definition of sustainability as: "development that meets the needs of the present without compromising the ability of future generations to meet their own needs."
U.S. Environmental Protection Agency (EPA): The federal environmental science, research, education, assessment, and regulatory agency. The mission of the Environmental Protection Agency is to protect human health and the environment. Waste Characterization Study: An analysis of a facility’s waste not being recycled or composted that involves sorting the garbage produced by type (e.g., paper, food waste, plastic) to determine what is being thrown away. Waste Diversion: A waste reduction strategy focused on the recycling or composting of materials, diverting for use in new products or materials what would otherwise have been sent to a landfill. Waste Reduction: Techniques such as source reduction, recycling, or composting that reduce waste generation or prevent waste from being created at all. Waste Stream: The total flow of solid waste from homes, businesses, institutions and manufacturing plants that is recycled, composted, burned, or disposed of in landfills. Watt: The standard measure of an amount of energy, usually electricity. For example, a 60-watt light bulb requires 60 watts of electricity. Energy use is measured in terms of the number of watts used over a period of time (see kilowatt-hour). Weather: The specific condition of the atmosphere at a particular place and time. It is measured in terms of such factors as wind, temperature, humidity, atmospheric pressure, cloudiness, and precipitation. In most places, weather changes from hour to hour, day to day, and season to season. Climate is the average of weather over time and space. A simple way of remembering the difference is that climate is what you expect (e.g., cold winters) and weather is what happens (e.g., a blizzard).

Cathedral City 2013 Climate Action Plan 57
Appendix B: Savings Measures Analysis by Cost-Effectiveness
Sphere GHG Sector
Linkage Measure Phase
Annual Savings
(Tonnes CO2e)
Job Creation Estimate
Annual Savings
Estimated Implementation
Cost to City
Efficacy ($/tonne
CO2e) Assumptions
GOVERN - 2 Cross-Cutting
Initiatives
Desert Cities Energy Partnership: Continue to actively partner with serving utilities to fully utilize energy efficiency and demand response programs in municipal facilities
I 2,250 9.8 $984,837 $2,000 $0.89 DCEP: Data from Energy Leader Partnership annualized data from 2004-2011; Municipal 105,436 kWh/yr., Community 7,710,734 kWh/yr. Total 7,816,170
LEARN - 1 Cross-Cutting
Initiatives
Save a Ton Campaign: Work with CVAG to develop and locally market the Save a Ton campaign, unlocking energy, dollar, and carbon savings in 30% of the housing stock
I 2,127 12.7 $1,269,914 $2,000 $0.94 5,000 homes 10% kWh savings (5,653,500 kWh), $0.207/kWh; Natural Gas with 5% savings (94,000 therms), $1.06/therm
WORK - 6 Government
Initiatives
Commercial PACE Program: Partner and aggressively promote commercial PACE program to provide commercial property owners —from retail to resorts—with property-secured funding for 100% of the cost of energy efficiency upgrades/renewable energy installations
II 5,129 21.3 $2,128,440 $5,000 $0.97
Efficiency upgrades (2,500,000 sq. ft. comm space; 30% reduction in elec. 5% reduction in natural gas): savings of 11,685,000 kWh/yr. and 43,750 therms nat. gas/yr. (energy upgrades); 1,000 kW PV producing 2,007,500 kWh/yr., $252,945; 2000 kW capacity wind producing 3,040,000 kWh/yr., $332,576; 90 businesses with solar hot water saving 58,081 kWh and 11,983 therms nat. gas/yr. $24,214 (renewable energy system)
LIVE - 7 Residential Buildings
On-Bill Finance/Repayment: Partner with SCE and SCG to locally promote on-bill financing/repayment for residential energy efficiency retrofits in 15% of housing stock
II 1,616 4.1 $406,686 $2,000 $1.24 15% of housing stock (2,557 homes), 40% kWh savings, 30% therms savings
WORK - 5 Commercial
Buildings
Commercial On-Bill Financing/Repayment: Encourage On-Bill Financing/Repayment through SCE, SCG with green messaging and teamwork in the community
II 1,440 6.1 $608,230 $2,000 $1.39 Efficiency upgrades (1,000,000 sq. ft. comm space; 30% reduction in elec. 5% reduction in natural gas) savings 4,680,000 kWh/y and 17,500 therms nat. gas/yr.
LIVE - 6 Residential Buildings
Residential PACE: Partner and aggressively promote Residential PACE Program with a goal to reach 25% of homes with property-secured funding for 100% of the cost of energy upgrades and renewable energy systems in eight years
I 8,792 46.7 $4,667,952 $16,000 $1.82
25% of housing stock (4,261 homes), 40% kWh savings, 30% therms savings (energy upgrades) (saving 19,275,042 kWh and 593,440 therms); 100 homes with 10kw solar PV (200,750 kWh savings), 50 homes with solar DHW (renewable energy system) (saving 11,616 kWh and 5,392 therms/yr.)
LIVE - 9 Solid Waste Solid Waste Diversion: Increase solid waste diversion to achieve an average annual goal of 65% through 2020
III 2,545 0.0 $5,000 $1.96 Cal-Recycle with consultant data analysis
LIVE - 4 Residential Buildings
Household Efficiency Audits: Partner with SCE and SCG to provide local promotion for the Home Energy Efficiency Survey to "self audit" homes
II 887 4.6 $464,321 $2,500 $2.82
Assume 1,700 homes reached (10% of homes) and a 10% reduction (1,130 kWh and 37 therms per home) resulting in 1,921,000 kWh and 62,900 therms saved annually

Cathedral City 2013 Climate Action Plan 58
Sphere GHG Sector
Linkage Measure Phase
Annual Savings
(Tonnes CO2e)
Job Creation Estimate
Annual Savings
Estimated Implementation
Cost to City
Efficacy ($/tonne
CO2e) Assumptions
LIVE - 2 Residential Buildings
Energy-Efficient Lighting: Work with the DCEP to acquire 12,000 compact fluorescent lamps and LEDs for giveaways to demonstrate their value in homes and leverage ten times the number in household and business applications
I 1,990 12.0 $1,202,256 $6,000 $3.02
12,000 bulbs resulting in 528,000 kWh annual savings. Each bulb costs $1.50 and saves 44 kWh/yr.; program administration assumed at $3,000. Each bulb given away leverages an additional 10 purchased through leveraging effect resulting in 5,280,000 kWh annual savings for a total of 5,808,000 kWh saved annually
GOVERN - 15 Transportation
Plug In Electric Vehicle Charging Stations: Seek grant funding to install 10 EV charging stations on public and private property and promote Plug In Electric Vehicles for public use
II 478 1.8 $177,800 $1,500 $3.14 Resulting in support of 400 EV purchases or leases for a savings of 127 gallons per vehicle/yr. 5,000 VMT/yr. ($3.50/ gal. of gas)
GOVERN - 12 Government
Initiatives
Public/Private Partnerships: Explore private-public partnerships for renewable energy installations and energy-efficiency upgrades on municipal facilities (performance-based contracts and power purchase agreements).
III 3,098 5.1 $505,890 $10,000 $3.23 4,500 kW (4MW) of solar PV generating 4,516,875 kWh
LIVE - 8 Solid Waste Solid Waste Diversion: Increase solid waste diversion to achieve an average annual goal of 55% through 2015
I 1,525 0.0 $5,000 $3.28 Cal-Recycle with consultant data analysis
GOVERN - 10 Government
Initiatives
Transit Oriented Development: Promote transit oriented development to foster development in line with mass transit corridors
II 1,475 1.5 $147,500 $5,000 $3.39 Reduced VMT by 2%
WORK - 2 Commercial
Buildings
Peak Demand Reduction: Collaborate with SCE and encourage 200 businesses to enroll in Energy Efficiency and Demand Response programs such as the Summer Discount Program
I 482 2.4 $244,000 $2,000 $4.15 200 business participating, 8,000 kWh/yr. reduction 200 therms/yr. reduction each for a total of 1,600,000 kWh and 40,000 therms.
BUILD - 3 Government
Initiatives
Green Building Program: Promote Voluntary Green Building Program to prepare for enhanced Title 24 requirements and green building standards
I 548 2.7 $270,015 $2,500 $4.56
100 new or "gut-rehab" homes at 3,000 square feet average; assume 25% savings off of the typical new construction annual energy usage per sf; resulting in 1,170,000 kWh and 26,250 therms saved annually
MOBILITY - 12
Transportation
Bus Route Maximization: Collaborate with SunLine officials to reform routes to promote smaller buses with more routes and frequencies with a goal to increase ridership by 1,500 riders
II 834 2.3 $227,172 $5,000 $6.00
1,500 new daily transit passengers, 9.8 miles avg. trip length, 19.7 mpg vehicle displaced saving 5,365,500 annual vehicle mile reduction, 272,360 gallons of gas ($3.50/ gal. of gas)
BUILD - 6 Government
Initiatives
Plan Checks and Permitting: Expedite plan check and permitting process for green building projects and remodels
II 154 0.9 $92,736 $1,000 $6.49
1% of housing stock (100 homes), 16,000 avg kWh usage, 20% kWh savings (3,200 kWh), 1% of commercial stock (8 bldgs.), 40,700 avg kWh usage, 40% kWh savings (16,000 kWh) saving 448,000 kWh

Cathedral City 2013 Climate Action Plan 59
Sphere GHG Sector
Linkage Measure Phase
Annual Savings
(Tonnes CO2e)
Job Creation Estimate
Annual Savings
Estimated Implementation
Cost to City
Efficacy ($/tonne
CO2e) Assumptions
GOVERN - 1 Cross-Cutting
Initiatives
Office of Energy Management: Continue to support the Office of Environmental Management and Sustainability to promote energy efficiency with designated staff member
I 2,300 2.3 $230,000 $15,000 $6.52 Additional 1% of citywide emissions over specific programs run
MOBILITY - 3 Transportation "Golf Cars:" Craft and implement a “golf cars” ordinance to achieve minimum goal of 250 registered vehicles by 2020
II 287 1.1 $106,600 $2,000 $6.97 100 new electric cars, 19.7 mpg vehicle replaced, average annual miles per vehicle, $3.50/gal gas, $0.207/kWh saving 30,457 gallons ($3.50/ gal. of gas)
WORK - 3 Commercial
Buildings
Energy-Efficient, Commercial-Sector Lighting: With DCEP promote and leverage existing incentives for efficient lighting with special local focus on building owner education and action with goal to eliminate any remaining T-12 lamps in commercial buildings
II 704 2.6 $258,930 $5,000 $7.10
1,000,000 sf of facilities retrofitted with efficient lighting, electricity cost of $0.126/kWh, annual lighting usage of 6.85 kWh/sf, 30% savings with retrofit of 2,055,000 kWh/yr.
LIVE - 3 Residential Buildings
Peak Demand Reduction: Partner with SCE to provide local promotion of the residential Summer Discount Program to cut peak demand in 10% of the housing stock
I 277 2.0 $199,414 $2,000 $7.22 Assume 10% of homes (1,704) and save 5% household electricity (565 kWh per home) resulting in 963,356 kWh saved annually
GOVERN - 13 Renewable
Energy
Solar Ready Ordinance: Develop and implement an ordinance requiring 100% of new homes be solar ready (PV)
II 1,284 8.6 $863,587 $10,000 $7.79
200 homes with 10kw solar PV (5.5 sun hours a day) resulting in 4,015,000 kWh/$831,105 production annually, 200 homes with solar DHW (avg. 50 gals a day usage) resulting in 46,464 kWh/$9,618 and 21,570 therms/$22,864 savings annually
LIVE - 5 Residential Buildings
Plan Checking and Permitting: Expedite plan check and permitting process for energy-efficiency measures, energy efficient remodels, and renewable energy installations to reduce carbon emissions
II 254 1.4 $144,419 $2,000 $7.87 850 homes 30% kWh savings 5% natural gas savings (678,420 kWh and 3,760 therms)
RECREATE - 3 Cross-Cutting
Initiatives
Comprehensive Pool Efficiency: Promote comprehensive pool efficiency including variable speed pool pumps, covers, wind breaks, and solar heating for 1,000 pools
II 493 3.5 $354,384 $4,000 $8.11 Target 1,000 additional pools, 1,712 kWh/yr. savings per pump resulting in 1,712,000 kWh/year
RECREATE - 6 Transportation
Neighborhood Electric Vehicles: Design and promote Neighborhood Electric Vehicle program with a goal to achieve minimum of 50 NEVs for Valley residents and visitors
II 120 0.4 $44,450 $1,000 $8.33 50 NEVs assuming 5000 miles each annually, saving 254 gallons gasoline per vehicle resulting in 12,755 gallons saved annually ($3.50/ gal. of gas)
MOBILITY - 15
Transportation
Car Sharing: Promote ZIP and/or other Car Share programs through preferential parking and promotion with signage with a goal to serve 5% of existing drivers who each reduce their driving by 25%
II 579 2.2 $215,356 $5,000 $8.64
500 car share participants, 30% reduction in vehicle miles, $3.50/gal of gas, 8,081 avg annual vehicle miles per person before car share, $2.40 cost per car share mile, 19.7 mpg fuel economy 1,212,150 fewer miles driven ($3.50/ gal. of gas)

Cathedral City 2013 Climate Action Plan 60
Sphere GHG Sector
Linkage Measure Phase
Annual Savings
(Tonnes CO2e)
Job Creation Estimate
Annual Savings
Estimated Implementation
Cost to City
Efficacy ($/tonne
CO2e) Assumptions
LEARN - 2 Cross-Cutting
Initiatives
Commercial Sector Green Business: Target and work with a minimum goal of 200 businesses for Green Business Program
III 1,052 3.7 $367,604 $10,000 $9.51
200 businesses targeted, 11,500 kWh and 367 therms saved annually, $0.126/kWh, $1.09/therm saving 2,300,000 kWh, 73,400 therms, $1,838 saved per business
RECREATE - 7 Water Irrigation System Controls: Promote the installation of irrigation control sensors at parks and golf courses
II 102 1.3 $127,140 $1,000 $9.80
26% savings, 300 acres, 652,000 gallons of water used per acre, $0.0025/gallon, 0.0035 kWh/gallon, $50/acre to install sensor saving 50,856,000 gallons of water, 177,996 kWh,
LIVE - 12 Water
Water Conservation Ordinance: Build on and exceed current CVWD water conservation ordinance by 15% community-wide by 2020
I 508 8.2 $816,657 $5,000 $9.84
17,047 homes, use of 350 gal/home/day, 15% savings under ordinance, domestic water cost of $0.0025/gallon, avg, .0054 kWh energy use per gallon. 326,663,137 gal saved, 1,763,980 kWh saved
BUILD - 5 Government
Initiatives
New and Efficient Construction: Promote the Savings by Design Program from SCE for new commercial buildings.
II 93 0.5 $47,215 $1,000 $10.75 Provide information to local builders on how to access and leverage this design assistance; 25 homes a year
GOVERN - 6 Government
Initiatives
Efficient and Green New Construction: Establish policy that 100% of new municipal buildings and major remodels adhere to Voluntary Green Building Program standards and are minimum LEED Silver or equivalent
II 158 0.6 $58,290 $2,000 $12.66 25% electricity and natural gas savings, 100,000 sq. ft., $0.126/kWh, $1.06/therm savings 389,000 kWh, 8,750 therms
MOBILITY - 6 Transportation
Buses: Promote the benefits of buses with a goal to increase ridership by 1,000 daily riders, provide promotions and incentives for new riders
II 556 1.5 $151,449 $7,500 $13.49 1,000 additional passengers, 9.8 mile avg trip length, savings of 181,574 gal/yr., increases of 121,015 gal/yr. of diesel ($3.50/ gal. of gas and $4.00/gal. of diesel))
RECREATE - 5 Transportation
Visitor Shuttles: Collaborate with local hotels and resorts to support and establish effective point-to-point transportation for visitors, e.g. shuttles to airport, hotels, business district
I 3,496 1.6 $155,483 $50,000 $14.30
292,000 trips avoided; 200 users per day for 8 years. 9.4 passengers per vehicle, 2.7 leverage factor, 9.8 miles avg trip length, 19.7 avg passenger fuel economy. ($3.50/ gal. of gas)
WORK - 1 Commercial
Buildings
Commercial Energy Audits: Work with DCEP to promote energy audits for 1,000,000 square feet of commercial buildings and confirm replacement/upgrade schedules
III 730 2.5 $245,658 $12,000 $16.44
1,000,000 sf community wide (approx. 50 buildings), 15.6 kWh/sf usage .35 therms/sf usage, achieve 10% electricity and natural gas savings post-audit, savings of 1,558,000 kWh, 35,000 therms
MOBILITY - 13
Transportation Van Pools: Partner and recognize all CC major employers with over 50 employees for van pools
III 287 1.1 $106,599 $5,000 $17.42
500 employees offered carpool/vanpool, 10% reduction in commute vehicle trips, 25 mile avg. one-way length, 19.7 mpg avg fuel economy…resulting in 600,000 VMT reduction, 30,457 gallons of gas savings annually ($3.50/ gal. of gas)

Cathedral City 2013 Climate Action Plan 61
Sphere GHG Sector
Linkage Measure Phase
Annual Savings
(Tonnes CO2e)
Job Creation Estimate
Annual Savings
Estimated Implementation
Cost to City
Efficacy ($/tonne
CO2e) Assumptions
WORK - 8 Transportation
Car-Pooling and Mass Transit: Promote "Shared Vehicle at Work" programs with a goal to increase carpooling and mass transit by 20% with a "guaranteed-ride home"
II 114 0.2 $22,652 $2,000 $17.54 Increase employee use of alternative transportation by 20%, Assumed 200 employees, 32 mile round trip, 6,472 gallons gas saved ($3.50/ gal. of gas)
MOBILITY - 1 Transportation
Electric Vehicles: Promote the lease and purchase of electric vehicles in the community with recognition and preferential parking for participants. Goal of 250 vehicles
III 1,994 4.4 $444,164 $40,000 $20.06
250 new electric cars, 19.7 mpg vehicle replaced, 10,000 average annual miles per vehicle, $3.50/gal gas, $0.207/kWh saving 126,904 gallons of gas, ($3.50/ gal. of gas)
WORK - 4 Commercial
Buildings
"The Temperature Club:" Promote community partnership through policies to adjust indoor temperatures to save/degree
I 97 0.5 $48,450 $2,000 $20.62 100 business participating, 4,000 kWh/yr. reduction 100 therms/yr. reduction
MOBILITY - 14
Transportation
Senior Vehicle Tune-Ups: Introduce and implement "Senior Vehicle Diagnostic Program" to target and incentivize seniors to tune and maintain their vehicles on a regular basis
II 235 0.1 $11,655 $5,000 $21.28
Assume 100 tune ups a year from 2 "Tune-Up Drives" saving 10% of the fuel of a 5,000 VMT senior vehicle getting 15 mpg, 3,330 gallons of gas saved/yr. for 8 years. Total 26,640 gallons saved
MOBILITY - 10
Transportation
Bike Distribution: Provide 50 bikes to local residents during annual distribution for three years and part of an existing city program
I 39 0.1 $14,592 $1,000 $25.64
150 bikes assumed as part of a program similar to the Safe Routes to Schools program. 180 school days a year, 1 trip per day for 3 miles (annualized) with 50% of those trip displacing a vehicle saves 82,125 miles or 4,169 gal/yr. ($3.50/ gal. of gas)
GOVERN - 11 Government
Initiatives
Group Purchasing: Promote and participate in group purchasing of energy efficiency goods and services with other CVAG cities/tribes
III 72 0.4 $40,000 $2,000 $27.78 Assume additional measures undertaken from $10,000 of savings to achieve 250,000 kWh savings
MOBILITY - 11
Transportation
"Walking School Bus:" Collaborate with school district and neighborhood officials to create a Safe Routes to School ("Walking School Bus") program to increase walking to school by 10%
III 68 0.3 $25,137 $2,000 $29.41
1,000 participating students who either walk or bike instead of being driven. 180 school days, 3 miles avg. drive, 19.7 mpg vehicle 141,480 miles, saving 7,182 gallons per year ($3.50/ gal. of gas)
RECREATE - 9 Water
Golf Course Water Management Recognition: Promote highly efficient irrigation sensors, water pumping and delivery for golf courses with Council recognition
II 169 2.1 $211,900 $5,000 $29.59
CAPPA Calc for Irrigation Control Sensors, 500 acres of lawn with irrigation control sensors, $.0025/gal of water, 652,000 gallons of water used per acre, .0035 kWh used per gal, 25% water savings
LIVE - 11 Water Landscaper Certification: Require all licensed landscapers to be certified by CVAG
I 156 2.0 $195,600 $5,000 $32.05
30% savings in landscaping water usage, 400 acres of lawn in the community, 652,000 gallons of water used per acre, $0.0025 price per gallon of water, 0.0035/kwh per gallon

Cathedral City 2013 Climate Action Plan 62
Sphere GHG Sector
Linkage Measure Phase
Annual Savings
(Tonnes CO2e)
Job Creation Estimate
Annual Savings
Estimated Implementation
Cost to City
Efficacy ($/tonne
CO2e) Assumptions
RECREATE - 8 Water
Drought-Tolerant Landscaping: Promote reduced need for golf course irrigation through design and use of drought-tolerant plants
II 30 0.1 $10,927 $1,000 $33.33 5-9 hole, 4-18 hole, and 2-18 hole short courses in City; assume average of 200,000 gal/day…average of 2% energy savings achieved: saving 86,724 kWh/yr.
BUILD - 9 Residential Buildings
Green Homes Tours: Administer “Green Homes Tours” annually to showcase six projects each year
II 93 0.5 $47,215 $4,000 $43.01
Provide tours at minimal cost to local homes and businesses: 1 tour a year; Assume tours and publicity stimulate of 25 additional green homes to existing program in the city
MOBILITY - 2 Transportation
Hybrid Vehicles: Promote the purchase of hybrid vehicles in the community with recognition and preferential parking for participants. Goal of 600 vehicles
III 1,974 7.3 $732,900 $100,000 $50.66 600 cars saving 349 gallons per vehicle/yr. resulting in 206,692 gallons saved annually ($3.50/ gal. of gas)
MOBILITY - 5 Transportation
Eco-Conscious Driving: Promote eco-conscious driving behavior to increase fuel efficiency by 5 - 10% and minimize emissions and maintenance. Aka "hyper-miling."
II 94 0.4 $35,000 $5,000 $53.19
400 participants who travel 10,000 miles per year in a vehicle that averages 19.7 mpg, saves 5% or 25 gallons per year after implementing eco-conscious driving behavior. ($3.50/ gal. of gas)
LEARN - 3 Cross-Cutting
Initiatives
Green Building Lectures and Continuing Education: Provide lectures, seminars and training on green building based on guide and training materials emphasizing desert conditions and opportunities
II 91 0.5 $47,595 $5,000 $54.95
Assume 20 new homes added per year: avg. 3000 sq. ft.; Assume 25% savings of electricity and nat. gas; resulting in 234,000 kWh and 5,250 therms saved annually
LIVE - 10 Solid Waste Solid Waste Pick-Up: Restructure and coordinate bulky and regular waste pick-up to maximize efficiency and reduce VMT
I 14 1.3 $133,920 $1,000 $71.43 Reduce Burrtec fleet fuel consumption 3% for overall regular and bulky pick-up routes. Overall Burrtec fleet contributes 480 tonnes CO2e saving 14 tonnes.
BUILD - 1 Commercial
Buildings
Lighting Controls: Promote SCE programs to encourage energy-efficient lighting linked to building controls and occupancy sensors
II 205 0.8 $75,521 $15,000 $73.17 250,000 sf of facilities retrofitted with efficient lighting, assumed annual lighting usage of 6.85 kWh/sf, 35% lighting savings with retrofit of 599,375 kWh
LEARN - 4 Cross-Cutting
Initiatives
Community Energy Champions: Solicit nominations and promote a Community Energy Champion each year to show value of efficiency and its energy, dollar, and carbon savings
III 25 0.1 $14,442 $2,000 $80.00
Public Relations and Education project stimulating at least 20 untapped homeowners to take significant efficiency action in their homes to save 30% electricity and 5% nat. gas
BUILD - 4 Government
Initiatives
Green Building Support Services: Advance the Voluntary Green Building Program to mandatory green building requirement with technical support services
II 548 2.7 $270,015 $50,000 $91.24
100 new or "gut-rehab" homes at 3,000 square feet average; assume 25% savings off of the typical new construction annual energy usage per sf: resulting in 1,170,000 kWh and 26,250 therms saved annually
GOVERN - 7 Government
Initiatives
Utility Manager Software: Maximize use of the Los Angeles County Energy Enterprise Management Information System (EEMIS) to manage municipal facilities
I 54 0.2 $22,893 $5,000 $92.59 5% of municipal electricity and natural gas 177,925 kWh and 448 therms

Cathedral City 2013 Climate Action Plan 63
Sphere GHG Sector
Linkage Measure Phase
Annual Savings
(Tonnes CO2e)
Job Creation Estimate
Annual Savings
Estimated Implementation
Cost to City
Efficacy ($/tonne
CO2e) Assumptions
GOVERN - 9 Government
Initiatives
Retro Commissioning: Abide by the Retro-Commissioning (RCx) practice and guidelines for qualifying municipal buildings
I 21 0.1 $9,219 $2,000 $95.24 2% of municipal electricity and natural gas 71,170 kWh and 179 therms
LIVE - 1 Residential Buildings
Pool Pumps: Promote high-efficiency, variable speed pool pumps to households at community fairs and retail outlets with a goal to achieve 1,000 pumps
II 493 3.5 $354,384 $50,000 $101.42 1,000 pumps @ 1,712 kWh/annual savings per pump: saving 8,560,000 kWh/yr.
WORK - 7 Solid Waste
Food Waste Composting at Restaurants: Restaurant composting program for food waste with a goal to reach all restaurants that serve more than 100 meals a day
I 47 0.5 $51,200 $5,000 $106.38 Leverage regional restaurant program: Assume additional 300lbs saved/per cap/yr.; assume $1.00 savings per cap/yr.
MOBILITY - 9 Transportation White Bikes: Provide bicycles for daily trips using public/private partnership model
III 17 0.1 $6,485 $2,000 $117.65 50 bikes available, avg 2 trips a day per bicycle, 2 mile avg trip length savings 1,853 gallons of gas, ($3.50/ gal. of gas)
WORK - 9 Water
Water Conservation Ordinance: Build on ordinance with goal to exceed current commercial-sector water conservation ordinance by 20% community-wide by 2020
II 79 1.1 $106,105 $10,000 $126.58
CAPPA Calc for Water Conservation Ordinance, 500 customers, assuming 3,000 gallons of water used per day, saving 20% from ordinance saves 42,441,860 gallons and 229,186 kWh
BUILD - 8 Residential Buildings
Affordable Housing: Promote the construction of energy-efficient affordable housing with private-sector partners
III 193 1.0 $96,900 $25,000 $129.53 100 new housing units, 16,000 kWh and 400 therm typical use annually, 25% savings at 400,000 kWh, 10,000 therms
RECREATE - 4 Government
Initiatives
Ball field Lighting Timers: Promote the installation of timers for all ball field or other recreational lighting at schools and city facilities
II 60 0.2 $22,076 $10,000 $166.67 120 high-pressure sodium lamps cut back 2 hrs. every day saving 175,200 kWh/yr.
RECREATE - 2 Commercial
Buildings
Green Conferences: Build on Sustainability Coordinator's work and continue to work with hospitality sector to define and promote “green” conference venues, hotels, etc.
II 11 0.2 $20,000 $2,000 $181.82
Assume 10 conference days a year: Avg. per "event day" 3 tons solid waste avoided to landfill through conscientious recycling, reusable dishware, double sided printing, reduced promotional paper materials, 2,000 kWh saved through special HVAC and lighting management, travel offsets through carpooling, van pooling, and telecommuting or web based participants, carbon offsets of additional energy needs
MOBILITY - 8 Transportation
Bike, Walking, NEV "Parkway:" Support Parkway 1e11 as a Valley amenity and means to alternative forms of transportation and to promote health in Cathedral City
III 25 0.0 $4,620 $5,000 $200.00 500 weekly trips switching from cars to walking/biking, avg distance 2 miles, 19.7 mpg car displaced, saving 1,320 gallons of gas ($3.50/ gal. of gas)
GOVERN - 8 Government
Initiatives
Benchmarking: Abide by Energy Benchmarking Program to gauge relative energy use and efficiency of municipal facilities
I 21 0.1 $9,219 $5,000 $238.10 2% of municipal electricity and natural gas 71,170 kWh and 179 therms

Cathedral City 2013 Climate Action Plan 64
Sphere GHG Sector
Linkage Measure Phase
Annual Savings
(Tonnes CO2e)
Job Creation Estimate
Annual Savings
Estimated Implementation
Cost to City
Efficacy ($/tonne
CO2e) Assumptions
GOVERN - 14 Solid Waste
Recyclable Take-Out Containers: Promote/mandate take-out alternative containers with a goal to eliminate the use of polystyrene packaging
III 20 0.0 $5,000 $250.00 100 lbs. of containers per capita
LIVE - 14 Water
Drought Tolerant Planting: Promote and augment City, DWA and CVWD rebates for drought tolerant planting, turf replacement and buy-back
II 215 0.0 $55,000 $256.41
500 homes, .5 acre yard, 4 gal of gasoline used per lawn annually, 19lbs of VOC produced per mower annually, 652,000 gallons of water used per acre, 0.0035 kWh used per gallon of water; 163,000,000 gallons, 570,500 kWh, 2,000 gallons of gas. Promote and augment existing City, DWA and CVWD combined rebates
RECREATE - 1 Commercial
Buildings
Net Zero Special Events: Build on Sustainability Coordinator's work and continue to work with the hospitality sector and require special purpose events to be sustainable with net zero energy and waste requirements
II 3 0.0 $1,000 $1,000 $333.33
Assume 10 events a year: Avg. Per event; 1 ton solid waste avoided to landfill through conscientious recycling, reusable dishware, double sided printing, reduced promotional paper materials , 2,000 kWh saved through special HVAC and lighting management, travel offsets through carpooling, van pooling, and telecommuting or web based participants, carbon offsets of additional energy needs
MOBILITY - 4 Transportation
Charging Stations: Foster public/private partnerships to promote 10 additional public access EV charging stations for existing EV and NEV fleets
II 22 0.1 $8,358 $12,500 $568.18 10 EV charging station spaces will save 2,388 gallons of gas ($3.50/ gal. of gas)
LIVE - 13 Water
Gray water-Ready Ordinance: Require all new residential development to be constructed for easy implementation of gray water systems that redirect water from wash basins, showers, and tubs
II 3 0.0 $26 $2,500 $833.33 50 new homes, use of 350 gal/home/day, 30% savings under ordinance, domestic water cost of $0.0025/gallon, avg, .0054 kWh energy use per gallon.
BUILD - 2 Commercial
Buildings
"Cool Roofs": Promote the installation of reflective roofing on commercial properties in the community with recognition for first ten early adopters
II 15 0.1 $8,714 $15,000 $1,000.00 50,000 sf of roof installed, $0.126/kWh, $1.06/therm, $0.25/sf of incremental cost of Energy Star roofing saving 42,100 kWh
LEARN - 5 Cross-Cutting
Initiatives
Internships: Provide student internships in city government each year to focus on updates to the GHG inventory and the climate action plan and to promote energy efficiency in Cathedral City
III 4 0.0 $5,000 $1,250.00 Workforce Development and Riverside County Employment Development Agency
GOVERN - 3 Government
Initiatives
Municipal Facility Efficiency Upgrades...Payback Threshold Policy: Establish energy policy within City's Energy Action Plan to invest in measures with less than a four-year, simple payback
I 20 0.1 $8,661 $28,200 $1,410.00
Municipal upgrades (detailed in EAP) with a payback of less than 4 years produce an annual kWh savings of 68,742 kWh realizing 52% of the EAP Energy Efficiency Goal of 132,391 kWh

Cathedral City 2013 Climate Action Plan 65
Sphere GHG Sector
Linkage Measure Phase
Annual Savings
(Tonnes CO2e)
Job Creation Estimate
Annual Savings
Estimated Implementation
Cost to City
Efficacy ($/tonne
CO2e) Assumptions
LEARN - 6 Cross-Cutting
Initiatives
Workforce Development: Promote workforce development in partnership with College of the Desert, UCR, and CSUSB to achieve 1,000 "green careers" by 2020
II 4 0.0 $10,000 $2,500.00 Workforce Development and Riverside County Employment Development Agency
BUILD - 7 Residential Buildings
Shade Trees: Promote properly sited and selected shade trees in 100% of new construction to reduce heat islands and provide shade to offset air conditioning
I 35 0.1 $12,240 $112,000 $3,200.00 500 trees, $0.126/kWh, 204 kWh saved per mature tree annually, $224 to plant each tree (CAPPA defaults) saves 102,000 kWh
MOBILITY - 7 Transportation Biking and Walking: Expand bikeways, trails, and walking paths connecting residential neighborhoods and commerce
II 24 0.0 $4,620 $200,000 $8,333.33
1,000 weekly trips switching from cars to walking/biking, avg distance 1 mile, 19.7 mpg car displaced, saving 1,320 gallons of gas ($3.50/ gal. of gas)
GOVERN - 5 Government
Initiatives
Municipal Facility Efficiency Upgrades: Complete 100% of remaining Energy Action Plan measures after 25 % savings has been realized (2015-2020)
III 16 0.1 $7,027 $493,311 $30,831.92 Implement the remaining 55,766 kWh savings developed in EAP. (2015 -2020) Total EAP savings measures (kWh) = 188,157 kWh
GOVERN - 4 Government
Initiatives
Municipal Facility Efficiency Upgrades: Complete balance of municipal facility upgrades (after 4 year payback threshold compliance) to achieve 25% reduction from 2004 baseline
I 18 0.1 $8,020 $563,044 $31,280.22
Assume 132,391 kWh savings required to reach initial EAP 25% savings goal by 2015…68,742 kWh savings realized from 4 year "Payback Threshold Compliance" measure...Leaving 63,649 kWh savings to achieve the remainder of SCE's 25% energy efficiency goal.
GRAND TOTAL OF EMISSION MEASURES 77 56,087 210 $21,034,435 $2,084,555
2020 EMISSIONS REDUCTION TARGET
55,909
EMISSIONS LEFT
-178
Surplus of emissions reduction measures
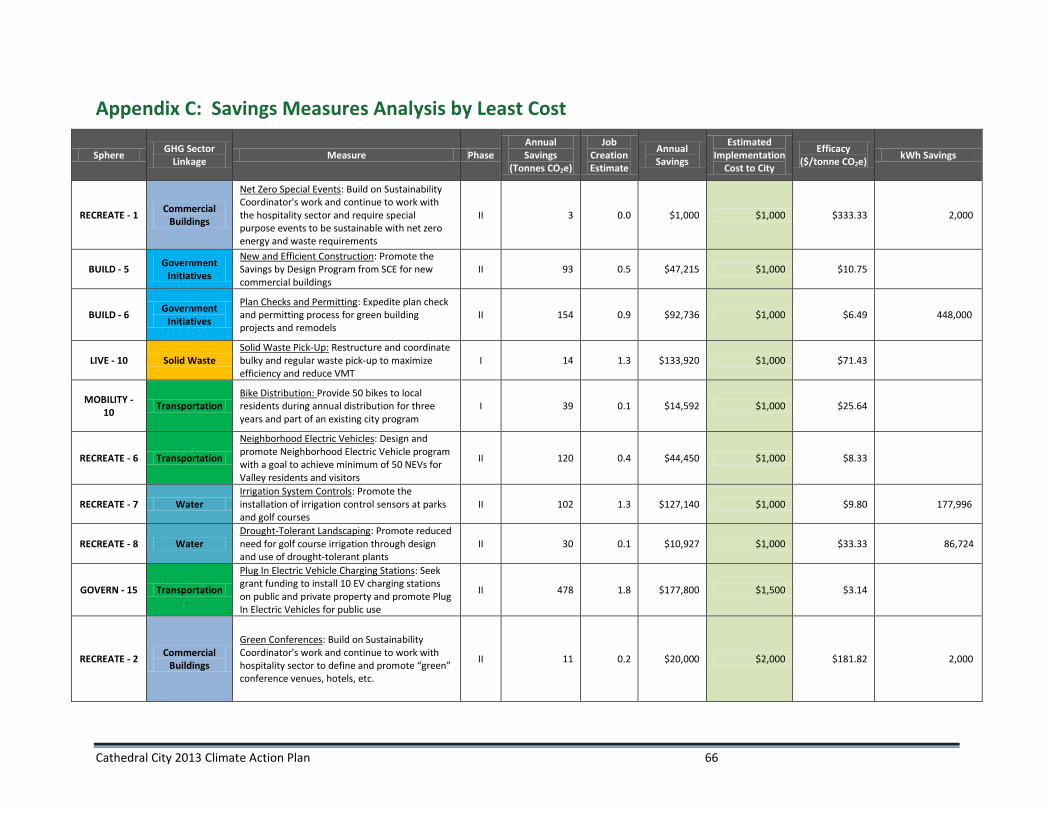
Cathedral City 2013 Climate Action Plan 66
Appendix C: Savings Measures Analysis by Least Cost
Sphere GHG Sector
Linkage Measure Phase
Annual Savings
(Tonnes CO2e)
Job Creation Estimate
Annual Savings
Estimated Implementation
Cost to City
Efficacy ($/tonne CO2e)
kWh Savings
RECREATE - 1 Commercial
Buildings
Net Zero Special Events: Build on Sustainability Coordinator's work and continue to work with the hospitality sector and require special purpose events to be sustainable with net zero energy and waste requirements
II 3 0.0 $1,000 $1,000 $333.33 2,000
BUILD - 5 Government
Initiatives
New and Efficient Construction: Promote the Savings by Design Program from SCE for new commercial buildings
II 93 0.5 $47,215 $1,000 $10.75
BUILD - 6 Government
Initiatives
Plan Checks and Permitting: Expedite plan check and permitting process for green building projects and remodels
II 154 0.9 $92,736 $1,000 $6.49 448,000
LIVE - 10 Solid Waste Solid Waste Pick-Up: Restructure and coordinate bulky and regular waste pick-up to maximize efficiency and reduce VMT
I 14 1.3 $133,920 $1,000 $71.43
MOBILITY - 10
Transportation Bike Distribution: Provide 50 bikes to local residents during annual distribution for three years and part of an existing city program
I 39 0.1 $14,592 $1,000 $25.64
RECREATE - 6 Transportation
Neighborhood Electric Vehicles: Design and promote Neighborhood Electric Vehicle program with a goal to achieve minimum of 50 NEVs for Valley residents and visitors
II 120 0.4 $44,450 $1,000 $8.33
RECREATE - 7 Water Irrigation System Controls: Promote the installation of irrigation control sensors at parks and golf courses
II 102 1.3 $127,140 $1,000 $9.80 177,996
RECREATE - 8 Water Drought-Tolerant Landscaping: Promote reduced need for golf course irrigation through design and use of drought-tolerant plants
II 30 0.1 $10,927 $1,000 $33.33 86,724
GOVERN - 15 Transportation
Plug In Electric Vehicle Charging Stations: Seek grant funding to install 10 EV charging stations on public and private property and promote Plug In Electric Vehicles for public use
II 478 1.8 $177,800 $1,500 $3.14
RECREATE - 2 Commercial
Buildings
Green Conferences: Build on Sustainability Coordinator's work and continue to work with hospitality sector to define and promote “green” conference venues, hotels, etc.
II 11 0.2 $20,000 $2,000 $181.82 2,000

Cathedral City 2013 Climate Action Plan 67
Sphere GHG Sector
Linkage Measure Phase
Annual Savings
(Tonnes CO2e)
Job Creation Estimate
Annual Savings
Estimated Implementation
Cost to City
Efficacy ($/tonne CO2e)
kWh Savings
WORK - 2 Commercial
Buildings
Peak Demand Reduction: Collaborate with SCE and encourage 200 businesses to enroll in Energy Efficiency and Demand Response programs such as the Summer Discount Program
I 482 2.4 $244,000 $2,000 $4.15 1,600,000
WORK - 4 Commercial
Buildings
"The Temperature Club:" Promote community partnership through policies to adjust indoor temperatures to save/degree
I 97 0.5 $48,450 $2,000 $20.62 4,000
WORK - 5 Commercial
Buildings
Commercial On-Bill Financing/Repayment: Encourage On-Bill Financing/Repayment through SCE, SCG with green messaging and teamwork in the community
II 1,440 6.1 $608,230 $2,000 $1.39 4,680,000
GOVERN - 2 Cross-Cutting
Initiatives
Desert Cities Energy Partnership: Continue to actively partner with serving utilities to fully utilize energy efficiency and demand response programs in municipal facilities
I 2,250 9.8 $984,837 $2,000 $0.89 7,816,170
LEARN - 1 Cross-Cutting
Initiatives
Save a Ton Campaign: Work with CVAG to develop and locally market the Save a Ton campaign, unlocking energy, dollar, and carbon savings in 30% of the housing stock
I 2,127 12.7 $1,269,914 $2,000 $0.94 5,653,500
LEARN - 4 Cross-Cutting
Initiatives
Community Energy Champions: Solicit nominations and promote a Community Energy Champion each year to show value of efficiency and its energy, dollar, and carbon savings
III 25 0.1 $14,442 $2,000 $80.00 36,000
GOVERN - 9 Government
Initiatives Retro Commissioning: Abide by the RCx Program and guidelines for qualifying municipal buildings
I 21 0.1 $9,219 $2,000 $95.24 71,170
GOVERN - 11 Government
Initiatives
Group Purchasing: Promote and participate in group purchasing of energy efficiency goods and services with other CVAG cities/tribes
III 72 0.4 $40,000 $2,000 $27.78 250,000
GOVERN - 6 Government
Initiatives
Efficient and Green New Construction: Establish policy that 100% of new municipal buildings and major remodels adhere to Voluntary Green Building Program standards and are minimum LEED Silver or equivalent
II 158 0.6 $58,290 $2,000 $12.66 389,000
LIVE - 3 Residential Buildings
Peak Demand Reduction: Partner with SCE to provide local promotion of the residential Summer Discount Program to cut peak demand in 10% of the housing stock
I 277 2.0 $199,414 $2,000 $7.22 963,356
LIVE - 5 Residential Buildings
Plan Checking and Permitting: Expedite plan check and permitting process for energy-efficiency measures, energy efficient remodels, and renewable energy installations to reduce carbon emissions
II 254 1.4 $144,419 $2,000 $7.87 678,420

Cathedral City 2013 Climate Action Plan 68
Sphere GHG Sector
Linkage Measure Phase
Annual Savings
(Tonnes CO2e)
Job Creation Estimate
Annual Savings
Estimated Implementation
Cost to City
Efficacy ($/tonne CO2e)
kWh Savings
LIVE - 7 Residential Buildings
On-Bill Finance/Repayment: Partner with SCE and SCG to locally promote on-bill financing/repayment for residential energy efficiency retrofits in 15% of housing stock
II 1,616 4.1 $406,686 $2,000 $1.24 6,136,800
MOBILITY - 11
Transportation
"Walking School Bus:" Collaborate with school district and neighborhood officials to create a Safe Routes to School ("Walking School Bus") program to increase walking to school by 10%
III 68 0.3 $25,137 $2,000 $29.41
MOBILITY - 3 Transportation "Golf Cars:" Craft and implement a “golf cars” ordinance to achieve minimum goal of 250 registered vehicles by 2020
II 287 1.1 $106,600 $2,000 $6.97
MOBILITY - 9 Transportation White Bikes: Provide bicycles for daily trips using public/private partnership model
III 17 0.1 $6,485 $2,000 $117.65
WORK - 8 Transportation
Car-Pooling and Mass Transit: Promote "Shared Vehicle at Work" programs with a goal to increase carpooling and mass transit by 20% with a "guaranteed-ride home"
II 114 0.2 $22,652 $2,000 $17.54
BUILD - 3 Government
Initiatives
Green Building Program: Promote Voluntary Green Building Program to prepare for enhanced Title 24 requirements and green building standards
I 548 2.7 $270,015 $2,500 $4.56 1,170,000
LIVE - 4 Residential Buildings
Household Efficiency Audits: Partner with SCE and SCG to provide local promotion for the Home Energy Efficiency Survey to "self audit" homes
II 887 4.6 $464,321 $2,500 $2.82 1,921,000
LIVE - 13 Water
Gray water-Ready Ordinance: Require all new residential development to be constructed for easy implementation of gray water systems that redirect water from wash basins, showers, and tubs
II 3 0.0 $26 $2,500 $833.33 10,348
RECREATE - 3 Cross-Cutting
Initiatives
Comprehensive Pool Efficiency: Promote comprehensive pool efficiency including variable speed pool pumps, covers, wind breaks, and solar heating for 1,000 pools
II 493 3.5 $354,384 $4,000 $8.11 1,712,000
BUILD - 9 Residential Buildings
Green Homes Tours: Administer “Green Homes Tours” annually to showcase six projects each year
II 93 0.5 $47,215 $4,000 $43.01

Cathedral City 2013 Climate Action Plan 69
Sphere GHG Sector
Linkage Measure Phase
Annual Savings
(Tonnes CO2e)
Job Creation Estimate
Annual Savings
Estimated Implementation
Cost to City
Efficacy ($/tonne CO2e)
kWh Savings
WORK - 3 Commercial
Buildings
Energy-Efficient, Commercial-Sector Lighting: With DCEP promote and leverage existing incentives for efficient lighting with special local focus on building owner education and action with goal to eliminate any remaining T-12 lamps in commercial buildings
II 704 2.6 $258,930 $5,000 $7.10 2,055,000
LEARN - 3 Cross-Cutting
Initiatives
Green Building Lectures and Continuing Education: Provide lectures, seminars and training on green building based on guide and training materials emphasizing desert conditions and opportunities
II 91 0.5 $47,595 $5,000 $54.95 234,000
LEARN - 5 Cross-Cutting
Initiatives
Internships: Provide student internships in city government each year to focus on updates to the GHG inventory and the climate action plan and to promote energy efficiency in Cathedral City
III 4 0.0 $5,000 $1,250.00
GOVERN - 10 Government
Initiatives
Transit Oriented Development: Promote transit oriented development to foster development in line with mass transit corridors
II 1,475 1.5 $147,500 $5,000 $3.39
GOVERN - 7 Government
Initiatives
Utility Manager Software: Maximize use of the Los Angeles County Energy Enterprise Management Information System (EEMIS) to manage municipal facilities
I 54 0.2 $22,893 $5,000 $92.59 177,925
GOVERN - 8 Government
Initiatives
Benchmarking: Abide by Energy Benchmarking Program to gauge relative energy use and efficiency of municipal facilities
I 21 0.1 $9,219 $5,000 $238.10 71,170
WORK - 6 Government
Initiatives
Commercial PACE Program: Partner and aggressively promote commercial PACE program to provide commercial property owners —from retail to resorts—with property-secured funding for 100% of the cost of energy efficiency upgrades/renewable energy installations
II 5,129 21.3 $2,128,440 $5,000 $0.97 16,790,581
GOVERN - 14 Solid Waste
Recyclable Take-Out Containers: Promote/mandate take-out alternative containers with a goal to eliminate the use of polystyrene packaging
III 20 0.0 $5,000 $250.00
LIVE - 8 Solid Waste Solid Waste Diversion: Increase solid waste diversion to achieve an average annual goal of 55% through 2015
I 1,525 0.0 $5,000 $3.28
LIVE - 9 Solid Waste Solid Waste Diversion: Increase solid waste diversion to achieve an average annual goal of 65% through 2020
III 2,545 0.0 $5,000 $1.96

Cathedral City 2013 Climate Action Plan 70
Sphere GHG Sector
Linkage Measure Phase
Annual Savings
(Tonnes CO2e)
Job Creation Estimate
Annual Savings
Estimated Implementation
Cost to City
Efficacy ($/tonne CO2e)
kWh Savings
WORK - 7 Solid Waste
Food Waste Composting at Restaurants: Restaurant composting program for food waste with a goal to reach all restaurants that serve more than 100 meals a day
I 47 0.5 $51,200 $5,000 $106.38
MOBILITY - 12
Transportation
Bus Route Maximization: Collaborate with SunLine officials to reform routes to promote smaller buses with more routes and frequencies with a goal to increase ridership by 1,500 riders
II 834 2.3 $227,172 $5,000 $6.00
MOBILITY - 13
Transportation Van Pools: Partner and recognize all CC major employers with over 50 employees for van pools
III 287 1.1 $106,599 $5,000 $17.42
MOBILITY - 14
Transportation
Senior Vehicle Tune-Ups: Introduce and implement "Senior Vehicle Diagnostic Program" to target and incentivize seniors to tune and maintain their vehicles on a regular basis
II 235 0.1 $11,655 $5,000 $21.28
MOBILITY - 15
Transportation
Car Sharing: Promote ZIP and/or other Car Share programs through preferential parking and promotion with signage with a goal to serve 5% of existing drivers who each reduce their driving by 25%
II 579 2.2 $215,356 $5,000 $8.64
MOBILITY - 5 Transportation
Eco-Conscious Driving: Promote eco-conscious driving behavior to increase fuel efficiency by 5 - 10% and minimize emissions and maintenance. Aka "hyper-miling."
II 94 0.4 $35,000 $5,000 $53.19
MOBILITY - 8 Transportation
Bike, Walking, NEV "Parkway:" Support Parkway 1e11 as a Valley amenity and means to alternative forms of transportation and to promote health in Cathedral City
III 25 0.0 $4,620 $5,000 $200.00
LIVE - 11 Water Landscaper Certification: Require all licensed landscapers to be certified by CVAG
I 156 2.0 $195,600 $5,000 $32.05 273,840
LIVE - 12 Water Water Conservation Ordinance: Build on and exceed current CVWD water conservation ordinance by 15% community-wide by 2020
I 508 8.2 $816,657 $5,000 $9.84 1,763,980
RECREATE - 9 Water
Golf Course Water Management Recognition: Promote highly efficient irrigation sensors, water pumping and delivery for golf courses with Council recognition
II 169 2.1 $211,900 $5,000 $29.59 285,250
LIVE - 2 Residential Buildings
Energy-Efficient Lighting: Work with the DCEP to acquire 12,000 compact fluorescent lamps and LEDs for giveaways to demonstrate their value in homes and leverage ten times the number in household and business applications
I 1,990 12.0 $1,202,256 $6,000 $3.02 5,808,000
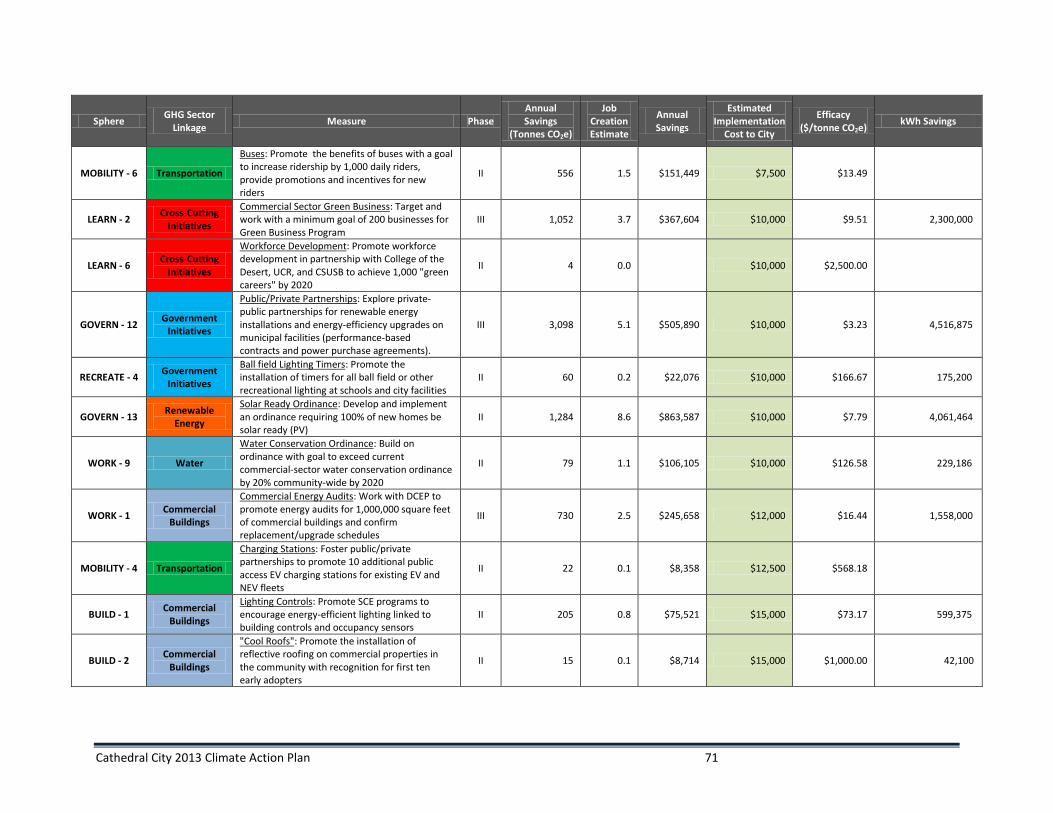
Cathedral City 2013 Climate Action Plan 71
Sphere GHG Sector
Linkage Measure Phase
Annual Savings
(Tonnes CO2e)
Job Creation Estimate
Annual Savings
Estimated Implementation
Cost to City
Efficacy ($/tonne CO2e)
kWh Savings
MOBILITY - 6 Transportation
Buses: Promote the benefits of buses with a goal to increase ridership by 1,000 daily riders, provide promotions and incentives for new riders
II 556 1.5 $151,449 $7,500 $13.49
LEARN - 2 Cross-Cutting
Initiatives
Commercial Sector Green Business: Target and work with a minimum goal of 200 businesses for Green Business Program
III 1,052 3.7 $367,604 $10,000 $9.51 2,300,000
LEARN - 6 Cross-Cutting
Initiatives
Workforce Development: Promote workforce development in partnership with College of the Desert, UCR, and CSUSB to achieve 1,000 "green careers" by 2020
II 4 0.0 $10,000 $2,500.00
GOVERN - 12 Government
Initiatives
Public/Private Partnerships: Explore private-public partnerships for renewable energy installations and energy-efficiency upgrades on municipal facilities (performance-based contracts and power purchase agreements).
III 3,098 5.1 $505,890 $10,000 $3.23 4,516,875
RECREATE - 4 Government
Initiatives
Ball field Lighting Timers: Promote the installation of timers for all ball field or other recreational lighting at schools and city facilities
II 60 0.2 $22,076 $10,000 $166.67 175,200
GOVERN - 13 Renewable
Energy
Solar Ready Ordinance: Develop and implement an ordinance requiring 100% of new homes be solar ready (PV)
II 1,284 8.6 $863,587 $10,000 $7.79 4,061,464
WORK - 9 Water
Water Conservation Ordinance: Build on ordinance with goal to exceed current commercial-sector water conservation ordinance by 20% community-wide by 2020
II 79 1.1 $106,105 $10,000 $126.58 229,186
WORK - 1 Commercial
Buildings
Commercial Energy Audits: Work with DCEP to promote energy audits for 1,000,000 square feet of commercial buildings and confirm replacement/upgrade schedules
III 730 2.5 $245,658 $12,000 $16.44 1,558,000
MOBILITY - 4 Transportation
Charging Stations: Foster public/private partnerships to promote 10 additional public access EV charging stations for existing EV and NEV fleets
II 22 0.1 $8,358 $12,500 $568.18
BUILD - 1 Commercial
Buildings
Lighting Controls: Promote SCE programs to encourage energy-efficient lighting linked to building controls and occupancy sensors
II 205 0.8 $75,521 $15,000 $73.17 599,375
BUILD - 2 Commercial
Buildings
"Cool Roofs": Promote the installation of reflective roofing on commercial properties in the community with recognition for first ten early adopters
II 15 0.1 $8,714 $15,000 $1,000.00 42,100

Cathedral City 2013 Climate Action Plan 72
Sphere GHG Sector
Linkage Measure Phase
Annual Savings
(Tonnes CO2e)
Job Creation Estimate
Annual Savings
Estimated Implementation
Cost to City
Efficacy ($/tonne CO2e)
kWh Savings
GOVERN - 1 Cross-Cutting
Initiatives
Office of Energy Management: Continue to support the Office of Environmental Management and Sustainability to promote energy efficiency with designated and responsible staff
I 2,300 2.3 $230,000 $15,000 $6.52
LIVE - 6 Residential Buildings
Residential PACE: Partner and aggressively promote Residential PACE Program with a goal to reach 25% of homes with property-secured funding for 100% of the cost of energy upgrades and renewable energy systems in eight years
I 8,792 46.7 $4,667,952 $16,000 $1.82 19,487,408
BUILD - 8 Residential Buildings
Affordable Housing: Promote the construction of energy-efficient affordable housing with private-sector partners
III 193 1.0 $96,900 $25,000 $129.53 16,000
GOVERN - 3 Government
Initiatives
Municipal Facility Efficiency Upgrades...Payback Threshold Policy: Establish energy policy within City's Energy Action Plan to invest in measures with less than a four-year, simple payback
I 20 0.1 $8,661 $28,200 $1,410.00 68,742
MOBILITY - 1 Transportation
Electric Vehicles: Promote the lease and purchase of electric vehicles in the community with recognition and preferential parking for participants. Goal of 250 vehicles
III 1,994 4.4 $444,164 $40,000 $20.06
BUILD - 4 Government
Initiatives
Green Building Support Services: Advance the Voluntary Green Building Program to mandatory green building requirement with technical support services
II 548 2.7 $270,015 $50,000 $91.24 1,170,000
LIVE - 1 Residential Buildings
Pool Pumps: Promote high-efficiency, variable speed pool pumps to households at community fairs and retail outlets with a goal to achieve 1,000 pumps
II 493 3.5 $354,384 $50,000 $101.42 8,560,000
RECREATE - 5 Transportation
Visitor Shuttles: Collaborate with local hotels and resorts to support and establish effective point-to-point transportation for visitors, e.g. shuttles to airport, hotels, business district
I 3,496 1.6 $155,483 $50,000 $14.30
LIVE - 14 Water
Drought Tolerant Planting: Promote and augment City, DWA and CVWD rebates for drought tolerant planting, turf replacement and buy-back
II 215 0.0 $55,000 $256.41
MOBILITY - 2 Transportation
Hybrid Vehicles: Promote the purchase of hybrid vehicles in the community with recognition and preferential parking for participants. Goal of 600 vehicles
III 1,974 7.3 $732,900 $100,000 $50.66

Cathedral City 2013 Climate Action Plan 73
Sphere GHG Sector
Linkage Measure Phase
Annual Savings
(Tonnes CO2e)
Job Creation Estimate
Annual Savings
Estimated Implementation
Cost to City
Efficacy ($/tonne CO2e)
kWh Savings
BUILD - 7 Residential Buildings
Shade Trees: Promote properly sited and selected shade trees in 100% of new construction to reduce heat islands and provide shade to offset air conditioning
I 35 0.1 $12,240 $112,000 $3,200.00 102,000
MOBILITY - 7 Transportation Biking and Walking: Expand bikeways, trails, and walking paths connecting residential neighborhoods and commerce
II 24 0.0 $4,620 $200,000 $8,333.33
GOVERN - 5 Government
Initiatives
Municipal Facility Efficiency Upgrades: Complete 100% of remaining Energy Action Plan measures after 25 % savings has been realized (2015-2020)
III 16 0.1 $7,027 $493,311 $30,831.92 55,766
GOVERN - 4 Government
Initiatives
Municipal Facility Efficiency Upgrades: Complete balance of municipal facility upgrades (after 4 year payback threshold compliance) to achieve 25% reduction from 2004 baseline
I 18 0.1 $8,020 $563,044 $31,280.22 132,391
GRAND TOTAL OF EMISSION MEASURES 77 56,087 210 $21,034,435 $2,084,555
104,342,737
2020 EMISSIONS REDUCTION TARGET
55,909
EMISSIONS LEFT
-178
Surplus of emissions reduction measures
Appendix D: Cathedral City 2013 Greenhouse Gas Inventory