TABLE OF CONTENTS - uir.unisa.ac.zauir.unisa.ac.za/bitstream/handle/10500/531/dissertation.pdf ·...
177
i USING THE DIFFERENTIAL APTITUDE TEST TO ESTIMATE INTELLIGENCE AND SCHOLASTIC ACHIEVEMENT AT GRADE NINE LEVEL by AMANDA CLAUDIA MARAIS submitted in part fulfilment of the requirements for the degree of MASTER OF EDUCATION - WITH SPECIALISATION IN GUIDANCE AND COUNSELLING at the UNIVERSITY OF SOUTH AFRICA SUPERVISOR: PROF G BESTER JUNE 2007
Transcript of TABLE OF CONTENTS - uir.unisa.ac.zauir.unisa.ac.za/bitstream/handle/10500/531/dissertation.pdf ·...

i
USING THE DIFFERENTIAL APTITUDE TEST TO ESTIMATE INTELLIGENCE AND SCHOLASTIC ACHIEVEMENT AT GRADE NINE LEVEL
by
AMANDA CLAUDIA MARAIS
submitted in part fulfilment of the requirements for the degree of
MASTER OF EDUCATION - WITH SPECIALISATION IN GUIDANCE AND COUNSELLING
at the
UNIVERSITY OF SOUTH AFRICA
SUPERVISOR: PROF G BESTER
JUNE 2007

ii
USING THE DIFFERENTIAL APTITUDE TEST TO ESTIMATE
INTELLIGENCE AND SCHOLASTIC ACHIEVEMENT AT GRADE NINE
LEVEL
by A.C. Marais
Degree : Master of Education – with Specialisation
in Guidance and Counselling
University : University of South Africa
Supervisor : Prof G. Bester
SUMMARY
The newly developed Differential Aptitude Test – Form S (DAT) does not give
an indication of general intelligence or expected achievement in Grade 9. The aim
of the current study was to determine the relationships of the aptitude subtests
(measured by the DAT) with intelligence and achievement. Two affective factors,
motivation and self-concept, as well as study orientation, were included as
variables predicting achievement. An empirical study was carried out in which 60
Grade 9 learners were tested. The variables were measured using reliable
instruments. Correlations were calculated and multiple regression analyses used to
predict achievement. Moderate to high positive correlations between aptitude and
intelligence were found. Affective factors explained more of the variance in
achievement in key subjects than aptitude variables. One conclusion is that Grade
9 achievement measures affective rather than cognitive factors. Recommendations
are made regarding the use of the DAT-S in predicting school achievement.
Key terms:
Academic achievement; Grade 9 learners; Aptitude; Intelligence; Cognitive
factors, Affective factors; Motivation; Self-concept; Study orientation; Prediction

iii
TABLE OF CONTENTS
CHAPTER 1
AWARENESS AND ANALYSIS OF THE PROBLEM, AIM AND
PROGRAMME OF THE RESEARCH
1.1 Awareness of the problem 1
1.2 Formal statement of the problem 6
1.3 Aim of the research 7
1.4 Programme of the research 8
CHAPTER 2
INTELLIGENCE AND APTITUDE
2.1 Introduction 9
2.2 Intelligence and aptitude 10
2.3 What is intelligence? 11
2.3.1 Factor-analytic approaches 12
2.3.1.1 The two factor theory of Spearman 12
2.3.1.2 Thurstone’s theory of primary mental
abilities 13
2.3.1.3 Guilford’s structure of the intellect 14
2.3.1.4 Gardner’s theory of multiple intelligences 17
2.3.1.5 Cattell and Horn’s theory of fluid and
crystallised intelligence 20
2.3.1.6 Carroll’s three-stratum theory of cognitive
abilities 20
iv
2.3.1.7 The Cattell-Horn Carroll model 22
2.3.2 Developmental approaches 23
2.3.2.1 Piaget’s cognitive-developmental theory 23
2.3.2.2 Vygotsky’s sociocultural theory 28
2.3.3 The information-processing approach 30
2.3.4 Recent approaches to intelligence 30
2.3.4.1 Sternberg’s triarchic theory 32
2.4 Measuring intelligence 33
2.5 What is aptitude? 34
2.6 Measuring aptitude 34
2.7 The relationship between intelligence and aptitude 37
2.8 Conclusion 38
CHAPTER 3
FACTORS AFFECTING ACADEMIC ACHIEVEMENT AT HIGH SCHOOL
LEVEL
3.1 Introduction 40
3.2 Cognitive factors 40
3.2.1 Intelligence and academic achievement 41
3.2.2 Aptitude and academic achievement 46
3.2.2.1 Factors affecting the predictive function of aptitude tests 50
3.2.3 Previous knowledge and achievement 51
3.3 Affective factors 55
3.3.1 Self-concept 56
3.3.1.1 Relative importance of specific and global
self-concepts 57
3.3.1.2 Academic self-concept 57
3.3.1.3 Self-concept and achievement 58
v
3.3.2 Motivation 59
3.3.2.1 Motivation and personality theories 59
3.3.2.1.1 Behavioural view of motivation 60
3.3.2.1.2 Humanistic view of motivation 60
3.3.2.1.3 Cognitive view of motivation 61
3.3.2.2 Motivation and achievement 62
3.4 Study Orientation 65
3.4.1 Study Orientation and achievement 66
3.5 Conclusions 68
CHAPTER 4
EMPIRICAL INVESTIGATION
4.1 Introduction 71
4.2 Hypotheses 71
4.3 Research design 77
4.3.1 Sample 77
4.3.2 Measuring instruments 79
4.3.2.1 Intelligence 79
4.3.2.1.1 Reliability of the Senior South
African Individual Scale – Revised 81
4.3.2.1.2 Validity of the Senior South
African Individual Scale – Revised 83
4.3.2.2 Aptitude 84
4.3.2.2.1 Reliability of the Differential
Aptitude Test Form S 86
4.3.2.2.2 Validity of the Differential
Aptitude Test Form S 87
4.3.2.3 Self-concept and motivation 89
vi
4.3.2.3.1 Reliability of the self-concept and
motivation questionnaire 90
4.3.2.3.2 Validity of the self-concept and
motivation questionnaire 91
4.3.2.4 Study orientation 92
4.3.2.4.1 Reliability of the Survey of Study
Habits and Attitudes 94
4.3.2.4.2 Predictive validity of the Survey
of Study Habits and Attitudes 95
4.3.2.5 Scholastic achievement 96
4.3.2.6 Previous knowledge 97
4.4 Research method 98
CHAPTER 5
RESULTS OF THE EMPIRICAL INVESTIGATION
5.1 Introduction 100
5.2 Testing of the hypotheses 100
5.2.1 Hypothesis 1 100
5.2.1.1 Explanation of the variance in intelligence 106
5.2.1.1.1 Explanation of the variance in
verbal intelligence 107
5.2.1.1.2 Explanation of the variance in
nonverbal intelligence 108
5.2.1.1.3 Explanation of the variance in
general intelligence 108
5.2.2 Hypothesis 2 110
5.2.3 Hypothesis 3 117
5.2.4 Hypothesis 4 118

vii
5.2.4.1 Explanation of the variance in scholastic
achievement using aptitude variables 119
5.2.4.1.1 Explanation of the variance in a
first language (English)
achievement 121
5.2.4.1.2 Explanation of the variance in
Mathematics achievement 121
5.2.4.1.3 Explanation of the variance in
Natural Sciences achievement 122
5.2.4.1.4 Explanation of the variance in
Human and Social Sciences
Achievement 123
5.3 Explanation of the variance in scholastic achievement using
aptitude variables, affective factors and study orientation 124
5.3.1 Explanation of the variance in achievement in a first
language (English) 124
5.3.2 Explanation of the variance in Mathematics
Achievement 125
5.3.3 Explanation of the variance in Natural Sciences
Achievement 126
5.3.4 Explanation of the variance in Human and Social
Sciences achievement 127
5.4 Conclusions 129
CHAPTER 6
EDUCATIONAL IMPLICATIONS AND RECOMMENDATIONS
6.1 Introduction 135
6.2 Recommendations 136
viii
6.2.1 Subject choice 136
6.2.2 Learning problems and poor performance 137
6.2.2.1 Identification of the presence of learning
problems 137
6.2.2.2 Diagnosis and remediation of learning
problems 137
6.2.3 Differentiation of the difficulty level of
Schoolwork 143
6.2.4 Emotional and behavioural problems 143
6.3 Evaluation of the investigation 146
6.4 Possibilities for future research 148
References 150 Appendix: Self-concept and motivation questionnaire

Student number: 608-242-4
I declare that “USING THE DIFFERENTIAL APTITUDE TEST TO ESTIMATE
INTELLIGENCE AND SCHOLASTIC ACHIEVEMENT AT GRADE NINE LEVEL”
is my own work and that all the sources that I have used or quoted have been indicated
and acknowledged by means of complete references.
______________________ ______________________
SIGNATURE DATE
(MRS A C MARAIS)

1
CHAPTER 1
AWARENESS AND ANALYSIS OF THE PROBLEM, AIM AND
PROGRAMME OF THE RESEARCH
People are busily living their lives forward, they are oriented toward the future.
Gordon Allport
1.1 AWARENESS OF THE PROBLEM
The above quotation is true for most people but has particular relevance to
adolescents who are on the brink of adulthood. During adolescence young people are
deciding what is important to them and making commitments to certain courses of
action in order to attain their goals and ambitions. Optimal scholastic progress and
making informed academic decisions will increase the likelihood of eventual success
in their academic and vocational life.
In order to assist learners in achieving their academic and eventual career goals it
becomes necessary to determine the factors that facilitate scholastic achievement
through psychological measurement (Cohen & Swerdlik 2002:288). Knowledge
obtained in this way gives direction to decisions made by the learners themselves,
their parents, teachers, counsellors and psychologists working in the school system.
Bloom (1976:10) identified three main variables which are related to academic
achievement, namely:
• Cognitive variables: These are variables such as intelligence, aptitude and
thoughts about a learning task.
• Affective variables: These are variables such as motivation, self-concept and
interest with which the learner approaches a task.

2
• Quality of instruction: This includes aspects such as good explanations,
participation in the learning events, application of the learning content and
regular evaluation.
Cognitive and affective variables are entry factors which lie within the learner and
precede the learning process. Quality of instruction lies outside the learner and varies
from teacher to teacher. In a high school situation where different subjects are taught
by different teachers, it is difficult to research a variable such as quality of instruction.
Therefore Bester (1998:10) used study orientation as a variable to predict scholastic
achievement.
As stated above, intelligence and aptitude are cognitive variables which influence
learning events. Intelligence is usually seen as g – the general complex problem-
solving ability common to many skills, while aptitude refers to s – specific abilities,
each involved in a certain domain or skill. However, research findings have revealed
that the level of g, or general intelligence is very high in tests of specific intellectual
factors. Intelligence and aptitude, therefore appear to have more similarities than
differences from each other (De Bruin 1997:14). For this reason, in the past, aptitude
has been used to predict intelligence. The Junior Aptitude Test (Verwey &
Wolmarans 1983:71) and Senior Aptitude Test (Fouché & Verwey 1994:54) were
previously used in this way. In so doing, they furnished not only information about
the learner’s specific abilities, but also about his or her approximate level of general
intelligence, both of which are important in predicting achievement at school.
The Differential Aptitude Tests were developed in order to be used with all South
African learners (Vosloo, Coetzee & Claassen 2000:1) and to replace the older Junior
Aptitude Test and Senior Aptitude Test. Due to their recent publication little research
has been carried out using these tests. Firstly, the Differential Aptitude Test Form S
(DAT-S), for Grade 7 to 10 learners, has not been studied with regard to the
prediction of general intelligence in learners.

3
There are important applications of intelligence scores in education. Grade 9 learners
need to know their level of general ability so that they will be in a position to decide
whether they are more suited to remain at school or to leave school at the end of the
General Education and Training Band. They could then, for example enter a college
or other learning institution. Another application of intelligence scores is to identify a
learning problem. The existence of a learning problem is usually inferred when there
is a discrepancy between a learner’s intelligence score and his or her scholastic
achievement (Wicks-Nelson & Israel 1997:272).
The test developers give guidelines to obtain only a rough indication of a learner’s
general ability (Vosloo et al. 2000:36-37). They state that Test 2: Verbal Reasoning is
the one test which gives the best indication of the general intellectual level of the
learner. A more reliable indication, they maintain, will be obtained by taking into
consideration Test 2 score with the scores of Test 3: Nonverbal Reasoning (especially
in the case of learners with a language backlog), Test 4: Computations and Test 5:
Reading Comprehension. They conclude that should a learner obtain a mean stanine
of 7 or higher in these four tests together, he or she will fall in the top 23% of the
population and can be regarded as an above average learner. A mean stanine of 3 or
lower indicates that the learner falls into the bottom 23% of the population and is
considered as having below average intellectual ability and would not be likely to
progress past Grade 9. A mean stanine of 4, 5 or 6 indicates that the learner falls
between the 23rd and 78th percentile, in other words where the majority of his or her
peer group find themselves and can therefore be regarded as an average learner. No
empirical evidence is given for these interpretations of test results. The respective
contributions of the four tests to the estimation of intelligence have not been
determined by the test developers, nor have the possible contributions made by Tests
1, 6, 7, 8 and 9 been investigated.
General intelligence needs to be determined more accurately than what is given by
the test developers of the DAT-S, before the information will be useful in education.

4
Learners at different levels of intellectual ability have different educational needs. For
example, a learner who has above average intelligence, may continue in mainstream
education, follow the standard curriculum and will probably perform better than many
others in the class. Gifted learners, however, have special educational needs. They
need to be provided with enrichment work, for example projects, which will satisfy
their intellectual interests and allow them to achieve their individual potential.
Currently, the New South African Group Test (NSAGT) is used to determine the
intelligence scores of learners in a group situation. The disadvantage of using the
group intelligence test is that information about the learner’s aptitudes is not obtained.
Therefore, educational psychologists, counsellors, teachers and others in the
education situation can only give limited educational guidance to the learner. Advice
regarding future subject choices, school placement and remedial assistance regarding
specific abilities cannot be provided.
Secondly, the DAT-S's relationship to scholastic achievement has not been studied
widely. Only one study, of limited scope, has been carried out to determine
correlations between scores on the individual tests of the DAT-S and scholastic
achievement in learners (Vosloo et al. 2000:44). The study was carried out on a
sample of 61 Afrikaans speaking, Grade 7 learners in one school. The sample size
used is small when considering the expected wide application of this test in the South
African learner population. The study involved only one grade, therefore nothing is
known about the relationships between the aptitude tests and scholastic achievement
in Grades 8, 9 and 10. Furthermore, the data was obtained from a study with learners
who used the Afrikaans version of the test only. It does not provide information about
the relationship between the English version of the test and achievement in English
schools.
During the latter half of Grade 9, learners are required to choose subjects to study in
Grade 10 to Grade 12. For this purpose, learners need to have information about their
specific abilities which will give them an indication of how well they can expect to
5
achieve in certain subjects. The test developers state that certain combinations of
DAT-S test scores give an indication of whether a learner is academically inclined,
technically orientated or more suited to clerical, business-type tasks. Knowledge of
the orientation of the learner can indicate that the learner should take certain subjects,
for example a learner who is technically orientated may be advised to take Technical
Drawing as a subject. There is no empirical evidence, however, to support the
assertion that high scores in a certain group of DAT tests will lead to high
achievement in specific school subjects.
Any attempt at prediction of academic performance also has to take affective factors
into account (Bloom 1976:10). Two of the most important factors that influence
school achievement are the learner’s self-concept and motivation regarding academic
tasks.
Many studies focus on one variable or on only a limited number of variables which
makes prediction difficult because the interaction between different variables is
ignored (Bester 1998:6). For example, in a study carried out by Brodnick and Ree
(1995:583-594) only intelligence and socio-economic status with regard to
achievement were studied. Intelligence explained 45% of the variance in achievement
but socio-economic status could not explain any more of the variance. Affective
variables such as self-concept and motivation, which could have contributed to the
variance in the above study were not included. The researchers themselves pointed
this out as a weakness in the study. The newly developed DAT-S has not been used in
research using a combination of affective variables and DAT-S scores, in order to
predict achievement. During the development of the test the researchers used only
aptitude scores to predict achievement (Vosloo et al. 2000:44). When many relevant
variables are used in one study, the most important predictive variables will be
identified.
There are little research results available on the relationship between psychological
variables and achievement in the new subjects (learning areas) developed for the

6
Outcomes Based Education (OBE) system introduced into Grade 9 in 2005. For
example, the old History and Geography subjects have been subsumed under the
subject of Human and Social Sciences, and novel subjects such as Economic and
Management Sciences have been developed. Moreover, assessment methods for
scholastic achievement have changed since the introduction of the OBE approach.
There is less emphasis on formal tests while continuous assessments of class work,
homework and projects take place. Other assessment methods such as peer and self
assessments are also carried out. The relationship between cognitive variables,
affective factors and scholastic achievement, as measured by these methods, is yet to
be ascertained.
1.2 FORMAL STATEMENT OF THE PROBLEM
If there is a strong relationship between two variables, one variable may be used, in a
regression equation, to predict the other. When considering a learner’s potential to
complete school and directions for further study, it is necessary to determine not only
a learner’s specific aptitudes but also his or her general intelligence level. For this
reason aptitude measures have been used in the past to predict intelligence. Currently,
the relationship between the newly developed DAT-S and intelligence measures is
unknown and therefore intelligence cannot be predicted from the aptitude tests.
Scholastic achievement is influenced by many factors. In order to provide support to
the learner an understanding of the role played by different variables is necessary.
Cognitive and affective variables, as well as study habits and attitudes, all have an
influence on scholastic achievement. The specific contribution made by each factor
when the newly developed Differential Aptitude Test is used and new methods of
measuring achievement are implemented, is currently unknown. Therefore, the formal
statement of the problem is based on the following three questions:
• How can individual tests or different combinations of the DAT-S tests be used
to obtain a general intelligence score?
7
• How can the aptitude tests be used to predict achievement in the major subject
areas?
• How can the aptitude tests in combination with other variables, such as self-
concept, motivation and study orientation predict achievement?
1.3 AIM OF THE INVESTIGATION
The aim of the investigation is to determine in what way aptitude, as measured by the
DAT-S, can be used to predict intelligence and how these aptitude measures predict
achievement in Grade 9 learners. The role of aptitude in combination with other
variables such as motivation, self-concept and study orientation in scholastic
achievement will also be investigated.
In the light of the abovementioned aim, a literature study will be carried out to:
• Analyse the constructs intelligence and aptitude, in order to determine the
relationship between them.
• Establish the relationship between intelligence, aptitude and scholastic
achievement.
• Analyse the constructs motivation, self-concept and study orientation and
determine to what extent they relate to scholastic achievement in combination
with aptitude scores.
An empirical investigation will be carried out in order to test hypotheses
regarding the relationship between the constructs of general intelligence and
aptitude, as well as their respective influence on scholastic achievement.
Hypotheses regarding the influence of other variables such as affective factors
and study orientation on scholastic achievement will also be put to the test.

8
1.4 PROGRAMME OF THE RESEARCH
Two cognitive factors are distinguished which are important in scholastic
achievement, namely, general intelligence and aptitude. Both general problem-
solving ability as well as more specific aptitudes, have an influence on a learner’s
performance at school. In chapter 2, these two cognitive constructs will be analysed
in the light of established psychological theory and recent research findings.
When engaged in the educational process the learner is acting as a psychological
whole and for this reason, the respective roles of affective factors and study
orientation are also investigated. An explanation of the constructs of motivation, self-
concept and study orientation will be provided in chapter 3. The main body of this
chapter will deal with the relationships of the cognitive variables, affective factors
and study orientation to scholastic achievement.
In chapter 4 the research design will be described and justified. At the beginning of
the chapter hypotheses with regard to the formal statement of the problem will be
given. A description of the sample, the measuring instruments used for each variable,
and the research method will be provided.
The results of the empirical investigation will be given in chapter 5. The way in
which the stated hypotheses are tested and the results obtained will be explained.
Conclusions will be made regarding the relationship between intelligence and
aptitude, as well as between certain independent variables and scholastic
achievement.
Finally, in chapter 6, the educational implications of the research findings will be
discussed. Guidelines will be provided to users of the DAT-S on how to predict an
intelligence score from the aptitude test results. Recommendations regarding the
optimal combination of cognitive and affective measures as well as study orientation
scores to best predict scholastic achievement will be given.
9
CHAPTER 2
INTELLIGENCE AND APTITUDE
2.1 INTRODUCTION
In order to predict scholastic achievement the most important variables
involved in learning need to be measured. Benjamin Bloom (1976:10)
developed a useful model to identify important factors involved in learning.
He differentiated between three main variables that influence academic
achievement, namely:
• Cognitive entry factors: these are variables such as intelligence,
aptitude and thoughts which the learner brings to the learning task
• Affective entry factors: these are variables such as motivation and self-
concept
• Quality of instruction: this includes aspects such as good explanations,
participation in the learning events, application of the learning content
and regular evaluation.
Cognitive and affective variables are entry factors that lie within the learner
and precede the learning process. Quality of instruction is situated outside the
learner and varies from teacher to teacher.
In a high school situation where different subjects are taught by different
teachers, it is difficult to research a variable such as quality of instruction and
because of this it is better to focus on a learner characteristic that is involved
in the learning process. Instead of the instruction the learner receives, his or
her study habits and study attitudes (study orientation) can be considered.
A representation of Bloom’s model is given below:

10
Learner entry factors Learning process Learning outcome
Cognitive
Achievement
Affective
Study orientation
The above model is used as a framework for this study. In this chapter the
cognitive factors are analysed. Reference is made to prominent theories of
intelligence, such as factor analytic theories, theories of cognitive
development and new perspectives using information-processing models of
intelligence. The concept, aptitude is described and the relationship between
intelligence and aptitude is clarified.
2.2 INTELLIGENCE AND APTITUDE
Both intelligence and aptitude refer to cognitive abilities present in the
individual (Cohen & Swerdlik 2002:257,301). Intelligence refers to those
cognitive abilities, for example verbal reasoning and knowledge of the
meanings of words, which are called upon in a person’s general intellectual
functioning across different areas of achievement (Berk 2000:316). Aptitudes,
however, are specific abilities which are utilised in certain areas of
achievement (Berk 2000:319), for example three dimensional spatial
reasoning is used in architectural drawing.
Intelligence is considered to be a relative stable trait that does not fluctuate
widely through the lifespan (Mussen, Conger, Kagan & Huston 1984:269),
while aptitudes develop and change depending on individual characteristics
and opportunities for learning. Cohen and Swerdlik (2002:301) explain that
aptitudes are formed through the interaction between psychological factors
(such as motivation) and the experiences the person encounters in everyday
life. Aptitudes, therefore, represent a fund of information and skills acquired
over time.
Learning content
11
Aptitudes are used to predict variables such as future success in a given career
which requires certain specific abilities (Vosloo, Coetzee & Claassen 2000:1).
High aptitude scores, for example, in mechanical reasoning and nonverbal
reasoning, may be interpreted as indicating that with further training, a person
will markedly improve his or her performance in engineering-related skills.
An important aspect of aptitude tests is therefore their predictive function.
General intelligence is not usually used to predict success in a specific career
but may be used to advise on the level of career to which a person may aspire.
For example, a person who has a high aptitude for mechanical reasoning and
an average level of intelligence may be advised to become a technician, while
another person who has the same aptitude but an above average level of
intelligence may be advised to become an engineer.
Research findings have revealed, however, that the level of g (general
intelligence) is very high in tests of specific intellectual factors. Intelligence
and aptitude, therefore appear to have more features in common than they
have differences (De Bruin 1997:14).
2.3 WHAT IS INTELLIGENCE?
Intelligence is a difficult construct to define. In a survey carried out by
Snyderman and Rothman (in Li: 1996: 6-9), questioning social scientists and
educators on the nature of intelligence, 99.3% indicated that abstract thinking
or reasoning was an important element of intelligence; 97.7% indicated that
the problem-solving ability was important, and 96% indicated that the capacity
to acquire knowledge was important. This survey therefore emphasises the
importance of thinking, learning and problem solving as elements of
intelligence. In a study asking nearly 500 laypeople and 24 experts to define
intelligence, Sternberg (2000: 316) found that their responses were
surprisingly similar. Both groups viewed intelligence as a complex construct
made up of verbal ability, practical problem solving and social competence.
Intelligence is an important component of learning and academic achievement
because it can be seen as the ability to gain knowledge, to think about abstract
concepts, to reason as well as the ability to solve problems (Li 1996:10).

12
An important consideration which has been in existence since Alfred Binet
constructed the first intelligence test, in 1905, is that while intelligence is
relatively stable, it should not be seen as a fixed characteristic. Matarazzo
(1972: 21) maintains that intelligence should not be studied in isolation but
seen as a quality of the total person as he or she functions in everyday life.
Changing conditions may increase or decrease the functional level of a
person’s intellectual resources.
In an effort to describe the nature of intelligence three basic approaches have
been used: the factor analytic approach where underlying relationships
between sets of intelligence variables are measured; the developmental
approach where the increase in complexity of cognitive functioning is
described, and the information-processing approach where the focus falls on
how the effective intake, processing and output of information occurs.
2.3.1 Factor-analytic approaches
A question pertinent to a factor-analytic explanation of intelligence is
whether intelligence is a general ability or whether it consists of a
number of specific abilities. If intelligence consists of several different
abilities what are they, and what is the relationship between them?
2.3.1.1 The two factor theory of Spearman
Charles Spearman (Spearman & Jones 1950:9-10) regarded the high
positive correlations between items designed to test aspects of
intelligence, such as memory span, spatial ability and sequential
reasoning, as an indication of the presence of a common factor. He
named this the general intelligence factor (g) that is common to many
abilities. At the same time, he saw that the items were not perfectly
correlated with each other. This meant that there were other factors
which were being tested. He consequently suggested that there are
specific intelligence factors (s) that are specifically related to a single
intellectual activity. This view of mental abilities came to be known as
the “two factor theory of intelligence” (Berk 2000:317).

13
2.3.1.2 Thurstone’s theory of primary mental abilities
Louis Thurstone (1938:80) disagreed with the idea that intelligence
comprised an overarching, general factor. He analysed the results of 50
intelligence tests which he administered to college students and came
to the conclusion that there are seven primary mental abilities that
make up a person’s intelligence. The abilities or factors are:
Spatial (S)
The ability to form spatial and visual images (Thurstone 1938:80).
Perceptual (P)
The ability to find or recognise particular items in a perceptual field
(Thurstone 1938:81).
Numerical (N)
The ability to perform simple numerical calculations (Thurstone
1938:83).
Verbal relations (V)
The ability to conceptualise ideas and meanings in language
(Thurstone 1938:84).
Word (W)
The ability to deal with single and isolated words in a fluent manner
(Thurstone 1938:84-85).
Memory (M)
The ability to recognise and recall words, numbers and figures after
having memorised them (Thurstone 1938:52-54).
Inductive Reasoning (I)
The ability to find a rule or principle and apply it. An example of an
item requiring inductive reasoning requires the identification of figures
that belong to a specified category even though they differ in other

14
properties. For example, if the category of shaded shapes is specified,
the respondent must choose shaded shapes in his or her answer even
though the shapes may be of different sizes or kinds (Thurstone
1938:25).
He also tentatively identified two further abilities as factors of
intelligence:
Restrictive Reasoning (R)
The ability to successfully complete tasks that involve restriction in the
solution. Arithmetical reasoning utilises restrictive reasoning as the
answer to an arithmetical calculation is limited to one correct solution.
Deductive Reasoning (D)
The abilty to draw a logical conclusion from a set of assumptions. For
example, the ability to correctly identify that the following item uses
faulty reasoning: Some sports are dangerous, and football is a sport.
Therefore, football is dangerous (Thurstone 1938:47).
2.3.1.3 Guilford’s structure of the intellect theory
Guilford identified many different factors which together make up the
structure of the intellect or intelligence (1967:70, 1985:229-233).
Intelligent functions are defined according to three different
dimensions: operation, content and product. Intelligence, therefore is
seen as comprising abilities which are grouped according to the
different kinds of mental processes used, the type of information
involved, and the form of the information processed.
The mental processes identified by Guilford are:
Cognition
The comprehension or understanding of information.

15
Memory
The ability to recall and recognise information that has been
memorised.
Divergent Production
Creative thinking which involves fluency, flexibility and elaboration
abilities (Guilford 1967:62).
Convergent Production
This refers to thinking in which the one correct answer to a question is
produced (Guilford 1967:62).
Evaluation
Comparing a product of information with known information
according to logical criteria and making a decision concerning criterion
satisfaction is identified as evaluation by Guilford (1967:185).
Comparing two pictures and deciding whether they are the same or
different involves evaluative ability.
These mental processes are used when considering different types of
information, therefore each mental process is discussed as it operates
on different types of information called content categories. The content
categories are:
Visual
The visual category refers to information that is visually perceived, for
example, the correct perception of words that have parts of the letters
missing (Guilford 1967:72).
Auditory
This category refers to information that is heard and therefore auditory
discrimination is important, for example listening to and interpreting a
radio code (Guilford 1967:72).
16
Symbolic
Information that is in the form of tokens or signs and stands for
something else, for example printed language (Guilford 1967:73).
Semantic
Meanings of words comprise semantic content (Guilford 1967:75).
Behavioural
Nonverbal information is involved in human interactions. Awareness
of one’s own and others’ thoughts, emotions, intentions and actions are
among the behavioural factors included here (Guilford 1967:77).
Abilities are not only classified according to the processes and content
but also according to the form in which the information was processed.
The form of information is classified into product categories. The
products identified are:
Units
The most basic form of information is units or parts of wholes. Units
can be seen as chunks of information, for example single words
(Guilford 1967:64).
Classes
A class is a set of objects with one or more common properties, for
example in number classification, the number 22 fits in with the class
formed by the numbers 44, 55 and 33 (Guilford 1967:64).
Relations
A relation is a connection between two things. An item testing the
cognition of relations, for example, may require the identification of
the relation as the movement of a line by 45 degrees in a clockwise
direction. This relation is then applied to another set of figures.

17
Systems
Complexes, patterns or organisations of interdependent or interacting
parts form systems. In testing the cognition of systems, spatial
orientation tasks may be used, where visual rotation and consideration
of many different parts and their changing relationships to each other
are involved.
Transformations
Changes, revisions, redefinitions or modifications, by which any
product of information in one state goes over into another state
involves transformation (Guilford 1967:64). In testing cognition of
semantic transformation, the respondent may have to explain the many
different ways in which two common objects, such as an apple and an
orange, are alike. This involves the redefinition of the objects by
emphasising one attribute or another (Guilford 1967:102).
Implications
An implication is something expected, anticipated or predicted from
given information. In an item testing the cognition of symbolic
implications, different words are placed in relation to each other in the
manner of a crossword so that the words may be read down or across.
Considering the position of the letters gives rise to the expectation that
one of the other words would fit in a certain place (Guilford 1967:104-
105).
The three different dimensions are used to describe different kinds of
intelligent thinking. A learner who needs to give the word “femur” in
response to the clue, “the thigh bone”, will be using the following
structures of the intellect: convergent production (only one correct
answer) of a unit (one word) that is symbolic (language) in nature. The
type of thinking used in the above example is abbreviated as NSU.
2.3.1.4 Gardner’s theory of multiple intelligences

18
Gardner (1993: 63) defined intelligence as comprising eight different
kinds of processing operations that allow a person to achieve in one or
more of eight culturally meaningful areas. A person who has a high
level of linguistic intelligence and is able to understand and express
ideas well in language may achieve in society as a journalist or a poet
(Berk 2000:323). One who has a high level of spatial intelligence may
become an accomplished cartographer. Gardner does not agree with
the concept of a general intelligence factor (g) and holds that eight
different intelligences are found to a greater or lesser extent in different
individuals. The eight intelligences identified by Gardner are:
Linguistic
A sensitivity to the sounds, rhythms and meanings of words and the
different functions of language.
Logico-mathematical
Sensitivity to and the capacity to detect logical or numerical patterns;
ability to handle long chains of logical reasoning
Musical
Ability to produce and appreciate pitch, rhythm (or melody) and
aesthetic-sounding tones; understanding of the forms of musical
expressiveness
Spatial
To perceive the visual-spatial world accurately, to perform
transformations on those perceptions, and to recreate aspects of visual
experience in the absence of relevant stimuli
Bodily-kinaesthetic
Ability to use the body skilfully for expressive as well as goal-directed
purposes; ability to handle objects skilfully
19
Naturalist
To recognise and classify all varieties of animals, minerals and plants
Interpersonal
The detection and appropriate responding to the moods, temperaments,
motivations and intentions of others
Intrapersonal
Ability to discriminate complex inner feelings and to use them to guide
one’s own behaviour; knowledge of one’s own strengths, weaknesses,
desires and intelligences
Gardner uses neurological evidence to support the existence of
separate intelligences. Damage to a specific part of the brain affecting
one ability, for example linguistic or spatial, while sparing others,
suggests that the affected ability is independent. Prodigies who have an
outstanding talent in one area of ability yet have average ability in
other areas lend support to the theory of the independence of abilities.
Only a few factor analytical studies support the existence of multiple
intelligences as Gardner sees them.
Plucker, Callahan and Tomchin (1996:81-92) carried out a study to
assess the reliability and validity of a battery of instruments based on
multiple intelligence theory to identify talented children. The battery
included performance-based assessments and teacher checklists of
behaviour and performance. The four intelligences investigated were
Linguistic intelligence, Logical-mathematical intelligence, Spatial
intelligence and Interpersonal intelligence. The factor analysis
confirmed only two of the four intelligences investigated. Evidence for
the existence of Linguistic and Logico-Mathematical intelligences was
found through establishing concurrent validity with the Iowa Test of
Basic Skills, measuring language abilities (such as storytelling),
mathematics, reading comprehension and vocabulary. All of the
Interpersonal intelligence activities loaded on Linguistic intelligence,

20
presumably because many interpersonal activities require verbal-
linguistic talent.
Several programmes based on Gardner’s theory of multiple
intelligences have been implemented in schools in the United States of
America. Activities aimed at developing a specific intelligence or set
of intelligences were provided. Evidence is still needed on how
effectively this approach nurtures children’s talents, but there are
indications that they highlight the strengths of some learners who
previously had been considered unexceptional or at risk of school
failure (Berk 2000:353). These programmes may therefore be useful in
identifying talented ethnic minority children who are underrepresented
in schools for the gifted (Suzuki & Valencia 1997:1103-1114).
2.3.1.5 Cattell and Horn’s theory of fluid and crystallised
intelligence
Cattell (in Cohen & Swerdlik 2002:231) proposed a theory that
intelligence consists of two major types of cognitive abilities:
crystallised intelligence and fluid intelligence. Crystallised intelligence
(Gc) refers to acquired skills and knowledge that are dependent on
exposure to a particular culture, as well as formal and informal
education, for example, vocabulary. The abilities that make up fluid
intelligence (Gf) are nonverbal, relatively culture-free, and independent
of specific instruction, for example, memory for digits.
2.3.1.6 Carroll’s three-stratum theory of cognitive abilities
John Carroll (Berk 2000:319) developed a hierarchically arranged
model of cognitive abilities. He used improved factor-analytic
techniques to reanalyse many studies in which the relationships
between mental abilities were determined. This model elaborates on
the models proposed by Spearman, Thurstone and Cattell discussed
above. Carroll represents the structure of intelligence as a pyramid,
with ‘g’, or general intelligence as conceptualised by Spearman, at the
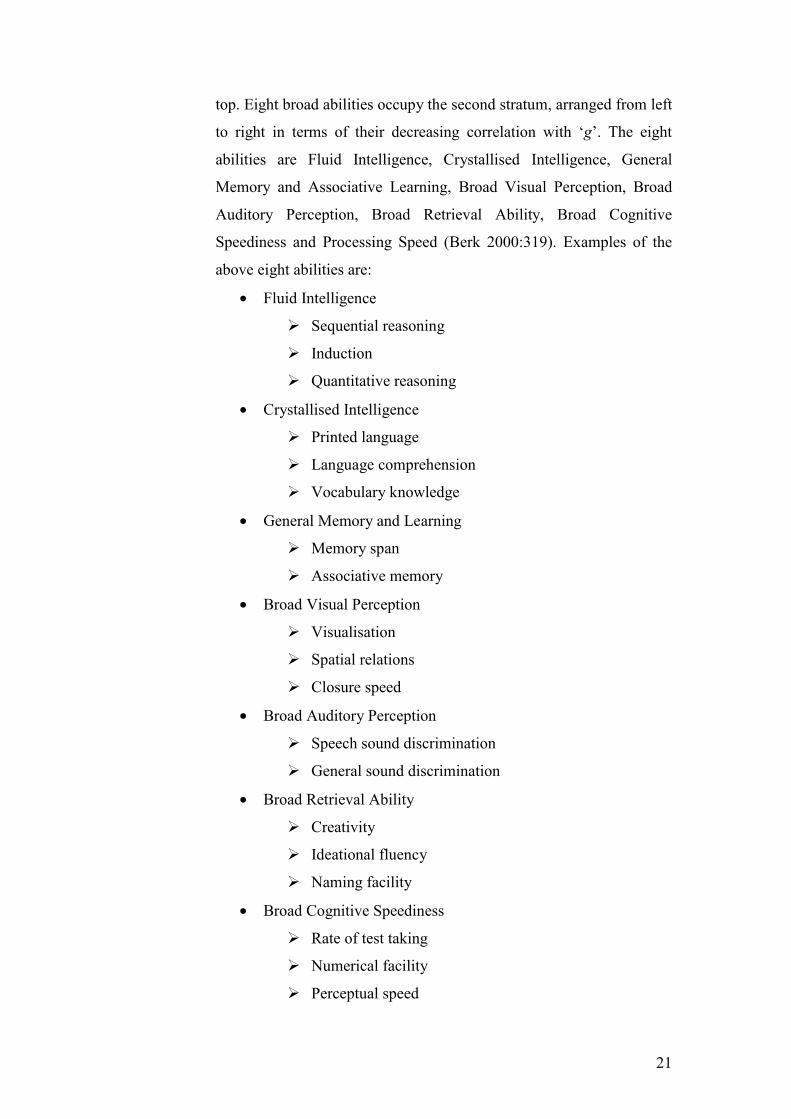
21
top. Eight broad abilities occupy the second stratum, arranged from left
to right in terms of their decreasing correlation with ‘g’. The eight
abilities are Fluid Intelligence, Crystallised Intelligence, General
Memory and Associative Learning, Broad Visual Perception, Broad
Auditory Perception, Broad Retrieval Ability, Broad Cognitive
Speediness and Processing Speed (Berk 2000:319). Examples of the
above eight abilities are:
• Fluid Intelligence
� Sequential reasoning
� Induction
� Quantitative reasoning
• Crystallised Intelligence
� Printed language
� Language comprehension
� Vocabulary knowledge
• General Memory and Learning
� Memory span
� Associative memory
• Broad Visual Perception
� Visualisation
� Spatial relations
� Closure speed
• Broad Auditory Perception
� Speech sound discrimination
� General sound discrimination
• Broad Retrieval Ability
� Creativity
� Ideational fluency
� Naming facility
• Broad Cognitive Speediness
� Rate of test taking
� Numerical facility
� Perceptual speed

22
• Processing Speed
� Simple reaction time
� Choice reaction time
� Semantic processing speed
2.3.1.7 The Cattell-Horn Carroll Model
The Cattell-Horn theory of intelligence was combined with the Carroll
model, initially by McGrew and later by McGrew and Flanagan
(Cohen & Swerdlik 2002:232-233), in an effort to provide a
comprehensive conceptualisation of human cognitive abilities that
many scientists would agree on. This theory could be used in
psychological assessment in education where a comprehensive
assessment of a student’s abilities is necessary. The Cattell-Horn
Carroll (CHC) model holds that there is no general intelligence factor.
According to this model, there are ten broad stratum abilities and over
seventy narrow stratum abilities. Each broad stratum ability includes
two or more narrow stratum abilities. The ten broad stratum abilities
are: Fluid Intelligence (Gf), Crystallised Intelligence (Gc), Quantitative
Knowledge (Gq), Reading/Writing Ability (Grw), Short-Term Memory
(Gsm), Visual Processing (Gv), Auditory Processing (Ga), Long-term
Storage and Retrieval (Glr), Processing Speed (Gs) and
Decision/Reaction Time or Speed (Gt).
Recent studies show that the CHC model offers a better representation
of the structure of intelligence compared to other selected models or
theories. A study was carried out comparing the CHC model to a four-
factor Wechsler intelligence test and an information-processing model
(Mascolo 2002:1084). The Wechsler test measured four abilities,
namely verbal comprehension, working memory, perceptual
organisation and processing speed (Cohen & Swerdlik 2002:269-270).
The study found that the CHC model accounted better for the factor
loadings obtained, supporting the existence of the ten broad stratum
abilities identified by the model. CHC theory can be used in

23
developing and assessing executive functioning, which has
implications for the educational sphere (Sherman 2002:87-195).
2.3.2 Developmental approaches
Human cognition refers to the inner processes and products of the mind that lead
to “knowing” (Berk 2000:221). These abilities develop and become increasingly
complex as a person grows from infancy into adulthood. Developmental
researchers have shed light not only on the nature of cognition at different ages,
but also on how children’s cognitive abilities develop. Two developmental
theories will be discussed here: Jean Piaget’s cognitive-developmental stage
theory and Lev Vygotsky’s sociocultural theory.
2.3.2.1 Piaget’s cognitive-developmental theory
Piaget conceptualised the child’s understanding of the world at any given
developmental period as being represented by mental structures or schemes
(Cohen & Swerdlik 2002:228). The child’s schemes are organised ways of
making sense of experience. As the child moves into the different
developmental phases and interacts with his or her environment, he or she
adjusts and changes his or her schemes so that they are consistent with his or
her environment. In this way the child constructs and reconstructs his or her
understanding of the world and how it works. This understanding contributes
to the child's intelligence.
Piaget defined intelligence as a cognitively driven process of assimilation and
adaptation to the environment (Cohen & Swerdlik 2002:227). The child uses
his or her current schemes or cognitive structures to interpret his or her
environment. The infant who repeatedly moves a cushion out of the way to
find the toy behind it, is assimilating that action into his or her object
permanence scheme. A preschool girl who sees a wild bird through the
window and calls it a “chicken”, has searched through her schemes until she
found one that most closely resembles the new sight. In accommodation the
child encounters information in his or her environment which is inconsistent
with his or her view of the world, as dictated by his or her level of cognitive
development. Through trial and error the child changes or creates new
24
schemes about the environment and how it works. The child’s schemes then
become consistent with what he or she perceives, and the child reaches a
higher, more sophisticated level of cognitive development. The infant boy who
points to the cupboard and calls for the biscuits that he knows are in there, is
modifying his object permanence scheme. The preschool girl who describes
the wild bird as a “small chicken” is changing her “chicken” scheme so that it
is more consistent with her observations. This process of building schemes
through direct interaction with the environment is called adaptation (Berk
2000:223).
Piaget described four different developmental phases that children go through,
representing increasingly complex levels of cognitive understanding.
The first stage is the sensorimotor period which ranges from birth to two years
of age and during which the infant uses his or her senses and movement to
learn about the environment.
The second stage is the preoperational period ranging from 2 to 6 years, during
which there is a great increase in the child’s ability to represent the
environment symbolically, as in language. However, thought is not yet logical.
The third stage is the concrete operational period which ranges from 6 to 12
years and is a major turning point in cognitive development. Concrete
operational reasoning is far more logical, flexible and organised than cognition
during the preschool period. According to Piaget children in this period are
able to perform logical operations only when the subject matter is concrete and
directly perceived by the child. Abstract thinking about ideas that are not
apparent in the real world is not yet present. The child who is capable of
operational thought is able to master the Piagetian tasks of conservation,
hierarchical classification and seriation, including transitive inference.
• Conservation involves the ability to see that a quantity of matter has
not changed even though its form has changed. There is conservation
of number, length, weight and volume. The child is able, for example,

25
to see that a volume of water has not changed when it is poured from a
short, wide glass into a tall, narrow glass. The child who understands
that the volume stays the same, uses logical operations in a correct way
(in this particular instance decentration). If the water is poured back
into the original container, another logical operation is used, namely
reversibility (Berk 2000:249).
• Hierarchical classification involves the ability to classify objects using
superordinate and subordinate categories. If a child is required to
identify which word fits in least with a group of words in a list, the
child will look for common characteristics which enable the
classification of similar objects and the exclusion of one object. In the
following list, “leaves, trunk, roots, branches, sunlight”, the word that
fits in least with the others is the word “sunlight”, as the others refer to
parts of a tree whereas “sunlight” does not (Owen & Vosloo 2000:8).
• The child in the concrete operational period is able to seriate, that is,
order objects along a quantitative dimension, such as length or weight.
Mentally the child can perform transitive inferences if he or she is able
to infer that if stick A is longer than stick B and stick B is longer than
stick C, then Stick A is longer than C. The child’s ability to seriate is
tested in the DAT-S through nonverbal reasoning with figures, for
example by showing him or her a sequence of pictures.
The child has to choose the correct option from a selection which
includes the correct answer (the largest triangle below the smallest
circle with a small part of intersection between the two shapes)
26
amongst other options such as a small circle and triangle next to each
other or a circle featured below a triangle (Owen & Vosloo 1999:17).
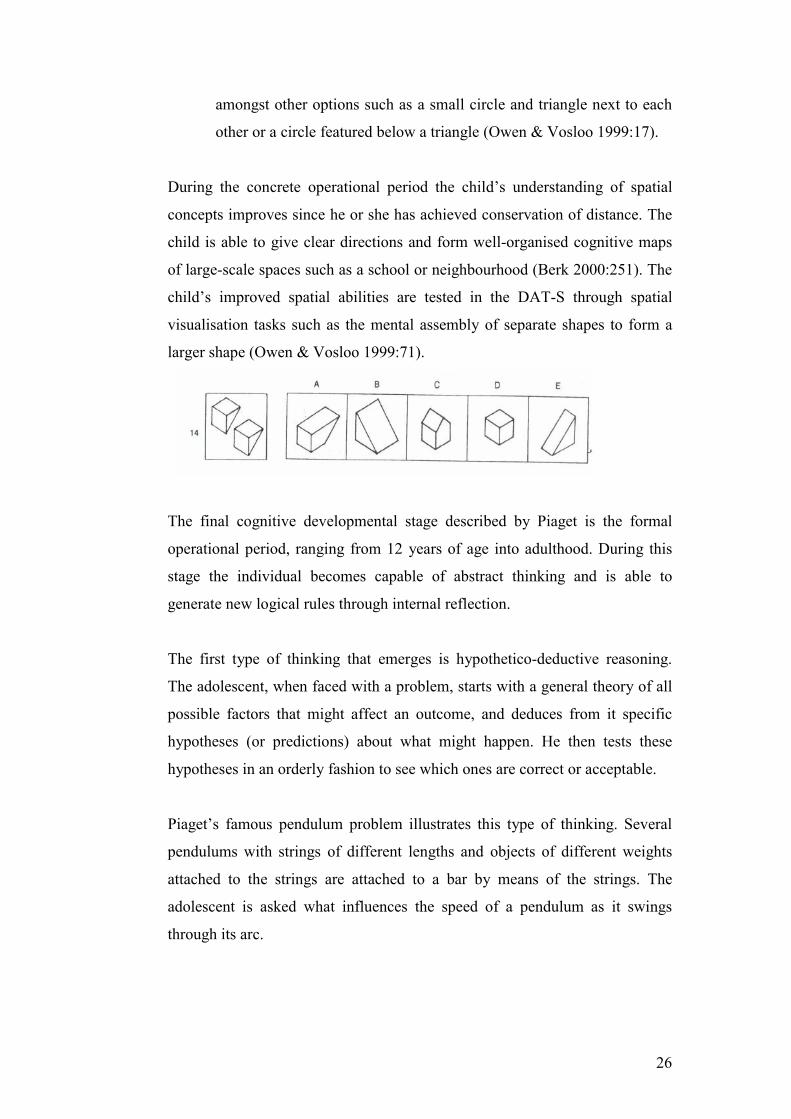
During the concrete operational period the child’s understanding of spatial
concepts improves since he or she has achieved conservation of distance. The
child is able to give clear directions and form well-organised cognitive maps
of large-scale spaces such as a school or neighbourhood (Berk 2000:251). The
child’s improved spatial abilities are tested in the DAT-S through spatial
visualisation tasks such as the mental assembly of separate shapes to form a
larger shape (Owen & Vosloo 1999:71).
The final cognitive developmental stage described by Piaget is the formal
operational period, ranging from 12 years of age into adulthood. During this
stage the individual becomes capable of abstract thinking and is able to
generate new logical rules through internal reflection.
The first type of thinking that emerges is hypothetico-deductive reasoning.
The adolescent, when faced with a problem, starts with a general theory of all
possible factors that might affect an outcome, and deduces from it specific
hypotheses (or predictions) about what might happen. He then tests these
hypotheses in an orderly fashion to see which ones are correct or acceptable.
Piaget’s famous pendulum problem illustrates this type of thinking. Several
pendulums with strings of different lengths and objects of different weights
attached to the strings are attached to a bar by means of the strings. The
adolescent is asked what influences the speed of a pendulum as it swings
through its arc.

27
The adolescent in the formal operational period will come up with four
possible hypotheses: 1) the length of the string, 2) the weight of the object
hung on it, 3) how high the object is raised before it is released and 4) how
forcefully the object is pushed. Then by varying one factor at a time while
holding all others constant, they try out each possibility. Eventually they
discover that only string length makes a difference.
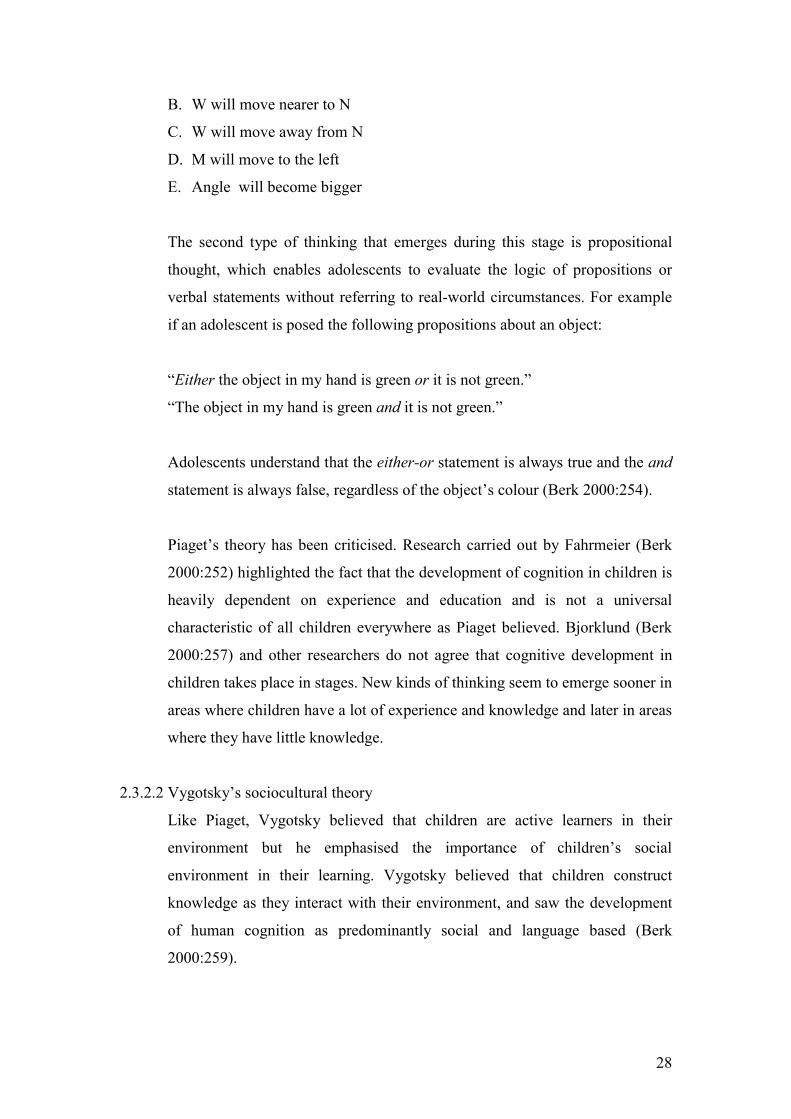
Test items included in the mechanical insight test of the DAT-S require
hypothetico-deductive thinking. For example in an item which requires the
adolescent to predict the consequences of the movement of levers attached to
pivots, the adolescent will generate several possible hypotheses (or assess each
multiple choice option given in the answer). He will then move the levers in
the imagination keeping certain pivots stationary, allowing others to move in
accordance with the mechanical principles explained, and thereby identify the
consequences (Owen & Vosloo 1999:74). Each false hypothesis or multiple
choice option is rejected until the correct one that matches the consequences as
deduced by the adolescent, is found.
If lever S is pulled in the direction of the arrow, then …
A. no movement will be possible
28
B. W will move nearer to N
C. W will move away from N
D. M will move to the left
E. Angle will become bigger
The second type of thinking that emerges during this stage is propositional
thought, which enables adolescents to evaluate the logic of propositions or
verbal statements without referring to real-world circumstances. For example
if an adolescent is posed the following propositions about an object:
“Either the object in my hand is green or it is not green.”
“The object in my hand is green and it is not green.”
Adolescents understand that the either-or statement is always true and the and
statement is always false, regardless of the object’s colour (Berk 2000:254).
Piaget’s theory has been criticised. Research carried out by Fahrmeier (Berk
2000:252) highlighted the fact that the development of cognition in children is
heavily dependent on experience and education and is not a universal
characteristic of all children everywhere as Piaget believed. Bjorklund (Berk
2000:257) and other researchers do not agree that cognitive development in
children takes place in stages. New kinds of thinking seem to emerge sooner in
areas where children have a lot of experience and knowledge and later in areas
where they have little knowledge.
2.3.2.2 Vygotsky’s sociocultural theory
Like Piaget, Vygotsky believed that children are active learners in their
environment but he emphasised the importance of children’s social
environment in their learning. Vygotsky believed that children construct
knowledge as they interact with their environment, and saw the development
of human cognition as predominantly social and language based (Berk
2000:259).

29
Vygotsky maintained that children use language in order to guide and direct
their behaviour and course of action. He called the way young children speak
aloud while playing, “private speech”. Vygotsky regarded private speech as
the foundation for all higher cognitive processes (Berk 2000:260).
According to Vygotsky children learn to master activities and develop their
cognitive abilities by engaging in joint activities with more mature members
of society. He described the optimal situation for children’s learning to take
place, as a situation in which the learning tasks cannot yet be managed alone
but can be accomplished with the help of adults and more skilled peers. This is
called the child’s “zone of proximal (or potential) development” (Berk
2000:261).
Vygotsky agrees with Piaget that the nature of thinking as the child enters the
adolescent years changes (Rieber & Robinson 2004:423). He maintains that
thinking becomes more abstract and complex. Acquired knowledge and the
influence of speech are two basic factors that lead to the formation of abstract
concepts in adolescent thinking. The younger, preadolescent child’s thinking
is characterised by more concrete visual thinking which requires graphic
representations. The younger child tries to explain abstract concepts by
describing the concrete manifestations thereof. For example, when explaining
the concept “love” the young child would say, “Love is someone who wants to
get married”. The older adolescent may explain the concept “love” as an
emotion characterised by a deep caring and committed attitude. The formation
of concepts by the adolescent therefore reflects reality, but also organises it
into a complex system of relationships.
Some theorists disagree with theories of cognitive development. They
maintain that qualitative differences in a child’s thinking do not occur, but that
thought processes are similar at all ages and are merely present to a greater or
lesser extent. This forms the basis of the information-processing approach to
intelligence (Berk 2000:257).
30
2.3.3 The information-processing approach
Ways in which information is processed are studied in the information-
processing approach. Two types of processing styles, namely simultaneous
and successive processing, have been identified. In simultaneous or
parallel processing information is integrated all at once. In successive or
sequential processing each bit of information is individually processed in a
sequential way (Cohen & Swerdlik 2002: 233). Sequential processing is
logical and analytical in nature, putting new pieces of information
successively together to reach a final conclusion, for example memorising
a telephone number or spelling a word. Simultaneous processing involves
the integration of information as a whole, for example looking at a
painting or a map.
2.3.4 Recent approaches to intelligence
Recently, researchers such as Ian Deary and Con Stough (Deary & Stough
1996:599-608) have begun combining psychometric and information-
processing approaches. They conducted componential analyses of
children’s intelligence test scores by correlating them with laboratory
measures, which assess the speed and effectiveness of information
processing. In this way they hoped to isolate specific cognitive skills, such
as inspection time, which underpin problem solving (Berk 2000: 321).
There is a distinction between speeded tasks involving only perception of
information and those that require not only the intake of information but
also a reaction within a certain amount of time. Perceptual tasks involving
a speeded reaction by the participant have shown low correlations with
intelligence measures, in the region of 0.2 or lower (Deary 1995:237-250).
However, perceptual tasks involving only the rapid seeing or hearing of
information and requiring a response that is not speeded, such as auditory
inspection time (AIT) or visual inspection time (VIT) show moderate
correlations with intelligence measures. Deary (1995:237-250)
investigated the causal relationship between auditory inspection time and
IQ measurements and found that auditory inspection time may cause late
general cognitive ability in young adolescents. This finding suggests that
31
individuals whose nervous systems function more efficiently have an edge
when it comes to intellectual skills. They can perceive and integrate
information more quickly and they are therefore able to consolidate more
information per unit of time. The rapid consolidation of information results
in more attentional resources being available to solve problems.
Working memory is that part of the memory a person uses to temporarily
store information so that it can be processed (Eysenck & Keane 2000:164).
Different bits of information need to be held in the mind at one time in
order to be able to reason and work out problems effectively. While
working out whether a country has a democratic society or not a learner
would have to consider the various ideas about democratic society in his or
her mind, such as the individual’s right to vote and the presence of a
representative government. The learner would then have to compare those
ideas to the specific aspects of the society in question. The activities of
recall, comparison and logical reasoning make large demands on the
learner’s working memory capacity.
Working memory is thought to have much in common with general
intelligence and can be predicted by g (Colom, Rebollo, Palacios, Juan-
Espinosa & Kyllonen 2004: 277-296). It has been found that the larger the
working memory the more attentional resources are available to
comprehend language, and therefore to complete demanding cognitive
tasks (Eysenck & Keane 2000: 342). Processing speed influences the
efficiency with which higher cognitive functions are carried out thereby
influencing children’s school achievement (Rinderman & Nienaber 2004:
573-589).
Geary and Burlingham-Dubree (Berk 2000:321) found that strategy use, or
the ability to decide how to solve a problem, is related to mental test
scores. Children who apply strategies adaptively develop the capacity for
fast, accurate retrieval of information stored in the memory, a skill which
seems to carry over to performance on intelligence test items.

32
2.3.4.1 Sternberg’s triarchic theory
Robert Sternberg (1985:41-42) expanded the componential approach into
a comprehensive theory which includes internal factors and external
factors which affect a person’s intelligence. Internal factors are factors
within the individual such as inherent abilities or talents. External factors
are factors such as a society that values and encourages the development
of verbal abilities.
The triarchic theory (Sternberg 1985:41-42) consists of three
subtheories: the contextual subtheory, the experiential subtheory and the
componential subtheory.
The contextual subtheory refers to the context or culture of the individual
and emphasises the importance of the individual’s adaptation to his or
her environment as a sign of intelligence. If individuals are unable to
adapt to their environment they may have to select an alternative
environment, or try to reshape their existing environment in order to
improve the “fit” between themselves and their environment to meet
their personal goals (Sternberg 1985: 45-46). An individual who is
outgoing and extravert would be unsuited to a work environment where
he or she would be required to work alone for long periods of time. Such
an individual should select a work environment that requires interaction
with other people.
The experiential subtheory explores the individual’s ability to deal with
novel tasks and the ability to automatise information processing as an
aspect of intelligent behaviour (Sternberg 1985: 69,71). The child who
learns efficiently from experience is, for example, able to rapidly learn a
new method of solving a mathematical problem and thereafter to retrieve
and use that strategy with ease.
The componential subtheory identifies different functions which underlie
intelligent performance. One of these functions is metacognition or

33
executive processing, which monitors and regulates a person’s thinking.
Another function is combining and comparing information in order to
carry out intelligent thinking. A further function is the selective encoding
of information in the memory in order to increase knowledge (Sternberg
1985: 99,107).
Sternberg developed a test based on his triarchic theory. Recent research
carried out by Koke and Vernon (2003:1803-1807) confirms that the
Sternberg Triarchic Abilities Test (STAT) correlates significantly with a
general intelligence test, the Wonderlic Personnel Test. This result
indicates that the STAT is a valid measure of general intelligence.
2.4 MEASURING INTELLIGENCE
The measurement of intelligence involves the comparison of a person’s
performance on a variety of subtests with the performances of others in that
particular age group (Van Eeden 1997a:2).
The Senior South African Individual Scale – Revised (SSAIS-R) (Van Eeden
1997b:3) as well as the Afrikaans version of the test, are used most often in
South Africa to test intelligence among English and Afrikaans speaking
children. In South Africa where most learners do not speak English or
Afrikaans as a home language the test may also be used. These learners must
have spent at least five years in a school where either language was the
medium of instruction. The test is then seen as an indication of the learners’
abilities in an English or Afrikaans school environment.
The SSAIS-R measures different abilities. These abilities include knowledge
of word meanings, verbal reasoning ability, short-term verbal memory,
number ability, nonverbal reasoning ability, visual memory and the ability to
visualise spatial relationships. The test also measures aspects of intelligence,
such as concentration, long-term memory and acquired knowledge (Van
Eeden 2000:6). The subtest scores can be grouped to provide a verbal and a
nonverbal score. All the test scores may be added together to obtain a general
intelligence factor.
34
One of the disadvantages of using the SSAIS-R is that it is a predominantly
verbal test which means that it relies heavily on the language abilities of the
child. In South Africa where many children do not speak English or Afrikaans,
a nonverbal test, or a test in their home language may be a better indicator of
their intelligence.
2.5 WHAT IS APTITUDE?
Aptitude refers to a specific ability (Berk 2000:319), such as carrying out
arithmetical calculations or recalling facts from information that has been
read. Aptitudes form as a result of the interaction between individual
characteristics and learning opportunities in the environment (Cohen &
Swerdlik 2002:301). They, therefore, represent information and skills which
are gradually acquired.
Aptitudes can be measured and are used to predict a person’s potential for
achievement in a defined area. If a person displays an aptitude for a type of
activity by currently showing high specific ability in that field, one may
predict that his or her performance will increase significantly with additional
training in that area (Reber 1995:52).
2.6 MEASURING APTITUDE
Aptitude is measured through the use of aptitude tests. Aptitude tests tap a
combination of learning experiences and inborn potential that was obtained
under uncontrolled and undefined conditions (Cohen & Swerdlik 2002:301).
Test results obtained can then be used to predict a learner’s probable success
in a future course or career.
The Differential Aptitude Tests were recently developed as standardised
aptitude tests for all population groups in South Africa (Vosloo, Coetzee &
Claassen 2000:1, Owen 2000:1). Previously, the Junior Aptitude Test (Verwey
& Wolmarans 1980:3) was used to test the aptitude of Grade 7, 8 and 9
learners and the Senior Aptitude Test (Fouché & Verwey 1994:1-82) was used
to test Grade 10, 11 and 12 learners. An advantage of the Junior Aptitude Test

35
was that it could be used to estimate intelligence, making it an effective
instrument to gain a lot of information about the respondent. The Junior
Aptitude Test is, however, an old test, released in 1975. A new manual was
published in 1980 with the addition of norms for Grade 10 learners but the test
remained essentially the same as the previous one. The standardisation sample
for this test consisted of Grade 7 to 10, male and female, English and
Afrikaans speaking learners in South Africa and South-West Africa (currently
Namibia). No indication of the population composition of the sample is given.
Given the recent political and social changes in South Africa, it became
necessary to develop tests that could be used with all population groups.
The Differential Aptitude Tests were developed to test learners in the General
Education Training phase (GET) and in the Further Education and Training
phase (FET). For each phase two tests were developed, a standard one for
general use, and an advanced version for those learners who have had access
to favourable educational opportunities. The full series comprises the
following:
Differential Aptitude Tests Form R – (Grades 7 to 10: Standard form)
Differential Aptitude Tests Form S – (Grades 7 to 10: Advanced form)
Differential Aptitude Tests Form K – (Grades 10 to 12: Standard form)
Differential Aptitude Tests Form L – (Grades 10 to 12: Advanced form)
(Vosloo et al. 2000:1).
The Differential Aptitude Tests Form S (DAT-S) were standardised on
English and Afrikaans speaking, Grade 7 and Grade 9 learners. The learners in
the standardisation sample were drawn from four different population groups,
namely black, coloured, Indian and white. The DAT-S was developed to
measure the aptitudes of learners in Grades 7 to 10 who have had favourable
educational opportunities (Vosloo et al. 2000:1). The DAT-S was used in this
study to test the Grade 9 learners’ aptitudes, as the learners had access to
relatively good educational opportunities.
Aptitude tests such as the DAT-S draw on a broad spectrum of information
and abilities (Cohen & Swerdlik 2002:301), such as knowledge of vocabulary,

36
verbal reasoning, nonverbal reasoning, arithmetical ability, reading
comprehension, visual perceptual speed, three dimensional spatial
visualisation, mechanical insight and memory (Vosloo et al. 2000:4,7).
Measurement of these aptitudes enables us to predict broader characteristics
such as whether a person will develop a high level of language ability or the
ability to quickly and efficiently perceive similarities and differences in visual
material (Cohen & Swerdlik 2002:301, Vosloo et al. 2000:4,7). Research
carried out by the developers of the DAT-S shows that the aptitude for reading
comprehension was the single aptitude in the test that correlated most highly
with academic achievement (Vosloo et al. 2000:44). Measurement of the
aptitude for Reading Comprehension could therefore be used to predict the
broader variable of academic achievement through the use of a regression
analysis. Combining the scores on different aptitude tests may be used to
predict achievement in a specified area, for example the scores on the tests for
vocabulary, verbal reasoning, reading comprehension and memory can be
combined to predict a learner’s general language achievement.
Nichols and Mittelholtz (1996:131) stated that aptitude tests measure mental
abilities that are neither so stable that they cannot be changed, nor so easily
changeable that they can be modified by a minor change in the situation where
the aptitude is being used. Therefore, the arithmetical ability measured by the
DAT-S should be an ability that can develop and improve with continued
maturation of the learner and with continued learning and use of the ability.
Arithmetical ability, on the other hand, should be stable enough so that it
remains a true indication of the learner’s ability and does not change too
easily. For example, when a learner learns a new method of working out a
particular kind of sum, this small, specific increase in ability should not result
in a large increase in the measurement of his or her overall arithmetical
aptitude.
Nichols and Mittelholtz (1996:131) point out that the prediction of
achievement using a score on an aptitude test assumes that a specific aptitude
is a necessary ability in that area. One could assume that visual perceptual
speed is important to achieve at school level since much school work involves
37
the reading, scanning and comparing of information. However, research
carried out by Vosloo, Coetzee and Claassen (2000:44) shows that visual
perceptual speed has a low correlation with academic achievement and
therefore would not accurately predict academic achievement.
At entry level an aptitude test is called a readiness test as the test is being used
to measure the individual’s readiness for learning (Cohen & Swerdlik
2002:301). The DAT-S, in assessing various aspects of intellectual
functioning, such as abstract reasoning ability, memory and mechanical
insight, can be used to assist the learner in deciding which subjects to take in
Grade 10, the first year of the Further Education and Training Phase. The end
of Grade 9 marks the end of the General Education and Training Phase when a
learner may leave school and enter the workplace. The DAT-S can therefore
also be used, together with information on interests and previous achievement,
to assess potential success in a course or career.
2.7 THE RELATIONSHIP BETWEEN INTELLIGENCE AND APTITUDE
Intelligence is usually seen as g – the general complex problem-solving ability
common to many skills, while aptitude refers to s – specific abilities, each
involved in a certain domain or skill. There is a close relationship between
general and specific intelligences. As was shown by Carroll (Berk 2000:319),
specific factors are related to general intelligence to a lesser or greater degree.
Fouché and Verwey (1994: 55) maintain that aptitude tests do tap g because
aptitude tests require the solution of complex problems. The high positive
correlations between the different subtests on the Differential Aptitude Test
indicate the presence of a common factor (Owen 2000:46-48).
While g appears to be closely related to s, it seems logical that certain specific
abilities may be developed to a greater or lesser degree in different people,
influencing their scholastic performance and making them more suited to
certain occupations than others. Carroll (1982:29-120) states that while the
general intelligence factor is the most important one in aptitude tests, some
skills are specialised. He points out that certain skills in particular individuals
have been developed to a point either above or below what could be expected
38
from the level of general intelligence in a person. This variation makes it
important to consider specific abilities as separate skills, independent of
general intelligence, which will predict aspects of scholastic performance or
make a person suited to a particular occupation.
2.8 CONCLUSION
It was stated in section 2.1 that Bloom saw cognitive and affective factors to
be important to scholastic achievement. This chapter dealt with two of the
most important cognitive factors that play a role in academic achievement, that
is intelligence and aptitude. Different perspectives on intelligence have been
discussed. These perspectives have viewed intelligence as a single construct
and alternatively, as many separate abilities related to each other in different
ways. The basic speed of processing information and the consideration of a
wider cultural context in the definition of intelligence were considered. The
construct of aptitude was analysed and it was found to have much in common
with intelligence, although there are also important differences between these
constructs. One of the differences between intelligence and aptitude is that
measures of aptitude are usually used to predict future academic and career
performance, while intelligence measures are not commonly used in this way.
The measurement of intelligence and aptitude in the South African context
were considered. The importance of the measurement of cognitive factors with
recently developed instruments was pointed out in the light of the political and
social developments in the country.
General intelligence was shown to be a complex concept which involves
cognitive abilities used in a person’s intellectual functioning across contexts.
These abilities are required in all learning situations to a greater or lesser
degree and are therefore also tapped in tests measuring aptitude. For this
reason it is possible to calculate the relationship between these two constructs
so that one can be predicted from the other, in this case, intelligence from
measures of aptitude. In section 2.6 it was pointed out that an advantage of the
old Junior Aptitude Test was that it could also be used to estimate intelligence.
The newly developed Differential Aptitude Test cannot be used to estimate
intelligence, even though aptitude and intelligence have been found to be

39
similar constructs. For this reason, the current study aims to measure the
relationships between the aptitude tests of the Differential Aptitude Test and
the tests of the Senior South African Individual Scale – Revised, so that
measures of aptitude can be used to estimate levels of intelligence in school
learners.
The two cognitive factors discussed in this chapter, namely intelligence and
aptitude, are closely related to a learner’s academic achievement but they are
not the only aspects involved in the learning situation. The learner brings his
or her whole self to the classroom, and therefore non-cognitive aspects also
influence his or her learning. Affective factors such as self-concept and
motivation, as well as academic behaviour, such as study habits, affect
academic achievement and will be the subject of the following chapter.

40
CHAPTER 3
FACTORS AFFECTING ACADEMIC ACHIEVEMENT AT HIGH SCHOOL
LEVEL
3.1 INTRODUCTION
Benjamin Bloom (1976:10) emphasised that both cognitive and affective factors are
central to determining learning. The current chapter focuses on the relationship
between cognitive and affective factors, and academic achievement.
Research has revealed that cognitive factors such as intelligence, aptitude and
previous knowledge play an important role in academic achievement (Horn, Bruning,
Schraw, Curry & Katkanant 1993:464-478). While these factors explain a great deal
of the variance in classroom achievement, they do not account for all of it. Affective
factors, such as the learner’s self-concept and motivation, were identified by Bloom
as important factors related to achievement. The learner, while participating in
classroom events, develops an academic self-concept which in turn influences
academic achievement. Motivational characteristics are important in influencing
academic achievement as learners who are motivated are more likely to attempt,
perform and persist in learning activities. Bloom considers quality of instruction as
the most important instructional variable. Since it is difficult to measure quality, the
concept of study orientation will be discussed in this chapter. The effective use of
study habits and techniques, which students use to consolidate learning, are important
in the learning process.
3.2 COGNITIVE FACTORS
Intelligence, aptitude and prior learning experiences have been identified as important
cognitive variables related to academic achievement (Horn et al. 1993:464-478).

41
3.2.1 Intelligence and academic achievement
Academic achievement at school is the result of a learning process which consists
of thinking, learning and problem solving (Bester 1998:9). Intelligence, as
discussed in the previous chapter, is seen to be the ability to think and learn and is
therefore considered to be fundamental to academic achievement.
In the literature, correlations between tests of general intelligence and measures of
academic performance are reported as being usually close to 0.50 (Brody
1992:279; Neisser, Boodoo, Bouchard, Boykin, Brody, Ceci, Halpern, Loehlin,
Perloff, Sternberg & Urbina 1996:81) but can be as much as 0.75 (Jensen 1998:
557-558). This means that 25% to 56% of the variance in academic performance
can be attributed to intelligence.
Many empirical investigations have shown that intelligence is the best single
predictor of academic success. Horn et al. (1993:464-478), in their study of
undergraduate university students, developed a path model to show the relative
influence of different variables on achievement. They found that when compared
to other factors, such as previous knowledge and motivational factors, general
intelligence was found to have a highly significant direct effect on achievement,
independent of the other variables in the model. Intelligence showed a correlation
of 0.55 with achievement, explaining 30% of the students’ performance in this
study.
Chen, Lee and Stevenson (1996:750-759) carried out a study investigating the
relative contributions of intelligence, previous achievement and family factors to
later school achievement in the Chinese, Japanese and American cultures. It was
found that there were similar correlations between intelligence and academic
achievement for each culture studied. Participants were administered intelligence
tests in Grade 1 and their achievement was tested 10 years later in Grade 11. The
single most predictive variable for Grade 11 achievement in mathematics, reading
and general knowledge was general intelligence. The study found correlations of
42
between 0.48 and 0.53 for mathematics achievement, between 0.28 and 0.51 for
reading and 0.35 and 0.44 for general knowledge. Gagné and St Père (2002:71-
100), in a study comparing the predictive values of intelligence, motivation and
persistence, similarly found that cognitive abilities were by far the best predictor
of school achievement. In this test, it was found that intelligence correlates with
an achievement of between 0.36 and 0.56, explaining 13% to 31% of the variance
in achievement.
Verbal ability, as measured in intelligence tests, appears to contribute most to
achievement in scholastic success. Marais (1992:184-191) carried out a study
investigating the prediction of academic achievement in Grade 7, 8 and 9 learners.
It was found that verbal intelligence, measured by the New South African Group
Test, contributed the most to achievement in English, Afrikaans, Mathematics and
Physical Science. Grade 7 learners’ verbal intelligence scores were the strongest
predictor of their achievement, explaining 62% of the variance in academic
performance at school. Grade 8 and 9 learners’ verbal intelligence was
significantly positively correlated with their academic achievement. The highest
correlation obtained for Grade 8 and 9 learners was 0.52 between verbal
intelligence and Afrikaans (first language) achievement. A correlation of 0.43 was
found between verbal intelligence and English (second language) achievement,
and a correlation of 0.40 was found between verbal ability and Science
achievement. It can be seen that for Grade 8 and 9 learners, between 16% and
27% of achievement in the above subjects can be accounted for by their verbal
ability. Thompson, Detterman and Plomin (1991:158-165) conducted an
investigation to ascertain the correlations between different measures of
intelligence and achievement in reading, mathematics and general language tasks
from Grades 1 to 6. The researchers found that the correlations between verbal
ability and achievement were higher than correlations between other measures of
intelligence, for example, spatial ability and achievement. Verbal intelligence was
measured using the WISC-R Vocabulary test and a verbal fluency test. The
correlation of verbal intelligence and achievement in reading was 0.40, in

43
mathematics 0.32 and in language achievement 0.34. Verbal ability therefore
accounted for between 10% and 16% of the variance in achievement. The high
correlations found between verbal intelligence and school achievement show that
knowledge of the meanings of words, as well as the ability to access associated
words in memory quickly, and articulate them fluently, are important in academic
achievement at school.
Research carried out during the standardisation of the Senior South African
Individual Scale – Revised (Van Eeden 1997a:121) shows significant correlations
between the verbal scores and Grade 9 academic achievement. The verbal scale is
an indication of verbal intelligence and comprises five subtests. The verbal
subtests are:
� Vocabulary, which tests the respondent’s knowledge of the meanings of
words
� Comprehension, which tests the respondent’s ability to understand and
express himself or herself in language
� Similarities, which tests the ability to think abstractly
� Number Problems, which test the respondent’s ability to solve numerical
problems
� Story Memory, which tests short-term auditory memory
The verbal scale score, that is the combined scores of all the verbal subtests,
shows significant correlations with the subjects taken at Grade 9 level. The verbal
score shows the highest correlations with the language subjects and subjects with
considerable language content. A correlation of 0.53 was obtained between the
verbal score and English achievement, and a correlation of 0.51 was found
between the verbal score and general science. Correlations of 0.48 were obtained
in both Afrikaans and history achievement. A correlation of 0.44 was obtained
between the verbal score and both geography and mathematics. A slightly lower
correlational value of 0.41 was obtained between the verbal score and the subject
44
accountancy (Van Eeden 1997a:121). The SSAIS-R verbal scale therefore shows
consistently significant correlations with academic achievement and predicts
between 16% and 28% of the variance in Grade 9 academic achievement.
The abovementioned studies show the importance of verbal intelligence with
regard to academic achievement, but the results reveal that other measures of
intelligence are also important in predicting scholastic success. In the study
carried out by Thompson et al. (1991:158-165), spatial intelligence, as measured
by a spatial relations test and a hidden patterns test, was found to be a good
predictor of scholastic success in reading and mathematics. Spatial intelligence
was, however, a less powerful predictor than verbal ability of achievement in the
general language area. Spatial ability was found to have a correlation with reading
of 0.40, with mathematics of 0.32 and with language of 0.33. In the study carried
out by Marais (1992:184-191) it was found that nonverbal factors were important
in predicting achievement in mathematics. The total score on the intelligence test,
that is, the combination of the verbal and nonverbal intelligence scores, was the
strongest predictor for Mathematics in this study. A correlation of 0.36 was found
between the total intelligence score and Mathematics, explaining 13% of the
variance in achievement. Similarly, the full scale score on the Senior South
African Individual Scale – Revised (Van Eeden 1997a:121) was found to have a
higher correlation with Mathematics achievement than the verbal score (0.48 as
opposed to 0.44). The subject of Accountancy also showed a higher correlation
with the full scale score on the SSAIS-R than with the verbal scale score (0.43 as
opposed to 0.41). General Science showed equal correlations of 0.51 between
achievement and both the verbal scale score and the full scale score. A
measurement of the total intelligence of a learner can therefore predict 23% of the
variance in mathematics achievement, 18% of accountancy achievement and 26%
of achievement in general science in Grade 9. The above results show that the
ability to do mathematics, accountancy and general science appears to require the
contribution of both verbal and nonverbal abilities.
45
Nonverbal intelligence alone does not appear to predict scholastic achievement
better than either verbal intelligence on its own, or a combination of verbal and
nonverbal intelligence. Research carried out using the SSAIS-R (Van Eeden
1997a:121) found that nonverbal scale scores showed correlations of between
0.30 and 0.43 with all the subjects taken at Grade 9 level, accounting for between
9% and 18% of academic achievement. The subject having the highest correlation
with the nonverbal scale was found to be mathematics (0.43). This relationship
possibly reflects the use of nonverbal intelligence in the high school mathematics
syllabus, with its increased visual figural content in geometry, and the
measurement of dimension, such as area and volume.
Information processing theories of intelligence emphasise the speed of processing
information. The study carried out by Thompson et al. (1991:158-165) showed
that cognitive processing speed is significantly positively correlated with
achievement. Perceptual speed (measured by a test where a specific alphabet letter
had to be found amongst other letters), showed correlations of 0.33 with Reading,
0.32 with Mathematics, and 0.36 with Language achievement. In the same study
Thompson et al. (1991:158-165) found that memory abilities, as measured in tests
of the recall of names and faces, as well as a picture memory test had positive, if
low, correlations with achievement. The correlation of memory with reading was
0.26, with mathematics 0.22 and with language achievement, 0.22. The memory
test was not as strongly related to academic achievement as were verbal
intelligence, spatial intelligence and speed of processing. This implies that school
learning does not rely that heavily on memorisation of information but rather on
more complex language abilities, spatial abilities and the rapid processing of
information.
One investigation emerged from the literature study which showed that
intelligence is not the most important predictor of academic achievement in
university students (Coté & Levine 2000:58-80). In this study, motivation, as
measured by the Student Motivations for Attending University (SMAU) Scale,

46
appeared to be more important than intelligence, showing higher correlations with
achievement than intelligence as measured by the Culture Fair Intelligence Test
(CFIT). The researchers explain this unusual finding by suggesting that the
university system in this study did not engage the brightest students to achieve
well but rewarded less bright students who were highly motivated.
The implication of the above studies is that general intelligence can be used as a
reliable predictor of academic achievement at school level. General intelligence,
however, does not explain all the variance in academic achievement and other
factors that play a role. One of these factors is aptitude, or specific intelligence.
3.2.2 Aptitude and academic achievement
The concept of aptitude was described in the previous chapter. Aptitude refers to
specific abilities and is tested with a view to the person’s future performance
should the person obtain additional training in a field (Reber 1995:52).
Specific abilities or aptitudes are related to academic achievement. In a study
carried out by Kelly (1999:104), achievement in mathematics was significantly
predicted by an arithmetic aptitude test. The Arithmetic Reasoning Test (ART),
measuring learners’ ability to understand basic arithmetic rules and the
application of these rules to solve numerical problems, was found to significantly
predict higher grade mathematics marks in secondary school. The ART showed a
correlation of 0.29 to 0.65 with higher grade secondary school mathematics
marks. The aptitude test, therefore, accounted for between 8% and 42% of the
variance in mathematics achievement, with the highest prediction being for Grade
9, Grade 10 and Grade 11 higher grade mathematics achievement.
Aptitude tests administered at school level appear to predict future school
performance as well as achievement in tertiary education. In a study carried out
by Stumpf and Stanley (2002:1042-1052) it was found that learners’ College
Board Scholastic Assessment Test (SAT) scores correlated positively with their

47
graduation from college. The Verbal score on the SAT contributed approximately
40% to the likelihood of a learner graduating from college and the Mathematics
score contributed 38%.
Marais (1992: 184-191) carried out an investigation into factors, such as
intelligence, aptitude, interest and socio-economic factors, that predict academic
achievement during the junior secondary phase of schooling (Grades 7 to 9). The
Junior Aptitude subtests showing the highest contributions to achievement in the
key subjects of Afrikaans, English, mathematics and science, were the Memory
for Paragraphs and Synonyms subtests. The Memory for Paragraphs subtest
accounted for between 2% and 8% of the variance in language achievement.
Synonyms accounted for between 2% and 5% of the variance in language
achievement. Memory for Paragraphs contributed 4% to the variance in
achievement of mathematics, with Synonyms contributing 2%. Synonyms
accounted for 3% of the variance in science achievement, and the Number Ability
subtest contributed 2% to the variance in this subject. According to Marais, a
contribution of 1% to the variance in academic achievement can be seen as
educationally meaningful. It is therefore clear that the contributions of the
aptitude subtests are both statistically and educationally meaningful.
Fouché and Verwey (1994:1-82), in the development of the Senior Aptitude
Tests, obtained significant correlations between the aptitude subtests and
academic achievement in higher grade subjects in Grades 10, 11 and 12. In Grade
10, the Verbal Comprehension subtest accounted for between 21% and 32% of
the variance in first language achievement. The Calculations subtest explained
between 21% and 25% of the variance in mathematics achievement. Verbal
Comprehension accounted for between 24% and 27% of first language
achievement in Grade 11. Mathematics achievement was best explained by the
Writing Speed and Verbal Comprehension tests. These two tests accounted for
between 9% and 24% of the variance in achievement. In Grade 12, first language
achievement was best explained by the Disguised Words and Verbal
48
Comprehension subtests. These two tests accounted for between 24% and 29% of
the variance in achievement. The Calculations and Pattern Completion subtests
best explained performance in mathematics, accounting for between 20% and
30% of achievement. The above results show that language comprehension is the
most important factor in predicting language achievement in the Further
Education and Training phase. Mathematics prediction at this level appears more
complex. The Calculations, Verbal Comprehension and Pattern Completion
subtests were the most important predictors of mathematics achievement. It
appears that mathematics at this level requires many different abilities such as
number ability, comprehension of language and nonverbal reasoning.
Verwey and Wolmarans (1983:54-55), during the development of the Junior
Aptitude Test, found significant correlations between the subtests and
achievement in Grades 7, 8 and 9. In Grade 7, the Reasoning, and Memory for
meaningful information, subtests explained between 32% and 39% of the
variation in first language achievement. Mathematics achievement was best
explained by the Number Ability and Reasoning subtests which accounted for
between 40% and 42% of the variance in achievement. The Synonyms subtest
accounted for between 40% and 52% of the variation in first language
achievement in Grade 8. Mathematics achievement in Grade 8 was explained by
the Number Ability and Synonyms subtests, which explained between 29% and
32% of the variation in performance. The highest correlations with first language
achievement in Grade 9, were obtained in the Reasoning and Synonyms subtests.
The two tests accounted for between 26% and 46% of first language achievement.
Verbal reasoning abilities, as well as knowledge of words and their meanings are
therefore considered to be important in Grade 9 language achievement.
Mathematics achievement was best accounted for by the Number Ability and
Memory for paragraph subtests, which explained between 6% and 27% of the
variance. The ability to work quickly and accurately with numbers, and the ability
to remember meaningful information, can therefore be regarded as important in
mathematics achievement in Grade 9. Science achievement was best explained by
49
the General Reasoning and Number Ability tests of the JAT which explained
between 20% and 31% of the variance.
In the development of the Differential Aptitude Test Form S (Vosloo, Coetzee &
Claassen 2000:44), the relationship between the aptitude tests and academic
achievement of Grade 7 learners only, was measured. The single test showing the
highest correlation with overall academic achievement in Grade 7, was found to
be the Reading Comprehension test. This test explained 50% of the variance in
achievement. The emphasis on the ability to read, not only in the languages and
the learning subjects such as History and Geography, but also to read instructions
and understand explanations in mathematics and science, appears to be very
important in the General Education phase of schooling. Reading Comprehension
and Memory abilities each accounted for 43% of the variance in Afrikaans first
language achievement. The ability to read with understanding, as well as to
remember information is predictably important in first language achievement.
English second language achievement variance was best accounted for by
Reading Comprehension and the Verbal Reasoning subtest, each explaining 52%
of the variance. Reading with understanding, as well as the ability to reason
verbally in a relatively unfamiliar language where the learner does not know all
the vocabulary and language constructions used, appears important in second
language achievement. Mathematics achievement correlated highly with the
Computations subtest, which accounted for 41% of the variance in Mathematics
achievement. The ability to work quickly and accurately with numbers therefore
had a predictable close relationship with mathematics achievement. Reading
Comprehension accounted for 41% of the variance in history achievement, with
memory abilities accounting for 36%, highlighting the importance of reading with
understanding, as well as recalling large volumes of information in this subject.
After Reading Comprehension, which accounted for 41% of the variance in
geography achievement, verbal reasoning accounted for the greatest variation,
37%. The ability to reason is important in geography, where application of
information and problem solving is often necessary. It appears that an

50
understanding of the figural content of geography, for example contour maps,
draws on nonverbal abilities, as significant positive correlations were obtained
with the tests for Spatial Visualisation (0.46) and Mechanical Insight (0.53). After
Reading Comprehension, which accounted for 40% of the variation in Science
achievement, the Nonverbal reasoning subtest accounted for the most variation,
38%. The Comparison subtest, measuring visual perceptual speed, showed the
highest correlation with mathematics where the ability to see similarities and
differences quickly is important. The Comparison subtest accounted for 6% of the
variance in Mathematics. The correlations between the subtests of the
Differential Aptitude Test Form S and academic achievement, range from low to
high positive correlations. It should be borne in mind that the study was carried
out on a selected sample of only 61 Afrikaans speaking learners. Further studies
with a more representative sample, is necessary to more precisely predict
academic achievement in South African learners.
3.2.2.1 Factors affecting the predictive function of aptitude tests
Certain variables appear to influence the effectiveness of aptitude tests.
The period of time that elapses between testing and the measurement of
achievement, lower the prediction of students’ later performance. In a
study carried out by Kruger and Bester (1989: 693-699) only 17,7% of the
variance in academic achievement in Afrikaans-Nederlands III at
university, was explained by the Senior Aptitude Test and the final
matriculation examination combined. The researchers explain that the
reason for this may be due to the long period of time between the
measurement of aptitude and the measurement of performance in
Afrikaans-Nederlands III which took place three, or in some cases, four
years later. A similarly low prediction of achievement was found in a
study investigating variables contributing to the academic achievement of
black Grade 12 students. Van der Westhuizen, Monteith and Steyn
(1989:771) found that aptitude, as measured by the Academic Aptitude
Test, explained only 15.3% of the variance in achievement in the

51
matriculation examinations. The researchers in this study maintain that it
was difficult to make predictions of achievement in black populations at
that time, due to the influence of non-test factors, such as educational
disadvantages. Another factor that may play a role in lowering the
predictive function of aptitude tests, is an inadequate command of the
language in which the aptitude and achievement tests are administered
(Huysamen 1999:132-137, Van Eeden, De Beer & Coetzee 2001:171-
179).
3.2.3 Previous knowledge and achievement
Meaningful learning, according to Ausubel (Woolfolk 1995:319), takes place
when new information is linked to existing knowledge. The learner associates
new and existing information, structures the information, and then classifies
existing and new information according to rules, so that meaningful conceptual
learning takes place (Prinsloo, Vorster & Sibaya 1996:240-241).
The existing conceptual structures that a person has are important, as Bereiter and
Scardamalia (Horn et al. 1993:464-478) point out. A learner who has high quality
previous knowledge in a given area, already possesses hierarchical cognitive
structures that allow for the connection of general ideas with factual detail, and
this allows for more efficient access at a later time. Bransford, Stein, Vye, Franks,
Auble, Mezynski and Perfetto (Horn et al. 1993:464-478) maintain that the more
knowledge a person has in a certain area, the more able the person is to make
accurate, meaningful connections between different concepts, and to "flesh out"
the information. If there is no existing conceptual framework into which new
information can be classified and integrated, rote learning will take place, new
information will be easily forgotten and poor academic achievement will result
(Bester 1998:21).
Previous knowledge assists learning by allowing for the rapid assimilation of
incoming information into existing conceptual structures. This frees up the

52
working memory, so that the learner is able to use the new information in, for
example, reasoning activities.
Previous achievement can be viewed from a macro-level or a micro-level point of
view. Macro-level studies assess achievement at the end of a relatively long
period of time, for example, a term or a year of instruction (Bloom 1976: 39).
Micro-level studies assess the learning of particular content and skills, which are
necessary for the mastery of specific learning tasks. An example of micro-level
learning, is the knowledge of how to measure angles with the aid of a protractor in
order to calculate the sum of the angles in a geometric diagram. If achievement in
general needs to be predicted, macro-level studies should rather be carried out,
where achievement is assessed over a year of instruction. Mathematics
achievement in Grade 10, therefore, will be predicted from a learner’s
mathematics achievement in Grade 9 (Bester 1998:21).
Previous knowledge and achievement appear to be strongly related. The
correlation between previous achievement (or knowledge that has already been
gained), and later achievement becomes higher as the learner progresses through
school (Bloom 1976: 39). This shows the importance of an increasing body of
knowledge to continued learning and achievement at school.
Bloom (1976:39) points out that learners who do not possess the required
previous knowledge for a specific task, will show lower levels of achievement
and slower rates of progress than learners who do possess the prerequisite
knowledge. Learners who may have had an opportunity to gain the knowledge,
but who cannot remember the information or lack the skills to apply the necessary
information, will not be able to achieve as well, or as fast as more effective
learners.
School learning tasks are often structured in such a way that simple, basic
concepts are learnt first, and concepts that are introduced later, are related to and

53
build on the information learnt earlier. In this situation the most critical tasks are
likely to be the early ones in the sequence, since if these are not learned
adequately, the student is likely to have great difficulty with all the tasks that
follow. As learners move from grade to grade, the deficit in knowledge will
become greater, and their level of achievement will continually drop (Van der
Lith 1991:74-81).
Knowledge of specific content areas appears to be important in later achievement
in related areas of knowledge. Irandoust and Karlsson (2002: 41-48) found that
studying Natural and Technical Sciences at high school, played a very important
role in academic achievement in the areas of Economics, Statistics, Business
Administration and Informatics, at tertiary level. They attribute the important role
played by previous learning of these subjects, as being the result of students
learning more mathematics, which formed an important part of the courses
studied later.
Kelly (1999:100-108) found that mathematics knowledge acquired by the end of
Grade 9, was strongly related to mathematics achievement in Grades 10, 11 and
12. Previous knowledge was assessed by measuring mathematics performance on
an achievement test, the Initial Evaluation Test in Mathematics (IET), as well as
noting the learners’ marks in mathematics at school. Kelly found that learners’
mathematics marks at the end of Grade 9, were the best predictors of later Higher
Grade mathematics achievement at school, in Grades 10-12. Their marks showed
high to very high positive correlations with later mathematics achievement,
between 0.67 and 0.83. The IET also showed significantly high correlations with
Higher Grade Mathematics, between 0.60 and 0.84.
Previous knowledge, when studied across countries, has been found to influence
subsequent achievement. Children in Japan and China, for example, know a great
deal more mathematics than American children and perform better in tests of
mathematics knowledge than do American children (Neisser et al. 1996:77-101).
54
Across cultures, the importance of previous knowledge to later achievement
seems clear. Chen et al. (1996:750-759) found that previous knowledge, assessed
in Grade 1, accounted for between 27% and 47% of the variation in mathematics
achievement in American, Chinese and Japanese learners when
they were assessed 10 years later, in Grade 11. In this study, the variation in
reading achievement seemed less dependent on previous reading performance.
Reading in Grade 1 accounted for between 6% and 18% of the variation in later
reading achievement. Overall, in this investigation, which assessed also learners’
general knowledge, it was found that between 38% and 51% of the variability of
achievement in Grade 11, could be accounted for by measures obtained when the
learners were in Grade 1.
Van der Westhuizen et al. (1989:769-773) conducted a study of variables
affecting the academic achievement of black students. They found that 22.9% of
the variance in Grade 12 was accounted for by achievement in Grade 10. Previous
achievement explained more of the variance in this study than did aptitude
measurements.
Previous knowledge has been found to be important in predicting whether a
student will be successful in tertiary study. Stumpf and Stanley (2002:1042-1052)
carried out a study in which they found that high Grade Point Averages obtained
at high school contributed 24% to the likelihood that a student would graduate
from college. Kanoy, Wester and Latta (1989:65-70) found that high school
achievement together with academic self concept predicted 56% of the variance in
first year college achievement. Unfortunately the predictive values of the
individual variables are not given. Kruger and Bester (1989:693-699), however,
found that Grade 12 matriculation results contributed very little, only 3.96%, to
the achievement of university students in Afrikaans-Nederlands III. They
attributed this lack of predictive power to the long period of time which elapsed
between the testing in Grade 12, and the testing at the end of the Afrikaans-
Nederlands III course, some three or four years later.

55
Horn et al. (1993:464-478) found that domain knowledge was not significantly
related to academic achievement even though it accounted for 11% of the
variance in achievement in the sample. The researchers pointed out that the lack
of predictive power of domain knowledge in this study may have been due to the
small size of their sample which required the effects of the independent variable
to be large to reach significance. Additionally, this finding may indicate that
previous knowledge may not be necessary for academic achievement in certain
types of courses, especially entry level courses. General experience may have
been an adequate preparation for the tasks the students needed to learn in this
study.
Previous knowledge can account for between 22.9% and 68% of the variance in
later achievement. A high predictive value was obtained for mathematics
achievement which by its nature is heavily sequenced and dependent on the
establishment of previous knowledge, in order for further learning to take place.
In some areas of achievement it appears that previous knowledge may not be a
condition for later achievement.
3.3 AFFECTIVE FACTORS
Psychological processes do not occur in isolation. When a person thinks, his or her
physical body, emotions, expectations, will, attitudes, moral and spiritual beliefs as
well as social influences contribute to those thoughts (Du Toit & Kruger 1993:28).
The learner, therefore, who approaches a learning task, does so as a psychological
whole, with many variables influencing his or her learning and ultimate level of
success.
The learner characteristics which most influence academic achievement other than
cognitive factors are affective or emotional characteristics (Bloom 1976:73-74).
Bloom maintains that a psychological state of emotional preparedness is necessary
for a learning task. He does not explicitly define this concept but it can be deduced,
56
that a state of emotional preparedness is present when a learner is interested in a
subject, has a favourable attitude towards it, is motivated to learn and views himself
or herself as being capable of completing work in that subject. If the student is
emotionally prepared to learn, learning should be easier, quicker and a higher level
of academic achievement will be attained. This emotional preparedness may vary
from subject to subject.
Bloom identifies the following affective factors as having the most influence on
learning: desire to learn (or motivation), fear, attitudes, self views and interest. The
above factors have been extensively researched with regard to education and two of
the most important will be discussed in this chapter, namely self-concept and
motivation.
3.3.1 Self-concept
Shavelson, Hubner and Stanton (1976:407-441) proposed the first
comprehensive model of the self-concept. The model represents the self-concept
as multifaceted and hierarchical. Perceptions of personal behaviour in specific
situations are at the base, inferences about the self in broader domains (for
example, social, physical and academic) in the middle of the hierarchy, with the
global or general self-concept at the top. Byrne and Shavelson (1986:474-481)
found empirical evidence for this model. According to them the self-concept
comprises the totality of a person’s self-perceptions. It shows stability but is
open to change as one moves down the hierarchy (Marsh & Shavelson
1985:107-123). Lower in the hierarchy, the self-concepts formed, are more
dependent on situation-specific experiences, and therefore the self-concepts at
that level are less stable. The self-concept is both descriptive and evaluative,
containing information describing the self (I am a girl, I have long hair) and
information evaluating the self (I do well in Mathematics, I am a person of
worth) (Schmidt & Padilla 2003:37-46).

57
3.3.1.1 Relative importance of specific and global self-concepts
The relative contribution of a specific component of the self-concept, to
the global self-concept, is dependent on how important the component is
to a particular individual. An adolescent, for example who considers his
academic self-concept as being important, will experience an
improvement in his global self-concept if he does well in a History test.
His global self-concept will not be substantially lowered, however, if the
physical ability component of the self-concept is not an important one to
him and he is not selected for the rugby team.
3.3.1.2 Academic self-concept
Initially it was assumed that learners’ experiences in different subjects at
school combined to form one academic self-concept, which Bracken
(1996:290) referred to as the view of the self with reference to scholastic
competence. Later research has pointed to the verbal and mathematics
self-concepts being nearly uncorrelated. It appears that the two self-
concepts do not combine to form one academic self-concept, but rather
two second-order academic factors, a verbal academic factor and a
mathematics academic factor (Marsh & Shavelson 1985:107-123; Marsh
1990a:623-636). The term "academic self-concept" (or scholastic self-
concept) is widely used in the literature, however, and when used, it can
be seen to refer to both the verbal and mathematics self-concepts.
The internal/external reference model was developed to explain the
relationship between different academic self-concepts (Marsh & Yeung
2001:389-420). Students base their self-concepts on two simultaneous
comparison processes. An internal comparison occurs when an individual
student appraises his or her ability in one academic domain, for example
mathematics, in comparison to his or her ability in other academic areas.
The external comparison is the student’s evaluation of his or her
competence in a specific academic domain, relative to the perceived

58
ability of peers. Therefore, a student’s self-concept in mathematics is
derived from his perceived mathematics competence relative to his or her
competence in other subjects, as well as from an evaluation of his or her
mathematics competence relative to that of his or her peers.
3.3.1.3 Self-concept and achievement
The model proposed by Shavelson et al. (1976:407-441) discussed above
holds that actual performances at the base lead to overall inferences about
the self at the top of the hierarchy. For example, self-perceptions of
mathematical ability "cause" positive self-views of mathematics academic
competence, which in turn foster a positive global self-concept. Recent
research does support the assertion that academic achievement causes the
formation of the academic self-concept (Schmidt & Padilla 2003:37-46).
However, it appears that the self-concept also influences subsequent
achievement (Marsh 1990b: 646-656). In the study by Marsh, academic
self-concept in Grade 10 was found to significantly affect later academic
achievement and accounted for between 5% and 14% of the variance in
achievement in Grades 11 and 12. In this study, prior achievement had no
effect on subsequent measures of academic self-concept. Therefore it
appears that a reciprocal interaction occurs between self-concept and
achievement. In a recent study carried out by Marsh, Hau and Kong
(2002:727-763) evidence was found for this relationship between self-
concept and achievement. Among high school students, previous self-
concept influenced subsequent achievement, while prior achievement had
effects on subsequent self-concept as well. There was a correlation
ranging from 0.22 to 0.25 between these two variables.
The more specific to an area of achievement a self-concept is, the more
closely related it is to that achievement. General self-concept is positively
related to academic achievement (Hansford & Hattie 1982:123-142;
Coover & Murphy 2000:125-147) showing correlations ranging from 0.21

59
to 0.27. Global self-concept can therefore be seen to account for between
4% and 7% of the variance in scholastic achievement. Marsh (Bracken
1996:301) found that subject-specific self-concepts have a higher
correlation with matching subjects than general self-concept and scholastic
achievement. This finding is supported by recent research carried out by
Koutsoulis and Campbell (2001:108-127). These studies show that
English self-concept has a correlation with English subject achievement of
between 0.39 and 0.42, explaining up to 18% of the variance in English
achievement. The relationship between mathematics self-concept and
mathematics achievement was found to be between 0.33 and 0.58,
explaining up to 34% of the variation in achievement in that subject.
The inverse relationship between learners’ English and mathematics self-
concepts was shown in a study of Grade 11 girls carried out by Marsh and
O’Niell (Marsh & Shavelson 1985:107-123). It was found that English
achievement was negatively correlated with mathematics self-concept and
mathematics achievement was negatively correlated with English self-
concept. A recent study of gifted high school learners, who would be
expected to have high self-concepts in all areas due to their general high
achievement, supported this finding (Plucker & Stocking 2001:534-548).
3.3.2 Motivation
Motivation refers to the inner state that arouses, directs and maintains behaviour
(Woolfolk 1995:330). Motivation may be seen as a temporary state of having
energy to move towards a specific goal, or it may be seen as an enduring trait
which is necessary for the individual’s continuing psychological development.
Gouws and Kruger (1994:5) refer to motivation in the child as involvement
which is characterised by an inherent, inner drive to attain maturity which
involves perseverance and commitment. A motivated learner is one who shows
an openness to learning, is willing to give attention, participate in the learning
events and to complete learning tasks.

60
3.3.2.1 Motivation and personality theories
3.3.2.1.1 Behavioural view of motivation
Behaviourists emphasise extrinsic reinforcement for behaviour in the form
of reinforcers, rewards, incentives and punishment (Meyer, Moore &
Viljoen 1993:187-188). The learner who is motivated extrinsically, will
focus his or her attention, persist with the activity and reach goals because
he or she seeks to obtain a good mark for his or her efforts, or to avoid
being punished by teachers or parents for not completing school tasks. If
the learner is praised or given other forms of positive recognition, such as
stars or good work stamps for doing his or her schoolwork, he or she is
more likely to develop a tendency or a habit of carrying out such
behaviours in the future (Bester 1998:26).
3.3.2.1.2 Humanistic view of motivation
According to the humanistic view motivation does not have an external
source, but an intrinsic cause. According to this view, people are
continually motivated to satisfy the needs that are situated within them
(Bester 1998:27).
An example of the humanistic view, is the theory of Abraham Maslow. He
maintained that people were driven by an inner need to fulfil their potential.
An important aspect of his theory is the description of a need hierarchy,
where physiological needs, such as the need for food and physical safety,
are situated at the bottom of the hierarchy. "Growth" needs such as the need
to understand the environment, and the need for personal growth are
situated at the top of the hierarchy. Maslow is of the opinion that the lower
needs have to be satisfied first, before needs at the top of the hierarchy can
develop and be fulfilled (Woolfolk 1995:341). The learner who is
motivated to do his or her schoolwork is seen as a person whose needs
61
lower in the hierarchy have been met, and who is then driven by a need to
know and understand his or her environment.
The need to have control over the environment influences learners’
scholastic achievement. Deci, Vallerand, Pelletier and Ryan (1991:28) and
Ramseier (2001:421-439) state that people have a need to be in control of
the environment in which they live. The more learners are able to determine
for themselves, the course and type of learning they will do, the more
motivated the learners will be.
3.3.2.1.3 Cognitive view of motivation
The cognitive view sees motivated behaviour as resulting from a person’s
thoughts, plans, expectations and attributions (Woolfolk 1995:334). The
learner is motivated not by responding to external events or internal needs,
but by interpreting the stimuli around him or her, including what he or she
learns at school (Bester 1998:28).
Attributions refer to the thoughts one has about the reasons for behaviour
(Beck 2000:452). A learner’s attributional style affects his or her
motivation and achievement at school. A learner may attribute his or her
success at school to high ability or effort, and is therefore more likely to
expect that he or she will achieve future success, through continuing or
greater expenditures of effort (Eccles & Wigfield 1995:215-225). Learners
who attribute their achievement to an external cause, such as luck or an
easy test, are not likely to believe that they can succeed in future, and will
therefore be less motivated.
The expectation of success for an activity, identified as self-efficacy by
Albert Bandura (Meyer, Moore & Viljoen 1993:232), may be an important
precondition for a learner to take the risk to learn new information. If an
individual feels confident in his or her ability to perform an activity, his or

62
her self-efficacy for that activity will be high and he or she will most likely
carry out the activity. If the individual’s self-efficacy for an activity is low,
he or she will avoid carrying out that activity, and will be inclined to select
another situation in which he or she expects to be successful.
Learners’ beliefs influence the type of goals they have regarding their
scholastic achievement. Three main types of goals that motivate student
behaviour are learning or mastery goals, performance goals and avoidance
goals (Martin & Marsh 2003:31-38). To improve learning or achieve
mastery of a task, students pursue learning goals and can be described as
having a task orientation. Learners pursue performance goals if their
primary aim is to show evidence of their ability in comparison to other
learners. Such learners can be described as having an ego orientation.
Avoidance goals are chosen by students who do not believe that they have
the competency to achieve, and they focus only on avoiding failure. They
emphasise the minimum requirements needed to pass, and they limit their
efforts to achieving only that minimum.
3.3.2.2 Motivation and achievement
The learner with high levels of intrinsic motivation, rather than the learner who
is motivated by external rewards, is more likely to achieve well at school.
Fortier, Vallerand and Guay (1995:257-274), Monteith (1988:23-34) and
Ramseier (2001:421-439) found positive relationships between intrinsic
motivation and scholastic achievement. Intrinsic motivation in these studies was
found to account for between 3% and 28% of the variance in scholastic
achievement.
An internal locus of control is significantly associated with academic
achievement (Ross & Broh 2000:270-284; Elliot, Hufton, Illushin & Lauchlan
2001:38-68). In the study carried out by Ross and Broh, it was found that there
63
was a correlation of 0.07 between locus of control measured in Grade 10, and
academic achievement in Grade 12.
Motivation to obtain high marks was found to play an important role in
explaining student behaviour towards academic achievement. Sideridis
(2001:277-288) as well as McCoach and Siegle (2003:144-154) found that a
strong emphasis on gaining high grade point averages, was the main reason why
learners achieved. It was found that the motivation to obtain high marks led to
student behaviour such as complying with teachers’ expectations and effective
study behaviour.
Maata, Stattin and Nurmi (2002:31-46) carried out a study to identify the
relationship between different attributional styles and achievement among
learners aged 14 to15. They identified two groups of students who achieved
well at school and who showed the following motivational characteristics: high
expectancies for success and low levels of task-avoidance. The students who did
not achieve well at school had higher expectations of failure and avoided tasks.
Elliot, Hufton, Illushin and Lauchlan (2001:38-68) as well as Schultz
(1997:193-102) found that the valuing of education as a goal in itself was
associated with scholastic achievement. In an international study comparing
motivational characteristics and achievement of school learners, these
researchers found that obtaining an education was seen as valuable by Russian
children, resulting in higher levels of motivation for scholastic achievement.
Students in Grades 10, 11 and 12 with strongly held educational goals, such as
the intention to obtain their high school qualification, tended to be higher
achievers than students who did not place a high value on this goal (Schultz
1997:193-102). A correlation of 0.31 between having educational goals and
academic achievement was obtained in this study. The presence of educational

64
goals, therefore, accounted for approximately 10% of the variance in academic
achievement.
Both a task and performance goal orientation, have been found to have a
positive relationship to academic achievement (Tanaka & Yamauchi 2001:123-
135; Bouffard, Boileau & Vezeau 2001:589-604). Mastery goals were found to
explain 11% of the variance in academic achievement and performance goals
were found to predict 1.3% of achievement. These results were confirmed by
Vrugt, Oort and Zeeberg (2002:385-397). They found that task orientation led to
beliefs of self-efficacy, which led to the setting of goals of marks to be
achieved, which in turn, led to high achievement results. A study carried out by
Leondari and Gialamas (2002:279-291) found a correlation of 0.52 between
beliefs of self-efficacy and achievement, accounting for 27% of academic
achievement.
Subject self-efficacy was found to better predict achievement in a particular
subject than general beliefs of self-efficacy. Bong (2002:133-162) found that
there was a correlation of 0.33 between English self-efficacy and English
achievement, while mathematics self-efficacy showed a correlation of 0.27 with
mathematics achievement. Self-efficacy beliefs for English therefore explained
11% of the variance in achievement, and mathematics self-efficacy explained
7% of the variation in mathematics achievement. Bouffard, Goileau and Vezeau
(2001:589-604) found that self-efficacy beliefs for French predicted 10% of the
variance in French achievement in Grade 6 and predicted 9.8% of the variance
in the first year of secondary school.
An important study, given the many South African learners who come from
disadvantaged backgrounds, was carried out by Gordon-Rouse (2001:461-472).
He found that disadvantaged, but resilient, students who achieved well at high
school, showed a positive "robust" motivational pattern. They had strong

65
positive beliefs about their cognitive abilities, and were highly confident that
they would receive sufficient support from their environment.
Motivation also contributes indirectly to scholastic performance. An expectancy
of success in a task encourages learners to select effective study strategies (Horn
et al. 1993:464-478; Manstead & van Eekelen 1998:1375-1392). Study
strategies or techniques form a part of a student’s study orientation.
3.4 STUDY ORIENTATION
A learner’s study habits and study techniques influence how effectively he or she
achieves academically (Bester 1998:36). The learner makes learning content
understandable and useful by, for example asking questions in class, making sure
that instructions to tasks are read and understood and completing homework
timeously. At high school level learners are taught by different teachers and the
quality of teaching from one teacher to another can differ substantially. Learners
need to be able to compensate for a teacher’s poor teaching, or the lack of adequate
learning opportunities, in order to master the work. Learners do this by developing
effective study habits and techniques to ensure that they are able to master the work
despite the lack of teaching support given in class. Learners have different aptitudes
for different subjects. They will therefore have to develop highly effective study
habits in subjects in which they have less ability, in order to achieve a desired
achievement level (Bester 1998:34).
Study habits refer to acquired behaviour patterns in a study environment. Time
management is an important habit to aid study. Learners who are unable to settle
down to study and who take opportunities to busy themselves with other activities,
have underdeveloped study habits .This is in contrast to the learner who dutifully
studies according to a set timetable (Coe & Sarbin 1984:6).
Study techniques refer to specific strategies that a learner applies to make learning
content understandable and to improve the retention of the information. Eggen en

66
Kauchak (1994:385-386) identify underlining, note-taking, summaries and visual
diagrams as typical study techniques which learners use. Underlining is effective, as
highlighting learning content shows that the learner is actively deciding what is
more or less important. Note-taking, in the form of making margin notes and
identifying key words, helps the learner to structure his or her long-term memory.
Summaries have the advantage that the learner attaches meaning to the content,
identifies important aspects and formulates the content in his or her own words. The
summing up of much of the information to be learnt is helpful as it allows the
release of mental resources to integrate other incoming information. Hierarchical
diagrams, network diagrams, sketches, maps and other diagrams help the learner to
form a global picture of the content, and to entrench it in the long-term memory.
There are comprehensive study strategies which combine different study techniques.
In this way, steps are identified which can be followed to master the learning
content. Six steps can be identified in the SQ4R, one of the most well known study
strategies:
� Survey (overview of the learning content)
� Question (pose questions about the learning content)
� Read (read the learning content with the questions in mind
� Reflect (think about what has been read and link it with existing knowledge
� Recite (try to answer the questions)
� Review (repeat the difficult parts)
(Eggen & Kauchak 1994:387)
The advantage of an effective study method lies in the fact that it often fits better
with the cognitive and affective characteristics of the learner than teaching in the
classroom situation (Bester 1998:35).
3.4.1 Study orientation and achievement
Study habits and appropriate study techniques are important in high school
students as they, more than primary school learners, are faced with increased

67
volumes of work to be mastered and an increased demand for independent study
skills.
Thombs (1995:280-288) found that poor study habits made students more likely
to drop out of college or to achieve poorly in their academic courses. Individuals
who do drop out of school, but who subsequently graduate from high school
through an alternative route, were found to be more likely to have good study
habits, to complete their homework timeously and to watch little television on
weekdays (Suh & Suh 2006:11-20).
The research literature shows that the following study habits and techniques are
positively associated with achievement at school:
• selecting important concepts
• organising and summarising information
• finding definitions
• using examples and diagrams
• using headings
• reading skills
• rehearsal of important information
• sticking to a study schedule
• using facts learnt at school to help understand events outside of school
(Mäkinen & Olkinuora 2004:477-491; Jakubowski, Terrance & Dembo
2002:1-53; Wilhite 1990:696-700, Lammers, Onwuegbuzie & Slate
2001:71-81; Elliot, Godshall, Shrout and Witty 1990:203-207; Yip and
Chung 2005:61-70; Kovach, Fleming and Wilgosh 2001:39-49; Horn et
al. 1993:464-478).
The above studies found that study habits and techniques accounted for between
4% and 13% of the variance in scholastic achievement. The study by Lammers,

68
Onwuegbuzie and Slate (2001:71-81) explained the greatest variance in
achievement by using a standardised study habits inventory. Note-taking, good
time-management, and study techniques, such as applying information to other
subjects and events outside the school environment, were measured by this
instrument.
Rau and Durand (2000:19-38) found that students who spent considerable time
on their studies and who studied consistently throughout the year achieved well
academically. These students studied on weekends and in the evenings, and did
not cram before tests and exams in an effort to raise their marks. The researchers
found a correlation of 0.24 between this way of studying and the achievement of
college students, explaining 6% of the variation in achievement.
Cooper, Lindsay, Nye and Greathouse (1998:70-83) found that students from
Grade 6 to 12 who regularly completed their homework, achieved higher grades
than those who did not. Their completion of homework explained between 2%
and 10% of the variance in their performance on standardised and teacher
administered tests.
The above research illustrates that good study habits and study techniques can
account for up to 13% of the variation in academic achievement. An effective
study orientation was found also to have beneficial effects on learners remaining
in school and ultimately graduating from school. Study orientation is, therefore a
significant variable when considering academic achievement, although it is not
one of the most important variables. It cannot be ignored, however, and should
be taken into account in a model which attempts to predict academic
achievement.
3.5 CONCLUSIONS
This chapter dealt with factors which are related to academic achievement. In section
3.2.1 it was stated that academic achievement is the result of activities such as

69
thinking, learning and problem solving. The predominance of these cognitive
activities in school work points to intelligence, specific aptitudes and previous
knowledge as being the most important variables affecting academic achievement.
General intelligence, and especially verbal ability, was found to be the most
significant variable affecting academic achievement. The reason why language
abilities are important becomes clear when the great extent of language usage in the
classroom is considered. Specific aptitudes appear to contribute significantly to
scholastic achievement, with tests of reading comprehension showing the highest
correlations with the many different subjects at school level. Previous knowledge and
scholastic achievement are shown to be strongly related in subjects that are strictly
sequenced, and where prior learning contains basic concepts essential for later
learning.
A state of emotional, or affective, preparedness was referred to in section 3.3 as being
important in the learning process, in addition to cognitive factors. Affective factors
and academic achievement have been the subject of a considerable amount of
research carried out recently. The most important affective variables appear to be the
learner’s subject-specific self-concepts, and his or her motivations for learning. Study
habits and techniques were found to additionally explain a portion of the learner’s
academic achievement.
It is clear from the literature that one variable does not adequately explain the
variation in achievement. A combination of variables explains a greater proportion of
the variation in achievement than a single variable can do. In addition, the
combination of variables can differ from subject area to subject area and from grade
to grade, which makes a uniform prediction model an impossibility. For this reason
this study focuses on Grade 9 school learners and achievement.
An empirical investigation was carried out, firstly to establish the relationships
between intelligence and aptitude. Secondly, the relationships between scholastic

70
achievement and certain cognitive variables, affective variables and study orientation
were determined. The empirical investigation will be discussed next.
71
CHAPTER 4
EMPIRICAL INVESTIGATION
4.1 INTRODUCTION
In this chapter the course of the empirical investigation will be described. As was
stated in Chapter 1 (section 1.3), the purpose of the empirical investigation was
firstly, to determine the relationship between intelligence and aptitude and secondly,
to determine the relationships between academic achievement at Grade 9 level and
certain cognitive variables, affective variables and study orientation. These variables
were measured in order to use aptitude scores to predict intelligence and scholastic
achievement.
In order to achieve the research aim as stated above, a representative sample was
selected of typical Grade 9 learners. Information about the final sample, as well as the
way in which the sample selection was carried out, will be discussed in this chapter.
Appropriate instruments were chosen to measure the variables that affect academic
achievement at school level. A discussion of these instruments will be undertaken in
this chapter as well as an explanation of the reasons for choosing them.
Hypotheses regarding the relationship between the variables were formulated which
will be discussed in the next section.
4.2 HYPOTHESES
The purpose of the empirical investigation is to, amongst other things, statistically test
the hypotheses regarding the use of measures of aptitude to predict intelligence and
academic achievement at school level. In the light of the completed literature study it
is possible to formulate the following hypotheses:
72
Hypothesis 1
There is a significant positive correlation between intelligence and aptitude, as
measured with the Differential Aptitude Test Form S (DAT-S).
Rationale
Intelligence, or g, is a factor common to all tests of complex problem solving (Fouché
& Verwey 1994: 55). The construct, general intelligence usually refers to those
cognitive abilities used in a person’s intellectual functioning across different contexts,
while specific abilities are required only in a certain context. The relationships
between specific abilities and general intelligence were described by Carroll (in Berk
2000:319) using psychometric analysis. He developed a three-stratum, pyramid
structure of intelligence which shows that some specific abilities are strongly related
to general intelligence, such as sequential reasoning, while others are less strongly
related to g, for example perceptual speed.
In section 2.7 it was stated that there is strong evidence for the presence of a general
cognitive ability in the different subtests on the Differential Aptitude Test (Owen
2000:46-48). It is therefore likely that the Differential Aptitude Test measures general
intelligence as well as specific abilities. When two variables are strongly related, it
becomes possible to use one to predict the other. In this study aptitude measures were
used to predict intelligence. Both of the previously developed aptitude tests, the
Junior Aptitude Test (Verwey & Wolmarans 1983:71) and the Senior Aptitude Test
(Fouché & Verwey 1994: 55), made use of the relationship between aptitude and
intelligence to estimate intelligence from aptitude measures. The correlation of the
estimated intelligence score obtained from the Junior Aptitude test with the New
South African Group Test intelligence score is 0.80, indicating a very high positive
relationship between the two constructs (Verwey & Wolmarans 1983:71).

73
Hypothesis 2
There is a significant positive correlation between the aptitude subtests of the DAT-S
and achievement in different school subjects.
Rationale
The literature study revealed that significant positive correlations have been found
between aptitude tests and achievement in the key subjects of English, Afrikaans,
Mathematics and Science, as well as in learning subjects. First language achievement
at Grade 9 level showed moderate to high positive correlations of between 0.53 and
0.68, with the Synonyms and Reasoning Junior Aptitude subtests (Verwey &
Wolmarans 1983:54-55). Achievement in a second language had moderate positive
correlations of between 0.47 and 0.55 with the Reasoning subtest. Correlations
ranging from 0.51 to 0.52 were obtained between the Number Ability subtests of the
JAT and Mathematics achievement (Verwey & Wolmarans 1983:54-55). Science
achievement showed moderate correlations with the Reasoning and Number Ability
subtests (0.46 and 0.56 respectively). The Reasoning and Number Ability subtests, as
well as the 3D Spatial Ability subtest, revealed moderate positive correlations ranging
from 0.45 to 0.57 with History and Geography achievement. Marais (1992:184-190)
also investigated the relationship between the Junior Aptitude subtests and academic
achievement at Grade 9 level. The Synonyms subtest showed moderate to high
correlations not only with language achievement in English (0.60) and Afrikaans
(0.54), but also with Science achievement (0.51). A study carried out by Kelly
(1999:104) focusing only on Mathematics achievement, showed that the Arithmetic
Reasoning test (a Mathematical aptitude test) had a correlation of between 0.29 and
0.65 with higher grade secondary school Mathematics marks.
Hypothesis 3
There is a positive correlation between affective variables and scholastic
achievement.

74
Rationale
Affective variables, such as self-concept and motivation, were found to have a
relationship with learners’ achievement. General self-concept shows positive
correlations ranging from 0.21 to 0.27 with academic achievement (Hansford &
Hattie 1982:123-142; Coover & Murphy 2000:125-147). The more specific academic
self-concept shows higher correlations with scholastic achievement than general self-
concept (between 0.22 and 0.38) (Marsh 1990: 646-656; Marsh, Hau & Kong
2002:727-763). Subject-specific self-concepts have the highest correlations with
achievement in matching subjects. Koutsoulis and Campbell (2001:108-127) found
that English self-concept had a correlation with English subject achievement of
between 0.39 and 0.42. The relationship between Mathematics self-concept and
Mathematics achievement was revealed to be between 0.33 and 0.58.
Motivation has a positive relationship with scholastic achievement (Monteith
1988:23-34). Fortier, Vallerand & Guay (1995:257-274) and Ramseier (2001:421-
439) found positive relationships between intrinsic motivation and scholastic
achievement ranging from 0.13 to 0.40. Extrinsic motivation also plays a role in
academic achievement. Sideridis (2001:277-288) as well as McCoach and Siegle
(2003:144-154) found that a strong emphasis on gaining high marks led to student
behaviour such as complying with teachers’ expectations and effective study
behaviour which in turn led to high school achievement. A correlation of 0.31 was
found between holding educational goals, such as the intention to obtain a high school
qualification, and academic achievement (Schultz 1997:193-102). The motivational
variable of subject self-efficacy was found to predict achievement in a particular
subject. Bong (2002:133-162) established that there was a correlation of 0.33 between
English self-efficacy and English achievement, while Mathematics self-efficacy
showed a correlation of 0.27 with Mathematics achievement. Bouffard, Goileau &
Vezeau (2001:589-604) determined that self-efficacy beliefs for French predicted
10% of the variance in French achievement in Grade 6 and predicted 9.8% of the
variance in the first year of secondary school. Both a task and performance goal

75
orientation, have been found to have a positive relationship with academic
achievement (Tanaka & Yamauchi 2001:123-135; Bouffard, Boileau & Vezeau
2001:589-604). Mastery goals explained 11% of the variance in academic
achievement and performance goals predicted 1.3% of achievement. A study carried
out by Leondari and Gialamas (2002:279-291) found a correlation of 0.52 between
beliefs of self-efficacy and achievement, accounting for 27% of academic
achievement.
Hypothesis 4
There is a positive correlation between study orientation and scholastic achievement.
Rationale
A survey of the literature revealed that effective study habits and techniques are
positively related to academic achievement. Research has shown that study habits and
attitudes account for between 4% and 13% of the variance in scholastic achievement
(Lammers, Onwuegbuzie & Slate 2001:71-81; Kovach, Fleming & Wilgosh 2001:39-
49). The study by Lammers, Onwuegbuzie and Slate (2001:71-81) revealed a
correlation of 0.36 between good study habits and academic achievement and
explained the greatest variance in achievement, using a standardised study habits
inventory. Note-taking, good time-management, and study techniques such as the
application of information to other subjects and events outside of school were
important in predicting high achievement. Rau and Durand (2000:19-38) found that
students who spent considerable time on their studies and who studied consistently,
achieved well academically. The researchers reported a correlation of 0.24 between
this way of studying and academic achievement. Regular completion of homework
accounted for between 2% and 10% of the variance in scholastic performance of
Grade 6 to 12 learners (Cooper, Lindsay, Nye & Greathouse 1998:70-83).

76
Hypothesis 5
A combination of variables explains more of the variance in achievement than any
variable on its own.
Rationale
A combination of different variables will explain more of the variance in scholastic
achievement than any one variable on its own (Marais 1992:184-191). Studies
measuring the effects of not only cognitive factors but also affective factors and other
variables, such as study habits and attitudes, have accounted for a greater amount of
variance in achievement than any variable on its own (Horn, Bruning, Schraw, Curry
& Katkanant 1993:464-478). These researchers developed a path model to establish
the contributions made by intelligence, previous knowledge, motivation and study
habits to academic achievement. They found that 21% of the variance was explained
by intelligence, while a further 11% was explained by previous knowledge. The
researchers suggest that an additional 3% of the variance in achievement can be
ascribed to motivation variables and effective study strategies. The above variables
taken together, accounted for a total of approximately 35% of the variance in
achievement.
Chen, Lee and Stevenson (1996:750-759) conducted a long-term study to predict
achievement at school. They measured learners’ intelligence and previous
performance. Included in the study were demographic factors and the effects of home
environment as predictive variables. The researchers found that intelligence
accounted for between 8% and 28% of the variance in school achievement in Grade
11. The combination of intelligence with previous knowledge, however, accounted
for up to 47% of the variance in Grade 11 achievement. Previous knowledge may be
influenced by a whole range of factors, such as specific aptitudes for a subject,
affective factors, study habits and quality of instruction on the part of the teacher.
Demographic factors and the influence of home environment did not have direct
effects on achievement.

77
4.3 RESEARCH DESIGN
The research design that was used to test the stated hypotheses will be discussed
below. The discussion includes a description of the sample, the measuring
instruments and the research procedure.
4.3.1 Sample
Grade 9 learners were selected for the study for the following reasons:
a) The completion of Grade 9 marks the end of the General Education and
Training Band when learners are legally allowed to leave school. The
possibility of estimating further academic achievement from measures
obtained in Grade 9 will enable learners and their parents to decide
whether it would be advantageous for the learner to remain in school, to
enter another training institution or to enter the job market.
b) The use of an aptitude test in Grade 9 can provide guidelines regarding
the selection of subjects for Grade 10.
c) Grade 9 learners have had a year’s experience of the secondary school
environment. Factors, such as excessive anxiety due to learning new
rules and routines, might not affect the research process.
Learners were selected in the province of Mpumalanga. Two circuits
within the Middelburg area were randomly chosen and one school from
each circuit was selected. The learners are representative of the diverse
cultural population of South Africa, including European, African, Indian
and Coloured learners. Girls comprised sixty percent of the sample and
boys, forty percent. Table 4.1 shows the composition of the sample
according to gender and language.
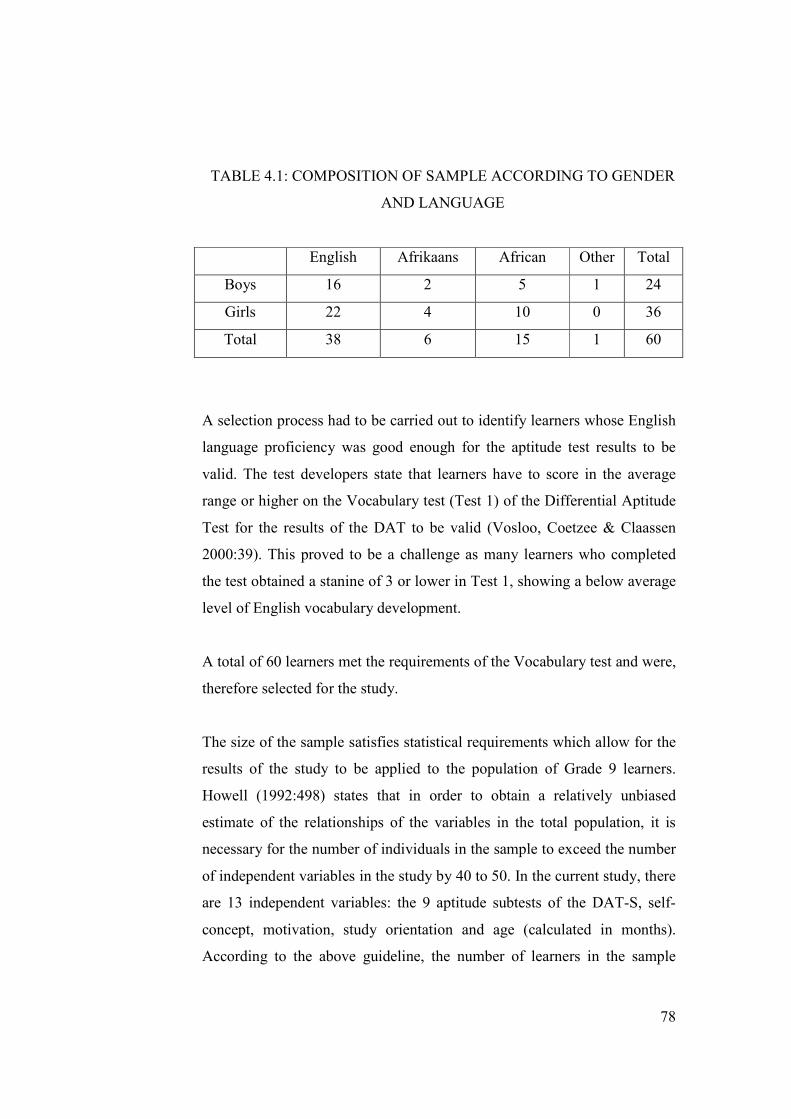
78
TABLE 4.1: COMPOSITION OF SAMPLE ACCORDING TO GENDER
AND LANGUAGE
English Afrikaans African Other Total
Boys 16 2 5 1 24
Girls 22 4 10 0 36
Total 38 6 15 1 60
A selection process had to be carried out to identify learners whose English
language proficiency was good enough for the aptitude test results to be
valid. The test developers state that learners have to score in the average
range or higher on the Vocabulary test (Test 1) of the Differential Aptitude
Test for the results of the DAT to be valid (Vosloo, Coetzee & Claassen
2000:39). This proved to be a challenge as many learners who completed
the test obtained a stanine of 3 or lower in Test 1, showing a below average
level of English vocabulary development.
A total of 60 learners met the requirements of the Vocabulary test and were,
therefore selected for the study.
The size of the sample satisfies statistical requirements which allow for the
results of the study to be applied to the population of Grade 9 learners.
Howell (1992:498) states that in order to obtain a relatively unbiased
estimate of the relationships of the variables in the total population, it is
necessary for the number of individuals in the sample to exceed the number
of independent variables in the study by 40 to 50. In the current study, there
are 13 independent variables: the 9 aptitude subtests of the DAT-S, self-
concept, motivation, study orientation and age (calculated in months).
According to the above guideline, the number of learners in the sample

79
should not have been fewer than 53. Therefore the sample size of 60
learners is satisfactory.
The sample contains some learners who are older than the normal age of a
learner in Grade 9, which is 14 years turning 15. The reason for this is that
in South Africa learners are retained in a grade if they have not sufficiently
mastered the academic content of a year. The oldest learners, however,
were not older than 16 years 11 months as this is the maximum age
provided for by the norm tables of the Senior South African Individual
Scale – Revised.
4.3.2 Measuring instruments
A range of tests were used in this study as several different variables had to
be measured.
4.3.2.1 Intelligence
The Senior South African Individual Scale – Revised (SSAIS-R)
(Van Eeden 1997b:1) was used to measure intelligence. It is a
deviation IQ scale where the individual’s scores are compared with
the test performance of others in the same age group. The aim of
the SSAIS-R is to obtain an indication of a learner’s general
intelligence as well as to determine relative strengths and
weaknesses in cognitive functioning. As was shown in Chapter 3
(section 3.2.1), the level of a learner’s general intelligence
accounts for the largest proportion of the variability in scholastic
achievement. Verbal and nonverbal factors were also shown to
predict performance in certain subjects. The SSAIS-R was
released in 1997 and is standardised for South African pupils from
the ages of 7 years 0 months to 16 years 11 months.
The standardisation of the English version of the SSAIS-R was
carried out with a sample of learners who had English as their

80
mother tongue. Some of the learners in the current study do not
speak English as a home language, but since the learners receive
their education in English, it was decided to use the SSAIS-R. The
measurement of a learners’ intelligence in English, gives an
indication of their intellectual ability in an English school
environment. This variable is important when the learner’s
achievement in English is being measured, as is the case in the
current study. A certain level of English proficiency was ensured,
however, as learners were only selected if they had an average
score or higher, on the Vocabulary test of the aptitude measure
used. It was therefore likely that the learners in this study had at
least an average level of English language proficiency.
The SSAIS-R comprises eleven subtests. Nine subtests form the
composite scale necessary to calculate the verbal scale, the
nonverbal scale and the full scale scores. Two additional tests, Test
10: Memory for Digits, and Test 11: Coding, are included if further
diagnostic information is required, but are not included in the
composite scales. The nine composite scale subtests are:
Verbal Scale
1) Test 1: Vocabulary
The test measures the individual’s verbal intelligence and verbal
learning ability. An indication of the individual’s language
development is also obtained.
2) Test 2: Comprehension
An understanding of a variety of social situations and the ability to
use the information in a meaningful and emotionally relevant way
is evaluated in this test.
3) Test 3: Similarities
81
Logical, abstract reasoning, verbal concept formation and long-
term memory are evaluated in this test.
4) Test 4: Number Problems
This test measures numerical reasoning which involves logical
thinking, abstract thought and mental alertness.
5) Test 5: Story Memory
In this test short-term auditory memory for meaningful material is
evaluated.
Nonverbal Scale
6) Test 6: Pattern Completion
Nonverbal sequential reasoning and the ability to use analogies is
tested.
7) Test 7: Block Designs
This test measures nonverbal intelligence and nonverbal problem-
solving skills. Spatial abilities are evaluated.
8) Test 8: Missing Parts
In this test comprehension of familiar situations, visual perception
and visual memory are evaluated.
9) Test 9: Form Board
Visual perception and visual-motor coordination are tested.
4.3.2.1.1 Reliability of the SSAIS-R
The reliability of the subtests and scales of the SSAIS-R, is
an indication of the extent to which they consistently
measure the respective cognitive abilities. The reliability
coefficients of the subtests of the nine composite subtests of
SSAIS-R for the ages 14, 15 and 16, relevant to the current
study, are provided in Table 4.2.

82
TABLE 4.2: RELIABILITY OF THE SSAIS-R
SUBTESTS/ SCALES 14 YEARS
N = 295
15 YEARS
N = 296
16 YEARS
N = 289
Test 1: Vocabulary
English
N = 135
0.87
N = 124
0.88
N = 122
0.85
Test 2: Comprehension 0.71 0.69 0.63
Test 3: Similarities 0.76 0.75 0.76
Test 4: Number
Problems
0.83 0.86 0.86
Test 5: Story Memory 0.83 0.84 0.83
Test 6: Pattern
Completion
0.73 0.76 0.79
Test 7: Block Designs 0.90 0.88 0.89
Test 8: Missing Parts 0.59 0.66 0.60
Test 9: Form Board 0.73 0.75 0.73
Verbal Scale 0.93 0.93 0.92
Nonverbal Scale 0.88 0.89 0.88
Full Scale 0.94 0.95 0.94
(Van Eeden 1997a:13)
The reliability coefficients range from 0.59 to 0.90 on the
subtests. In general, the subtests appear to be reliable with
the possible exceptions of Test 2: Comprehension for 15
year olds and 16 year olds, and Test 8: Missing Parts for all
three age groups. These coefficients are below the accepted
minimum of 0.70 (Bester 2003:38).

83
4.3.2.1.2 Validity of the SSAIS-R
The validity of a test refers to the extent to which it
measures that which it is supposed to measure (Cohen &
Swerdlik 2002:154). In most cases three types of validity
are investigated: content validity, criterion validity and
construct validity.
Content validity refers to the extent to which items in a test
are representative of the area that the test is designed to
measure (Cohen & Swerdlik 2002:156). The content
validity of the SSAIS-R was established by a description of
the cognitive abilities that are measured in each subtest and
which are widely accepted measures of intelligence. For
example, in Test 1: Vocabulary, the individual’s verbal
intelligence and verbal learning ability are measured.
Sternberg (2000: 316) maintains that verbal intelligence
and verbal learning ability are widely accepted as valid
measures of intelligence.
Construct validity refers to the extent to which a construct
explains the variance in test behaviour (Van Eeden
1997a:34). The construct validity of the SSAIS-R, as an
intelligence test, was established through factor analysis, as
well as using comparisons with other intelligence tests. In
order to establish validity in the standardisation process,
factor analysis was carried out. The factor analysis revealed
that there were significant loadings, of 0.30 or higher, on
one main factor. This factor was taken to be g, or general
intelligence (Van Eeden 1997a:98). The general
intelligence factor explained 44% of the variance in scores
obtained on the different subtests. Two further factors were
84
identified which had sufficient specific variance to be
distinguished from each other (Van Eeden 1997a:35).
These factors were verbal and nonverbal intelligence.
Criterion-related validity refers to the extent to which scores
obtained on a test can predict scores of a specific criterion.
The test developer mentions that the SSAIS-R is used in the
educational context, to predict future scholastic achievement
and to obtain diagnostic and prognostic information (Van
Eeden 1997a:34) but does not provide evidence for this
aspect of validity. As stated in Chapter 3 (section 3.2.1),
however many studies show that intelligence measures
predict academic achievement. It can be said that the SSAIS-
R has content and construct validity which indicate that it is
a valid intelligence test. On this basis it would be probable
that the test would be able to predict academic achievement.
4.3.2.2 Aptitude
Aptitude was measured using the newly developed Differential
Aptitude Tests Form S (Advanced Form) (Vosloo et al. 2000:1).
The DAT-S was developed in 2000, with the purpose of measuring
different aptitudes which could be used to help make decisions
regarding subject choices and choice of school type. The DAT-S is
one of a series of aptitude tests for different grades. The other
aptitude tests in the series have been described in more detail in
chapter 2 (section 2.6). The DAT-S was developed for use with
learners in Grades 7, 8, 9 and 10 who have received favourable
learning opportunities. The learners in the current study have
received favourable educational opportunities so it was decided to
use the DAT-S.

85
The DAT-S comprises nine different aptitude tests:
Test 1: Vocabulary
This test measures the Verbal Comprehension Factor (V), which is
the knowledge of word meanings, as well as the application of this
knowledge in spoken and written language.
Test 2: Verbal reasoning
General reasoning (R) with verbal material is measured in this test.
Test 3: Nonverbal reasoning: Figures
General reasoning (R) on the basis of nonverbal material is
measured in this test.
Test 4: Computations
The arithmetical ability of learners is measured in this test.
Test 5: Reading Comprehension
This test measures the ability of the learner to comprehend what he
is reading.
Test 6: Comparison
Visual Perceptual Speed (P) is measured in this test as an aspect of
clerical ability. The learner is required to perceive differences and
similarities between visual configurations quickly and accurately.
Test 7: Spatial Visualisation 3 D
The three-dimensional spatial ability of a learner is measured in this
test.
Test 8: Mechanical Insight
86
This test measures Mechanical Insight through evaluating the ability
of the learner to make correct visual representations of the result of
the operation of a mechanical apparatus, or a physical principle
depicted in a drawing.
Test 9: Memory (Paragraph)
The Memory Factor (M) is measured in this test where the learner is
required to memorise written paragraphs, and to correctly answer
questions on the content of the paragraphs.
The DAT-S was standardised on a sample of Grade 7 and Grade 9
learners. In total there were 2 250 learners. Learners from all
population groups were included. About half were boys and half
were girls. The researchers state that good quality education was
provided in most of the schools.
4.3.2.2.1 Reliability of the DAT-S
The reliability coefficients are given only for a Grade 7
group in the manual and are provided in Table 4.3.

87
TABLE 4.3: RELIABILITY COEFFICIENTS FOR A GRADE 7
GROUP TESTED IN 4 SCHOOLS
TEST Reliability
1. Vocabulary English 0.84
2. Verbal reasoning 0.78
3. Nonverbal reasoning 0.78
4. Computations 0.81
5. Reading comprehension English 0.87
7. Spatial visualisation Boys 0.80
Girls 0.80
8. Mechanical insight Boys 0.82
Girls 0.77
9. Memory 0.89
(Vosloo et al. 2000: 41)
The reliability of Test 6: Comparison was not given as the
researchers maintain that the test is a speeded one and
therefore highly reliant on the pace at which the learner
works rather than his or her ability to complete items
correctly. Seeing as the reliability coefficients are all above
0.70 the tests appear to be reliable measures of aptitude
(Vosloo et al. 2000:41).
4.3.2.2.2 Validity of the DAT-S
The test developers state that an indication of the content
validity of the DAT-S was obtained by a consideration of
the items by a team of experts in the field of aptitude
testing. Construct validity, that is, the degree to which the
test measures a theoretical construct, was evaluated by

88
looking at the correlations of the tests with each other. The
tests that should theoretically correlate with each other,
show significant correlations, because of their relation with
the same construct (Vosloo et al. 2000:42-43). The
intercorrelations of the tests are given in Table 4.4.
TABLE 4.4: INTERCORRELATIONS OF DAT-S SUBTESTS
Test 1 2 3 4 5 6 7 8
1. Vocabulary
2. Verbal reasoning 0.70
3. Nonverbal reasoning 0.59 0.64
4. Computations 0.62 0.66 0.65
5. Reading comprehension 0.75 0.66 0.56 0.60
6. Comparison 0.39 0.37 0.39 0.42 0.44
7. Spatial visualisation 0.60 0.63 0.64 0.57 0.55 0.34
8. Mechanical insight 0.60 0.59 0.61 0.59 0.63 0.42 0.65
9. Memory 0.75 0.69 0.55 0.59 0.79 0.39 0.53 0.59
(Vosloo et al. 2000: 43)
Some of the highest correlations occur between Test 1:
Vocabulary, Test 2: Verbal reasoning, Test 5: Reading
comprehension and Test 10: Memory. These tests have the
factor, verbal ability, in common.
The predictive validity of the DAT-S was established by
correlating the test results with achievement in school
subjects. Only 61 Grade 7 learners were involved in this
study. All correlations, except for Test 6: Comparison, are

89
significant at the 5% level. The correlations are given in
Table 4.5.
TABLE 4.5: CORRELATIONS OF DAT-S TESTS WITH
SUBJECT PERCENTAGES FOR 61 AFRIKAANS-SPEAKING
GRADE 7 LEARNERS TESTED IN ONE SCHOOL
Test Afr Eng Math Hist Geog Sci Art Total1. Vocabulary 0.58 0.68 0.55 0.50 0.52 0.61 0.47 0.65
2. Verbal reasoning 0.60 0.72 0.49 0.51 0.61 0.61 0.52 0.68
3. Nonverbal reasoning 0.56 0.62 0.53 0.44 0.56 0.62 0.49 0.65
4. Computations 0.56 0.57 0.64 0.41 0.51 0.51 0.48 0.61
5. Reading comprehension 0.66 0.72 0.57 0.64 0.64 0.63 0.60 0.71
6. Comparison 0.14 0.23 0.25 0.06 0.23 0.18 0.23 0.21
7. Spatial visualisation 0.34 0.49 0.51 0.28 0.46 0.36 0.29 0.46
8. Mechanical insight 0.47 0.48 0.55 0.26 0.53 0.54 0.51 0.55
9. Memory 0.66 0.67 0.44 0.60 0.55 0.57 0.47 0.65
(Vosloo et al. 2000:44)
4.3.2.3 Self-concept and Motivation
A questionnaire developed for measuring affective factors in
learners participating in the performing arts in secondary school,
was used (Bester 2003:186). The questionnaire measured the levels
of anxiety, motivation, self-concept and stress in these learners.
Their relationships with their teacher and peers were also assessed.
Only the motivation and self-concept items were selected from this
questionnaire and the wording translated and adapted to be used in a
general school context. For example, one of the original items was

90
“As musiekleerder, is ek die meeste van die tyd teleurgesteld in
myself.”
The item was translated into English and changed to:
“As a learner, I am disappointed in myself most of the time.”
The questionnaire contains 40 items, 20 items measuring motivation
and 20 measuring self-concept. The sequence of the items is mixed
so that the respondents do not know which construct is being
measured as this knowledge may affect their responses. The items
are answered on a six-point scale so that a greater range of scores
can be obtained, thus increasing the reliability of the questionnaire.
A high score on the questionnaire indicates high motivation while a
low score indicates low motivation. The same applies to self-
concept. Some of the items are reversed to prevent respondents from
answering “yes”, in a uniform way.
4.3.2.3.1 Reliability of the self-concept and motivation questionnaire
The reliability of the questionnaire was established by
calculating the Alpha reliability coefficient for the items
dealing with each construct. The reliability coefficients are
provided in Table 4.6.
TABLE 4.6: RELIABILITY COEFFICIENTS OF THE
MOTIVATION AND SELF-CONCEPT SECTIONS OF THE
QUESTIONNAIRE
Variable Reliability coefficient
Motivation 0.86
Self-concept 0.89
91
The reliability coefficients are higher than 0.70 and the
questionnaire can therefore be considered as a reliable
measure.
4.3.2.3.2 Validity of the self-concept and motivation questionnaire
Content validity was addressed by using some items from
existing tests, such as Mellet’s motivation questionnaire
(Bester 2003:187), and some were developed on the basis of
the definition used for motivation. The researcher defined
motivation in a similar way to that used in the current study
in Chapter 3 (section 3.3.2). Motivation is seen as a state of
having energy to move towards a specific goal. Motivation
therefore leads a person to take action, to become involved
in an issue and to be determined to persevere until the goal
is achieved. A motivated learner is, therefore someone who
sets a certain standard for himself, is determined to maintain
that standard, who learns conscientiously and is proud of
the work he does (Bester 2003:187). The self-concept items
were based on existing tests such as Waetjen’s Self-concept
as Learner Scale (Burns 1979:141). The definition of the
self-concept used in developing the items is similar to that
used in the current study in Chapter 3 (section 3.3.1). The
self-concept is defined as a comprehensive construct which
includes a person’s behaviour as well as his or her thoughts
and feelings. The self-concept is seen as both descriptive
and evaluative (Bester 2003:190). Content validity was also
addressed by having experts in the relevant fields evaluate
whether the items measure what they are supposed to
measure.
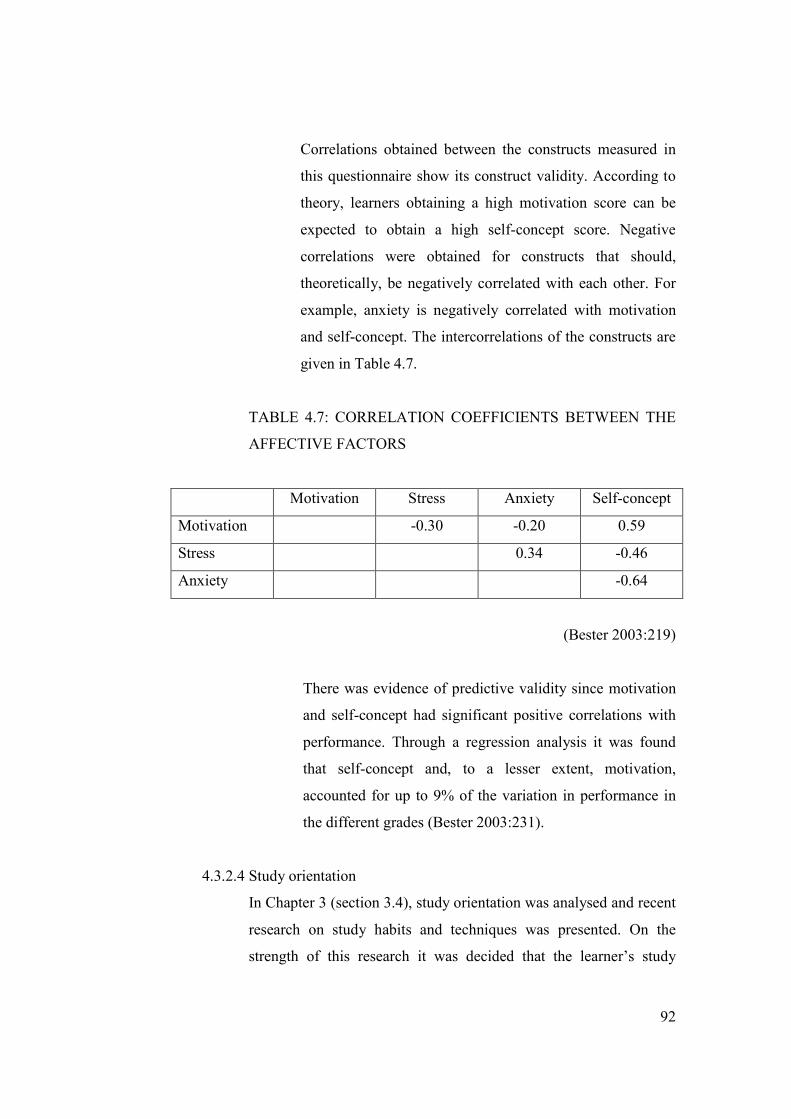
92
Correlations obtained between the constructs measured in
this questionnaire show its construct validity. According to
theory, learners obtaining a high motivation score can be
expected to obtain a high self-concept score. Negative
correlations were obtained for constructs that should,
theoretically, be negatively correlated with each other. For
example, anxiety is negatively correlated with motivation
and self-concept. The intercorrelations of the constructs are
given in Table 4.7.
TABLE 4.7: CORRELATION COEFFICIENTS BETWEEN THE
AFFECTIVE FACTORS
Motivation Stress Anxiety Self-concept
Motivation -0.30 -0.20 0.59
Stress 0.34 -0.46
Anxiety -0.64
(Bester 2003:219)
There was evidence of predictive validity since motivation
and self-concept had significant positive correlations with
performance. Through a regression analysis it was found
that self-concept and, to a lesser extent, motivation,
accounted for up to 9% of the variation in performance in
the different grades (Bester 2003:231).
4.3.2.4 Study orientation
In Chapter 3 (section 3.4), study orientation was analysed and recent
research on study habits and techniques was presented. On the
strength of this research it was decided that the learner’s study
93
orientation be assessed using the Survey of Study Habits and
Attitudes developed by Brown and Holtzman (1997:1).
The questionnaire may be administered to learners from Grade 8 to
Grade 12. It consists of 100 statements to which the learner
responds on a five-point scale. The learner indicates how often each
statement is true for him or her, either “rarely” (0-15% of the time),
“sometimes” (16-35% of the time), “frequently” (36-65% of the
time), “generally” (66-85% of the time) or “always” (86-100% of
the time). An example of an item is “It takes a long time before I
really start working” (Brown & Holtzman 1997:3).
The scores on the questionnaire are grouped into four different
scales, which are further grouped into higher order descriptions of
study habits and study attitudes. The scores on the “Delay
avoidance” and “Work methods” scales are grouped into a “Study
habits” scale. The “Teacher approval” and “Education acceptance”
scales are grouped into the “Study attitudes” scale. The combination
of the study habits and study attitudes scales forms a global picture
of the learner’s study orientation (Du Toit 1995:7).
The Delay avoidance scale indicates to what extent the learner
promptly completes his assignments. An indication of the learner’s
use of effective study methods is provided by the Work methods
scale. The Teacher approval scale provides a measure of the
learner’s attitude towards the teacher’s classroom behaviour and
methods. The Education acceptance scale determines the extent of
the learner’s acceptance of educational ideals, objectives, practices
and requirements.

94
The questionnaire was adapted and standardised for use in South
Africa by the Health Sciences Research Council (Du Toit 1995:8).
A group of 354 learners, comprising 184 girls and 170 boys, were
involved in the sample for standardisation for Grade 9.
4.3.2.4.1 Reliability of the Survey of Study Habits and Attitudes
The reliability of the questionnaire was determined through
the calculation of split-half coefficients shown in Table 4.8.
TABLE 4.8: CORRECTED SPLIT-HALF RELIABILITY FOR
THE FOUR PRIMARY SCALES OF THE SSHA (N=2790)
Scale Delay
Avoidance
Work
Methods
Teacher
Approval
Education
Acceptance
0.83 0.84 0.87 0.81
(Du Toit 1995:9)
Test-retest reliability was also used to assess the reliability
of the questionnaire. Four groups of learners were tested
and then retested after 14 days. The results of the test-retest
reliability are provided in Table 4.9.

95
TABLE 4.9: RETEST RELIABILITY FOR THE SSHA SCALES
Group N DA WM TA EA SH SA SO
Boys 229 0.89 0.86 0.87 0.87 0.90 0.90 0.92
Girls 223 0.88 0.81 0.86 0.88 0.88 0.90 0.90
Afrikaans 210 0.86 0.86 0.88 0.87 0.89 0.90 0.91
English 242 0.90 0.82 0.85 0.88 0.89 0.90 0.91
(Du Toit 1995:9)
The reliability coefficients using both methods are above
0.70, therefore the questionnaire can be taken as a reliable
measure of all the scales.
4.3.2.4.2 Predictive validity of the Survey of Study Habits and
Attitudes
The SSHA questionnaire has a significant, positive
relationship with scholastic achievement. The correlations
between SSHA scores on the seven scales and school
achievement in Grade 9 are provided in Table 4.10

96
TABLE 4.10: CORRELATIONS BETWEEN SSHA SCORES
AND SCHOLASTIC ACHIEVEMENT AS AN AVERAGE
PERCENTAGE IN GRADE 9 (N=332)
Scale Grade 9 achievement
Delay avoidance 0.36
Work methods 0.40
Teacher approval 0.35
Education acceptance 0.44
Study habits 0.44
Study attitudes 0.42
Study orientation 0.45
(Du Toit 1995:10)
4.3.2.5 Scholastic achievement
Marks obtained at the end of the second term in both schools were
taken as measures of academic achievement. Half of the second
term percentage comprised a term mark, and the other half the
formal midyear examination mark. The term mark in Grade 9 is
made up of different kinds of assessments which are weighted more
or less equally. The kinds of assessments used differ from subject to
subject but usually included the following:
• An investigation – the learners carry out real-life research,
for example in Mathematics, they find out how hamburger
sales at Steers compares with hamburger sales at
McDonalds. The learners collect the data and report on their
findings.
• A project – information on a topic has to be presented in
written or other form. The topic does not form part of the
syllabus and is therefore enrichment work.

97
• Formal tests – the usual controlled, supervised tests that take
place in the classroom.
• Assignments – written exercises done as homework.
• Informal tests – small tests completed in class. The subject
matter is decided on by the teacher. In Mathematics, aspects
of theory may be tested in the informal test.
In obtaining the final term mark, the above five kinds of assessment
may each be represented as a mark out of 10. A mark out of 50
would then be obtained. The learner’s term mark would then be
added to the midyear examination mark and the total percentage for
the subject would then be obtained.
Performance in the following subjects was seen as representative of
Grade 9 achievement in the current study:
First language (English)
Second language (Afrikaans)
Mathematics
Natural sciences
Social sciences
Economic and Management sciences
4.3.2.6 Previous knowledge
Previous performance was not taken into account as previous
knowledge is not a pure variable. It is influenced by many factors.
Additionally, in cases where learners have performed badly in the
past it is psychologically-speaking better not to take previous
performance into account in a prediction model. Learners may feel
that they will be disadvantaged by their previous weak performance.
If previous performance is not taken into account, it is possible to
98
predict performance for a learner even if he does not take the
relevant subject.
4.4 RESEARCH METHOD
The aptitude tests were administered to the 60 learners in groups of no more than
12 at a time. The learners completed the tests during the school morning to avoid
fatigue due to the long testing time required. The administration procedures were
strictly followed according to the instructions in the DAT-S manual.
The Self-concept and Motivation Questionnaires, as well as the Survey of Study
Habits and Attitudes questionnaires, were completed by the learners on the same
day they completed the aptitude tests. The instructions were read aloud to the class
and the learners were allowed to complete these at their individual pace.
The Senior South African Individual Scale IQ tests were administered individually
to learners, in the weeks following their completion of the aptitude tests and
questionnaires. The IQ tests were carried out at a time suitable for the learner
considering their school time table and extra mural commitments. Most of the IQ
tests were administered during the morning to avoid fatigue. The instructions as
stated in the manual for the SSAIS-R were strictly followed.
The school results were obtained after the June reports had been compiled at the
respective schools. All the information was entered on coded sheets and the
information was processed using a computer.
Ethical considerations were addressed in the study. Learners were informed that the
test results would be used in a research study at the University of South Africa. The
aims of the study were explained. They were assured of the confidentiality of their
results and they were offered the opportunity to obtain feedback regarding their
tests.

99
The tests were carefully selected and the research method developed in order to
provide reliable and valid answers to the research questions posed in Chapter 1
(section 1.2). The results of the investigation are presented and discussed in the
following chapter.

100
CHAPTER 5
RESULTS OF THE EMPIRICAL INVESTIGATION
5.1 INTRODUCTION
The purpose of the empirical investigation is to test the hypotheses which were
stated in chapter 4 (section 4.2). These hypotheses deal mainly with the
relationships between aptitude, intelligence, affective factors and scholastic
achievement.
5.2 TESTING OF THE HYPOTHESES
5.2.1 Hypothesis 1
With regard to hypothesis 1 in section 4.2, the following null hypothesis is stated:
There is no significant positive correlation between intelligence and aptitude.
In order to test the null hypothesis, the Pearson correlation coefficients between
each of the aptitude tests and the Verbal scale, Nonverbal scale and Total scale of
the intelligence test were calculated. The results are given in Table 5.1.

101
TABLE 5.1: CORRELATIONS BETWEEN DAT-S APTITUDE TESTS AND
SCALES OF SENIOR SOUTH AFRICAN INDIVIDUAL SCALE – REVISED
(SSAIS-R)
APTITUDE TEST VERBAL
SCALE
NONVERBAL
SCALE
TOTAL SCALE
1.VOCABULARY 0.63 0.37 0.58
2.VERBAL
REASONING
0.57 0.48 0.62
3.NONVERBAL
REASONING
0.45 0.54 0.60
4.COMPUTATIONS 0.44 0.48 0.55
5.READING
COMPREHENSION
0.50 0.39 0.52
6.COMPARISON 0.10* 0.19* 0.16*
7.SPATIAL
VISUALISATION
0.40 0.60 0.58
8.MECHANICAL
INSIGHT
0.50 0.47 0.58
9. MEMORY 0.37 0.20* 0.33
* p>0.05
For all the other correlations p<0.01
From the results it appears that the null hypothesis can be rejected as all of the
aptitude subtests show significant, positive correlations with the intelligence
scales. The correlations between most of the aptitude subtests and the different
scales of the Senior South African Individual Scale – Revised (SSAIS-R) are
moderate to high positive correlations. These correlations indicate that the
aptitude scores are related to intelligence scores. Persons with a high aptitude
score will also obtain a high general intelligence score. These findings are in
agreement with De Bruin (1997:14) as well as Fouché and Verwey (1994:55) who

102
maintain that specific aptitudes have much in common with general intelligence.
Owen (2000:46-48), in the development of the Differential Aptitude Test, found
that there was evidence of a common factor. This factor is probably general
intelligence.
The subtest showing the highest correlation with the Total Intelligence Scale is
Test 2 (Verbal Reasoning) (0.62). The last mentioned result is in agreement with
the interpretation made by the developers of the DAT-S, that Test 2 (Verbal
Reasoning) gives the best indication of the learner’s general intelligence level
(Vosloo, Coetzee & Claassen 2000:36).
Five of the nine aptitude subtests correlate more with the Total Scale of the
SSAIS-R than with either of the two subscales. These tests are Test 2 (Verbal
Reasoning) (0.62), Test 3 (Nonverbal Reasoning) (0.60), Test 4 (Computations)
(0.55), Test 5 (Reading Comprehension) (0.52) and Test 8 (Mechanical Insight)
(0.58). Therefore, these tests appear to be measuring both verbal and nonverbal
factors and give an indication of the learner’s general intelligence. These results
are in agreement with the relationships between general and specific intelligences
illustrated by Carroll (in Berk 2000:319) and described in Chapter 2
(section2.3.1.6). The Nonverbal Reasoning, Computations and Mechanical Insight
subtests measure abilities such as sequential reasoning and quantitative reasoning.
The Verbal Reasoning and Reading Comprehension subtests measure language
abilities. Sequential reasoning, quantitative reasoning as well as language
comprehension are closely related to general intelligence according to Carroll.
The SSAIS-R comprises two subscales, verbal intelligence and nonverbal
intelligence. An analysis of the relationship between each aptitude subtest and the
two subscales will give an indication of common factors measured. The aptitude
subtests that were expected to show higher correlations with the Verbal scale
rather than the Nonverbal scale generally do show this relationship (except for
Test 8: Mechanical Insight which shows a higher relationship with the Verbal
103
scale despite measuring nonverbal content. Further discussion of the possible
reasons for this is undertaken later in this chapter). The tests are Test 1
(Vocabulary) (0.63), Test 2 (Verbal Reasoning) (0.57), Test 5 (Reading
Comprehension) (0.50) and Test 9 (Memory) (0.37). The higher correlations of
these subtests with the Verbal scale are probably as a result of their measurement
of a common Verbal factor (V).
The subtests that show higher correlations with the Nonverbal scale are the ones
that would be expected to do so. These tests are Test 7 (Spatial Visualisation)
(0.60) and Test 3 (Nonverbal Reasoning) (0.54). It appears therefore that these
two subtests primarily measure nonverbal intelligence. Both the Nonverbal
Reasoning subtest and the Spatial Visualisation subtest measure the general
reasoning factor (R) according to Vosloo et al. (2000:5,8). General reasoning
includes reasoning on the basis of nonverbal material.
Test 4 (Computations) and Test 8 (Mechanical Insight), correlate similarly with
both the Verbal and Nonverbal scales indicating that they require the use of both
verbal and nonverbal abilities. The Computations subtest shows moderate
correlations of 0.44 with the Verbal scale and 0.48 with the Nonverbal scale.
Mechanical Insight has moderate correlations of 0.50 with the Verbal Scale and
0.47 with the Nonverbal scale. It appears therefore that these two subtests
measure general intelligence. This interpretation is supported by the higher
correlations of these subtests with the Total scale of the SSAIS-R compared to
that of the subscales.
A discussion of the relationship of each aptitude subtest with the different scales
of the Senior South African Individual Scale (SSAIS-R) follows. Test 1
(Vocabulary), as shown above, has the highest correlation with the Verbal scale of
the SSAIS-R (0.63). This would be expected as knowledge and understanding of
the meaning of words are primarily verbal abilities. The test appears to
discriminate well between verbal and nonverbal abilities as it shows a high

104
correlation with the Verbal scale and a conversely low correlation with the
nonverbal scale (0.37). The Vocabulary subtest has a correlation of 0.58 with the
Total scale.
The correlation of Test 2 (Verbal Reasoning) with the Total scale of the SSAIS-R
(0.62) is higher than the correlations of this subtest with either of the subscales.
This may indicate that the Verbal Reasoning subtest measures many verbal as
well as nonverbal factors. The test shows a higher correlation with the Verbal
Scale (0.57), than with the Nonverbal scale (0.48), probably due to the verbal
content of the test.
Test 3 (Nonverbal Reasoning) shows a higher correlation with the Total scale
(0.60) than with either of the subscales. This means that it measures verbal as well
as nonverbal factors. It has, however a higher correlation with the Nonverbal scale
(0.54) than with the Verbal scale (0.45) indicating that it measures more
nonverbal than verbal factors.
Test 4 (Computations) shows similar correlations with both the Nonverbal scale
(0.48) and the Verbal Scale (0.44). This finding appears to be in agreement with
van Eeden (1997a:36) who found that the Number Problems subtest of the
SSAIS-R, which also measures arithmetic ability, loads on both verbal and
nonverbal factors. The Computations subtest shows the highest correlation with
the Total scale (0.60) indicating the measurement of both verbal and nonverbal
factors by this test.
Test 5 (Reading Comprehension) has a considerable higher correlation with the
Verbal scale (0.50) than with the Nonverbal scale (0.39). This is probably due to
its measurement of primarily verbal factors. Again, this subtest shows the highest
correlation with the Total scale (0.52) indicating some measurement of nonverbal
factors.

105
Test 7 (Spatial Visualisation) has the highest correlation with the Nonverbal scale
(0.60) and a lower correlation with the Verbal scale (0.40). This is probably due
to the nonverbal content of the test which comprises mostly drawings and
diagrams. The Spatial Visualisation subtest appears to be measuring a nonverbal
visualisation factor, Vz (Vosloo et al. 2000:8). This test shows a correlation of
0.58 with the Total scale.
Interestingly, Test 8 (Mechanical Insight) shows a slightly higher correlation with
the Verbal scale (0.50) than with the Nonverbal scale (0.47). This is unexpected
as the test is meant to measure Mechanical Ability on the basis of nonverbal
pictures (Vosloo et al. 2000:8). Many of the multiple choice items in the test have
lengthy, verbal descriptions of mechanical movement in the stems of the answers,
as well as in the different answers available for selection. This relatively complex
verbal content probably requires a good standard of language ability, and explains
the strong positive relationship of this test with measures of verbal intelligence.
Test 9 (Memory) has a higher correlation with the Verbal scale (0.37) than with
the Total scale (0.33). It has a non-significant relationship of 0.20 (p>0.05) with
the Nonverbal scale. The Memory subtest therefore appears to measure verbal
factors rather than nonverbal factors. However, the correlation between the
Memory test and the Verbal scale is a low one indicating that the factors
measured in the Memory subtest do not have much in common with measures of
verbal or general intelligence. If one looks at the insignificant relationship
between the Memory test and the Nonverbal scale as discussed above, together
with a consideration of the low correlation between the test and both the Verbal
and Total scales, it appears that Memory aptitude does not have a strong
relationship with any of the measures of intelligence included in this study.
The Comparison subtest shows statistically insignificant relationships with the
Verbal, Nonverbal and Full scale scores of the SSAIS-R (respectively, r = 0.10, r
= 0.19, r = 0.16; p>0.05 in all three cases). These results appear to be in

106
agreement with the literature on the relationship between intelligence and timed
reaction tasks. The Comparison test measures Visual Perceptual Speed (P) where
the learner is required to perceive visual information and to make a speeded
reaction by marking the correct choice on the response sheet (Vosloo et al.
2000:7). Deary (1995:237-250) states that the correlation between cognitive test
scores and reaction time tasks is around 0.2 or lower. In addition, Carroll (in Berk
2000:319) in his three-stratum theory of intelligence describes choice reaction
time tasks as having the weakest relationship with g.
5.2.1.1 Explanation of the variance in intelligence
As stated in the previous section, the correlation between aptitude subtests and
general intelligence varies. For example the higher the score for verbal reasoning
aptitude, the higher the score for verbal intelligence will be. The variance (or
amount of change) shared by the variables is represented by the coefficient of
determination. The coefficient of determination is obtained by squaring the
Pearson correlation coefficient. It is then a measure of the variance of the
dependent variable which can be explained by the independent variable (Bester
2003:26). More of the variance in intelligence can be explained by calculating the
correlation between many of the aptitude tests and an intelligence score and
squaring the correlations. The measurement of the amount of variance explained
by the different aptitude tests as the independent variables can then be used in a
regression analysis to predict the dependent variable, that is intelligence (Cohen &
Swerdlik 2002:121).
In order to predict intelligence using aptitude scores in the current study, a
number of regression analyses were carried out. The different aptitude tests and
the learner’s age (in months) were used as predictive variables and the criterion
variables were verbal intelligence, nonverbal intelligence and general intelligence.
The learner's age was found to be in a negative relationship with his or her level
of intelligence. This may be because learners are kept back in a grade if they do
not cope with the schoolwork. Learners who are kept back a year, or fail in a

107
grade, may have a lower level of intelligence than other learners who progress in
the normal way. They are also necessarily older than the other learners in the
same grade.
5.2.1.1.1 Explanation of the variance in verbal intelligence
In Table 5.2 R2 indicates the proportion of the variance in verbal intelligence
which can be explained by each of the variables. It appears that Vocabulary
aptitude explains 40% of the variance in verbal intelligence. The learner’s age
explains a further 12% of the variance which was not explained by the
Vocabulary score. Mechanical Reasoning explains 7% more of the variance
not explained by the previous two variables while Verbal Reasoning
contributes a further 3% to the explanation of the variance in intelligence. In
total, 62% of the variance in verbal intelligence is explained. No other
variable adds to the explanation of the variance.
Table 5.2: EXPLANATION OF THE VARIANCE IN VERBAL
INTELLIGENCE
Variable R2 *F df
Vocabulary (VOCAB) 0.40 38.86 (1.58)
Age in Months (AGEM) 0.52 30.95 (2.57)
Mechanical Reasoning (MEC) 0.59 27.57 (3.56)
Verbal Reasoning (VERBAL) 0.62 22.50 (4.55)
*In all cases p<0.05
The regression equation for verbal intelligence can be calculated as follows:
Y = 153.121 + 1.822 (VOCAB) + 0.822 (VERBAL) + 0.992 (MEC) - 0.719
(AGEM)
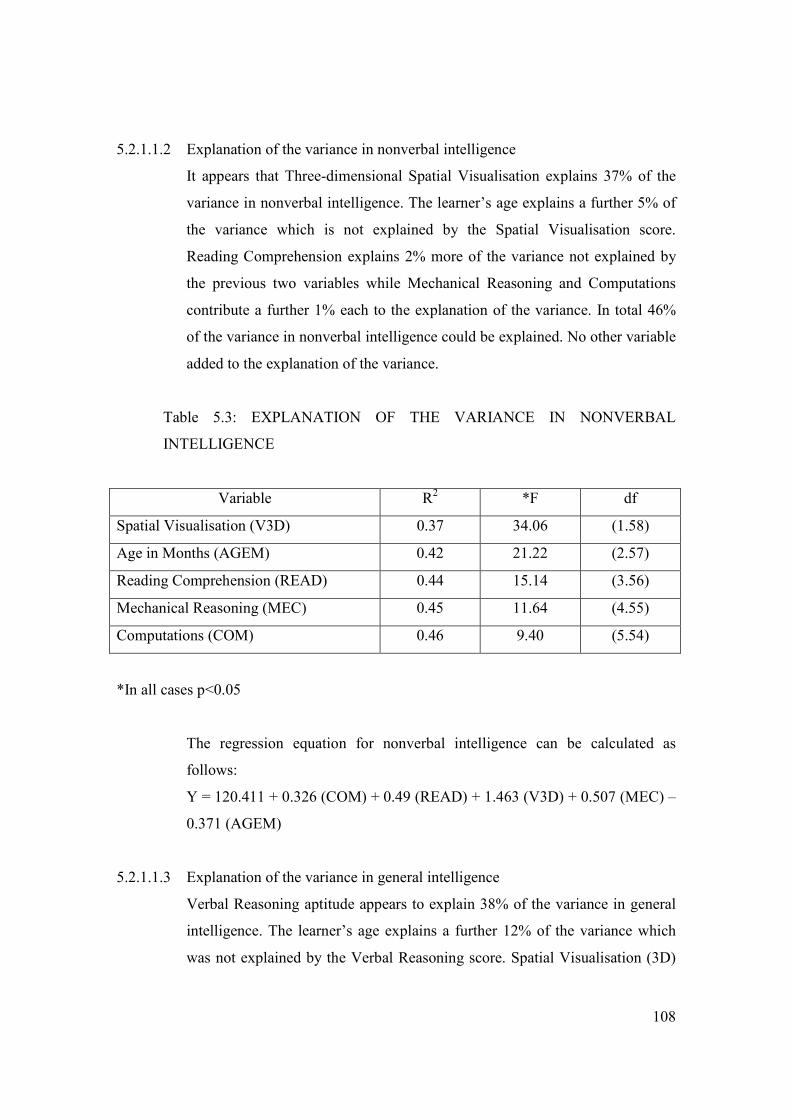
108
5.2.1.1.2 Explanation of the variance in nonverbal intelligence
It appears that Three-dimensional Spatial Visualisation explains 37% of the
variance in nonverbal intelligence. The learner’s age explains a further 5% of
the variance which is not explained by the Spatial Visualisation score.
Reading Comprehension explains 2% more of the variance not explained by
the previous two variables while Mechanical Reasoning and Computations
contribute a further 1% each to the explanation of the variance. In total 46%
of the variance in nonverbal intelligence could be explained. No other variable
added to the explanation of the variance.
Table 5.3: EXPLANATION OF THE VARIANCE IN NONVERBAL
INTELLIGENCE
Variable R2 *F df
Spatial Visualisation (V3D) 0.37 34.06 (1.58)
Age in Months (AGEM) 0.42 21.22 (2.57)
Reading Comprehension (READ) 0.44 15.14 (3.56)
Mechanical Reasoning (MEC) 0.45 11.64 (4.55)
Computations (COM) 0.46 9.40 (5.54)
*In all cases p<0.05
The regression equation for nonverbal intelligence can be calculated as
follows:
Y = 120.411 + 0.326 (COM) + 0.49 (READ) + 1.463 (V3D) + 0.507 (MEC) –
0.371 (AGEM)
5.2.1.1.3 Explanation of the variance in general intelligence
Verbal Reasoning aptitude appears to explain 38% of the variance in general
intelligence. The learner’s age explains a further 12% of the variance which
was not explained by the Verbal Reasoning score. Spatial Visualisation (3D)

109
explains 9% more of the variance not explained by the previous two variables
while vocabulary and mechanical reasoning contribute a further 4% and 3%
respectively to the explanation of the variance. Reading Comprehension
explains approximately a further ½ %, while Memory and Computations
explain an additional 1% each. In total 68% of the variance in general
intelligence could be explained. This high amount of variance in intelligence
explained by the aptitude test implies a multiple correlation of at least 0.80
which is very high. The very high correlation between aptitude and
intelligence indicates that the two variables are measuring similar factors. No
other variable added to the explanation of the variance.
Table 5.4: EXPLANATION OF THE VARIANCE IN GENERAL
INTELLIGENCE
Variable R2 *F df
Verbal Reasoning (VERBAL) 0.38 36.31 (1.58)
Age in Months (AGEM) 0.50 29.25 (2.57)
Spatial Visualisation 3 D (V3D) 0.59 27.44 (3.56)
Vocabulary (VOCAB) 0.63 23.65 (4.55)
Mechanical Reasoning (MEC) 0.66 21.31 (5.54)
Reading Comprehension (READ) 0.66 17.91 (6.53)
Memory (MEM) 0.67 15.59 (7.52)
Computations (COM) 0.68 13.61 (8.51)
*In all cases p<0.05
The regression equation for general intelligence can be calculated as follows:
Y = 136.758 + 0.934 (VOCAB) + 0.525 (VERBAL) + 0.244 (COM) + 0.494
(READ) + 0.746 (V3D) + 0.896 (MEC) – 0.268 (MEM) – 0.579 (AGEM)
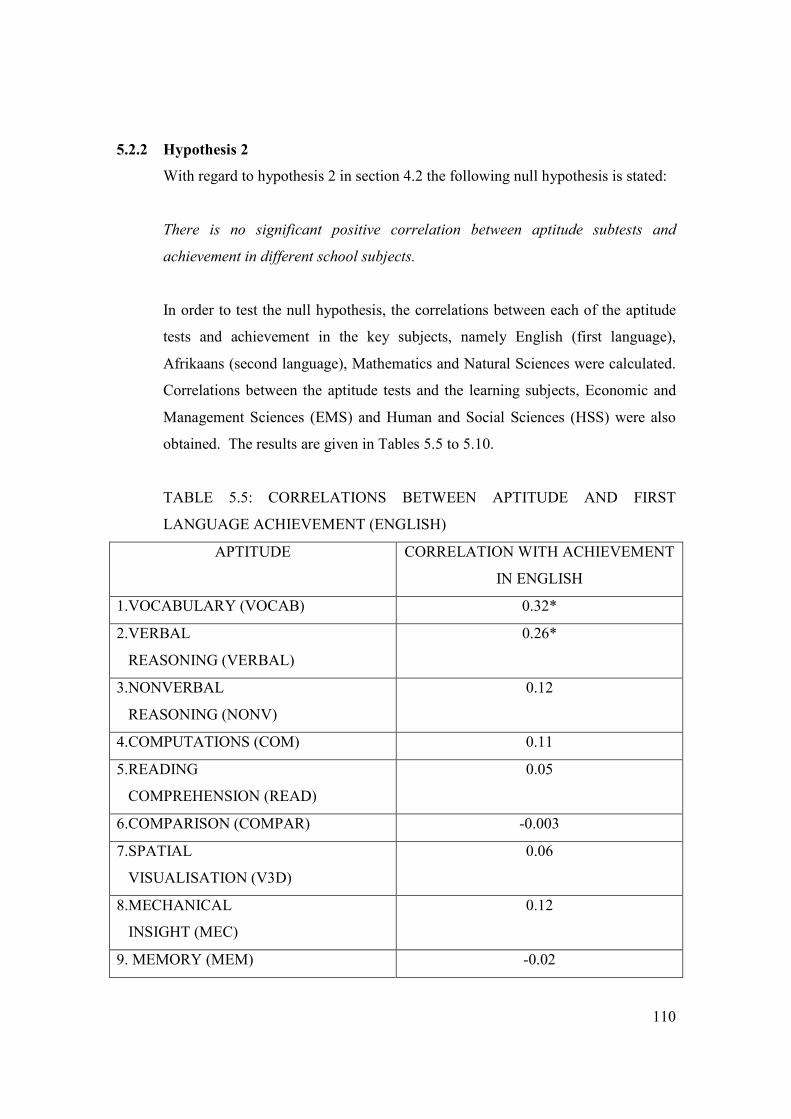
110
5.2.2 Hypothesis 2
With regard to hypothesis 2 in section 4.2 the following null hypothesis is stated:
There is no significant positive correlation between aptitude subtests and
achievement in different school subjects.
In order to test the null hypothesis, the correlations between each of the aptitude
tests and achievement in the key subjects, namely English (first language),
Afrikaans (second language), Mathematics and Natural Sciences were calculated.
Correlations between the aptitude tests and the learning subjects, Economic and
Management Sciences (EMS) and Human and Social Sciences (HSS) were also
obtained. The results are given in Tables 5.5 to 5.10.
TABLE 5.5: CORRELATIONS BETWEEN APTITUDE AND FIRST
LANGUAGE ACHIEVEMENT (ENGLISH)
APTITUDE CORRELATION WITH ACHIEVEMENT
IN ENGLISH
1.VOCABULARY (VOCAB) 0.32*
2.VERBAL
REASONING (VERBAL)
0.26*
3.NONVERBAL
REASONING (NONV)
0.12
4.COMPUTATIONS (COM) 0.11
5.READING
COMPREHENSION (READ)
0.05
6.COMPARISON (COMPAR) -0.003
7.SPATIAL
VISUALISATION (V3D)
0.06
8.MECHANICAL
INSIGHT (MEC)
0.12
9. MEMORY (MEM) -0.02

111
*p<0.05
In all other cases p>0.05
The results indicate that in the case of English achievement the null hypothesis
can be rejected as Test 1 (Vocabulary) and Test 2 (Verbal Reasoning) show
significant positive correlations with achievement. While the Vocabulary and
Verbal Reasoning aptitude subtests show positive relationships with English
achievement they are low correlations, indicating that the vocabulary and verbal
reasoning aptitudes do not explain a great amount of the variance in English first
language achievement. The remainder of the aptitude subtests do not show
significant relationships with English achievement. The Comparison test appears
to be unrelated to English achievement at school.
The correlations between the aptitude tests and second language (Afrikaans)
achievement are provided in Table 5.6.

112
TABLE 5.6: CORRELATIONS BETWEEN APTITUDE AND SECOND
LANGUAGE ACHIEVEMENT (AFRIKAANS)
APTITUDE CORRELATION WITH ACHIEVEMENT
IN AFRIKAANS
1.VOCABULARY (VOCAB) 0.07
2.VERBAL
REASONING (VERBAL)
0.14
3.NONVERBAL
REASONING (NONV)
0.11
4.COMPUTATIONS (COM) 0.08
5.READING
COMPREHENSION (READ)
-0.03
6.COMPARISON (COMPAR) 0.05
7.SPATIAL
VISUALISATION (V3D)
0.05
8.MECHANICAL
INSIGHT (MEC)
0.04
9. MEMORY (MEM) 0.13
For all correlations p>0.05
In the case of Afrikaans achievement the null hypothesis can be accepted as none
of the aptitude tests show significant relationships with Afrikaans achievement.
The correlations between the aptitude tests and Mathematics achievement are
provided in Table 5.7.

113
TABLE 5.7: CORRELATIONS BETWEEN APTITUDE AND
MATHEMATICS ACHIEVEMENT
APTITUDE CORRELATION WITH ACHIEVEMENT
IN MATHEMATICS
1.VOCABULARY (VOCAB) 0.15
2.VERBAL
REASONING (VERBAL)
0.25
3.NONVERBAL
REASONING (NONV)
0.35*
4.COMPUTATIONS (COM) 0.36*
5.READING
COMPREHENSION (READ)
0.08
6.COMPARISON (COMPAR) 0.06
7.SPATIAL
VISUALISATION (V3D)
0.17
8.MECHANICAL
INSIGHT (MEC)
0.13
9. MEMORY (MEM) 0.02
*p<0.01
For all other correlations p>0.05
In the case of Mathematics the null hypothesis may be rejected for Test 3
(Nonverbal Reasoning) and Test 4 (Computations). Both show significant,
positive relationships with Mathematics achievement. However, the relationships
with Mathematics achievement seem to be low.
The correlations between the aptitude tests and Natural Sciences achievement are
provided in Table 5.8.

114
TABLE 5.8: CORRELATIONS BETWEEN APTITUDE AND NATURAL
SCIENCES ACHIEVEMENT
APTITUDE CORRELATION WITH ACHIEVEMENT
IN NATURAL SCIENCES
1.VOCABULARY (VOCAB) 0.23
2.VERBAL
REASONING (VERBAL)
0.26**
3.NONVERBAL
REASONING (NONV)
0.39*
4.COMPUTATIONS (COM) 0.32**
5.READING
COMPREHENSION (READ)
0.21
6.COMPARISON (COMPAR) 0.07
7.SPATIAL
VISUALISATION (V3D)
0.17
8.MECHANICAL
INSIGHT (MEC)
0.19
9. MEMORY (MEM) 0.19
*p<0.01
**p<0.05
For all other correlations p>0.05
In the case of Natural Sciences achievement the null hypothesis may be rejected
for Test 2 (Verbal Reasoning), Test 3 (Nonverbal Reasoning) and Test 4
(Computations). These tests show significant, positive relationships with Science
achievement. However, the correlations seem to be low. No other aptitude test
showed a significant relationship with achievement in this subject area.

115
The correlations between the aptitude tests and Economic and Management
Sciences (EMS) achievement are provided in Table 5.9.
TABLE 5.9: CORRELATIONS BETWEEN APTITUDE AND EMS
ACHIEVEMENT
APTITUDE CORRELATION WITH ACHIEVEMENT
IN EMS
1.VOCABULARY (VOCAB) 0.18
2.VERBAL
REASONING (VERBAL)
0.11
3.NONVERBAL
REASONING (NONV)
0.18
4.COMPUTATIONS (COM) 0.19
5.READING
COMPREHENSION (READ)
0.18
6.COMPARISON (COMPAR) 0.10
7.SPATIAL
VISUALISATION (V3D)
-0.00
8.MECHANICAL
INSIGHT (MEC)
-0.07
9. MEMORY (MEM) 0.08
For all correlations p>0.05
In the case of Economics and Management Sciences the null hypothesis can be
accepted as none of the aptitude subtests showed significant relationships with
achievement in this subject.
The correlations between the aptitude subtests and Human and Social Sciences
(HSS) achievement are provided below.

116
TABLE 5.10: CORRELATIONS BETWEEN APTITUDE AND HSS
ACHIEVEMENT
APTITUDE CORRELATION WITH ACHIEVEMENT
IN HSS
1.VOCABULARY (VOCAB) 0.32*
2.VERBAL
REASONING (VERBAL)
0.25*
3.NONVERBAL
REASONING (NONV)
0.26*
4.COMPUTATIONS (COM) 0.22
5.READING
COMPREHENSION (READ)
0.24
6.COMPARISON (COMPAR) 0.04
7.SPATIAL
VISUALISATION (V3D)
0.17
8.MECHANICAL
INSIGHT (MEC)
0.13
9. MEMORY (MEM) 0.16
*p<0.05
For all other correlations p>0.05
In the case of Human and Social Sciences the null hypothesis may be rejected for
Test 1 (Vocabulary), Test 2 (Verbal Reasoning) and Test 3 (Nonverbal
Reasoning). These tests show significant, positive relationships with achievement
in this subject. However, the correlations seem to be low.
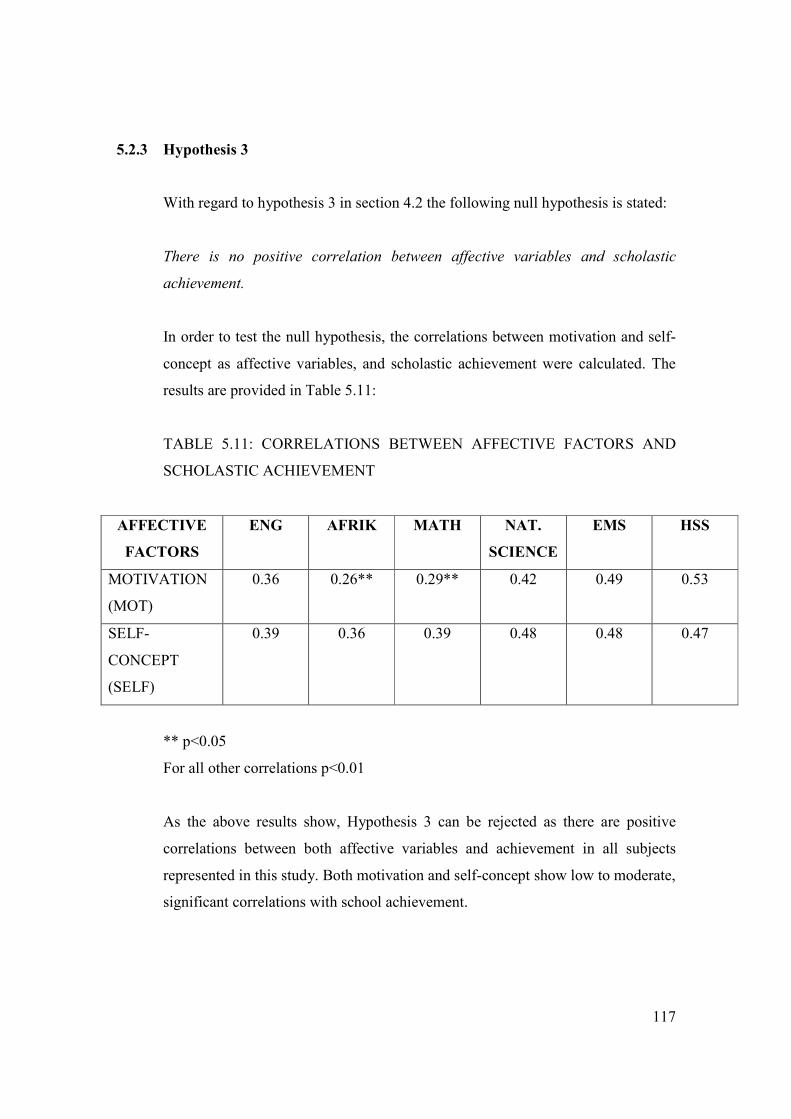
117
5.2.3 Hypothesis 3
With regard to hypothesis 3 in section 4.2 the following null hypothesis is stated:
There is no positive correlation between affective variables and scholastic
achievement.
In order to test the null hypothesis, the correlations between motivation and self-
concept as affective variables, and scholastic achievement were calculated. The
results are provided in Table 5.11:
TABLE 5.11: CORRELATIONS BETWEEN AFFECTIVE FACTORS AND
SCHOLASTIC ACHIEVEMENT
AFFECTIVE
FACTORS
ENG AFRIK MATH NAT.
SCIENCE
EMS HSS
MOTIVATION
(MOT)
0.36 0.26** 0.29** 0.42 0.49 0.53
SELF-
CONCEPT
(SELF)
0.39 0.36 0.39 0.48 0.48 0.47
** p<0.05
For all other correlations p<0.01
As the above results show, Hypothesis 3 can be rejected as there are positive
correlations between both affective variables and achievement in all subjects
represented in this study. Both motivation and self-concept show low to moderate,
significant correlations with school achievement.

118
5.2.4 Hypothesis 4
With regard to hypothesis 4 in section 4.2 the following null hypothesis is stated:
There is no positive correlation between study orientation and scholastic
achievement.
In order to test the null hypothesis, the correlations between study orientation and
scholastic achievement were calculated. The results are provided in Table 5.12:
TABLE 5.12: CORRELATIONS BETWEEN STUDY ORIENTATION AND
SCHOLASTIC ACHIEVEMENT
STUDY
ORIENTATION
ENG AFRIK MATH SCIENCE EMS HSS
DELAY
AVOIDANCE
(DELAY)
0.37* 0.28** 0.39* 0.41* 0.42* 0.52*
WORK METHODS
(WORK)
0.35* 0.15 0.27** 0.31** 0.36* 0.47*
STUDY HABITS
(STUDY)
0.38* 0.22 0.34* 0.37* 0.41* 0.53*
TEACHER
APPROVAL
(TAPPRO)
0.18 0.21 0.10 0.12 0.17 0.28**
EDUCATION
ACCEPTANCE
(EDACC)
0.34* 0.30** 0.34* 0.35* 0.40* 0.51*
STUDY
ATTITUDES (SATT)
0.26** 0.26** 0.22 0.24 0.29** 0.40*
STUDY
ORIENTATION
(SO)
0.35* 0.26** 0.30** 0.33* 0.37* 0.50*

119
*p<0.01
**p<0.05
For all other correlations p> 0.05
The above results show that the null hypothesis can be rejected as there are
positive correlations between study orientation and all subjects included in the
current study. Study Habits appear to be most important in the learning subjects of
EMS and HSS showing moderate positive correlations of 0.41 and 0.53. Study
Attitudes shows the highest correlation with HSS achievement. Teacher approval
does not correlate significantly with five of the six subjects. It only correlates
significantly in HSS achievement. Indeed, Study Orientation correlates higher
with achievement in the Human Sciences compared to achievement in the other
subject areas. All correlations between HSS and the different aspects of study
orientation appear to be moderate positive correlations, except for that with
Teacher Approval which is a low positive correlation. Afrikaans achievement
does not appear to relate strongly with study orientation as two aspects fail to
correlate significantly with achievement in this subject, namely Work Methods
and Teacher Approval. The variable, Study Habits, does not correlate
significantly with achievement in Afrikaans.
5.2.4.1 Explanation of the variance in scholastic achievement using aptitude variables
Overall the aptitude tests did not contribute greatly to the variance in scholastic
achievement, and did not explain any of the variance in achievement in Afrikaans,
and Economic and Management Sciences.
The lack of a contribution to the variance in Afrikaans is in contrast to the
findings of Verwey and Wolmarans (1980:54-55) where the ten Junior Aptitude
tests were found to account for between 5% and 30% of the variance in
achievement in Grade 9 Afrikaans as a second language. The aptitude test that
showed the highest correlation with Afrikaans achievement was the reasoning test

120
which measures general reasoning aptitude based on verbal and numerical
material (Verwey & Wolmarans 1980:7).
An explanation for the difference in predictive validity between the
abovementioned results of the JAT and the current findings of the DAT-S may be
that the way in which achievement is measured in education has changed from
measures based primarily on summative tests and examinations (which measure
primarily cognitive variables) to the Outcomes Based Education (OBE) system
where the learner is also assessed using creative and practical forms of
assessment, such as projects and real-life investigations. OBE assessment takes
place continually throughout the year, unlike tests and examinations in the
previous system which were held after a relatively long period of learning. The
kind of assessment in the OBE system may therefore reward the learner who is
creative, practical and motivated rather than one who has high intelligence, but is
not necessarily creative or practical, and who does not work consistently through
the year.
In the same test as that used in the current study, the DAT-S, Vosloo et al.
(2000:44) found that eight of the nine aptitude subtests explained between 23%
and 51% of the variance in achievement in a second language in Grade 7 (albeit in
English). The discrepancy between the amount of variance explained by that
study compared to the current investigation may be attributed to differences in
grade, language and assessment methods used.
None of the variance in achievement of the Economic and Management Sciences
(EMS) could be accounted for by the aptitude variables of the DAT-S. No
comparative information about achievement in EMS can be obtained from the
literature as this is a new subject introduced to the schools. The closest subject
included in the old syllabus would be Accounting but Accounting forms only a
part of the EMS syllabus. This fact together with the differences in assessing
achievement make it difficult to compare research results.

121
5.2.4.1.1 Explanation of the variance in first language (English) achievement
In the case of achievement in English as a first language, it appears that
Vocabulary knowledge contributes 10% to the variance. An additional 1% in
achievement which is not explained by vocabulary is accounted for by verbal
reasoning. In total 11% of the variance in English achievement could be
explained by aptitude factors. No other aptitude tests contributed to the
explanation of the variance. These results correspond with the findings of
Verwey and Wolmarans (1983:54-55) which show that the Reasoning and
Synonyms subtests of the JAT explain the greatest amount of variance in first
language achievement. The abovementioned tests of the JAT measure general
reasoning aptitudes as well as knowledge of words and their meanings,
aptitudes which are similar to those measured by the Vocabulary and Verbal
Reasoning tests of the DAT (Vosloo et al. 2000:4-5).
TABLE 5.13: EXPLANATION OF THE VARIANCE IN FIRST LANGUAGE
(ENGLISH) ACHIEVEMENT
Variable R2 *F df
Vocabulary (VOCAB) 0.10 6.74 (1.58)
Verbal Reasoning (VERBAL) 0.11 3.69 (2.57)
*In all cases p<0.05
The regression equation for first language achievement in English using
aptitude variables can be calculated as follows:
Y = 43.420 + 0.874 (VOCAB) + 0.359 (VERBAL)
5.2.4.1.2 Explanation of the variance in Mathematics achievement
With regard to Mathematics achievement, it appears that Computations
contributes 13% to the variance and nonverbal reasoning explains a further
2% which is not explained by Computations. A total of 15% of the variance in

122
Mathematics achievement was accounted for by aptitude variables. No other
aptitude tests contributed to the explanation of variance. The importance of a
test measuring arithmetic aptitude in order to explain the variance in
Mathematics achievement is supported by the studies carried out by Kelly
(1999:104) and by Verwey and Wolmarans (1983:54-55). In these two
studies, tests of arithmetic aptitude explain between 8% and 42% of the
variance in Mathematics achievement. The current finding is supported also
by the study of Vosloo et al. (2000:44) where the Computations aptitude test
has the highest correlation with Mathematics achievement in Grade 7.
TABLE 5.14: EXPLANATION OF THE VARIANCE IN MATHEMATICS
ACHIEVEMENT
Variable R2 *F df
Computations (COM) 0.13 8.82 (1.58)
Nonverbal Reasoning (NONV) 0.15 5.05 (2.57)
*In all cases p<0.05
The regression equation for Mathematics achievement can be calculated as
follows:
Y = 33.662 + 0.935 (NONV) + 0.973 (COM)
5.2.4.1.3 Explanation of the variance in Natural Sciences (NS) achievement
Variance in achievement in Natural Sciences is accounted for by nonverbal
reasoning aptitude only. This subtest explains 15% of the variance. No other
aptitude variable contributes to the explanation of the variance in NS
achievement. The importance of reasoning aptitudes is supported by Verwey
and Wolmarans (1983:54-55) whose research reveals that general reasoning
aptitudes explain between 20% and 21% of the variance in Science
achievement. The current finding is supported also by the study of Vosloo et
al. (2000:44), which identifies nonverbal reasoning aptitudes as important in
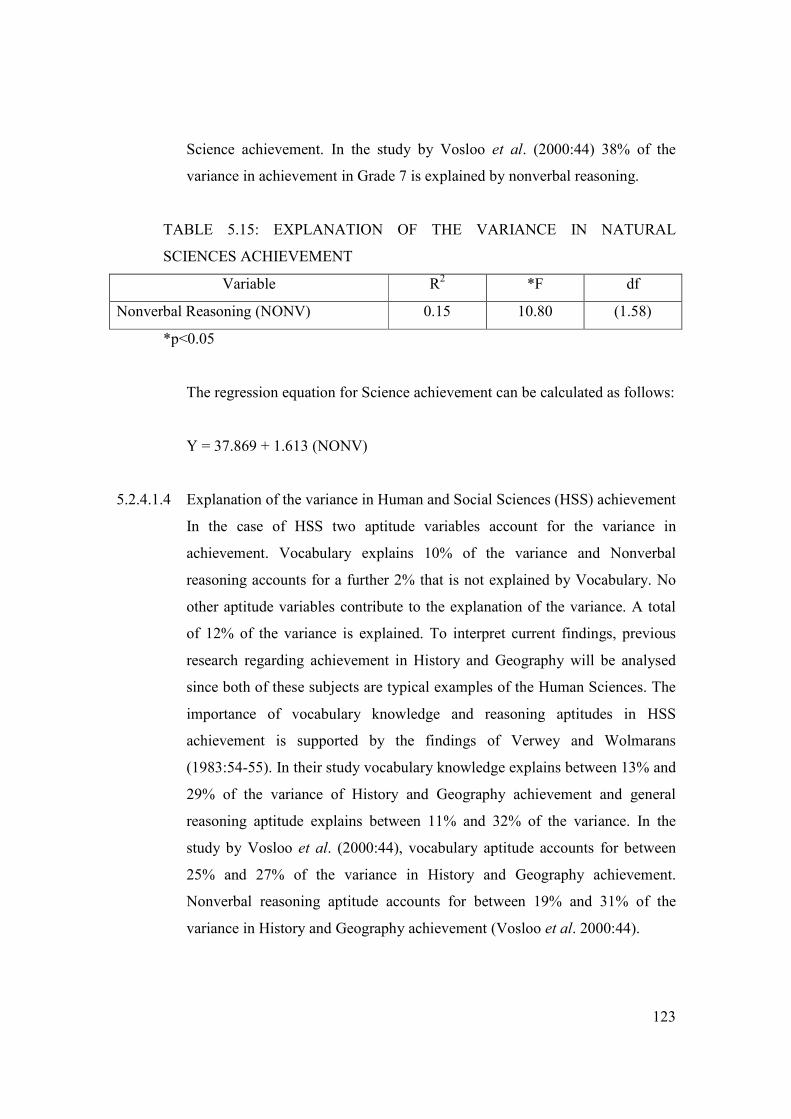
123
Science achievement. In the study by Vosloo et al. (2000:44) 38% of the
variance in achievement in Grade 7 is explained by nonverbal reasoning.
TABLE 5.15: EXPLANATION OF THE VARIANCE IN NATURAL
SCIENCES ACHIEVEMENT
Variable R2 *F df
Nonverbal Reasoning (NONV) 0.15 10.80 (1.58)
*p<0.05
The regression equation for Science achievement can be calculated as follows:
Y = 37.869 + 1.613 (NONV)
5.2.4.1.4 Explanation of the variance in Human and Social Sciences (HSS) achievement
In the case of HSS two aptitude variables account for the variance in
achievement. Vocabulary explains 10% of the variance and Nonverbal
reasoning accounts for a further 2% that is not explained by Vocabulary. No
other aptitude variables contribute to the explanation of the variance. A total
of 12% of the variance is explained. To interpret current findings, previous
research regarding achievement in History and Geography will be analysed
since both of these subjects are typical examples of the Human Sciences. The
importance of vocabulary knowledge and reasoning aptitudes in HSS
achievement is supported by the findings of Verwey and Wolmarans
(1983:54-55). In their study vocabulary knowledge explains between 13% and
29% of the variance of History and Geography achievement and general
reasoning aptitude explains between 11% and 32% of the variance. In the
study by Vosloo et al. (2000:44), vocabulary aptitude accounts for between
25% and 27% of the variance in History and Geography achievement.
Nonverbal reasoning aptitude accounts for between 19% and 31% of the
variance in History and Geography achievement (Vosloo et al. 2000:44).
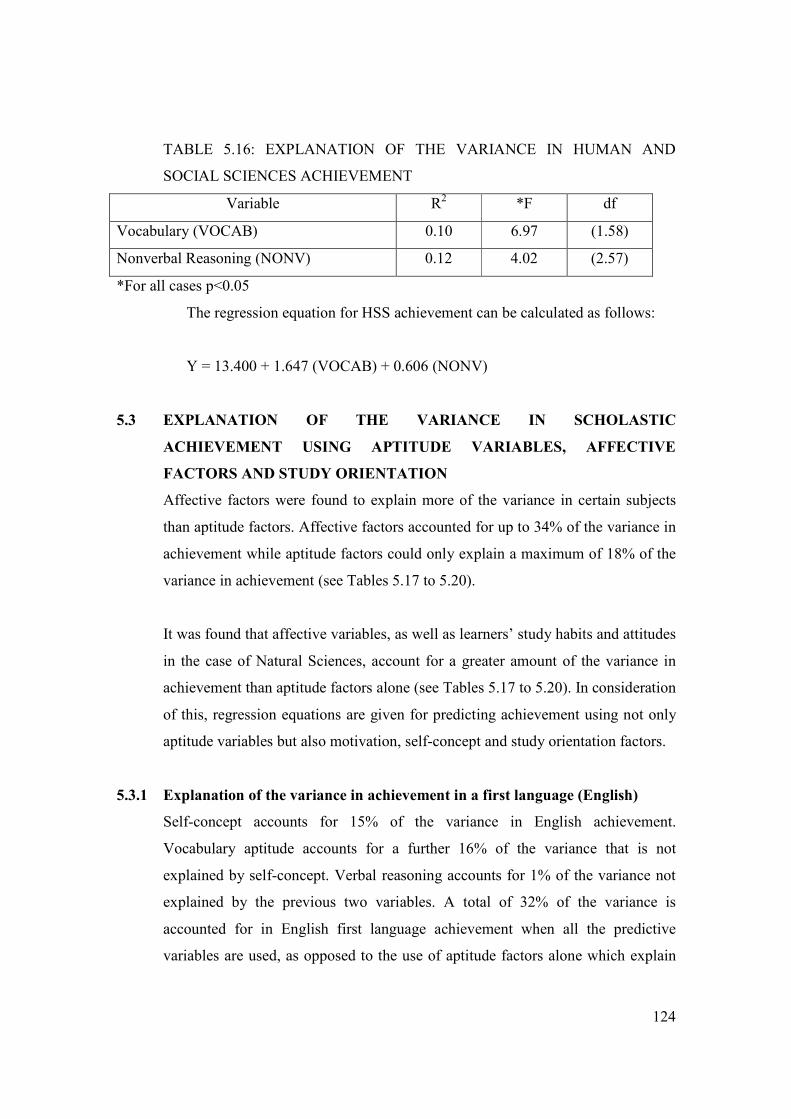
124
TABLE 5.16: EXPLANATION OF THE VARIANCE IN HUMAN AND
SOCIAL SCIENCES ACHIEVEMENT
Variable R2 *F df
Vocabulary (VOCAB) 0.10 6.97 (1.58)
Nonverbal Reasoning (NONV) 0.12 4.02 (2.57)
*For all cases p<0.05
The regression equation for HSS achievement can be calculated as follows:
Y = 13.400 + 1.647 (VOCAB) + 0.606 (NONV)
5.3 EXPLANATION OF THE VARIANCE IN SCHOLASTIC
ACHIEVEMENT USING APTITUDE VARIABLES, AFFECTIVE
FACTORS AND STUDY ORIENTATION
Affective factors were found to explain more of the variance in certain subjects
than aptitude factors. Affective factors accounted for up to 34% of the variance in
achievement while aptitude factors could only explain a maximum of 18% of the
variance in achievement (see Tables 5.17 to 5.20).
It was found that affective variables, as well as learners’ study habits and attitudes
in the case of Natural Sciences, account for a greater amount of the variance in
achievement than aptitude factors alone (see Tables 5.17 to 5.20). In consideration
of this, regression equations are given for predicting achievement using not only
aptitude variables but also motivation, self-concept and study orientation factors.
5.3.1 Explanation of the variance in achievement in a first language (English)
Self-concept accounts for 15% of the variance in English achievement.
Vocabulary aptitude accounts for a further 16% of the variance that is not
explained by self-concept. Verbal reasoning accounts for 1% of the variance not
explained by the previous two variables. A total of 32% of the variance is
accounted for in English first language achievement when all the predictive
variables are used, as opposed to the use of aptitude factors alone which explain

125
only 11% of the variance (section 5.2.5.1.1). Correlations between English self-
concept and English achievement were found by Koutsoulis and Campbell
(2001:108-127) to be between 0.39 and 0.42 explaining between 15% and 17% of
the variance. This finding supports the results obtained in the current study.
TABLE 5.17: EXPLANATION OF THE VARIANCE IN FIRST
LANGUAGE ACHIEVEMENT (ENGLISH)
Variable R2 *F df
Self-concept (SELF) 0.15 10.92 (1.58)
Vocabulary (VOCAB) 0.31 13.30 (2.57)
Verbal Reasoning (VERBAL) 0.32 9.17 (3.56)
*In all cases p<0.05
The regression equation for first language achievement in English can be
calculated as follows:
Y = 10.871 + 1.156 (VOCAB) + 0.372 (VERBAL) + 0.462 (SELF)
5.3.2 Explanation of the variance in Mathematics achievement
Four variables contribute significantly to the variance in Mathematics
achievement. Both nonverbal reasoning and self-concept variables account for
15% of the variance. Computations accounts for a further 1% of the variance not
explained by the first two variables. Motivation factors explain a further 1% of the
variance. A total of 32% of the variance in Mathematics achievement is
explained. These factors explain more of the variance than aptitude variables
alone which account for only 15% of the variance (section 5.2.5.1.2).
The correlations between self-concept and Mathematics reported in the literature
lie between 0.33 and 0.58 (Koutsoulis & Campbell 2001:108-127) explaining
10% to 33% of the variance in Mathematics achievement. The correlation

126
between self-concept and Mathematics achievement obtained in the current study
is therefore in agreement with the abovementioned research.
TABLE 5.18: EXPLANATION OF THE VARIANCE IN MATHEMATICS
ACHIEVEMENT
Variable R2 *F df
Self-concept (SELF) 0.15 10.82 (1.58)
Nonverbal Reasoning (NONV) 0.30 12.24 (2.57)
Computations (COM) 0.31 8.60 (3.56)
Motivation (MOT) 0.32 6.66 (4.55)
* In all cases p<0.05
The regression equation for Mathematics can be calculated as follows:
Y = –11.516 + 1.140 (NONV) + 0.846 (COM) – 0.318 (MOT) +1.134 (SELF)
5.3.3 Explanation of the variance in Natural Sciences achievement
The use of affective factors and study orientation variables greatly increase the
explanation of the variance in Natural Sciences. Self-concept contributes 23% the
explanation of the variance in Natural Sciences achievement and nonverbal
reasoning accounts for a further 18%. Study orientation explains a further 2% of
the variance that is not accounted for by the first two variables. Natural Sciences
is the only subject where study orientation contributed significantly to
achievement. A total of 43% of the variance in achievement in Natural Sciences is
explained by the variables used. This combination of factors accounts for more
than the 15% variance explained by aptitude factors alone (section 5.2.5.1.3).
The correlation of 0.48 between self-concept and Science achievement in the
current study is higher than those correlations found between the variables in the
literature of between 0.21 and 0.27 (Hansford & Hattie 1982:123-142; Coover &
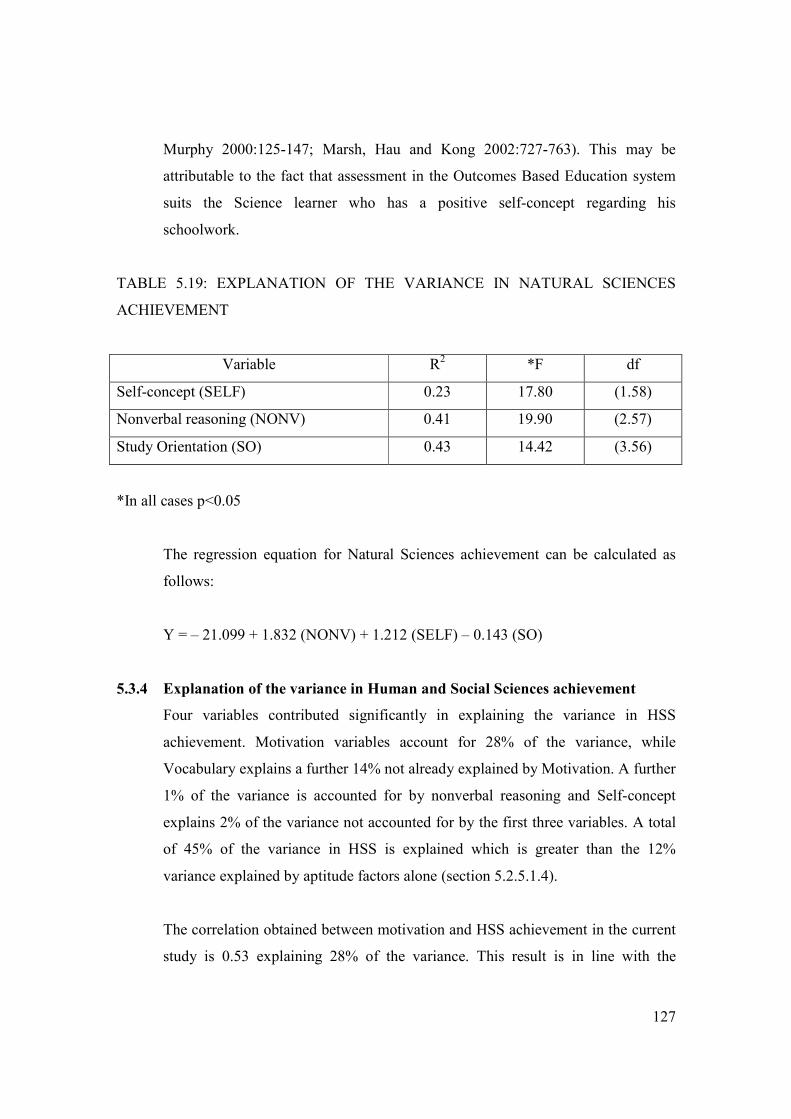
127
Murphy 2000:125-147; Marsh, Hau and Kong 2002:727-763). This may be
attributable to the fact that assessment in the Outcomes Based Education system
suits the Science learner who has a positive self-concept regarding his
schoolwork.
TABLE 5.19: EXPLANATION OF THE VARIANCE IN NATURAL SCIENCES
ACHIEVEMENT
Variable R2 *F df
Self-concept (SELF) 0.23 17.80 (1.58)
Nonverbal reasoning (NONV) 0.41 19.90 (2.57)
Study Orientation (SO) 0.43 14.42 (3.56)
*In all cases p<0.05
The regression equation for Natural Sciences achievement can be calculated as
follows:
Y = – 21.099 + 1.832 (NONV) + 1.212 (SELF) – 0.143 (SO)
5.3.4 Explanation of the variance in Human and Social Sciences achievement
Four variables contributed significantly in explaining the variance in HSS
achievement. Motivation variables account for 28% of the variance, while
Vocabulary explains a further 14% not already explained by Motivation. A further
1% of the variance is accounted for by nonverbal reasoning and Self-concept
explains 2% of the variance not accounted for by the first three variables. A total
of 45% of the variance in HSS is explained which is greater than the 12%
variance explained by aptitude factors alone (section 5.2.5.1.4).
The correlation obtained between motivation and HSS achievement in the current
study is 0.53 explaining 28% of the variance. This result is in line with the

128
findings of Leondari and Gialamas (2002:279-291) who identified a correlation of
0.52 between the motivational variable of self-efficacy and achievement.
Motivation, in the last mentioned study, explains 27% of the variance in HSS
achievement.
The correlation between self-concept and HSS achievement in the current study is
0.47. This correlation is higher than the correlations found between self-concept
and scholastic achievement in the literature (from 0.21 to 0.27). This may be
attributable to the fact that assessment in the OBE system suits the learner who
has a positive self-concept regarding his schoolwork.
TABLE 5.20: EXPLANATION OF THE VARIANCE IN HUMAN AND SOCIAL
SCIENCES ACHIEVEMENT
Variable R2 *F Df
Motivation (MOT) 0.28 23.48 (1.58)
Vocabulary (VOCAB) 0.42 21.02 (2.57)
Nonverbal Reasoning (NONV) 0.43 14.62 (3.56)
Self-concept (SELF) 0.45 11.35 (4.55)
*In all cases p<0.05
The regression equation for Human and Social Sciences achievement can be
calculated as follows:
Y = –51.755 + 2.11 (VOCAB) + 0.548 (NONV) + 0.541 (MOT) + 0.393 (SELF)

129
5.4 CONCLUSIONS
In chapter 1 (section 1.2) three questions were stated which comprised the formal
problem statement of the study. After the completion of the empirical
investigation these questions can be answered as follows:
1. How can individual tests or different combinations of the DAT-S tests be used
to obtain a general intelligence score?
A statistical analysis of the relationships between the aptitude tests and the
intelligence test scores was carried out. The correlations between most of the
aptitude tests and the different scales of the Senior South African Individual
Scale – Revised (SSAIS-R) were found to be moderate to high positive
correlations. These correlations were used to develop regression equations
using the aptitude tests as predictive variables and intelligence as the
dependent variable. Age is negatively related to intelligence, that is, the older
the learner in Grade 9, the lower the level of intelligence tends to be.
The following aptitude tests are important in predicting verbal intelligence:
• Vocabulary
• Verbal reasoning
• Mechanical Insight
The regression equation for verbal intelligence using the aptitude tests can be
calculated as follows:
Y = 153.121 + 1.822 (VOCAB) + 0.822 (VERBAL) + 0.992 (MEC) - 0.719
(AGEM)
When a rough prediction of verbal intelligence is required, the values may be
rounded off. The above equation may then read:
Y = 153 + 2 (VOCAB) + (VERBAL) + (MEC) – (AGEM)

130
The following aptitude tests are important in predicting nonverbal
intelligence:
• Computations
• Reading Comprehension
• Spatial Visualisation 3D
• Mechanical Insight
The regression equation for nonverbal intelligence using the aptitude tests can
be calculated as follows:
Y = 120.411 + 0.326 (COM) + 0.49 (READ) + 1.463 (V3D) + 0.507 (MEC) –
0.371 (AGEM)
When a rough prediction of nonverbal intelligence is required, the values
may be rounded off. The above equation may then read:
Y = 120 + 0.5 (COM) + 0.5 (READ) + 1.5 (V3D) + 0.5 (MEC) – 0.5
(AGEM)
Seven aptitude tests predict general intelligence:
• Vocabulary
• Verbal Reasoning
• Computations
• Reading comprehension
• Spatial Visualisation 3D
• Mechanical Reasoning
The regression equation for general intelligence using the aptitude tests can be
calculated as follows:
Y = 136.758 + 0.934 (VOCAB) + 0.525 (VERBAL) + 0.244 (COM) + 0.494
(READ) + 0.746 (V3D) + 0.896 (MEC) – 0.268 (MEM) – 0.579 (AGEM)
When a rough prediction of general intelligence is required, the values may
be rounded off. The above equation may then read:

131
Y = 136 + VOCAB + 0.5 (VERBAL) + 0.5 (COM) + 0.5 (READ) + V3D +
MEC – 0.5 (MEM) – 0.5 (AGEM)
2. How can the aptitude tests be used to predict achievement in the major subject
areas?
Statistical analyses of the relationships between the aptitude tests and the main
subjects in Grade 9 were carried out.
Two aptitude tests have significant correlations (at the 0.05% level) with
achievement in a first language (English):
• Vocabulary (0.32)
• Verbal Reasoning (0.26)
The regression equation for first language achievement in English using
aptitude variables is:
Y = 43.420 + 0.874 (VOCAB) + 0.359 (VERBAL)
When a rough prediction of first language achievement in English is required,
the values may be rounded off. The above equation may then read:
Y = 43 + VOCAB + 0.5 (VERBAL)
Two aptitude tests have significant correlations (at the 0.01 level) with
Mathematics achievement. They are:
• Computations (0.36)
• Nonverbal Reasoning (0.35)
The regression equation for Mathematics achievement is:
Y = 33.662 + 0.935 (NONV) + 0.973 (COM)
132
When a rough prediction of Mathematics achievement is required, the values
may be rounded off. The above equation may then read:
Y = 33 + NONV + COM
Three aptitude tests showed significant correlations with achievement in
Natural Sciences. They were:
• Verbal Reasoning (0.26, p<0.05)
• Nonverbal Reasoning (0.39, p<0.01)
• Computations (0.32, p<0.05)
Only the Nonverbal Reasoning test shows sufficient predictive power to be
used in the regression equation. The regression equation for Natural Sciences
achievement is:
Y = 37.869 + 1.613 (NONV)
When a rough prediction of Science achievement is required, the values may
be rounded off. The above equation may then read:
Y = 37 + 1.5 (NONV)
Three aptitude tests show significant correlations (at the 0.05 level) with
Human and Social Sciences. They are:
• Vocabulary (0.32)
• Verbal Reasoning (0.25)
• Nonverbal Reasoning (0.26)
Only the Vocabulary and Nonverbal reasoning tests have enough predictive
power to be used in the regression equation. The regression equation for HSS
achievement is:
Y = 13.400 + 1.647 (VOCAB) + 0.606 (NONV)
133
When a rough prediction of HSS achievement is required, the values may be
rounded off. The above equation may then read:
Y = 13 + 1.5 (VOCAB) + 0.5 (NONV)
No aptitude test correlates significantly with achievement in Afrikaans as a
second language or with Economic and Management Sciences. Therefore, no
regression equation could be developed for achievement in these subjects.
3. How can the aptitude tests in combination with other variables, such as self-
concept, motivation and study orientation predict achievement?
Correlations between the aptitude tests, affective factors, study orientation and
achievement in the major subjects in Grade 9 were calculated. Motivation,
Self-concept, as well as Study Orientation show low to moderate significant
correlations with scholastic achievement. Statistical analyses were carried out
using the affective variables and Study Orientation as predictive variables and
scholastic achievement in the different subjects as dependent variables. Only
those variables with sufficient predictive power are included in the regression
equations. The regression equations using the predictive variables are:
First language achievement in English:
Y = 10.871 + 1.156 (VOCAB) + 0.372 (VERBAL) + 0.462 (SELF)
When a rough prediction of first language achievement in English is required,
the values may be rounded off. The above equation may then read:
Y = 10 + VOCAB + 0.5 (VERBAL) + 0.5 (SELF)
Mathematics:

134
Y = –11.516 + 1.140 (NONV) + 0.846 (COM) – 0.318 (MOT) +1.134 (SELF)
When a rough prediction of Mathematics achievement is required, the values
may be rounded off. The above equation may then read:
Y = 11 + NONV + COM – 0.5 (MOT) + SELF
Natural Sciences:
Y = – 21.099 + 1.832 (NONV) + 1.212 (SELF) – 0.143 (SO)
When a rough prediction of Natural Sciences achievement is required, the
values may be rounded off. The above equation may then read:
Y = –21 + 2 (NONV) + SELF – 0.1 (SO)
Human and Social Sciences:
Y = –51.755 + 2.11 (VOCAB) + 0.548 (NONV) + 0.541 (MOT) + 0.393
(SELF)
When a rough prediction of Human and Social Sciences achievement is
required, the values may be rounded off. The above equation may then read:
Y = –51 + 2 (VOCAB) + 0.5 (NONV) + 0.5 (MOT) + 0.5 (SELF)

135
CHAPTER 6
EDUCATIONAL IMPLICATIONS AND RECOMMENDATIONS
6.1 INTRODUCTION
The purpose of the investigation was to determine in what way aptitude, as
measured by the Differential Aptitude Test Form S, could be used to predict
intelligence and scholastic achievement in Grade 9. The prediction value of
aptitude in combination with other variables such as motivation, self-concept and
study orientation was also investigated.
In the light of the abovementioned aim a literature study was carried out to:
• Analyse the constructs, intelligence and aptitude.
• Establish the relationship between intelligence, aptitude and scholastic
achievement.
• Analyse the constructs motivation, self-concept and study orientation and to
determine to what extent they relate to scholastic achievement in combination
with aptitude scores.
An empirical investigation was carried out in order to test hypotheses regarding
the:
• Relationship between general intelligence and aptitude.
• Use of aptitude measures to predict intelligence.
• Prediction of scholastic achievement by combining aptitude scores with
affective factors and study orientation.

136
Reliable instruments were used to measure the different variables. The scores
were used to determine how the variables correlate with one another. The scores
were also used to obtain regression equations to predict intelligence as well as
scholastic achievement in Grade 9 subjects.
The findings indicated that the aptitude subtests predict a significant proportion of
intelligence. However, many of the aptitude subtests do not predict a significant
proportion of scholastic achievement in Grade 9. It was found that motivation and
especially self-concept scores, accounted for more of the variance in most
subjects compared to aptitude scores alone.
The implications of these results will be discussed under the following headings:
• Subject choice
• Learning problems and poor performance
• Differentiation of the difficulty level of schoolwork
• Emotional and behavioural problems
In the discussion of the implications, recommendations will be made for parents,
the class teacher, the life orientation teacher and the educational psychologist.
6.2 RECOMMENDATIONS
6.2.1 Subject choice
One of the most important reasons for administering an aptitude test in
Grade 9 is to determine which subjects should be chosen for Grade 10 to
Grade 12. Since the DAT does not explain a great deal of the variance in
scholastic performance (section 5.2.4.1) it is recommended that the
educational psychologist will not use the DAT on its own, but rather in
conjunction with motivation, self-concept and study orientation measures
(Vosloo et al. 2000:2). It is further advised that other tests, for example

137
achievement tests, be added to the assessment process to determine which
subjects the learner should study in Grade 10.
6.2.2 Learning problems and poor performance
6.2.2.1 Identification of the presence of learning problems
It was stated in Chapter 1 (section1.1) that the presence of learning
problems is often inferred when there is a discrepancy between a
learners’ general intelligence level and their scholastic achievement.
The DAT can be administered to obtain an estimated level of
intelligence which can then be compared to the learner’s school
performance. If the learner’s level of school achievement is below
what would be expected of the learner considering his level of
intelligence, this could be a warning of the presence of learning
problems and would indicate the need for further testing and
exploration. Interventions to assist the learner, for example with
remedial help can then be planned.
6.2.2.2 Diagnosis and remediation of learning problems
The DAT, together with the motivation and self-concept questionnaire
as well as the study orientation questionnaire, can be used as
diagnostic tests to identify the presence of learning problems. The
current study indicates that poor scholastic performance can be
attributed to a low aptitude for the subject, an unsatisfactory scholastic
self-concept, lack of motivation or inadequate study orientation
regarding schoolwork.
When all the variables were analysed, self-concept and motivation
factors were found to relate more strongly than aptitude variables to
achievement in Natural Sciences and Human and Social Sciences. In
other subjects, self-concept, motivation and study orientation were
significantly related to achievement. If a learner is not progressing

138
satisfactorily he can be assessed using the DAT, the self-concept and
motivation questionnaire as well as the study orientation questionnaire.
While little can be done to improve intelligence or aptitude, parents,
teachers and psychologists can contribute to the improvement of a
learner’s self-concept, motivation and study orientation.
Self-concept appears to be strongly related to achievement in Natural
Sciences achievement. Both self-concept and aptitude show equally
strong relationships with Mathematics achievement. Self-concept
shows a slightly weaker relationship with English first language
achievement compared to aptitude, and is significantly related to
Human and Social Sciences achievement. If a learner is not
performing well in these subjects his or her self-concept scores could
be affected.
If the learner’s self-concept is poor, it can be improved through
intervention by parents, the class teacher, the life orientation teacher
and the educational psychologist. The following guidelines for
improving the learner’s self-concept are provided based on
information obtained in the literature study.
• Since high achievement raises the academic self-concept (Schmidt
& Padilla 2003:37-46) and intervention at the lowest (behavioural)
level of the self-concept hierarchy is most effective (Marsh &
Shavelson 1985:107-123), teachers should make sure that the
everyday activities in the classroom are geared to provide
opportunities for success. Learners who perceive themselves as
being able, for example to correctly observe and note down the
results of an experiment, is likely to develop a positive science
self-concept.

139
• Learners form their self-concepts by comparing their performance
with the performances of others (Marsh & Yeung 2001:389-420).
In the classroom, learners who perform poorly can be paired with
weaker or younger learners so that they have opportunities to
perceive their achievement in a more positive way. This may lead
to an improved academic self-concept. A high academic self-
concept, in turn leads to increased achievement (Marsh 1990:646-
656).
Motivation appears more strongly related to Human and Social Sciences
achievement than aptitude. It is significantly related to Mathematics
achievement. The following suggestions based on the literature study are
provided to improve a learner’s motivation regarding his or her school
work.
• While intrinsic motivation is the best type of motivation, external
reinforcement of behaviour should not be discounted. Motivation
in the classroom can be improved through positively reinforcing
effort and progress made by the learner. Positive reinforcement can
take the form of praise by the teacher. Other means of recognition
such as the allocation of marks can also be used.
• Teachers need to remember that what motivates one learner may
not motivate another. They therefore need to know their learners
well in order to motivate them effectively. Contact with parents in
this regard is helpful.
• Parents, as well as the class teacher, life orientation teacher and
educational psychologist can help the learner to set attainable
achievement goals. Learners who are able to meet their academic
goals will be more motivated to undertake future tasks and
persevere until they attain success.

140
• According to Abraham Maslow’s hierarchy of needs, learners must
have their lower needs satisfied, for example for food and safety,
before they can satisfy their need to know and understand the
environment (Woolfolk 1995:341). Parents should, therefore make
sure that their children eat before they go to school, and teachers
must create a classroom atmosphere in which pupils feel safe.
• Deci and Ryan (Bester 1998:28) as well as Ramseier (2001:421-
439) state that learners are more motivated if they have a feeling of
control over the learning process. Teachers can, therefore give
learners choices. For example, they can assign a project but give
different options regarding the content and method of presentation.
• The life orientation teacher and the educational psychologist need
to determine a learner’s attributions regarding his schoolwork. A
learner who attributes his performance in a test to luck, may not
have a high expectation of future success. The anticipation of
probable failure may result in a decrease in motivation, because the
learner may think that there is little to be gained by trying. If the
learner attributes his good mark to effort, he may have higher
levels of motivation and feel that he can achieve success if he tries
hard enough (Eccles & Wigfield 1995:215-225).
• The life orientation teacher and the educational psychologist need
to help the learner identify motivational goals for school
achievement. The learner who is focused on mastering his school
work (mastery goals) or who wants to perform better than others
(performance goals) is more likely to achieve well (Tanaka &
Yamauchi 2001:123-135; Bouffard, Boileau & Vezeau 2001:589-
604). A learner may have avoidance goals and avoid or neglect

141
academic tasks. The learner with avoidance goals often does the
minimum amount of work in class, rarely attempts or completes
homework, and usually fails tests with very low marks. The learner
who has avoidance goals needs to formulate mastery and
performance goals. Mastery goals can be encouraged by teachers,
through, for example the clear description of requirements and
standard of work expected. Performance goals can be established
by encouraging competition between learners.
• Children whose parents bring them up to value education as a goal
in itself, are more motivated to achieve scholastically (Elliot,
Hufton, Illushin and Lauchlan 2001:38-68; Schultz 1997:193-102).
Therefore, in homes where there is an emphasis on being well-
educated and well-informed, learners are more likely to identify
with the goals of the school.
Study orientation significantly relates with achievement in Natural
Sciences. The current study showed that the following specific study
habits and attitudes which form part of the learner’s study orientation, are
related to Natural Sciences achievement:
• ability to complete tasks timeously
• application of appropriate work methods
• acceptance of the goals of education
The Natural Sciences teacher should emphasise the importance of
completing work timeously, for example to instruct learners to complete a
task on the day it is assigned, and not to wait until the day before it is due.
Parents can play an important role in this regard by monitoring the
completion of homework, and limiting television viewing time which has
been shown to be detrimental to academic achievement (Suh & Suh

142
2006:11-20). The Natural Sciences teacher should inform learners of
specific study methods appropriate for learning the Natural Sciences, for
example summarising information using keywords.
The following additional guidelines based on information in the literature
study can help learners to achieve at school.
• All subject teachers have a responsibility to educate learners about
the most effective study techniques for their subjects. For example,
Mathematics is not primarily a learning subject, but one in which
the application of methods and rules must be practised. Teachers
need to inform learners of this and explain or model how to master
the work.
• Teaching students how to identify and underline important
information, take notes, make summaries and use visual diagrams
should be done by subject teachers, life orientation teachers and
educational psychologists. The use of the above study techniques
helps learners to attach meaning to the content, actively decide
what information is important and to structure information in their
long-term memory (Eggen & Kauchak 1994:385-386).
• Comprehensive strategies which combine different study
techniques into a multi-step approach make learning easier. The
life orientation teacher can show learners how to use, for example
the SQ4R method (Survey, Question, Read, Reflect, Recite,
Review) to master their school work (Eggen & Kauchak
1994:387).
• Learners who are aware of a variety of study techniques and
methods are able to choose those that best fit their needs.
143
• Parents can help their children to achieve by ensuring that they
study consistently throughout the year and do not merely cram
before tests and exams. Encouraging children to study not only
during the week, but also on weekends and in the evenings raises
academic achievement (Rau & Durand 2000:19-38).
• Regular completion of homework is an important requirement at
school (Cooper, Lindsay, Nye & Greathouse 1998:70-83). Parents
and teachers, therefore need to constantly check that homework
has been correctly done.
6.2.3 Differentiation of the difficulty level of schoolwork
It was stated in Chapter 1 (section 1.1) that determination of a learner’s
general intelligence score is important when differentiation of schoolwork
in the mainstream classroom is considered. The DAT can be used to
obtain a general intelligence score so that it can be decided whether, for
example a learner needs enrichment activities to stimulate a gifted
intellect, or whether the learner could benefit from a slow pace and extra
practice when new concepts are introduced.
6.2.4 Emotional and behavioural problems
Emotional or behavioural problems often develop as a result of difficulties
with schoolwork and require the combined efforts of parents, the class
teacher and the educational psychologist. Signs that indicate that a learner
is experiencing serious difficulty in coping emotionally may manifest in
several ways. The learner may show overt anger towards the teacher, peers
and towards the school in general. Depression and anxiety can also result
if learners cannot succeed with their schoolwork. The strong relationship
between affective factors and school achievement has been highlighted in
the current study.

144
In this section the focus will be on emotional and behavioural problems
with specific reference to the self-concept and motivational factors.
The aggressive learner may feel that he is never going to succeed. He may
perceive his continual failure as a threat to his self-concept and his sense
of capability. In response the learner may react with aggression towards
people who are connected with the school. The learner may talk back to
the teacher, neglect his school books, be aggressive towards his peers or
damage school property.
Bester (2003:256) states that the social relationship between the teacher
and the learner is important in the formation of the affective aspects of a
learner. The teacher therefore, needs to cultivate a warm and supportive
relationship with the aggressive learner so that he feels that someone
believes in his ability to succeed, and that he is not alone in his difficulties.
The educational psychologist plays an important role in helping the
aggressive learner. Person-centred therapy can be used to establish an
empathic relationship between the psychologist and the learner. Here, the
learner experiences a safe space in order to identify and work through his
feelings of, for example hurt and inadequacy. Later, action therapies, for
example Reality Therapy, aimed at helping the learner to work
constructively towards his academic goals, can be used.
A depressed learner often has a negative academic self-concept and lacks
motivation for schoolwork. He may feel that he is “useless at schoolwork”
and that trying for future success at school is “hopeless”. The educational
psychologist can assist the learner by providing therapy aimed at
improving his academic self-concept and motivation for schoolwork.
Cognitive Behavioural Therapy and Reality Therapy may be particularly

145
helpful. Therapeutic techniques developed by Beck (Corey 2005:289)
such as challenging the tendency of the depressed learner to focus on his
academic inadequacies, disputing the learner’s negative interpretations of
scholastic events and his feelings of helplessness, would be helpful.
Glasser’s Reality Therapy can be used to help the learner through
application of the WDEP system (Corey 2005:325-328). This approach
helps the learner to:
• Become conscious of his wants and needs regarding school
achievement
• Become aware of what he is currently doing regarding his
schoolwork
• Evaluate whether his actions are bringing him closer to what he
wants regarding achievement
• Take action to attain what he wants to achieve academically
Anxious learners may have a poor self-concept due to unrealistic
expectations of their abilities, often believing that they have to improve
their performance no matter how well they achieve. They may become so
anxious that they are unable to complete tasks or perform in test situations.
Setting realistically obtainable goals is necessary to avoid the development
of a low self-concept and lack of motivation for schoolwork (Bester
1998:3). Therapy, such as Cognitive Behavioural Therapy, aimed at
identifying unrealistic expectations and bringing those expectations in line
with current and previous achievement at school, may be carried out by
the educational psychologist. Use of Rational Emotive Behaviour
Therapy (REBT) developed by Albert Ellis (Corey 2005:271-272), may
help the anxious learner to deal with situations in more positive and less
anxiety-provoking ways. In REBT the following components need to be
identified, and ways in which these components interact should be
understood by the learner:
146
• A – Activating event (event that arouses anxiety, for example a
test)
• B – Belief (beliefs related to the activating event, such as “I will be
disgraced if I do not get at least 80%”)
• C – Emotional and Behavioural consequence (experience of panic
and “freezing up” in the test situation)
• D – Disputing intervention (“it is not a disgrace to get less than
80% on a test”, “I am worthy of respect even if I get less than
80%”)
• E – Effect (healthy thoughts, such as “I will do my best in this
test”, “I will not expect more of myself than what I can realistically
do”)
• F – New Feeling (instead of feeling overwhelmingly anxious, the
learner feels a healthy tension associated with taking a test)
6.3 EVALUATION OF THE INVESTIGATION
The current study has made contributions to the literature regarding the uses of
the Differential Aptitude Test, as well as the influence of various factors on
school achievement in Grade 9.
1) In the past aptitude tests have been used not only to obtain information
about aptitudes, but also to estimate a learner’s level of general
intelligence. In Chapter 1 (section 1.1) it was stated the relationship
between the DAT (as an aptitude test) and general intelligence had not
been established in previous studies. The current study has filled this gap
and the relationship between the general intelligence and aptitude has been
determined. In addition, the relationship between aptitudes as measured by
the DAT, and achievement in Grade 9 had not been determined. The
current study has identified and described these relationships.

147
2) In Chapter 2 it was stated that aptitude and intelligence were closely
related to each other. The current study supports that assertion because the
Differential Aptitude Test and the Senior South African Individual Scale –
Revised correlate very highly with each other. As a result of this study it is
clear that the DAT measures both specific aptitudes and general
intelligence. Furthermore, the high correlations between the DAT and the
SSAIS-R established in this study make it possible to predict intelligence
from the DAT scores through the use of regression analyses. This makes
the DAT a more useful and time-effective test to use.
3) In Chapter 1 (section 1.1) it was stated that both cognitive and affective
factors contribute to scholastic achievement. According to Bloom
(1976:10) the most important factors are cognitive variables such as
aptitudes, while other variables, such as affective factors, explain a lesser
amount of scholastic achievement. In contrast to this viewpoint the current
study shows that affective factors may be more important than aptitude
variables (measured by the DAT) in achievement. It appears that affective
factors account for more of the variance in achievement in Natural
Sciences as well as in Human and Social Sciences. Both self-concept and
aptitude show equally strong relationships with Mathematics achievement.
Self-concept shows a slightly weaker relationship with English first
language achievement compared to aptitude. The importance of affective
factors in Grade 9 achievement may be due to changes in measuring
achievement under the Outcomes Based Education system in the schools.
It may be possible that Outcomes Based Education is measuring a kind of
emotional intelligence as well as cognitive intelligence.
The predictive validity of the current study may be compromised by the small
sample size of 60 learners. However, the administration of 60 intelligence tests
which are individual tests and take between 75 and 90 minutes each, is a time
148
consuming task. A larger sample size would have taken a greater amount of time
which would have made the study excessive for a dissertation of limited scope.
6.4 POSSIBILITIES FOR FUTURE RESEARCH
In the current study the relationship between aptitude, as measured by the DAT-S,
and Grade 9 scholastic achievement was investigated. It was found that many
aptitudes did not correlate significantly with achievement in the school subjects.
The correlations that did reach significance fell into the low range (0.25 to 0.39).
Affective factors, however showed significant relationships with all of the
subjects, the strength of correlation ranging from low to moderate (0.26 to 0.53).
In future research, therefore it would be important to investigate the reasons for
the higher correlations between affective variables and achievement compared to
cognitive variables. In addition, other variables, such as previous achievement,
could be added to aptitude and affective factors to increase the accuracy in
predicting achievement.
Grade 9 achievement scores on their own or in combination with aptitude and
affective variables, could be used to predict Grade 11 scores. These scores could
also be used to predict Grade 12 achievement, assisting in the identification of
possible matriculation failure. Grade 11 achievement scores may be used on their
own or in combination with aptitude and affective factors for Career Guidance
purposes. The scores may be used to predict achievement in different subjects at
tertiary level.
In section 6.2.3.2, suggestions regarding the diagnosis and remediation of learning
problems are made. In future research, the outcome of these recommendations
could be empirically established.
In the current study a random sample of learners was selected and the relationship
between affective factors and their achievement became clear. In future research
specific samples of learners who experience learning problems, emotional

149
difficulties or behavioural problems may be selected to study the relationship
between their problems, affective factors and school achievement.

150
REFERENCES
Bereiter, C. & Scardamalia, M. 1993. Educational relevance of the study of
expertise. In Horn, C., Bruning, R., Schraw, G., Curry, E. & Katkanant, C. 1993.
Contemporary Educational Psychology 18:464-478.
Berk, L. 2000. Child development. 5th edition. Massachusetts: Allyn and Bacon.
Bester, C.A. 2003. Affektiewe faktore wat met uitvoerende kuns op sekondêre
skoolvlak verband hou. Unpublished DEd thesis. Pretoria: University of South Africa.
Bester, G. 1998. Die bepaling van realistiese prestasievlakke as ‘n voorligtingstaak.
Unpublished MEd dissertation. Pretoria: University of South Africa.
Bester, G. 2003. Psychometrics workbook for Course OSV454-6. Pretoria: University
of South Africa.
Bloom, B.S. 1976. Human characteristics and school learning. New York: McGraw-
Hill.
Bong, M. 2002. Predictive utility of subject-, task-, and problem-specific self-
efficacy judgements for immediate and delayed academic performances. The Journal
of Experimental Education 70(2):133-162.
Bouffard, T., Boileau, L. & Vezeau, C. 2001. Students’ transition from elementary
to high school and changes of the relationship between motivation and academic
performance. European Journal of Psychology of Education 16 (4):589-604.
Bracken, B.A. 1996. Handbook of self-concept: Development, social and clinical
considerations. New York: John Wiley.
151
Bransford, J.D., Stein, B.S., Vye, N.J., Franks, J.J., Auble, P.M., Mezynski, K.J.
& Perfetto, G.A. 1993. Differences in approaches to learning: an overview. In Horn,
C., Bruning, R., Schraw, G., Curry, E. & Katkanant, C. 1993. Contemporary
Educational Psychology 18:464-478
Brodnick, R.J. & Ree, M.J. 1995. A structural model of academic performance,
socioeconomic status, and Spearman’s g. Educational and Psychological
Measurement, 55: 583-594.
Brody, N. 1992. Handbook of intelligence. San Diego: Academic Press
Brown, W.F. & Holtzman, W.H. 1997. Survey of Study Habits and Attitudes: Form
H. Pretoria: Human Sciences Research Council.
Burns, R.B. 1979. The self-concept. theory, measurement, development and
behaviour. New York: Longman
Byrne, B.M. & Shavelson, R.J. 1986. On the structure of adolescent self-concept.
Journal of Educational Psychology 78:474-481
Carroll, J.B. 1982. The measurement of intelligence. In Sternberg, R.J. (Ed.) 1982.
Handbook of human intelligence. Cambridge: Cambridge University Press.
Carroll, J.B. 1993. Human cognitive abilities: a survey of factor-analytic studies. In
Berk, L. 2000. Child development. 5th edition. Massachusetts: Allyn and Bacon.
Chen, C., Lee, S. & Stevenson, H.W. 1996. Long-term prediction of academic
achievement of American, Chinese and Japanese adolescents. Journal of Educational
Psychology 88(4):750-759

152
Coe, W.C. & Sarbin, T.R. 1984. Mastering psychology. Springfield: Charles C
Thomas.
Cohen, R.J. & Swerdlik, M.E. 2002. Psychological testing and assessment: an
introduction to test and measurement. 5th edition. Boston: McGraw-Hill.
Colom, R., Rebollo, I., Palacios, A., Juan-Espinosa, M. & Kyllonen, P.C. 2004.
Working memory is (almost) perfectly predicted by g. Intelligence, 32 (3): 277-296.
Cooper, H., Lindsay, J., Nye, B. & Greathouse, S. 1998. Relationships among
attitudes about homework, amount of homework assigned and completed, and student
achievement. Journal of Educational Psychology 90 (1):70-83.
Coover, G.E. & Murphy, S.T. 2000. The communicated self: exploring the
interaction between self and social context. Human Communication Research 26
(1):125-147.
Corey, G. 2005. Theory and practice of counselling and psychotherapy. 7th edition.
Belmont: Thomson Brooks/Cole.
Coté, J.E. & Levine, C.G. 2000. Attitude versus aptitude: is intelligence or
motivation more important for positive higher-educational outcomes? Journal of
Adolescent Research 15(1):58-80.
Dai, D.Y. 2000. To be or not to be (challenged), that is the question: task and ego
orientations among high-ability, high-achieving adolescents. The Journal of
Experimental Education 68(4):311-330.
De Bruin, G. P. 1997. Spearman se G en die faktorstrukture van die senior
aanlegtoetse en die algemene skolastiese aanlegtoets. Tydskrif vir Bedryfsielkunde 23
(2): 14-18.

153
Deary, I. J. & Stough, C. 1996. Intelligence and inspection time: achievements,
prospects, and problems. American Psychologist 51 (6): 599-608.
Deary, I. J. 1995. Auditory inspection time and intelligence: what is the direction of
causation? Developmental Psychology 31 (2): 237-250.
Deci, E.L., Vallerand, R.J., Pelletier, L.G. & Ryan, R.M. 1991. Motivation and
education: the self-determination perspective. Educational Psychologist 26: 325-346.
Du Toit, L. 1995. Manual for the Survey of Study Habits and Attitudes: Form H.
Pretoria: Human Sciences Research Council.
Du Toit, S.J. & Kruger, N. 1993. The Child: An educational perspective. Durban:
Butterworths
Eccles, J.S. & Wigfield, A. 1995. In the mind of the actor: the structure of
adolescents’ achievement task values and expectancy-related beliefs. Personality and
Social Psychology Bulletin 21:215-225.
Eggen P. & Kauchak, D. 1994. Educational psychology: classroom connections.
New York: Macmillan.
Elliot, T.R., Godshall, F., Shrout, J.R. & Witty, T.E. 1990. Problem-solving
appraisal, self-reported study habits, and performance of academically at-risk college
students. Journal of Counselling Psychology 37: 203-207.
Elliot, J.G., Hufton, N., Illushin, L. & Lauchlan, F. 2001. Motivation in the junior
years: international perspectives on children’s attitudes, expectations and behaviour
and their relationship to educational achievement. Oxford Review of Education
27(1):38-68.

154
Eysenck, M. W. & Keane, M. 2000. Cognitive psychology: a student’s handbook.
4th edition. East Sussex: Psychology Press.
Fortier, M.S., Vallerand, R.J. & Guay, F. 1995. Academic motivation and school
performance: toward a structural model. Contemporary Educational Psychology.
20:257-274
Fouché, F.A. & Verwey, F.A. 1994. Manual for the Senior Aptitude Tests 1978
Edition (SAT 78). Pretoria: Human Sciences Research Council.
Gagné, F. & St Père, F. 2002. When IQ is controlled, does motivation still predict
achievement? Intelligence 30(1):71-100
Gardner, H. 1993. Frames of mind: the theory of multiple intelligences. 2nd edition.
London: Fontana.
Geary, D.C. & Burlingham-Dubree, M. 1989. External validation of the strategy
choice model for addition. In Berk, L. 2000. Child development. 5th edition.
Massachusetts: Allyn and Bacon.
Gordon-Rouse, K.A. 2001. Resilient students’ goals and motivation. Journal of
Adolescence 24:461-472
Gouws, E. & Kruger, N. 1994. The adolescent: an educational perspective. Durban:
Butterworths.
Guilford, J.P. 1967. The nature of human intelligence. New York: McGraw-Hill.
155
Guilford, J.P. 1985. The structure-of-intellect model. In Wolman, B.B. 1985.
Handbook of intelligence: theories, measurements, and applications. New York: John
Wiley & Sons.
Gustafsson, J.E. & Balke, G. 1993. General and specific abilities as predictors of
scholastic achievement. Multivariate Behavioural Research 28 (1): 407-434.
Hansford, B.C. & Hattie, J.A. 1982. The relationship between self and
achievement/performance measures. Review of Educational Research 52 (1): 123-
142.
Horn, C., Bruning, R., Schraw, G., Curry, E. & Katkanant, C. 1993. Paths to
success in the college classroom. Contemporary Educational Psychology. 18:464-
478.
Howell, D.C. 1992. Statistical methods for psychology. 3rd edition. California:
Duxbury Press.
Huysamen, G.K. 1999. Psychometric explanations for the poor predictability of the
tertiary-Academic performance of educationally disadvantaged students. South
African Journal of Higher Education 13 (1):132-137.
Irandoust, M. & Karlsson, N. 2002. Impact of preferences, curriculum, and learning
strategies on academic success. Education Economics 10 (1):41-48.
Jakubowski, T.G. & Dembo, M.H. 2002. Social cognitive factors associated with
the academic self-regulation of undergraduate college students enrolled in a learning
and study strategies course. Paper presented at Annual Meeting of American
Educational Research Association, New Orleans.
Jensen, A.R. 1998. The Science of mental ability. New York: Praeger

156
Kanoy, K.W., Wester, J. & Latta, M. 1989. Predicting college success of freshmen
using traditional, cognitive, and psychological measures. Journal of Research and
Development in Education 22:65-70.
Kelly, J. 1999. A longitudinal study measuring the ability of two South African
mathematics tests to predict mathematics performance of Grade 9 high school pupils.
South African Journal of Education 19 (2): 100-108.
Koke, L.C. & Vernon, P.A. 2003. The Sternberg triarchic abilities test (STAT) is a
measure of academic achievement and general intelligence. Personality and
Individual Differences 35: 1803-1807.
Koutsolis, M.K. & Campbell, J.R. 2001. Family processes affect students’
motivation, and science and math achievement in Cypriot high schools. Structural
Equation Modeling 8(1):108-127.
Kovach, K., Fleming, D. & Wilgosh, L. 2001. The relationship between study skills
and conceptions of intelligence for high school students. Korean Journal of Thinking
and Problem-solving 11(1):39-49.
Kruger, H.B. & Bester, P.M. 1989. Voorspellingswaarde van die senior aanlegtoets
en die matrikulasie-eksamen ten opsigte van sukses in Afrikaans-Nederlands III.
Suid-Afrikaanse Tydskrif vir Opvoedkunde 9 (4): 693-699.
Lammers, W., Onwegbuzie, A. & Slate, J. 2001. Academic success as a function
of the gender, class, age, study habits, and employment of college students. Research
in the Schools 8(2):71-81

157
Leondari, A. & Gialamas,V. 2002. Implicit theories, goal orientations and perceived
competence: impact on students’ achievement behaviour. Psychology in the Schools
39(3):279-291.
Li, R. 1996. A theory of conceptual intelligence. London: Praeger.
Maatta, S., Stattin, J. & Nurmi, J. 2002. Achievement strategies at school: types
and correlates. Journal of Adolescence 25(1):31-46.
Mäkinen, J. & Olkinuora, E. 2004. University students’ situational reaction
tendencies: reflections on general study orientations, learning strategies, and study
success. Scandinavian Journal of Educational Research 48(5):477-491.
Manstead, A.S.R. & Van Eekelen, S.A.M. 1998. Distinguishing between perceived
behavioural control and self-efficacy. Journal of Applied Social Psychology
28(15):1375-1392.
Marais, J.L. 1992. Voorspelling van akademiese prestasie tydens die junior
sekondêre skoolfase. Suid-Afrikaanse Tysdskrif van Opvoedkunde 12(22):184-191.
Marsh, H.W. 1990a. The structure of academic self-concept. Journal of Educational
Psychology 82:623-636.
Marsh, H.W. 1990b. Causal ordering of academic self-concept and academic
achievement. Journal of Educational Psychology 82:646-656.
Marsh, H.W., Byrne, B.M. & Shavelson, R.J. 1988. A multifaceted academic self-
concept: its hierarchical structure and its relation to academic achievement. Journal of
Educational Psychology 80(3):366-380.
158
Marsh, H.W., Hau, K. & Kong, C. 2002. Multilevel causal ordering of academic
self-concept and achievement: influence of language of instruction (English
Compared with Chinese) for Hong Kong Students. American Educational Research
Journal 39(3):727-763.
Marsh, H.W. & O’Niell, R. 1984. Self Description Questionnaire III (SDQ III): The
construct validity of multidimensional self-concept ratings by late-adolescents.
Journal of Educational Measurement 21:153-174.
Marsh, H.W. & Shavelson, R. 1985. Self-concept: its multifaceted, hierarchical
structure. Educational Psychologist 20(3):107-123.
Marsh, H.W. & Yeung, A. 2001. An extension of the internal / external frame of
reference model: a response to Bong (1998). Multivariate Behavioural Research.
36(3):389-420.
Martin, A.J. & Marsh, H.W. 2003. Fear of failure: friend or foe? Australian
Psychologist 38(1):31-38.
Mascolo, J. 2002. An investigation of the structural validity of the cross-battery
approach in a referred sample: Confirmatory factor analysis of competing Cattel-
Horn-Carroll, Wechsler, and PASS models. Dissertation-Abstracts-International:-
Section B: The Sciences and Engineering 63: 1084
Matarazzo, J. 1972. Wechsler’s measurement and appraisal of adult intelligence. 5th
edition. Baltimore: Williams & Wilkins.
McCoach, D.B. & Siegle, D. 2003. Factors that differentiate underachieving gifted
students from high-achieving gifted students. Gifted Child Quarterly 47(2):144-154.
Meyer, L.W. 1988. Selfkonsep as voorspeller van skolastiese prestasie. South
African Journal of Education 8(2):112-118.
159
Meyer, W.F., Moore, C. and Viljoen, H.G. 1993. Personality Theories – from
Freud to Frankl. Johannesburg: Lexicon.
Monteith, J.L. de K. 1988. Faktore wat die Akademiese Prestasie van Eerstejaars
Beinvloed. Bulletin vir Dosente 20:23-34.
Mussen, P.H., Conger, J.J., Kagan, J. & Huston, A.C. 1984. Child development
and personality. New York: Harper & Row.
Myburgh, C.P.H., Grobler, R.C. & Niehaus, L. 1999. Predictors of scholastic
achievement: IQ, self-concept, time concept, and background characteristics. South
African Journal of Education 19(3):165-178.
Neisser, U., Boodoo, G., Bouchard, J., Boukin, A.W., Brody, N., Ceci, S.J.,
Halpern, D.F., Loehlin, J.C., Perloff, R., Sternberg, R.J. & Urbina, S. 1996.
Intelligence: knowns and unknowns. American Psychologist 51: 77-101.
Nichols, P.D. & Mittleholtz, D.J. 1996. Constructing the concept of aptitude:
implications for the assessment of analogical reasoning. In Phye, G.D. (Ed.) 1996.
Handbook of academic learning: construction of knowledge. San Diego: Academic
Press.
Owen, K. & Vosloo, H.N. 1999. Senior Aptitude Tests Form L. Pretoria: Human
Sciences Research Council.
Owen, K. & Vosloo, H.N. 2000. Differential Aptitude Tests Form S. Pretoria: Human
Sciences Research Council.
Owen, K. 2000. Manual for the Differential Aptitude Test Form L. Pretoria: Human
Sciences Research Council.

160
Plucker, J.A. & Stocking, V.B. 2001. Looking outside and inside: self-concept
development of gifted adolescents. Exceptional Children 67(4):534-548.
Plucker, J.A., Callahan, C.M. & Tomchin, E.M. 1996. Wherefore art thou,
multiple intelligences? Alternative assessments for identifying talent in ethnically
diverse and low income students. Gifted Child Quarterly 40 : 81-92.
Prinsloo, E., Vorster, P.J. & Sibaya, P.T. 1996. Teaching with confidence. Pretoria:
Kagiso.
Ramseier, E. 2001. Motivation to learn as an outcome and determining factor of
learning at school. European Journal of Psychology of Education 16(3):421-439.
Rau, W. & Durand, A. 2000. The academic ethic and college grades: does hard
work help students to “make the grade”? Sociology of Education 73(1):19-38.
Reber, A.S. 1995. The Penguin dictionary of psychology. 2nd edition. London:
Penguin (self concept, p.701).
Rieber, R.W & Robinson, D.K. 2004. The essential Vygotsky. New York: Kluwer
Academic.
Rinderman, H. & Nienaber, A.C. 2004. Processing speed, intelligence, creativity,
and school performance: testing of causal hypotheses using structural equation
models. Intelligence 32 (6): 573-589.
Ross, C.E. & Broh, B.A. 2000. The roles of self-esteem and the sense of personal
control in the academic achievement process. Sociology of Education 73(4):270-284.

161
Schmidt, J.A. & Padilla, B. 2003. Self-esteem and family challenge: an
investigation of their effects on achievement. Journal of Youth and Adolescence
32(1):37-46.
Schultz, P.A.L. 1997. Educational goals, strategies use and the academic
performance of high school students. High School Journal 80(3):193-203.
Shavelson, R.J., Hubner, J.J. & Stanton, G.C. 1976. Self-concept: validation of
construct interpretations. Review of Educational Research 46(3):407-441.
Sherman, M.R. 2002. Structural Modelling of the WAIS-R and Tests of Executive
Function under Comprehensive CHC Theory. Dissertation Abstracts International
Section A: Humanities and Social Sciences 63: 87.
Sideridis, G.D. 2001. The causal role of goal importance for the explanation of
student study behaviour: cross-validation with multiple samples. Educational
Psychology 21:278-288.
Spearman, C. & Jones, L.L. 1950. Human ability: a continuation of “The Abilities
of Man”. London: Macmillan.
Sternberg, R.J. 1985. Beyond IQ: a triarchic theory of human intelligence.
Cambridge: Cambridge University Press.
Sternberg, R.J. Who’s intelligent? In Berk, L. 2000. Child development. 5th edition.
Massachusetts: Allyn and Bacon.
Stumpf, H. & Stanley, J.C. 2002. Group data on high school grade point averages
and scores on academic aptitude tests as predictors of institutional graduation rates.
Educational and Psychological Measurement 62(6): 1042-1052.
162
Suh, S. & Suh, J. 2006. Educational engagement and degree attainment among high
school dropouts. Educational Research Quarterly 29(3):11-20.
Suzuki, L.A. & Valencia, R.R. 1997. Race-ethnicity and measured intelligence:
educational implications. American Psychologist 52 (10):1103-1114.
Tanaka, A. & Yamauchi, H. 2001. A model for achievement motives, goal
orientations, intrinsic interest, and academic achievement. Psychological Reports
88(1):123-135.
Thombs, D. L. 1995. Problem behaviour and academic achievement among first
semester college freshmen. Journal of College Student Development 36:280-288.
Thompson, L.A., Detterman, D.K. & Plomin, R. 1991. Associations between
cognitive abilities and scholastic achievement: genetic overlap but environmental
differences. Psychological Science 2: 158-165.
Thurstone, L.L. 1938. Primary mental abilities. Chicago: University of Chicago
Press.
Van der Lith, J.J. 1991. Die invloed van die kognitiewe en affektiewe
toetredingseienskappe van leerlinge op hulle prestasies in die skoolmilieu. Education
Bulletin 35: 74-81.
Van der Westhuizen, G.J., Monteith, J.L. de K. & Steyn, H.S. 1989. Relative
contribution of different sets of variables to the prediction of the academic
achievement of black students. South African Journal of Education 9: 769-773.
Van Eeden, R. 1997a. Manual for the Senior South African Individual Scale –
Revised (SSAIS-R) Part 1 Background and Standardization. Pretoria: Human
Sciences Research Council.
163
Van Eeden, R. 1997b. Senior South African Individual Scale - Revised. Pretoria:
Human Sciences Research Council.
Van Eeden, R. 2000. Interpretation of the SSAIS-R. Pretoria: University of South
Africa.
Van Eeden, R., De Beer, M. & Coetzee, C.H. 2001. Cognitive ability, learning
potential, and personality traits as predictors of academic achievement by engineering
and other science and technology students. South African Journal of Higher
Education 15 (1):171-179.
Verwey, F.A. & Wolmarans, J.J. 1983. Manual (1980 edition) for the Junior
Aptitude Tests (JAT). Pretoria: Human Sciences Research Council.
Vosloo, H.N., Coetzee, N. & Claassen, N.C.W. 2000. Manual for the Differential
Aptitude Tests Form S. Pretoria: Human Sciences Research Council
.
Vrugt, A., Oort, F.J. & Zeeberg, C. 2002. Goal orientations, perceived self-efficacy
and study results amongst beginners and advanced students. British Journal of
Educational Psychology 72(3):385-397.
Wicks-Nelson, R. & Israel, A.C. 1997. Behaviour disorders of childhood. New
Jersey: Prentice Hall.
Wilhite, S. C. 1990. Self-efficacy, locus of control, self-assessment of memory
ability, and study activities as predictors of college course achievement. Journal of
Educational Psychology 82:696-700.
Woolfolk, A.E. 1995. Educational psychology. Boston: Allyn and Bacon.

164
Yip, M.C.W. & Chung, O.L.L. 2005. Relationship of study strategies and academic
performance in different learning phases of higher education in Hong Kong.
Educational Research and Evaluation 11(1):61-70.

APPENDIX
MOTIVATION AND SELF-CONCEPT QUESTIONNAIRE
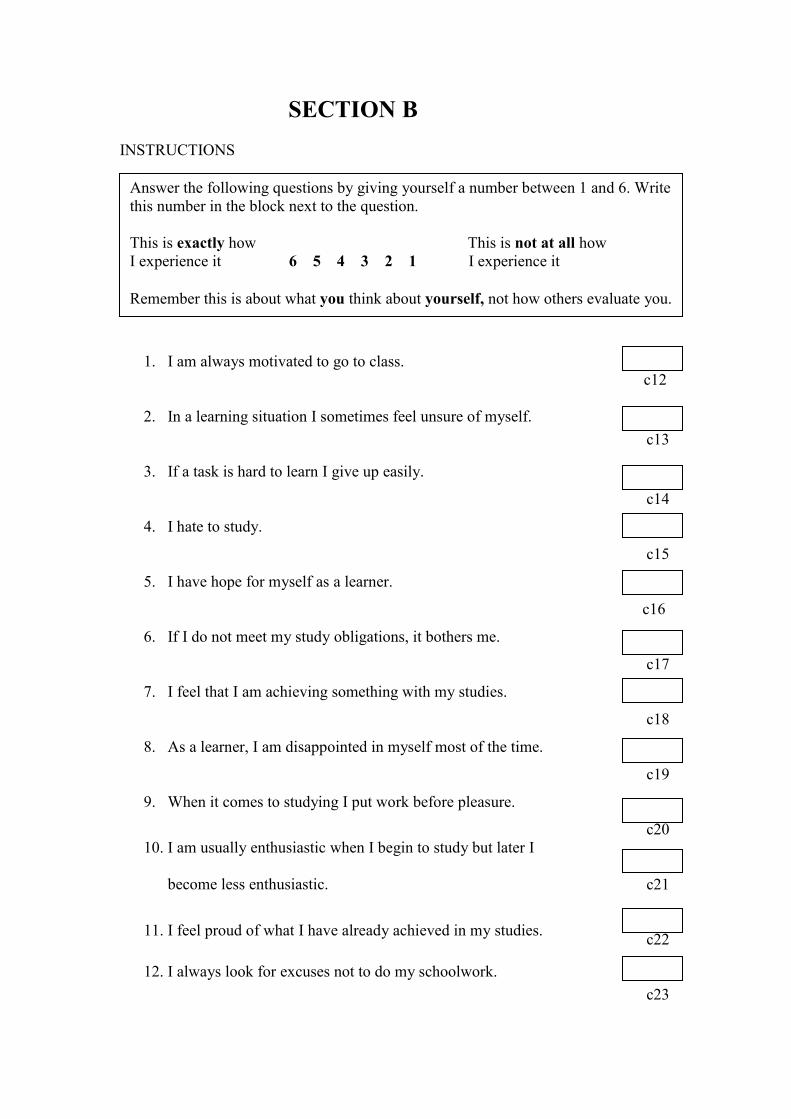
SECTION B INSTRUCTIONS
1. I am always motivated to go to class.
2. In a learning situation I sometimes feel unsure of myself.
3. If a task is hard to learn I give up easily.
4. I hate to study.
5. I have hope for myself as a learner.
6. If I do not meet my study obligations, it bothers me.
7. I feel that I am achieving something with my studies.
8. As a learner, I am disappointed in myself most of the time.
9. When it comes to studying I put work before pleasure.
10. I am usually enthusiastic when I begin to study but later I
become less enthusiastic.
11. I feel proud of what I have already achieved in my studies.
12. I always look for excuses not to do my schoolwork.
c12
c13
c14
c15
c16
c17
c18
c19
c20
c21
c22
c23
Answer the following questions by giving yourself a number between 1 and 6. Write this number in the block next to the question. This is exactly how This is not at all how I experience it 6 5 4 3 2 1 I experience it Remember this is about what you think about yourself, not how others evaluate you.

13. I have confidence in myself when I have to perform a task or
write an examination.
14. I set goals for my studies and try to reach them.
15. I catch up work that I have missed.
16. I fail most learning tasks which I attempt.
17. Where my schoolwork is concerned I use my time productively.
18. I am ashamed of my shortcomings in schoolwork.
19. It bothers me if my work for the day is not finished.
20. I do not have enough self-confidence to do a presentation before
an audience.
21. I can overcome obstacles in my studies because I believe in
myself.
22. I study when I feel like it.
23. If a task is too difficult I do not even try to learn it.
24. I have my schoolwork under control – I know where I am going
to.
25. I am reluctant to learn new, challenging tasks.
26. I like to learn new work and extend my skills.
27. I sometimes feel that I will never produce good work.
c24
c25
c26
c27
c28
c29
c30
c31
c32
c33
c34
c35
c36
c37
c38

28. I sometimes feel that I will never get anywhere with my
schoolwork.
29. Where my schoolwork is concerned, I see myself as a hard
worker.
30. My school performance is acceptable to me.
31. As a learner I sometimes doubt myself and what I can achieve.
32. I am determined to do my schoolwork to a high standard.
33. I am ashamed of the standard of my schoolwork.
34. I do not have to be told to do my schoolwork.
35. Where my schoolwork is concerned I do what I am meant to do
but nothing extra.
36. To do my schoolwork gives meaning to my life.
37. As a school learner I am a struggler.
38. I am motivated to learn difficult, challenging work.
39. I always postpone doing my homework.
40. I would like to change many things about myself as a school
learner if I could.
c39
c39
c40
c40
c41
c42
c43
c44
c45
c46
c46 c47
c48
c49
c50 c51
c52 For office use