TABLE OF CONTENTS - Tufts...
38
1
Transcript of TABLE OF CONTENTS - Tufts...

1

2
TABLE OF CONTENTS
PAGE
HIGHLIGHTS 3
2015 FINANCIAL REPORT 4
2015 ENDOWMENT AND INVESTMENT REPORT 11
REPORT OF INDEPENDENT AUDITORS 13
CONSOLIDATED FINANCIAL STATEMENTS AS OF AND FOR THE YEAR ENDED JUNE 30, 2015, WITH SUMMARIZED INFORMATION AS OF AND FOR THE YEAR ENDED JUNE 30, 2014
Statement of Financial Position 14
Statement of Activities 15
Statement of Cash Flows 16
Notes to Consolidated Financial Statements 17
THE BOARD OF TRUSTEES OF TUFTS COLLEGE 37

3
TUFTS UNIVERSITY HIGHLIGHTS Fiscal years ended June 30, 2015 and 2010
2015 2010 FINANCIAL (in thousands)
Total unrestricted operating revenue
$813,460
$682,382
Total net assets
2,235,096
1,787,777
Land, buildings and equipment, net
870,270
702,200
Investments, net of receivables and payables 2,122,561 1,470,218
Bonds and notes payable 648,511 420,222
CREDIT RATING
Standard & Poors AA- AA- Moody's Aa2 Aa2 STUDENTS
Enrollment (full-time equivalent enrollment)
Undergraduate 5,126 5,137
Graduate 3,190 2,601
Professional 1,983 1,778
Certificate and other 160 321
Total full-time equivalent enrollment 10,459 9,837
Undergraduate Admission
Applicants 19,062 15,433
Selectivity 16% 24%
Yield 44% 35%
SAT (mean) 1,436 1,416
Total undergraduate student charges (tuition, room, board, mandatory fees)
$61,277
$51,088
PERSONNEL
Faculty 1,155 1,014
Staff 2,979 2,832
Total full-time equivalent 4,134 3,846
FACILITIES
Gross square feet 5,171,757 4,792,660

4
TUFTS UNIVERSITY 2015 FINANCIAL REPORT With total net assets of $2.2 billion and unrestricted operating revenues of $813 million, the University continues to maintain a strong financial position. Coupled with efficiency initiatives, including Tufts Effectiveness in Administrative Management (TEAM), the University is poised to further its goals of supporting the financial needs of our students and maintaining and investing in our educational and research programs and initiatives. Total net assets for the University decreased $33 million in 2015. The 5-year compounded annual growth of net assets was 4.6%. The University’s financial performance is primarily influenced by operating results, philanthropy and investment performance. Unrestricted operations produced an increase in net assets of $1 million. This modest surplus is in part due to the short term investments being made in efficiency related initiatives, such as TEAM, that will result in greater efficiency and savings starting in fiscal year 2016. Capital and annual giving increased to $108 million, with annual giving providing $18.5 million to operations. Investment performance matched our investment policy benchmark; however, performance lagged our long term return target of 8% and was less than that which we distribute during the year to support operations. This required a draw of accumulated prior years’ excess returns to fund operations, which is one of the primary reasons for the decline in net assets. This draw on prior year accumulated returns is made possible due to the University’s prudent management of the endowment, retaining excess funds in years of high returns to enable use, and thus stable annual funding, in years of lower returns.
(33)
-300
-200
-100
0
100
200
300
2011 2012 2013 2014 2015
Change in Net Assets ($ millions)
Operations Capital Contributions Excess Investment Returns and Other Changes Total

5
Current 22%
Long-term 78%
Investments Investment and related accounts ended the year at $2.1 billion, a $15.5 million year-over-year decrease, but a five-year compound annual growth of 7.6%. Please refer to section 2015 Endowment and Investment Report for additional discussion on the endowment and investments.
Property and Equipment Property and Equipment had an $870 million book value net of depreciation at year end, growing $36.6M (4.4%) from the prior year end. Capital expenditures for 2015 amounted to $83 million with the completion of the Collaborative Learnings and Innovation Complex (CLIC) at 574 Boston Avenue, the Stearns Facade, Carmichael Exterior Envelope, Arnold Biosafety Lab, Heating Plant Upgrades, Cohen Auditorium, and Colby Exterior Renovations. Major projects in progress include work on Science Building, Campus Energy Plant, and Cousens Exterior Renovations. Physical Plant Renewal The University is committed to preserving and renewing its physical resources, made possible by an increasing commitment of annual operating revenue and the prudent use of debt. During fiscal year 2012, the Board of Trustees approved a plan to significantly increase funds available for deferred maintenance. In accordance with the funding plan, the University allocated $30 million in 2015 to improve the condition of the physical plant. Funding in 2016 will be $36 million. Funding over the next ten years is scheduled to total $453 million. LIABILITIES
Debt Outstanding debt totaled $648.5 million at year end. In February 2015, the University issued $69.6 million of Series Q tax-exempt bonds, due in August 2045, the proceeds of which were used to advance refund a portion of the University’s existing Series O bonds, generating substantial savings on future interest expense. The University also entered into a new $28 million tax-exempt line of credit in March 2015 to finance various capital maintenance projects. The University currently has $7 million outstanding under the agreement and plans to borrow the full $28 million over two years, as needed, allowing the University to minimize borrowing costs. Proceeds of the $250 million Series 2012A taxable bonds, issued in fiscal year 2012 and due in April 2112, continue to fund construction and renovation of classroom, office and research facilities to advance the University’s academic priorities. The liability associated with interest rate swap agreements increased from $56.2 million at June 30, 2014 to $62.7 million at June 30, 2015. These long term swaps are matched to the University’s variable rate debt to assure effectively fixed rate debt instruments. The agreements do not have covenants and do not require the University to post collateral.
Other Assets 4%
Property and Equipment
28%
Investments 68%
Liabilities totaled $944 million at year end, a year-over-year increase of $42 million. Long-term liabilities included bonds and notes payable, interest rate agreements, and government advances for student loans while current liabilities included accounts payable, deferred revenue and other liabilities.
ASSETS Assets of $3.2 billion are comprised primarily of cash and investments at 68% and property and equipment at 28%. Total assets increased 0.3% during the year with a compound five-year average increase of 5.2%.

6
The University’s overall weighted average cost of capital as of June 30, 2015 was 4.6%. The debt service to operating expense ratio was 4.6% in fiscal year 2015, in keeping with the University’s goal of maintaining debt service levels less than 5% of operating expenses. Over the past five years, this ratio ranged between 3.8% and 4.9%, enabling the University to maintain its strong credit ratings while benefiting from a low cost of capital.
OPERATING RESULTS Operations contributed $1 million to unrestricted net assets in fiscal year 2015 compared to $3.8 million and $6.1 million in fiscal years 2014 and 2013, respectively. Planned increases in tuition and fee rates and student enrollment plus growth in clinical revenue and investment return utilized funded priority investments in faculty, financial aid, systems and the Tufts Effectiveness in Administrative Management (TEAM) implementations. Unrestricted operating revenues grew 2.8% to $813 million. Operating expenses grew 3.1% to $812 million.
Revenue Fiscal year 2015 unrestricted operating revenues totaled $813 million. The University has a diverse revenue base, which mitigates the impact of changes in any one revenue source. In the last several years the revenue components have remained stable. The chart below shows the fiscal year 2015 revenue components.
Tuition and Financial Aid Net Tuition, tuition and fees minus financial aid, grew $12 million (3.7%) to $341 million. Gross tuition and fees increased 4.5% to $471 million due to planned rate increases and an increased enrollment across the University of 210 students. Undergraduate total student charges increased 4.25% and undergraduate enrollment increased by 27 students. Graduate and professional degree rates increased 2% to 5% and enrollment increased by 183 students with enrollment increases highest in AS&E graduate programs and the Medical school. Financial aid for all degree programs grew 6.6% to $130 million in fiscal year 2015 signaling this to be among Tufts’ highest priorities. Undergraduate aid grew to $74 million or 9.1% of which school support increased 9.1%, aid from restricted contributions and the endowment grew 9.4% and Pell and state aid increased 8.3%. Graduate aid increased 3.5% overall, with the Medical School continuing its long-term plan to increase the number of need-based scholarships. Investment return utilized Investment return utilized increased 5.2% to $99.2 million in 2015. This amount includes investment income distributed from the Total Return Pool (TRP) and income earned on short-term investments of the University’s working capital. The endowment distribution utilization grew 5.7%, primarily due to the a planned TRP distribution increase of 3% augmented by: an increase in endowment scholarships, an increase in professorship funding, and a $1.3 million increase in the release of temporarily restricted endowment distributions from prior
4.4% 3.8%
4.9% 4.6% 4.6%
0%
1%
2%
3%
4%
5%
6%
2011 2012 2013 2014 2015
Debt Service Ratio
Net Tuition & Fees
41.9% Government
Grants & Contracts
17.0%
Clinical & Other 14.1%
Auxiliary Enterprises
6.8%
Contributions & Grants,
8.0%
Investment Return
Utilized, 12.2%

7
years. Non-endowment return utilized in operations, primarily from income on reserves generated by prior years’ operating surpluses invested in the TRP, increased 2.9% from the prior year.
Additional information regarding the TRP, the University’s spending policy, and the performance of the University’s investments can be found in the next section, 2015 Endowment and Investment Report. Contributions, Grants and Contracts Contribution, grants and contracts, which include government and private research grants and contracts, the Commonwealth of Massachusetts appropriation for the Cummings School and gifts for operating use, totaled $190 million, an increase of $8 million from the prior year. Government grants and contracts comprised 71% of this amount, private grants 18%, state appropriation 2% and gifts 9%. Government grant and contract revenue, excluding the state appropriation for the Cummings School, grew 3.0% to $134.5 million reversing declines of 2.7% in 2013 and 1.1% in fiscal year 2014. In 2015 several schools had increases in government grant and contract revenues while others had decreases. AS&E, HNRCA, and the School of Nutrition experienced growth: AS&E primarily due to an increase in Office of Naval Research funded research; HNRCA due to increased activity on the multi-year corporative agreement with the USDA Agricultural Research Service; and the School of Nutrition primarily due to increased USAID funded activity in the Nutrition Innovation Lab. The Cummings School and Medical School experienced decreases; the Cummings School primarily due to a gap in USAID RESPOND grant funding during a delay in the continuation of that agreement; and the Medical School due to DHHS funding declines. The Cumming School’s state appropriation remained at $4.0 million. Private grant revenue increased 1.5% to $33.4 million, a deceleration from growth in 2013 and 2014, which saw increases of 9.3% and 10.4%. Gifts for current use increased to $18.5 million. Clinical and Other Educational Activities Revenue from clinical and other educational activities totaled $114.4 million in fiscal year 2015, a decrease of 1.5% from fiscal year 2014. The Cummings School, Medical School, and Dental School generate most of the revenue in this area. The Cummings School’s Foster Hospital, Hospital for Large Animals, and Tufts Veterinary Emergency Treatment and Specialties (TVETS) clinic again performed well in 2015 with increased caseloads and increased fees per case driving revenue up by $1 million. The Dental School clinical and other revenues increased $1.2 million primarily due to increases in Public Health Programs, UG and PG Clinics. Medical School revenues fell by $3 million primarily due to changes to residency match requirements making it more difficult to place international medical graduates into US residency programs. The Tufts Educational Daycare Center operation was transitioned to a private company leading to a reduction in revenues of $1.1 million. Patent and licensing income continued to fall due to the expiration of a license agreement. Expenses Operating expenses increased 3.1% from $788 million to $812 million in fiscal year 2015. This chart displays the major natural classification categories for expenses. Over time, the share of expense components has remained relatively stable. Compensation, comprising 58% of expenses, rose 4% due primarily to a 2.75% annual merit salary increase, a 9% increase in healthcare expenses, and an increase in compensated absences expenses. The University continued its commitment to attract and retain outstanding faculty by providing competitive compensation packages and supporting research and teaching. Non-compensation expense increased 1.9% from $331 million to $337 million in fiscal year 2015. Notable expense increases included Tufts Effectiveness in Administrative Management (TEAM) implementation expenses, snow removal costs, and depreciation due to completion of CLIC, the TAB Data Center, Carmichael Exterior Envelope and Stearns Façade. Notable expense decreases included a reduction in travel expenses, a decrease in interest expense, and an increase in capitalized facility costs.
Compensation (Salaries,
Wages and Benefits)
58.5%
Facilities (Maintenance, Depreciation,
Interest) 15.9%
Materials and Supplies 14.5%
Purchased Services
9.0%
Travel 2.1%

8
ADVANCEMENT Fiscal year 2015 was a strong fundraising year for Tufts. University leadership, volunteer leadership, and the University’s Advancement division successfully raised $108 million in gifts and pledges, exceeding the goal of $100 million. Capital achievement totaled more than $89.7 million, a 20% increase over 2014. Annual giving totaled $18.5 million, a 7.5% increase over 2014. All schools surpassing their annual fundraising goals with the Friedman School/HNRCA up 40%; Tisch College up 29%; and the School of Dental Medicine up 17%. In addition, the Tufts Fund for Arts, Sciences & Engineering, the largest annual fund at the University, surpassed its $8.34 million goal to achieve $8.8 million, an 8.4% increase, and the highest since 2007. The Financial Aid Initiative (FAI) generated more than $25 million in endowed scholarship support in 2015, bringing the total support raised to $64 million. Originally intended to be a two year initiative in 2013 and 2014, FAI was extended an additional two years, through 2016, with a two-year $50 million goal. All schools participate and offer matching funds for gifts of $100,000 or more. Schools, Corporate and Foundation Relations, and Gift Planning The School of Arts and Sciences capital fundraising totaled $25.2 million, exceeded the goal of $22 million. Gifts this year include a junior professorship in the humanities and the arts, an endowed fellowship for international graduate students in economics, naming spaces in the CLIC, and FAI support. The School of Engineering launched a fundraising effort to honor the achievements of Linda M. Abriola, E18P, as she completed her term as dean this year. The Linda M. Abriola Graduate Fellowship Fund has drawn the support of the school’s Board of Advisors and, after matching by the FAI, reached $1.4 million. The Cummings School of Veterinary Medicine completed a campaign to fund the first phase of renovations for the Henry and Lois Foster Hospital for Small Animals, raising more than $8.6 million. Cummings raised more than $10 million in capital gifts, exceeding the $9.8 million goal. At the School of Dental Medicine alumni and friends propelled the school past its $3.75 million capital goal to end the year with $4.8 million. Notable achievements include helping the leadership of the alumni association close its first commitment to an endowed scholarship for students with financial need. The commitment will be matched and create, in perpetuity, a scholarship of $500,000. The Friedman School/HNRCA experienced one of the strongest fundraising years in history, second only to 2001 when the school received its $20 million naming gift. This year the Friedman/HNRCA team achieved $22 million. Annual fund achievement was more 40% more than last year, reaching the largest amount raised for the Friedman/HNRCA annual fund in its history. The School of Medicine completed the year with a significant increase (5%) in leadership donors (donors who gave $1,000 or more to the annual fund during the fiscal year) for the third year in a row. As of June 30, the school had the highest rate of donor retention (71%) than any other school at Tufts by nearly 10%. The school’s first annual fund challenge for the Fund for Tufts Medicine Scholarship (500 gifts for $50,000) met and exceeded its goal with 538 gifts. This effort in itself led to a 60% increase in revenue and a 52% increase in number of gifts for that allocation in this fiscal year. Capital achievement exceeded $14 million and annual fund gifts totaled $2.4 million. The Fletcher School eclipsed its capital goal of $4.5 million raising $4.8 million and generating nearly $1.6 million in annual fund donations, the highest annual fund achievement to date. The school also achieved significant growth in unrestricted giving, reversing a downward trend.
108
0
20
40
60
80
100
120
2011 2012 2013 2014 2015
Achievement (in millions)

9
18.5
12 13 14 15 16 17 18 19
2011
2012
2013
2014
2015
Annual Giving (in millions)
Tisch College donors raised the bar for philanthropy this year, contributing $2.3 million in capital gifts and more than $583,000 to the annual fund. Donors also came out in to support the new Tufts 1+4 Bridge-Year Service Learning Program. Fifteen students will be going to Spain, Nicaragua, and Brazil, 11 of which will receive full financial aid, successfully making this transformative life experience accessible to all students who are interested. Corporate and Foundation Relations achievement totaled $44.5 million, excluding family foundations, 48% greater than the $30 million goal and the largest corporate and foundation achievement for Tufts in the past decade. This total reflects robust foundation support of programs at all Tufts schools, particularly at the Friedman School, Cummings School, and Arts and Sciences, as well as significantly increased corporate support at the School of Engineering and the School of Dental Medicine. Gift Planning raised $21 million in new achievement this year, surpassing a $20 million goal. Highlights include a $7 million commitment from the estate of Mathew Ross for the School of Medicine.
Alumni Engagement Tufts’ largest reunion, Alumni Weekend, drew more than 2,200 undergraduate alumni and friends, and included a sold-out Tufts Night at Pops at Symphony Hall, a first-ever 65th Class Reunion, and capacity crowds for all seven Super Seminars. The Back to the Hill: Young Alumni Reunion weekend had its second highest attendance, with more than 570 graduates returning to campus. University Advancement implemented a collaborative initiative to enhance the reunion fundraising efforts for our undergraduate alumni. This cross-team effort resulted in enhanced marketing of our Tufts Reunion Challenge, a robust relaunch of both the Alumni Weekend Awards and the Back to the Hill Awards, and more tailored direct marketing communication to all alumni in reunion years. The Tufts Travel-Learn Program had another best-ever year. With more than 320 travelers enjoying 30 trips to destinations on five different continents, the program generated the highest level of revenue since it began in 2000. This year Tufts energized the leadership phase of the next campaign with consultation dinners from October through March in San Francisco, Los Angeles, Chicago, London, New York, Washington, D.C., Miami, and Boston. Current and potential prospects were invited to hear President Monaco’s vision and share feedback about themes presented in the prospectus. In preparation for the campaign, campaign pyramids for all of the schools have been developed, illuminating new fundraising opportunities and providing critical data to help shape strategies for meeting campaign goals. This spring, Tufts commenced the project to replace the Harris Connect alumni online community with a suite of tools on the Salesforce platform. The project is on schedule to go live in the fall with a new alumni community, sophisticated email marketing capabilities, and an online event registration and management product.

10
STUDENT DEMAND AND QUALITY The University continues to experience strong student demand. For academic year 2015-16 the number of applicants totaled 19,062 and the freshman enrollment was 1,360. Tufts experienced a decrease in the number of applicants who were accepted (selectivity) and experienced an increase in the number of those accepted who matriculated (yield). The graph below shows these trends for the undergraduate population.
The quality of matriculating undergraduate students as measured by SAT (scholastic aptitude test) scores continues to be excellent. The mean combined SAT scores of Tufts’ entering classes reflect a trend of continuing student quality and mirror highly selective institutions.
0%
10%
20%
30%
40%
50%
14,000
15,000
16,000
17,000
18,000
19,000
20,000
2011-12 2012-13 2013-14 2014-15 2015-16
Undergraduate Student Demand
Applicants Selectivity (%) Yield (%)
1350
1400
1450
2011-12 2012-13 2013-14 2014-15 2015-16
Mean Combined SAT Scores (Fall Freshman Class)

11
TUFTS UNIVERSITY 2015 ENDOWMENT AND INVESTMENT REPORT
Global equity prices remained strong in the 12 months ended 6/30/2015, but as divergences began to appear in the actions of central banks across the globe, the dollar strengthened dramatically. While this creates opportunity, it also introduces volatility for a globally diversified portfolio. Commodities, and in particular oil, began their downward march in price towards the end of calendar 2014, indicating that cracks may be appearing in the global growth that has fueled the last few years’ strong returns. The University’s long term investment assets at the end of FY 2015 totaled $2.1 billion, of which the majority are endowment assets. These assets belong both to funds established by individual donors, with each fund supporting a specific purpose within each of the University’s schools, and to funds designated as unrestricted by the Board of Trustees. Endowment value at June 30, 2015 was $1.6 billion. The remainder are funds earmarked for operating and capital purposes.
The assets in the funds are invested in a variety of instruments including life income trusts, separately managed accounts, and the Omidyar Tufts Microfinance Fund. This fund’s charter is to invest exclusively in microfinance institutions in developing countries. Investment Objectives and Strategy The largest proportion of the long term investment assets is invested in the Total Return Pool, or TRP. Assets in the pool at June 30 2015 were just over $1.7 billion, of which $1.4 billion belonged to the endowment and the balance to long term investments. The investment objective of this pool is to achieve a long term rate of return that provides both current support to the purposes specified by donors, as well as keep up with inflation to insure a steady level of support (“intergenerational equity”) in the future.

12
Each year the Investment Subcommittee of the Board of Trustees reviews the strategy in light of Tufts’ investment objectives and constraints, to insure that the future returns of the portfolio can be expected to meet the target rate of return, while the Administration and Finance Committee insures that the level of spending from endowment resources is appropriate under current circumstances. With expectations for lower future returns, the Committee continues to carefully consider the parameters for determining endowment spending.
The Investment Subcommittee’s process gives rise to two benchmarks against which performance is measured. The first is a broad market benchmark of 70% global equity and 30% US bonds. The second is a diversified benchmark that includes most of the asset types in which the portfolio invests. Both benchmarks were slightly positive for the year, a reflection of some of the stresses noted above. Performance The performance of the assets in the Total Return Pool continues to exceed previous highs with both the compounded three and five year returns exceeding 9%. However the dollar value of the Pool has declined as distributions for support of the university have outpaced contributions. As noted above, the 70/30 benchmark produced a return of 1.1% for the year vs. 2.4% for the diversified Evaluation Benchmark, with real estate returns outpacing all other asset classes. The actively managed portfolio added 117 basis points of value, bringing the total net return for the year to 3.5%.

PricewaterhouseCoopers LLP, 101 Seaport Boulevard, Suite 500, Boston, MA 02210T: (617) 530 5000, F: (617) 530 5001, www.pwc.com/us
Independent Auditor's Report
To the Board of Trustees of Tufts University
We have audited the accompanying consolidated financial statements of Tufts University and itssubsidiaries (the “University”), which comprise the consolidated statement of financial position as of June30, 2015 and 2014, and the related consolidated statements of activities for the year ended June 30, 2015and the related cash flows for the years ended June 30, 2015 and 2014.
Management's Responsibility for the Consolidated Financial Statements
Management is responsible for the preparation and fair presentation of the consolidated financialstatements in accordance with accounting principles generally accepted in the United States of America;this includes the design, implementation, and maintenance of internal control relevant to the preparationand fair presentation of consolidated financial statements that are free from material misstatement,whether due to fraud or error.
Auditor's Responsibility
Our responsibility is to express an opinion on the consolidated financial statements based on our audits.We conducted our audits in accordance with auditing standards generally accepted in the United States ofAmerica. Those standards require that we plan and perform the audit to obtain reasonable assuranceabout whether the consolidated financial statements are free from material misstatement.
An audit involves performing procedures to obtain audit evidence about the amounts and disclosures inthe consolidated financial statements. The procedures selected depend on our judgment, including theassessment of the risks of material misstatement of the consolidated financial statements, whether due tofraud or error. In making those risk assessments, we consider internal control relevant to the University'spreparation and fair presentation of the consolidated financial statements in order to design auditprocedures that are appropriate in the circumstances, but not for the purpose of expressing an opinion onthe effectiveness of the University's internal control. Accordingly, we express no such opinion. An auditalso includes evaluating the appropriateness of accounting policies used and the reasonableness ofsignificant accounting estimates made by management, as well as evaluating the overall presentation ofthe consolidated financial statements. We believe that the audit evidence we have obtained is sufficientand appropriate to provide a basis for our audit opinion.
Opinion
In our opinion, the consolidated financial statements referred to above present fairly, in all materialrespects, the financial position of the University and its subsidiaries as of June 30, 2015 and 2014, and thechanges in their net assets for the year ended June 30, 2015 and their cash flows for the years ended June30, 2015 and 2014 in accordance with accounting principles generally accepted in the United States ofAmerica.
Other Matter
We have previously audited the University’s 2014 financial statements, and we expressed an unmodifiedaudit opinion on those audited financial statements in our report dated November 7, 2014. In our opinion,the summarized comparative information presented herein as of and for the year ended June 30, 2014 isconsistent, in all material respects, with the audited financial statements from which it has been derived.
November 6, 2015

14
TUFTS UNIVERSITY
AS OF JUNE 30, 2015 AND JUNE 30, 2014 (in thousands)
2015 2014
ASSETS
Cash and cash equivalents 62,244$ 76,201$ Receivables and other assets, net 43,940 36,867 Receivables for investments purchased, net 14,588 6,360 Contributions receivable, net 30,273 33,708 Student loans receivable, net 50,150 51,632 Investments 2,107,973 2,131,765 Land, buildings, and equipment, net 870,270 833,636
TOTAL ASSETS 3,179,438$ 3,170,169$
LIABILITIES AND NET ASSETS
LIABILITIES: Accounts payable and accrued expenses 152,687$ 135,837$ Deferred revenue and deposits 52,645 49,258 Bonds and notes payable 648,511 633,460 Interest rate agreements 62,694 56,249 Government advances for student loans 27,805 27,355
Total liabilities 944,342 902,159
NET ASSETS: Unrestricted 1,188,962 1,202,485 Temporarily restricted 459,067 496,780 Permanently restricted 587,067 568,745
Total net assets 2,235,096 2,268,010
TOTAL LIABILITIES AND NET ASSETS 3,179,438$ 3,170,169$
The accompanying notes are an integral part of these consolidated financial statements.
CONSOLIDATED STATEMENTS OF FINANCIAL POSITION

15
TUFTS UNIVERSITY
CONSOLIDATED STATEMENTS OF ACTIVITIES
FOR THE YEAR ENDED JUNE 30, 2015, WITH SUMMARIZED INFORMATION FOR THE YEAR ENDED JUNE 30, 2014 (in thousands)
Temporarily PermanentlyUnrestricted Restricted Restricted 2015 2014
OPERATIONS: REVENUE: Tuition and fees 471,029$ -$ -$ 471,029$ 450,951$ Less scholarships and fellowships (130,031) - - (130,031) (121,999) Tuition and fees, net 340,998 - - 340,998 328,952 Government grants and contracts 138,479 - - 138,479 134,622 Clinical and other educational activities 114,378 - - 114,378 116,070 Auxiliary enterprises 55,202 - - 55,202 54,222 Contributions and grants 51,460 11,305 - 62,765 59,879 Investment return utilized 91,899 7,293 - 99,192 94,334 Net assets released from restrictions 21,044 (21,044) - - -
Total revenue 813,460 (2,446) - 811,014 788,079
EXPENSES: Salaries and wages 383,925 - - 383,925 373,635 Benefits 91,127 - - 91,127 83,119 Materials, supplies and other 118,069 - - 118,069 122,758 Purchased services 73,092 - - 73,092 67,353 Facility and maintenance costs 52,394 - - 52,394 48,724 Depreciation 49,974 - - 49,974 46,335 Interest 26,964 - - 26,964 28,028 Travel 16,793 - - 16,793 17,822
Total expenses 812,338 - - 812,338 787,774
INCREASE (DECREASE) IN NET ASSETS FROM OPERATING ACTIVITIES 1,122 (2,446) - (1,324) 305
NONOPERATING ACTIVITIES: Investment return reinvested, net of utilized 2,734 (37,256) 702 (33,820) 143,693 Contributions and grants 4,141 4,844 17,620 26,605 48,550 Net assets released from restrictions for capital and other nonoperating purposes 2,855 (2,855) - - - Net unrealized (loss) on interest rate agreements (6,445) - - (6,445) (4,740) Change in funded status of postretirement health care plan (7,105) - - (7,105) 1,361 Loss on defeasance of debt (9,912) - - (9,912) - Other nonoperating activities (913) - - (913) 2,190 (DECREASE) INCREASE IN NET ASSETS FROM NONOPERATING ACTIVITIES (14,645) (35,267) 18,322 (31,590) 191,054
(DECREASE) INCREASE IN NET ASSETS (13,523) (37,713) 18,322 (32,914) 191,359
NET ASSETS—Beginning of year 1,202,485 496,780 568,745 2,268,010 2,076,651
NET ASSETS—End of year 1,188,962$ 459,067$ 587,067$ 2,235,096$ 2,268,010$
Total
The accompanying notes are an integral part of these consolidated financial statements.
16
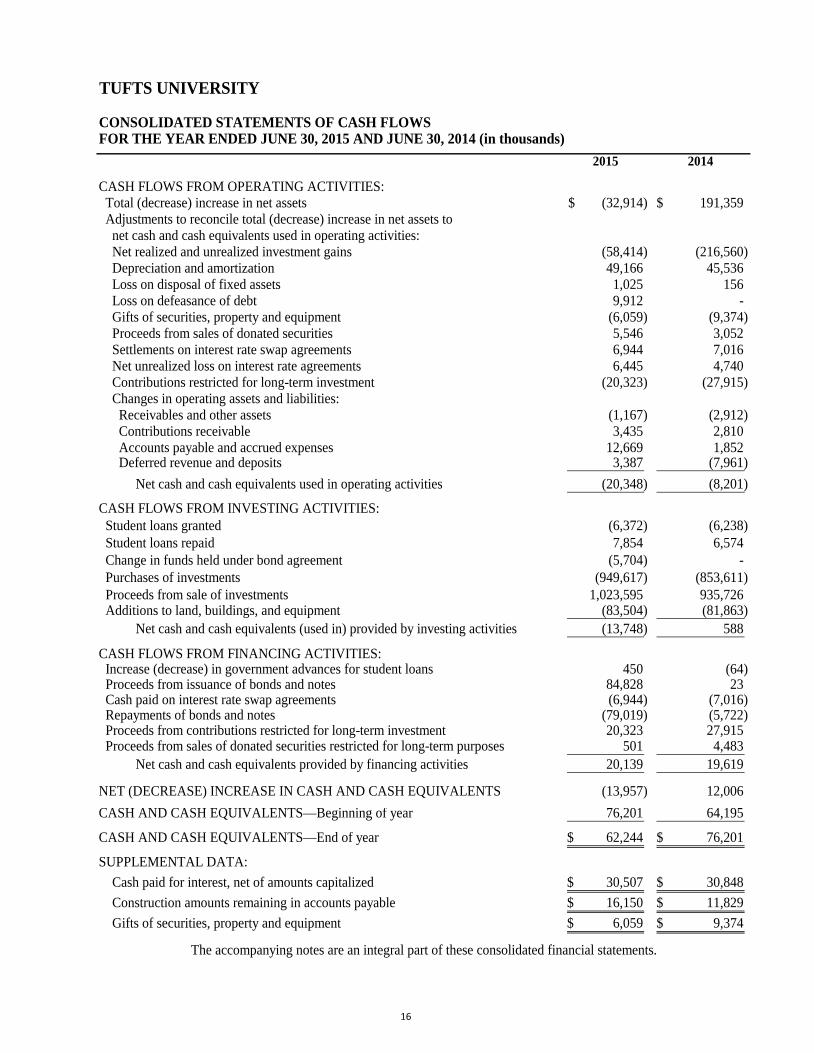
TUFTS UNIVERSITY
CONSOLIDATED STATEMENTS OF CASH FLOWSFOR THE YEAR ENDED JUNE 30, 2015 AND JUNE 30, 2014 (in thousands)
2015 2014
CASH FLOWS FROM OPERATING ACTIVITIES: Total (decrease) increase in net assets (32,914)$ 191,359$ Adjustments to reconcile total (decrease) increase in net assets to net cash and cash equivalents used in operating activities: Net realized and unrealized investment gains (58,414) (216,560) Depreciation and amortization 49,166 45,536 Loss on disposal of fixed assets 1,025 156 Loss on defeasance of debt 9,912 - Gifts of securities, property and equipment (6,059) (9,374) Proceeds from sales of donated securities 5,546 3,052 Settlements on interest rate swap agreements 6,944 7,016 Net unrealized loss on interest rate agreements 6,445 4,740 Contributions restricted for long-term investment (20,323) (27,915) Changes in operating assets and liabilities: Receivables and other assets (1,167) (2,912) Contributions receivable 3,435 2,810 Accounts payable and accrued expenses 12,669 1,852 Deferred revenue and deposits 3,387 (7,961) Net cash and cash equivalents used in operating activities (20,348) (8,201)
CASH FLOWS FROM INVESTING ACTIVITIES: Student loans granted (6,372) (6,238) Student loans repaid 7,854 6,574 Change in funds held under bond agreement (5,704) - Purchases of investments (949,617) (853,611) Proceeds from sale of investments 1,023,595 935,726 Additions to land, buildings, and equipment (83,504) (81,863) Net cash and cash equivalents (used in) provided by investing activities (13,748) 588
CASH FLOWS FROM FINANCING ACTIVITIES: Increase (decrease) in government advances for student loans 450 (64) Proceeds from issuance of bonds and notes 84,828 23 Cash paid on interest rate swap agreements (6,944) (7,016) Repayments of bonds and notes (79,019) (5,722) Proceeds from contributions restricted for long-term investment 20,323 27,915 Proceeds from sales of donated securities restricted for long-term purposes 501 4,483 Net cash and cash equivalents provided by financing activities 20,139 19,619
NET (DECREASE) INCREASE IN CASH AND CASH EQUIVALENTS (13,957) 12,006 CASH AND CASH EQUIVALENTS—Beginning of year 76,201 64,195
CASH AND CASH EQUIVALENTS—End of year 62,244$ 76,201$
SUPPLEMENTAL DATA: Cash paid for interest, net of amounts capitalized 30,507$ 30,848$ Construction amounts remaining in accounts payable 16,150$ 11,829$ Gifts of securities, property and equipment 6,059$ 9,374$
The accompanying notes are an integral part of these consolidated financial statements.

17
TUFTS UNIVERSITY
NOTES TO CONSOLIDATED FINANCIAL STATEMENTS AS OF AND FOR THE YEARS ENDED JUNE 30, 2015 AND 2014
1. ORGANIZATION
Tufts University (the “University”), founded in 1852, is a not-for-profit institution committed to education and research. The University is a complex independent nonsectarian university, with approximately 10,500 students and three campuses in Boston, Medford/Somerville and Grafton, Massachusetts. The University provides degree programs at both undergraduate and graduate levels in a variety of liberal arts and professional areas. The University has been granted a tax-exemption as described in Section 501(c)(3) of the Internal Revenue Code (the “Code”) and is generally exempt from income taxes pursuant to Section 501(a) of the Code.
The following organizations are included in the consolidated financial statements of the University:
Walnut Hill Properties Corporation (“Walnut Hill”)—Walnut Hill is a not-for-profit corporation established by the University to own and manage certain investment and rental properties.
Tufts Veterinary Emergency Treatment & Specialties (“Tufts VETS”)—Tufts VETS is a not-for-profit corporation organized by the University to provide emergency and specialty veterinary services in a community environment. It provides postgraduate training in its emergency and critical care training program and training to veterinary students on elective rotations.
Tufts Media LLC (“Tufts Media”)—Tufts Media is a single member limited liability company created by the University to operate its consumer publishing and media capability.
JM Holding Corporation (“JM Holdings”)—JM Holdings is a for-profit development corporation created by the University to develop 106 acres designated for commercial use at the Cummings School of Veterinary Medicine. At this time, there is no development agreement.
Omidyar–Tufts Microfinance Fund (“Microfinance Fund”)—The Microfinance Fund was organized in October 2005 as a charitable trust to support, benefit and carry out the purposes of public charity beneficiaries, including the University, by engaging in two activities: promoting the relief of the poor and distressed through microfinance investments, and promoting education through grants. The capital assets of the Microfinance Fund were contributed by a third party and, according to the donor’s stipulation, are to be invested in microfinance-related ventures. The majority of the Microfinance Fund’s trustees are appointed by the University. In 2006, a $100 million contribution to establish the Microfinance Fund was recorded in temporarily restricted net assets.
The assets of any of the organizations included in the consolidated financial statements may not be available to meet the obligations of the other entities.
2. SUMMARY OF SIGNIFICANT ACCOUNTING POLICIES
Basis of Presentation—The accompanying consolidated financial statements have been prepared in accordance with accounting principles generally accepted in the United States of America on the accrual basis with net assets and revenues, expenses, gains and losses classified based on the existence or absence of donor-imposed restrictions. Accordingly, net assets of the University are classified and reported as follows:
Permanently Restricted—Net assets subject to donor-imposed stipulations that they be maintained in perpetuity by the University. Such net assets consist primarily of donor-restricted endowment funds.
Temporarily Restricted—Net assets subject to donor-imposed stipulations that may be satisfied by actions of the University that will expire with the passage of time or the occurrence of specific events.

18
Unrestricted—Net assets not subject to donor-imposed stipulations. Unrestricted net assets may be designated for specific purposes.
Consolidation—The consolidated financial statements include the accounts of the University and its wholly owned or controlled subsidiaries. Intercompany accounts and transactions have been eliminated.
Classifications—Expenses are reported as decreases in unrestricted net assets. Gains and losses on investments are reported as increases or decreases in unrestricted net assets unless their use is restricted by explicit donor stipulations or by law. Contributions and investment return for operating activities subject to donor-imposed stipulations not utilized in the current period are released from temporarily restricted net assets when spent and are reported as net assets released from restrictions under revenue from operating activities. Expirations of all other temporarily restricted net assets are reported in the nonoperating section of the statement of activities.
Contributions—Contributions, including unconditional promises to give, are recognized as revenue in the period received. Contributions restricted for the acquisition of land, buildings, and equipment are reported as increases in temporarily restricted net assets. These contributions are reclassified to unrestricted net assets as the funds are expended, or in the case of construction, when the related assets are placed in service. Promises to give subject to donor-imposed stipulations that the corpus be maintained in perpetuity are recognized as increases in permanently restricted net assets.
Conditional promises to give are not recognized until the conditions on which they depend are substantially met. Contributions of assets other than cash are reported at their estimated fair value at the date of gift. Pledges for contributions scheduled to be received after one year are discounted using factors that approximate the risk and the expected term of the promise to give. Amortization of the discount is recorded as additional contributions in the appropriate net asset class.
Investments—Investments are reported at fair value. Dividends, interest, gains and losses on investments are reported as increases or decreases:
• in permanently restricted net assets if the terms of the gift require that they be added to the principal of a permanent endowment or loan fund;
• in temporarily restricted net assets if the terms of the gift or relevant state law impose restrictions on the current use of the income or net gains. The University has relied on the Massachusetts Attorney General’s interpretation of relevant state law that unappropriated endowment gains should generally be classified as temporarily restricted; and
• in unrestricted net assets in all other cases.
Investments are comprised of the assets of the University’s endowment and nonendowment funds. The majority of these assets are invested in the University’s Total Return Pool. The Total Return Pool assets are owned by participating funds based on shares acquired by each fund when it entered the pool. The fair value of the pooled assets is determined each month and the resulting value per share is used to account for funds entering or leaving the pool. The University has established spending policies for endowment and nonendowment investments in the Total Return Pool as follows:
Endowment Spending Policy—The Board of Trustees determines the method to be used to appropriate endowment funds for expenditure. The objective of the policy is to ensure that endowment income available to support operations is stable and predictable, while at the same time increases over time to offset the effects of inflation. Endowment funds receive income distributions equal to the current spending level of all funds in the Total Return Pool. The targeted distribution is 5% of each fund’s market value, but may vary with market conditions. The dollar amount is then increased each year by 3-4%. The policy provides for management to adjust the spending rate as necessary if it does not remain within a range of 4.5% to 5.5% of the pool’s market value calculated as of December 31 of the previous year. In establishing this policy, the Board considered the expected long term rate of return on its endowment.
Nonendowment Spending Policy—The nonendowment investments in the Total Return Pool consist of operating and capital funds. These long-term funds, while invested in a similar manner as the endowment, are
19
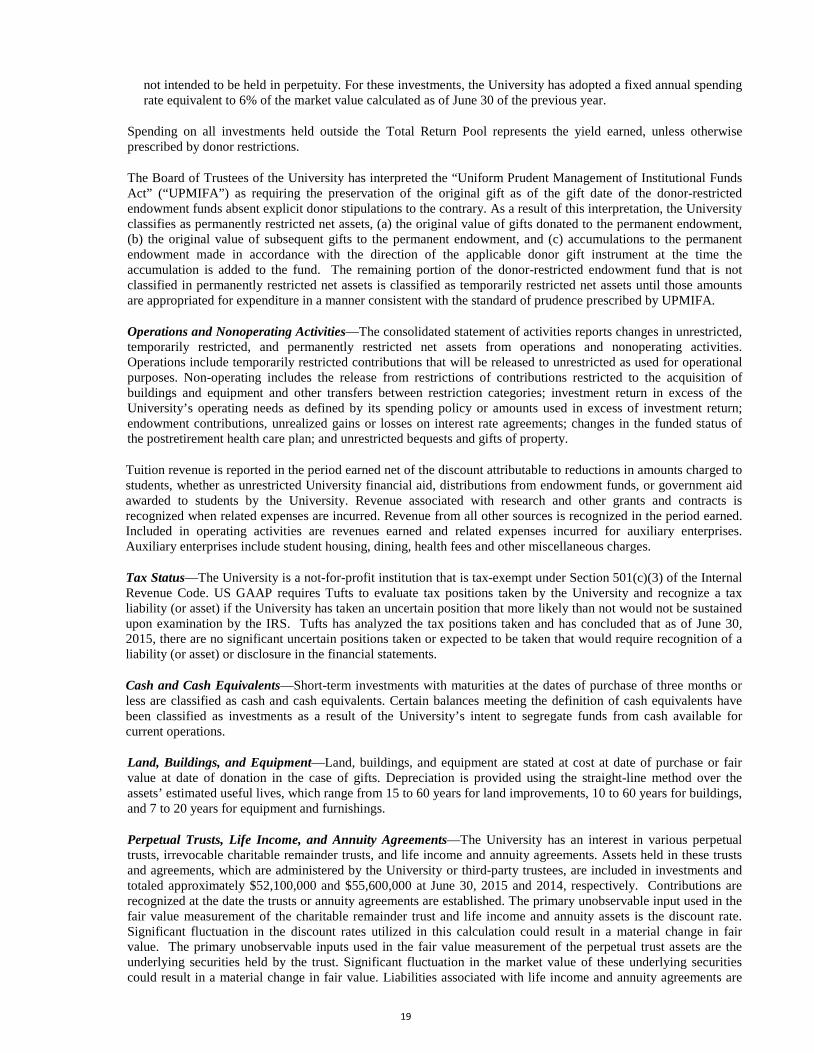
not intended to be held in perpetuity. For these investments, the University has adopted a fixed annual spending rate equivalent to 6% of the market value calculated as of June 30 of the previous year.
Spending on all investments held outside the Total Return Pool represents the yield earned, unless otherwise prescribed by donor restrictions.
The Board of Trustees of the University has interpreted the “Uniform Prudent Management of Institutional Funds Act” (“UPMIFA”) as requiring the preservation of the original gift as of the gift date of the donor-restricted endowment funds absent explicit donor stipulations to the contrary. As a result of this interpretation, the University classifies as permanently restricted net assets, (a) the original value of gifts donated to the permanent endowment, (b) the original value of subsequent gifts to the permanent endowment, and (c) accumulations to the permanent endowment made in accordance with the direction of the applicable donor gift instrument at the time the accumulation is added to the fund. The remaining portion of the donor-restricted endowment fund that is not classified in permanently restricted net assets is classified as temporarily restricted net assets until those amounts are appropriated for expenditure in a manner consistent with the standard of prudence prescribed by UPMIFA.
Operations and Nonoperating Activities—The consolidated statement of activities reports changes in unrestricted, temporarily restricted, and permanently restricted net assets from operations and nonoperating activities. Operations include temporarily restricted contributions that will be released to unrestricted as used for operational purposes. Non-operating includes the release from restrictions of contributions restricted to the acquisition of buildings and equipment and other transfers between restriction categories; investment return in excess of the University’s operating needs as defined by its spending policy or amounts used in excess of investment return; endowment contributions, unrealized gains or losses on interest rate agreements; changes in the funded status of the postretirement health care plan; and unrestricted bequests and gifts of property.
Tuition revenue is reported in the period earned net of the discount attributable to reductions in amounts charged to students, whether as unrestricted University financial aid, distributions from endowment funds, or government aid awarded to students by the University. Revenue associated with research and other grants and contracts is recognized when related expenses are incurred. Revenue from all other sources is recognized in the period earned. Included in operating activities are revenues earned and related expenses incurred for auxiliary enterprises. Auxiliary enterprises include student housing, dining, health fees and other miscellaneous charges.
Tax Status—The University is a not-for-profit institution that is tax-exempt under Section 501(c)(3) of the Internal Revenue Code. US GAAP requires Tufts to evaluate tax positions taken by the University and recognize a tax liability (or asset) if the University has taken an uncertain position that more likely than not would not be sustained upon examination by the IRS. Tufts has analyzed the tax positions taken and has concluded that as of June 30, 2015, there are no significant uncertain positions taken or expected to be taken that would require recognition of a liability (or asset) or disclosure in the financial statements.
Cash and Cash Equivalents—Short-term investments with maturities at the dates of purchase of three months or less are classified as cash and cash equivalents. Certain balances meeting the definition of cash equivalents have been classified as investments as a result of the University’s intent to segregate funds from cash available for current operations.
Land, Buildings, and Equipment—Land, buildings, and equipment are stated at cost at date of purchase or fair value at date of donation in the case of gifts. Depreciation is provided using the straight-line method over the assets’ estimated useful lives, which range from 15 to 60 years for land improvements, 10 to 60 years for buildings, and 7 to 20 years for equipment and furnishings.
Perpetual Trusts, Life Income, and Annuity Agreements—The University has an interest in various perpetual trusts, irrevocable charitable remainder trusts, and life income and annuity agreements. Assets held in these trusts and agreements, which are administered by the University or third-party trustees, are included in investments and totaled approximately $52,100,000 and $55,600,000 at June 30, 2015 and 2014, respectively. Contributions are recognized at the date the trusts or annuity agreements are established. The primary unobservable input used in the fair value measurement of the charitable remainder trust and life income and annuity assets is the discount rate. Significant fluctuation in the discount rates utilized in this calculation could result in a material change in fair value. The primary unobservable inputs used in the fair value measurement of the perpetual trust assets are the underlying securities held by the trust. Significant fluctuation in the market value of these underlying securities could result in a material change in fair value. Liabilities associated with life income and annuity agreements are

20
recorded at the present value of the estimated future payments to be made to the donors and/or other beneficiaries by the University. The liabilities associated with life income and annuity agreements are adjusted during the term of the life income agreement or annuity for changes in the value of the assets, accretion of the discount and other changes in the estimates of future payments. The liabilities are included in accounts payable and accrued expenses and totaled approximately $11,200,000 and $11,400,000 at June 30, 2015 and 2014, respectively.
Use of Estimates—The preparation of financial statements in conformity with accounting principles generally accepted in the United States of America requires management to make estimates and assumptions that affect the reported amounts of assets and liabilities and disclosure of contingent assets and liabilities at the date of the financial statements and the reported amounts of revenues and expenses during the reporting period. Actual results could differ from these estimates.
New Accounting Pronouncements—In May 2015, the FASB issued ASU 2015-07, Disclosures for Certain Entities That Calculate Net Asset Value per Share (or its Equivalent), which removes the requirement to categories within the fair value hierarchy all investments for which fair value is measured using net asset value per share as the practical expedient. This guidance is effective in fiscal year 2017, however, early adoption is permitted. The University has elected to adopt the guidance early, and the impact of the adoption of the new standard is limited to the notes to the financial statements.
In May 2014 the FASB issued ASU 2014-09, Revenue from Contracts with Customers, a principles-based standard to recognize revenue from customer contracts. ASU 2014-09 is effective for the University’s fiscal year 2019. The University is evaluating the impact that the ASU may have on its financial statements.
Reclassification—Certain June 30, 2014 balances and amounts previously reported have been reclassified to conform to the June 30, 2015 presentation.
Subsequent events—The University has evaluated the impact of subsequent events through November 6, 2015, representing the date the financial statements were issued. Prior Year Summarized Information—The consolidated statement of activities includes certain prior-year summarized comparative information in total, but not by net asset class. Such information does not include sufficient detail to constitute a presentation in conformity with generally accepted accounting principles. Accordingly, such information should be read in conjunction with the University’s consolidated statement of activities for the year ended June 30, 2014, from which the summarized information was derived.
3. RECEIVABLES AND OTHER ASSETS Receivables represent amounts due from students, grants and contracts, clinic billings, and other sources. Other assets include deferred charges, prepaid expenses, and inventories, as well as approximately $5,700,000 of restricted funds held under bond agreement at June 30, 2015. The components at June 30, 2015 and 2014 are as follows (in thousands):
2015 2014
Gross receivables 33,383$ 32,014$ Less allowance for uncollectible amounts (2,502) (2,246)
Receivables, net 30,881 29,768
Other assets 13,059 7,099
Total 43,940$ 36,867$

21
4. CONTRIBUTIONS RECEIVABLE
Contributions receivable at June 30, 2015 and 2014, which are recorded at fair value, consisted of the following (in thousands):
2015 2014Unconditional promises scheduled to be collected in: Less than one year 21,850$ 23,191$ One year to five years 11,022 13,787 More than five years 1,232 1,617 Gross contributions receivable 34,104 38,595
Less allowance for uncollectible amounts (3,035) (4,136) Less discount to present value (796) (751)
Total 30,273$ 33,708$
A review of pledges is periodically made with regard to collectability. As a result, the allowance for pledges that may not be collected is adjusted, and some pledges have been cancelled and are no longer recorded in the financial statements. The University’s indicative 1- to 10-year taxable unsecured borrowing rate is used to discount pledges receivable upon receipt. The discount was calculated using rates ranging from 1.09% to 3.60% for the years ending June 30, 2015 and 2014. The University’s pledges receivable have been categorized as Level 2 assets under the fair value hierarchy. Contributions receivable at June 30, 2015 and 2014 were intended for the following purposes (in thousands):
2015 2014Endowment for educational and general purposes 15,512$ 19,351$ Construction and modernization of plant 3,304 3,370 Support of current operations 11,457 10,987
Total 30,273$ 33,708$
5. STUDENT LOANS RECEIVABLE
Student loans receivables at June 30, 2015 and 2014 consisted of the following (in thousands):
2015 2014Student loans receivable 50,916$ 52,449$
Less allowance for uncollectible amounts (766) (817)
Total 50,150$ 51,632$
Loans receivable are principally amounts due from students under U.S. Government-sponsored loan programs, which are subject to significant restrictions. Generally, payment on student loans receivable commences upon graduation and can extend up to 20 years. Interest rates range from 2% to 18%.
The University assesses the adequacy of the allowance for doubtful accounts by evaluating the loan portfolio, including such factors as the differing economic risks associated with each loan category, the financial condition of specific borrowers, the economic environment in which the borrowers operate, the level of delinquent loans, and, where applicable, the existence of any guarantees or indemnifications. In addition to these factors, the University reviews the aging of the loans receivable and the default rate in comparison to prior years. The allowance is

22
adjusted based on these reviews. The University considers the allowance at June 30, 2015 and 2014 to be reasonable and adequate to absorb potential credit losses inherent in the loan portfolio.
6. INVESTMENTS AND FAIR VALUE MEASUREMENTS
The accounting standard for fair value measurement establishes a hierarchy of valuation inputs based on the extent to which the inputs are observable in the marketplace. Observable inputs reflect market data obtained from sources independent of the reporting entity and unobservable inputs reflect the entities’ own assumptions about how market participants would value an asset or liability based on the best information available. Valuation techniques used to measure fair value under the accounting standard must maximize the use of observable inputs and minimize the use of unobservable inputs. The accounting standard describes a fair value hierarchy based on three levels of inputs, of which the first two are considered observable and the last unobservable, that may be used to measure fair value.
The following describes the hierarchy of inputs used to measure fair value and the primary valuation methodologies used by the University for financial instruments measured at fair value on a recurring basis. The three levels of inputs are as follows:
• Level 1 - Quoted prices in active markets for identical assets or liabilities.
• Level 2 - Inputs other than Level 1 that are observable, either directly or indirectly, such as quoted prices for similar assets or liabilities; quoted prices in markets that are not active; or other inputs that are observable or can be corroborated by observable market data for substantially the same term of the assets or liabilities.
• Level 3 - Unobservable inputs that are supported by little or no market activity and that are significant to the fair value of the assets or liabilities.
A financial instrument's categorization within the valuation hierarchy is based upon the lowest level of input that is significant to the fair value measurement.
The University invests in alternative investments, consisting of hedge funds, private equities, real estate, natural resources and commingled public equity funds through various limited partnerships and similar vehicles. Alternative investments utilize a variety of investment strategies incorporating marketable securities and, in some cases, derivative instruments, all of which are reported at fair value or its equivalent as estimated by management using values provided by external investment managers. Hedge funds consist of limited partnership investments in stocks, bonds, commodities, currencies, derivatives and other instruments and often use non-traditional portfolio management techniques including shorting, leveraging, arbitrage and swaps. Commingled public equity funds consist of investments in commingled investment products that invest in long positions of publicly traded equity. Private equity investments consist of long-term private investment securities. Real estate consists of investments in privately held and publicly traded REITs and other privately held entities. Natural resources consist of private investments. Estimates of fair value may differ significantly from values that would have been used had a ready market for the investments existed. The University is obligated under certain limited partnership agreements and other alternative investment arrangements to advance additional funding periodically up to specified levels.
Investment fund managers may invest in derivatives, and the value of these positions is reflected in the NAV of the respective funds. Separately the University may employ derivatives to hedge its risks and to rebalance its market exposures. The University held three foreign exchange forward contracts, with a notional amount of $26,000,000 and a fair value of approximately $1,239,000 at June 30, 2015. The fair value of the derivatives are reflected as a level 2 asset. The University has entered into its exchange forward contracts with a single counterparty.

23
The following tables present the financial instruments carried at fair value as of June 30, 2015 and 2014, by the fair value hierarchy defined above (in thousands):
Assets as of June 30, 2015:
Quoted Prices in Active Markets (Level 1)
Significant Other
Observable Inputs
(Level 2)
Significant Unobservable
Inputs (Level 3)
Total Fair Value
Investments: Equity securities $ 57,648 $ - $ 323 57,971$ Fixed income securities 265,940 - 371 266,311 Hedge funds - - 2,686 2,686 Private equities - - 60,562 60,562 Real estate 3,890 - - 3,890 Natural resources 12,196 - - 12,196 Other - 21,825 9,860 31,685 Total Investments $ 339,674 $ 21,825 $ 73,802 435,301$ Other investments measured at net asset value (a) - - - 1,617,338
339,674 21,825 73,802 2,052,639 Liabilities:Interest rate swaps liability $ - 62,694$ $ - 62,694$
Assets as of June 30, 2014:
Quoted Prices in Active Markets (Level 1)
Significant Other
Observable Inputs
(Level 2)
Significant Unobservable
Inputs (Level 3)
Total Fair Value
Investments: Equity securities $ 27,384 $ - $ 323 27,707$ Fixed income securities 330,221 1,159 15,428 346,808 Hedge funds - - 2,686 2,686 Private equities - - 60,924 60,924 Real estate 15,306 - - 15,306 Natural resources 5,602 - - 5,602 Other - 6,702 9,234 15,936 Total Investments $ 378,513 $ 7,861 $ 88,595 474,969$ Other investments measured at net asset value (a) - - - 1,585,710
378,513 7,861 88,595 2,060,679 Liabilities:Interest rate swaps liability $ - 56,249$ $ - 56,249$
(a) In accordance with ASU 2015-07, certain investments that are measured at fair value using the net asset value per share (or its equivalent) practical expedient have not been classified in the fair value hierarchy. The fair value amounts presented in this table are intended to permit reconciliation of the fair value hierarchy to the amounts presented in the statement of financial position.
Excluded from the tables above, but included in total investments at June 30, 2015 and 2014, are cash and cash equivalents amounting to approximately $50,334,000 and $41,086,000 respectively. In addition, the tables above exclude $5,000,000 and $30,000,000 representing cash subscriptions made to two investments pending settlement at June 30, 2015 and 2014 respectively.

24
The value of certain alternative investments represents the ownership interest in the net asset value (“NAV”) of the respective partnership. The fair values (NAV) of the securities held by limited partnerships that do not have readily determinable fair values are determined by the general partner and are based on appraisals, or other estimates that require varying degrees of judgment. These values are agreed to by management of the University. If no public market exists for the investment securities, the fair value is determined by the general partner or management for securities held directly, taking into consideration, among other things, the cost of the securities, prices of recent significant placements of securities of the same issuer, and subsequent developments concerning the companies to which the securities relate. The University has performed significant due diligence around these investments to ensure NAV is an appropriate measure of fair value as of June 30. Interest rate swaps, held for investment purposes, are valued using both observable and unobservable inputs, such as quotations received from the counterparty, dealers or brokers, whenever available and considered reliable. In instances where models are used, the value of the interest rate swap depends upon the contractual terms of, and specific risks inherent in the instrument as well as the availability and reliability of observable inputs. Such inputs include market prices for reference securities, yield curves, credit curves, measures of volatility, prepayment rates, assumptions for nonperformance risk, and correlations of such inputs. The interest rate swap arrangements have inputs which can generally be corroborated by market data and are therefore classified within Level 2.
Beneficial and perpetual trusts held by third parties are valued at the present value of the future distributions expected to be received over the term of the agreement and are classified as Level 3.
The methods described above may produce a fair value calculation that may not be indicative of net realizable value or reflective of future fair values. Furthermore, while the University believes its valuation methods are appropriate and consistent with other market participants, the use of different methodologies or assumptions to determine the fair value of certain financial instruments could result in a different estimate of fair value at the reporting date.
The University also invests directly in private companies that are primarily valued using industry standard methodologies, as applicable. Management strives to corroborate information from third-party sources for relevance and accuracy; these valuations are subject to significant review and consideration by management. The valuation procedures performed on these assets are based on industry standard processes for each respective asset class. The inputs utilized in any valuation model may be significant and unobservable, and require a certain degree of judgment. Management examines market data and collaborates closely with industry experts to attempt to arrive at the best estimation of fair value for each respective asset. While the inputs described below represent the range of inputs utilized as of the measurement date, these inputs may change over time, which may have a material effect on the valuation of these types of investments in the future.
The following table presents additional information about valuation techniques and inputs used for the investments that are measured at fair value and categorized within Level 3 as of June 30, 2015 and June 30, 2014 (in thousands):
Fair Value atAsset Type Industry Valuation Approach Unobservable Inputs June 30, 2015
Private equities Banking Book value multiple determined using a blended approach for public market comparables, dividend discount model and recent market transaction
Recent market transaction for similar security (50%) - book value multiple of 1.22; DDM (25%) - book value multiple of 1.28; comparable public company analysis (25%) - book value multiple range of 0.47 to 4.94 further adjusted for a marketability discount of 17%.
40,822
Banking Market approach Recent market transaction 13,348
Financial services Option pricing model A set of 16 publically traded Mexican financial service companies was utilized to draw reference points to create an option pricing model.
5,642
Insurance Market approach Recent market transaction 750 60,562$

25
Fair Value atAsset Type Industry Valuation Approach Unobservable Inputs June 30, 2014
Fixed income securities Financial services Market approach Market Transaction 15,000$
Private equities Banking Book Value Multiple determined using a blended approach for public market comparables, dividend discount model and recent market transaction
Recent market transaction for similar security (50%) - book value multiple of 1.20; DDM (25%) - book value multiple of 1.26; comparable public company analysis (25%) - book value multiple range of 0.59 to 4.71 further adjusted for a marketability discount of 17%.
41,646
Banking Market approach Recent market transaction 10,902
Financial services Blend of an option pricing model and residual income model
A set of 16 publically taded Mexican financial service compaies was utilized to draw reference points to create an option pricing model and residual income model.
7,626
Insurance Market approach Recent market transaction 750 75,924$
Commingled Public
Fixed Private Hedge Equity Real Natural Redemption Terms as of June 30, 2015 Income Equities Funds Funds Estate Resources Total
Monthly, 2-120 days prior written notice $ 34,043 $ - $ 42,971 $ 329,118 $ - $ 6,990 $413,122 Quarterly, 30-90 days prior written notice - - 277,946 23,641 34,514 - 336,101 Semi-Annually, Annually, 30-90 days prior written notice - - 114,528 - - - 114,528 1-3 Years, 45-120 days prior written notice - 4,846 129,863 59,429 - - 194,138 1-7 Years (no terms) - 73,750 22,216 - 107,090 60,514 263,570 7+ Years (no terms) - 235,544 - - 26,838 10,936 273,318
Total $ 34,043 $314,140 $587,524 $412,188 $168,442 $78,440
$1,594,777
Level 1 securities
339,674 Other investments not subject to redemption
173,522
Total Investments
$2,107,973
Commingled Public
Fixed Private Hedge Equity Real Natural Redemption Terms as of June 30, 2014 Income Equities Funds Funds Estate Resources Total
Monthly, 2-120 days prior written notice $ 15,000 $ - $ 33,675 $370,599 $ - $ - $419,274 Quarterly, 30-90 days prior written notice - - 272,509 35,618 27,814 - 335,941 Semi-Annually, Annually, 30-90 days prior written notice - - 136,731 - - - 136,731 1-3 Years, 45-120 days prior written notice - 8,046 150,524 29,608 - - 188,178 1-7 Years (no terms) - 202,930 19,634 - 96,858 80,256 399,678 7+ Years (no terms) - 60,396 - - 37,822 9,954 108,172
Total $ 15,000 $271,372 $613,073 $435,825 $162,494 $90,210
$1,587,974
Level 1 securities
378,513 Other investments not subject to redemption
165,278
Total Investments
$2,131,765

26
The University had unfunded commitments of approximately $214,384,000 at June 30, 2015 which consisted of approximately $119,970,000 in private equities, $66,631,000 in real estate, $20,613,000 in natural resources and $7,170,000 in hedge funds, and can be called through 2020. The following tables include roll forwards of investments classified by the University within Level 3 as of June 30, 2015 and 2014.
Equity Fixed Hedge Private
Total
Securities Income Funds Equities Other Investments
Fair value, July 1, 2014 $ 323 $ 15,428 $ 2,686 $ 60,924 $ 9,234 $ 88,595
Transfers - - - - - -
Purchases - - - 3,925 - 3,925
Sales - (15,057) - - - (15,057)
Unrealized and realized gains (losses), net - - - (4,287) 626 (3,661)
Fair value, June 30, 2015 $ 323 $ 371 $ 2,686 $60,562 $ 9,860 $73,802
Equity Fixed Hedge Private
Total
Securities Income Funds Equities Other Investments
Fair value, July 1, 2013 $ 323 $ 15,457 $ 2,279 $ 65,145 $ 8,325 $ 91,529
Transfers - - - - - -
Purchases - - - - - -
Sales - (29) - - - (29)
Unrealized and realized gains (losses), net - - 407 (4,221) 909 (2,905)
Fair value, June 30, 2014 $ 323 $ 15,428 $ 2,686 $ 60,924 $9,234 $ 88,595
The total return on investments for the years ended June 30, 2015 and 2014 is as follows (in thousands):
7. LAND, BUILDINGS, AND EQUIPMENT
Land, buildings, and equipment at June 30, 2015 and 2014 consisted of the following (in thousands):
2015 2014Land and land improvements 47,875$ 48,605$ Buildings 1,201,923 1,150,387 Construction in progress 92,733 69,782 Equipment and furnishings 195,003 186,624
1,537,534 1,455,398
Less accumulated depreciation (667,264) (621,762)
Total 870,270$ 833,636$
2015 2014Dividends and interest 6,958$ 21,467$ Net realized and unrealized gains 58,414 216,560 Total return on investments 65,372 238,027 Investment return utilized (99,192) (94,334)
Investment return (utilized) reinvested (33,820)$ 143,693$
27
Depreciation expense charged to operations was approximately $49,974,000 and $46,335,000 in 2015 and 2014, respectively. Net interest cost capitalized in fiscal 2015 and 2014 was $2,205,000 and $1,982,000, respectively. Maintenance and repairs are expensed as incurred, and improvements are capitalized. When assets are retired or disposed of, the cost and accumulated depreciation thereon are removed from the accounts and gains or losses are included in other nonoperating activities on the statement of activities.
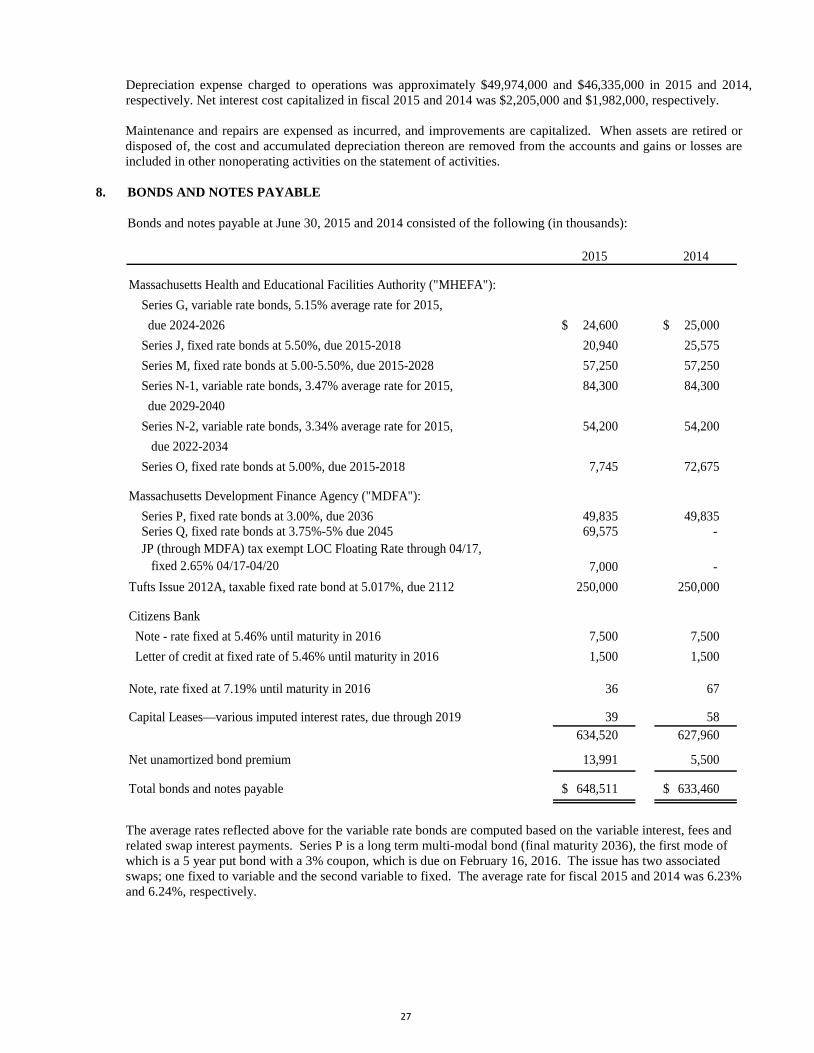
8. BONDS AND NOTES PAYABLE
Bonds and notes payable at June 30, 2015 and 2014 consisted of the following (in thousands):
2015 2014
Massachusetts Health and Educational Facilities Authority ("MHEFA"): Series G, variable rate bonds, 5.15% average rate for 2015, due 2024-2026 24,600$ 25,000$ Series J, fixed rate bonds at 5.50%, due 2015-2018 20,940 25,575 Series M, fixed rate bonds at 5.00-5.50%, due 2015-2028 57,250 57,250 Series N-1, variable rate bonds, 3.47% average rate for 2015, 84,300 84,300 due 2029-2040 Series N-2, variable rate bonds, 3.34% average rate for 2015, 54,200 54,200 due 2022-2034 Series O, fixed rate bonds at 5.00%, due 2015-2018 7,745 72,675
Massachusetts Development Finance Agency ("MDFA"): Series P, fixed rate bonds at 3.00%, due 2036 49,835 49,835 Series Q, fixed rate bonds at 3.75%-5% due 2045 69,575 - JP (through MDFA) tax exempt LOC Floating Rate through 04/17, fixed 2.65% 04/17-04/20 7,000 - Tufts Issue 2012A, taxable fixed rate bond at 5.017%, due 2112 250,000 250,000
Citizens Bank Note - rate fixed at 5.46% until maturity in 2016 7,500 7,500 Letter of credit at fixed rate of 5.46% until maturity in 2016 1,500 1,500
Note, rate fixed at 7.19% until maturity in 2016 36 67
Capital Leases—various imputed interest rates, due through 2019 39 58 634,520 627,960
Net unamortized bond premium 13,991 5,500
Total bonds and notes payable 648,511$ 633,460$
The average rates reflected above for the variable rate bonds are computed based on the variable interest, fees and related swap interest payments. Series P is a long term multi-modal bond (final maturity 2036), the first mode of which is a 5 year put bond with a 3% coupon, which is due on February 16, 2016. The issue has two associated swaps; one fixed to variable and the second variable to fixed. The average rate for fiscal 2015 and 2014 was 6.23% and 6.24%, respectively.

28
Scheduled aggregate principal repayments on bonds and notes payable at June 30, 2015 are as follows (in thousands):
Fiscal Year
Ending
Scheduled Principal Maturities
2016
$ 15,825 2017
7,484
2018
7,777 2019
8,304
2020
8,880 Thereafter
586,250
Total
$ 634,520 Included in the University’s debt is $163,100,000 of variable rate demand bonds (“VRDBs”). The University has entered into standby bond purchase agreements with a diverse group of financial institutions to secure bond repayment and interest obligations associated with its VRDBs. In fiscal year 2012, the University replaced the three standby bond purchase agreements with substantially similar agreements with other financial institutions. These agreements expire in October 2017 and March 2018. In the event a bond cannot be remarketed, the bond may be “put” to the standby bond purchase agreements providers, resulting in a loan to fund redemption of the bond. If it is assumed that outstanding bonds are put during fiscal year 2015, the maximum aggregate scheduled principal repayments under the VRDB-related standby bond purchase agreements would be as follows: $54,367,000 in 2016, $54,367,000 in 2017 and $54,366,000 in 2018.
The University’s debt is stated at cost. The fair value has been calculated by determining the net present value of future cash outlays using an appropriate interest rate based on the length of time to maturity and non-performance risk. The rates were based upon market conditions as of June 30, 2015 and 2014. The estimated fair values at June 30, 2015 and 2014 are approximately $659,098,000 and $659,944,000, respectively. The University determined the fair value of its existing fixed rate debt obligations based on trade data, broker/dealer quotes and other observable market data. The carrying amounts of its variable rate debt obligations approximately fair value because the obligations are currently callable at a price equal to the carrying amounts. The University considers this to be a Level 2 measurement.
In February 2015, the University refinanced $63,110,000 of Massachusetts Health and Educational Facilities Authority (MHEFA), Series O bonds into $63,670,000 Massachusetts Development Finance Agency Revenue Bonds (MDFA) Issue Series Q. As a result of this refinancing, the University incurred a charge of approximately $9,900,000, which is reflected as a non-operating item in the statement of activities. The proceeds of the Series Q refinanced bonds were deposited to a Refunding Trust fund dated February 2015. The refinanced bonds are no longer deemed to be outstanding for financial reporting purposes as such, neither the debt nor the trust assets are included in the consolidated statement of financial position. In addition to the Series Q refinance, the University issued $5,905,000 Massachusetts Development Finance Agency Revenue Bonds (MDFA), Series Q and obtained a new $28,000,000 tax exempt line of credit, the liability balance is $7,000,000 at June 30, 2015.
Interest Rate Agreements— The University has entered into derivative transactions for the purpose of reducing the impact of fluctuations in interest rates and reducing interest expense. The University has entered into fixed-to-floating and floating-to-fixed interest rate swaps and basis swaps.

29
The following summarizes the terms for each of the interest rate swap agreements as of June 30, 2015 and 2014 (in thousands).
Swap Agreements as of June 30, 2015
Swap Agreements as of June 30, 2014
Swaps Interest Rate Swap
Interest Rate Swap
Interest Rate Swap
Interest Rate Swap
Interest Rate Swap
Interest Rate Reverse Swap
Debt Hedged (Series P) (Series G & N-1) (Series N-1) (Series N-1) (Series N-2)
(Series P)
Notional Amount $50,500 $39,900 $40,000 $34,000 $54,000
$50,500
Termination Date
February 15, 2036
August 15, 2033
August 15, 2040
August 15, 2036
August 15, 2034
February 16, 2016
Fair Value June 30, 2014 ($20,543) ($10,329) ($6,633) ($9,211) ($11,222)
$1,689
The University reported the fair value of its interest rate swap agreements in the statement of financial position as a liability of $62,694,000 and $56,249,000 at June 30, 2015 and 2014, respectively. The change in fair market value of approximately $6,445,000 and $4,740,000 for the years ended June 30, 2015 and 2014, respectively, is included in the statement of activities as net unrealized loss on interest rate agreements.
The interest rate swap on Series N-1 for $40,000,000 was amended in November 2009 to change the rate paid by the counterparty to 69% of one month of LIBOR for three years. In November 2012, the rate reverted back to 64.4% of the five year USD-ISDA swap rate.
The estimated market value of the interest rate exchange agreements at June 30, 2015 and June 30, 2014, was computed using the net present value of fixed and floating future cash flows, with floating future cash flows estimated through the use of forward interest rate yield curves adjusted for non-performance risk. These financial instruments necessarily involve counterparty credit exposure. The counterparties for these interest rate exchange transactions are a diversified group of major financial institutions that meet the University’s criteria for financial stability and credit worthiness.
Swaps Interest Rate Swap
Interest Rate Swap
Interest Rate Swap
Interest Rate Swap
Interest Rate Swap
Interest Rate Reverse Swap
Debt Hedged (Series P) (Series G & N-1) (Series N-1) (Series N-1) (Series N-2)
(Series P)
Notional Amount $50,500 $39,900 $40,000 $34,000 $54,000
$50,500
Termination Date
February 15, 2036
August 15, 2033
August 15, 2040
August 15, 2036
August 15, 2034
February 16, 2016
Fair Value June 30, 2015
($21,460) ($10,429) ($8,522) ($10,568) ($12,604)
$889

30
9. NET ASSETS
Net assets at June 30, 2015 and 2014 consisted of the following (in thousands):
Temporarily Permanently 2015 2014Unrestricted Restricted Restricted Total Total
Endowment 654,621$ 400,762$ 566,634$ 1,622,017$ 1,625,057$ Invested in physical plant 329,485 - - 329,485 342,421 Operating 131,295 47,320 3 178,618 217,171 Building projects 53,415 10,935 17 64,367 41,354 Student loans 20,146 50 20,413 40,609 42,007
Total 1,188,962$ 459,067$ 587,067$ 2,235,096$ 2,268,010$
Endowment consists of resources that have been restricted by the donor, trust, split interest agreement, or designated by the Board of Trustees for investment to provide future resources to support the University’s activities. Temporarily restricted endowment includes unappropriated gains of approximately $226,352,000 and $262,080,000 in 2015 and 2014, respectively. Unrestricted operating includes funds that have been internally designated for use by various schools, departments, and programs throughout the University.
The University’s endowment consists of individual donor restricted endowment funds and board-designated endowment funds for a variety of purposes plus the following where the assets have been designated for endowment: pledges receivables, split interest agreements, and other net assets. The net assets associated with endowment funds, including funds designated by the Board of Trustees to function as endowments, are classified and reported based on the existence or absence of donor imposed restrictions. Board-designated endowment funds at June 30, 2015 total the unrestricted endowment amount in the above table.
Changes in endowment net assets for the years ended June 30, 2015 and June 30, 2014 are as follows (in thousands):
Temporarily Permanently 2015 2014Unrestricted Restricted Restricted Total Total
Endowment net assets, beginning of year
$ 637,952 $ 438,477 $ 548,628 $ 1,625,057 $ 1,472,355
Investment return:Investment income 2,090 2,646 - 4,736 18,891 Realized and unrealized gains (losses) 49,656 12,083 (137) 61,602 191,473
Total investment return 51,746 14,729 (137) 66,338 210,364
Contributions 756 190 17,423 18,369 27,446 Appropriation of endowment assets for expenditure (40,299) (59,211) - (99,510) (93,504)Other changes, net 4,466 6,577 720 11,763 8,396
Endowment net assets, end of year 654,621$ 400,762$ 566,634$ 1,622,017$ 1,625,057$
Other changes include additions or deductions to the endowment from net transfers resulting from changes in donor restrictions or University designations.

31
The temporarily restricted endowment funds consist of the following components (in thousands): 2015 2014 Subject to time restriction $111,127 $112,766 Restricted for program support 289,635 325,711 Total endowment assets classified as temporarily restricted net assets $400,762 $438,477 The portion of perpetual endowment funds that is required to be retained (in thousands): 2015 2014 Restricted for scholarship support $262,461 $243,301 Restricted for faculty support 129,469 128,149 Restricted for program support 174,704 177,178 Total endowment assets classified as permanently restricted net assets $566,634 $548,628 Endowment Funds with Deficits From time to time, the fair value of assets associated with individual donor-restricted endowment funds may fall below the value of the initial and subsequent donor gift amounts. When donor endowment deficits exist, they are classified as a reduction of unrestricted net assets. Deficits of this nature reported in unrestricted net assets were approximately $86,000 and $82,000 as of June 30, 2015 and 2014, respectively. These deficits resulted from market losses.
10. FUNCTIONAL CLASSIFICATION OF EXPENSES
The University reports operating expenses in its consolidated statement of activities by natural classification. Operating expenses by functional category for the years ended June 30, 2015 and 2014 consisted of the following (in thousands):
2015 2014
Instruction 249,038$ 238,766$ Sponsored programs 152,884 150,696 Clinical and other educational activities 141,575 137,045 Academic and student services 97,284 96,633 Auxiliary enterprises 59,453 57,188 Institutional support 112,104 107,446
Total expenses 812,338$ 787,774$
Interest, depreciation, operations, and maintenance expenses have been allocated to functional expense classifications based on square footage utilized.
11. BENEFIT PLANS
Defined Contribution Plan—The University sponsors a defined contribution retirement plan under Section 401(a) of the Code, which is available to eligible faculty and administrative staff. All retirement benefits are funded by the University and are subject to a vesting schedule. The University’s contributions to the plan amounted to approximately $27,620,000 and $26,601,000 in 2015 and 2014, respectively.
The University also offers a supplemental retirement plan under Section 403(b) of the Code, which is fully funded by voluntary employee contributions.
Deferred Compensation Plans—The University maintains two separate plans under Section 457(b) of the Code for eligible officers, faculty and administrative staff. The University funded the Officers’ Plan with approximately $102,355 and $98,300 in 2015 and 2014, respectively. Under the terms of the Faculty and Administrative Staff

32
Plan, no contributions are made by the University but are fully funded by voluntary employee contributions. The assets and related liabilities of these plans are recorded in investments and accrued liabilities in the consolidated financial statements and total approximately $14,475,000 and $12,811,000 in 2015 and 2014, respectively. The University also maintains a plan under Section 457(b) of the Code for eligible faculty and administrative staff that was closed to future participants in 1989. The University funded this plan with approximately $6,300 and $4,000 in 2015 and 2014, respectively. The investment assets and related liabilities of these plans, which total approximately $4,964,000 and $5,471,000 in 2015 and 2014, respectively, are recorded in investments and accrued liabilities in the consolidated financial statements of financial position.
Health and Welfare Benefit Plan—The University provides postretirement health care benefits to eligible retired employees and their eligible spouses. Retirees share in the cost of their health care benefits through co-payments and deductibles related to years of service and date of retirement. Employees who were hired after December 31, 1993, must pay for the entire cost of their benefit when they retire. The University established a trust to fund the postretirement health care benefits for most of the eligible employees. The trust qualifies as a “voluntary employees beneficiary association” (“VEBA”) under the provisions of Section 501(c)(9) of the Code in order that the trust be exempt from certain taxes.
Changes in the University’s postretirement health care benefit obligation for the years ended June 30, 2015 and 2014 are as follows (in thousands):
2015 2014
Benefit obligation—Beginning of year 34,837$ 33,225$ Service cost 449 425 Interest cost 1,261 1,313 Benefits paid (4,197) (3,735) Participants’ contributions 2,375 2,040 Actuarial loss 4,840 1,569
Benefit obligation—end of year 39,565$ 34,837$
The funded status of the University’s postretirement health care plan and the amounts recognized in the consolidated statements of financial position at June 30, 2015 and 2014 are as follows (in thousands):
2015 2014
Fair value of plan assets—beginning of year $ 34,803 $ 31,226
Actual return on plan assets 423 5,210
Additional employer contributions to VEBA - 45
Employer contributions for key employees 8 17
Plan participant contributions 2,375 2,040
Benefits paid (4,197) (3,735)
Fair value of plan assets—end of year $ 33,412 $ 34,803
Funded Status $ (6,153) $ (34)

33
Amounts recognized in the Statement of Financial Position (in thousands):
2015 2014
Accounts payable and accrued expenses (6,153)$ (34)$ Net amount recognized in the statement of financial position (6,153)$ (34)$
Amounts not yet reflected in net periodic benefit cost and included in unrestricted net assets (in thousands)
2015 2014
Unamortized actuarial loss 10,181 3,076 Change to unrestricted net assets 10,181$ 3,076$
Other changes recognized in unrestricted net assets in nonoperating activities (in thousands):2015 2014
Net loss (gain) 7,105$ (1,238)$ Amortization of loss - (123)
Total changes recognized in unrestricted net assets 7,105$ (1,361)$
Total changes recognized in net periodic cost and in nonoperating activities 6,127$ (1,903)$
The weighted-average assumptions to determine obligations are as follows:
2015 2014
Discount rate at end of year 3.75% 3.75%
The weighted-average assumptions to determine net periodic benefit cost are as follows:
2015 2014
Discount rate at beginning of year 3.75% 4.10% Expected return on plan assets during year 8.00% 8.00%
In fiscal year 2015, the University updated the actuarial assumption related to participant mortality from the RP-2000 tothe RP-2014 mortality table, which resulted in an actuarial loss in the 2015 obligation calculation.
There are no amounts expected to be recognized in the net periodic cost in the following year as there were no eventscreating any prior service cost and there is no unrecognized actuarial (gain)/loss over the 10% corridor this year.
The components of net periodic benefit cost (in thousands):2015 2014
Service cost 449$ 425$ Interest cost 1,261 1,313 Expected return on plan assets (2,688) (2,403) Amortization of net actuarial loss - 123
Net periodic benefit cost (978)$ (542)$

34
Health Care Cost Trend RateFiscal Year
Ending 2015Fiscal Year
Ending 2014
2016 7.50% 2015 7.50%
2017 6.50% 2016 6.50%
2018 5.50% 2017 5.50%
2019+ 4.50% 2018+ 4.50%
Impact of 1% increase in health care cost trend on Interest cost plus service cost during past year 188,000$ Accumulated postretirement benefit obligation 4,134,000$
Impact of 1% decrease in health care cost trend on
Interest cost plus service cost during past year (161,000)$ Accumulated postretirement benefit obligation (3,514,000)$
The expected future benefit payments net of employee contributions (in thousands):
Expected Net Expected Medicare
Benefit Payments Part D Subsidy Payments
Fiscal Year Ending in 2016 2,433 323 Fiscal Year Ending in 2017 2,590 344 Fiscal Year Ending in 2018 2,724 372 Fiscal Year Ending in 2019 2,801 394 Fiscal Year Ending in 2020 2,840 414 Fiscal Year Ending in 2021 through fiscal year ending 2025 13,215 2,482
The estimated University cash contribution for fiscal year 2016 is $0.
VEBA Trust Asset Allocation and Investment Strategy— The weighted-average investment allocation of plan assets by category is as follows:
2015 2014 Target Allocation
Equity securities 57% 58% 58%Debt securities 30% 29% 29%Real estate securities 13% 13% 13%
Total 100% 100% 100%
The Health and Welfare Benefit Plan fiduciaries set the investment policy and strategy for investment of plan assets, including selecting investment managers and setting long-term risk and return objectives. The asset allocations are broadly diversified among asset category and within each category, which lowers the expected volatility of the portfolio’s return and may protect against negative market environments.

35
To determine the expected long-term rate of return on plan assets, the University considers the target asset allocations, and the expected return on assets by category.
Equity securities primarily include mutual fund investments in large-cap and small-cap companies primarily located in the United States. Debt securities include high quality, investment grade and international bond funds. Real estate securities consist of mutual fund investments in domestic and international real estate investment trusts. The fair values of the University's post-retirement health care plan assets at June 30, 2015 and 2014 by asset category (in thousands):
VEBA Trust Investments at June 30, 2015 Level 1
Level 2
Level 3
Total
Equity securities $ 19,049 $ - $ - $ 19,049
Debt securities 9,729 - - 9,729 Real estate securities 4,225 - - 4,225
$ 33,003 $ - $ - $ 33,003
VEBA Trust Investments at June 30, 2014 Level 1
Level 2
Level 3
Total
Equity securities $ 20,016
$ -
$ -
$ 20,016 Debt securities 9,733
-
-
9,733
Real estate securities 4,528
-
-
4,528 $ 34,277
$ -
$ -
$ 34,277
At June 30, 2015 and 2014, the plan also held cash and cash equivalents amounting to approximately $410,000 and $525,000.
12. RELATED ORGANIZATIONS
Tufts Shared Services, Inc. (“TSS”)—The University and Tufts Medical Center, Inc. (“Medical Center”) jointly formed TSS, a not-for-profit service corporation, to provide the organization and facilities for coordinating certain education and health services activities. The administrative board of TSS includes equal representation from the University and the Medical Center. The cost of services provided by TSS to the University for the years ended June 30, 2015 and 2014 were approximately $5,649,000 and $5,690,000, respectively. The University’s 50% ownership investment in TSS has been recorded at approximately $9,860,000 and $9,234,000 at June 30, 2015 and 2014 using the equity method of accounting. The accounts of TSS are included in the accompanying consolidated financial statements of the University using the equity method of accounting, in investments and non-operating revenues.

36
13. CONTINGENCIES AND COMMITMENTS
Outstanding commitments on construction contracts amounted to approximately $28,760,000 at June 30, 2015.
There are currently several legal cases pending involving labor relations and other matters related to the normal operation of the University. The University believes that the outcome of these cases will have no significant effect on the financial position or results of operations of the University.
Operating Leases—The University has several noncancelable operating lease commitments at June 30, 2015, with terms in excess of one year for office space. Expenses associated with operating leases totaled approximately $6,050,000 and $5,730,000 for the years ended June 30, 2015 and 2014, respectively.
Future minimum lease payments under operating leases are as follows (in thousands):
Fiscal Year 2016 $ 5,800 Fiscal Year 2017 5,275 Fiscal Year 2018 4,496
Fiscal Year 2019 3,455 Fiscal Year 2020 3,028 Thereafter 2,134 Total $ 24,188

37
TUFTS UNIVERSITY
The Board of Trustees of Tufts College AS OF JUNE 30, 2015
OFFICERS OF THE CORPORATION Peter Dolan, Chair David Kahle, Vice President for Information Technology William O’Reilly Vice Chair Jonathan Tisch Vice Chair
and Chief Information Officer Christine C. Sanni, Vice President for Communication & Marketing
Anthony P. Monaco, President of the University David R. Harris, Provost and Senior Vice President
George A. Hibbard, Assistant Treasurer Paul Tringale; Secretary of the Corporation
Patricia Campbell, Executive Vice President Michael Baenen, Assistant Secretary of the Corporation Eric C. Johnson, Vice President for University Advancement Mary R. Jeka, Senior Vice President for University Relations PRESIDENTS EMERITI Julien Carter, Vice President for Human Resources John DiBiaggio (1992-2001) Thomas S. McGurty, Vice President for Finance and Treasurer Lawrence S. Bacow (2002-2012) Linda Snyder, Vice President for Operations
MEMBERS OF THE BOARD OF TRUSTEES TRUSTEES EMERITI (cont.) MEMBERS OF THE Peter Dolan, Chair William S. Cummings (1986-1996) ADMINISTRATION AND William O’Reilly Vice Chair Marilyn J. Ducksworth (1993-2003) FINANCE COMMITTEE Jonathan M. Tisch Vice Chair Steven B. Epstein (1999-2009) Steven Galbraith , Chair Anthony Monaco, President of the University Issam Fares (1992-2000) Daniel Doherty Thomas M. Alperin Nathan Gantcher (1983-2003) Laurie A. Gabriel John J. Bello Leslie H. Gelb (1988-1998) Michael S. Gordon Robert R. Bendetson Nelson S. Gifford (1978-1995) Bruce D. Grossman Betsy Busch, M.D. Brian M. Golden M.D. (1996-2006) Peter H. Kamin Elizabeth Cochary Gross Maurene L. Golden (1985-1996) Brian H. Kavoogian John H. de Jong Dr. Bernard M. Gordon (1996-2006) Jeffrey B. Kindler Jeannie Diefenderfer Joanne S. Gowa (2000-2010) Jeffrey M. Moslow Daniel Doherty Martin J. Granoff (1998-2008) Hugh R. Roome III E. Michael Fung Annetta Grisard-Schrafl (1997-2007) Andrew Safran Laurie A. Gabriel Sharon Mead Halverson (2004-2009) Tina Surh Steven M. Galbraith Dr.Bernard Harleston (2002-2007) James Wong Steven A. Goldstein Frederick H. Hauck (1988-2002) Anthony Monaco ex officio Michael S. Gordon Monte R. Haymon (1994-2004) Bruce D. Grossman Irwin M. Heller (1998-2008) MEMBERS OF THE AUDIT Diane S. Hessan Jane C.I. Hirsh (1999-2009) COMMITTEE Varney Hintlian Michael Jaharis (1993-2003) Brian H. Kavoogian, Chair Deborah Jospin Abby F. Kohnstamm (1999-2009) Ellen J. Kullman Peter H. Kamin Daniel A. Kraft (2002-2012) Jeffrey M. Moslow Brian H. Kavoogian John A. Krol (1992-2002) Kathleen O’Loughlin Jeffrey B. Kindler Robert Legvold (1991-2001) William O’Reilly Debra S. Knez Andrew N. Liveris (2006-2013) David Rone Ellen J. Kullman Bruce M. Male (2000-2006) Hugh R. Roome III Diana V. Lopez Ursula B. Marvin (1975-1985) Ioannis Miaoulis Karen B. Mavrides (2002-2007) Jeffrey Moslow Kathleen A. McCartney (2008-2013) Kathleen O’Loughlin David J. McGrath (1999-2009) David Rone Edward H. Merrin (1980-1991) Hugh R. Roome III Seth I. Merrin (2004-2014) Andrew Safran William G. Meserve (1979-1997) Janice Savin-Williams Joseph E. Neubauer (1986-2008) Neal Shapiro Thomas O'Brien (1978-1992)
Tina Surh Pierre M. Omidyar (2000-2010) Teri Coleman Volpert Karen M. Pritzker (2003-2013) Gloria White-Hammond Inez Smith Reid (1988-1998) James J. Wong Ruth L. Remis (1980-1990) TRUSTEES EMERITI Honorable William B Richardson (2003-2008) Dr. Peter Ackerman (1996-2006) Barbara A. Rockett (1988-2002) Shirley Aidekman-Kaye (1991-1999) William W. Sellers (1985-2000) Placido Arango (1987-1996) Alan D. Solomont (1999-2009) Fred G. Arrigg (1981-1991) Ira Stepanian (1981-1993) Joyce L. Barsam (1994-2004) James A. Stern (1982-2013) Chairman Emeritus Paul A. Brown (1980-1990) Edward M. Swan, Jr. (2002-2012) Edward H. Budd (199- 2003) Morris Tanenbaum (1977-1986) Matthew J. Burns (1973-1987) Alfred I. Tauber (2003-2013) John G.L. Cabot (1983-1993) William C. Thompson (2003-2013) Allan D. Callow (1971-1986) Judith l. Vaitukaitis (1998-2008) A. Dana Callow, Jr. (2002-2012) Ione D. Vargus (198- 1991) Kathryn C. Chenault (1998-2008) JoAnn Giffuni Wellner (1989-1999) Robert S. Cohen (1984-1993) Dr. Gordon S. Wood (1991-2002)

38