Table of Contents...The Carl Vinson Institute of Government previously completed fiscal viability...
206
Transcript of Table of Contents...The Carl Vinson Institute of Government previously completed fiscal viability...


1
Table of Contents Executive Summary ....................................................................................................................................... 4
Chapter 1. Background and Methodology .................................................................................................. 18
Introduction ................................................................................................................................................ 18
Framing of the Study ................................................................................................................................... 18
Report Format ............................................................................................................................................. 22
Background DeKalb County ........................................................................................................................ 23
Urbanization and Local Government Service Demand ....................................................................... 24
The Creation of New Cities ................................................................................................................. 27
Methodology ............................................................................................................................................... 27
Notes about the Data .................................................................................................................................. 29
Population Data .................................................................................................................................. 30
Property Tax Data ............................................................................................................................... 30
Road Mileage ...................................................................................................................................... 30
Revenues ............................................................................................................................................. 31
Expenditures ....................................................................................................................................... 32
Excluded Services ................................................................................................................................ 32
Chapter 2. Summary of Current Services and Revenues ............................................................................ 33
Services and Expenditures .......................................................................................................................... 33
Indirect Expenditures .......................................................................................................................... 34
Beautification – Fund 272, Account 5800 ........................................................................................... 36
Planning and Sustainability – Fund 272, Account 5100 and Fund 201, Account 5100 ....................... 40
Police Services – Fund 274, Account 4600 .......................................................................................... 43
Public Works Divisions of Roads and Drainage, and Transportation – Fund 271, Accounts 5700 and 5400 and Funds 211 and 212 .............................................................................................................. 62
Recreation, Parks, and Cultural Affairs – Fund 271, Account 6100 and Fund 207 ............................. 64
Traffic Court – Fund 272, Account 3700 ............................................................................................. 70
Capital and Grants ............................................................................................................................... 71
Summary of Operating Expenditures and Capital .............................................................................. 74
Grants .................................................................................................................................................. 75
Revenues ..................................................................................................................................................... 76
Revenue Fund Structure ..................................................................................................................... 76
Fund 271 – Designated Services Fund ................................................................................................ 78

2
Fund 272 – Unincorporated Fund ....................................................................................................... 79
Fund 274 – Police Services .................................................................................................................. 80
Fund 201 – Development Fund ........................................................................................................... 81
Revenue Collections ............................................................................................................................ 82
Chapter 3. Estimated Impact of Incorporation ........................................................................................... 84
Study Area 1 ................................................................................................................................................ 84
Beautification – Keep DeKalb Beautiful .............................................................................................. 84
Beautification – Code Compliance ...................................................................................................... 85
Planning and Sustainability – Business Licenses ................................................................................. 87
Planning and Sustainability – Current Planning .................................................................................. 88
Planning and Sustainability – Development ....................................................................................... 90
Recreation, Parks, and Cultural Affairs ............................................................................................... 92
Nondesignated Revenues ................................................................................................................... 97
Study Area 1: Summary of Impact ...................................................................................................... 98
Study Area 2 ................................................................................................................................................ 99
Beautification – Keep DeKalb Beautiful .............................................................................................. 99
Beautification – Code Compliance .................................................................................................... 100
Planning and Sustainability – Business Licenses ............................................................................... 101
Planning and Sustainability – Current Planning ................................................................................ 102
Planning and Sustainability – Development ..................................................................................... 104
Police ................................................................................................................................................. 106
Public Works – Roads and Drainage and Transportation ................................................................. 112
Recreation, Parks, and Cultural Affairs ............................................................................................. 115
State Court – Traffic Court ................................................................................................................ 119
Nondesignated Revenues ................................................................................................................. 121
Study Area 2: Summary of Impact .................................................................................................... 121
Study Area 3 .............................................................................................................................................. 122
Beautification – Keep DeKalb Beautiful ............................................................................................ 122
Beautification – Code Compliance .................................................................................................... 123
Planning and Sustainability – Business Licenses ............................................................................... 125
Planning and Sustainability – Current Planning ................................................................................ 126
Planning and Sustainability – Development ..................................................................................... 127
Police ................................................................................................................................................. 129

3
Public Works – Roads and Drainage and Transportation ................................................................. 134
Recreation, Parks, and Cultural Affairs ............................................................................................. 138
State Court – Traffic Court ................................................................................................................ 143
Nondesignated Revenues ................................................................................................................. 145
Study Area 3: Summary of Impact .................................................................................................... 145
Impact of incorporation on DeKalb County’s General Fund ..................................................................... 146
Administrative Indirect Cost Plan ..................................................................................................... 146
Debt ................................................................................................................................................... 149
Magistrate Court ............................................................................................................................... 150
Pension Liability ................................................................................................................................ 150
Chapter 4. Alternative Police Service Scenarios ....................................................................................... 153
Impact on County if Tucker and Stonecrest Provide Police Services ........................................................ 153
Scenario One: Tucker Provides Its Own Police Services ................................................................... 154
Scenario Two: Stonecrest Provides Its Own Police Services ............................................................. 161
Revenues and Expenditures .............................................................................................................. 162
Scenario Three: Both Tucker and Stonecrest provide their own police services ............................. 168
Complete Municipalization of Police Services .......................................................................................... 175
Impacts on Personnel and Budgets................................................................................................... 175
Impacts on Capital Use...................................................................................................................... 176
Impacts on Service Delivery .............................................................................................................. 177
Pensions ............................................................................................................................................ 179
Confiscated Assets ............................................................................................................................ 180
Capital Expenditures ......................................................................................................................... 181
Chapter 5. Annexation .............................................................................................................................. 182
Two Chamblee Annexations ..................................................................................................................... 183
Appendix A – Revenue Allocation Formulas ............................................................................................. 188
Appendix B. Revenue Definitions .............................................................................................................. 195
Appendix C. DeKalb County Police Department Grants, FYs 2014–2018 ................................................. 199
Appendix D. Expenditure Allocation Formulas for the Department of Recreation, Parks, and Cultural Affairs ........................................................................................................................................................ 204

4
Acronyms Used in This Study ACS American Community Survey (from the US Census Bureau) ADC Actuarially determined calculation AV Assessed value BOC Board of Commissioners CEO Chief executive officer CID Criminal Investigations Division DCPD DeKalb County Police Department DFACS Georgia Division of Family and Children Services DMA DeKalb Municipal Association DOJ US Department of Justice DUI Driving under the influence of alcohol or drugs E911 Enhanced 911 EHOST Equalized Homestead Optional Sales Tax FTE Full-time equivalent employee FMV Fair market value FY Fiscal year GDOT Georgia Department of Transportation GEMA Georgia Emergency Management Agency GIS Geographic information system GOHS Governor’s Office of Highway Safety HB House bill HIDTA High-intensity drug trafficking areas HOST Homestead Optional Sales Tax HVAC Heating, ventilation, and air-conditioning KDB Keep DeKalb Beautiful LMIG Local Maintenance and Improvement Grant NPDES National Pollutant Discharge Elimination System ROW Right-of-way STAR Strategic traffic accident reduction team STEP Strategic Traffic Enforcement Program SUV Sport utility vehicle SWAT Special weapons and tactics TAVT Title ad valorem tax TRP Therapeutic Recreation Program

5
Executive Summary
This research analyzes the potential financial impact on the DeKalb County government if further incorporation or annexation of unincorporated land within the county occurs.1 The analyses presented in this report were performed by the University of Georgia’s Carl Vinson Institute of Government research team beginning in the spring of 2019. To fully understand the results, it is highly recommended that the full report be read.
Chapter 1. Introduction and Study Background Chapter 1 provides a background on DeKalb County, its history of urbanization, and the recent establishment of new cities. Since the 1960s, DeKalb County has evolved into a suburban/urban county with a population of over 750,000. Along with this expanding population over the last several decades came the demand from residents for municipal-type services like water, sanitation, career fire, and parks and recreation. With the adoption of Amendment 19 to the state constitution, DeKalb, along with all other Georgia counties, gained the authority to provide these types of services. However, questions of equity also arose in regard to whether only those who received a municipal service from the county should be required to pay for it. In response, special tax districts were created to fund these services.
The governmental makeup of the county continues to evolve. Currently, the county has 13 municipalities, four of which have been created in recent years, with the latest being Stonecrest and Tucker in 2016. Approximately 55.7% of the population continues to live in the unincorporated area. The impetus for this report stems from legislative proposals to create two additional cities from the unincorporated area. One is the proposed City of Greenhaven, which would encompass nearly all the unincorporated area in the southern portion of the county. The other is the proposed City of Vista Grove, which would include much of the remaining unincorporated land south of I-85 and north of Highway 78.
Framing the Study To define the scope of work, the Carl Vinson Institute of Government sought guidance from a steering committee composed of representatives from the Georgia General Assembly, DeKalb County, and municipalities within the county.
1 For brevity, this report uses on the term, “incorporation” to consider both incorporation and annexation of unincorporated land. In either instance, the impact on the county would be the same.

6
Based on the steering committee’s recommendations, the Institute of Government developed the following research areas:
1. Measure the estimated financial impact on DeKalb County associated with additional incorporation and annexation of the unincorporated area. More specifically, this report estimates the impacts from a loss of unincorporated territory for three specific research areas (see the map below):
o Study Area 1: the land proposed to be incorporated as the City of Greenhaven o Study Area 2: the land proposed to incorporated as the City of Vista Grove o Study Area 3: all unincorporated land north of Highway 78, inclusive of Area 2
2. Estimate the financial impact on DeKalb County if the cities of Tucker and Stonecrest were to establish their own police departments rather than receive this service from DeKalb County and the potential impacts if DeKalb County no longer provided police services as a stand-alone department (i.e., only the DeKalb County sheriff would exist).
3. Evaluate the benefits and challenges associated with budget-neutral annexation.

7
Methodology The data used for this analysis came from DeKalb County, and the base year used to determine impact was fiscal year (FY) 2018 for revenues and expenditures.2 When possible, the research team geographically determined revenues and expenditures, such as the location of calls for police services. When the exact location of service effort could not be determined, revenues and expenditures were assigned using a metric considered to be the service’s primary revenue and cost driver, such as population or road miles. All the estimated revenue losses and expenditure savings for each service within each study area are summed to determine net estimated impact.
Prior studies were used to determine which services the county would no longer provide if a study area incorporated.3 The county departments and divisions that would no longer serve the study areas are as follows:
• Study Area 1: Keep DeKalb Beautiful; Code Compliance; Current Planning; Business Licenses; Development Services; and Recreation, Parks, and Cultural Affairs
• Study Area 2: Keep DeKalb Beautiful; Code Compliance; Current Planning; Business Licenses; Development Services; Police Services; Roads and Drainage; Transportation; Recreation, Parks, and Cultural Affairs; and Traffic Court
• Study Area 3: Keep DeKalb Beautiful; Code Compliance; Current Planning; Business Licenses; Development Services; Police Services; Roads and Drainage; Transportation; Recreation, Parks, and Cultural Affairs; and Traffic Court
The analyses in this report did not examine several revenues and services, including those considered countywide. The research team also excluded fire protection services and those services funded through proprietary funds, such as water and sewer.
Chapter 2. Summary of Current Services and Revenues Chapter 2 summarizes the DeKalb County departments and divisions under review for this report and describes their respective expenditures and revenues for FY 2018.
Summary Expenditures The analyses included the following costs: personnel services and employee benefits, purchased and contracted services, supplies, capital outlays, and interdepartmental charges.
The most significant interdepartmental charges were for indirect costs assessed by the county’s General Fund (for countywide revenues and expenditures). DeKalb County has implemented
2 DeKalb County’s fiscal year runs from January 1 through December 31. Prior year expenditures are only considered when creating an average annual expense for capital, which is based on data from FYs 2014–2018. 3 The Carl Vinson Institute of Government previously completed fiscal viability studies for potential incorporation on Areas 1 and 2. Because Study Area 3 includes Study Area 2, the research team assumed that the former area would no longer receive the same services from the county.

8
an indirect cost plan so that services outside the General Fund pay their fair share for the support services they receive — like human resources, information technology, and the county administrator’s time — and are funded through that countywide fund. The total amount of indirect charges assigned to the unincorporated services for this report totaled $17,452,758 in FY 2018.
Below are each service’s total FY 2018 expenditures and its metric. The total expenditures for all the various services equaled $168,582,201. Of this amount, $166,317,611 was for operating and an estimated $2,264,590 was for annual capital investment.
Beautification-Keep DeKalb Beautiful Expenditure: $5,911,210 Metric: Percentage of unincorporated center-lane miles in each study area Beautification-Code Compliance Expenditure: $4,025,208 Metric: Percentage of code compliance officers4 assigned to each study area Planning and Sustainability–Current Planning Expenditure: $1,520,252 Metric: Percentage of workload related to zoning or variance permits within each study area; for the one employee dedicated to historic preservation districts, percentage of time spent on each (There are two in the unincorporated area.) Planning and Sustainability–Business Licenses Expenditure: $755,541 Metric: Percentage of business license revenue from each study area; location of businesses are known; percentage of study area revenue applied to expenditures Planning and Sustainability–Development Services Expenditure: $6,287,283 Metric: Percentage of building permit revenue generated within each study area; location of permits is known; percentage of study area revenue applied to expenditures Police Services Expenditure: $102,873,192 Metric: Percentage of weighted service calls in the study area (Service area includes unincorporated, Tucker, and Stonecrest)
4 Excludes administrative employees

9
Public Works – Roads and Drainage and Transportation Expenditure: $22,039,306
Metric: Percentage of center-lane miles in the study area (Total center-lane miles includes unincorporated, Tucker, and Stonecrest) Recreation, Parks, and Cultural Affairs Expenditure: $19,843,066 Metric: Recreation Services – percentage of recreation participants in study area; parks maintenance – percentage of park acres in study area State Court – Traffic Court Expenditure: $5,327,143 Metric: Percentage of population in study area (Total population includes unincorporated, Tucker, and Stonecrest)
Summary of Revenues
Total revenues under review for FY 2018 equaled $180,271,523. Of this amount, 49.72% came from property taxes. When all taxes are considered (e.g., property, sales, excise, and motor vehicle), the percentage increases to 77.56%. Revenues were allocated to the study areas and assigned to various services based on a variety of metrics (see Appendix A for details). The table below shows the revenue amounts assigned to each service. “Nondesignated Revenues” are revenues that cannot be attributed to any one service, such as alcohol taxes, that were collected from the unincorporated area.
Revenues by Service, FY 2018 Unincorporated Service Total Revenue Keep DeKalb Beautiful $115,000 Code Compliance $962,144 Current Planning $90,486 Business Licenses $8,676,344 Development $7,844,099 Police Services $104,680,343 Roads and Drainage and Transportation $18,493,031 Recreation, Parks, and Cultural Affairs $19,880,689 Traffic Court $8,348,081 Nondesignated Revenues $11,181,306 Total FY 2018 $180,271,523

10
Chapter 3. Findings for the Study Areas Chapter 3 presents the estimated revenue losses, expenditures savings, and net dollar impact to the county if it were to no longer provide select municipal-type services in the three study areas. Results show that for each of the three study areas, the county would experience an estimated net loss with incorporation. The amount of net loss varies by study area, reflecting the expenditures required to perform different types of services (i.e., police versus planning), varying levels of demand, and the revenue generated from each area.
For each of the study areas, the first table shows the metrics applied for each of the services analyzed. Please note that for some services, more precise metrics may have been applied, such as estimating youth participants for summer camp expenditures. Therefore, the table below offers a general context for the estimated net fiscal impact presented in the table that follows it.
Study Area 1
Study Area 1 is the largest study area analyzed, both in terms of landmass and population.
Service Total Amount of Metric Study Area 1 Metric Allocation
Keep DeKalb Beautiful 1,221.2 center lane miles 75.48% of miles
Code Compliance 44 employees 37.01 employees (84.1%)
Business Licenses Revenue known by address 48.02% of revenue
Current Planning Zoning Variance / Administrative
91 applications 95 appeals
63.74% of application 21.05% of appeals
Development Services Revenue known by address 56.12% of permit revenue
Recreation, Parks, and Cultural Affairs Park Maintenance Recreation
6,042 park acres 719,585 participants
2,465.2 acres (40.8%) 304,772 participants (42.4%)
Using the metrics in the table above, the county is estimated to save $21,021,688 in reduced expenditures from no longer providing the defined set of services within Study Area 1. Even though the county experiences savings from no longer providing a few of the services analyzed, the county will experience an overall net revenue loss of $2,869,898 due to no longer receiving business license and nondesignated revenues.

11
Estimated Net Impact from Study Area 1 Incorporating
Service Revenues Expenditures Net Impact Keep DeKalb Beautiful $0 $4,275,079 $4,275,079 Code Compliance ($805,934) $3,394,636 $2,588,702 Business Licenses ($4,166,712) $362,840 ($3,803,872) Current Planning ($41,439) $633,881 $592,442 Development ($4,401,832) $3,528,423 ($873,409) Recreation, Parks, and Cultural Affairs ($7,791,247) $8,826,829 $1,035,582 Nondesignated Revenues ($6,684,122) $0 ($6,684,122) Total Study Area 1 ($23,891,573) $21,021,688 ($2,869,598)
Study Area 2
Study Area 2 is the smallest of the areas under review. The proposed City of Vista Grove is expected to provide a wide array of services if created, including police and roads and bridges. The metrics show that Study Area 2 has relatively less demand for police services and does not include a significant amount of county parkland.
Service Total Amount of Metric Study Area 2 Metric Allocation
Keep DeKalb Beautiful 1,221.2 center lane miles 14.6% of center lane miles
Code Compliance 44 employees 2.15 employees (4.9%)
Business Licenses Revenue known by address 23.31% of revenue
Current Planning Zoning Variance / Administrative
91 applications 95 appeals
18.7% of application 50.5% of appeals
Development Services Revenue known by address 13.01% of permit revenue
Police Services Uniform Criminal Investigations Special Operations – SWAT Special Operations – K-9 Special Operations – Aerial
303,661 weighted calls 126,527 weighted calls 55 incidents responded 137 incidents responded 420 incidents responded
8.37% of weighted calls 6.00% of incidents/calls 0.00% incidents 2.19% of incidents 0.95% of incidents
Roads and Drainage, Transportation Operations Street Lights Speed Humps
1,500.6 center lane miles1 Revenue known by address Revenue known by address
11.88% of center lane miles 11.00% of revenue 16.33% of revenue
Recreation, Parks, and Cultural Affairs Park Maintenance Recreation
6,042 park acres 719,585 participants
120.5 acres (1.99%) 0 participants (0.00%)
Traffic Court 480,023 pop. service area 12.73% of service area pop. 1. The Division of Roads and Drainage counts its total road miles in its service area as 1,744.2. The difference between two mileage counts may be due to roads and alleys not designated as county roads by Georgia DOT as well as the type of GIS “clipping” of road segments used to allocated roads to the study areas of interest.

12
Based on the percentage of services delivered, as expressed in the above table, the estimated savings to the county if Study Area 2 incorporated would be $14,418,317. However, due to reductions in revenues, the county would experience an estimated net loss of $17,552,832 annually. This is primarily due to the Study Area 2 no longer receiving services from the DeKalb County Police Department and the Department of Recreation, Parks, and Cultural Affairs. Interestingly, there is very little fiscal impact on the county from road maintenance, meaning the estimated levels of service as expressed through road mileage is nearly equivalent to the revenue generated from the area.
Estimated Net Impact from Study Area 2 Incorporating
Service Revenues Expenditures Net Impact Keep DeKalb Beautiful $0 $826,753 $826,753 Code Compliance ($47,583) $197,067 $149,484 Business Licenses ($2,022,633) $176,132 ($1,846,501) Current Planning ($29,014) $441,577 $412,563 Development ($1,020,830) $817,976 ($202,854) Police ($18,611,141) $7,599,432 ($11,011,709) Roads and Drainage and Transportation ($3,227,672) $3,231,217 $3,545
Recreation, Parks, and Cultural Affairs ($4,004,401) $450,018 ($3,554,383) Traffic Court ($1,062,399) $678,145 ($384,254) Nondesignated Revenues ($1,945,476) $0 ($1,945,476) Total Study Area 2 ($31,971,149) $14,418,317 ($17,552,832)

13
Study Area 3
By including all unincorporated land north of Hwy. 78, Study Area 3 incorporates Study Area 2 as well. The metric allocations for Study Area 3 reflect the larger land area and population.
Service Total Amount of Metric Study Area 3 Metric Allocation
Keep DeKalb Beautiful 1,221.2 center lane miles 20.72% of center lane miles
Code Compliance 44 employees 5.09 employees (11.57%)
Business Licenses Revenue known by address 33.76% of revenue
Current Planning Zoning Variance / Administrative
91 applications 95 appeals
28.6% of application 66.3% of appeals
Development Services Revenue known by address 19.8% of permit revenue
Police Services Uniform Criminal Investigations Special Operations – SWAT Special Operations – K-9 Special Operations – Aerial
303,661 weighted calls 126,527 weighted calls 55 incidents responded 137 incidents responded 420 incidents responded
12.99% of weighted calls 9.00% of weighted calls 1.82% incidents 2.92% of incidents 2.14% of incidents
Roads and Drainage, Transportation Operations Street Lights Speed Humps
1,500.6 center lane miles1 Revenue known by address Revenue known by address
16.86% of center lane miles 16.86% of revenue 27.37% of revenue
Recreation, Parks, and Cultural Affairs Park Maintenance Recreation
6,042 park acres 719,585 participants
346.6 acres (5.74%) 123,665 participants (17.19%)
Traffic Court 480,023 pop. service area 19.40% of service area pop.
If it incorporated, Study Area 3 would have the largest negative financial impact on the county, with a net revenue loss of $26,549,428. Like Study Area 2, the largest impacts would come from the county no longer providing police and parks and recreation services.

14
Estimated Net Impact from Study Area 3 Incorporating
Service Revenues Expenditures Net Impact Keep DeKalb Beautiful $0 $1,173,410 $1,173,410 Code Compliance ($111,295) $466,864 $355,569 Business Licenses ($2,929,284) $255,084 ($2,674,200) Current Planning ($40,206) $611,944 $571,738 Development ($1,551,381) $1,243,625 ($307,756) Police ($29,266,344) $11,792,327 ($17,474,017) Roads and Drainage and Transportation ($5,110,550) $4,660,690 ($449,860)
Recreation, Parks, and Cultural Affairs
($6,650,372) $2,437,782 ($4,212,590)
Traffic Court ($1,619,728) $1,033,466 ($586,262) Nondesignated Revenues ($2,945,460) $0 ($2,945,460) Total Study Area 3 ($50,224,620) $23,675,192 ($26,549,428)
Potential Impact on the General Fund
Beyond the direct financial impacts of no longer providing certain services, DeKalb County’s General Fund would also likely be impacted in four ways if any of the study areas were to incorporate and begin providing their own services.5
• Administrative Charge. With reductions in unincorporated services, the county would receive less funding through its administrative charges for countywide support services. To the extent the county could not decrease support service expenditures, e.g., personnel, proportionally to the reductions in transfers from departments serving only the unincorporated area, the General Fund may have to absorb the difference.
• Public Safety and the Judicial Facilities Authority Bond Debt. In FY 2018, the Police Department paid 49% of the debt payments for the Public Safety and Judicial Facility. To the extent this department has fewer personnel because of incorporations and thus needs less facility space, its payments would decrease (departmental payments are based on the square feet used). With less money coming from the DCPD, then the other departments using the facility, which includes those funded from the General Fund, may need to pay a higher price per square foot to make up for the lost revenue.
• Magistrate Court. Because the Magistrate Court hears code enforcement cases, incorporations that reduce code compliance services would also reduce the workload of the Magistrate Court.
• Pension Liability. DeKalb County provides a pension benefit to all its full-time employees who have vested. As of its 2018 actuarial valuation, the DeKalb County’s pension plan
5 DeKalb County’s General Fund is the accounting mechanism used to manage countywide financial resources.

15
has an unfunded liability of $1,082,200,800 and is funded at 54.27% of assets. Because pension benefits are considered a financial right, this liability to the county does not go away if any additional land is incorporated. The unfunded liability has increased over several years. There may be concerns over the fairness of making current unincorporated residents and businesses pay the full pension liability of county employees who served in areas (and created pension liabilities) that are now within cities.
Chapter 4. Other Police Provision Scenarios In Chapter 4, the research team analyzes the financial impact on the county using four different police service scenarios:
1. The City of Tucker begins providing its own police services
2. The City of Stonecrest begins providing its own police services
3. Both Tucker and Stonecrest begin providing their own police services
4. DeKalb County no longer provided police services.
For scenarios 1–3, the research team used the same methodology as that described in Chapter 3.
In FY 2018, Stonecrest had higher police service demand than Tucker, particularly for criminal investigations. The impact of this higher demand is reflected in the net cost savings of $2,783,806 the county would incur if Stonecrest provided its own police services. In contrast, the county is estimated to experience a net loss of revenue of approximately $3 million if only Tucker no longer receives police services from the county.
Note that in FY 2018, the county continued to receive insurance premium taxes based on a population that included Tucker and Stonecrest. For the calculation of impact to be fair, the estimated insurance premium revenues for the two cities are included as lost revenues in this analysis. Regardless of whether these cities provide their own police services in the future, the county will no longer receive their portion beginning in FY 2019.
Metrics for Police Service
Police Division/Unit Tucker Stonecrest Tucker and Stonecrest
Uniform (weighted calls) 8.44% 12.98% 21.42% Criminal Investigations (weighted calls) 6.3% 14.00% 20.7% Special Operations-SWAT (incidents) 7.27% 3.64% 10.91% Special Operations – K-9 (incidents) 3.65% 12.41% 16.06% Special Operations – Aerial (incidents) 10.00% 13.57% 23.57%

16
Net Financial Impact on the DCPD If Tucker and/or Stonecrest Began Providing Their Own Police Services
Service Revenues Expenditures Net Impact Tucker Only ($11,079,665) $8,123,068 ($2,956,597) Stonecrest Only ($10,395,876) $13,179,682 $2,783,806 Tucker and Stonecrest ($21,475,541) $21,302,750 ($172,791)
If Tucker and/or Stonecrest provided their own police services, the county would no longer receive revenue from traffic citations. As with the study areas, the revenues and expenditures coming from these two cities were based on their percentage of population to the service area. For all three scenarios, the county would experience a net loss of revenue from no longer managing traffic citations. For Stonecrest, this loss is not as great as the savings generated from no longer providing police services to that city. Metric for Traffic Court
Total Service Area
Tucker Stonecrest Tucker and Stonecrest
Population 480,023 6.96% 10.46% 17.41%1 1. Difference from sum of 6.96 + 10.46 due to rounding Net Financial Impact on Traffic Court if Tucker and/or Stonecrest Began Providing Their Own Police Services
Service Revenues Expenditures Net Impact Tucker Only ($580,807) $370,769 ($210,038) Stonecrest Only ($872,837) $557,219 ($315,618) Tucker and Stonecrest1 ($1,453,645) $927,456 ($526,189)
1. Tucker and Stonecrest scenario does not sum to individual scenarios for Tucker and Stonecrest due to population rounding. See metric for traffic court.
In the final scenario, DeKalb County would no longer provide police services. The impact of this scenario on the budget would be significant, with a reduction of 15% of the county’s employees and $101 million in expenditures (8% of the total county budget). By no longer providing this service, the county would not need several facilities. However, selling these properties would be complicated, as other agencies are co-located in some of the buildings. Perhaps the most challenging issue to address would be how specialized services, such as SWAT, bomb squad, K-9, and aerial, could be provided by individual cities. Because DeKalb’s cities have relatively small populations and low individual need for these services, it would be inefficient for any one municipality to support them. It may be most effective for DeKalb to provide these services on a countywide basis, funded from the General Fund.

17
Chapter 5. Revenue-Neutral Annexation The final chapter of this report discusses the issues surrounding budget-neutral annexation, defined as annexation of unincorporated land that will not result in a net revenue gain for the city, assuming no changes in tax rates or service levels from the status quo. This concept be may most readily achieved through larger annexations that include a mix of residential and commercial/industrial property. The following issues should be considered when trying to achieve a budget-neutral annexation:
• Budget-neutral annexation for a city may or may not result in a net financial loss to the county, depending on the revenues collected by the county and the services it provided to that area.
• A city can collect different revenues from counties, i.e., franchise taxes on electricity and natural gas.
• Changes to a property’s zoning classification after annexation can affect both the city’s and the county’s finances.
• A city providing higher levels of service to the annexed area could increase property values, thus raising tax revenue for both the city and the county.

18
Chapter 1. Introduction and Study Background
INTRODUCTION The University of Georgia’s Carl Vinson Institute of Government completed this study on the potential financial impacts of additional municipal incorporations and/or annexations on the DeKalb County government. This research focused on three geographic areas within the unincorporated portion of the county, estimating the net change in revenues to the county if it no longer provided specific “municipal type” (i.e., not countywide) services in those areas. The research also considered the impact on the county if two existing cities — Tucker and Stonecrest — began providing their own policing services rather than using the DeKalb County Police Department or if the county no longer provided any police services. Finally, the study includes a brief discussion on the benefits and challenges to revenue-neutral annexation, that is, annexation that does not result in an immediate net financial gain to a city after annexation. The findings show that incorporation results in a net financial loss to the county for all three study areas based on the services included in the analysis. If the City of Tucker provides its own police services, the result is also a net financial loss while the opposite is likely true if Stonecrest provides its own police services. The Carl Vinson Institute of Government hopes this report serves as useful information source for policy makers as they consider the future of DeKalb County.
FRAMING OF THE STUDY Advocates of two new proposed cities within DeKalb County have been seeking support for bills calling for referenda on incorporation from the Georgia General Assembly. The first is Greenhaven, which has proposed to offer planning and zoning, parks and recreation, and code enforcement. The Institute of Government conducted a feasibility study for this proposed city in 2015.6 The other is Vista Grove, which when studied in 2018 proposed to provide parks, police, public works, planning, and zoning. The Institute of Government conducted a feasibility study for this proposed city as well.7 Determining the net impact of the municipal service displacement on the county that would be caused were they to be incorporated is the driving question underlying this research. Assessing the impact of reducing the footprint of county municipal services within the unincorporated area due to municipalization requires an examination of two things: the cost of providing services based on current expenses and service demand, and the revenues available at existing rates.
6 Carl Vinson Institute of Government. 2015, February. A Study of Fiscal Feasibility for a Proposed City of South DeKalb. (The proposed city was referred to as the City of South DeKalb at the time.) The study found it to be fiscally feasible. 7 Carl Vinson Institute of Government. 2018, February. Fiscal Feasibility Analysis of a Proposed City of Vista Grove. The study found the proposed city to be fiscally feasible.

19
During the legislative sessions during which the Vista Grove and Greenhaven bills were proposed, representatives of DeKalb County government urged the legislative delegation to wait to act until the impacts of incorporation had been studied. Discussions between County Commissioner Jeff Rader and the DeKalb Municipal Association (DMA) about the possibility of a study as early as 2016. After several meetings, Commissioner Rader and the DMA put forward an agreed-upon set of principles that should guide such a study.
These principles included several foundational concepts. Among these was the notion that citizens countywide should have access to a “standard”, i.e., minimum level of service for a defined set of local government services, while acknowledging that these are likely to be implemented at different levels and funded by different tax or fee rates in different jurisdictions. They agreed that demarcation of future local government boundaries should take service efficiency into account. They indicated that a series of benchmarks for determining what constitutes standard levels of service and local government fiscal capacity should be identified. They concurred that local government officials have the responsibility to decide on the service levels and delivery mechanisms that they believe best meet the needs and expectations of their constituents. Finally, there was a universal desire that the fiscal sustainability of every local government in DeKalb County benefits all local governments within DeKalb County.
After these principles were established, DeKalb County agreed to fund the study from the General Fund, and a steering committee was formed consisting of three city representatives, three county representatives, and four state legislators that represented portions of DeKalb (two state senators and two state representatives). The steering committee then met and refined these concepts down to demonstrable elements that could be researched and analyzed.
Basic level of service was essentially determined to be the current level of service provided by DeKalb County. Assumptions built into the report are that the government does not wish to go below this current level of service; thus, the current conditions create the baseline for service levels. The concept of balanced annexation was debated by the steering committee at its first meeting, and members settled on the concept of budget-neutral annexation. Legislative members of the steering committee were particularly interested in the potential impact to the county in terms of revenue and service provision of the municipalization of sections of the unincorporated area.

20
The Institute of Government was asked by the steering committee to address the following research areas:
1. Measure the estimated financial impact on DeKalb County associated with additional incorporation and annexation of the unincorporated area. More specifically, this report estimates the impacts from a loss of unincorporated land for three specific research areas (see Figure 1.1 for a map of these areas):8
o Area 1: the land proposed to be incorporated as the City of Greenhaven o Area 2: the land proposed to incorporated as the City of Vista Grove o Area 3: all unincorporated land north of Highway 78, inclusive of Area 2
2. Estimate the financial impact on DeKalb County if the cities of Tucker and Stonecrest were to establish their own police departments rather than receive this service from DeKalb County and the potential impacts if DeKalb County no longer provided police services as a stand-alone department (i.e., only the DeKalb County sheriff would exist).
3. Evaluate the benefits and challenges associated with budget-neutral annexation, defined as a municipality not receiving a net increase in operating revenue from an annexation.9 Net operating revenue is the amount of revenue available to the city after collecting all associated taxes, fees, charges, fines, etc. and providing the same level of services to the annexed area as received by residents and businesses in the existing city. This definition does not necessarily imply a budget-neutral impact on the county.
8 Throughout this report, the study areas are referred to by number (i.e., Area 1, Area 2, Area 3), not by the names of any proposed incorporation. 9 This excludes later development of undeveloped land or redevelopment that may occur after an annexation or any increase in property values associated with being within the municipality.

21
Figure 1.1. Cities and Study Areas in DeKalb County

22
REPORT FORMAT This report is divided into five chapters, primarily focusing on the four research questions described above. The remainder of Chapter 1 provides context for the study and describes the methodologies used in the analyses.
Chapter 2 summarizes the various services DeKalb County currently provides its unincorporated residents and businesses and the revenues that fund those services. Additionally, levels of service are quantified using basic performance measures. These measures act as counterfactuals for how service levels may change if the study areas are incorporated.10 Countywide services and revenues are not included in the analyses.
The core of the analysis is given in Chapter 3, which outlines the estimated financial impacts of incorporating each of the three study areas. For each study area, the services proposed to be offered by the new city11 are evaluated for net impact and then summarized. Therefore, the services analyzed for Area 1 and Area 2 differ. The services analyzed for Area 3 are the same as those for Area 2. In addition to reviewing operating revenues and expenditures, Chapter 3 also broadly discusses other potential impacts on the county and taxpayers from any of the study areas incorporating such as from reductions in cost allocations12 to the General Fund and repayment of outstanding debt and pension liabilities.
Chapter 4 considers various police service scenarios, including the existing cities of Stonecrest and Tucker providing their own police services, and DeKalb County no longer providing any police services. In the case of Stonecrest and Tucker providing their own police service rather than having it provided by DeKalb County, this analysis includes county revenue that would be lost, possible reductions in demand for police services, the potential impact on service levels assuming the same property tax rate in the current unincorporated area, and conversely, the estimated change in tax burden on unincorporated property owners if service levels were kept the same.
Chapter 5 discusses the benefits and challenges of budget-neutral annexation. Rather than providing a quantitative analysis as in the previous chapters, this chapter should be viewed as a narrative on the topic of annexation. This analysis explores the challenges a county may face by municipalities aggressively annexing properties with the greatest revenue potential and least service demands (i.e., “cherry picking” properties to annex) as well the general benefits that can accrue from annexation. Finally, this section presents the challenges and potential solutions to
10 For this report, incorporation includes new municipal incorporation, annexation, or a combination of both for unincorporated land. 11 Based on the fiscal feasibility studies performed for the proposed City of Greenhaven and the proposed City of Vista Grove and presented to the Georgia General Assembly 12 Cost allocation is defined as assigning the costs for administrative support service, such as information technology, to other government departments that benefit from it.

23
establishing a formal or informal agreement for revenue-neutral annexation among the county government and the municipalities within DeKalb County.
BACKGROUND DEKALB COUNTY Before delving into the financial implications of incorporation, it is useful to provide background on DeKalb County to understand the context in which incorporation or annexation would occur.
DeKalb County was formed in 1822 from parts of the surrounding counties of Henry, Gwinnett, and Fayette. It is named for a Continental Army major general who fought in the US Revolutionary War, Baron Johann de Kalb.13 Currently, the county’s key employment sectors are higher education, health care, retail, and food service; its major employers include Emory University and Hospital and the Kroger Company.14
According to 2018 US Census estimates, DeKalb had 756,558 residents, making it the fourth most populous county in Georgia. Table 1.1 shows that DeKalb is a racially and ethnically diverse county.
Table 1.1. Percentage of Population in DeKalb County Identifying by Race in 2010 US Census Data
Race Percentage Asian 6.6% Black 54.9% White 35.8% Other or Multiple Races 2.8% Hispanic Ethnicity 8.6%
Note: totals do not sum to 100% because the US Census Bureau treats Hispanic identity as an ethnicity, not a race.
The racial diversity of the unincorporated area is given in Table 1.2.15
Table 1.2. Percentage of Population in Unincorporated DeKalb County Identifying by Race in 2010 US Census Data
Race Percentage Black 68% White 23% Other or Multiple Races 9% Hispanic Ethnicity 5%
13 See dekalbhistory.org/exhibits-dekalb-history-center-museum/dekalb-county-history/. 14 See www.oneglobaldekalb.org/about-dekalb-county-ga.html. 15 Based on US Census Bureau American Community Survey (ACS) data for census tracks with a centroid in the unincorporated area

24
Countywide, median household income is approximately $55,876, and the poverty rate is 15.3%.16 The unincorporated area is somewhat less affluent when compared to the entire county, with a median income of approximately $45,867 and a poverty rate of 18.5%.17
DeKalb County contains the following 13 cities, which range widely in terms of population and services offered: Atlanta (a portion is in DeKalb; most of the city is located in Fulton County), Avondale Estates, Brookhaven, Chamblee, Clarkston, Decatur, Doraville, Dunwoody, Lithonia, Pine Lake, Stonecrest, Stone Mountain, and Tucker. Table 1.3 shows the date of incorporation for each city, its current estimated population as of 2018, and its population estimate in 2010.
Table 1.3. Details about the Cities of DeKalb County
City Year of
Incorporation 2018 Census
Population Estimate 2010 Census Population
Atlanta 1847 40,285 33,996 Avondale Estates 1924 3,154 2,960 Brookhaven 2012 54,145 – Chamblee 1907 29,691 9,892 Clarkston 1882 12,757 7,554 Decatur 1823 25,732 19,335 Doraville 1871 10,526 8,330 Dunwoody 2008 49,459 46,267 Lithonia 1856 2,352 1,924 Pine Lake 1937 761 730 Stone Mountain 1839
(as New Gibraltar) 6,324 5,802
Stonecrest 2016 54,522 – Tucker 2016 36,206 –
The total estimated population of the incorporated area is 335,433, which represents 43% of the county’s total population. Over the last nine years, this percentage has risen from 20% due to the incorporation of three new cities and annexations of territory into the other existing cities.
Urbanization and Local Government Service Demand DeKalb County’s dramatic growth over the last 50 years has led to demand for expanded local government services. DeKalb County was one of the first Atlanta suburbs to begin experiencing rapid growth in the 1960s and 1970s. According to the 1960 census, DeKalb County’s population was 256,782, growing to 415,387 by 1970, and to 665,865 by the year 2000. As residents continued to move into unincorporated DeKalb and the county transitioned into a more
16 US Census Bureau QuickFacts. 17 Based on US Census Bureau ACS data for census tracks with a centroid in the unincorporated area.

25
suburban and urban environment, those citizens began demanding municipal services. Prior to 1972, county commissioners in Georgia were known as the Commissioners of Roads and Revenues because they primarily handled road funding and collecting taxes to fund state services that were provided at the local level through constitutional officers (i.e., sheriff, superior courts). DeKalb County officials and other metro area county officials began advocating with the state legislature for the legal authority to provide municipal services in the unincorporated area to meet citizen demand. The state legislature responded, and an amendment to the state constitution that would allow all counties throughout the state to provide municipal type services was placed on the ballot.
The so-called Amendment 19 (the number of the question on the ballot) was approved by voters and became the Supplementary Powers Clause of the state constitution. Specifically, it provides that all cities and all counties throughout the state possess the authority to provide the following services: police and fire protection; garbage and solid waste collection and disposal; public health facilities and services, including hospitals, ambulance, and emergency rescue services; animal control; street and road construction and maintenance, including curbs, sidewalks, street lights, and devices to control the flow of traffic on streets and roads constructed by counties and/or municipalities; parks, recreational areas, programs, and facilities; storm water and sewage collection and disposal systems; development, storage, treatment, purification, and distribution of water; public housing; public transportation; libraries, archives, and arts and sciences programs and facilities; terminal and dock facilities and parking facilities; codes, including building, housing, plumbing, and electrical codes; and air quality control. The Supplementary Powers Clause also gives cities and counties the power to maintain and modify existing retirement or pension systems, to continue in effect or modify other benefits provided as a part of or in addition to such retirement or pension systems, and the power to create and maintain retirement or pension systems for any elected or appointed public officers and employees whose compensation is paid in whole or in part from county or municipal funds and for the beneficiaries of such officers and employees.18 Unless otherwise provided by law, no county can provide these services inside a city’s limits and no city can provide these services outside its own boundaries without an agreement with the impacted city or county.19 Finally, the General Assembly may regulate, restrict, or limit the exercise of these powers, but it may not withdraw any such powers.20 If the General Assembly chooses to “regulate, restrict, or limit,” it must do so only through general law.21
As a result of this change in the state constitution, counties across the state, including DeKalb and other metro area counties, began providing municipal services. As more and more counties
18 Ga. Const. Art. IX, § II, Para. III (a). 19 Ga. Const. Art. IX, § II, Para. III (b). 20 Ga. Const. Art. IX, § II, Para. III (c). 21 Ga. Const. Art. IX, § II, Para. III (d).

26
began expanding their services into their unincorporated areas, competition to provide certain services such as water and sewer began to arise between cities and counties. Questions of tax equity also began to surface. The main concern was whether city residents should be paying for services only provided in the unincorporated area through taxes imposed countywide.
The DeKalb County delegation to the General Assembly attempted to deal with some these issues through local legislation. A local amendment to the state constitution that applied only to jurisdictions in DeKalb County was placed on the ballot and approved in 1978. (Local constitutional amendments are not permitted under the current state constitution, but some local constitutional amendments from the preceding 1976 constitution were carried forward.) This amendment, implemented by local acts, provides for the creation of special taxing districts that specified which services were provided for which areas at particular tax rates.22 Since the original act implementing the special tax districts was passed in 1982, this local legislation has been amended eight times.23 Ultimately, the state legislature responded to statewide concerns over duplication of service and double taxation by enacting the Service Delivery Strategy Act in 1997.24 This has created a situation in DeKalb County where the county operates under both the legacy of these special districts created through a local constitutional amendment and the statewide requirement to address these issues through an agreement.
Changes in the special district local acts made in 2010 created a process by which most of the municipalities included could opt out of the special district services.25 Most cities covered by this legislation elected to opt out of most of the special district services. Consequently, the tax millage rate to the county to pay for those services is no longer collected, and those services are now provided by the city and are funded by city revenues. Some cities, however, chose to continue to receive basic or nonbasic police services through the special district legislation.
Each city listed in the DeKalb Special Services Tax District Acts26 can elect which services — parks, roads, police basic, police nonbasic, fire — it wants to receive from the county. For police services, a city can choose to receive either police basic, police nonbasic, or both basic and nonbasic services. Basic and nonbasic police services are defined as follows:
22 Special tax districts are a common mechanism used by local governments across Georgia to provide and fund services in a localized area within their jurisdiction. These are authorized by the state constitution for use by the General Assembly, county, and city governments. See Ga. Const. Art. IX, § II, Para VI. 23 See Local Acts of the General Assembly, 1982, p. 4396; 1989, p. 4165; 1990, p. 4601; 1991, p. 4320; 1992, p. 6512; 1993, p. 4198; 1995, p. 3527; 2010, p. 3548; 2011, p. 3989. 24 For more details on the Service Delivery Strategy Act, see kaltura.uga.edu/media/t/1_18yxvx6w. 25 Ga. Law 2010, p. 3548. 26 Only the cities created prior to 2008 are included in these local acts.

27
• Basic police services include services performed by the uniform division, traffic unit, park patrol, criminal investigation division, and crime scene investigation unit of the DeKalb County Police Department.
• Nonbasic police services include services performed by the aerial support unit, the SWAT team, the bomb squad unit, intelligence and permits, the K-9 division, the gangs unit, the drug task force, and the homeland security division (emergency management) of the DeKalb County Police Department.27
Based on the types of services a city chooses to receive, its property owners are assessed a millage rate designed to pay for their share of the cost of the services. The general allocation method is based on the per capita share of the cost of the service among the jurisdictions that have chosen to receive that service. A particularized millage rate is then calculated for each special district.
The Creation of New Cities The metro Atlanta area continues to experience the incorporation movement that began with the creation of the City of Sandy Springs in 2005. Four new cities have been created in DeKalb County in recent years. The City of Dunwoody was incorporated in 2008, Brookhaven in 2012, and then Stonecrest and Tucker in 2016. Each of these new cities provides an array of services, but unlike every other city in DeKalb, Stonecrest and Tucker rely on the county police department instead of maintaining their own. Additionally, at least initially, these two cities relied on the county for road maintenance. These cities were created after the special district legislation discussed in the previous section. The county appears to have chosen to levy the same millage rate on the residents of these two cities for road maintenance and police services that is levied in the unincorporated area even though other county funds only collected in the unincorporated area are used to fund police services (e.g., insurance premium taxes).
METHODOLOGY With this background in mind, the Institute research team began devising the methodology for addressing the four research questions posed by the steering committee. This report applies various types of quantitative analyses to calculate estimated revenue losses and expenditure savings from the incorporation of Areas 1, 2, and 3. The geographic boundaries of Areas 128 and 2 were determined from previous annexation studies. The boundaries for Area 3 were determined by the steering committee. When possible, geographically determined revenues and expenditures are used, such as the location of calls for police service and when assessing parks
27 Ga. Law 2010, p. 3549. 28 Since the publication of A Study of Fiscal Feasibility for a Proposed City of South DeKalb in 2015, the boundaries of the proposed City of Greenhaven have changed slightly due to an annexation by the City of Tucker. This boundary adjustment has been taken into account in all of the revenue and cost estimates in this report.

28
and recreation services. In some instances, the exact location of service effort could not be determined. Therefore, the Institute research team assigned revenues and expenditures using a metric that was seen as the service’s primary revenue and cost driver, such as population or road miles.
The data used in this report come from DeKalb County; however, in some instances, Institute of Government researchers assigned revenues or services geographically using geographic information system (GIS) mapping. This report uses fiscal year (FY) 201829 data because it was the latest full fiscal year at the time this research was being conducted. Thus, FY 2018 provides the most accurate picture of the potential impact on the county’s resources if further incorporation were to occur. The findings show what the financial impact on the county would have been if Areas 1, 2, or 3, had been incorporated in FY 2018.
The estimated revenue losses and expenditure savings for each service within each area are summed to determine net estimated impact. The estimated dollar value impact is then translated into service-level impact based on one or two performance measures. For services primarily funded from property taxes, an estimated adjustment to the unincorporated millage rate to maintain FY 2018 levels of service is also calculated. Note that this report contains a large number of financial analyses. Figures may vary slightly from table to table due to rounding, but these differences do not affect individual or overall findings.
The research team only analyzed financial impact for those services that previous studies showed the area as offering if incorporated. If a fiscal viability study for a proposed city, referred to here as a study area, did not include that city as directly providing it, this analysis assumes DeKalb County will continue to directly provide it to residents.
More specifically, the following services are analyzed for each study area:
Study Area 1
• Code Compliance • Keep DeKalb Beautiful • Planning and Sustainability • Recreation, Parks, and Cultural Affairs
29 The DeKalb County fiscal year stars on January 1 and ends on December 31.

29
Study Area 2
• Code Compliance • Keep DeKalb Beautiful • Planning and Sustainability • Police • Recreation, Parks, and Cultural Affairs • Roads and Drainage and Transportation • Traffic Court
Study Area 3
• Code Compliance • Keep DeKalb Beautiful • Planning and Sustainability • Police • Recreation, Parks, and Cultural Affairs • Roads and Drainage and Transportation • Traffic Court
NOTES ABOUT THE DATA Most of the data sets acquired from DeKalb County were aggregated by the DeKalb County GIS Unit, which geocoded these records so that they could be mapped across the areas of interest. Several data sets obtained by the county were geocoded, such as police basic service calls, property tax charges, business license revenue, building permit revenue, and street light charges. Additionally, the DeKalb County Tax Assessor provided geocoded data with information on all property uses. In some cases, the geocoding of the data was less accurate. For example, the Police Special Unit records often only referenced a place such as a school, mall, or stadium rather than a street address or intersection. The Institute of Government research team used the Google geocoding service, which is able to handle this type of data to a greater degree than other services or desktop GIS. Nevertheless, the accuracy of this geocoding is likely to be less accurate than for records with higher quality location descriptions.
The Institute researchers created a Python script to automate some of the data analysis and to allow for analyses of customized areas of interest as needed. In terms of the spatial queries, the Institute researchers generally used a “within the source layer feature” request when the data were point based.
The research team applied various bases to distribute revenues and costs, using whatever was deemed to generate the most accurate estimates. Below are those bases that were most commonly used and may require additional explanation.

30
Population Data The research team used 2010 US census block data for this analysis. Because census data for later years are based on estimates, 2010 was viewed as the most accurate year. Additionally, the population of a study area is not used as the basis of calculation but rather an area’s population as a percentage of the total. Because the report uses the percentage of the population, the study areas are not likely to be undercounted. However, by using 2010 figures, the analyses assume that population growth occurred relatively proportionally across the county from 2010 through 2018. The report highlights instances where the percentage of the population is used as the basis for assigning revenues and expenditures, such as in Appendix A and Chapter 2. To determine population from GIS, the research team used census blocks and assigned blocks to the study areas.
Property Tax Data To allocate property tax revenues and some charges, the research team relied on property tax and charges data provided by the Office of the DeKalb County Tax Commissioner. (See Appendix A.) The Tax Commissioner’s Office provided the research team an Excel file by study area that included each property, its property classification, current assessed values, and 2018 assessed special services property taxes. Likewise, the Tax Commissioner’s Office provided the special charges assessed in the each of the study areas for speed humps and street lighting.
Road Mileage The Division of Roads and Drainage counts its total road miles in its service area as 1,744.2, and the research team does not dispute this figure.30 However, our GIS analysis came up with a total mileage of 1,500.6. The research team used the most recent Georgia Department of Transportation (GDOT) GIS roads layer and sorted the data for county roads only. The difference between the Institute of Government estimates and those of the Division of Roads and Drainage could be due to some roads and alleys not being designated as county roads by GDOT as well as the type of GIS “clipping” of road segments used to allocate roads to the study areas of interest.31 The research team believes the difference in mileage between the county estimate and the Institute estimate is not an issue for the analysis because this study is examining the percentages of road miles contained within each study area. Therefore, the
30 The Georgia Department of Transportation’s Local Maintenance Improvement Grant lists DeKalb’s unincorporated area as having 1,414 miles of road, Stonecrest as 205 miles, and Tucker as 160 miles for a total of 1,779 miles. 31 For determining the road mileage for the areas of interest, Institute researchers first employed an “intersects the source layer feature” request to identify all the road segments that pass through the area of interest and then used a clip routine to extract only the road segments and subsegments that were within the area of interest. This approach was used for all areas except the area “Above Hwy 78,” which included areas that did not seem to allow the clipping method.

31
calculations provided in this report are based on the relative number of miles for each study area rather than an absolute number.
Table 1.4. Road Miles in the Unincorporated Area, Stonecrest, and Tucker
Unincorporated
Area
Stonecrest
Tucker Total Service
Area Center Lane Miles 1,221.2 137.6 141.8 1,500.6 Percentage 81.4% 9.2% 9.4% 100%
Table 1.5. Road Miles in the Study Areas, Stonecrest, and Tucker
Center Lane
Miles
Percentage Unincorporated Area1 1,221.2 81.4%
Study Area 1 921.8 61.4% Study Area 2 178.3 11.9% Study Area 3 253.0 16.9% Remaining Unincorporated 46.4 3.1%
Stonecrest 137.6 9.2% Tucker 141.8 9.4% Total 1,500.6 100
1. Individual areas summed exceed 81.4% because Area 3 includes Area 2
Revenues To understand the effects of municipalization on revenues, the first step was to sort the revenue streams according to which departments either generate them or are aligned with them. For example, all revenues for the Department of Recreation, Parks, and Cultural Affairs (e.g., property taxes dedicated to this service, charges, and fees) are gathered to show the revenues associated with that department. The county collects a handful of general taxes not affiliated with or assigned to a particular service, such as alcohol taxes. These general revenues are grouped together as “nondesignated revenues.” Each revenue is analyzed separately to determine the best way to assess how incorporation would affect it. For each of the three study areas, the same basis for reducing revenues is used. To avoid double-counting unincorporated revenues, transfers from one general tax fund to another are excluded (e.g., transfers from the unincorporated tax fund to the police tax fund). However, transfers from enterprise funds and the countywide General Fund are included. (For more information on the county’s use of funds to manage revenues, please see Chapter 2.) The impact of a potential loss of revenue transfers is discussed with the affected services in Chapter 3. See Appendix A for a list of revenues included in this report and the methodology applied to geographically assign them. For those less familiar with the various revenues, brief definitions for each are given in Appendix B.

32
Expenditures The methodologies used for assigning expenditures to a study area were determined based upon the best available data and are discussed with each service. For some services like parks, expenditures are known geographically, while for others, they are not. For some of these other services, the most logical cost driver of each expenditure, such as population, was applied geographically. For still other services, such as business licenses, it was known where the revenues derived. In these instances, the research team assumed that where revenues were earned, work effort also occurred to the same degree, such as with building inspections. Therefore, expenditures were allocated using the same distribution percentages as the revenues.
For both revenues and expenditures, estimates given in this report should not be viewed as certainties. Furthermore, while this report is intended to assist the public, policy makers, and other stakeholders in understanding the potential impact of further incorporations and annexations on DeKalb County, it should not be construed as either advocating for or against any such actions.
Excluded Services Because the purpose of this study is to evaluate the impact of further incorporations and annexations on DeKalb County, several services are excluded from analysis, with the most prominent being all countywide services. Additionally, career fire service, which is typically considered a municipal-type service, is not included in this report because the cities seeking annexation did not propose to adopt their own fire departments. Furthermore, all cities within the county except for Decatur and Atlanta receive fire service from the county, and it seems unlikely that a new city will propose to do so in the near future. Services provided through proprietary funds, i.e., stormwater and sanitation, are also excluded because, by definition, the impact of further incorporation should be revenue neutral. Because residents and businesses pay for these services through charges and fees, a reduction in customers can generally be matched with a reduction in expenditures, with one exception being the need to pay for fixed costs like debt from capital investments.

33
Chapter 2. Summary of Current Services and Revenues
This chapter summarizes the DeKalb County departments and divisions under review for this report and describes their respective expenditures and revenues. This information acts as a baseline for understanding the service levels provided in the unincorporated area and for measuring the impact if Areas 1, 2, or 3 were to incorporate.
SERVICES AND EXPENDITURES DeKalb County provides a wide array of services specifically for the unincorporated area. The following services are of interest for this report:
• Department of Beautification: includes Keep DeKalb Beautiful and the Code Compliance Division32
• Department of Planning and Sustainability: includes the Business Licenses Unit, Development Unit, and Current Planning Unit (The Long-Term Planning Unit is funded within the General Fund.)
• Police Department • Department of Recreation, Parks, and Cultural Affairs • Roads and Drainage Division (within the Public Works Department) • Transportation Division (within the Public Works Department) • Traffic Court (within State Court)
In FY 2018, DeKalb County provided all of the above services throughout the entire unincorporated area. Additionally, specific departments provided the following services in existing municipalities per local legislation first adopted in 1982:33
• Recreation, Parks, and Cultural Affairs: cities of Lithonia, Pine Lake, and Stonecrest34 • Roads and Drainage and Transportation: cities of Stonecrest and Tucker • Police35
o Basic and Nonbasic: Clarkston, Lithonia, Pine Lake, Stonecrest, and Tucker o Nonbasic only: Chamblee, Decatur, and Stone Mountain
32 In FY 2019, these two divisions were separated; currently, Keep DeKalb Beautiful is housed within the Sanitation Division. 33 See Chapter 1 of this report for a more complete discussion of the DeKalb County’s special tax districts and provision of services on behalf of its municipalities. 34 In the fall of 2019, Stonecrest assumed ownership and maintenance of county parks within its boundaries. 35 The distinction between basic and nonbasic police services is fully explained under the “Police Services” section of this chapter.

34
The FY 2018 operating expenditures that the Institute of Government research team analyzed were broken into the following five major categories, which conform to the DeKalb County’s financial system and Georgia’s uniform chart of accounts for local governments:36
1. Personnel Services and Employee Benefits 2. Purchased/ Contracted Services 3. Supplies 4. Capital Outlays 5. Interdepartmental Charges
Indirect costs are included in the Interdepartmental Charges category.
Indirect Expenditures DeKalb County has implemented an indirect cost plan so that direct services outside the General Fund pay their fair share for the support services funded through that countywide fund. Indirect cost plans are common and represent a best practice in financial management.37 Under the county’s plan, specific dollar amounts are charged to service departments based on a variety of factors, including the number of full-time equivalent (FTE) employees, square footage of facilities, use of employee time, and so forth. In this report, the funds transferring revenue to the General Fund for indirect cost allocations are Fund 271: the Designated Services Fund (Department of Recreation, Parks, and Cultural Affairs and the Divisions of Roads and Drainage and Transportation), Fund 272: Unincorporated Services (Department of Beautification, Planning & Sustainability,38 and Traffic Court), Fund 274: Police Services, and Fund 201: Development. In DeKalb County, revenue transfers to the General Fund are made at the fund level rather than at the departmental level.
In the cost allocation plan, some service allocations were determined by department, such as for facilities management and GIS. In other words, an assessment was made based on the how much each department used a particular support service. For other support services, the indirect charges were determined at the fund level, such for the chief executive officer, the Ethics Board, and budget management. For department-level allocations, those exact dollars are added to each department’s operating expenditures. For fund-level allocations, the research team assigned costs to the departments reviewed in this report on an FTE39 basis. Additionally,
36 stofgeorgia.az1.qualtrics.com/jfe/form/SV_1yUN2K32Xe2Qost 37 www.gfoa.org/indirect-cost-allocation 38 Except for Long-Term Planning, which is within the General Fund, and Development, which has its own special revenue fund 39 Filled positions as of December 31, 2018.

35
the funds under review had to pay their share of the following additional expenditures that were not part of the cost allocation plan:
• Nonimmunity judgements • Unemployment compensation • Risk management charges • Insurance allocation • Paid retirements
These costs were allocated to departments on an FTE basis as well and added to each department’s operating expenditures along with the other allocated costs. Table 2.1 lists the departments, divisions, and units and their allocations for FY 2018.
Table 2.1. FY 2018 Summary of Indirect Allocated Costs
Department Administrative
Allocation Additional Allocation
Total Allocation
Beautification – Keep DeKalb Beautiful $135,158 $37,096 $172,254 Beautification – Code Compliance $107,331 $29,459 $136,790 Planning – Business Licenses $249,026 $2,728 $251,754 Planning – Current Planning $498,053 $5,455 $503,508 Planning – Development $1,330,120 $64,620 $1,394,740 Police $8,622,380 $1,115,346 $9,737,726 Public Works – Roads & Drainage $941,091 $197,194 $1,138,285 Public Works – Transportation $477,953 $23,854 $501,807 Recreation, Parks, and Cultural Affairs – Parks
$2,635,463 $91,441 $2,726,904
Recreation, Parks, and Cultural Affairs – Recreation
$204,654 $62,816 $267,470
Traffic Court $594,243 $27,277 $621,520 Total Allocation $15,795,472 $1,657,286 $17,452,758
These cost allocations were in addition to interdepartmental charges to internal services funds,40 such as vehicle maintenance, that the county had included as operating expenditures for each department. Therefore, the total interdepartmental charges for a division or department will be greater than the indirect cost allocation given in Table 2.1.
40 Internal service funds account for services that charge other agencies within a government for a service such as vehicle maintenance or motor pool.

36
Beautification – Fund 272, Account 5800 In FY 2018, the Department of Beautification consisted of two divisions: Keep DeKalb Beautiful and Code Compliance. Keep DeKalb Beautiful’s mission is to maintain the upkeep of public rights-of-way in the unincorporated area, including mowing, litter removal, and tree trimming. The division also has three staff dedicated to community outreach focused on this mission. This unit, also referred to Keep DeKalb Beautiful (KDB), works to promote and implement community engagement programs, such as sponsoring right-of-way clean up and antilittering campaigns.
Keep DeKalb Beautiful
As of the end of FY 2018, the Keep DeKalb Beautiful Division had 68 filled full-time positions and expenditures totaling $5.9 million. In addition to three community outreach staff, the division had 35.5 FTE employees dedicated to litter removal and 29.5 FTEs focused on right-of-way mowing. Employee efforts were supplemented by contractors for right-of-way mowing. Tree trimming activities are completely contracted out.
The programmatic FY 2018 expenditure distribution for the Keep DeKalb Beautiful unit is shown in in Table 2.2. For the litter removal and mowing units, employee salaries and benefits were distributed based on the average grades of the employees. (Those in the mowing unit earned approximately 25% more than those in litter removal.)41 The actual salaries were known for the three-person KDB unit. Operating costs were divided per-employee, with two exceptions. First, $15,000 was assigned to the KDB unit based on discussions with the division’s current director.42 Second, the tree-trimming contracts were segregated out. Finally, capital and indirect costs were also allocated per-employee.
41 Calculation: (29.5)(1.25X) + 35.5X = Y (total salaries); X = salary difference between mowing and litter removal 36.875X + 35.5X = Y 72.375X = Y X = Y/72.375 Litter Removal Salaries = $2,069,708/72.375 x 35.5 Mowing Salaries = $2,069,708/72.375 x 29.5 x 1.25 42 In FY 2019, the Keep DeKalb Beautiful Division was transferred to the Sanitation Department.

37
Table 2.2. Operating Expenditures for Keep DeKalb Beautiful, FY 2018
Operating Expenditures
Division Total
KDB
Litter Removal
Mowing ROW
Tree Trimming
Full-Time Employees 68 3 35.5 29.5 0 Salaries $2,365,560 $159,187 $1,082,228 $1,124,145 0 Other Personnel $1,504,122 $66,056 $705,708 $732,357 0 Purchased Services $902,846 0 $166,126 $441,6091 $295,110 Supplies $160,030 $15,000 $79,209 $65,822 0 Capital $4,623 0 $2,525 $2,098 0 Interdepartmental $974,029 $7,246 $528,012 $438,772 0 Total $5,911,210 $247,489 $2,563,808 $2,804,803 $295,110
1. Includes mowing contracts. Note: ROW = right-of-way.
In 2018, the division collected 51,994 bags of litter on 3,648 miles of roadway. (Some roads received multiple treatments.) The mowing unit serviced 3,311 center-lane miles of roadway.43 This translates to a $690.08 cost per mile for litter removal and $835.47 per mile for right-of-way mowing.
During discussions for this report, the director of the Department of Sanitation, who now oversees Keep DeKalb Beautiful, recommended using center-lane miles of road to allocate the litter removal and right-of-way mowing workloads in the unincorporated area. Table 2.3 shows the number of center-lane miles per study area as well as the percentage of total miles in each study area.
Table 2.3. Distribution of Keep DeKalb Beautiful by Center-Lane Miles of Roadway
Study Area 1
Study Area 2
Study Area 3
Remaining Unincorporated
Total Miles of Road
921.8 178.3 253.0 46.4 1,221.2 75.5% 14.6% 20.7% 3.8% 100%1
1. Individual areas summed exceed 100% because Area 3 includes Area 2.
Code Compliance
The Code Compliance Division44 “is responsible for the inspection and enforcement of residential and commercial properties that violate the DeKalb County Code of Ordinances”45 within the unincorporated area. In support of this service, the department spent $4,025,208, 43 “Center lane” refers to a mile length of road, regardless of its width. 44 Also referred to as code enforcement. “Code Compliance” is used throughout this report to match the terms provided in DeKalb County FY 2018 operating budget. 45 www.dekalbcountyga.gov/beautification/code-enforcement-general-information

38
including the indirect cost allocations. The division had a total of 54 filled full-time positions at the end of FY 2018. Of these, 10 were counted as serving the entire service area as they were administrative support or senior managerial staff.
The remaining employees were divided into two groups: those assigned to enforcement zones across the unincorporated area and those assigned to a special unit that focuses on code enforcement of motels and multifamily housing. The division has 26 distinct zones, with three additional code enforcement officers who serves as “floaters in the southwestern portion of the county”46 due to higher service demand. Three of the four supervisors oversee staff assigned to enforcement zones. The remaining 12 employees work in the special unit. Of these 12 employees, 10 are code compliance officers, one is a supervisor, and one is a special projects coordinator.
Table 2.4 presents the employee workload distribution for the 32 employees assigned to enforcement zones (including supervisors). The distribution of employees is based on a map provided by the agency, and the number of supervisors assigned to each study area was determined by the research team. Assignment of supervisors was based upon the number of employees in each study area as well as allowing for some supervision outside of Study Area 1.
Table 2.4. Workload and Employee Distribution of Code Compliance Officers within Zoned Areas1
Study Area 1
Study Area 2
Study Area 3
Remaining Unincorporated
Number of Zones 23 1 2 1 Employees 262 1 2 1 Supervisors 2.75 0 0.25 0 Total Employees 28.75 1 2.25 1
1. Sum of zones does not equal 26 because Study Area 3 includes Study Area 2; sum of employees does not equal 29 for the same reason.
2. Includes three floater positions.
46 According to the director of the Code Compliance Division

39
The workload of those in the motel and multifamily housing special unit is based on the location of these properties (see Table 2.5). In FY 2018, a total of 674 properties in the DeKalb County Tax Assessor’s database fit this general description. More specifically, the research team included the following properties in the analysis:
• Extended-Stay Motels – 9 • Motels – 24 • Apartment Garden – 634 • Apartment Highrise – 2 • Apartment Midrise – 4 • Mobile Home – 1
However, the research team believes that many of the multifamily units do not require much code compliance attention; consequently, the high number of multifamily properties overstates their relative workload. To address this issue, the percentage of motels (total of 33) for each area was averaged with the percentage of multifamily properties (total of 641) in each study area to distribute employee workload.
Table 2.5. Code Compliance Workload and Employee Distribution for Motel and Multifamily Housing Unit1
Study Area 1
Study Area 2
Study Area 3
Remaining Unincorporated
Percent Motels 66.7% 9.1% 27.3% 6.0% Percent Multifamily 71.0% 10.0% 20.0%% 9.0% Average Percent Motel and Multifamily Properties
68.8% 9.5% 23.7% 7.5%
Employees 8.26 1.15 2.84 0.90 1. Study area data will not sum to 100% or 12 for employees because Study Area 3 includes Study Area 2.
Division expenditures are assigned to the two groups on a per-employee basis (total of 44). Costs associated with the 10 division-wide employees are split between the two operating groups: those working in enforcement zones and those in the special motel/multifamily housing unit.
Total FY 2018 Division Expenditures: $4,025,208 Direct service employees: 44 (excludes 10 support staff) Cost per direct service employee: $91,482 Expenditures associated with zoned employees: 32 x $91,482 = $2,927,424 Expenditures associated with special unit: 12 x $91,482 = $1,097,784

40
In FY 2018, the division performed 11,664 inspections. Of these 3,671 warning notices were issued, 6,453 court summonses were issued, and 2,227 properties passed/complied with the code. In terms of efficiency, the cost per inspection equaled $345.10 ($4,025,208/11,664).
The Code Compliance Division also manages the Foreclosure and Vacant Property Registry (special revenue Fund 205). Owners of foreclosed or vacant properties are required to register their property for a $100 fee and to designate a local property agent. Due to the county’s improved real estate market, the number of registered properties has declined significantly. In FY 2018, the fund only spent $11,897.
Planning and Sustainability – Fund 272, Account 5100 and Fund 201, Account 5100 The mission of the Department of Planning and Sustainability (Planning Department) is to “(1) coordinate the county’s strategic-planning and land development activities with its various stakeholders, (2) facilitate long-term planning and development policies, and (3) preserve the county’s natural and built environment. The Planning Department accomplishes this by regulating zoning, land-use amendments, land development activities, permitting, inspections, and enforcing county codes to promote the health, safety, and welfare of the citizens of DeKalb County.”47
The Planning and Sustainability Department is composed of two divisions: Planning Services and Development Services. Within the Planning Services Division are the Long-Range and Current Planning Units, with the former being funded out of the General Fund and the latter out of Fund 272: Unincorporated Fund (i.e., unincorporated revenues). The Development Services Division consists of the Building Development Unit and the Business and Alcohol Licenses Unit. Funds for Building Development are managed through a special revenue fund (Fund 201), while business and alcohol revenue and expenditures are accounted for in the Unincorporated Fund, along with Current Planning.
Planning Division
In FY 2018, Current Planning’s total expenditures were $1,520,252, including $503,508 in indirect expenditures, and there were 10 filled positions. During this period, the unit handled a variety of planning tasks related to rezoning applications, zoning variances, and commercial plan reviews. Zoning applications included rezonings, special land-use permits, MODs, and land-use map amendments. The Current Planning Unit categorized zoning applications as simple, average, or difficult based on the amount of staff time required to review them. Table 2.6 shows the staff’s workload distribution in FY 2018.
47 www.dekalbcountyga.gov/planning-and-sustainability/planning-sustainability
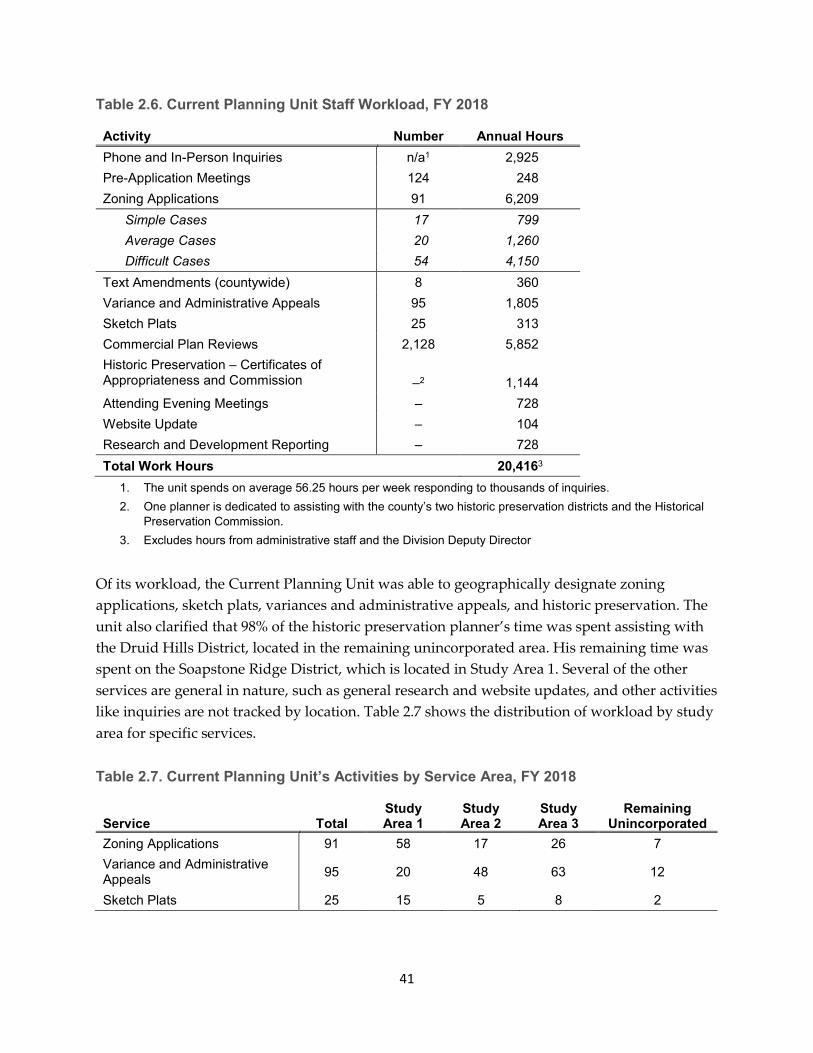
41
Table 2.6. Current Planning Unit Staff Workload, FY 2018
Activity Number Annual Hours Phone and In-Person Inquiries n/a1 2,925 Pre-Application Meetings 124 248 Zoning Applications 91 6,209
Simple Cases 17 799 Average Cases 20 1,260 Difficult Cases 54 4,150
Text Amendments (countywide) 8 360 Variance and Administrative Appeals 95 1,805 Sketch Plats 25 313 Commercial Plan Reviews 2,128 5,852 Historic Preservation – Certificates of Appropriateness and Commission
–2
1,144
Attending Evening Meetings – 728 Website Update – 104 Research and Development Reporting – 728 Total Work Hours 20,4163
1. The unit spends on average 56.25 hours per week responding to thousands of inquiries. 2. One planner is dedicated to assisting with the county’s two historic preservation districts and the Historical
Preservation Commission. 3. Excludes hours from administrative staff and the Division Deputy Director
Of its workload, the Current Planning Unit was able to geographically designate zoning applications, sketch plats, variances and administrative appeals, and historic preservation. The unit also clarified that 98% of the historic preservation planner’s time was spent assisting with the Druid Hills District, located in the remaining unincorporated area. His remaining time was spent on the Soapstone Ridge District, which is located in Study Area 1. Several of the other services are general in nature, such as general research and website updates, and other activities like inquiries are not tracked by location. Table 2.7 shows the distribution of workload by study area for specific services.
Table 2.7. Current Planning Unit’s Activities by Service Area, FY 2018
Service Total Study Area 1
Study Area 2
Study Area 3
Remaining Unincorporated
Zoning Applications 91 58 17 26 7 Variance and Administrative Appeals 95 20 48 63 12
Sketch Plats 25 15 5 8 2

42
Because the Current Planning Unit’s workload is divided among a variety of activities, including customer service, the research team determined that cost per position is the best measure of its workload. With 10 full-time staff and expenditures of $1,520,252, the cost per FTE equaled $152,025 in FY 2018.
The Long-Range Planning Unit consists of seven full-time personnel and had expenditures totaling $625,52648 in FY 2018. Table 2.8 lists the specific activities of the unit and the targeted time for staff to spend on each during FY 2019.49 Because this unit is funded from the countywide General Fund, it is beyond the scope of this report, and the information is provided for informational purposes only.
Table 2.8. Long-Range Planning Activities, FY 2019
Activity
Percent of Time
Comprehensive Plan / Land Use 22% Regional Coordination 5% Intergovernmental Coordination 1% Small Area Plans 25% Reports / Research and Mapping 20% Customer Service / Zoning Counter 5% Special Projects 5% Transportation 15% Training / Administrative 2%
Development Division
The Development Division is responsible for building development services and business license administration. The Building Development Unit had a total of 44 filled positions at the end of FY 2018 and spent $6,287,283, including indirect costs and a transfer to the Capital Improvement Fund. This unit has cost centers for land development ($704,860), structural inspections ($1,401,835), permits and zoning ($1,046,571), environmental plan reviews and inspections ($430,449), and administration ($2,703,568).
The workload of the Building Development Unit depends on the level of construction within the unincorporated area. In FY 2018, unit personnel issued 23,622 building permits50 and completed approximately 3,350 residential and commercial building plan reviews, 565 land
48 This figure excludes General Fund expenditures for Planning and Sustainability department-wide administration, which totaled $1,052,483. 49 The Long-Range Planning Unit manager only provided FY 2019 information. 50 Miscellaneous, structural, and trade permits

43
development reviews, and 35,514 trade inspections. The unit had 19 inspectors51 on staff in FY 2018, which translates to an average of 1,869 inspections per inspector during the year. Because cost centers are not easily aligned with revenues for this unit, the best workload measure for the impact analysis is cost per FTE, which was $178,275.
The other unit within the Development Division is Business Licenses, which in addition to managing the county business licenses program also collects revenue for alcohol licenses, excise taxes, and franchise taxes. Though this unit collected $8,676,344 in revenue for FY 2018, it is rather small, with only five FTEs and expenditures of $755,541 (including $251,754 in indirect costs). The unit issued approximately 7,260 business and alcohol permits in FY 2018 and served 13,017 people who came in-person to receive service.52 Therefore, on average, each FTE issued 1,452 licenses and served over 2,603 persons in FY 2018. The cost per position equaled $151,108.
Police Services – Fund 274, Account 4600 The DeKalb County Police Department (DCPD) is one of the major agencies within the county’s Office of Public Safety. The DCPD had 840 filled positions53 and total expenditures within its special services fund (Fund 274) of $101,973,516 in FY 2018. The major expenditures from this fund were $72.2 million for personnel; $2.9 million for contracted services and supplies; $23.7 million for indirect costs, which included vehicle replacement; $800,000 in transfers to DeKalb cities; a $1.2 million transfer to the DeKalb County General Fund; $1.3 million to the Public Safety Judicial Fund as rent for the DCPD’s part of the facility that is operated out of that fund; and $370,000 in transfers to the Grant Fund.
The DCPD provides a full array of police services in the unincorporated area and to the cities of Stonecrest, Tucker, Lithonia, and Pine Lake. Because the last two cities require so little support, the Institute research team considered the designated service area for basic police services as including the unincorporated area, Stonecrest, and Tucker.54 Additionally, the research team only analyzed the impact of incorporation for Study Areas 2 and 3 because a previous study on the possible incorporation of Study Area 1 excluded police services. Therefore, in the tables presented in this section, the area referred to as “remaining unincorporated area” includes Study Area 1 plus any unincorporated land not part of any of the study areas (see Figure 1.1).
51 Position titles included building inspector, senior building inspector, land development inspector, senior development construction inspector, inspection supervisor, and inspections manager. 52 The count of business licenses came from revenue data sent by the department, and the number of persons served came from an end-of-year report provided by the planning and sustainability director. The research team surmises that people coming to the unit in person had general questions and did not all come to pay for a business license. 53 In FY 2018, the Police Department employed another 26 positions through the General Fund. 54 This greatly assisted the research team’s ability to geolocate services.

44
The DCPD includes the following major divisions:
• Executive Command Staff • Criminal Investigation Division (including Drug and High-Intensity Drug Trafficking
Areas (HIDTA), K-9, and Gangs units) • Special Operations Division • Internal Affairs • Uniform • E911 Communications • Police Records • Animal Services and Enforcement • DeKalb Emergency Management Agency
Figure 2.1. The DeKalb County Police Department Organizational Chart
In addition, the DCPD has the following support units: • Records • Service Support • Special Operations (SWAT) • Training • Precincts (supporting the distinct geographic units) • Intelligence/Permits • Recruiting and Background • Homeland Security • Intelligence-led Policing
While the DCPD supports all of these units, it does not consider all of them as primarily serving the unincorporated area and the specific special service districts, i.e., cities that have chosen to

45
receive some or all DCPD services. While most police staffing and activities are supported from Fund 274, approximately 26 public safety positions are funded through the General Fund. These positions include the public safety director and administrative staff that support police, fire, and E911 as well as countywide functions such as Animal Services, Emergency Management, and the medical examiner. A transfer to the General Fund from the Police Fund (Fund 274) covers 75% of the personnel costs for these positions, which suggests that countywide, taxpayers contribute approximately a quarter of the funding for these positions. Based on the percentage of the total Office of Public Safety budget that is related to police services, this 75% reimbursement seems rather high, e.g., the DCPD budget is approximately 54% of the total budget of Fire, Animal Services, and E911 Services. However, at least seven of these public safety positions are related to specific police services, including an officer responsible for planning and a number of officers working in aerial services.
Basic Versus Nonbasic Police Services
Cities in DeKalb County can choose to receive either police basic services, police nonbasic services, or both basic and nonbasic services, according to the Special Services Tax District Act. House Bill 1508 of Local and Special Acts and Resolutions (2010) defines basic and nonbasic police services as follows:
(A) Basic police services [are] comprised of services performed by the uniform division, traffic unit, park patrol, criminal investigation division, and crime scene investigation unit of the DeKalb County Police Department.
(B) Nonbasic police services [are] comprised of services performed by the aerial support unit, SWAT team, bomb squad unit, intelligence and permits, K-9 division, gang task force, drug task force, and homeland security division (emergency management) of the DeKalb County Police Department.
In addition to the special units mentioned in Georgia law as being part of the nonbasic services that cities can opt to receive from the DCPD, the Special Operations Division also operates the following units that are not part of these nonbasic services: the Strategic Traffic Accident Reduction (STAR) Team, the Strategic Traffic Enforcement Program (STEP) Team, and Motors/TAC.
The STAR Team is a group of officers funded through both budgetary funding and a Governor’s Office of Highway Safety (GOHS) grant to specifically target offenses related to driving under the influence (DUI). Most are certified drug recognition experts and conduct safety campaigns, including child restraint compliance education initiatives.

46
The STEP Team is a group of officers who target traffic-related offenses throughout the county. They drive patrol cars and primarily work the interstates and main roadways, aiming to reduce traffic-related accidents and injuries. They are employed to flood an area during critical incidents in progress, which allows precinct units to still manage 911 calls. They are also used for special details and escorts.
Motors/TAC are a group of officers who drive motorcycles and conduct traffic enforcement throughout the county. Motorcycles allow this unit to maneuver quickly through congested areas. This unit conducts traffic direction, escorts dignitary details, and provides special event support. The Traffic Specialist Unit similarly is used to help manage traffic issues on the roads in the DCPD jurisdiction.
These units (as well as non-special operations activities within the Special Operations Division) provide some services that in many police departments would be housed in a uniform division. Thus, in this analysis, the budgets for these units are allocated in a manner parallel to the method for allocating the Uniform Division’s activities and associated budgets.
In addition, the Special Operations Division operates a Security & Warrants Unit that engages people with outstanding warrants requiring special care in their apprehension.
Table 2.9. Special Units Expenditures, FY 2018
Bomb $787,367.21 SWAT $2,035,275.82 Aerial Within Special Operations $715,737.63 K-9 $1,110,561.31 Security & Warrants $583,871.87 Traffic Specialist $1,328,717.00 STAR team $508,473.32 STEP $1,164,834.69 Motors/TAC $1,962,044.12 Non-Special Operations $110,071.89 Total Special Operations Expenditures $10,306,954.86 Aerial Outside of Special Operations (Cost Center 04602 Administrative Services) $897,584.02
Note that special operations units receive significant monetary support through grants. This funding goes toward costs such as veterinary bills and dog food as well as vehicles and other operational equipment. Items charged directly to the grant are not captured in the police or General Fund activities. See the grants section at the end of this chapter for more information about these grants.

47
The Institute of Government research team attempted to contact representatives of the cities in DeKalb County listed as receiving basic and/or nonbasic police services from DCPD.55 The responding cities indicated that they use DeKalb police services to varying degrees. For example, the Avondale Estates police chief considers the DCPD as predominately a “standby” mechanism in case of a catastrophic incident for the nonbasic services it pays to receive. In contrast, the City of Decatur uses DCPD’s nonbasic services more frequently than the other DeKalb cities because it is the county seat and the center for governmental activities (e.g., the Maloof Building) and related protests. The City of Lithonia continues to pay for basic and nonbasic police services and uses the DCPD for nonbasic services such as crime scene investigations, SWAT, and aerial support. Additionally, Lithonia has occasionally used the DCPD to supplement the city’s own police force when understaffed over the last eight months. Similarly, Pine Lake, which also receives basic and nonbasic services from the DCPD, receives patrol from DCPD for its third-shift (the city only operates two shifts) as well as support for response services when needed. Institute researchers identified several instances within the DCPD financial data in which the expenditure or personnel allocations to basic versus nonbasic categories did not seem to exactly follow a layperson’s interpretation of the descriptions of these categories.56 These findings were presented to the DCPD management team, which responded promptly. The DCPD is in the process of correcting the accounting of basic and nonbasic expenditures. The pattern of slippage in the categorization of basic and nonbasic expenditures showed no evidence of any purposeful miscategorization. Rather, it seems likely that over time a mixture of organizational and personnel changes resulted in category mistakes. Because the contributions by cities participating in the nonbasic services represented such a small percentage of the DCPD’s FY 2018 budget, the accounting needed to track these contributions was deemed unnecessary.
Support services include both the services that are budget units within Fund 274 (e.g., records, internal affairs) and services funded from the General Fund (e.g., human resources, finance, purchasing). These latter services are allocated based on DeKalb County’s Cost Allocation Plan.
55 The cities of Avondale Estates, Chamblee, Clarkston, Decatur, Lithonia, and Pine Lake provided information, but the City of Stone Mountain did not respond. The cities of Stonecrest and Tucker do not have their own police departments and thus receive the same full complement of services as the unincorporated area. 56 Seven officer positions assigned to the aerial unit (a nonbasic service) were located in the General Fund; a high percentage of the Criminal Investigation Division expenditures were categorized as nonbasic; a low percentage of Special Operations expenditures were categorized as nonbasic; only about half of Homeland Security expenditures appeared to be categorized as nonbasic (In HB 1508, Homeland Security is described as a nonbasic service); and Crime Scene Investigation expenditures were categorized as nonbasic in the expenditure accounting but are not mentioned in the law as being nonbasic.

48
Table 2.10 shows the support services amounts drawn from the DCPD’s FY 2018 budget. The General Fund amounts are included in the nondepartmental category.
Table 2.10. DCPD Support Services Expenditures, FY 2018
Records $1,639,572.23 Assistant Director $1,639,572.23 Support Services $977,210.12 Internal Affairs $786,680.57 Training $4,589,925.77 Intelligence Permits $1,001,481.11 Recruiting $1,244,690.80 Homeland Security $740,399.79 Interfund $2,538,684.00 Nondepartmental (primarily General Fund) $7,737,730.00 Debt Service $1,304,148.00 Total $24,200,094.62 Bomb Unit $1,030,695.49 Total with Bomb Unit $25,230,790.11
Workload Analysis
This section identifies the likely resource demands that the study areas placed on the DCPD during FY 2018. Resource demands ultimately translate into expenditures and the need to fund these expenditures with revenues. The section first lays out the assumptions made in the analysis and then presents the data that best reflect the relative resource demands that the three study areas place on the DCPD. Ultimately, resource demands can also reflect the fiscal responsibility of the residents and taxpayers in the areas of interest to fund police services.
When analyzing the relative service and associated resource demands, the Institute of Government team made the following assumptions:
• Workload/resource demands on the Uniform Division generally reflect the distribution of service calls among the various service jurisdictions.
• Workload/resource demands on the Criminal Investigation Division (CID) and the Crime Scene and Intelligence units generally reflect the distribution of more serious incidents or service calls. Serious service calls include armed robbery, burglary, child abuse, murder, and rape.
• Because the Uniform Division is responsible for investigating property crimes, some portion of the workload/resource demands on this division are reflected in the distribution of more serious incidents or service calls.
49
• Workload/resource demands on the special service units generally reflect the distribution of incidents that these units respond to.
• The workload/resource demands on all other units of the DCPD (administration, support, training and recruiting, permits, and records) reflect the workload/resource demands placed on the direct services divisions (Uniform, CID, and special services units) in proportion to the expenditures made by these division.
As outlined in these general assumptions, the allocation of the workload of criminal investigations is based on the distribution of serious service calls (weighted by their level of seriousness) to the areas of interest. While the CID includes some special service units such as Narcotics, Gangs, and a K-9 unit, the geographical information about the location of these units’ services was not detailed enough to allow the researchers to allocate specific services, events, or activities to the specific study areas of interest. Consequently, these activities are considered to be part of the overall workload of the CID and are allocated to the areas of interest on the same basis as the activities of the CID in general, i.e., based on the distribution of weighted service calls.
Because the Uniform Division performs some criminal investigations, its workload is best measured through a combination of overall service call requests and the more serious calls for service likely to require a criminal investigator.57 To determine how best to combine these two measures of service demand, the Institute research team assumed that the workload weight given to general service calls versus more serious service calls should largely track the distribution of standard uniform officers to officers and staff assigned to criminal investigations. As the DCPD reported, the Uniform Division is staffed with a total of 349 officers, of which 38 are detectives. These numbers do not include supervisors. There are four investigative aides (one for each Precinct Investigative Unit). Based on these figures, the criminal investigations workload represented approximately 12% of the total workload for the Uniform Division. Based on this estimate, the research team established a weight of 7.3 for general service calls and a weight of 1 for more serious service calls.
Special operation units operating in the Special Operations Division include the Bomb Unit, the Special Operations K9 Unit, the SWAT Unit, and the Aerial Unit. For each of these units, the DCPD provided the services, events, and activities of these units by location. To the degree possible, the Institute of Government researchers geocoded these services, events, and activities
57 The precincts investigate all robbery events including pedestrian, residential, and commercial types. Precinct detectives also investigate all burglary events, commercial, residential, or other. Precinct detectives are assigned a variety of additional cases, including entering auto, felony shoplifting, all elder abuse cases involving theft/fraud, felony theft, identity theft (suspect known or alleged), forgery/fraud, trailer theft, auto theft if the vehicle was taken by deception or coercion, vehicle thefts involving motors less than 49ccs, located or found property, felony criminal damage, misdemeanor criminal damage if the suspect is known, and domestic events if property is damaged.

50
and established counts of these for each of the study areas. However, when allocating the costs of units to the geographical areas of interest, the research team had to make a few adjustments. First, because some resources used by the Aerial Unit come out of the General Fund (rather than Fund 274), the research team added these costs to the Aerial Unit’s expenditures and subtracted them from the General Fund reimbursement amount.58 Second, because the geocoding of the Bomb Unit’s activities indicated that these services were primarily provided to either the City of Atlanta (to sweep the Mercedes-Benz Stadium) or to DeKalb County in its general countywide governance capacity (to sweep the locations where the DeKalb Board of Commissioners meet), the Bomb Unit’s services are treated as a general support service and thus considered to be a countywide service. Finally, because of the nature of a Security and Warrants Unit’s mission, for the purposes of this study, its budget allocation was aligned with the allocation of activities/funds based on the share of calls for services deemed “serious” (in line with the classification used to determine the need for criminal investigation services).
The Institute research team used service requests and caseload data to assess the DCPD workload. The sections that follow present this information. First, an overview of workload data from these sources is given. Some of these data are informative but are not specific enough to be used in the workload analysis for the specific scenarios and areas of interest discussed in Chapters 3 and 4. For example, data on special unit activities that is available by police precinct but not by the proposed incorporation areas is presented. Next, specific service call and caseload data that can be used in the later analyses are presented.
Service requests were assessed by examining and analyzing geocoded calls for service as recorded by DeKalb E911.59 Calls for service are primarily received from residents of the DCPD service areas. However, the call data include some calls from officers notifying the E911 dispatchers that they were performing a particular activity such as a business check. In addition, some of the call records involved DCPD officers responding to requests for assistance outside of the department’s designated service areas.
DeKalb County recently installed an information system with geolocation capabilities and thus provided the research team with nine months of geocoded service call data (April 2018 through December 31, 2018).60 Because these data included the higher activity summer months, they are
58 See the Revenues Section later in this chapter for more information on the General Fund transfer to the Police Services Fund (Fund 274). 59 Call takers at DeKalb E911 often receive from the system a message saying that a call is possibly a duplicate call. According to a representative of the E911 unit, they tend to send the call anyway and let the dispatcher determine whether it is a duplicate call. The E911 representative estimated that duplicates could account for up to about 20% of calls and is more likely to happen with public events such as auto accidents, fires, and shootings. 60 Includes 10 calls from January 1, 2019.

51
fairly representative of annual activity levels or at least when extrapolated out to a full year’s worth of service calls do not represent an undercount of the actual annual activity level.
The research team analyzed the geocoded data using spatial queries to generate counts of service calls within specific geographical areas of interest. To more clearly capture the police services workload related to the scenarios of interest for this report, service calls originating outside of the county or in cities not contracted for uniform patrol services were excluded from the sample.61 Table 2.11 presents the results of this analysis.
Table 2.11. DeKalb County Police Department Service Calls, 2018
Service Area Service Calls
(9 months) Service Calls Annualized
Percent of Total
Unincorporated Area Only 177,485 238,169 78.4% Study Area 2 19,679 26,407 8.7% Study Area 3 30,641 41,118 13.5% Remaining Unincorporated Area 146,844 197,052 64.9%
Stonecrest 29,055 38,989 12.8% Tucker 19,750 26,503 8.7% Total Service Area 226,290 303,661 100.0%
*Note: Service calls and percentages are not cumulative as Study Areas 2 and 3 overlap. Table 2.11 shows that 21.5% of all service calls originated in Stonecrest and Tucker, which receive all police services from DeKalb County (and fund these services through special services district property taxes). In contrast, Study Area 3 (which includes Study Area 2) accounts for only 13.5% of service calls. Consequently, were Study Area 3 to incorporate, the DCPD would still have nearly 83% of its current workload, based on service calls.
This view of the service call data allows one to better understand the service workload percentages in a way that can translate into an equity view of the relative share of resource support (or funding) for services received. That is, if one assumes that all the designated serviced areas share proportionally in the cost of servicing the nondesignated areas, then by excluding these areas, one can identify the actual share of funding responsibility for each jurisdiction (assuming that funding generally tracks services received). For example, if the City of Tucker accounts for 9% of the service calls in the designated DCPD service area, then the City of Tucker would be expected to contribute (through its special services district taxes) 9% of the cost of the DCPD services that are reflected by service call demand.
61 In the nine months of data analyzed, 2,937 (2.2%) calls came from outside of the county and 1,970 came from DeKalb cities without contracted uniform services.

52
DCPD operates the following special units:
• Narcotics • Vice • HIDTA or Homeland Security • Gangs • Aerial • SWAT • K-9 • Bomb
Narcotics, Vice, Gangs, and a portion of the K-9 Unit fall within the Criminal Investigation Division. SWAT, most of K-9, the Bomb Unit, and the Aerial Unit are part of the Special Operations Division. However, several staff/officers in the Aerial Unit are funded directly through the General Fund rather than Fund 274, although Fund 274 repays the General Fund for their services.
Table 2.12 presents the count of incidents handled by the CID’s special units within the DCPD precincts as well as municipal jurisdictions other than Stonecrest and Tucker. Note that the DCPD’s precincts do not exactly match the boundaries of the cities of Tucker and Stonecrest or of the study areas. Consequently, the special unit incident data are not used in the analyses of the incorporation/service change scenarios in Chapters 3 and 4. Nevertheless, these data do provide some insight into the distribution of the workload of these units within the county as a whole. Figure 2.2 presents a map of the DCPD precincts to give context for the distribution of incidents within these areas.

53
Table 2.12. 2018 Criminal Investigation Division–Related Incidents, FY 2018
Geographic Area Narcotics Vice HIDTA K-9 (Rex) East Precinct 101 25 0 1 North Central Precinct 84 31 5 2 South Precinct 128 74 5 2 Tucker Precinct 113 25 1 1 Atlanta 1 1 0 1 Brookhaven 2 3 2 0 Clarkston 0 1 0 1 Chamblee 0 0 0 0 Doraville 2 0 0 0 Dunwoody 0 0 0 0 Pine Lake 0 1 0 0 Out of County 3 1 5 5 Total Operations 434 162 18 13

54
Figure 2.2. DeKalb County Police Precincts

55
In 2018, the Gangs Unit reported taking 1,417 actions, requiring a total of 6,633.5 work hours. Many of these actions were taken in coordination with out-of-county police departments and other law enforcement agencies such as the federal Bureau of Alcohol, Tobacco, Firearms, and Explosives, district attorney offices, the federal Drug Enforcement Agency, the FBI, and sheriff’s offices. Table 2.13 shows the geographic distribution of Gangs Unit activities within DeKalb County, based on the 2018 Gangs Unit Report.
Table 2.13. Geographic Distribution of Gangs Unit Activities
Hours of Unit Work DCPD Precincts East CID 76 East Uniform 64 North Central CID 19 North Central Uniform & Net 118.5 South CID 30.5 South Uniform 118.5 Tucker CID 85.5 Tucker Uniform 34 Cities in DeKalb Atlanta 59.5 Brookhaven 59 Chamblee 65
Serious Service Calls
The Criminal Investigation Division’s workload is best reflected in the more serious calls for service. To translate service calls into CID workload, the Institute of Government research team selected 89 (out of more than 200) service call incident types that seemed to potentially require more concerted response by the DCPD. The DCPD then assessed these service call incident types and weighted each based on the amount of time and other resources the DCPD would expend on that type of service call. Weights ranged from 1 for a relatively low-demand call type to 5 for a high-demand call type.
Of the total service calls made to the DCPD, approximately 32% were identified as potentially requiring criminal investigation services. Most of these serious calls were weighted as 1. However, because some calls were weighted as high as 5 (or five times the relatively low-weighted calls), areas with both more calls designated as “serious” and more higher-weighted calls would likely demand more criminal investigation resources. Table 2.14 shows the weighted values of the serious calls for service by the study areas.

56
Table 2.14. Serious Service Calls
Service Area
Count of Weighted Service Calls (9 months)
Annualized Service Calls
Percent of Total
Unincorporated Only 75,121 100,805 79.7% Study Area 2 5,633 7,559 6.0% Study Area 3 8,483 11,383 9.0% Remaining Unincorporated Area 66,638 89,422 70.7%
Stonecrest 13,246 17,775 14.0% Tucker 5,922 7,947 6.3% Total Designated Service Area 94,289 126,527 100.0%
Table 2.15 compares the percentage of general service calls by study area to the percentage of weighted serious service calls by study area, showing the areas likely to require more criminal investigation services and other services.
Table 2.15. Comparison of General and Serious Service Calls
Service Area
Serious Service Calls General Service Calls
Percent of Total Percent of Total Unincorporated Only 79.7% 78.4%
Study Area 2 6.0% 8.7% Study Area 3 9.0% 13.5%
Remaining Unincorporated Area 70. 7% 64.9% Stonecrest 14.0% 12.8% Tucker 6.3% 8.7%
Total Designated Service Area 100.0% 100.0%
As revealed in Table 2.15, the following areas have greater-than-average need for criminal investigations and related services:
• Unincorporated only • Stonecrest • The remaining unincorporated area

57
Other areas have a less-than-average need for criminal investigations and related services:
• Study Area 2 • Study Area 3 • Tucker
In 2018, the Bomb Unit reported 138 incident or prevention activities. Of these, 47 (more than one-third) involved services provided to the City of Atlanta, primarily at the Mercedes-Benz Stadium.
The next most frequent service provided by the Bomb Unit involved sweeping the Maloof Auditorium or other facilities prior to commission meetings. This service was performed 42 times, representing approximately 33% of the total service calls. Another 13% of service activities for the Bomb Unit involved instruction or demonstrations. Four additional cities in the county received assistance from the unit: Dunwoody (four times), Brookhaven (one time), Clarkston (one time), and Stone Mountain (one time). Neither Dunwoody nor Brookhaven pay for nonbasic services, which include the Bomb Unit. The cities of Covington and Sandy Springs also received services from the Bomb Unit once, despite being outside the county. Finally, Stone Mountain Park also requested the assistance of the unit once in 2018.
In all, only about 12% of the Bomb Unit services were provided to the areas of interest for this study. Given the low number of these activities of interest, analyzing the geographic distribution of the activities and associated costs would not be meaningful, as the distribution of activities could radically change from year to year.
The DCPD’s SWAT Unit reported 67 incidents (or activations) in 2018. Of these, eight services were provided to outside agencies, and one was a response for a call for service in the City of Atlanta.62 Institute of Government researchers were able to geocode 55 of the remaining 59 SWAT incident addresses that fell within the DCPD service area and calculated counts for each of the areas of interest in this study. Table 2.16 presents these findings.
62 These included three requests from the City of Atlanta, one from the Veterans’ Affairs Hospital, one from the City of Clarkston Police Department, one from the FBI in Atlanta, and one from the Department of Drug Enforcement in Atlanta.

58
Table 2.16. SWAT Events/Services in the DCPD Designated Services Area, FY 2018
Service Area Events/Service
Activities Percent of Total Unincorporated Only 49 89.1%
Study Area 2 0 0.0%
Study Area 3 1 1.8% Remaining Unincorporated Area 48 87.3%
Stonecrest 2 3.6% Tucker 4 7.3%
Total in Designated Service Area 55 100% The Aerial Unit reported 3,267 events, approximately 2,625 of which were basic patrol events rather than specific requests for aerial services, such as helping spot an escaped prisoner or tracking a burglary in progress. To assess the distribution of the workload of this unit across the geographic areas of interest, the research team geocoded the addresses reported in the Aerial Unit work report.63 Approximately, 602 addresses were geocoded, 420 of which were in the DCPD service areas of interest for this study (see Table 2.17). The remaining were either in cities in DeKalb County (35) or outside of the county.
Table 2.17. Aerial Unit Events/Services in the DCPD Designated Services Area, FY 2018
Service Area Events/Service
Activities Percent of Total Unincorporated Only 321 76.4%
Study Area 2 4 1.0%
Study Area 3 9 2.1% Remaining Unincorporated Area 312 71%
Stonecrest 57 13.6% Tucker 42 10.0%
Total in Designated Service Area 420 100%
The K-9 Unit of the Special Operations Division also reported service event locations. These locations were geocoded and analyzed based on the areas of interest. A total of 137 service
63 Note that the location data provided by the DCPD were often partial and did not conform to common geocoding requirements. Thus, the level of error in the geocoded results could be higher than desirable. The Institute team used the Google geocoder as it is more adept at locating non-address type locations such as a park, mall, or subdivision name, which was often the form in which the location data were provided.

59
events were identified in the areas of interest, and an additional nine events were identified as located in other cities in DeKalb County (see Table 2.18).
Table 2.18. K-9 Unit Events/Services in the DCPD Designated Services Area, FY 2018
Service Area Events/Service
Activities Percent of Total Unincorporated Only 115 83.9%
Study Area 2 3 2.2%
Study Area 3 4 2.9% Remaining Unincorporated Area 111 81.0%
Stonecrest 17 12.4% Tucker 5 3.6%
Total in Designated Service Area 137 100%
The total expenditures for the DCPD in FY 2018 were $101,973,516. Of this amount about $71 million comprised DCPD salaries, plus benefits, overtime, and other personnel costs.
The research team categorized expenditure data into four major groups: investigations, uniform, special units, and support services. These major categories include subunit services. Thus, the totals presented here may not exactly match an expenditure category used by the DCPD that has a similar name. As will become clear in the next chapter, the categorization of expenditures presented here was chosen to support the workload analysis used to estimate the cost of serving the areas of interest in this study.64
The first three of these categories involve direct service delivery. Table 2.19 presents expenditure amounts for these three categories in FY 2018.
Table 2.19. Direct Service Delivery Expenditures by DCPD, FY 2018
Type of Expenditure Amount % of Total Direct Services Investigations $14,242,870 18.8% Uniform $56,775,049 74.9% Special Operations $4,759,159 6.3% Total $75,777,078 100.0%
64 Our categorization of expenditures diverges from DCPD nomenclature particularly with regard to the special operations.

60
Support services expenditures constitute the remaining $26,196,438 of DCPD expenditures in FY 2018.
Investigations
Investigation expenditures were made within four DCPD units: the Criminal Investigation Division, Crime Scene Investigations, Intelligence, and the Special Operations Warrants Unit. Table 2.20 shows the expenditures related to each of these units in FY 2018.
Table 2.20. Investigation Expenditures by DCPD, FY 2018
Expenditure Amount Criminal Investigations $10,428,759 Crime Scene Investigations $1,200,883 Intelligence $2,029,357 Special Operations Warrants $583,872 Total $14,242,870
Uniform
The uniform category’s expenditures were made by three units: the Uniform Division, the Precincts budget item, and the Special Operations Traffic unit. Table 2.21 shows the expenditures related to each of these units in FY 2018.
Table 2.21. Uniform Expenditures by DCPD, FY 2018
Expenditure Amount Uniform $51,802,991 Precincts $73,823 Special Ops, Traffic, etc. $5,074,141 Animal Control –$175,906 Total $56,775,049
Note: Animal Control is a General Fund expenditure and so is omitted from this analysis.
Special Operations Category
For this study, the category of special operations is limited to three service units: the Aerial Unit, the SWAT Unit, and the K-9 Unit. Table 2.22 shows expenditures for these units in FY 2018.

61
Table 2.22. Special Operations Expenditures by DCPD, FY 2018
Expenditure Amount Aerial Unit $1,613,322 SWAT Unit $2,035,276 K-9 Unit $1,110,561 Total $4,759,159
Support Services
Support services include both the services that are budget units within Fund 274 (e.g., records, internal affairs) and services funded from the General Fund (e.g., human resources, finance, purchasing). These latter services are allocated based on DeKalb County’s Cost Allocation Plan.
Table 2.23 shows the support services amounts drawn from the detailed FY 2018 expenditure data spreadsheet provided by DeKalb County. The General Fund amounts are included in the “nondepartmental” category.
Table 2.23. Support Services Expenditures by DCPD, FY 2019
Expenditure Amount Records $1,639,572.23 Assistant Director $1,639,572.23 Support Services $977,210.12 Internal Affairs $786,680.57 Training $4,589,925.77 Intelligence Permits $1,001,481.11 Recruiting $1,244,690.80 Homeland Security $740,399.79 Interfund $2,538,684.00 Nondepartmental (primarily General Fund) $7,737,730.00 Debt Service $1,304,148.00 Total $24,200,094.62 Bomb Unit $1,030,695.49 Total with Bomb Unit $25,230,790.11
Benchmarks
A number of benchmarks could be used to assess DCPD expenditures. Table 2.24 presents data on the FY 2018 cost per sworn officer, cost per FTE total, cost per capita, cost per $100,000 in property value, and officers per 1,000 residents.

62
Table 2.24. DCPD FY 2018, Benchmark Calculations
Cost Per Sworn Officer FY 2018 Total Expenditures $101,973,516 Sworn Officers 716.5 Measure $142,321.73
Costs Per FTE Total Total Expenditures $101,973,516 Total FTEs 805.3 Measure $126,627.98
Costs Per Capita Cost Per Capita Basic $146.07 Cost Per Capita Nonbasic $35.49 Measure $181.56
Costs Per $100,000 in Fair Market Value Total FMV $38,714,464,485 Measure $263.40
Officers Per 1,000 Population Total FTE Officers 716.5 Measure 1.49
Public Works Divisions of Roads and Drainage, and Transportation – Fund 271, Accounts 5700 and 5400 and Funds 211 and 212 Roads and Drainage, and Transportation are two divisions within the Department of Public Works. The missions of these two divisions complement each other as both are focused on maintaining and improving the roadway system within their service area. For FY 2018, that service area included the unincorporated area, Stonecrest, and Tucker; however, the two cities may elect to maintain their own roads in the future.
The Roads and Drainage Division manages several programs beyond roadways, such as the stormwater utility and dam and bridge maintenance, but these are accounted for in the Stormwater Utility Enterprise Fund and not analyzed in this report.

63
The following responsibilities were reviewed for this report:
• Resurfacing and patching asphalt roadways and filling potholes • Managing the traffic signal system
o Installing and maintaining traffic signals, school flashers, and intersection beacons
• Constructing and maintaining sidewalks • Striping lanes on roadways • Issuing permits for signage, sign toppers, house moving, and haul routes
The Transportation Division, which can be viewed more as the traffic engineering arm for the county’s roadway system, has the following responsibilities:
• Managing infrastructure projects, such as those funded from the Homestead Optional Sales Tax (HOST) and the Georgia Department of Transportation
• Developing internal construction planning • Inspecting the construction work of major utility companies, Georgia Department of
Transportation projects, and other county-implemented projects • Acquiring land for right-of-way easements for the county • Issuing permits such as for utilities and lane closures • Managing the street light program and the residential calming program • Conducting traffic studies
The combined operating expenditures for the two divisions in FY 2018 were $20,235,390, including $1,640,092 in indirect administrative costs. At the end of the fiscal year, the Transportation Division had 15 filled positions and Roads and Drainage had 124. Both division directors recommended geographically allocating expenditures and workload for their divisions through center-lane miles. See the Methodology Section in Chapter 1 for a discussion of how the research team allocated road miles across the study areas. Table 2.25 lists the mileage for each of the study areas. The miles of roadway presented in this table differ from those presented in Table 2.3 for Beautification because Roads and Drainage and Transportation’s service areas included Stonecrest and Tucker in FY 2018.

64
Table 2.25. Distribution of Center-Lane Miles Across Service Areas, FY 20181
Study Area 1 Study Area 2 Study Area 3
Remaining Unincorporated
Stonecrest & Tucker
Miles of Road 921.8 178.3 253.0 46.4 279.4 Percentage 61.4% 11.9% 16.9% 3.1% 18.6%
1. Individual areas summed exceed 100% because Area 3 includes Area 2.
The divisions also manage two services within special revenue funds: speed humps and street lighting. The public can request a speed hump for their street. If a speed hump is deemed appropriate, the public pays the Division of Roads and Drainage to install it. In FY 2018, the Speed Hump Fund (Fund 212) spent $192,526. The operating expenditures are allocated according the percentage of revenue generated within each area. This was possible because the Tax Commissioner provided the speed hump charges assessed to property owners by study area.
The Transportation Division manages the Street Light Program (Fund 211). Property owners petition to install a street light. If the petition is approved by the county commission and the street light is erected, property owners are annually assessed a charge on their property taxes. In FY 2018, the program spent $5,311,105, nearly all of which was used to purchase electricity. Like speed humps, street lights expenditures were allocated geographically because of the revenue data provided by the DeKalb County Tax Commissioner.
Based on data provided by the director for the Division of Roads and Drainage, in FY 2018, the county spent on average $8,109 to maintain one mile of road (sum of pothole repair, resurfacing, patching, striping, sidewalk maintenance/replacement, construction); $5,231 to maintain one street signal, intersection beacon, or school flasher (including electricity costs); and $4,877 to build one speed hump (contractor cost).
Recreation, Parks, and Cultural Affairs – Fund 271, Account 6100 and Fund 207 The Department of Recreation, Parks, and Cultural Affairs is responsible for managing the county’s parks, recreation facilities, and the Porter Sanford Performing Arts Center. The department’s total expenditures for FY 2018 were $19,189,866,65 including indirect costs allocated to the department. This figure excludes a $635,210 payment to the City of Tucker for assuming ownership of parks in the spring of that year. The department had 97 filled full-time permanent positions at the end of the fiscal year and spent $1,489,282 in temporary salaries.
Table 2.26 lists the department’s cost centers that served both the Parks and Recreation divisions. These expenditures were split between the two divisions based on the percentage of direct expenditures each utilized in FY 2018 (Parks 55%, Recreation 45%).
65 Special Services Fund (271) and Recreation Fund (207).

65
Table 2.26. FY 2018 Recreation, Parks, and Cultural Affair Administrative Expenditures (Fund 271)
Cost Center Park
Allocation Recreation Allocation
Total Expenditure
Administration1 $1,312,291 $1,054,330 $2,366,621 Special Populations $9,705 $7,798 $17,503 Planning and Development2 $268,947 $216,080 $485,027 Support Services $18,168 $14,596 $32,764 Marketing and Promotion $128,325 $103,099 $231,424 Indirect Cost Allocation $2,726,904 $267,470 $2,994,374 Total $4,464,340 $1,663,373 $6,127,713
1. Less $635,210 paid to the City of Tucker 2. Cost centers 6113 ($260,810) and 6121 ($8,137)
The majority of the department’s expenditures, through its cost center accounting, were allocated to either parks or recreation. Tables 2.27 and 2.28 present the total expenditures for each division by cost center. These will be used in Chapter 3 to determine impact from the possible incorporations of Study Areas 1, 2, and 3.

66
Table 2.27. Parks Division Expenditures, FY 2018
Cost Center Fund Expenditure Administration 271 $1,312,291 Special Populations 271 $9,705 Mason Mill Tennis Center 271 $15,906 Mystery Valley Golf 271 $1,915 Sugar Creek Golf 271 $72,655 Planning and Development 271 $260,810 Aquatics 271 $518,581 Parks Division Admin. 271 $1,193,285 District 1 Service Center 271 $1,470,239 District 2 Service Center 271 $1,418,425 District 3 Service Center 271 $1,819,166 Support Services 271 $18,168 Horticulture & Forestry 271 $28,280 Planning and Development 271 $8,137 Sugar Creek Tennis Center 271 $1,000 Natural Resource Mgt. 271 $145,659 Marketing and Promotion 271 $128,325 Little Creek Horse Farm 271 $427,983 Indirect Cost Allocation 271 $2,726,904 Outdoor Recreation 207 $60,899 Total Parks Expenditures $11,638,333

67
Table 2.28. Recreation Division Expenditures, FY 2018
Cost Center Fund Expenditure Administration 271 $1,054,330 Special Populations 271 $7,798 Summer Programs 271 $122,191 Recreation Div. Admin. 271 $521,146 Recreation Centers 271 $3,552,412 Planning and Development 271 $216,080 Support Services 271 $14,596 Marketing and Promotion 271 $103,099 Cultural Affairs 271 $329,834 Youth Athletics 271 $250,190 Indirect Cost Allocation 271 $267,470 Arabia Mountain 207 $577 Therapeutic Rec Program 207 $16,125 Exchange Park 207 $23,856 Lucious Sanders Rec Center 207 $27,438 Redan Park Rec Center 207 $18,568 Gresham Rec Center 207 $36,668 NH Scott Rec Center 207 $18,399 Midway Rec Center 207 $26,695 Tobie Grant Rec Center 207 $5,780 Tucker Rec Center 207 $13,661 Browns Mill Rec Center 207 $63,615 Playground Day Camp 207 $4,791,977 Hamilton Rec Center 207 $6,850 Adult Softball 207 $2,164 Youth Sports 207 $60,014 Total Recreation Expenditures $7,551,533
In FY 2018,66 the county had the following park and recreation assets: 6,548 acres of parkland, which included 114 parks, 10 recreation centers, eight swimming centers, two golf courses, two tennis centers, and dozens of playgrounds and playing fields. Because the two golf courses were managed through a contract (575 total acres), these two amenities are excluded from this report’s calculations. Note that both golf courses are located in Study Area 1. Additionally, because the department managed Tucker’s parks (277.3 total acres) for 25% of the year, one-
66 This figure excludes assets transferred to the City of Tucker, which took control of them in the spring of 2018. However, it does include parks and recreation facilities within the boundaries of the City of Stonecrest (eight parks with 349.5 acres, including one recreation center), which assumed control over them in the fall of 2019.

68
fourth of those acres, 69.3, are considered to be part of the park division’s responsibility in FY 2018 and are included in the cost calculations. Table 2.29 shows the park acreage used to determine park maintenance costs for this report. The acreage figure of 6,042 translates to the county spending an average of $1,926 to maintain one acre of a park in FY 2018.67
Table 2.29. Park Acreage Used to Determine Park Maintenance Costs
Acres End of FY 2018 Park Acres 6,548 Less Mystery Valley Golf Course –265 Less Sugar Creek Golf Course –310 Plus Tucker Parks 1/1–3/31 69 Net Park Division Maintenance 6,042
Table 2.30 shows the distribution of parks and park acreage across the areas of interest for this study, which includes the unincorporated area, Tucker, Stonecrest, and Lithonia, whose residents pay for DeKalb County parks and recreation services through the special services property tax. Note that the Remaining Unincorporated figures includes Lithonia parks.
Table 2.30. Distribution of Parks Across Service Areas, FY 2018
Study Area 1 Study Area 2 Study Area 3 Remaining
Unincorporated1 Stonecrest & Tucker
Park Number 68 12 26 12 19 Acreage 2,465.2 120.5 346.6 2,811.4 418.8
1. Includes parks in Lithonia
Note that the large amount of acreage remaining in the unincorporated area is due to the Davidson–Arabia Mountain Nature Preserve, comprising 2,705.7 acres. The other 11 parks total only 105.7 acres. When Arabia Mountain is excluded from the analysis, the vast majority of parks are within Study Area 1 and so is park acreage. Study Area 2 has the fewest number of parks of the three study areas as well as the least park acreage.
DeKalb County recreation centers, programs, and pools are popular with residents. A total of 719,585 participants utilized the county’s various recreation programs in FY 2018. (Park visitors are not tracked.) Table 2.31 shows the distribution of participation by program type. Recreation centers and summer camps had the most participants in FY 2018. Although the Therapeutic Recreation Program served fewer people, its program is quite meaningful to those who use it.
67 $11,638,333 / 6,042 = $1,926

69
Table 2.31. Distribution of Recreation Participation by Program Type, FY 2018
Therapeutic Recreation
Summer Camp
Recreation Centers Aquatics Athletics
Participants 5,365 221,284 248,831 177,130 66,975 Percent 0.7% 30.8% 34.6% 24.6% 9.3%
Table 2.32 shows the level of participation by participant group and location and is inclusive of all recreation and aquatics programs. The largest number of participants were youth, which makes sense because of the county’s summer camp program. The most popular recreation facilities were Gresham, Hamilton, Mason Mill, and Browns Mill. Browns Mill’s large participation number comes from aquatics as the facility includes a splash pad, water slides, and a large main pool.
Table 2.32. Recreation Participation by Group and Recreation Facility, FY 2018
Center Youth (5–12)
Teens (13–17)
Adults (18 +)
Seniors (50 +) TRP1 Total
Browns Mill 91,652 9,790 4,428 1,920 0 107,790 Exchange 3,039 2,834 16,125 13,353 522 35,873 Gresham 163,756 6,180 8,750 1,920 0 180,606 Hamilton 105,960 32,155 336 5,944 370 144,765 Lucious Sanders 13,979 12,560 730 0 0 27,269 Mason Mill 67,125 5,058 9,043 39,451 2,988 123,665 Midway 6,300 2,450 0 0 0 8,750 NH Scott 14,343 2,112 2,021 485 0 18,961 Redan 7,710 3,919 41,042 6,426 1,485 60,582 Tobie Grant 7,897 1,142 1,401 884 0 11,324 Total Participants 481,761 78,200 83,876 70,383 5,365 719,585
1. Therapeutic Recreation Program
With 719,585 participants and recreation operating expenditures totaling $7,551,533, the average cost per recreation participant was $10.50 in FY 2018.
Like for parks, the location of the recreation centers and participants can be allocated across the service areas. Table 2.33 presents this information. Note that these figures exclude participants at the Little Creek Horse Farm, which is within the remaining unincorporated area, as well as participants of the Porter-Sanders Cultural Center, which is located in Study Area 1.

70
Table 2.33. Distribution of Recreation Participation Across Service Areas, FY 2018
Study Area 1 Study Area 2 Study Area 3
Remaining Unincorporated1
Stonecrest & Tucker
Participants 304,772 0 123,665 183,358 107,790 Percent2 42.3% 0.0% 17.2% 25.5% 15.0% Recreation Facility 5 0 1 3 1
1. Includes recreation center in Lithonia 2. Individual areas summed exceed 100% because Area 3 includes Area 2 Table 2.33 shows that Study Area 2 does not contain a recreation center and, again, that Study Area 1 contains most of the recreation centers in the unincorporated area. Tucker did not acquire any recreation centers with incorporation, but Stonecrest acquired the Browns Mill Aquatic Center.
Traffic Court – Fund 272, Account 370068 The traffic court in DeKalb County is a division of State Court and is responsible for processing all traffic citations originating in the unincorporated area as well as in the jurisdictions where the DeKalb County Police Department provides basic police services, which include traffic enforcement. At the end of FY 2018, traffic court funded 50 full-time employees, including four state court judges,69 with operating expenditures totaling $5,327,143 with indirect cost allocations. This amount equaled $106,543 per filled position. In FY 2018, the DCPD issued a total of 48,691 tickets (48,487 tickets and 204 driving under the influence arrests).70 This translates to a cost of $109.41 to adjudicate a ticket in traffic court. Traffic Court also generated $8,348,081 in FY 2018, equaling an average revenue per ticket of $171.45. These figures also show that the court generated positive net income (revenues less expenditures) of $3,020,938.
GIS data on the exact location of traffic citations is unavailable, so the research team distributed workload and expenditures to the study areas based on population. Table 2.34 shows the distribution of residents across the service areas, the unincorporated area, and Stonecrest and Tucker.
68 The Institute of Government researchers were unable to acquire data on the number of traffic citations processed by the DeKalb County Traffic Court in FY 2018. 69 The DeKalb County Traffic Court website only lists three judges. The Institute research team used the personnel report for filled and unfilled positions provided by the DeKalb County Budget Office throughout this report. 70 The research team did not receive actual citation information from the courts and thus relied on citation information from the DeKalb County Police Department.

71
Table 2.34. Population Distribution for Traffic Court Service Area, FY 2018
Study Area 2
Study Area 3
Remaining Unincorporated
Stonecrest & Tucker
Total Population
61,089 93,136 303,301 83,586 480,023 12.7% 19.4% 63.2% 17.4% 100%1
1. Individual areas summed exceed 100% because Study Area 3 includes Study Area 2.
Capital and Grants Beyond operating expenditures, DeKalb County invests in capital infrastructure to maintain its assets within the unincorporated area. To fully measure the impact of further incorporation of currently unincorporated areas, it was important to also consider any potential savings to the county from no longer needing to address capital needs in areas it does not serve. Because capital investment typically varies substantially from year to year, the research team examined capital spending for FYs 2014–2018, focusing on capital funded from revenues generated in the unincorporated area. HOST-funded capital was not considered because HOST would not be impacted by further incorporation. Because this study measures impact of incorporation for a single fiscal year, FY 2018, the capital expenses from FYs 2014–2018 were averaged. This annual average established a fair estimate for capital spending by the county for the unincorporated services.
Tables 2.35 to 2.39 provide a complete list of capital investments funded through the various tax funds. Capital spending related to grants is discussed later in this section.
The capital expenses for the Department of Planning and Sustainability are associated with long-term leases to improve the department’s permitting processes. These leases will be repaid in FY 2020. Normally, Planning and Sustainability would not experience such an extensive capital investment as its work is not infrastructure-based such as with parks and road maintenance. Because a permitting system is not associated with a specific geographic area and thus would occur regardless of a specific incorporation, these expenses are excluded from this analysis.

72
Table 2.35. Capital Spending for Planning and Sustainability, FYs 2014–2018
Project Tax Fund Fiscal Year Amount Permitting System 272 2018 $328,814 Technology Project 272 2017 $111,256 Permitting System 272 2017 $259,009 Permitting System 272 2016 $370,265 Permitting System 201 2018 $314,379 Permitting System 201 2017 $247,490 Permitting System 201 2016 $1,747,490 Permitting System 201 2014 $247,490 Total Capital $3,626,193 Average Annual Spending $725,239
The capital purchase of body cameras for the DCPD was a one-time event. According to a DCPD representative, in the future, body cameras will most likely be acquired via a yearly allocation for expected replacement costs according to a lifetime cycle cost. Because it is unclear whether this capital expenditure will become an ordinary and ongoing cost, the analysis only includes the capital costs that have already been incorporated into the Fund 274 operational budget. However, if this new capital expenditure becomes ongoing, the research team estimates the impact on expenditures would be minor.71
Table 2.36. Capital Spending for Police, FYs 2014–2018
Project Tax Fund Fiscal Year Amount Uniform Officer Body Cameras 274 2017 $600,000 Total Capital $600,000 Average Annual Spending $120,000
Not surprisingly, the largest average annual capital spending comes from the Divisions of Roads and Drainage and Transportation within the Department of Public Works. The $1.6 million in annual spending shown in Table 2.37 translates to $1,074 per center-lane mile for the full service area, i.e., the unincorporated area and the cities of Stonecrest and Tucker.
71 If Study Area 2 incorporated, the amount of additional revenue needed to support current services in the remaining service area would be $8,943. If no additional revenue were available, this would translate to reduction of 6% of an FTE police officer.
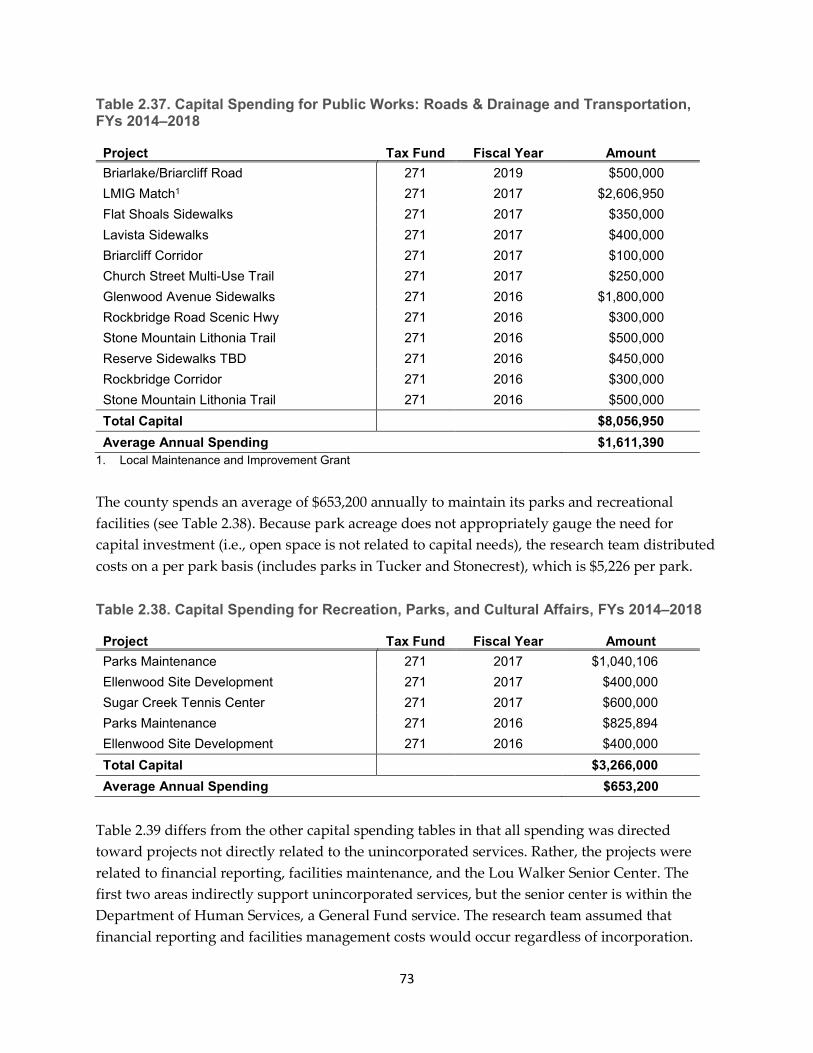
73
Table 2.37. Capital Spending for Public Works: Roads & Drainage and Transportation, FYs 2014–2018
Project Tax Fund Fiscal Year Amount Briarlake/Briarcliff Road 271 2019 $500,000 LMIG Match1 271 2017 $2,606,950 Flat Shoals Sidewalks 271 2017 $350,000 Lavista Sidewalks 271 2017 $400,000 Briarcliff Corridor 271 2017 $100,000 Church Street Multi-Use Trail 271 2017 $250,000 Glenwood Avenue Sidewalks 271 2016 $1,800,000 Rockbridge Road Scenic Hwy 271 2016 $300,000 Stone Mountain Lithonia Trail 271 2016 $500,000 Reserve Sidewalks TBD 271 2016 $450,000 Rockbridge Corridor 271 2016 $300,000 Stone Mountain Lithonia Trail 271 2016 $500,000 Total Capital $8,056,950 Average Annual Spending $1,611,390
1. Local Maintenance and Improvement Grant The county spends an average of $653,200 annually to maintain its parks and recreational facilities (see Table 2.38). Because park acreage does not appropriately gauge the need for capital investment (i.e., open space is not related to capital needs), the research team distributed costs on a per park basis (includes parks in Tucker and Stonecrest), which is $5,226 per park.
Table 2.38. Capital Spending for Recreation, Parks, and Cultural Affairs, FYs 2014–2018
Project Tax Fund Fiscal Year Amount Parks Maintenance 271 2017 $1,040,106 Ellenwood Site Development 271 2017 $400,000 Sugar Creek Tennis Center 271 2017 $600,000 Parks Maintenance 271 2016 $825,894 Ellenwood Site Development 271 2016 $400,000 Total Capital $3,266,000 Average Annual Spending $653,200
Table 2.39 differs from the other capital spending tables in that all spending was directed toward projects not directly related to the unincorporated services. Rather, the projects were related to financial reporting, facilities maintenance, and the Lou Walker Senior Center. The first two areas indirectly support unincorporated services, but the senior center is within the Department of Human Services, a General Fund service. The research team assumed that financial reporting and facilities management costs would occur regardless of incorporation.

74
Likewise, the decision to fund capital improvements for the Lou Walker Center is not directly tied to any of the study areas. Therefore, none of the expenses in Table 2.38 are thought to be impacted by incorporation.
Table 2.39. Capital Spending for Indirect and General Fund Services: FYs 2014–2018
As part of its capital investment policy, the county has implemented a vehicle replacement fund to ensure revenues are dedicated annually to regularly purchase new vehicles. Therefore, costs related to vehicle replacement are integrated into the operating expenditure for all departments with vehicles and not discussed in this section.
Summary of Operating Expenditures and Capital Table 2.40 presents the combined FY 2018 operating and capital expenditures the research team used to calculate the fiscal impact of incorporation for the study areas that is presented Chapter 3.
Project Tax Fund Fiscal Year Amount Lou Walker Improvements 271 2017 $100,000 Lou Walker Improvements 271 2016 $100,000 Facilities Management 271 2016 $200,000 R12 Financial Reporting 272 2015 $15,000
R12 Financial Reporting 274 2015 $15,000 R12 Financial Reporting 271 2015 $35,000 Total Capital $465,000

75
Table 2.40. Combined Operating and Capital Expenditures for Departments, FY 2018
Department/Division Operating Capital Total Beautification – Keep DeKalb Beautiful $5,911,210 $0 $5,911,210
Beautification – Code Compliance $4,025,208 $0 $4,025,208
Planning and Sustainability – Current Planning
$1,520,252 $0 $1,520,252
Planning and Sustainability – Business Licenses
$755,541 $0 $755,541
Planning and Sustainability – Development
$6,287,283
$0
$6,287,283
Police $101,973,516 $0 $101,973,516
Public Works – Roads & Drainage and Transportation $25,739,021 $1,611,390 $22,039,306
Recreation, Parks, and Cultural Affairs $19,189,866 $653,200 $19,843,066
Traffic Court $5,327,143 $0 $5,327,143
Total $170,729,040 $2,264,590 $172,993,630
Grants Based on the data the research team received,72 DeKalb County receives grants for two of the services under review: police and transportation infrastructure. Revenue and expenditures associated with grants are managed through separate accounts and are not incorporated into any of the operating expenditures discussed earlier.
From FY 2014 to FY 2018, the DCPD received 60 grants from federal and state agencies and private-sector organizations that totaled $7,084,053. See Appendix C for information about the grants, including the grant name, amount, funding source, and time period. The grants ranged from just a couple of hundred dollars to hundreds of thousands of dollars. The grants funded a variety of equipment, technical assistance, and training needs. There is no indication that the DCPD would no longer receive any of these grants if additional incorporations were to occur. Thus, the research team does not believe incorporation will impact the department’s ability to continue to receive grants. Likewise, it does not appear that the need for the grants would be much affected by incorporation because the remaining officers and the department as a whole would continue to benefit from the resources provided through the grants.
During FYs 2014–2018, DeKalb County received several grants dedicated to road and bridge maintenance and development within the unincorporated area. More specifically, the county
72 The Institute of Government attempted to learn about grants received from the other departments under review but did not receive sufficient information to assess any potential impact from additional incorporation of the unincorporated area.

76
received $19,210,264 ($3,842,053 on average annually) from the Georgia Department of Transportation’s (GDOT) Local Maintenance and Improvement Grant (LMIG) program and an additional $20,467,446 in competitive GDOT grants ($4,093,489 on average annually). The LMIG is based on a formula that uses center-lane miles of road and population numbers. For DeKalb County, the formula relates only to the unincorporated area.73 The research team assumed that the net impact of the grants is neutral in that while the value of the county’s LMIG would decrease with additional incorporations due to owning fewer road miles and having a smaller population, the county would also spend less. In other words, without a grant, the expenditures would not have occurred. Having a smaller LMIG grant may result in the department needing fewer personnel, but how many fewer is uncertain because large road repair or improvement projects are typically completed by private contractors. The competitive grants are based on specific transportation needs for a particular portion of the roadway system and are not tied to any formula. Whether the county continues to receive competitive grants is not directly influenced by incorporation but rather by specific transportation needs.
REVENUES Revenue Fund Structure The county has created special tax funds to segregate the revenues and expenditures associated with the municipal-type services it offers in the unincorporated area74 (e.g., police, parks, planning, road maintenance) apart from those provided countywide, such as courts, elections, and the constitutional officers. The analyses in this report are based on these special tax funds. This section explains the various revenues that DeKalb County collects in order to fund the services described in the previous section. For consistency with expenditures, FY 2018 data are used. Note that to avoid double-counting revenues, transfers between the unincorporated tax funds are not considered. More specifically, the data show the revenues from three tax funds:75
• Fund 271 – The Designated Services Fund supports parks and recreation and road maintenance services (i.e., Department of Recreation, Parks, and Cultural Affairs; Divisions of Roads and Drainage and Transportation).76 The fund contains a mix of general tax revenues such as property and sales taxes as well as charges for services, miscellaneous revenues, and transfers from the Rental Car Tax Fund, Stormwater Enterprise Fund, and Fund 272. Excluding the transfer from Fund 272, FY 2018 revenues for Fund 271 totaled $34,223,626.
• Fund 272 – The Unincorporated Fund supports the Business Licenses, Code Compliance, Current Planning, Keep DeKalb Beautiful, and Traffic Court units and divisions. Revenues deposited into this fund are considered the purview of the county
73 In FY 2018, Tucker began receiving its own LMIG allocation. For Stonecrest, the grant began in FY 2019. 74 Some cities chose to receive these services from the county and therefore also pay into the fund. 75 See Appendix A for line-item detail revenues for Funds 271, 272, and 274. 76 These divisions are within the Department of Public Works.
77
for unincorporated services, including beverage taxes and licenses, business licenses, traffic and code compliance fines, and a transfer from the Hotel/Motel Tax Fund. The total revenue generated equaled $28,504,877 in FY 2018.
• Fund 274 – The Police Fund supports only the DeKalb County Police Department. In FY 2018, revenues primarily came from property taxes, the Homestead Option Sales Tax, and insurance premium taxes. Approximately $910,000 was generated from licenses, charges for services, and other miscellaneous revenue. Additionally, the fund received a $2,775,404 transfer from Fund 272. Total FY 2018 revenues, sans the transfer from Fund 272, equaled $104,680,344.
Other Funds
The revenue tables below (Tables 2.40, 2.41, and 2.43) also integrate data from the following special revenue funds,77 which also support unincorporated services:
• Fund 201 – Development • Fund 205 – Foreclosure and Vacant Property Registry • Fund 207 – Recreation • Fund 211 – Street Lights • Fund 212 – Speed Humps • Fund 275 – Hotel/Motel – portion transferred to Designated Services Fund • Fund 280 – Rental Car Tax – portion transferred to Designated Services Fund
Note that revenues will not necessarily equal expenditures across the funds because of changes in fund balances. Every fund has a balance of revenue, which is a critical component of proper cash management. Balances in funds that are carried over between fiscal years allow governments to continue paying for services even when revenues are less than expected, and they allow a continuous payment for services even when revenue deposits fluctuate. For each fund, the DeKalb County operating budget includes the beginning and projected ending balance as well as the estimated number of months of operating expenditures the reserve equals. For example, Fund 271 could fund 1.17 months of operating expenditures (without additional revenues) based on its fund balance. None of the three tax funds has a fund balance exceeding three months of operating expenditures.78 For the special revenue funds, the amount of fund balance in proportion to expenditures varies considerably, from a zero projected fund balance to 20 months of operating expenditures.
77 Special revenue funds are used to account for earmarked revenues or those with a single purpose. 78 Best practice in financial management generally recommends having a fund balance equal to three months of operating costs, unless special conditions exist.

78
Fund 271 – Designated Services Fund DeKalb County first established the Designated Services Fund in 1983 in accordance with state law to segregate revenues and expenditures for parks and recreation, road maintenance, and police in order to minimize double taxation of residents and businesses that received these services from municipalities.79 In FY 2012, the county moved police-related revenues and expenditures to a separate tax fund, Fund 274.
In FY 2018, the combined millage rate for the Designated Services Fund was 2.229 for the unincorporated area and the cities of Tucker and Stonecrest. Of the total, 1.349 was attributed to parks and recreation services and 0.880 to road maintenance (i.e., Divisions of Roads and Drainage and Transportation). From an expenditure standpoint, parks and recreation services was responsible for 60.54% of expenditures in Fund 271 and road maintenance for 39.46%,80 which reflects the distribution of the millage rate between the two service areas. The cities of Lithonia and Pine Lake received parks and recreation services, and their property owners paid 0.167 mills in taxes.
In early FY 2018, DeKalb refunded the City of Tucker $1,763,630 for property taxes paid by residents because the city assumed ownership and maintenance of the parks and recreation facilities within its geographic boundaries. This refunded money has been removed from the ad valorem taxes presented in Table 2.41 and Appendix A in order to present a clearer picture of the revenues available to the county for parks and recreation services.81 This report attributes 60.54% of all personal property taxes, public utilities taxes, motor vehicle ad valorem taxes, intangible recording taxes, and interest income from Fund 271 to Parks and Recreation, following the same distribution as real property taxes. Because the Homestead Option Sales Tax (HOST) serves as an offset to residential property taxes, Parks and Recreation is assigned 60.54% of Fund 271’s total allocation (fund total $2,312,094) as well.
The program charges for the Department of Recreation, Parks, and Cultural Affairs are generated through a variety of services to children and adults throughout the year and deposited into Fund 271 or Fund 207, a special tax fund dedicated to recreation. Fund 207 collected a total of $902,410 in FY 2018. The largest sources of charges come from the Little Creek Horse Farm and the Gresham Recreation Center, which generated $237,984 and $188,723 in FY 2018, respectively. The Little Creek Horse Farm is located just south of Hwy. 78 between
79 Ga L. 1982, p. 4396 80 From property tax collection spreadsheets created by DeKalb County for the FY 2018 budget. 81 Removing the Tucker refund from Parks and Recreation property taxes was done proportionally among current real property taxes (87.8%), current personal property taxes (10.5%), and motor vehicle taxes (1.7%), reflecting each of the three revenues’ percentage contributions to the sum of ad valorem taxes. Tucker does not have public utility property so it was excluded from the calculation. In DeKalb’s FY 2018 year-end financial documents, the payment to Tucker is shown as an expenditure, which conforms to governmental accounting standards.
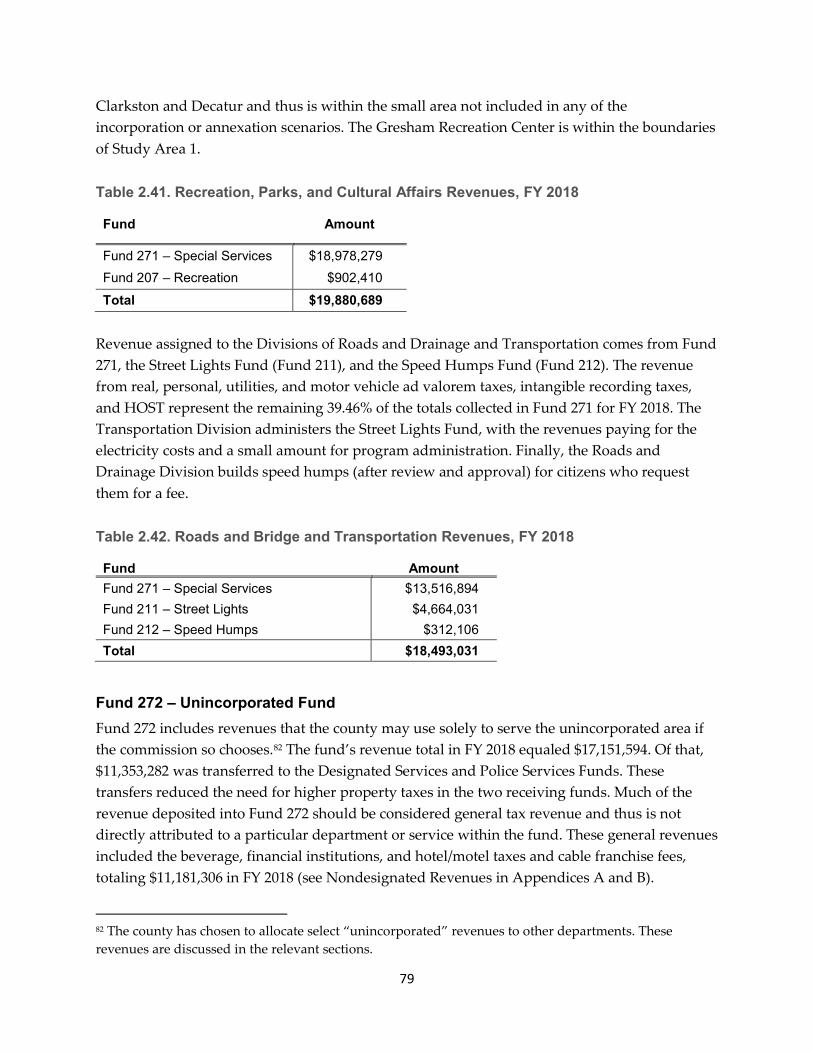
79
Clarkston and Decatur and thus is within the small area not included in any of the incorporation or annexation scenarios. The Gresham Recreation Center is within the boundaries of Study Area 1.
Table 2.41. Recreation, Parks, and Cultural Affairs Revenues, FY 2018
Fund Amount
Fund 271 – Special Services $18,978,279 Fund 207 – Recreation $902,410 Total $19,880,689
Revenue assigned to the Divisions of Roads and Drainage and Transportation comes from Fund 271, the Street Lights Fund (Fund 211), and the Speed Humps Fund (Fund 212). The revenue from real, personal, utilities, and motor vehicle ad valorem taxes, intangible recording taxes, and HOST represent the remaining 39.46% of the totals collected in Fund 271 for FY 2018. The Transportation Division administers the Street Lights Fund, with the revenues paying for the electricity costs and a small amount for program administration. Finally, the Roads and Drainage Division builds speed humps (after review and approval) for citizens who request them for a fee.
Table 2.42. Roads and Bridge and Transportation Revenues, FY 2018
Fund Amount Fund 271 – Special Services $13,516,894 Fund 211 – Street Lights $4,664,031 Fund 212 – Speed Humps $312,106 Total $18,493,031
Fund 272 – Unincorporated Fund Fund 272 includes revenues that the county may use solely to serve the unincorporated area if the commission so chooses.82 The fund’s revenue total in FY 2018 equaled $17,151,594. Of that, $11,353,282 was transferred to the Designated Services and Police Services Funds. These transfers reduced the need for higher property taxes in the two receiving funds. Much of the revenue deposited into Fund 272 should be considered general tax revenue and thus is not directly attributed to a particular department or service within the fund. These general revenues included the beverage, financial institutions, and hotel/motel taxes and cable franchise fees, totaling $11,181,306 in FY 2018 (see Nondesignated Revenues in Appendices A and B).
82 The county has chosen to allocate select “unincorporated” revenues to other departments. These revenues are discussed in the relevant sections.
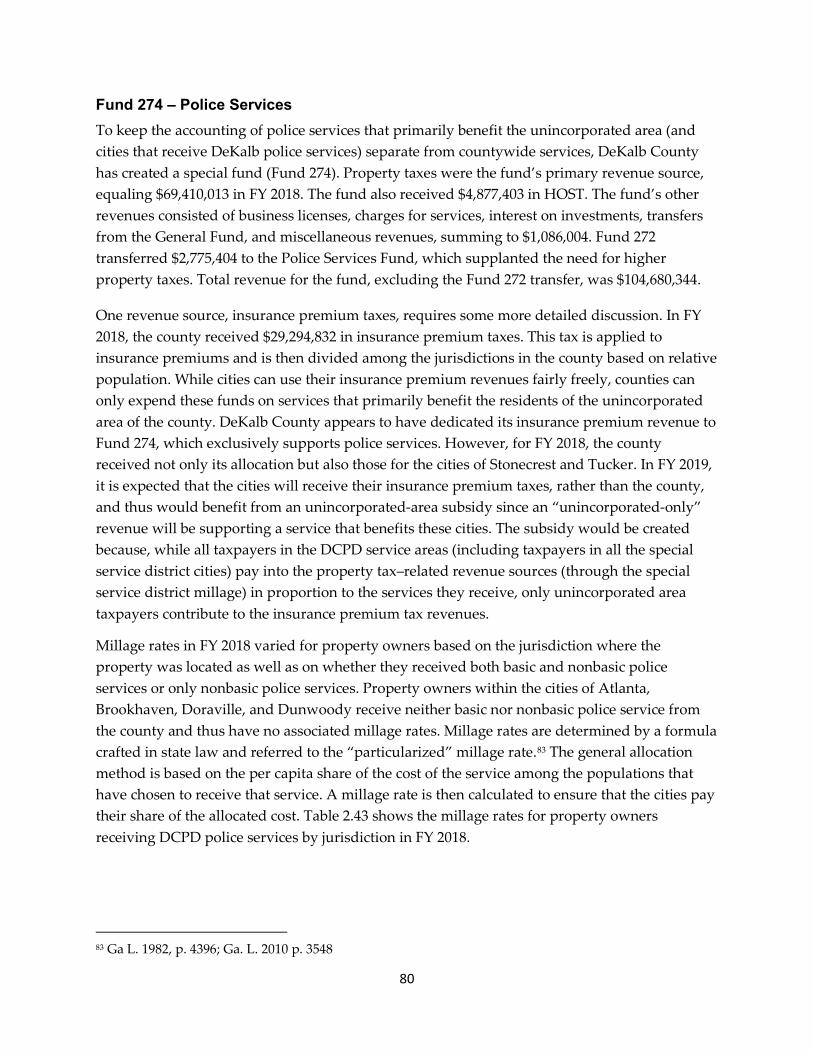
80
Fund 274 – Police Services To keep the accounting of police services that primarily benefit the unincorporated area (and cities that receive DeKalb police services) separate from countywide services, DeKalb County has created a special fund (Fund 274). Property taxes were the fund’s primary revenue source, equaling $69,410,013 in FY 2018. The fund also received $4,877,403 in HOST. The fund’s other revenues consisted of business licenses, charges for services, interest on investments, transfers from the General Fund, and miscellaneous revenues, summing to $1,086,004. Fund 272 transferred $2,775,404 to the Police Services Fund, which supplanted the need for higher property taxes. Total revenue for the fund, excluding the Fund 272 transfer, was $104,680,344.
One revenue source, insurance premium taxes, requires some more detailed discussion. In FY 2018, the county received $29,294,832 in insurance premium taxes. This tax is applied to insurance premiums and is then divided among the jurisdictions in the county based on relative population. While cities can use their insurance premium revenues fairly freely, counties can only expend these funds on services that primarily benefit the residents of the unincorporated area of the county. DeKalb County appears to have dedicated its insurance premium revenue to Fund 274, which exclusively supports police services. However, for FY 2018, the county received not only its allocation but also those for the cities of Stonecrest and Tucker. In FY 2019, it is expected that the cities will receive their insurance premium taxes, rather than the county, and thus would benefit from an unincorporated-area subsidy since an “unincorporated-only” revenue will be supporting a service that benefits these cities. The subsidy would be created because, while all taxpayers in the DCPD service areas (including taxpayers in all the special service district cities) pay into the property tax–related revenue sources (through the special service district millage) in proportion to the services they receive, only unincorporated area taxpayers contribute to the insurance premium tax revenues.
Millage rates in FY 2018 varied for property owners based on the jurisdiction where the property was located as well as on whether they received both basic and nonbasic police services or only nonbasic police services. Property owners within the cities of Atlanta, Brookhaven, Doraville, and Dunwoody receive neither basic nor nonbasic police service from the county and thus have no associated millage rates. Millage rates are determined by a formula crafted in state law and referred to the “particularized” millage rate.83 The general allocation method is based on the per capita share of the cost of the service among the populations that have chosen to receive that service. A millage rate is then calculated to ensure that the cities pay their share of the allocated cost. Table 2.43 shows the millage rates for property owners receiving DCPD police services by jurisdiction in FY 2018.
83 Ga L. 1982, p. 4396; Ga. L. 2010 p. 3548

81
Table 2.43. Millage Rates and Property Tax Contributions for Police Services, FY 2018
Jurisdiction Basic Nonbasic Total Tax Unincorporated 3.81 0.987 4.797 $53,068,077 Avondale 0.168 0.168 $29,234 Chamblee 0.068 0.068 $99,841 Clarkston 0.538 0.142 0.68 $107,435 Decatur 0.089 0.089 $123,129 Lithonia 0.557 0.147 0.704 $21,799 Pine Lake 0.637 0.168 0.805 $16,051 Stone Mountain 0.126 0.126 $10,558 Stonecrest 3.81 0.987 4.797 $6,706,797 Tucker 3.81 0.987 4.797 $8,532,532 Total $68,715,452
Currently, about 27% of the DCPD’s Fund 274 revenues appear to be supplied by the insurance premium (or life and property and casualty) tax. This tax is applied to insurance premiums and is then divided among the jurisdictions in the county based on relative population. While cities can use their insurance premium revenues fairly freely, counties can only expend these funds on services that primarily benefit the residents of the unincorporated area of the county. DeKalb County appears to have dedicated its insurance premium revenue to Fund 274, which exclusively supports police services. Prior to the incorporation of Tucker and Stonecrest, DCPD services were almost exclusively provided to the unincorporated area. The exception to this general rule was the relatively small number of services being provided to cities that selected these services. However, because upon incorporation Tucker and Stonecrest chose to still receive the full array of police services, taxpayers in the unincorporated area are subsidizing the residents of these two cities and to a lesser extent residents of the other cities that receive fewer services. This subsidy exists because while all taxpayers in the DCPD service areas (including taxpayers in all the special service district cities) pay into the property tax–related revenue sources (through the special service district millage) in proportion to the services they receive, only unincorporated area taxpayers contribute to the insurance premium tax revenues. As these insurance premium tax revenues comprise approximately 27% of the total Fund 274 revenue, one could conclude that the cities receiving DCPD services are undercontributing to the DCPD budget by a similar percentage.
Fund 201 – Development Fund Although the Development Fund is a special revenue fund, it is discussed here with the tax funds because an entire unit in the Department of Planning and Sustainability is funded from it. All the revenues generated in this fund are directly attributable to staff work effort. Therefore, revenues are driven by the public’s demand for new building development and redevelopment

82
within the unincorporated area. The revenues included building permits, building inspection fees, and related charges, totaling $7,844,098 in FY 2018.
Revenue Collections Revenues under review for this study totaled $180,271,523 in FY 2018. (Appendix A presents line-item revenue amounts.) Table 2.44 presents the revenues by major category.84 Of the $180 million, 77.56% was classified as a tax. More specifically, $89,627,383 came from real, utility, personal property, and intangible recording taxes, with relatively minimal amounts also from mobile home taxes. Combined, these property taxes represent nearly half of all the revenue (49.72%) collected. An additional $7,440,126 came from motor vehicle taxes and the title ad valorem tax’s (TAVT) ”true up revenue”85 (4.13%). In FY 2018, the county collected several excise taxes strictly in the unincorporated area, the most important of which were beverage (alcohol-related), hotel/motel, and rental car taxes. Excise taxes equaled $5,361,779 (2.97%).
The HOST tax deserves special comment. This tax has provided substantial revenue to support parks and recreation, road maintenance, and police for several years, but this will no longer be the case moving forward due to changes in the county’s sales tax structure, regardless of the future incorporation activity. The transition of HOST revenues to pay for homestead tax credits from both countywide and unincorporated-only services to just countywide services under the new EHOST results in greater reliance on property taxes to fund road, parks and recreation, and police services (Fund 271 and Fund 274). From a taxpayer’s perspective, the overall tax burden may not be dramatically different;86 however, where the property taxes are deposited will be. For example, for a 2018 DeKalb County property tax bill, an unincorporated residential property with an assessed value of $40,280 received an EHOST tax credit of $198.26 for countywide taxes (tax due of $34.44) but only tax credits equaling $21.71 for roads, parks and recreation, and police (tax due of $147.92). In FY 2018, HOST contributed $7,189,497. The remaining taxes—the financial institutions business license tax and the insurance premium tax—summed to $30,198,695, or 16.75% of revenues.
Licenses and permits were a major revenue category. These included business licenses, beverage licenses, cable franchise fees, and various building and planning permits. The amount collected across all funds was $22,159,087 (12.29%).
While still important, charges for services were a less significant revenue category than the others at 4.21% of revenue. The largest source of charges came from street light assessments, at $4,664,031 (Fund 211). Recreation, Parks, and Cultural Affairs earned $1,740,160 in charges, while Roads and Drainage and Transportation, apart from street lights, collected $336,276.
84 This report applies the same revenue classifications as DeKalb County. 85 Reimbursement to a county from the Department of Revenue for losses associated with revenue reductions in the motor vehicle tax. An additional $29 came from the heavy vehicles tax. 86 Assuming no changes in millage rates.

83
Planning and Sustainability generated $414,961, Police generated $400,312, and Code Compliance’s Foreclosure and Vacant Property Registry Fund made $37,200.
Fines and forfeiture revenue came from traffic and code enforcement citations and constituted 5.14% of all revenues that were reviewed. Revenue from traffic citations came from the county’s traffic court and state court, while the Magistrate Court, which is funded from the General Fund, hears code enforcement cases, but all fine and forfeiture revenues were deposited into the Unincorporated Fund (Fund 272). Traffic court revenue totaled $8,348,081, and Magistrate Court revenues were $924,944.
The research team considered three revenue transfers:87 two transfers from the General Fund ($290,906) and one from the Stormwater Enterprise Fund ($952,220). The General Fund transfers supported the Keep DeKalb Beautiful Program and animal control services in the Police Department. The stormwater transfer was for administrative services provided by the Roads and Drainage Division.
The county earns investment income on available cash within its various funds, conforming to best practices in financial management. For FY 2018, the county allocated a total of $110,889 to unincorporated funds.
The last major revenue category is miscellaneous revenues, which come from sources that do not fit into the above types. Returned checks are assigned to this category, which resulted in revenue reductions of $176,578. Nearly all of these returned checks were for business licenses. The net miscellaneous income result was $75,108.
Table 2.44. Revenues That Support Unincorporated Services, FY 2018
Revenue Category Total All Funds1 Percent2 Taxes $139,817,480 77.56% Licenses and Permits $22,159,087 12.29% Charges for Services $7,592,940 4.21% Fines and Forfeitures $9,272,893 5.14% Investment Income $110,889 0.06% Transfers from Other Funds $1,243,126 0.69% Miscellaneous $75,108 0.04% Total $180,271,523
1. Funds include Designated Services (271), Unincorporated Services (272), Police Services (274), Development (201), Foreclosure and Vacant Property Registry (205), Recreation (207), Street Lights (211), Speed Humps (212), Hotel/Motel (275), Rental Car Tax (280)
2. Does not sum to 100% due to rounding.
87 Revenues from the hotel/motel and rental car taxes were transferred to the Unincorporated Services Fund (272) but are not considered a transfer for the purposes of this analysis.

84
Chapter 3. Estimated Impact of Incorporation
Chapter 3 answers the core question of the potential financial impact on DeKalb County’s revenues and expenditures from loss of unincorporated areas. The chapter presents the estimated revenue losses and expenditure savings for each service by study area. Note that for the analyses, the research team assumed that DeKalb County would no longer provide services delineated in previous incorporation studies for the proposed cities that comprise Study Area 1 and Study Area 2. See Figure 1.1 for a map showing the boundaries of the three study areas.
At the end of each section, the financial estimates for each service are summed to show the net impact of incorporation. The analyses do not discuss the remaining service area. Likewise, the analyses do not consider any lost benefits from economies of scale due to DeKalb’s service areas being smaller after incorporation. The analyses show substantial net savings for a few services but substantial losses for others, so it is important to consider the total impact from all revenues and expenditures from the possible incorporation of a study area. The final section of this chapter discusses potential impacts to the county’s General Fund if any of the study areas were to incorporate.
STUDY AREA 1 A 2015 study by the Carl Vinson Institute of Government examined the fiscal viability of Study Area 1 incorporating.88 That study assumed that the following services would be no longer be provided by DeKalb County but would instead become the responsibility of the new city:
• Business licenses (within Planning and Sustainability) • Code compliance (within Beautification) • Planning and zoning (within Planning and Sustainability) • Development (within Planning and Sustainability) • Parks and recreation (Recreation, Parks, and Cultural Affairs)
The 2015 study assumed that DeKalb County would continue road maintenance in Study Area 1 if incorporation occurred. In contrast, this study assumes that right-of-way maintenance conducted by the Keep DeKalb Beautiful Division would no longer be provided by the county because it is fully funded from the unincorporated services fund.
Beautification – Keep DeKalb Beautiful The Keep DeKalb Beautiful Division did not generate any revenues in FY 2018, so none would be lost if Study Area 1 incorporated.
88 Carl Vinson Institute of Government. 2015, February. A Study of Fiscal Feasibility for a Proposed City of South DeKalb.

85
Table 3.1 shows the total expenditures for the division as well as the metric used to allocate expenditures, percentage of center-lane miles in Study Area 1. These expenditures represent the cost savings to the county if Study Area 1 is incorporated. The KDB program89 is not expected to be impacted by incorporation.
Table 3.1. Study Area 1 Keep DeKalb Beautiful Expenditures
Division Total
KDB
Litter Removal
Mowing ROW
Tree Trimming
Total Expenditure $5,911,210 $247,489 $2,563,808 $2,804,803 $295,110
Study Area 1 Percent of Lane Miles N/A 75.48% 75.48% 75.48%
Study Area 1 Expenditures1 $0 $1,935,209 $2,117,116 $222,754
Study Area 1 Keep DeKalb Beautiful Expenditures $4,275,079 Notes: Study Area 1 does not exactly match total expenditure multiplied by the percentage of lane miles due to rounding of lane miles for this table. KDB = Keep DeKalb Beautiful; ROW = right-of-way The net impact to DeKalb County of no longer providing rights-of-way maintenance to Study Area 1 is a savings of $4,275,079. Assuming an equal distribution of work across the study areas, service levels in the remaining unincorporated area should not be affected if Study Area 1 were to incorporate. Likewise, these cost savings would not affect the property tax rate because the Keep DeKalb Beautiful Division is not funded through property taxes.
Beautification – Code Compliance Code compliance revenues are reflected in code enforcement fines issued by the Magistrate Court as well as deposits into the Foreclosure and Vacant Property Registry Fund (Fund 205). For Fund 205, property owners pay a fee to the county when they register their vacant property. Revenues were assigned to the study areas proportionally to expenditures. Over 84% of expenditures90 (84.13%) were dedicated to Study Area 1 (see Chapter 2 for discussion of workload and cost distribution), so 84.13% of Magistrate Court revenues were as well. For the Foreclosure and Vacant Property Registry Fund, revenues were allocated based on the percentage of vacant properties, which for Study Area 1 equaled 74.7% according the DeKalb County Tax Assessor’s database. Table 3.2 shows that if Study Area 1 were to incorporate, an estimated $805,934 would no longer be available to the county to perform code compliance services.
89 The Keep DeKalb Beautiful Division has within it a program of the same name. The latter is referred by its acronym, KDB. 90 Expenditures are allocated on an FTE basis.

86
Table 3.2. Study Area 1 Code Compliance Revenue
Revenue Division Total Study Area 1 Magistrate Court $924,944 $778,146 Foreclosure Registry Fund $37,200 $27,788 Code Compliance Revenue $962,144 $805,934
Note: Study Area 1 does not exactly match due to rounding of percentages. As discussed in Chapter 2, the Code Compliance Division categorizes employees into two main service units: those who service particular zoned areas and a special unit that serves motels and multifamily housing. The estimated expenditures for the division’s zoned work totaled $2,927,424 in FY 2018 and the special unit’s expenditures were calculated to be $1,097,784 for division-wide total expenditures of $4,025,208. Additionally, in Chapter 2, Study Area 1 was calculated as having 28.75 positions out of 32 working in the zoned areas (including supervisors) and 8.26 out of 12 employees working as part of the special unit (see Tables 2.4 and 2.5). Costs for Study Area 1 were determined based on the average cost per direct service employee.91 Table 3.3 shows the estimated expenditure reductions if Study Area 1 were incorporated.
Table 3.3. Study Area 1 Code Compliance Operating Expenditure
Service Zones Special Unit Number of Employees – Study Area 1 28.75 8.26 Average Per Employee Cost $91,482 $91,482 Study Area 1 Expenditure $2,630,108 $755,641 Code Compliance Expenditure $3,385,749
In FY 2018, the Foreclosure Registry Fund only spent $11,897 to manage vacant properties. The distribution of expenditures by study area was the same as for revenues, the percentage of vacant properties in each area, which amounted to 74.7% for Study Area 1. This amount results in an additional expenditure savings of $8,887.
If DeKalb County no longer performed code compliance services in Study Area 1, the net savings would be $2,588,702, as shown in Table 3.4.
91 For more information on how costs for the two service units were determined, please see Chapter 2.

87
Table 3.4. Net Impact to the Code Compliance Division if Study Area 1 Incorporated
Estimated Amount Revenue Losses ($805,934) Expenditure Savings Fund 272 $3,385,749 Expenditure Savings Fund 205 $8,887 Code Compliance Net Impact $2,588,702
Because expenditures were assigned per employee and revenues were assigned proportionally to expenditures, the level of service in the remaining unincorporated area does not change if Study Area 1 becomes a city. The remaining division, however, would be quite small, having only $639,459 in expenditures (using FY 2018 amounts) and seven code compliance officers. If the ratio of direct service employees to administrative employees were maintained — 44 direct service and 10 administrative (4.4:1) — the department would only need 1.6 full-time equivalent (FTE) administrative staff members. The total size of the smaller department would then be 8.6 employees.
As with Keep DeKalb Beautiful, property taxes do not support this division and thus would be unaffected if the county ceased to provide code compliance services within Study Area 1.
Planning and Sustainability – Business Licenses The Department of Planning and Sustainability provided business license data for this study. The research team geographically located businesses with the license amount paid. Table 3.5 presents FY 2018 totals for each type of revenue associated with business licenses for the division and for within Study Area 1. See Appendix A for details on how the research team distributed revenues across the study areas. If Study Area 1 were to incorporate, the county would annually lose an estimated $4,166,712 in revenue from business licenses.
Table 3.5. Study Area 1 Business License Revenue
Revenue Division Total Study Area 1 Beverage Licenses $664,696 $386,638 Business Licenses – General1 $8,060,815 $3,789,238 Business Licenses – Adult Ent. $125,000 $72,709 Misc. Revenue $75 $35 Misc. Returned Check ($174,242) ($81,908) Business License Revenue $8,676,344 $4,166,712
1 These are actually occupation taxes levied pursuant to O.C.G.A. § 48-13-10. Many local governments continue to use the term “business licenses” to describe this tax.

88
The research team allocated expenditures proportionally to revenues. A total of 48.02% of all business license revenues came from Study Area 1. Applying that same percentage to expenditures results in a savings of $362,840 from fewer staff and lower operating costs.92
Table 3.6 shows the estimated net impact on business licenses if Study Area 1 were to incorporate. The county would lose $3.8 million in business license revenue. The county has used this money to support other services in the unincorporated areas, such as code compliance and right-of way maintenance (Keep DeKalb Beautiful) as well as to make transfers to the Designated Services Fund (Fund 271) and Police Fund (Fund 274).
Table 3.6. Net Impact to Business License Revenues if Study Area 1 Incorporates
Estimated Amount Revenue Losses ($4,166,712) Expenditure Savings $362,840 Business License Net Impact ($3,803,872)
Planning and Sustainability – Current Planning The Current Planning Unit collected $90,486 in FY 2018. Of this, $52,276 came from zoning fees, $37,845 from variance permits, and $365 in miscellaneous revenues. Using the workload data discussed in Chapter 2 (see Table 2.7), 58 of the 91 zoning applications (63.7%) and 20 of the 95 (21.1%) variance and administrative appeals that year came from Study Area 1. Therefore, the associated revenues for these services are distributed based on those percentages. Miscellaneous revenue is the average percentage of the other two revenues (42%).
Table 3.7. Study Area 1 Current Planning Revenue
Revenue Division Total Study Area 1 Zoning Fees $52,276 $33,319 Variance Permits $37,845 $7,967 Miscellaneous $365 $153 Current Planning Revenue $90,486 $41,439
Because of the differences in time required for the Current Planning Unit to perform its various planning and zoning activities, the deputy director of planning suggested distributing expenditures to the study areas based on the percentage of revenue collected from each. Almost two-thirds (63.74%) of zoning fees came from Study Area 1; thus, the study area was allocated
92 $755,541 × .4802 = $362,840

89
63.74% of the zoning costs.93 Likewise, 21.05% of variance permit revenue came from Study Area 1, so the research team allocated that same percentage of expenditures. For historic preservation,94 costs were allocated to Study Area 1 based on the time spent by staff (2% of one FTE) to support the Soapstone Ridge District, which is located in Study Area 1.
Table 3.8. Study Area 1 Current Planning Expenditures
Service Area
Division Total Expenditure
Study Area 1 Percent Allocation
Study Area 1 Expenditures
Historic Preservation $142,775 2% $2,856 Zoning $798,937 63.74% $509,242 Variance Permits $578,540 21.05% $121,783 Current Planning Expenditure $1,520,252 $633,881
The Current Planning Division is not self-funded and relies on other unincorporated revenues to fund its services, such as revenue that not designated for a service (referred to as nondesignated) and business licenses (occupation taxes). Thus, although there are savings from the county no longer providing this service to Study Area 1, it has no impact on property taxes. The estimated net savings for FY 2018 if Study Area 1 had incorporated would have been $592,442. Using the cost per employee of $152,025 discussed in Chapter 2, this savings translates to nearly four fewer FTEs for the Current Planning Unit (3.9 FTEs). Because of the diverse work the unit performs, it is unclear how having fewer employees would impact its overall performance and ability to serve the remaining service area.
Table 3.9. Net Impact on the Current Planning Division if Study Area 1 Incorporates
Estimated Amount Revenue Losses ($41,439) Expenditure Savings Fund 272 $633,881 Current Planning Net Impact $592,442
93 The research team allocated unit-wide costs between zoning and variance according to the revenues each service generated. Zoning generated 58% of total revenues and was assigned 58% of the costs after first removing costs for historic preservation. Variance permits generated 42% of the revenue and was assigned 42% of expenditures after removing costs for historic preservation. 94 Costs for this program are based on the mid-range salary for a staff person’s grade ($62,233), average per employee benefits for the division in Fund 272 ($25,267), average per employee operating costs ($5,470), and the average per employee cost for the county’s administrative indirect charge ($49,805).

90
Planning and Sustainability – Development As discussed in Chapter 2, revenues and expenditures for the Development Unit95 are managed through a separate fund, Fund 201. The Department of Planning and Sustainability provided revenue and location data for its FY 2018 building permits and inspections, which was used to allocate revenues.96 See Appendix A for how each revenue was calculated. Table 3.10 shows that the county would lose an estimated $4,401,832 if it were no longer performing development services in Study Area 1.
95 Within the Development Division, there is the Development Unit and the Business Licenses Unit. This section refers only to the Development Unit. 96 A caveat for Building Inspection Permit revenue should be noted. Rather than using the actual dollars collected for the study area as with the other inspection fees, the research team used the proportion of revenue collected because the data provided by the Department of Planning and Sustainability for these specific fees included customer payments for other agencies that could not be disaggregated. The payment for a single building inspection included what was owed to the Development Unit as well as to other DeKalb departments, such as for connecting property to the water and sewer system. The unit did not believe these additional payments distorted the percentages going to the study areas.
The research team was unable to geographically locate $507,411 in inspection fees because the addresses provided by the Department of Planning and Sustainability did not match any parcel number provided by the Tax Assessor’s Office. By joining address information with the parcel identifications in GIS, the research team was able to locate parcels and segregate them into study areas. These discrepancies likely occurred because new buildings had yet not been assigned a parcel number. Over 95% of the unlocatable fees ($482,530) were for inspections of new buildings. The team believes Study Area 1 revenue estimates are still accurate because the analysis used the proportion of structural permit revenue rather than actual dollars. The team assumed that these unlocatable buildings are distributed across the unincorporated area similarly to the permit data researchers could locate.

91
Table 3.10. Study Area 1 Development Revenue
Revenue Division Total Study Area 1 Sign Permits $25,809 $12,543 Certificates of Occupancy $270,703 $151,512 Variance Permits $5,031 $2,816 Subdivision Fees $41,901 $23,452 Registration Fees – Plumbing1 $3,672 $2,053 Develop Permits $378,814 $212,022 Inspection Fees – Building $4,418,603 $2,462,929 Inspection Fees – Plumbing $514,021 $287,338 Inspection Fees – Electrical $1,140,178 $661,759 Inspection Fees – HVAC $630,406 $353,154 Sales of Printed Material $6,995 $3,915 NPDES Fees $8,162 $4,569 Technology Fees $399,803 $223,770 Development Revenue $7,844,098 $4,401,832
1. There were no revenues for HVAC and electrical registration fees in FY 2018. Note: NPDES = National Pollutant Discharge Elimination System The director of the Development Unit recommended allocating expenditures across the study areas based on the revenue distribution. The revenues associated with Study Area 1 equal 56.12% of all revenues collected for the Development Fund (Fund 201) in FY 2018. Using this percentage, Study Area 1’s estimated expenditures were $3,528,423.
Table 3.11 shows the estimated net impact on the Development Unit if Study Area 1 were to incorporate. The county would lose $873,409 from no longer providing development services. Because this revenue is only used for development, no other services would be impacted. Likewise, no property taxes support this service and thus would be unaffected. Using the cost-per-employee metric discussed in Chapter 2 of $178,275, the estimated reduction in expenditures ($3,528,423) translates to 19.8 FTEs. Additionally, the net loss of $873,409 equals 4.9 FTEs. The loss of the employees beyond the reduced workload implies lower service levels for the remaining service area if Study Area 1 were to incorporate.
Note that in FY 2018, the Development Fund (Fund 201) earned $1,556,816 more than it spent. This excess revenue is typical during times of heavier development. Conversely, the unit would incur a net loss when there is less construction to pay staff and operating needs.

92
Table 3.11. Net Impact on the Development Unit if Study Area 1 Incorporates
Estimated Amount Revenue Losses ($4,401,832) Expenditure Savings $3,528,423 Development Net Impact ($873,409)
Recreation, Parks, and Cultural Affairs The Department of Recreation, Parks, and Cultural Affairs tracks revenues by cost center, enabling an accurate distribution of revenues across the study areas. Table 3.12 shows that revenues for Study Area 1 totaled $7,791,247 in FY 2018. For additional information regarding how revenues were distributed across the service areas, particularly for taxes deposited into the Designated Services Fund (Fund 271), see Appendix A.

93
Table 3.12. Study Area 1 Recreation, Parks, and Cultural Affairs Revenue
Revenue Department Total Study Area 1 Real Property Taxes $13,394,5091 $5,595,850 Prop. Taxes – Prior Year $563,597 $236,316 Personal Property Taxes $924,8301 $274,490 Public Utility Taxes $473,532 $267,593 Mobile Home Taxes $647 $0 Motor Vehicle Taxes2 $429,1431 $282,120 Intangible Recording Tax $261,663 $109,715 Energy Excise Tax $2,830 $1,452 HOST Parks $1,399,742 $0 Department Programs $360,624 $51,938 Recreation Programs $902,410 $449,065 Nonresident Dept. Program $18,062 $7,649 Concessions $28,306 $0 Swimming Pool $367,465 $14,411 Golf Course Fees $20,048 $20,048 Tennis Center Fees $43,245 $255 Tennis Center Rental $31,050 $0 Rental – Other/Pavilions $48,682 $32,456 Fees – Porter Sanford $62,652 $62,652 Other Miscellaneous $6,791 $2,876 Returned Check ($2,316) ($981) Rental Car Tax Fund $522,178 $374,504 Investment Income $20,999 $8,838 Recreation, Parks, and Cultural Affairs Revenue $19,880,689 $7,791,247
1. Reflects reductions in revenue of $1,763,630 transferred to the City of Tucker as reimbursement for excess property taxes paid by residents when Tucker began providing parks and recreation services in the spring of 2018. Reductions to real, personal, and motor vehicle taxes were made proportionally based on Tucker’s portion of the total assessed value of property for these property tax categories.
In Chapter 2, the operating expenditures for the Department of Recreation, Parks, and Cultural Affairs were disaggregated between the Parks and Recreation Divisions (Tables 2.27 and 2.28). Each cost center has its own methodology for allocating costs across the study areas (see Appendix D for details). For the Parks Division, expenditures were allocated across the study areas based on the location of a park and its acreage. For the Recreation Division, expenditures were allocated based on the percentage of recreation participation in a study area (see Table 2.33).
For the Recreation Fund (Fund 207), costs were allocated based on the location of recreation centers, except for the Therapeutic Recreation Program (TRP), Playground Day Camp, and

94
Youth Sports cost centers. TRP costs are allocated based on the number of TRP participants in a study area. For the latter two cost centers, the research team allocated spending by the number of youth participants from each study area. With these calculations, the research team was able to estimate the operating expenditures for Parks and Recreation for Study Area 1. The total estimated spending for Study Area 1 was $8,471,461 in FY 2018 or 44.15% of all departmental spending (See Table 3.13).
Table 3.13. Study Area 1 Recreation, Parks, and Cultural Affairs Expenditures
Service Area
Department Total Expenditure
Study Area 1 Expenditures
Study Area 1 Percent of $
Parks – Fund 271 $11,577,434 $5,137,251 44.37% Recreation – Fund 2711 $6,439,146 $2,821,534 43.82% Parks – Fund 2072 $60,899 $44,998 73.89% Recreation – Fund 207 $1,112,387 $467,678 42.04% Park Division Expenditure $19,189,866 $8,471,461 44.15%
1. Cultural Affairs expenditures are within Recreation. 2. Arabia Mountain is excluded from the percentage of park acreage calculation (2,465.2 / 3,336.3 acres). To provide greater detail for Study Area 1, Tables 3.14 and 3.15 list the expenditures by cost center for the Designated Services Fund (Fund 271) and the Recreation Fund (Fund 207), respectively. The final category of expenditures in Table 3.14 represents the indirect administrative charges assigned to the department.97 (See Chapter 2 for more information on the county’s administrative indirect cost plan and its application in this report.)
97 The Recreation Fund was not assigned an indirect administrative charge.

95
Table 3.14. Study Area 1 Parks and Recreation Expenditure Detail, Designated Services Fund (Fund 271)
Expenditure Category1 Estimated Amount Department Administration $981,924 Special Populations $7,262 Summer Programs $49,500 Recreation Division. Administration $220,705 Recreation Centers $1,504,446 Mystery Valley Golf2 $1,915 Sugar Creek Golf2 $72,655 Planning and Development $195,151 Aquatics $19,519 Parks Division Administration $486,860 District 1 Service Center $475,769 District 2 Service Center $380,280 District 3 Service Center $1,718,093 Support Services $13,594 Horticulture & Forestry $11,538 Planning and Development $6,089 Sugar Creek Tennis Center2 $1,000 Natural Resource Management $59,429 Marketing and Promotion $96,019 Cultural Affairs $329,834 Youth Athletics $101,352 County Cost Allocation $1,225,851 Total Study Area 1 Expenditures $7,958,785
1. Cost centers without expenditures are not included in the table. 2. Management for this facility is contracted out to a private management company.

96
Table 3.15. Study Area 1 Parks and Recreation Expenditure Detail, Recreation Fund (Fund 207)
Expenditure Category1 Estimated Amount Outdoor Recreation $44,998 Therapeutic Rec Program $6,032 Exchange Park $23,856 Redan Park Rec Center $18,568 Gresham Rec Center $36,668 NH Scott Rec Center $18,399 Midway Rec Center $26,695 Playground Day Camp $313,148 Youth Sports $24,312 Total Study Area 1 Expenditures $512,676
1. Cost centers without expenditures are not included in the table. In addition to operating expenditures, the Department of Recreation, Parks, and Cultural Affairs spent on average $653,200 annually for capital maintenance and improvements between FY 2014 and FY 2018. Annually per-park, this translates to $5,226. Because Study Area 1 has a total of 68 parks, the amount of total capital spending assigned to Study Area 1 is $355,368.
Table 3.16 presents the net impact on the county if Study Area 1 incorporated and the county no longer provided park services to it. The table sums the revenue losses and the savings from reduced operating and capital spending. The estimated net impact is an annual savings of $1,035,582. This savings could result in either additional spending on the remaining parks or a reduction in the Designated Services property tax.
Table 3.16. Net Impact on the Department of Recreation, Parks, and Cultural Affairs if Study Area 1 Incorporates
Estimated Amount
Revenue Losses ($7,791,247) Operating Expenditure Savings (Funds 271 + 207) $8,471,461 Capital Expenditure Savings $355,368 Recreation, Parks and Cultural Affairs Net Impact $1,035,582
If Study Area 1’s assigned expenditures were reduced in an amount equivalent to lost revenue ($7,791,247), the operating expenditures would have been $11,409,22898 to manage 3,002 acres and serve 414,813 recreation program participants99 in FY 2018, all other things remaining equal.
98 This figure excludes the consideration of capital. 99 Park acres: 6,042 – 3,040.2 =3,001.8 and recreation participants: 719,585 – 304,772 = 414,813

97
To determine how each division could be affected by the loss of Study Area 1, the lost revenues were removed from each division’s total expenditures proportionally to its expenditures. Parks spent 60.6% of the total departmental budget, and recreation spent 39.4%. The spending per park acre for maintenance would increase from $1,926 to $2,304, and the spending per park participant changes from $10.50 to $10.80. (See Table 3.17.)
Table 3.17. Estimated Change in Parks and Recreation Service Levels if Study Area 1 Incorporates
Parks Division Recreation Division FY 2018 Actual Expenditures $11,638,333 $7,551,533 Study Area 1 Revenue Reduction ($4,721,496) ($3,069,752) Remaining Service Area Budget $6,916,837 $4,481,781 Remaining Park Acres / Recreation Participants 3,001.8 414,813 New Service Level $2,304 per acre $10.80 per participant
The research team used a simple calculation to estimate the impact on property taxes (assuming service levels remain unchanged). The calculation used only real property values for the service area in FY 2018.100 Table 3.18 shows that the county could reduce the Designated Services millage rate for parks and recreation by approximately 0.13 mills while maintaining the same service levels if Study Area 1 incorporated.
Table 3.18. Estimated Change in Parks and Recreation Millage Rate from Study Area 1 Incorporating
Computation Results
Current Assessed Value Real Property $13,248,201,314 Study Area 1 Assessed Value $5,453,100,037 New Assessed Value1 $7,795,101,277 Study Area 1 Savings $1,035,582 Savings as Millage Rate 0.13 mils
1. For simplicity, this scenario only uses the assessed value for real property and does not consider HOST, exemptions, or personal and utility property.
Nondesignated Revenues DeKalb County would no longer receive nondesignated revenues—revenues with no direct link to service provision—from Study Area 1 if it incorporated. The county received nearly $11.2 million in nondesignated revenues in FY 2018, and an estimated $6,683,409 (59.8%) originated
100 The total assessed value excludes property within the City of Tucker because the city was rebated the value of property taxes that property owners paid in FY 2018.

98
from Study Area 1 (see Table 3.19). If Study Area 1 incorporated, the county would experience a net loss of revenue equaling that amount.
Table 3.19. Study Area 1 Nondesignated Revenues, FY 2018
Revenue Unincorporated Area Study Area 1 Alcohol Taxes $3,088,362 $1,868,459 Bank Share Tax $903,863 – Hotel/Motel Tax Fund $1,734,473 $927,741 Franchise Fee – Cable $5,425,127 $3,866,908 Miscellaneous Revenue – Other $29,481 $21,013 Nondesignated Revenue $11,181,306 $6,684,122
Study Area 1: Summary of Impact Table 3.20 combines all the revenue and expenditure estimates for a summary net impact of a loss of $2,869,598 to DeKalb County if Study Area 1 incorporated. Even though most services would see an overall net savings, the loss of nondesignated revenue and business license revenue ultimately led to a negative financial outcome for the county.
Table 3.20. Estimated Net Impact from Study Area 1 Incorporating
Service Revenues Expenditures Net Impact Keep DeKalb Beautiful – $4,275,079 $4,275,079 Code Compliance ($805,934) $3,394,636 $2,588,702 Business Licenses ($4,166,712) $362,840 ($3,803,872) Current Planning ($41,439) $633,881 $592,442 Development ($4,401,832) $3,528,423 ($873,409) Recreation, Parks, and Cultural Affairs ($7,791,247) $8,826,829 $1,035,582 Nondesignated Revenues ($6,684,122) – ($6,684,122) Total Study Area 1 (23,891,286) $21,021,688 ($2,869,598)

99
STUDY AREA 2 A 2018 study by the Carl Vinson Institute of Government examined the fiscal viability of Study Area 2 incorporating.101 That study assumed that the following services would no longer be provided by DeKalb County but instead would become the responsibility of the new city:
• Business licenses (within Planning and Sustainability) • Code compliance (within Beautification) • Planning and zoning (within Planning and Sustainability) • Development (within Planning and Sustainability) • Parks and recreation (within Recreation, Parks, and Cultural Affairs) • Police (Police) • Right-of-way maintenance (Keep DeKalb Beautiful within Beautification) • Roads (Roads and Drainage and Transportation within Public Works) • Traffic Court (within State Court)
Beautification – Keep DeKalb Beautiful The Keep DeKalb Beautiful Division did not generate any revenues in FY 2018, so none would be lost if Study Area 2 incorporated.
Table 3.21 shows the total expenditures for the division as well as the percentage of center-lane miles in Study Area 2, which is used to determine the area’s estimated expenditures. These expenditures represent the cost savings to the county if Study Area 2 were to incorporate. The KDB program is not expected to be impacted by incorporation.
Table 3.21. Study Area 2 Keep DeKalb Beautiful Expenditures
Division Total
KDB
Litter Removal
Mowing ROW
Tree Trimming
Total Expenditure $5,911,210 $247,489 $2,563,808 $2,804,803 $295,110 Study Area 2 Percent of Lane Miles – 14.6% 14.6% 14.6%
Study Area 2 Expenditures1 – $374,248 $409,427 $43,078
Keep DeKalb Beautiful Expenditures $826,753 1. Study Area 2 does not exactly match total expenditures multiplied by the percentage of lane miles due to
rounding of lane miles for this table. Note: KDB = Keep DeKalb Beautiful; ROW = right-of-way The net impact to the county of no longer providing right-of-way services within Study Area 2 is a savings of $826,753. Assuming an equal distribution of work across the study areas, service levels in the remaining unincorporated area should not change if Study Area 2 were to 101 Carl Vinson Institute of Government. 2018, February. Fiscal Feasibility Analysis of a Proposed City of Vista Grove.

100
incorporate. Likewise, these cost savings would not affect the property tax rate since the Keep DeKalb Beautiful Division is not funded through property taxes.
Beautification – Code Compliance Code compliance revenues are reflected in code enforcement fines issued by the Magistrate Court as well as deposits into the Foreclosure and Vacant Property Registry Fund (Fund 205). Magistrate Court revenues were assigned to the study areas proportionally to expenditures. Less than 5% of personnel (4.88%) were dedicated to Study Area 2 (see Chapter 2 for a discussion of workload and cost distributions), so 4.88% of Magistrate Court revenues were as well. For Fund 205, property owners pay a fee to the county when they register their vacant property. Therefore, revenues deposited into the Foreclosure and Vacant Property Registry Fund were allocated to each study area based upon their percentage of vacant properties, which for Study Area 2 equaled 6.7% of the total. Table 3.22 shows that if Study Area 2 were to incorporate, an estimated $47,583 would no longer be available to the county to perform code compliance services.
Table 3.22. Study Area 2 Code Compliance Revenue
Revenue Division Total Study Area 2 Magistrate Court $924,944 $45,091 Foreclosure Registry Fund $37,200 $2,492 Code Compliance Revenue $962,144 $47,583
Note: Study Area 2 does not exactly match 4.88% due to rounding of that percentage. The Code Compliance Division categorizes employees into two main service units: those who service particular zoned areas and a special unit that serves motels and multifamily housing. The estimated expenditures for the division’s zoned work totaled $2,927,424 in FY 2018 and the special unit’s expenditures were $1,097,784, for division-wide total expenditures of $4,025,208. In Chapter 2, Study Area 2 was calculated as having just one position out of 32 working in the zone areas (including supervisors) and 1.15 employees working as part of the special unit (see Tables 2.4 and 2.5). Costs for Study Area 2 were determined based on the average cost of one direct service employee.102 Table 3.23 show the estimated reduction in expenditures if Study Area 2 incorporated.
102 For more information on how costs for the two service units were determined, please see Chapter 2.

101
Table 3.23. Study Area 2 Code Compliance Operating Expenditure
Service Zones Special Unit Number of Employees – Study Area 2 1.0 1.15 Average Per Employee Cost $91,482 $91,482 Study Area 2 Expenditure $91,482 $104,788 Code Compliance Expenditure $196,270
In FY 2018, the Foreclosure Registry Fund only spent $11,897 to manage vacant properties. The distribution of expenditures by study area was the same as for revenues, the percentage of vacant properties in each area. In FY 2018, Study Area 2 had 6.7% of all vacant residential and commercial properties, according to the county tax assessor’s database. This results in an additional expenditure savings of $797.
The net impact of DeKalb County no longer performing code compliance services in Study Area 2 would be a net savings of $149,484 (See Table 3.24).
Table 3.24. Net Impact to the Code Compliance Division if Study Area 2 Incorporates
Estimated Amount Revenue Losses ($47,583) Expenditure Savings Fund 272 $196,270 Expenditure Savings Fund 205 $797 Code Compliance Net Impact $149,484
Because expenditures were assigned per employee and revenues were assigned proportionally to expenditures, the level of spending in the remaining unincorporated area does not change if Study Area 2 becomes a city. The remaining division would be relatively unchanged, with an estimated loss of 2.15 FTEs. If the ratio between direct service employees and administrative employees were maintained — 44 direct service and 10 administrative (4.4:1) — the division would continue to continue to employ 9.5 administrative staff.103
As with Keep DeKalb Beautiful, property taxes do not support this division and thus would be unaffected if the county ceased to provide code compliance services within Study Area 2.
Planning and Sustainability – Business Licenses The Department of Planning and Sustainability provided business license data for this study that enabled the research team to geographically locate businesses with the license amount paid. Table 3.25 presents FY 2018 totals for each type of revenue associated with business licenses applied for within Study Area 2. See Appendix A for details on how the research team
103 The Code Compliance Division currently has 10 administrative staff, including the deputy director.

102
distributed revenues across the study areas. If Study Area 2 were to incorporate, the county would lose an estimated $2,022,633 in revenue annually.
Table 3.25. Study Area 2 Business License Revenue
Revenue Division Total Study Area 2 Beverage Licenses $664,696 $136,788 Business Licenses - General $8,060,815 $1,901,199 Business Licenses - Adult Ent. $125,000 $25,724 Misc. Revenue $75 $18 Misc. Returned Check ($174,242) ($41,096) Business License Revenue $8,676,344 $2,022,633
The research team allocated expenditures proportionally to revenues. Nearly a quarter (23.31%) of all business license revenues came from Study Area 2. Applying that same percentage to expenditures results in a savings of $176,132 from fewer staff and lower operating costs.104 With five positions, a 23% reduction in expenditures equals approximately one FTE and associated operating costs.
Table 3.26 shows the estimated net impact on business licenses if Study Area 2 incorporates. The county would lose $1.85 million from no longer receiving business license revenue. The county has used this money to support other unincorporated serves like code compliance and rights-of way maintenance (Keep DeKalb Beautiful) as well as transferring revenue to the Designated Services Fund (Fund 271).
Table 3.26. Net Impact to Business License Revenues if Study Area 2 Incorporates
Estimated Amount Revenue Losses ($2,022,633) Expenditure Savings $176,132 Business License Net Impact ($1,846,501)
Planning and Sustainability – Current Planning The Current Planning Unit collected $90,486 in FY 2018. Of this, $52,276 came from zoning fees, $37,845 from variance permits, and $365 from miscellaneous revenues. Using the workload data discussed in Chapter 2 (see Table 2.7), 17 of the 91 zoning applications (18.7%) and 48 of the 95 (50.5%) variance and administrative appeals that year came from Study Area 2. Therefore, the associated revenues for these services are distributed based on those percentages. Miscellaneous revenue is the average percentage of the other two revenues (34.6%).
104 $755,541 x .23312 = $176,132

103
Table 3.27. Study Area 2 Current Planning Revenue
Revenue Division Total Study Area 2 Zoning Fees $52,276 $9,766 Variance Permits $37,845 $19,122 Miscellaneous $365 $126 Current Planning Revenue $90,486 $29,014
Because of the differences in time required for the Current Planning Unit to perform its various planning and zoning activities, the deputy director of planning recommended distributing expenditures to the study areas based on the percentage of revenue collected from each.105 Nearly 19% (18.7%) of zoning fees came from Study Area 2, and thus the same percentage was allocated to the study area for that cost center. Likewise, 50.5% of variance permit revenues were from Study Area 2 and so 50.5% of the variance permits costs were assigned there as well. There were no historic preservation expenditures for Study Area 2.
Table 3.28. Study Area 2 Current Planning Expenditures
Service Area
Division Total Expenditure
Study Area 2 Percent Allocation
Study Area 2 Expenditures
Historic Preservation $142,775 0.0% $0 Zoning $798,937 18.68% $149,241 Variance Permits $578,540 50.53% $292,336 Current Planning Expenditure $1,520,252 $441,577
The Current Planning Division is not self-funded and relies on other unincorporated revenues to fund its services, such as nondesignated revenue and business licenses. Thus, although there are savings from the county no longer providing this service for Study Area 2, it has no impact on property taxes. The estimated net savings for FY 2018 if Study Area 2 had incorporated would have been $412,563. Using the cost per employee of $152,025 discussed in Chapter 2, this savings translates to 2.7 fewer FTEs for the Current Planning Unit. Because of the diverse work the unit performs, it is unclear how having fewer employees would impact its overall performance and ability to serve the remaining unincorporated area.
105 The research team allocated unit-wide costs between zoning and variance according to the revenues each service generated. Zoning generated 58% of total revenues and was assigned 58% of the costs after first removing costs for historic preservation. Variance permits generated 42% of the revenue and was assigned 42% of expenditures after removing costs for historic preservation.
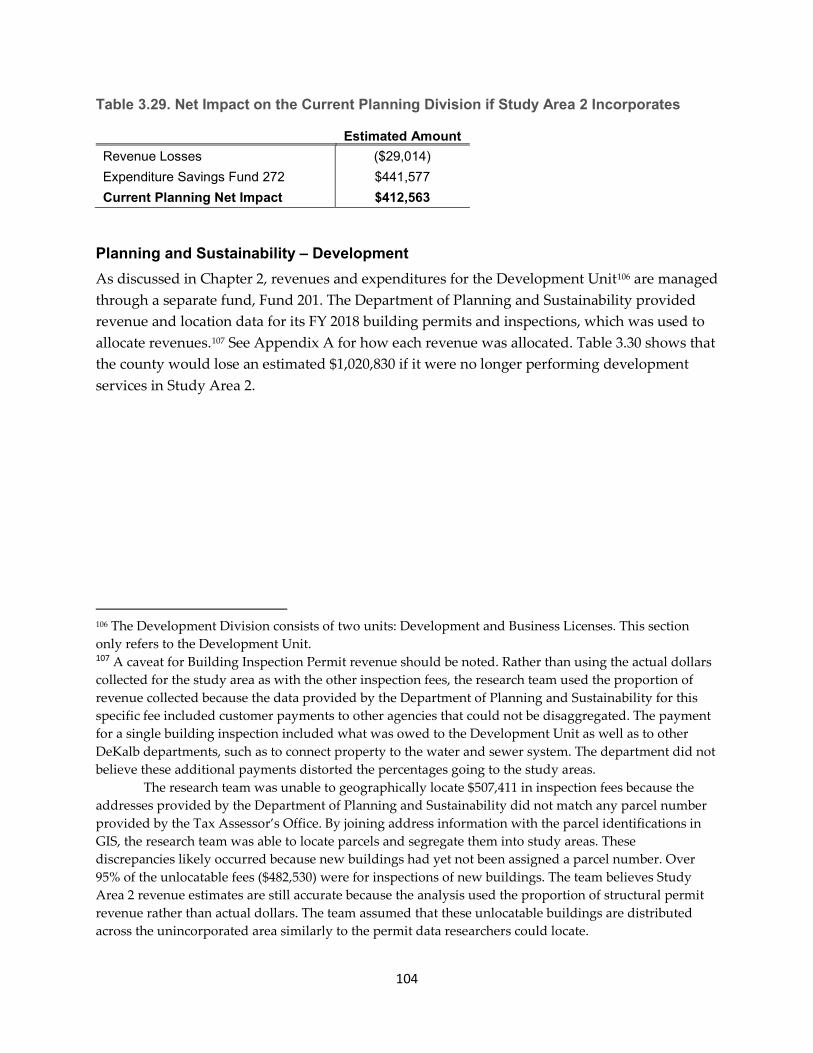
104
Table 3.29. Net Impact on the Current Planning Division if Study Area 2 Incorporates
Estimated Amount Revenue Losses ($29,014) Expenditure Savings Fund 272 $441,577 Current Planning Net Impact $412,563
Planning and Sustainability – Development As discussed in Chapter 2, revenues and expenditures for the Development Unit106 are managed through a separate fund, Fund 201. The Department of Planning and Sustainability provided revenue and location data for its FY 2018 building permits and inspections, which was used to allocate revenues.107 See Appendix A for how each revenue was allocated. Table 3.30 shows that the county would lose an estimated $1,020,830 if it were no longer performing development services in Study Area 2.
106 The Development Division consists of two units: Development and Business Licenses. This section only refers to the Development Unit. 107 A caveat for Building Inspection Permit revenue should be noted. Rather than using the actual dollars collected for the study area as with the other inspection fees, the research team used the proportion of revenue collected because the data provided by the Department of Planning and Sustainability for this specific fee included customer payments to other agencies that could not be disaggregated. The payment for a single building inspection included what was owed to the Development Unit as well as to other DeKalb departments, such as to connect property to the water and sewer system. The department did not believe these additional payments distorted the percentages going to the study areas.
The research team was unable to geographically locate $507,411 in inspection fees because the addresses provided by the Department of Planning and Sustainability did not match any parcel number provided by the Tax Assessor’s Office. By joining address information with the parcel identifications in GIS, the research team was able to locate parcels and segregate them into study areas. These discrepancies likely occurred because new buildings had yet not been assigned a parcel number. Over 95% of the unlocatable fees ($482,530) were for inspections of new buildings. The team believes Study Area 2 revenue estimates are still accurate because the analysis used the proportion of structural permit revenue rather than actual dollars. The team assumed that these unlocatable buildings are distributed across the unincorporated area similarly to the permit data researchers could locate.

105
Table 3.30. Study Area 2 Development Revenue
Revenue Division Total Study Area 2 Sign Permits $25,809 $3,910 Certificate of Occupancy $270,703 $34,433 Variance Permits $5,031 $640 Subdivision Fees $41,901 $5,330 Registration Fees – Plumbing1 $3,672 $463 Develop Permits $378,814 $48,185 Inspection Fee – Building $4,418,603 $547,465 Inspection Fee – Plumbing $514,021 $64,818 Inspection Fee – Electrical $1,140,178 $168,746 Inspection Fee – HVAC $630,406 $94,057 Sale of Printed Material $6,995 $890 NPDES Fees $8,162 $1,038 Technology Fees $399,803 $50,855 Development Revenue $7,844,098 $1,020,830
1. There were no revenues for HVAC and electrical registration fees in FY 2018. The director of the Development Unit recommended allocating expenditures across the study areas based on the revenue distribution. The revenues associated with Study Area 2 equal 13.01% of all revenues collected for the Development Fund (Fund 201) in FY 2018. Using this percentage, Study Area 2’s estimated expenditures were $817,976.
Table 3.31 shows the estimated net impact on the Development Unit if Study Area 2 were to incorporate. The county would experience a net loss of $202,854 from no longer providing development services. Because this revenue is only used for development, no other services would be impacted. Likewise, no property taxes support this service and thus would be unaffected. Using the cost-per-employee metric discussed in Chapter 2 of $178,275, the estimated reduction in expenditures ($817,976) translates to 4.6 FTEs. Additionally, the net loss of $202,854 equals 1.1 employees. The loss of the employees beyond the reduced workload, estimated here through revenues, implies lower service levels for the remaining service area if Study Area 2 were to incorporate.
Note that in FY 2018, the Development Fund (Fund 201) earned $1,556,816 more than it spent. This excess revenue is typical during times of heavier development. Conversely, the unit would incur a net loss when there is less construction to pay for staff and operating needs.

106
Table 3.31. Net Impact on the Development Unit if Study Area 2 Incorporates
Estimated Amount Revenue Losses ($1,020,830) Expenditure Savings $817,976 Development Net Impact ($202,854)
Police Chapter 2 outlined the basic service call data and the expenditure amounts for each of the categories of police services. Note that while the DCPD has a Special Operations Division, only a few of the units in this division recorded activities in a manner that would allow for the precise geolocation needed to allocate activities to geographic areas. Because the Bomb Unit activity data suggest that this unit is used in a manner similar to a countywide service (rather than primarily for the designated police service areas), expenditures have been included as a support service.
To translate workload demands into an allocation of costs to the various geographic areas of interest, the research team allocated direct service expenditures (on uniform, investigations, and designated services). Once direct service expenditures were allocated, the researchers allocated support services (or indirect) expenditures to the areas of interest based on needed direct service expenditures.
For simplicity, the Aerial, SWAT, and K-9 units are combined into a special operations category.
Table 3.32. Allocation of Police Expenditures for DCPD Service Area, FY 2018
Expenditure on Direct Services
% of Total Direct Services
Allocation of Indirect & Support Units
Investigations $14,242,870 18.8% $4,923,817 Uniform $56,775,049 74.9% $19,627,361 Special Operations $4,759,159 6.3% $1,645,260 Total $75,777,078 100.0% $26,196,438
This section examines the effects on the rest of the DCPD service area if Study Area 2 were to incorporate and operate its own police department. Based on the analysis of service call and incident data and the assumptions outlined in Chapter 2 (see Tables 2.11–2.18), Table 3.33 shows the estimated percentages of current DCPD resources Study Area 2 utilizes.

107
Table 3.33. Estimated Percentage of DCPD Resources Study Area 2 Utilizes
Uniform Services SWAT K-9 Aerial Criminal Investigations, Crime
Scene, Intelligence 8.37% 0.00% 2.19% 0.95% 6.00%
Table 3.34 presents expenditure estimates for the cost of providing police services in Study Area 2. These estimates were generated by applying the percentages in Table 3.33 to both the direct and indirect expenditures (according to the assumptions discussed above and in Chapter 2).
Table 3.34. Study Area 2 Police Service Expenditure Estimates
Type of Expenditure Amount Criminal Investigations, Crime Scene, Intelligence $1,150,001 Uniform Division $6,396,028 Special Operation Units
SWAT $0 K-9 $32,726 Aerial $20,677
Grand Total $7,599,432
Table 3.35 compares Study Area 2 with the total unincorporated area with regard to fiscal capacity factors such as cost of police services per capita and per $100,000 in fair market value (FMV) of the property in the area.
Table 3.35. Study Area 2 Police Services Fiscal Factors
Service Area Total Cost
Percent of Total Service
Area Expenditures
Population 2010
Cost Per Capita
Fair Market Value
Cost per $100,000 in FMV
Study Area 2 $7,599,432 7.45% 61,089 $124.40 $8,383,284,287 $90.65 Unincorporated Only $80,670,766 79.11% 396,437 $203.49 $30,717,763,683 $262.62
Staffing. Assuming that Study Area 2’s expenditures would be used to support officers at a cost similar to that which DeKalb County currently incurs, the research team was able to estimate the number of officers that Study Area 2 would need. Table 3.36 presents the number of officers needed in Study Area 2 and in the unincorporated area per 1,000 residents.

108
Table 3.36. Officers Needed
Service Area Officers Needed Officers Per 1,000 Pop. Study Area 2 53.40 0.87 Unincorporated Only 566.82 1.43
Vehicles. Were a city comprising Study Area 2 to equip its police officers and staff with vehicles using the same ratio of vehicles to officers as is currently the case in the DCPD, then approximately 80 vehicles would be needed.
Expenditure Savings and Net Impact
Table 3.37 summarizes the findings presented in the revenues section of Chapter 2 and Appendix A regarding the loss of revenue for DeKalb County (Fund 274).
Table 3.37. FY 2018 Revenue Impact Had Study Area 2 Incorporated
Revenue Category Amount Percent Taxes $14,754,180 79.28% Insurance Premium $3,731,185 20.05% Licenses and Permits $53,144 0.29% Charges for Services $49,879 0.27% Fines and Forfeitures $0 0.00% Investment Income $13,985 0.08% Transfers from Other Funds $0 0.00% Miscellaneous $8,768 0.05% Total $18,611,141 100.00%
Table 3.37 shows that the vast majority of the loss in revenue would have come from property taxes and insurance premiums.
Table 3.38 summarizes the revenue losses, expenditures savings, and the net impact to DeKalb County from Study Area 2 providing its own police services. Expenditure savings include funds spent on uniform services, criminal investigations, special operations, and all the support services needed to provide these direct law enforcement actions.
Table 3.38. Net Impact of Study Area 2 No Longer Receiving Services from the DCPD
Revenue Loss ($18,611,141) Expenditure Savings $7,599,432 Net Impact ($11,011,709)

109
Potential Response Options
DeKalb County could address the impact of a net loss of this much revenue in three primary ways. First, the county could reduce the level of service in the remaining DCPD service area. Second, DeKalb could raise taxes and fees in the remaining DCPD service area in order to provide the same level of service that residents currently receive. Third, the county could use a combination of some increase in taxes and fees with some level of reduction in service. The next sections discuss the implications if the county were to choose either Option 1 or 2. The implications of the county choosing the third option would range somewhere between those of Options 1 and 2.
Option 1. Reduce the Level of Service
The level of service could be reduced in a variety of ways: The DCPD could cut back on training; it could eliminate certain special units; it could cut down on patrol routes; it could increase response times; or it could enact any combination of these cost reduction strategies. To illustrate the impact of a reduction in service, the research team used two straightforward metrics—number of officers and officers per 1,000 residents—because they can be easily calculated from figures on available revenue. Attempting to translate revenue loss into something like an increase in police response time would be problematic because the calculation would depend on numerous factors other than revenues.
Tables 3.39 and 3.40 show how Study Area 2 incorporating and establishing its own police department would affect DCPD’s capacity to deliver services in the remaining unincorporated area. Table 3.39 shows how the remaining revenue to support DCPD services translates into a deficit in the number of officers that can be funded with that revenue.
Table 3.39. Office Deficit in Remaining DCPD Service Area if Study Area 2 Incorporates
Event
Officers Needed in Remaining DCPD Service
Area Net Officers Deficit Incorporation of Study Area 2 663.1 –77.37
Table 3.40 indicates how the ratio of officers to population would change if Study Area 2 were removed from the DCPD service area. The deficit in officers per 1,000 residents shows the net impact in service delivery capacity after incorporation. This figure is the difference between the number of officers per capita needed to police the remaining area and the officers per capita that the remaining service area can afford at current levels of taxes and fees.

110
Table 3.40. Change in Officers per 1,000 Population in Remaining Service Area if Study Area 2 Incorporates
Officers: Population, Keeping Service Level
Constant
Officers: Population, After Revenue
Reduction Change in Officers to
Population Ratio Incorporation of Study Area 2 1.58 1.40 -0.18
Option 2. Raise Taxes
If DeKalb County chose to maintain the current level of police services in the remaining DCPD service area, additional revenue would need to be raised through increases in either taxes or fees or both. Some revenue amounts like insurance premiums are essentially set, and some fees, such as charges for fingerprinting and background checks, are relatively minor sources of revenue for the county and therefore cannot practically be increased through rate hikes. Thus, property taxes are the only feasible revenue source for raising the kind of revenue needed to fill the revenue gap created by the DCPD no longer providing police services in Study Area 2.
Although a number of property taxes (e.g., real, personal, motor vehicle, intangible, utility, recording, etc.) could potentially be raised to fill the fiscal gap, the Raise Taxes Option is illustrated solely through the real property tax. This is done in part because of the lack of accurate information on personal property, motor vehicle property (subject to the old ad valorem tax), and utility property in the areas of the county that do not currently form tax jurisdictions, i.e., Vista Grove and the area above Hwy. 78. Consequently, the estimate of the millage rate increase will be higher than the actual millage rate increase that a real property owner would likely experience. An analysis of the property taxes raised for Fund 274 suggests that real property taxes represent approximately 87.4% of all property taxes that the county has the ability to adjust.108 To illustrate impact, the research team assumed that all of the revenue gap that needs to be covered through increases in taxes and fees is borne by an increase in the real property tax.
The research team’s aim was to estimate how much the real property millage rate would need to increase to fill the gap in revenues required to provide the same level of service as the DCPD currently offers in the service area. The researchers began by identifying the area of analysis as the area where DCPD provides full services. This primary service area includes all of the unincorporated area as well as the cities of Tucker and Stonecrest. The other cities serviced by the DCPD receive only nonbasic or minimal basic services, with total expenditures of less than $500,000. The area of analysis is thus limited by the assumption that these smaller cities will
108 The new Title Ad Valorem Tax is set by the state with the revenues shared with local government. This TAVT revenue accounts for most motor vehicle taxes collected by DeKalb County.

111
continue to pay for the services they receive. Consequently, total DCPD expenditures are adjusted to include only expenditures on services delivered in the primary service area.
The research team next identified the total amount of taxable assessed value109 of the real property in the various portions of the primary service area, i.e., unincorporated DeKalb and the cities of Tucker and Stonecrest.110 From the sum of these assessed values, the researchers subtracted the assessed value of real property in Study Area 2 to arrive at the assessed value in the DCPD’s primary service area remaining if Study Area 2 was no longer receiving DCPD services.
Finally, based on the assessed value of real property in the remaining service area, the research team calculated a millage rate applied to this value that would generate the revenue needed to fill the gap. Table 3.41 shows these calculations.
3.41. Table Millage Rate Impact Possible If Study Area 2 Were Removed from the DCPD Service Area
Assessed Value in DCPD Primary Service Area Remaining After Study Area 2 Removed $11,725,884,375
Net Revenue Loss ($11,011,709) Millage Rate Increase Needed to Fill Gap 0.94
Capital
This analysis focuses on operational capability and the revenues needed to support this capability. Because Fund 274 makes annual appropriations for normal capital expenditures, the analysis includes these ordinary and ongoing capital costs. However, sometimes Fund 274 transfers funds to a separate capital fund, and expenditures are made from this fund to support DCPD operations. In the last five years, this occurred only once, as part of a capital project to purchase body cameras. Because the Institute research team does not know whether this capital expenditure will become an ordinary and ongoing cost, the analysis includes only the capital costs that have already been incorporated into the Fund 274 operational budget. However, if this new capital expenditure does become ongoing, DeKalb County would incur approximately $120,000 in additional annual expenditures.
109 “Assessed value” in DeKalb County represents 40% of the fair market value set by tax assessors. 110 Data on assessed values for the study areas (e.g., Tucker, Stonecrest, and the unincorporated area) were provided by the DeKalb County Tax Commissioner’s Office. Data for the cities of Tucker and Stonecrest were extracted from the Consolidated Tax Digest, State Department of Revenue. The gross Consolidated Digest values were adjusted to exclude utility taxes, motor vehicle, heavy equipment, and personal property taxes.

112
Public Works – Roads and Drainage and Transportation Because the work of the Roads and Drainage and Transportation Divisions (Roads Services) is interconnected and the expenditures for both divisions are allocated across the study areas similarly, via center-lane miles, they are treated as a single entity in the analysis.
As Table 3.42 shows, a total of $3,227,672 in revenues is assigned to Study Area 2 for Roads Services. See the Revenue Section in Chapter 2 and Appendix A for more information about property taxes and other revenues assigned to Roads Services.
Table 3.42. Study Area 2 Roads and Drainage and Transportation Revenue
Revenue Department Total Study Area 2 Real Property Taxes $9,739,838 $2,237,942 Property Taxes Prior Year $367,352 $77,181 Personal Property Taxes $723,506 $161,921 Public Utilities Taxes $308,648 $10,432 Mobile Homes Taxes $422 – Motor Vehicle Taxes $299,257 $42,524 Intangible Recording Tax $170,552 $35,833 Energy Excise Tax $1,845 $245 HOST $912,352 $0 Parking Lot Assessments $20,862 $2,478 Retention Pond Fees $3,283 $390 Stormwater Utility Transfer $952,220 $92,175 Sale of Printed Material $25 $3 Residential Parking Permits $2,070 – Speed Humps – Fund 212 $312,106 $50,975 Street Light Assessments – Fund 211 $4,664,031 $512,831 Investment Income $14,662 $2,742 Roads Services Revenue $18,493,031 $3,227,672
The division directors agreed that the best method to distribute expenditures across the study areas was through the percentage of center-lane miles in the service area. For Study Area 2, that amount equaled 11.88%. (See Chapter 2 for more information.) The research team used this percentage to distribute expenditures from the Designated Services Fund (Fund 271), with two exceptions: expenditures for survey design and construction and for land acquisition. According to the Transportation Division director, all the expenditures related to these cost centers were within the unincorporated area in FY 2018. Therefore, instead of Study Area 2 representing 11.88% of the total center-lane miles (and expenditures), it represented 14.6% of

113
the center-lane miles.111 Rather than using center-lane miles, the research team was able to allocate expenditures for Street Lights (Fund 211) and Speed Humps (Fund 212) geographically due to information from the County Tax Commissioner. (See Chapter 2 for details.)
Table 3.43. Study Area 2 Roads and Drainage and Transportation Operating Expenditures
Expenditure Category Division Total Study Area 2 Roads and Drainage – Fund 271 $17,479,520 $2,076,566 Transportation – Fund 271 $2,755,870 $347,796 Speed Humps – Fund 212 $192,526 $31,445 Street Lights – Fund 211 $5,311,105 $583,977 Roads Services Expenditures $25,739,021 $3,039,784
To provide greater detail, Tables 3.44 and 3.45 present each division’s FY 2018 expenditure information by cost center.
Table 3.44. Study Area 2 Roads and Drainage Expenditure Details, Fund 271
Expenditure Category Estimated Amount Administration $73,957 Maintenance $207,487 Road Maintenance $997,698 Support Services $177,386 Drainage Maintenance $70 Stormwater – Traffic Operations $105,148 Speed Humps $12,624 Signals $254,697 Signs and Paint $112,278 County Cost Allocation $135,221 Total Study Area 2 Expenditures $2,076,566
111 Study Area 2 center-lane miles = 178.27 and total unincorporated center-lane miles = $1,221.23. 178.27 / 1,221,23 = 14.60%

114
Table 3.45. Study Area 2 Transportation Expenditure Details, Fund 271
Expenditure Category Estimated Amount Administration $126 Transportation Administration $44,794 Engineering Operations $4,439 Design/Survey Construction $78,920 Roads & Drainage $6 Project Management $16,888 Land Acquisition $30,660 Support Services $142 Traffic Planning/Engineering $107,560 Traffic Calming $1,732 Traffic Lights $34 Signals $1,220 Signs and Paint $1,660 County Cost Allocation $59,615 Total Study Area 2 Expenditures $347,796
In addition to operating expenditures, the Roads and Drainage and Transportation Divisions spent on average $1,611,390 annually from Fund 271 for capital maintenance and improvements between FYs 2014 and 2018 (see Table 2.37).112 By allocating capital spending per center-lane mile, including Stonecrest and Tucker, the amount assigned to Study Area 2 is $191,433.
Table 3.46 summarizes the estimated revenue losses and the operating and capital expenditure savings if DeKalb County no longer provided road services to Study Area 2. When all revenues and expenditures are summed, the impact is essentially neutral, with a net revenue savings of just $3,545. This calculation includes the special revenue funds (Fund 211 and Fund 212). When just the revenues and operating and capital expenditures for the Designated Services Fund (Fund 271) is considered, the net revenue loss is still relatively small at $48,071113 or only 0.36% of total Roads Services revenues in the fund.
112 This amount is in addition to capital spending from Georgia Department of Transportation grants, HOST projects, etc. 113 Fund 271: $2,663,866 – ($2,076,566 + $347,796 + $191,433) = –$48,071

115
Table 3.46. Net Impact to Roads and Drainage and Transportation if Study Area 2 Incorporates
Estimated Amount
Revenue Losses (Funds 271, 211, 212) ($3,227,672) Operating Expenditure Savings (Funds 271, 211, 212) $3,039,784 Capital Expenditure Savings $191,433 Roads and Drainage and Transportation Impact $3,545
Because the net revenue loss is fairly small when considering only the Designated Services Fund (Fund 271), a reduction in the quality of service should not need to occur, assuming no changes in relative efficiency. However, the two divisions would, by necessity, be smaller and require fewer staff, as well as pave fewer miles of road and undertake fewer major transportation projects. If one assumes that workload and personnel are correlated, then the number of staff could be reduced by 12%, which is the percentage of road miles in Study Area 2.
Recreation, Parks, and Cultural Affairs The Department of Recreation, Parks, and Cultural Affairs tracks revenues by cost center, enabling an accurate distribution of revenues across the study areas. Table 3.47 shows that revenues for Study Area 2 totaled $4,004,401 in FY 2018. For additional information regarding how revenues were distributed across the service areas, particularly for taxes deposited into the Designated Services Fund, please see Appendix A.

116
Table 3.47. Study Area 2 Recreation, Parks, and Cultural Affairs Revenue
Revenue Department Total Study Area 2 Real Property Taxes $13,394,5091 $3,433,478 Property Taxes – Prior Year $563,597 $136,898 Personal Property Taxes $924,8301 $251,554 Public Utility Taxes $473,532 $16,005 Mobile Home Taxes $647 $0 Motor Vehicle Taxes $429,1431 $66,131 Intangible Recording Tax $261,663 $63,558 Energy Excise Tax $2,830 $376.39 HOST $1,399,742 $0 Department Programs $360,624 $0 Recreation Programs – Fund 207 $902,410 $36 Nonresident Dept. Program $18,062 $0 Concessions $28,306 $0 Swimming Pool $367,465 $4,022 Golf Course Fees $20,048 $0 Tennis Center Fees $43,245 $0 Tennis Center Rental $31,050 $0 Rental – Other/Pavilions $48,682 $0 Fees – Porter Sanford $62,652 $3,247 Other Miscellaneous $6,791 $0 Returned Check ($2,316) $0 Rental Car Tax Fund5 $522,178 $24,493 Investment Income $20,999 $4,603 Dept. of Recreation, Parks, and Cultural Affairs Revenue $19,880,689 $4,004,401
1. Reflects reductions in revenue of $1,763,630 transferred to the City of Tucker as reimbursement for excess property taxes paid by residents when Tucker began providing parks and recreation services in the spring of 2018. Reductions to real, personal, and motor vehicle taxes were made proportionally based on Tucker’s portion of the total assessed value of property for these property tax categories.
In Chapter 2, the operating expenditures for the Department of Recreation, Parks and Cultural Affairs were disaggregated between the parks and recreation divisions. Each cost center has its own methodology for allocating costs across the study areas (see Appendix D for details). For the Parks Division, expenditures were allocated across the study areas based on the location of a park and its acreage. For the Recreation Division, expenditures were allocated based on the percentage of recreation participation in a study area (see Table 2.33). Because Study Area 2 does not have a recreation center, it does not have recreation participants and thus was not assigned recreation expenditures. With these calculations, the research team was able to estimate the operating expenditures for Study Area 2. The total estimated spending for Study Area 2 was $387,106 in FY 2018 or just 2.02% of all departmental spending (See Table 3.48).

117
Table 3.48. Study Area 2 Recreation, Parks, and Cultural Affairs Expenditures
Service Area
Department Total Expenditure
Study Area 2 Expenditures
Study Area 2 Percent of $
Parks – Fund 271 $11,577,434 $385,106 3.33% Recreation – Fund 271 $6,439,146 $0 0.00% Parks – Fund 2071 $60,899 $2,200 3.61% Recreation – Fund 207 $1,112,387 $0 0.00% Park Division Expenditure $19,189,866 $387,306 2.02%
Note: Arabia Mountain is excluded from the percentage of park acreage calculation (120.5 / 3,336.3 acres). To provide greater detail for Study Area 2, Tables 3.49 and 3.50 list the expenditures by cost center, for the Designated Services Fund (Fund 271) and Recreation Fund (Fund 207), respectively. The final category of expenditures in Table 3.49 represents the indirect administrative charges assigned to the department.114 (See Chapter 2 for more information on the county’s administrative indirect cost plan and its application in this report.)
Table 3.49. Study Area 2 Parks and Recreation Expenditure Detail, Designated Services Fund (Fund 271)
Expenditure Category1 Estimated Amount Department Administration $26,115 Special Populations $193 Planning and Development $5,190 Aquatics $5,450 Parks Division Administration $23,746 District 1 Service Center $259,350 District 2 Service Center $0 District 3 Service Center $4,257 Support Services $362 Horticulture & Forestry $563 Planning and Development $162 Natural Resource Management $2,899 Marketing and Promotion $2,554 County Cost Allocation $54,265 Total Study Area 2 Expenditures $385,106
1. Cost centers without expenditures are not included in the table.
114 The Recreation Fund was not assigned an indirect administrative charge.

118
Table 3.50. Study Area 2 Parks and Recreation Expenditure Detail, Recreation Fund (Fund 207)
Expenditure Category1 Estimated Amount Outdoor Recreation $2,200 Total Study Area 2 Expenditures $2,200
1. Cost centers without expenditures are not included in the table. In addition to operating expenditures, the Department of Recreation, Parks, and Cultural Affairs spent on average $653,200 annually on capital maintenance and improvements between FYs 2014–2018. This translates to $5,226 per park each year. Study Area 2 has a total of 12 parks; thus, the amount of total capital spending assigned to Study Area 2 is $62,712.
Table 3.51 presents the net impact on the county if Study Area 2 incorporated and the county no longer provided park services in the area. The table, which sums the revenue losses and operating and capital expenditure savings, shows that the county would experience a revenue loss of $3,554,383 annually. To adjust for this shortfall, the department would need to either reduce the level of spending on the remaining parks or increase the millage rate for the Designated Services property tax (or a combination of the two).
Table 3.51. Net Impact on the Department of Recreation, Parks, and Cultural Affairs if Study Area 2 Incorporates
Estimated Amount Revenue Losses (Funds 271 + 207) ($4,004,401) Operating Expenditure Savings (Funds 271 + 207) $387,306 Capital Expenditure Savings $62,712 Recreation, Parks, and Cultural Affairs Net Impact ($3,554,383)
Because the department would experience a net revenue loss with incorporation, the research team calculated an adjusted operating expenditure based on the net revenue loss of $3,554,383. This figure already adjusts for the savings to the county associated with no longer maintaining the 120.5 acres of parkland in Study Area 2. If Study Area 2’s assigned expenditures were reduced in an amount equivalent to lost revenue ($3,554,383), the operating expenditures would have been $15,248,177115 to manage 5,921.5 acres and serve 719,585 recreation program participants116 in FY 2018, all other things remaining equal.
By distinguishing the impact of Study Area 2 incorporating on the Parks and Recreation Divisions separately, the estimated effect on park maintenance becomes much more striking because recreation is unaffected (see Table 3.52). In other words, all $3.55 million in lost revenue
115 This figure excludes the consideration of capital. 116 Park acres: 6,042 – 120.5 =5,912.5 and recreation participants: 719,585 – 0 = 719,585

119
is assigned to parks maintenance. Parks Division expenditures decrease from $11,638,333 to $8,083,950. Concomitantly, the spending per park acre for maintenance drops from $1,926 to just $1,365, a 29% a change, whereas the spending per recreation participant remains the same.
Table 3.52. Estimated Change in Parks and Recreation Service Levels if Study Area 2 Incorporates
Parks Division Recreation Division FY 2018 Actual Expenditures $11,638,333 $7,551,533 Study Area 2 Impact ($3,554,383) $0 Remaining Service Area Budget $8,083,950 $7,551,533 Remaining Park Acres / Recreation Participants 5,921.5 719,585 New Service Level $1,365 per acre $10.50 per participant
The research team used a simple calculation to estimate the impact of Study Area 2 incorporating on property taxes (assuming service levels remain unchanged). The calculation used only real property values for the service area in FY 2018.117 Table 3.53 shows that the county would need to increase the Designated Services millage rate for parks and recreation by approximately 0.35 mills to maintain the same service levels if Study Area 2 incorporated.
Table 3.53. Estimated Change in Parks and Recreation Millage Rate from Study Area 2 Incorporating
Computation Results
Current Assessed Value Real Property $13,248,201,314 Study Area 2 Assessed Value $3,159,331,815 New Assessed Value1 $10,088,869,499 Study Area 2 Loss $3,554,383 Net Revenue Loss as Millage Rate 0.35 mills
1. For simplicity, this scenario only uses the assessed value for real property and does not consider HOST, exemptions, or personal and utility property.
State Court – Traffic Court The workload of DeKalb County’s traffic court is tied to the number of moving violations tickets the county police issue. Because the exact location of every ticket is unknown, workload (and therefore revenues and expenditures) are distributed by population. Study Area 2 represents 12.73% of the county’s population, and thus traffic court workload.118 Although the DCPD offers some services to the cities of Clarkston, Lithonia, and Pine Lake, they have their 117 The total assessed value excludes property within the City of Tucker because the city was rebated the value of property taxes that property owners paid in FY 2018. 118 61,089 / 480,023 =12.73% (See Table 2.34)

120
own police departments and municipal courts and are excluded from this analysis. However, the populations of Stonecrest and Tucker are included in the calculations of traffic court revenues and expenditures. If Study Area 2 were to incorporate and provide its own police services, the estimated loss to traffic court revenue would be $1,062,399 (see Table 3.54).
The DeKalb County Police Department issued 48,691 tickets in FY 2018 (see Chapter 2 for more details), with an average collection of $171.45 per ticket.119 If Study Area 2 were to incorporate and provide its own police services, the county would issue an estimated 6,197 fewer tickets.120
Table 3.54. Study Area 2 Traffic Court Revenue
Revenue Division Total Study Area 2 State Court Traffic $6,971,875 $887,259 State Court Costs $1,376,074 $175,123 Misc. Revenue $132 $17 Traffic Court Revenue $8,348,081 $1,062,399
Table 3.55 shows the estimated cost reductions and the net impact to the county in regard to traffic court if Study Area 2 incorporated. As with revenues, the associated savings to the county from no longer providing traffic court services were estimated as a percentage of the population in the area, 12.73%. The reduced expenditures are calculated to be $678,145, equivalent to 6.4 FTEs.
If Study Area 2 were to provide its own police services, the county would incur an estimated net revenue loss of $384,254 related to traffic court.121 In FY 2018, traffic court generated excess revenue of $3,020,938 for the Unincorporated Fund (Fund 272). Fund 272 also transferred $2,775,404 to the Police Services Fund (Fund 274) that year. Therefore, the net loss of revenue from traffic court would undoubtedly partially limit the ability of Fund 272 to support police services.
Table 3.55. Net Impact on DeKalb County Traffic Court if Study Area 2 Incorporated
Estimated Amount Revenue Losses ($1,062,399) Expenditure Savings $678,145 Traffic Court Net Impact ($384,254)
119 $8,348,081 / 48,691 = $171.45 120 $1,062,399 / $171.45 = 6,196.6 121 Because the calculated revenues and expenditures were based on population, the net revenue loss is 12.73% of excess revenues.

121
Nondesignated Revenues DeKalb County would no longer receive nondesignated revenues—revenues with no direct link to service provision—from Study Area 2 if it incorporated. The county received nearly $11.2 million in nondesignated revenues in FY 2018, $1,945,476 (17.4%) of which originated from Study Area 2 (see Table 3.56). If Study Area 2 incorporated, the county would experience a net loss of revenue equaling that amount.
Table 3.56. Study Area 2 Nondesignated Revenues, FY 2018
Revenue Unincorporated Area Study Area 2 Alcohol Taxes $3,088,362 $661,218 Bank Share Tax $903,863 – Hotel/Motel Tax Fund $1,734,473 $443,703 Franchise Fee – Cable $5,425,127 $836,012 Miscellaneous Revenue – Other $29,481 $4,543 Nondesignated Revenue $11,181,306 $1,945,476
Study Area 2: Summary of Impact Table 3.57 combines all the revenue and expenditures estimates for a summary net impact loss of $17,552,832 to DeKalb County if Study Area 2 incorporated. This net loss equals 9.74% of all the revenues included in this analysis. Even though a few departments would see overall net savings after incorporation, these were more than offset by the significant net losses of revenues in other departments, particularly police and parks and recreation. Unless additional revenues were raised, the levels of service for these two department would undoubtedly have to be reduced, such as through fewer officers per capita or call and less spending per acre for park maintenance. Additionally, the loss of revenue associated with business licenses and traffic court could limit the ability of the Unincorporated Fund (Fund 272) to transfer revenues to support parks and recreation and police.
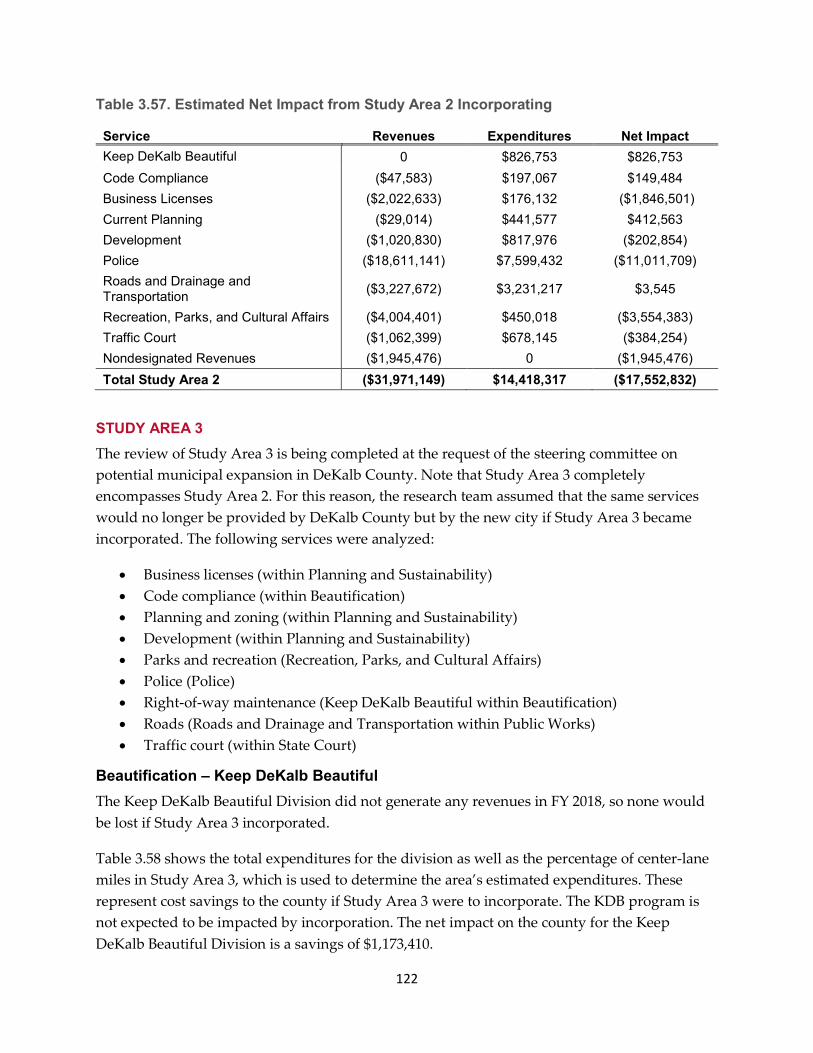
122
Table 3.57. Estimated Net Impact from Study Area 2 Incorporating
Service Revenues Expenditures Net Impact Keep DeKalb Beautiful 0 $826,753 $826,753 Code Compliance ($47,583) $197,067 $149,484 Business Licenses ($2,022,633) $176,132 ($1,846,501) Current Planning ($29,014) $441,577 $412,563 Development ($1,020,830) $817,976 ($202,854) Police ($18,611,141) $7,599,432 ($11,011,709) Roads and Drainage and Transportation ($3,227,672) $3,231,217 $3,545
Recreation, Parks, and Cultural Affairs ($4,004,401) $450,018 ($3,554,383) Traffic Court ($1,062,399) $678,145 ($384,254) Nondesignated Revenues ($1,945,476) 0 ($1,945,476) Total Study Area 2 ($31,971,149) $14,418,317 ($17,552,832)
STUDY AREA 3 The review of Study Area 3 is being completed at the request of the steering committee on potential municipal expansion in DeKalb County. Note that Study Area 3 completely encompasses Study Area 2. For this reason, the research team assumed that the same services would no longer be provided by DeKalb County but by the new city if Study Area 3 became incorporated. The following services were analyzed:
• Business licenses (within Planning and Sustainability) • Code compliance (within Beautification) • Planning and zoning (within Planning and Sustainability) • Development (within Planning and Sustainability) • Parks and recreation (Recreation, Parks, and Cultural Affairs) • Police (Police) • Right-of-way maintenance (Keep DeKalb Beautiful within Beautification) • Roads (Roads and Drainage and Transportation within Public Works) • Traffic court (within State Court)
Beautification – Keep DeKalb Beautiful The Keep DeKalb Beautiful Division did not generate any revenues in FY 2018, so none would be lost if Study Area 3 incorporated.
Table 3.58 shows the total expenditures for the division as well as the percentage of center-lane miles in Study Area 3, which is used to determine the area’s estimated expenditures. These represent cost savings to the county if Study Area 3 were to incorporate. The KDB program is not expected to be impacted by incorporation. The net impact on the county for the Keep DeKalb Beautiful Division is a savings of $1,173,410.

123
Table 3.58. Study Area 3 Keep DeKalb Beautiful Expenditures
Division Total
KDB
Litter Removal
Mowing ROW
Tree Trimming
Total Expenditure $5,911,210 $247,489 $2,563,808 $2,804,803 $295,110 Study Area 3 Percent of Lane Miles N/A 20.72% 20.72% 20.72%
Study Area 3 Expenditures1 $0 $531,170 $581,099 $61,141
Keep DeKalb Beautiful Expenditures $1,173,410 Notes: Study Area 3 does not exactly match total expenditure multiplied by percent lane miles due to rounding of lane miles for this table. KDB = Keep DeKalb Beautiful Program; ROW = right-of-way+ Assuming an equal distribution of work across the study areas, service levels in the remaining unincorporated area should not be affected if Study Area 3 were to incorporate. Likewise, these cost savings would not affect the property tax rate because the KDB Division is not funded through property taxes.
Beautification – Code Compliance Code compliance revenues are reflected in code enforcement fines issued by the Magistrate Court as well as deposits into the Foreclosure and Vacant Property Registry Fund (Fund 205). Magistrate Court revenues were assigned to the study areas proportionally to expenditures. Slightly over 11% of expenditures (11.56%) were dedicated to Study Area 3 (see Chapter 2 for discussion of workload and cost distribution) so 11.56% of Magistrate Court revenues were as well. For Fund 205, property owners pay a fee to the county when they register their vacant property. Therefore, revenues for the Foreclosure and Vacant Property Registry Fund were distributed based on the percentage of vacant properties in each study area, which for Study Area 3 equaled 11.8%. Table 3.59 shows that if Study Area 3 were to incorporate, an estimated $111,295 would no longer be available to the county to perform code compliance services.
Table 3.59. Study Area 3 Code Compliance Revenue
Revenue Division Total Study Area 3 Magistrate Court $924,944 $106,905 Foreclosure Registry Fund $37,200 $4,390 Code Compliance Revenue $962,144 $111,295
Note: Study Area 3 revenue does not exactly match 11.56% due to rounding. As discussed in Chapter 2, the Code Compliance Division categorizes employees into two main service units: those who service particular zoned areas and a special unit that serves motels and multifamily housing. The estimated expenditures for the division’s zoned work totaled $2,927,424 in FY 2018 and the special unit’s expenditures were $1,097,784, for division-wide

124
total expenditures of $4,025,208. Additionally, in Chapter 2, Study Area 3 was calculated as having 2.25 positions122 out of 32 (including supervisors) working in zoned areas and 2.84 out of 12 employees working as part of the special unit (see Tables 2.4 and 2.5). Costs for Study Area 3 were determined based on the average cost per direct service employee.123 Table 3.60 shows the estimated savings if Study Area 3 were incorporated.
Table 3.60. Study Area 3 Code Compliance Operating Expenditure
Service Zones Special Unit Number of Employees – Study Area 3 2.25 2.84 Average Per Employee Cost $91,482 $91,482 Study Area 3 Expenditure $205,834 $259,626 Code Compliance Expenditure $465,460
In FY 2018, the Foreclosure and Vacant Property Registry Fund (Fund 205) only spent $11,897 to manage vacant properties. The distribution of expenditures by study area was the same as for revenues, the percentage of vacant properties in each area, which amounted to 11.8% for Study Area 3. This amount results in an additional expenditure savings of $1,404.
If DeKalb County no longer performed code compliance services in Study Area 3, the net savings would be $355,569, as shown in Table 3.61.
Table 3.61. Net Impact to the Code Compliance Division if Study Area 3 Incorporated
Estimated Amount Revenue Losses ($111,295) Expenditure Savings Fund 272 $465,460 Expenditure Savings Fund 205 $1,404 Code Compliance Net Impact $355,569
Because expenditures were assigned per employee and revenue was assigned proportionally to expenditures, the levels of spending in the remaining unincorporated area do not change if Study Area 3 becomes a city. The remaining division, however, would require an estimated five fewer direct service full-time employees (5.09). If the ratio between direct service employees and administrative employees were maintained — 44 direct service and 10 administrative (4.4:1) — the department would need approximately one fewer administrative staff person. As with Keep
122 Includes one-quarter (0.25) of a supervisory position. 123 For more information regarding how costs between the two divisions were determined, please see Chapter 2.

125
DeKalb Beautiful, property taxes do not support this service and thus are unaffected if the county no longer provided code compliance services within Study Area 3.
Planning and Sustainability – Business Licenses The Department of Planning and Sustainability provided business license data for this study. The research team geographically located businesses with the license amount paid. Table 3.62 presents FY 2018 totals for each type of revenue associated with business licenses applied for within Study Area 3. See Appendix A for details on how the research team distributed revenue across the study areas. If Study Area 3 were to incorporate, the county would lose an estimated $2,929,284 in revenue annually.
Table 3.62. Study Area 3 Business License Revenue
Revenue Division Total Study Area 3 Beverage Licenses $664,696 $194,058 Business Licenses – General $8,060,815 $2,758,330 Business Licenses – Adult Ent. $125,000 $36,494 Misc. Revenue $75 $26 Misc. Returned Check ($174,242) ($59,624) Business License Revenue $8,676,344 $2,929,284
The research team allocated expenditures proportionally to revenues. One-third (33.76%) of all business license revenues came from Study Area 3. Applying that same percentage to expenditures results in an expenditure savings of $255,084 from fewer staff, lower operating costs, and the county’s indirect cost allocation.124 Based on this unit’s current five positions, a reduction in expenditures of one-third equals approximately 1.7 FTEs.
Table 3.63 shows the estimated net impact on business licenses if Study Area 3 incorporates. The county would lose $2,674,200 from no longer receiving business license revenue. The county has historically used this money to support other services in the unincorporated areas, such as code compliance and right-of way maintenance (Keep DeKalb Beautiful).
Table 3.63. Net Impact to Business License Revenues if Study Area 3 Incorporates
Estimated Amount Revenue Losses ($2,929,284) Expenditure Savings $255,084 Business License Net Impact ($2,674,200)
124 $755,541 × .337617 = $255,083

126
Planning and Sustainability – Current Planning The Current Planning Unit collected $90,486 in FY 2018 (see Table 3.64). Of this, $52,276 came from zoning fees, $37,845 from variance permits, and $365 from miscellaneous revenues. Using the workload data discussed in Chapter 2 (see Table 2.7), 26 of the 91 zoning applications (28.6%) and 63 of the 95 (66.3%) variance and administrative appeals that year were from Study Area 3. Therefore, the associated revenues for these services are distributed based on those percentages. Miscellaneous revenue is the average percentage of the other two revenues (47.4%).
Table 3.64. Study Area 3 Current Planning Revenue
Revenue Source Division Total Study Area 3 Zoning Fees $52,276 $14,936 Variance Permits $37,845 $25,097 Miscellaneous $365 $173 Current Planning Revenue $90,486 $40,206
Because of the differences in time required for the Current Planning Unit to perform its various planning and zoning activities, the deputy director of planning advised distributing expenditures to the study areas based on the percentage of revenue collected from each.125 Table 3.65 shows that 28.6% of zoning fees came from Study Area 3; thus, that area was allocated 28.6% of zoning costs. Likewise, 66.3% of variance permit revenue was collected from Study Area 3, so the research team allocated that same percentage of expenditures to the study area. There were no historic preservation expenditures for Study Area 3.
Table 3.65. Study Area 3 Current Planning Expenditures
Service Area
Division Total Expenditure
Study Area 3 Percent Allocation
Study Area 3 Expenditures
Historic Preservation $142,775 0.0% 0 Zoning $798,937 28.6% $228,256 Variance Permits $578,540 66.3% $383,688 Current Planning Expenditure $1,520,252 $611,944
The Current Planning Division is not self-funded and relies on other unincorporated revenues to fund its services, such as nondesignated revenue and business licenses. Thus, although there
125 The research team allocated unit-wide costs between zoning and variance according to the revenues each service generated. Zoning generated 58% of total revenues and was assigned 58% of the costs after first removing costs for historic preservation. Variance permits generated 42% of the revenue and was assigned 42% of expenditures after removing costs for historic preservation.

127
are savings to the county for no longer providing this service to Study Area 3, it has no impact on property taxes. The estimated net savings for FY 2018 if Study Area 3 had incorporated would have been $571,738 (Table 3.66). Using a cost per employee of $152,025 discussed in Chapter 2, this savings translates to 3.76 fewer FTEs for the Current Planning Unit. Because of the diverse work the unit performs, it is unclear how having fewer employees would impact the unit’s overall performance and ability to serve the remaining unincorporated area.
Table 3.66. Net Impact on the Current Planning Division if Study Area 3 Incorporates
Estimated Amount Revenue Losses ($40,206) Expenditure Savings Fund 272 $611,944 Current Planning Net Impact $571,738
Planning and Sustainability – Development As discussed in Chapter 2, revenues and expenditures for the Development Unit are managed through a separate fund, Fund 201. The Department of Planning and Sustainability provided revenue and location data for its FY 2018 building permits and inspections, which were used to allocate revenues.126 See Appendix A for how each revenue was calculated. Table 3.67 shows that the county would lose an estimated $1,551,381 if it were no longer performing development services in Study Area 3.
126 A caveat for building inspection fee revenue should be noted. Rather than using the actual dollars collected for the study area as with the other inspection fees, the research team used the proportion of revenue collected because the data provided by the Department of Planning and Sustainability for these specific fees included customer payments for other agencies that could not be disaggregated. The payment for a single building inspection included what was owed to the Development Unit as well as to other DeKalb departments, such as for connecting property to the water and sewer system. The unit did not believe these additional payments distorted the percentages going to the study areas.
The research team was unable to geographically locate $507,411 in inspection fees because the addresses provided by the Department of Planning and Sustainability did not match any parcel number provided by the Tax Assessor’s Office. By joining address information with the parcel identifications in GIS, the research team was able to locate parcels and segregate them into study areas. These discrepancies likely occurred because new buildings had yet not been assigned a parcel number. Over 95% of the unlocatable fees ($482,530) were for inspections of new buildings. The team believes Study Area 3 revenue estimates are still accurate because the analysis used the proportion of structural permit revenue rather than actual dollars. The team assumed that these unlocatable buildings are distributed across the unincorporated area similarly to the permit data researchers could locate.

128
Table 3.67. Study Area 3 Development Revenue
Revenue Division Total Study Area 3 Sign Permits $25,809 $7,242 Certificate of Occupancy $270,703 $51,894 Variance Permits $5,031 $964 Subdivision Fees $41,901 $8,032 Registration Fees – Plumbing1 $3,672 $751 Develop Permits $378,814 $72,619 Inspection Fee – Building $4,418,603 $819,209 Inspection Fee – Plumbing $514,021 $105,169 Inspection Fee – Electrical $1,140,178 $255,286 Inspection Fee – HVAC $630,406 $150,667 Sale of Printed Material $6,995 $1,341 NPDES Fees $8,162 $1,565 Technology Fees $399,803 $76,642 Development Revenue $7,844,098 $1,551,381
1. There were no revenues for HVAC and electrical registration fees in FY 2018. The director of the Development Unit recommended allocating expenditures across the study areas based upon the revenue distribution. The revenues associated with Study Area 3 equal 19.8% of all revenues collected for the Development Fund (Fund 201) in FY 2018. Using this percentage, Study Area 3’s estimated operating expenditures were $1,243,625.
Table 3.68 shows the estimated net impact on the Development Unit if Study Area 3 were to incorporate. The county would experience a net loss of $307,756 from no longer providing development services. Because this revenue is only used for development, no other services would be impacted. Likewise, no property taxes support this service and thus would not be affected. Using the cost-per-employee metric discussed in Chapter 2 of $178,275, the estimated reduction in expenditures ($1,243,625) translates to seven fewer FTEs for the unit. Additionally, the net loss of $307,756 equals 1.7 FTEs. The loss of the employees beyond the reduced workload implies lower service levels for the remaining service area if Study Area 3 were to incorporate.
Note that in FY 2018, the Development Fund (Fund 201) earned $1,556,816 more than it spent. This excess revenue is typical during times of heavier development. Conversely, the unit would incur a net loss when there is less construction to pay staff and operating needs.

129
Table 3.68. Net Impact on the Development Unit if Study Area 3 Incorporates
Estimated Amount Revenue Losses ($1,551,381) Expenditure Savings $1,243,625 Development Net Impact ($307,756)
Police This section examines the effects on the rest of the DCPD service area if Study Area 3 were to incorporate and operate its own police department. Based on the analysis of service call and incident data and the assumptions outlined in Chapter 2 (see Tables 2.11–2.18), Table 3.69 shows the estimated percentages of current DCPD resources that Study Area 3 utilizes.
Table 3.69. Estimated Percentage of DCPD Resources Study Area 3 Utilizes
Uniform Services SWAT K-9 Aerial Criminal Investigations, Crime
Scene, Intelligence 12.99% 1.82% 2.92% 2.14% 9.00%
Table 3.70 presents expenditure estimates for the cost of providing police services in Study Area 3. These estimates were generated by applying the percentages in Table 3.68 to both the direct and indirect expenditures (according to the assumptions discussed above and in Chapter 2).
Table 3.70. Study Area 3 Police Service Expenditure Estimates
Type of Expenditure Amount Criminal Investigations, Crime Scene, Intelligence $1,725,002 Uniform Division $9,927,370 Special Operation Units
SWAT $49,798 K-9 $43,635 Aerial $46,523
Grand Total $11,792,327 Table 3.71 compares Study Area 3 with the total unincorporated area with regard to fiscal capacity factors such as cost of police services per capita and per $100,000 in fair market value of the property in the area.

130
Table 3.71. Study Area 3 Police Services Fiscal Factors
Service Area Total Cost
Percent of Total Service
Area Expenditures
Population 2010
Cost Per Capita
Fair Market Value
Cost per $100,000 in FMV
Study Area 3 $11,792,327 11.56% 93,136 $126.61 $13,330,786,889 $88.46 Unincorporated Only $80,670,766 79.11% 396,437 $203.49 $30,717,763,683 $262.62
Note: FMV = fair market value Staffing. Assuming that Study Area 3’s expenditures would be used to support officers at a cost similar to that which DeKalb County currently incurs, the research team was able to estimate the number of officers that Study Area 3 would need. Table 3.72 presents the number of officers needed in Study Area 3 and in the unincorporated area per 1,000 residents.
Table 3.72. Officers Needed
Service Area Officers Needed Officers Per 1,000 Pop. Study Area 3 82.86 0.89 Unincorporated Only 566.82 1.43
Vehicles. Were a city comprising Study Area 3 to equip its police officers and staff with vehicles using the same ratio of vehicles to officers as is currently the case in the DCPD, then approximately 80 vehicles would be needed.
Expenditure Savings and Net Impact
Table 3.73 summarizes the findings presented in the revenues section of Chapter 2 and Appendix A regarding the loss of revenue for DeKalb County (Fund 274).
Table 3.73. FY 2018 Revenue Impact Had Study Area 3 Incorporated
Revenue Category Amount Percent Taxes $23,377,284 79.88% Insurance Premium $5,688,547 19.44% Licenses and Permits $89,094 0.30% Charges for Services $76,053 0.26% Fines and Forfeitures $0 0.00% Investment Income $21,997 0.08% Transfers from Other Funds $0 0.00% Miscellaneous $13,369 0.05% Total $29,266,344 100.00%

131
Table 3.73 shows that the vast majority of the loss in revenue would have come from property taxes and insurance premiums.
Table 3.74 summarizes the revenue losses, expenditures savings, and the net impact to DeKalb County from Study Area 3 providing its own police services. Expenditure savings include funds spent on uniform services, criminal investigations, special operations, and all the support services needed to provide these direct law enforcement actions.
Table 3.74. Net Impact of Study Area 3 No Longer Receiving Services from the DCPD
Revenue Loss ($29,266,344) Expenditure Savings $11,792,327 Net Impact ($17,474,017)
Potential Response Options
DeKalb County could address the impact of a net loss of this much revenue in three primary ways. First, the county could reduce the level of service in the remaining DCPD service area. Second, DeKalb could raise taxes and fees in the remaining DCPD service area in order to provide the same level of service that residents currently receive. Third, the county could use a combination of some increase in taxes and fees with some level of reduction in service. The next sections discuss the implications if the county were to choose either Option 1 or 2. The implications of the county choosing the third option would range somewhere between those of Options 1 and 2.
Option 1. Reduce the Level of Service
The level of service could be reduced in a variety of ways: The DCPD could cut back on training; it could eliminate certain special units; it could cut down on patrol routes; it could increase response times; or it could enact any combination of these cost reduction strategies. To illustrate the impact of a reduction in service, the research team used two fairly straightforward metrics—number of officers and officers per 1,000 residents—because they can be easily calculated from figures on available revenue. Attempting to translate revenue loss into something like an increase in police response time would be problematic because the calculation would depend on numerous factors other than revenues.
Tables 3.75 and 3.76 show how removing Study Area 3 from the DCPD service area would affect DCPD’s capacity to deliver services in the remaining unincorporated area. Table 3.75 shows how the remaining revenue to support police services translates into a deficit in the number of officers that can be funded with that revenue.

132
Table 3.75. Office Deficit in Remaining DCPD Service Area if Study Area 3 Incorporates
Event
Officers Needed in Remaining DCPD
Service Area Net Officers Deficit Incorporation of Study Area 3 633.6 -122.78
Table 3.76 shows how the ratio of officers to population would change if Study Area 3 were removed from the DCPD service area. The deficit in officers per 1,000 residents indicates the net impact in service delivery capacity after Study Area 3 is removed. This figure is the difference between the number of officers per capita needed to police the remaining area and the officers per capita that the remaining service area can afford at current levels of taxes and fees.
Table 3.76. Change in Officers per 1,000 Population in Remaining Service Area if Study Area 3 Incorporates
Officers to Population Ratio – Keeping
Service Level Constant
Officers to Population Ratio – After Revenue
Reduction Change in Officers to
Population Ratio Incorporation of Study Area 3 1.64 1.32 –0.32
Option 2. Raise Taxes
If DeKalb County chose to maintain the current level of police services in the remaining DCPD service area, additional revenue would need to be raised through increases in either taxes or fees or both. Some revenue amounts like insurance premiums are essentially set, and some fees, such as charges for fingerprinting and background checks, are relatively minor sources of revenue for the county and therefore cannot practically be increased through rate hikes. Thus, property taxes are the only feasible revenue source for raising the kind of revenue needed to fill the revenue gap created by the DCPD no longer providing police services in Tucker.
Although a number of property taxes (e.g., real, personal, motor vehicle, intangible, utility, recording, etc.) could potentially be raised to fill the fiscal gap, the Raise Taxes Option is illustrated solely through the real property tax. This is done in part because of the lack of accurate information on personal property, motor vehicle property (subject to the old ad valorem tax), and utility property in the areas of the county that do not currently form tax jurisdictions, i.e., Vista Grove and the area above Hwy. 78. Consequently, the estimate of the millage rate increase will be higher than the actual millage rate increase that a real property owner would likely experience. An analysis of the property taxes raised for Fund 274 suggests that real property taxes represent approximately 87.4% of all property taxes that the county has

133
the ability to adjust.127 To illustrate impact, the research team assumed that all of the revenue gap that needs to be covered through increases in taxes and fees is borne by an increase in the real property tax.
The research team’s aim was to estimate how much the real property millage rate would need to increase to fill the gap in revenues required to provide the same level of service as the DCPD currently offers in the service area. The researchers began by identifying the area of analysis as the area where DCPD provides full services. This primary service area includes all of the unincorporated area as well as the cities of Tucker and Stonecrest. The other cities serviced by the DCPD receive only nonbasic or minimal basic services, with total expenditures of less than $500,000. The area of analysis is thus limited by the assumption that these smaller cities will continue to pay for the services they receive. Consequently, total DCPD expenditures are adjusted to include only expenditures on services delivered in the primary service area.
The research team next identified the total amount of taxable assessed value128 of the real property in the various portions of the primary service area, i.e., unincorporated DeKalb and the cities of Tucker and Stonecrest.129 From the sum of these assessed values, the researchers subtracted the assessed value of real property in Study Area 3 to arrive at the assessed value in the DCPD’s primary service area remaining if Study Area 3 was no longer receiving DCPD services.
Finally, based on the assessed value of real property in the remaining service area, the research team calculated a millage rate applied to this value that would generate the revenue needed to fill the gap. Table 3.77 shows these calculations.
3.77. Table Millage Rate Impact Possible If Study Area 3 Were Removed from the DCPD Service Area
Assessed Value in DCPD Primary Service Area Remaining After Study Area 3 Removed
$9,827,469,892
Net Revenue Loss ($17,474,017) Millage Rate Increase Needed to Fill Gap 1.78
127 The new Title Ad Valorem Tax is set by the state with the revenues shared with local government. This TAVT revenue accounts for the vast majority of motor vehicle taxes collected by DeKalb County. 128 “Assessed value” in DeKalb County represents 40% of the fair market value set by tax assessors. 129 Data on assessed values for the study areas (e.g., Tucker, Stonecrest, and the unincorporated area) were provided by the DeKalb County Tax Commissioner’s Office. Data for the cities of Tucker and Stonecrest were extracted from the Consolidated Tax Digest, State Department of Revenue. The gross Consolidated Digest values were adjusted to exclude utility taxes, motor vehicle, heavy equipment, and personal property taxes.

134
Capital
This analysis focuses on operational capability and the revenues needed to support this capability. Because Fund 274 makes annual appropriations for normal capital expenditures, the analysis includes these ordinary and ongoing capital costs. However, sometimes Fund 274 transfers funds to a separate capital fund, and expenditures are made from this fund to support DCPD operations. In the last five years, this occurred only once, as part of a capital project to purchase body cameras. Because the Institute research team does not know whether this capital expenditure will become an ordinary and ongoing cost, the analysis includes only the capital costs that have already been incorporated into the Fund 274 operational budget. However, if this new capital expenditure does become ongoing, DeKalb County would incur approximately $120,000 in additional annual expenditures.
Public Works – Roads and Drainage and Transportation Because the work of the Roads and Drainage and Transportation Divisions (Roads Services) is interconnected and the expenditures for both divisions are allocated across the study areas similarly, via center-lane miles, they are treated as a single entity in the analysis.
As Table 3.78 shows, a total of $5,110,550 in revenues is assigned to Study Area 3 for Roads Services. See the Revenue Section in Chapter 2 and Appendix A for more information about property taxes and other revenues assigned to Roads Services.

135
Table 3.78. Study Area 3 Roads and Drainage and Transportation Revenue
Revenue Department Total Study Area 3 Real Property Taxes $9,739,838 $3,535,357 Property Taxes Prior Year $367,352 $123,577 Personal Property Taxes $723,506 $245,051 Public Utilities Taxes $308,648 $45,433 Mobile Homes Taxes $422 $422 Motor Vehicle Taxes $299,257 $64,835 Intangible Recording Tax $170,552 $57,374 Energy Excise Tax $1,845 $349 HOST $912,352 $0 Parking Lot Assessments $20,862 $3,517 Retention Pond Fees $3,283 $554 Stormwater Utility Transfer $952,220 $157,973 Sale of Printed Material $25 $5 Residential Parking Permits $2,070 $0 Speed Humps – Fund 212 $312,106 $85,438 Street Light Assessments – Fund 211 $4,664,031 $786,324 Investment Income $14,662 $4,341 Roads Services Revenue $18,493,031 $5,110,550
The division directors agreed that the best method to distribute expenditures across the study areas was through the percentage of center-lane miles in the service area. For Study Area 3, that amount equaled 16.86%. (See Chapter 2 for more information.) The research team used this percentage to distribute expenditures from the Designated Services Fund (Fund 271), with two exceptions: expenditures for survey design and construction and for land acquisition. According to the Transportation Division director, all the expenditures related to these cost centers were within the unincorporated area in FY 2018. Therefore, instead of Study Area 3 representing 16.86% of total center-lane miles (and expenditures), it represented 20.72% of center-lane miles.130 The research team was able to allocate expenditures for Street Lights (Fund 211) and Speed Humps (Fund 212) geographically rather than using center-lane miles due to information from the County Tax Commissioner. (See Chapter 2 for details.)
130 Study Area 3 center-lane miles = 253.01 and total unincorporated center-lane miles = 1,221.23. 253.01 / 1,221.23 = 20.72%; See Tables 1.4 and 1.5.

136
Table 3.78. Study Area 3 Roads and Drainage and Transportation Operating Expenditures
Revenue Division Total Study Area 3 Roads and Drainage – Fund 271 $17,479,520 $2,947,271 Transportation – Fund 271 $2,755,870 $493,599 Speed Humps – Fund 212 $192,526 $52,703 Street Lights – Fund 211 $5,311,105 $895,416 Roads Services Expenditures $25,739,021 $4,388,989
To provide greater detail, Tables 3.79 and 3.80 present each division’s FY 2018 operating expenditure information by cost center.
Table 3.79. Study Area 3 Roads and Drainage Expenditure Detail, Fund 271
Expenditure Category Estimated Amount Administration $104,967 Maintenance $294,487 Road Maintenance $1,416,033 Support Services $251,764 Drainage Maintenance $100 Stormwater $0 Traffic Operations $149,236 Speed Humps $17,917 Signals $361,492 Signs and Paint $159,356 County Cost Allocation $191,919 Total Study Area 3 Expenditures $2,947,271

137
Table 3.80. Study Area 3 Transportation Expenditure Detail, Fund 271
Expenditure Category Estimated Amount Administration $179 Transportation Administration $63,572 Engineering Operations $6,300 Design/Survey Construction $112,008 Roads & Drainage $9 Project Management $23,967 Land Acquisition $43,514 Support Services $202 Traffic Planning/Engineering $152,648 Traffic Calming $2,458 Traffic Lights $48 Signals $1,732 Signs and Paint $2,357 County Cost Allocation $84,605 Total Study Area 3 Expenditures $493,599
In addition to operating expenditures, the Roads and Drainage and Transportation Divisions spent on average $1,611,390 annually from Fund 271 for capital maintenance and improvements between FYs 2014 and 2018 (see Table 2.37).131 By allocating capital spending per center-lane mile, including Stonecrest and Tucker, the amount assigned to Study Area 3 is $271,701.
Table 3.81 summarizes the estimated revenue losses and operating and capital expenditure savings if DeKalb County no longer provided road services to Study Area 3. When all revenues and expenditures area summed, the impact is a net revenue loss of $449,860. When just the revenues and expenditures for associated with the Designated Services Fund (Fund 271) are considered, the net revenue loss increases by approximately $75,000 to $526,217.132
Table 3.81. Net Impact to the Roads and Drainage and Transportation if Study Area 3 Incorporates Drainage
Estimated Amount Revenue Losses (Funds 271, 211, 212) ($5,110,550) Operating Expenditure Savings (Funds 271, 211, 212) $4,388,989 Capital Expenditure Savings $271,701 Roads and Drainage and Transportation Impact ($449,860)
131 This amount is in addition to capital spending from Georgia Department of Transportation grants, HOST projects, etc. 132 Fund 271: -$4,238,788 + ($2,947,271 + $493,599 + 271,701) = –$526,217

138
The net reduction of $526,217 in Fund 271 if Study Area 3 incorporated would necessitate either a reduction in the level service or a slight increase in the property tax rate. However, as Table 3.82 shows, the change in property tax would be very slight, just 0.05 mills.
Table 3.82. Estimated Change in Road Services Millage Rate from Study Area 3 Incorporating
Computation Results
Current Assessed Value Real Property $14,885,216,190 Study Area 3 Assessed Value $5,057,746,298 New Assessed Value1 $9,827,469,892 Study Area 3 Net Revenue Loss $526,217 Net Revenue Loss as Millage Rate 0.05 mills
1. For simplicity, this scenario only uses the assessed value for real property and does not consider HOST, exemptions, or personal and utility property.
Another way to consider the impact of Study Area 3 incorporating would be if the net loss of $526,217 were completely absorbed by the Roads and Drainage Division. One example of service impact would be to focus on road maintenance. According to the division’s director, the county spent $8,109 to fully maintain one center-lane mile of road in FY 2019. Based on the division maintaining 1,500.56 center-lane miles,133 at $8,109 per mile that equals a total of $12,168,041. With a reduction of $526,217, the new budget would be $11,641,824 and $7,758 spending per mile. In practice, the department cannot actually reduce the amount spent on maintaining a mile of road; rather, the Roads and Drainage Division would likely have to increase the time needed to address potholes, striping, patching, and sidewalk repairs, as well as delay road resurfacing projects, all else being equal.
Recreation, Parks, and Cultural Affairs The Department of Recreation, Parks, and Cultural Affairs tracks revenues by cost center, enabling an accurate distribution of revenues across the study areas. Table 3.83 shows that revenues for Study Area 3 totaled $6,650,372 in FY 2018. For additional information regarding how revenues were distributed across the service areas, particularly for taxes deposited into the Designated Services Fund (Fund 271), see Appendix A.
133 Again, the department counts its center-lane miles as being 1,774.22. For consistency, the research team used total center-lane miles of 1,500.56. Because of the difference between the number of center-lane miles the department counts and that used in this analysis, the reader should not use the 1,500.56 figure to calculate the division’s actual FY 2018 spending on road maintenance.

139
Table 3.83. Study Area 3 Recreation, Parks, and Cultural Affairs Revenue
Revenue Department Total Study Area 3 Real Property Taxes $13,394,5091 $5,423,986 Property Taxes – Prior Year $563,597 $219,183 Personal Property Taxes $924,8301 $380,753 Public Utility Taxes $473,532 $69,704 Mobile Home Taxes $647 $647 Motor Vehicle Taxes $429,1431 $100,820 Intangible Recording Tax $261,663 $101,761 Energy Excise Tax $2,830 $535 HOST $1,399,742 $0 Department Programs $360,624 $21,082 Recreation Programs – Fund 207 $902,410 $73,336 Nonresident Dept. Program $18,062 $3,105 Concessions $28,306 $0 Swimming Pool $367,465 16,825 Golf Course Fees $20,048 $0 Tennis Center Fees $43,245 42,990 Tennis Center Rental $31,050 31,050 Rental – Other/Pavilions $48,682 $9,736 Fees – Porter Sanford $62,652 $0 Other Miscellaneous $6,791 $1,167 Returned Check ($2,316) ($398) Rental Car Tax Fund $522,178 $146,476 Investment Income $20,999 $7,614 Recreation, Parks, and Cultural Affairs Revenue $19,880,689 $6,650,372
1. Reflects reductions in revenue of $1,763,630 transferred to the City of Tucker as reimbursement for excess property taxes paid by residents when Tucker began providing parks and recreation services in the spring of 2018. Reductions to real, personal, and motor vehicle taxes were made proportionally based on Tucker’s portion of the total assessed value of property for these property tax categories.
In Chapter 2, the operating expenditures for the Department of Recreation, Parks and Cultural Affairs were disaggregated between the parks and recreation divisions (Tables 2.27 and 2.28). Each cost center has its own methodology for allocating costs across the study areas (see Appendix D for detail). For the Parks Division, expenditures were allocated based on the location of a park and its acreage. For the Recreation Division, expenditures were allocated based on the percentage of recreation participation in a study area (see Table 2.33). With these calculations, the research team was able to estimate the operating expenditures for Study Area 3. The total estimated spending for Study Area 3 was $2,301,906 in FY 2018, equaling 12.0% of all departmental spending. The spending between parks and recreation was nearly equal with 49.3% dedicated to the former and 50.7% on the latter (see Table 3.84).
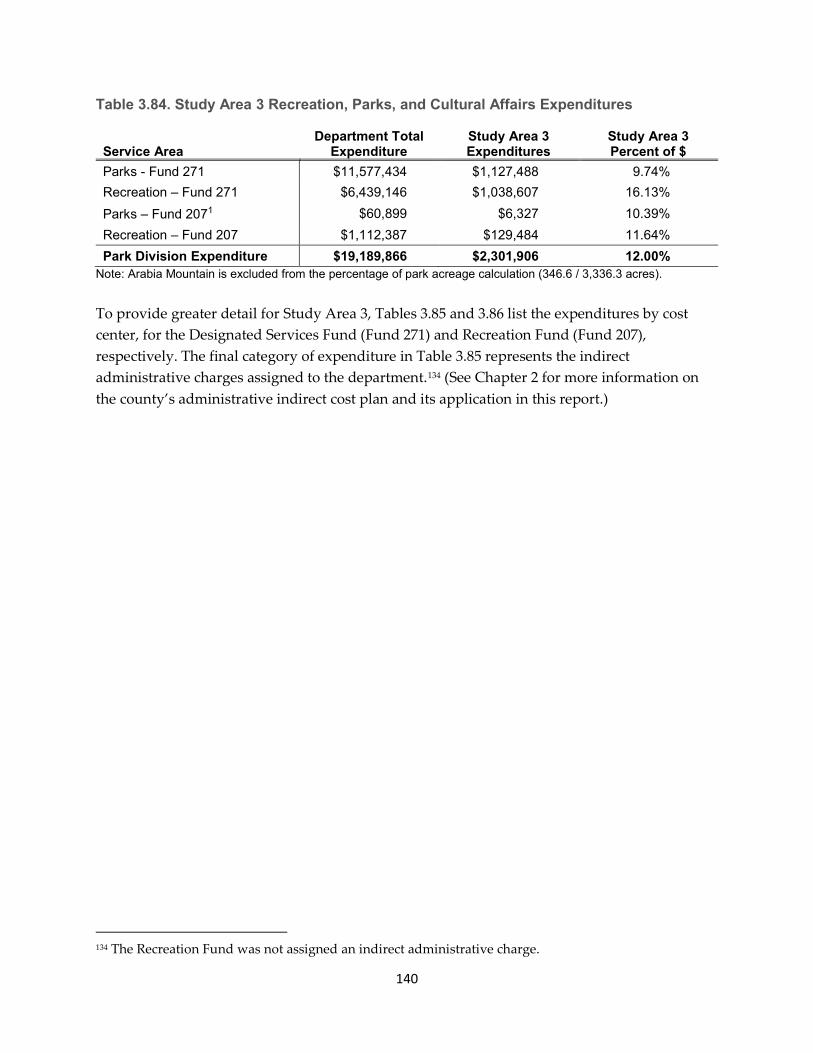
140
Table 3.84. Study Area 3 Recreation, Parks, and Cultural Affairs Expenditures
Service Area
Department Total Expenditure
Study Area 3 Expenditures
Study Area 3 Percent of $
Parks - Fund 271 $11,577,434 $1,127,488 9.74% Recreation – Fund 271 $6,439,146 $1,038,607 16.13% Parks – Fund 2071 $60,899 $6,327 10.39% Recreation – Fund 207 $1,112,387 $129,484 11.64% Park Division Expenditure $19,189,866 $2,301,906 12.00%
Note: Arabia Mountain is excluded from the percentage of park acreage calculation (346.6 / 3,336.3 acres). To provide greater detail for Study Area 3, Tables 3.85 and 3.86 list the expenditures by cost center, for the Designated Services Fund (Fund 271) and Recreation Fund (Fund 207), respectively. The final category of expenditure in Table 3.85 represents the indirect administrative charges assigned to the department.134 (See Chapter 2 for more information on the county’s administrative indirect cost plan and its application in this report.)
134 The Recreation Fund was not assigned an indirect administrative charge.

141
Table 3.85. Study Area 3 Parks and Recreation Expenditure Detail, Designated Services Fund (Fund 271)
Expenditure Category1 Estimated Amount Department Administration $256,565 Special Populations $1,897 Summer Programs $17,021 Recreation Division. Administration $89,585 Recreation Centers $610,660 Mason Mill Tennis Center2 $15,906 Planning and Development $50,990 Aquatics $22,792 Parks Division Administration $68,495 District 1 Service Center $748,940 District 2 Service Center $1,418 District 3 Service Center $4,257 Support Services $3,552 Horticulture & Forestry $1,623 Planning and Development $1,591 Natural Resource Management $8,361 Marketing and Promotion $25,089 Youth Athletics $34,851 County Cost Allocation $202,502 Total Study Area 3 Expenditures $2,166,095
1. Cost centers without expenditures are not included in the table. 2. Management for this facility is contracted out to a private management company.
Table 3.86. Study Area 3 Parks and Recreation Expenditure Detail, Recreation Fund (Fund 207)
Expenditure Category1 Estimated Amount Outdoor Recreation $6,327 Therapeutic Rec Program $8,980 Playground Day Camp $112,144 Youth Sports $8,360 Total Study Area 3 Expenditures $135,811
1. Cost centers without expenditures are not included in the table. In addition to operating expenditures, the department spent on average $653,200 annually for capital maintenance and improvements between FY 2014 and FY 2018, which translates to $5,226 per park each year. Study Area 3 has a total of 26 parks; thus, the amount of total capital spending assigned to Study Area 3 is $135,876.

142
Table 3.87 presents the net impact on the county if Study Area 3 incorporated and the county no longer provided parks and recreation services in that area. The table, which sums the revenue losses and savings from reduced operating and capital spending, shows that the county would experience an estimated net revenue loss of $4,212,590 annually. To adjust for this shortfall, the department would either need to reduce the level of spending on the remaining parks or increase the millage rate for the Designated Services property tax (or a combination of the two).
Table 3.87. Net Impact on the Department of Recreation, Parks, and Cultural Affairs if Study Area 3 Incorporates
Estimated Amount
Revenue Losses (Funds 271 + 207) ($6,650,372) Operating Expenditure Savings (Funds 271 + 207) $2,301,906 Capital Expenditure Savings $135,876 Recreation, Parks, and Cultural Affairs Net Impact ($4,212,590)
Because the department would experience a net revenue loss with incorporation, the research team calculated an adjusted operating expenditure based on the net revenue loss of $4,212,590. This figure already adjusts for the savings to the county associated with no longer maintaining 346.6 acres of parkland and serving 123,665 fewer recreation participants from Study Area 3. This adjusted operating expenditure equals $14,977,277135 to manage 5,695.4 acres and serve the remaining 595,920 recreation program participants in FY 2018, all else being equal.
Table 3.88 shows the impact of Study Area 3 incorporating on the Parks and Recreation Divisions separately. The $4.2 million in lost revenue is assigned proportionally to the two divisions’ total expenditures for FY 2018, i.e., 60.65% to the Parks Division and 39.35% to the Recreation Division. The park expenditures decrease from $11,638,333 to $9,083,398. Concomitantly, the spending per park acre for maintenance declines from $1,926 to $1,595, a 17.2% decrease. For recreation, the expenditures go from $7,551,533 to $5,893,879 and spending per recreation participant shrinks from $10.50 to $9.89.
135 In FY 2018, the department had an excess of revenues over operating expenditures of $690,823 for funds 272 and 207 combined, after adjusting for payment to the City of Tucker. This surplus figure does not take into account spending for capital.

143
Table 3.88. Estimated Change in Parks and Recreation Service Levels if Study Area 3 Incorporates
Parks Division Recreation Division FY 2018 Actual Expenditures $11,638,333 $7,551,533 Study Area 3 Impact ($2,554,935) ($1,657,654) Remaining Service Area Budget $9,083,398 $5,893,879 Remaining Park Acres / Recreation Participants 5,695.4 595,920 New Service Level $1,595 per acre $9.89 per participant
The research team used a straightforward calculation to estimate the impact of Study Area 3 incorporating on property taxes (assuming service levels remain unchanged). The calculation used only real property values for the service area in FY 2018.136 Table 3.89 shows that the county would need to increase the Designated Services millage rate for parks and recreation by approximately 0.51 mills to maintain the same service levels if Study Area 3 incorporated.
Table 3.89. Estimated Change in Parks and Recreation Millage Rate from Study Area 3 Incorporating
Computation Results
Current Assessed Value Real Property $13,248,201,314 Study Area 3 Assessed Value $5,057,746,298 New Assessed Value1 $8,190,455,016 Study Area 3 Revenue Loss $4,212,590 Net Revenue Loss as Millage Rate 0.51
1. For simplicity, this scenario only uses the assessed value for real property and does not consider HOST, exemptions, or personal and utility property.
State Court – Traffic Court The workload of DeKalb County’s traffic court is tied to the number of moving violations tickets the county police issue. Because the exact location of every ticket is unknown, workload (and therefore revenues and expenditures) are distributed by population. Study Area 3 represents 19.40% of the county’s population, and thus traffic court workload (see Table 2.34).137 Although the DCPD offers some services to the cities of Clarkston, Lithonia, and Pine Lake, they have their own police departments and municipal courts and are excluded from this analysis. However, the populations of Stonecrest and Tucker are included in the calculations of traffic
136 The total assessed value excludes property within the City of Tucker because the city was rebated the value of property taxes that property owners paid in FY 2018. 137 93,136 / 480,023 =19.40%
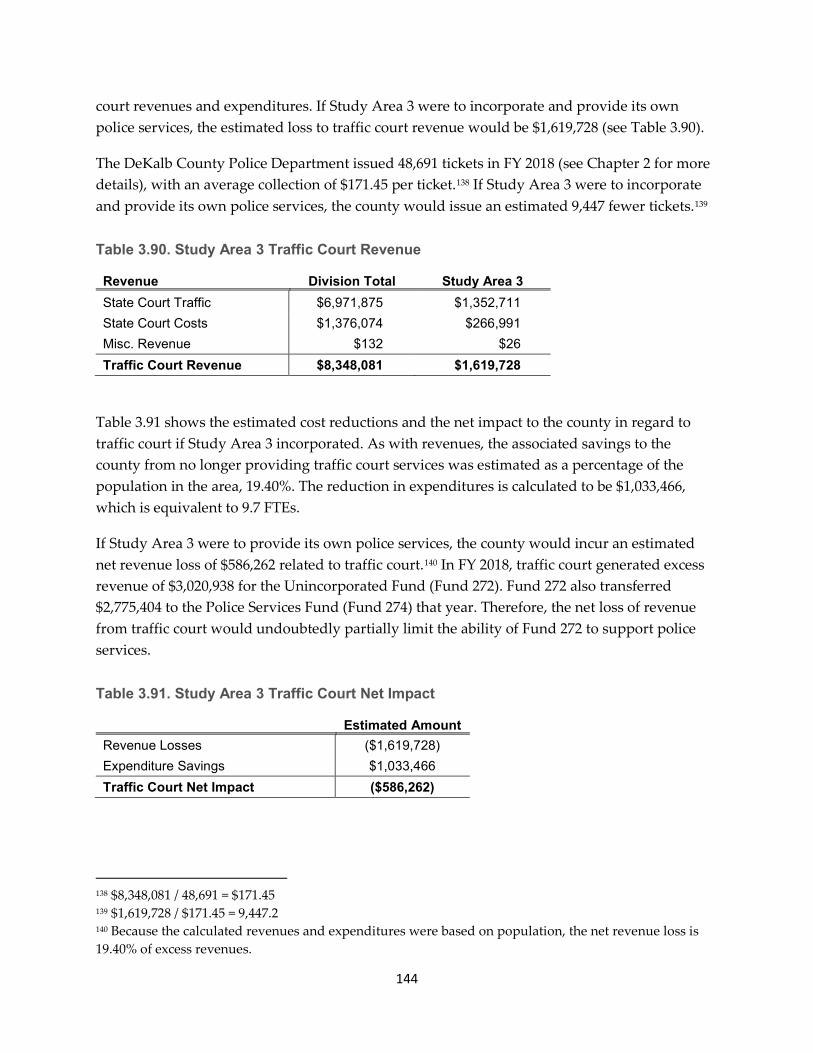
144
court revenues and expenditures. If Study Area 3 were to incorporate and provide its own police services, the estimated loss to traffic court revenue would be $1,619,728 (see Table 3.90).
The DeKalb County Police Department issued 48,691 tickets in FY 2018 (see Chapter 2 for more details), with an average collection of $171.45 per ticket.138 If Study Area 3 were to incorporate and provide its own police services, the county would issue an estimated 9,447 fewer tickets.139
Table 3.90. Study Area 3 Traffic Court Revenue
Revenue Division Total Study Area 3 State Court Traffic $6,971,875 $1,352,711 State Court Costs $1,376,074 $266,991 Misc. Revenue $132 $26 Traffic Court Revenue $8,348,081 $1,619,728
Table 3.91 shows the estimated cost reductions and the net impact to the county in regard to traffic court if Study Area 3 incorporated. As with revenues, the associated savings to the county from no longer providing traffic court services was estimated as a percentage of the population in the area, 19.40%. The reduction in expenditures is calculated to be $1,033,466, which is equivalent to 9.7 FTEs.
If Study Area 3 were to provide its own police services, the county would incur an estimated net revenue loss of $586,262 related to traffic court.140 In FY 2018, traffic court generated excess revenue of $3,020,938 for the Unincorporated Fund (Fund 272). Fund 272 also transferred $2,775,404 to the Police Services Fund (Fund 274) that year. Therefore, the net loss of revenue from traffic court would undoubtedly partially limit the ability of Fund 272 to support police services.
Table 3.91. Study Area 3 Traffic Court Net Impact
Estimated Amount Revenue Losses ($1,619,728) Expenditure Savings $1,033,466 Traffic Court Net Impact ($586,262)
138 $8,348,081 / 48,691 = $171.45 139 $1,619,728 / $171.45 = 9,447.2 140 Because the calculated revenues and expenditures were based on population, the net revenue loss is 19.40% of excess revenues.
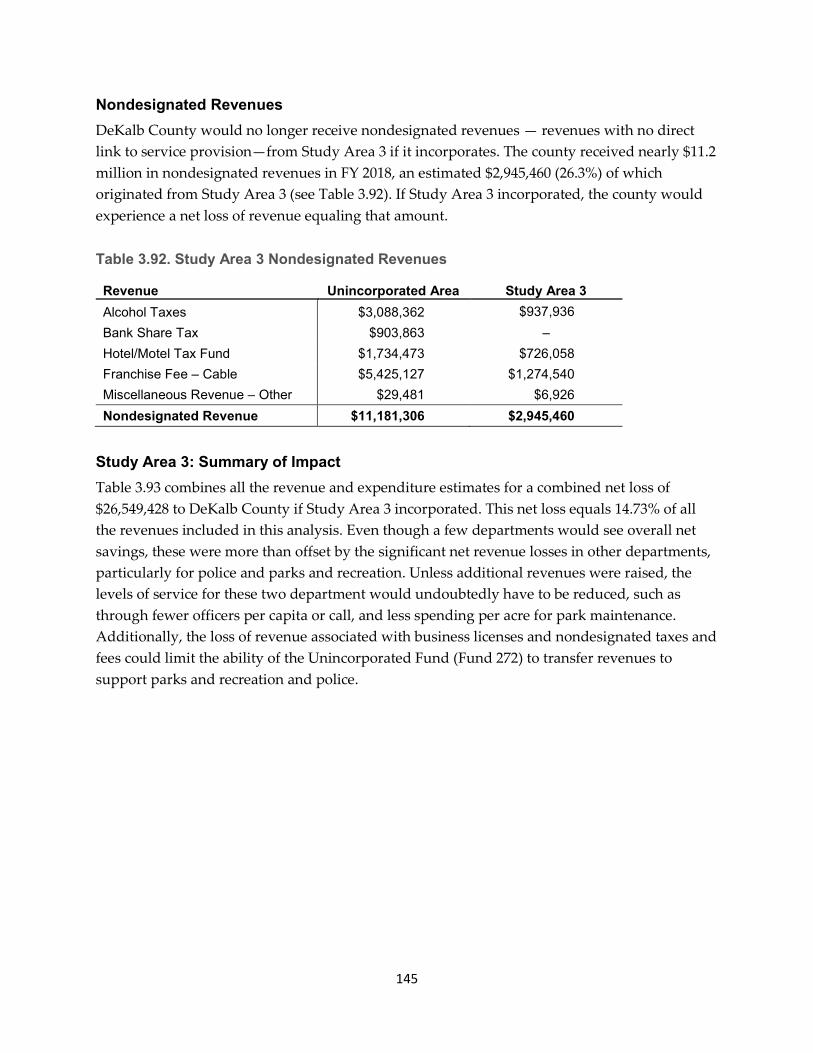
145
Nondesignated Revenues DeKalb County would no longer receive nondesignated revenues — revenues with no direct link to service provision—from Study Area 3 if it incorporates. The county received nearly $11.2 million in nondesignated revenues in FY 2018, an estimated $2,945,460 (26.3%) of which originated from Study Area 3 (see Table 3.92). If Study Area 3 incorporated, the county would experience a net loss of revenue equaling that amount.
Table 3.92. Study Area 3 Nondesignated Revenues
Revenue Unincorporated Area Study Area 3 Alcohol Taxes $3,088,362 $937,936 Bank Share Tax $903,863 – Hotel/Motel Tax Fund $1,734,473 $726,058 Franchise Fee – Cable $5,425,127 $1,274,540 Miscellaneous Revenue – Other $29,481 $6,926 Nondesignated Revenue $11,181,306 $2,945,460
Study Area 3: Summary of Impact Table 3.93 combines all the revenue and expenditure estimates for a combined net loss of $26,549,428 to DeKalb County if Study Area 3 incorporated. This net loss equals 14.73% of all the revenues included in this analysis. Even though a few departments would see overall net savings, these were more than offset by the significant net revenue losses in other departments, particularly for police and parks and recreation. Unless additional revenues were raised, the levels of service for these two department would undoubtedly have to be reduced, such as through fewer officers per capita or call, and less spending per acre for park maintenance. Additionally, the loss of revenue associated with business licenses and nondesignated taxes and fees could limit the ability of the Unincorporated Fund (Fund 272) to transfer revenues to support parks and recreation and police.

146
Table 3.93. Estimated Net Impact from Study Area 3 Impact
Service Revenues Expenditures Net Impact Keep DeKalb Beautiful 0 $1,173,410 $1,173,410 Code Compliance ($111,295) $466,864 $355,569 Business Licenses ($2,929,284) $255,084 ($2,674,200) Current Planning ($40,206) $611,944 $571,738 Development ($1,551,381) $1,243,625 ($307,756) Police ($29,266,344) $11,792,327 ($17,474,017) Roads and Drainage and Transportation ($5,110,550) $4,660,690 ($449,860)
Recreation, Parks, and Cultural Affairs ($6,650,372) $2,437,782 ($4,212,590) Traffic Court ($1,619,728) $1,033,466 ($586,262) Nondesignated Revenues ($2,945,460) 0 ($2,945,460) Total Study Area 3 ($50,224,620) $23,675,192 ($26,549,428)
IMPACT OF INCORPORATION ON DEKALB COUNTY’S GENERAL FUND Beyond the direct effect on the revenues and expenditures of the unincorporated areas of DeKalb County, the incorporation of the study areas would also impact the county’s General Fund. This section briefly considers the following areas most likely to be impacted by the incorporation of any of the study areas: transfers to the General Fund via the administrative indirect cost plan, demand for Magistrate Court services, repayment of county debt, and the county’s employee pension plan. No recommendations for specific actions the county should take are given, and the research team cannot estimate the full cost of the impact for every issue. For example, an actuarial evaluation would be required to accurately estimate the impact of incorporation on the county pension plan. Instead, this section is meant to raise awareness of the additional indirect impacts that incorporation would likely have on other aspects of DeKalb County’s government.
Administrative Indirect Cost Plan As discussed in Chapter 2, the county assesses charges on non-General Fund departments and funds for administrative services provided by staff paid from the countywide General Fund. This commonly applied type of indirect cost charge is appropriate to ensure that countywide taxes are not financially supporting services that could or should be paid through fees, grants, or special district taxes. In FY 2018, the county assessed a total of $15,795,472 in administrative charges to the departments and funds analyzed for this report (see Table 2.1). Because these charges are linked to specific services, such as facility maintenance or budget support, reductions in the size of the department either through the number staff, facilities, vehicles, or the like would reduce the revenue going to the General Fund. This reduction in the revenue transfer (i.e., charge) would require either that the administrative support departments supported by the General Fund reduce their own expenditures or that additional revenues for

147
the General Fund be raised as an offset. The increase in General Fund revenue could likely include countywide property taxes.
The General Fund departments that issue indirect charges are quite varied and comprehensive. All the unincorporated departments and divisions analyzed earlier in this chapter were assessed fees for the chief executive officer, Board of Commission clerk, Board of Commission districts, executive assistant, human resources, information systems, budget and management, and risk management. However, not all of these departments assess charges on all the unincorporated departments analyzed in this report. For example, the Tax Commissioner only assessed the Department of Recreation, Parks, and Cultural Affairs and the Department of Public Works–Transportation for services in FY 2018. Because not all General Fund departments assess charges to every unincorporated department or fund, they would be impacted differently if a study area incorporated. Table 3.94 shows how much the tax and special revenue funds (Funds 271,272, 274, 201) analyzed for this report paid to the various General Fund administrative departments in FY 2018.141
141 This table excludes the charges assessed to Funds 271, 272, 274, and 201 for insurance allocations, nonimmunity judgements, retirements paid, risk management administrative charges, and unemployment compensation. These are referred to as “additional allocation” in Chapter 2.

148
Table 3.94. Indirect Administrative Charge by Fund, FY 2018
General Fund Department1
Fund 271 Special Svcs.
Fund 272 Unincorporated
Fund 274 Police
Fund 201 Development
Building Use $45,661 $47,777 $611,841 $124,401 BOC Clerk $18,760 $8,197 $70,765 $4,282 BOC Districts $32,165 $14,055 $435,130 $7,342 Chief Executive Officer $75,089 $32,809 $283,213 $17,138 Law Department 0 $30,071 $14,710 $93,890 Executive Assistant $61,738 $26,976 $232,862 $14,090 Ethics Board $14,452 $6,315 $54,511 $3,298 GIS $63,140 0 $78,925 $78,926 Facilities Management $2,092,270 $90,384 $933,038 $20,388 Purchasing General $267,079 $45,517 $100,054 $183,382 Human Resources $185,744 $81,159 $700,586 $42,392 Information Systems $972,936 $558,511 $4,318,482 $556,066 Finance 0 $68,913 0 0 Accounting Services $168,472 $1,330 $126,952 $43,077 Records Management 0 0 0 0 Internal Audit $8,259 $179,056 $14,451 $68,264 Budget & Management $95,466 $20,417 $203,478 $59,956 Risk Management $22,542 $9,849 $85,022 $5,144 Property Assessment 0 0 $47,342 0 Tax Commissioner Collection $53,693 0 $154,261 0 District Attorney Admin. $5,930 0 0 0 Communications $29,499 $15,479 $133,624 $8,084 Planning and Development $46,266 $346,996 $23,133 0 Public Works Director 0 0 0 0 Fleet Overhead 0 0 0 0 Total $4,259,161 $1,583,811 $8,622,380 $1,330,120
1. Department titles and amounts taken from Dekalb County, Georgia Full Cost Presentation – Cost Allocation Plan Based on Actual Costs Incurred During FY 2016 For use during Budget Yea Fiscal Year 2018 by Cost Plans Plus, LLC.
Likewise, the incorporation of each study area would have a different estimated impact in terms of reductions to administrative charges going to the General Fund because each of the study areas receives different levels of services due to its population or level of need such as crime rate, acres of parks, development needs, and the like. Table 3.95 presents the estimated amount of administrative indirect charges associated with each study area. The assigned charges are based upon the various methodologies applied to determine workload in each study area. Additionally, this analysis assumes that Study Area 1 would continue obtaining police and roads services from the county even if incorporated.
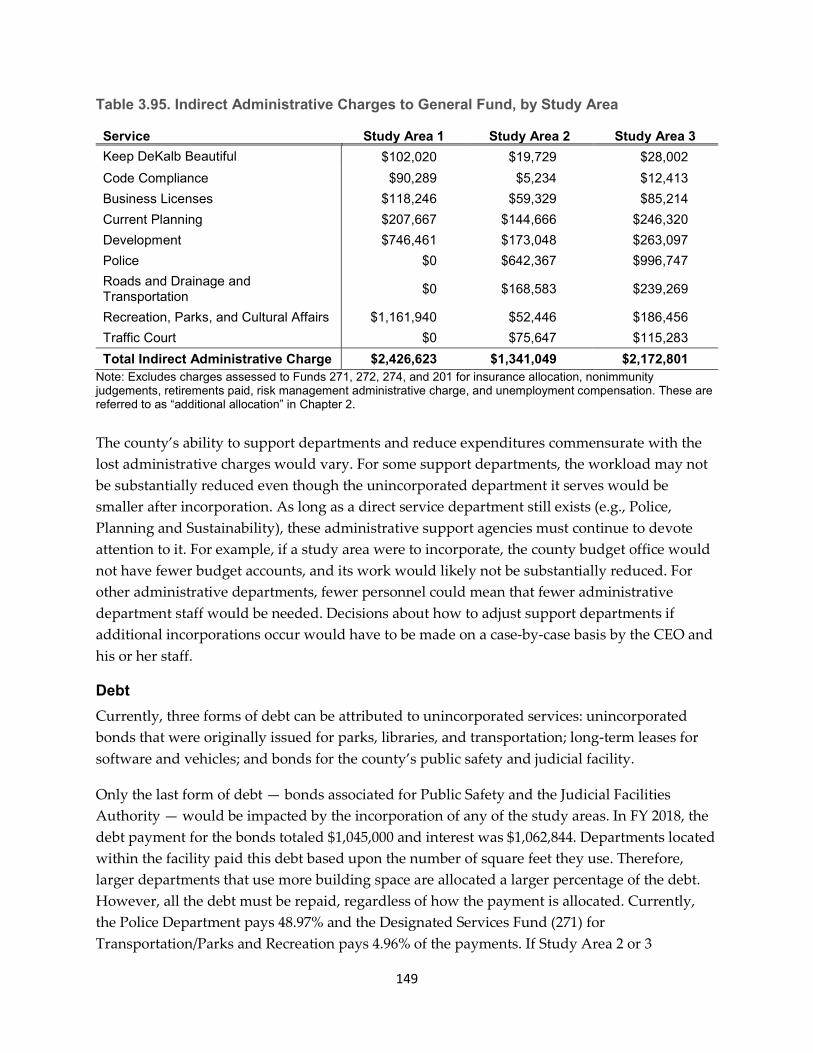
149
Table 3.95. Indirect Administrative Charges to General Fund, by Study Area
Service Study Area 1 Study Area 2 Study Area 3 Keep DeKalb Beautiful $102,020 $19,729 $28,002 Code Compliance $90,289 $5,234 $12,413 Business Licenses $118,246 $59,329 $85,214 Current Planning $207,667 $144,666 $246,320 Development $746,461 $173,048 $263,097 Police $0 $642,367 $996,747 Roads and Drainage and Transportation $0 $168,583 $239,269
Recreation, Parks, and Cultural Affairs $1,161,940 $52,446 $186,456 Traffic Court $0 $75,647 $115,283 Total Indirect Administrative Charge $2,426,623 $1,341,049 $2,172,801
Note: Excludes charges assessed to Funds 271, 272, 274, and 201 for insurance allocation, nonimmunity judgements, retirements paid, risk management administrative charge, and unemployment compensation. These are referred to as “additional allocation” in Chapter 2. The county’s ability to support departments and reduce expenditures commensurate with the lost administrative charges would vary. For some support departments, the workload may not be substantially reduced even though the unincorporated department it serves would be smaller after incorporation. As long as a direct service department still exists (e.g., Police, Planning and Sustainability), these administrative support agencies must continue to devote attention to it. For example, if a study area were to incorporate, the county budget office would not have fewer budget accounts, and its work would likely not be substantially reduced. For other administrative departments, fewer personnel could mean that fewer administrative department staff would be needed. Decisions about how to adjust support departments if additional incorporations occur would have to be made on a case-by-case basis by the CEO and his or her staff.
Debt Currently, three forms of debt can be attributed to unincorporated services: unincorporated bonds that were originally issued for parks, libraries, and transportation; long-term leases for software and vehicles; and bonds for the county’s public safety and judicial facility.
Only the last form of debt — bonds associated for Public Safety and the Judicial Facilities Authority — would be impacted by the incorporation of any of the study areas. In FY 2018, the debt payment for the bonds totaled $1,045,000 and interest was $1,062,844. Departments located within the facility paid this debt based upon the number of square feet they use. Therefore, larger departments that use more building space are allocated a larger percentage of the debt. However, all the debt must be repaid, regardless of how the payment is allocated. Currently, the Police Department pays 48.97% and the Designated Services Fund (271) for Transportation/Parks and Recreation pays 4.96% of the payments. If Study Area 2 or 3

150
incorporated and the county’s police department decreased in size, then the department would likely need less building space. While the police department and its special tax fund (Fund 274) might be allocated less of the debt, that burden would simply result in a reallocation of costs across all agencies using the building, which could result in General Fund departments like the courts being assigned more of the costs. If building space is unused, the county would simply need to charge a higher cost per square foot to make up for any “lost” revenue from the police department.
As for the first two debt instruments, the unincorporated bonds were refunded in 2016 and are being repaid through the unincorporated bond property tax. The county and remaining unincorporated residents would not be impacted in their ability to repay this debt if future incorporations occurred because all property that was within the unincorporated area at the time the original bonds were issued (2006) continue to be assessed the tax, regardless of whether that property is now located within a city. The county has entered into long-term lease purchase agreements for vehicles and Hanson Mitigation Software for the Department of Planning and Sustainability. The lease purchase of vehicles should not be an issue because the county regularly makes payments for vehicles and the lease is set to mature in September 2020. Likewise, the county has consistently paid the lease for the Hanson Mitigation Software, which is also set to mature in September 2020.
Magistrate Court One of the Magistrate Court’s responsibilities is to hear cases involving code enforcement violations. In FY 2018, the Magistrate Court had 38 full- and part-time employees142 and expenditures totaling $3,689,854. The Magistrate Court would be affected differently depending on which study areas incorporated. For example, Study Area 2’s incorporation would likely have little effect on the Magistrate Court because Code Compliance did not dedicate substantial resources to the area in FY 2018. Conversely, if Study Area 1 incorporated, the county would need to review how many fewer court cases the Magistrate Court would need to adjudicate and, consequently, how many fewer judges and personnel would be needed.143
Pension Liability The last significant area of concern regarding the potential impact of additional incorporations on the General Fund is employee pension liabilities. All full-time county employees, regardless of the department to which they are assigned, earn a pension benefit after vesting, that is, qualifying for retirement.144 To fairly allocate employee pension liabilities across the
142 The chief magistrate is a full-time position, but all senior and associate magistrate judges are part-time. There are 20 senior and associate part-time magistrates. 143 The Institute of Government research team was unable to collect workload data from the Magistrate Court and therefore cannot estimate how potential incorporations would impact it. 144 Employees hired on or after January 1, 2016 must work seven years before vesting. Persons hired prior to that date had a vesting period of 10 years.

151
government’s various funds, the county budget allocated charges based on the work assignment of employees. In other words, the Special Services Fund (Fund 271) pays the associated pension liabilities from current and former employees from Recreation, Parks, and Cultural Affairs, Roads and Drainage, and Transportation. The county’s contracted actuary calculates the payment needed for the county to meet its actuarially determined contribution (ADC) annually. The ADC incorporates the accrued liabilities for the current year, i.e., normal costs, plus the accumulated unfunded liabilities from previous years, i.e., amortization payments. Any changes made to the ADC are based upon a variety of factors such demographic changes in the employee base and the investment returns for the pension fund’s assets. As of its 2018 actuarial valuation, the DeKalb County employee pension plan had an unfunded liability of $1,082,200,800145 and was funded at 54.27% of assets.146
It is critical to understand that the county’s pension liabilities do not go away, regardless of whether any additional land is incorporated. The pension benefits earned by employees have been determined to be a financial right. Therefore, reductions in the number of current personnel will reduce current liabilities but NOT the accumulated liabilities. It is these accumulated liabilities that are the most expensive, as seen in the unfunded liability. Significantly reducing the number of personnel due to incorporation of one of the study areas would result in the county needing to assess a higher per-employee charge to meet future ADCs, perhaps even for General Fund employees. Even if no unincorporated land existed, the county would continue to owe pension benefits for employees who served only the unincorporated area. In this extreme example, the county’s General Fund would need to pay the pension fund’s ADC. This could lead to the potentially inequitable result of taxpayers in older cities paying pension costs for county employees that only ever provided services for the unincorporated area.
Because of the county’s fund structure, pension costs for “unincorporated employees” like police, road services, and parks employees are segregated in separate funds. At some point, the tax burden required to pay the unfunded liability for these employees could become very burdensome for the remaining unincorporated residents. Questions of equity could also be raised as these taxpayers would be paying the pension benefits of employees who had served in what currently is and would be incorporated areas. Determining how much each resident in DeKalb “owes” for county employee pension benefits would be extremely difficult if not impossible. Each time a city chose to provide its own police, parks, or road maintenance services over the last decade,147 it was not required to assume any accumulated pension 145 Unfunded actuarial accrued liability on actuarial value of assets, updated for 2018. DeKalb County Pension Plan: Revised Actuarial Valuation and Review as of January 1, 2018. Segal Consulting, Atlanta, GA, p. 8. 146 Based on the actuarial value of assets. Based on the market value of assets, the funded ratio is 60.35%, Segal Consulting, p. 8. 147 Ga. Law 2010, p. 3548.

152
liabilities associated with the county employees who served in that geographic area. Instead, the liability was retained by the county. This was the case for both existing cities when they took over an unincorporated service and for the newly incorporated cities. If the county pension plan had been consistently 100% funded, there would be no equity concerns because of the lack of historical unfunded liability. However, because it is funded at a much lower rate than 100%, the ADC includes payments for pension benefits for employees from previous years. Of the four potential impacts of further incorporation on the General Fund, the county’s pension liability would have the greatest long-term effect as the unfunded liability is amortized over a 25-year period.148
148 A closed 25-year amortization period is reasonable and within the timeframe to represent best practice.

153
Chapter 4. Alternative Police Service Scenarios
This chapter explores varying scenarios regarding the future of the DeKalb County Police Department. The first section analyzes the impact if the cities of Tucker and/or Stonecrest began offering their own police services to residents rather than using the DCPD, and the second section considers the issues that would arise if the DeKalb County Police Department no longer provided police services and this function was wholly taken on by DeKalb municipalities.
IMPACT ON COUNTY IF TUCKER AND STONECREST PROVIDE POLICE SERVICES Chapter 2 outlined the basic service call data and the expenditure amounts for each of the categories of service for the DCPD. Note that while the DCPD has a Special Operations Division, only a few of the units in this division recorded activities in a manner that would allow for the precise geolocation needed to allocate activities to geographic areas. Because the Bomb Unit activity data suggest that this unit is used in a manner similar to a countywide service (rather than primarily for the designated police service areas), expenditures have been included as a support service.
The Institute research team translated workload demands into an allocation of costs to the various geographic areas of interest in order to allocate direct service expenditures (on uniform, investigations, and special services). After allocating direct service expenditures, support services (or indirect) expenditures were allocated to the areas of interest based on needed direct service expenditures.
For simplicity, the Aerial, SWAT, and K-9 units are combined into a special operations category throughout this analysis.
Table 4.1. Police Expenditures Allocation
Expenditure on Direct Services
% of Total Direct Services
Allocation of Indirect & Support Units
Investigations $14,242,870 18.8% $4,923,817 Uniform $56,775,049 74.9% $19,627,361 Special Operations $4,759,159 6.3% $1,645,260 Total $75,777,078 100.0% $26,196,438
This chapter first estimates the impact on police services in the remaining DCPD service area if the cities of Tucker and Stonecrest were to provide their own police services. Estimates are provided for three scenarios: Tucker only, Stonecrest only, and a combined estimate if both cities were to provide their own police services. Specifically, the estimates are focused on how expenditures and related resource usage would change under these scenarios.

154
Two key impact measures are used in this analysis: (1) the number of officers the DCPD would be able to support in the remaining service area after the net revenue loss or gain if the area under consideration were to provide its own police services, and (2) the possible change in the millage rate if the county chooses to maintain the same service capacity as before the event and needs to change revenue collection rates as a consequence.
The Institute research team used a straightforward approach to estimate the impact on these factors by simply identifying the net revenue loss or gain from the scenarios and then expressing this dollar figure in terms of the relevant measure. For example, the analysis might show the number of FTE officers that could no longer be funded or the number of additional officers that could be funded. In other instances, the analysis might show the increase (or decrease) in the millage rate needed to address the shortfall (or surplus) of available revenue caused by the event. In this estimation process, the research team assumed that Fund 274 would maintain the same relationship between available revenues and expenditures as was the case in FY 2018, when this fund had a surplus of approximately $4 million. This estimation approach provides measures that might be considered a “worst case scenario” in that DeKalb County could choose to use the Fund 274 surplus to soften the measures that would otherwise be taken to bring the DCPD and taxpayers back to the same fiscal position as in FY 2018.
Scenario One: Tucker Provides Its Own Police Services This section examines the effects on the rest of the DCPD service area if the City of Tucker were to operate its own police department. Based on the analysis of service call and incident data (see Tables 2.11–2.18) and the assumptions outlined in Chapter 2, Table 4.2 shows the estimated percentages of current DCPD resources the City of Tucker utilizes.
Table 4.2. Estimated Percentage of DCPD Resources Tucker Utilizes
Uniform Services SWAT K-9 Aerial Criminal Investigations, Crime
Scene, Intelligence 8.44% 7.27% 3.65% 10.00% 6.30%
Table 4.3 presents expenditure estimates for the provision of police services in the City of Tucker based on FY 2018 data. These estimates were generated by applying the percentages in Table 4.2 to both the direct and indirect expenditures (according to the assumptions discussed above and in Chapter 2).

155
Table 4.3. Tucker Police Services Expenditure Estimates
Type of Expenditure Amount Criminal Investigations, Crime Scene, Intelligence $1,207,501 Uniform Division $6,444,727 Special Operation Units
SWAT $199,191 K-9 $54,543 Aerial $217,105
Grand Total $8,123,068 Table 4.4 compares the City of Tucker with the total unincorporated area with regard to fiscal capacity factors such as annual cost of police services per capita and per $100,000 in fair market value of the property in the area.
Table 4.4. City of Tucker Police Services Fiscal Factors
Service Area Total Cost
% of Total Service Area Expenditures
Population 2010
Cost Per Capita
Fair Market Value
Cost per $100,000 in FMV
Tucker $8,123,068 7.97% 33,397 $243.23 $4,379,660,209 $185.47 Unincorporated Only $80,670,766 79.11% 396,437 $203.49 $30,717,763,683 $262.62
Note: FMV = fair market value
Staffing. Assuming that the City of Tucker’s expenditures would be used to support officers at a cost similar to that which DeKalb County currently incurs, the research team was able to estimate the number of officers that the City of Tucker would need. Table 4.5 presents the number of officers needed in Tucker and in the unincorporated area per 1,000 residents.
Table 4.5. Officers Needed
Service Area Officers Needed Officers Per 1,000 Pop. Tucker 57.08 1.71 Unincorporated Only 566.82 1.43
Vehicles. Were the City of Tucker to equip its police officers and staff with vehicles using the same ratio of vehicles to officers as is currently the case in the DCPD, then approximately 85 vehicles would be needed.

156
Revenues and Expenditures
If the City of Tucker were to provide its own police services, the DCPD would be relieved of the law enforcement workload in this area, resulting in some savings to DeKalb County. However, Fund 274, which supports the DCPD’s service delivery, would also lose some funding. Tables 4.6 and 4.7 present data on the likely revenue losses, expenditure savings, and net impacts on the remaining DCPD service area.
Table 4.6 summarizes the findings on revenues presented in Chapter 2 and Appendix A regarding the loss of revenue for DeKalb County (Fund 274) had Tucker provided its own police services in FY 2018.
Table 4.6. FY 2018 Revenue Impact Had Tucker Provided Police Services In-House
Revenue Category Amount Percent Taxes $8,912,518 80.44% Insurance Premium $2,028,948 18.31% Licenses and Permits $98,404 .89% Charges for Services $27,101 0.24% Fines and Forfeitures $0 0.00% Investment Income $7,929 0.07% Transfers from Other Funds $0 0.00% Miscellaneous $4,764 0.04% Total $11,079,664 100.00%
In FY2018, the City of Tucker had not yet qualified for its share of the insurance premium tax revenue, as stipulated in O.C.G.A. § 33-8-8. Consequently, this share of the insurance premium tax revenue remained with DeKalb County. However, as of FY 2019, the City of Tucker began to receive its share of these revenues, and as a result, DeKalb County’s share of these revenues decreased, negatively impacting the county. (Due to substantial increases in overall insurance premium tax revenue collection in FY 2019, the net loss to DeKalb was not as great as would otherwise have been the case). Thus, if one ran the same analysis on FY 2019, the impact on DeKalb County would appear to be substantially less negative than is shown in Table 4.7 below, but only because the county has already lost Tucker’s share of the insurance premium tax.
Table 4.7 summarizes the revenue losses, expenditures saving, and net impact to DeKalb County from Tucker providing its own police services. Expenditure savings include funds spent on uniform services, criminal investigations, special operations, and all the support services needed to provide these direct law enforcement actions to the City of Tucker. The remaining DCPD service area would save because the DCPD would no longer need to make these expenditures. The net impact depends on whether the expenditure savings are larger or smaller than the revenue losses.

157
Table 4.7. Net Impact of the City of Tucker No Longer Receiving Services from the DCPD
Revenue Loss ($11,079,665) Expenditure Savings $8,123,068 Net Impact ($2,956,597)
Note: based on FY 2018 funding levels
Potential Response Options
DeKalb County could address the impact of a net loss of this much revenue in three primary ways. First, the county could reduce the level of service in the remaining DCPD service area. Second, DeKalb could raise taxes and fees in the remaining DCPD service area in order to provide the same level of service that residents currently receive. Third, the county could use a combination of some increase in taxes and fees with some level of reduction in service. The next sections discuss the implications if the county were to choose either Option 1 or 2. The implications of the county choosing the third option would range somewhere between those of Options 1 and 2.
Option 1. Reduce the Level of Service
The level of service could be reduced in a variety of ways: The DCPD could cut back on training; it could eliminate certain special units; it could cut down on patrol routes; it could increase response times; or it could enact any combination of these cost reduction strategies. To illustrate the impact of a reduction in service, the research team used two straightforward metrics — number of officers and officers per 1,000 residents — because they can be easily calculated from figures on available revenue. Attempting to translate revenue loss into something like an increase in police response time would be problematic because the calculation would depend on numerous factors other than revenues.
Tables 4.8 and 4.9 show how removing Tucker from the DCPD service area would affect DCPD’s capacity to deliver services in the remaining unincorporated area. Table 6.8 shows how the remaining revenue to support police services translates into a deficit in the number of officers that can be funded with that revenue.
Table 4.8. Impact of the City of Tucker Providing Its Own Police Service on Number of Officers Needed to Service the Remaining DCPD Service Area
Event Officers Needed to Service
Remaining DCPD Service Area Net Officers
Deficit Removal of Tucker from DCPD Service Area 659.4 –21
Table 4.9 shows how the ratio of officers to population would change if Tucker were removed from the DCPD service area. The deficit in officers per 1,000 residents shows the net impact in service delivery capacity after Tucker is removed. This figure is the difference between the

158
number of officers per capita needed to police the remaining area and the officers per capita that the remaining service area can afford at current levels of taxes and fees.
Table 4.9. Impact of the City of Tucker Providing Its Own Police Service in Terms of Officers Per 1,000 Population in Remaining DCPD Service Area
Event
Officers Per 1,000 Pop. Needed to Serve
Remaining Service Area at Current Service Level
Officers Per 1,000 Population Available
after Service Reduction
Deficit in Officers Per 1,000 Pop.
Removal of Tucker from DCPD Service Area 1.48 1.43 -0.05
Option 2. Raise Taxes
If DeKalb County chose to maintain the current level of police services in the remaining DCPD service area, additional revenue would need to be raised through increases in either taxes or fees or both. Some revenue amounts like insurance premiums are essentially set, and some fees, such as charges for fingerprinting and background checks, are relatively minor sources of revenue for the county and therefore cannot practically be increased through rate hikes. Thus, property taxes are the only feasible revenue source for raising the kind of revenue needed to fill the revenue gap created by the DCPD no longer providing police services in Tucker.
Although a number of property taxes (e.g., real, personal, motor vehicle, intangible, utility, recording, etc.) could potentially be raised to fill the fiscal gap, the Raise Taxes Option is illustrated solely through the real property tax. This is done in part because of the lack of accurate information on personal property, motor vehicle property (subject to the old ad valorem tax), and utility property in the areas of the county that do not currently form tax jurisdictions, i.e., Vista Grove and the area above Hwy. 78. Consequently, the estimate of the millage rate increase will be higher than the actual millage rate increase that a real property owner would likely experience. An analysis of the property taxes raised for Fund 274 suggests that real property taxes represent approximately 87.4% of all property taxes that the county has the ability to adjust.149 To illustrate impact, the research team assumed that all of the revenue gap that needs to be covered through increases in taxes and fees is borne by an increase in the real property tax.
The research team’s aim was to estimate how much the real property millage rate would need to increase to fill the gap in revenues required to provide the same level of service as the DCPD currently offers in the service area. The researchers began by identifying the area of analysis as
149 The new Title Ad Valorem Tax is set by the state with the revenues shared with local government. This TAVT revenue accounts for the vast majority of motor vehicle taxes collected by DeKalb County.

159
the area where DCPD provides full services. This primary service area includes all of the unincorporated area as well as the cities of Tucker and Stonecrest. The other cities serviced by the DCPD receive only nonbasic or minimal basic services, with total expenditures of less than $500,000. The area of analysis is thus limited by the assumption that these smaller cities will continue to pay for the services they receive. Consequently, total DCPD expenditures are adjusted to include only expenditures on services delivered in the primary service area.
The research team next identified the total amount of taxable assessed value150 of the real property in the various portions of the primary service area, i.e., unincorporated DeKalb and the cities of Tucker and Stonecrest.151 From the sum of these assessed values, the researchers subtracted the assessed value of real property in the City of Tucker to arrive at the assessed value in the DCPD’s primary service area remaining if Tucker was no longer receiving DCPD services.
Finally, based on the assessed value of real property in the remaining service area, the research team calculated a millage rate applied to this value that would generate the revenue needed to fill the gap. Table 4.10 shows these calculations.
Table 4.10 Millage Rate Impact Possible If Tucker Were Removed from the DCPD Service Area
Assessed Value in DCPD Primary Service Area Remaining After Tucker Removed $10,102,140,879
Net Revenue Loss ($2,956,597) Millage Rate Increase Needed to Fill Gap 0.293
State Court – Traffic Court (Fund 272)
As discussed in Chapters 2 and 3, the county’s revenue collection for traffic citations is directly tied to police enforcement of traffic laws. To the extent the DCPD no longer provides police services in an area, so too will the county lose traffic citation revenue. This section considers the financial impact to the county’s traffic court and traffic citation revenue if the City of Tucker had provided its own police services in FY 2018.
The workload of DeKalb County’s traffic court is tied to the number of moving violations tickets that county police issue. Because the exact location of every ticket is unknown, workload
150 “Assessed value” in DeKalb County represents 40% of the fair market value set by tax assessors. 151 Data on assessed values for the study areas (e.g., Tucker, Stonecrest, and the unincorporated area) were provided by the DeKalb County Tax Commissioner’s Office. Data for the cities of Tucker and Stonecrest were extracted from the Consolidated Tax Digest, State Department of Revenue. The gross Consolidated Digest values were adjusted to exclude utility taxes, motor vehicle, heavy equipment, and personal property taxes.

160
(and therefore revenues and expenditures) is distributed by population. The City of Tucker represents 6.96% of the county’s population, and thus workload (see Table 4.4).152 If Tucker were to provide its own police services, the estimated loss to traffic court revenue would be $580,807 (see Table 4.11).
The DCPD issued 48,691 tickets in FY 2018 (see Chapter 2 for more details), with an average collection of $171.45 per ticket.153 If Tucker were to provide its own police services, the county would issue an estimated 3,388 fewer tickets.154
Table 4.11. Tucker Traffic Court Revenue
Revenue Division Total Tucker State Court Traffic $6,971,875 $485,059 State Court Costs $1,376,074 $95,739 Misc. Revenue $132 $9 Traffic Court Revenue $8,348,081 $580,807
Table 4.12 shows the estimated cost reductions and the net impact to the county in regard to traffic court if Tucker began providing its own police services. As with revenues, the associated savings to the county from no longer providing traffic court services to Tucker was estimated as a percentage of the population in the area, 6.96%. The estimated savings would be $370,769, which is equivalent to 3.5 FTEs.155
If Tucker were to provide its own police services, the county would incur an estimated net revenue loss of $210,038.156 In FY 2018, Traffic Court generated excess revenue of $3,020,938 for the Unincorporated Fund (Fund 272). Fund 272 also transferred $2,775,404 to the Police Services Fund (Fund 274) that year. Therefore, the net loss of revenue from Traffic Court would undoubtedly impact the ability of Fund 272 to support police services.
152 33,397 / 480,023 = 6.96%. Includes the entire unincorporated area plus the cities of Tucker and Stonecrest. 153 $8,348,081 / 48,691 = $171.45 154 $580,807 / $171.45 = 3,387.6 155 See Chapter 2 for calculation on cost per employee. 156 Because the calculated revenues and expenditures were based on population, the net revenue loss is 6.96%.

161
Table 4.12. Tucker Traffic Court Net Impact
Estimated Dollars Revenue Losses ($580,807) Expenditure Savings $370,769 Traffic Court Net Impact ($210,038)
Scenario Two: Stonecrest Provides Its Own Police Services This section examines the effects of the City of Stonecrest operating its own police department. Based on the analysis of service call and incident data and the assumptions outlined at the beginning of the chapter and in Chapter 2, Table 4.13 shows the estimated percentages of current DCPD resources utilized by the City of Stonecrest.
Table 4.13. Estimated Percentage of DCPD Resources Stonecrest Utilizes
Uniform Services SWAT K-9 Aerial
Criminal Investigations, Crime Scene, Intelligence
12.98% 3.64% 12.41% 13.57% 14.00%
Table 4.14 presents expenditure estimates for the provision of police services in the City of Stonecrest. These estimates were generated by applying the percentages in Table 4.13 to both the direct and indirect expenditures (according to the assumptions discussed above).
Table 4.14. Stonecrest Police Services Expenditure Estimates
Type of Expenditure Amount Criminal Investigations, Crime Scene, Intelligence $2,683,336 Uniform Division $9,916,660 Special Operation Units
SWAT $99,596 K-9 $185,447 Aerial $294,643
Grand Total $13,179,682
Table 4.15 compares the City of Stonecrest with the total unincorporated area with regard to fiscal capacity factors such as the annual cost of police services per capita and per $100,000 in fair market value of the property in the area.
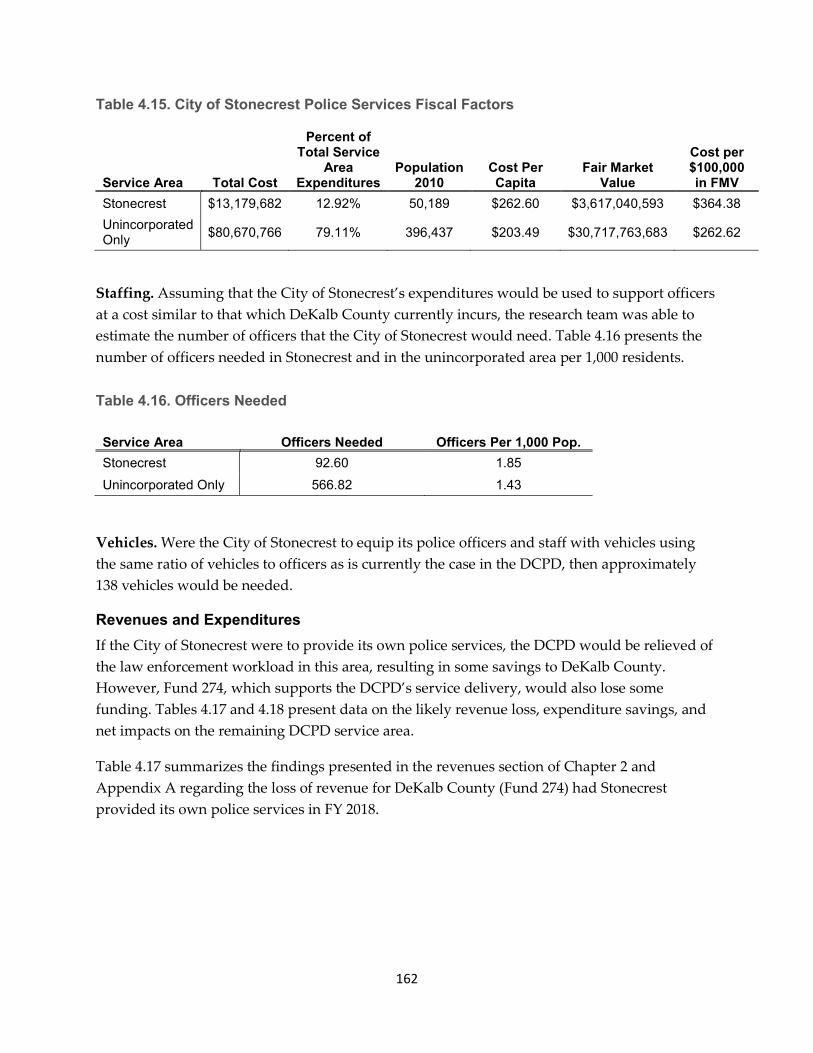
162
Table 4.15. City of Stonecrest Police Services Fiscal Factors
Service Area Total Cost
Percent of Total Service
Area Expenditures
Population 2010
Cost Per Capita
Fair Market Value
Cost per $100,000 in FMV
Stonecrest $13,179,682 12.92% 50,189 $262.60 $3,617,040,593 $364.38 Unincorporated Only $80,670,766 79.11% 396,437 $203.49 $30,717,763,683 $262.62
Staffing. Assuming that the City of Stonecrest’s expenditures would be used to support officers at a cost similar to that which DeKalb County currently incurs, the research team was able to estimate the number of officers that the City of Stonecrest would need. Table 4.16 presents the number of officers needed in Stonecrest and in the unincorporated area per 1,000 residents.
Table 4.16. Officers Needed
Service Area Officers Needed Officers Per 1,000 Pop. Stonecrest 92.60 1.85 Unincorporated Only 566.82 1.43
Vehicles. Were the City of Stonecrest to equip its police officers and staff with vehicles using the same ratio of vehicles to officers as is currently the case in the DCPD, then approximately 138 vehicles would be needed.
Revenues and Expenditures If the City of Stonecrest were to provide its own police services, the DCPD would be relieved of the law enforcement workload in this area, resulting in some savings to DeKalb County. However, Fund 274, which supports the DCPD’s service delivery, would also lose some funding. Tables 4.17 and 4.18 present data on the likely revenue loss, expenditure savings, and net impacts on the remaining DCPD service area.
Table 4.17 summarizes the findings presented in the revenues section of Chapter 2 and Appendix A regarding the loss of revenue for DeKalb County (Fund 274) had Stonecrest provided its own police services in FY 2018.

163
Table 4.17. FY 2018 Revenue Impact of Stonecrest Providing Police Services In-House
Revenue Category Amount Percent Taxes $7,248,314 69.72% Insurance Premium $3,052,362 29.36% Licenses and Permits $39,587 0.38% Charges for Services $40,983 0.39% Fines and Forfeitures $0 0.00% Investment Income $7,425 0.07% Transfers from Other Funds $0 0.00% Miscellaneous $7,204 0.07% Total $10,395,875 100.00%
In FY 2018, the City of Stonecrest had not yet qualified for its share of the insurance premium tax revenue, as stipulated in O.C.G.A. § 33-8-8. Consequently, this share of the insurance premium tax revenue remained with DeKalb County. As of FY 2019, the City of Stonecrest began to receive its share of these revenues, and as a result DeKalb County’s share of these revenues decreased, negatively impacting the county. (Due to substantial increases in overall insurance premium tax revenue collection in FY 2019, the net loss to DeKalb was not as great as would otherwise have been the case.) Thus, if one ran the same analysis for FY 2019, the impact on DeKalb County would appear to be more positive than is shown in the analysis below, but only because it has already lost Stonecrest’s share of the insurance premium taxes.
Table 4.18 summarizes the revenue losses, expenditure savings, and net impact from Stonecrest providing its own police services. Expenditure savings include expenditures for uniform services, criminal investigations, special operations, and all the support services needed to provide these direct law enforcement actions to the City of Stonecrest. The remaining DCPD service area would save because the DCPD would no longer need to make these expenditures. The net impact depends on whether the expenditure savings are larger or smaller than the revenue losses.
Table 4.18. Net Impact of the City of Stonecrest No Longer Receiving Services from the DCPD
Revenue Loss ($10,395,876) Expenditure Savings $13,179,682 Net Impact $2,783,806
Note: Based on FY 2018 funding levels

164
Potential Response Options
The net fiscal impact on DeKalb County of Stonecrest no longer receiving DCPD services would be positive. The county could address the impact of a net revenue gain in three primary ways. First, DeKalb could increase the level of service in the remaining DCPD service area. Second, it could lower taxes and fees in the remaining DCPD service area and provide the same level of service as residents currently receive. Third, the county could use a combination of some decrease in taxes and fees with some level of increase in service. This section outlines the implications if the county were to choose either Option 1 or 2. The implications of the county choosing the third option would range somewhere between those of Options 1 and 2.
Option 1. Increase the Level of Service
An increase in the level of service could occur in numerous ways: The DCPD could enhance training; it could expand certain special units; it could increase patrol routes; it could decrease response times; or it could enact any combination of these service enhancement strategies. To illustrate the impact of an increase in service, the research team used two straightforward metrics — number of officers and officers per 1,000 residents — because they could be easily calculated from figures on available revenue. Attempting to translate revenue gains into something like a decrease in police response time would be problematic because the calculation would depend on numerous factors other than revenues.
Tables 4.19 and 4.20 show how removing Stonecrest from the DCPD service area would affect DCPD’s capacity to deliver services in the remaining unincorporated area. Table 6.19 shows how the remaining revenue translates into a surplus in the number of officers that can be funded.
Table 419. Impact of the City of Stonecrest Providing Its Own Police Service on Number of Officers Needed to Service the Remaining DCPD Service Area
Event
Officers Needed to Service Remaining DCPD Service Area Net Officers Surplus
Removal of Stonecrest from DCPD Service Area 623.9 41
These data suggest that the removal of the City of Stonecrest from the DCPD service area would allow the DCPD to employ additional officers in the remaining service area.
Table 4.20 shows how the ratio of officers to population would change if Stonecrest were removed from the DCPD service area. The deficit in officers per 1,000 residents shows the net impact in service delivery capacity after Stonecrest is removed. This figure is the difference between the officers per capita needed to police the remaining area and the officers per capita that the remaining service area can afford at current levels of taxes and fees.
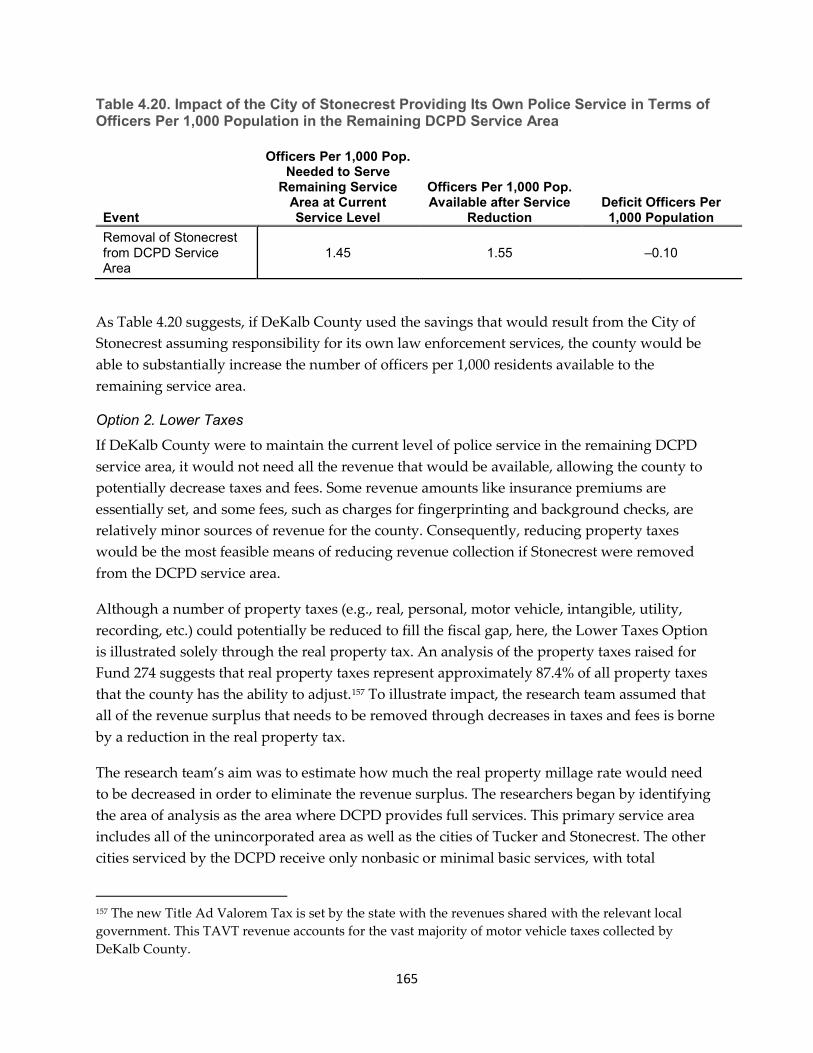
165
Table 4.20. Impact of the City of Stonecrest Providing Its Own Police Service in Terms of Officers Per 1,000 Population in the Remaining DCPD Service Area
Event
Officers Per 1,000 Pop. Needed to Serve
Remaining Service Area at Current Service Level
Officers Per 1,000 Pop. Available after Service
Reduction Deficit Officers Per 1,000 Population
Removal of Stonecrest from DCPD Service Area
1.45 1.55 –0.10
As Table 4.20 suggests, if DeKalb County used the savings that would result from the City of Stonecrest assuming responsibility for its own law enforcement services, the county would be able to substantially increase the number of officers per 1,000 residents available to the remaining service area.
Option 2. Lower Taxes
If DeKalb County were to maintain the current level of police service in the remaining DCPD service area, it would not need all the revenue that would be available, allowing the county to potentially decrease taxes and fees. Some revenue amounts like insurance premiums are essentially set, and some fees, such as charges for fingerprinting and background checks, are relatively minor sources of revenue for the county. Consequently, reducing property taxes would be the most feasible means of reducing revenue collection if Stonecrest were removed from the DCPD service area.
Although a number of property taxes (e.g., real, personal, motor vehicle, intangible, utility, recording, etc.) could potentially be reduced to fill the fiscal gap, here, the Lower Taxes Option is illustrated solely through the real property tax. An analysis of the property taxes raised for Fund 274 suggests that real property taxes represent approximately 87.4% of all property taxes that the county has the ability to adjust.157 To illustrate impact, the research team assumed that all of the revenue surplus that needs to be removed through decreases in taxes and fees is borne by a reduction in the real property tax.
The research team’s aim was to estimate how much the real property millage rate would need to be decreased in order to eliminate the revenue surplus. The researchers began by identifying the area of analysis as the area where DCPD provides full services. This primary service area includes all of the unincorporated area as well as the cities of Tucker and Stonecrest. The other cities serviced by the DCPD receive only nonbasic or minimal basic services, with total
157 The new Title Ad Valorem Tax is set by the state with the revenues shared with the relevant local government. This TAVT revenue accounts for the vast majority of motor vehicle taxes collected by DeKalb County.

166
expenditures of less than $500,000. The area of analysis is thus limited by the assumption that these smaller cities will continue to pay for the services they receive. Consequently, the total DCPD expenditures are adjusted to include only expenditures on services delivered in the primary service area.
The research team next identified the total amount of taxable assessed value158 of the real property in the various portions of the primary service area, i.e., unincorporated DeKalb and the cities of Tucker and Stonecrest.159 From the sum of these assessed values, the researchers subtracted the assessed value of real property in the City of Stonecrest to arrive at assessed value in the DCPD’s primary service area remaining if Stonecrest were no longer receiving DCPD services.
Finally, based on the assessed value of real property in the service area remaining, the research team calculated a millage rate applied to this value that would generate the revenue surplus amount. Table 4.21 shows these calculations.
Table 421. Millage Rate Impact Possible If Stonecrest Were Removed from the DCPD Service Area
Assessed Value in DCPD Primary Service Area Remaining After Incorporation Event
$13,492,593,629
Net Revenue Loss $2,783,806 Millage Rate Decrease Possible -0.206
Capital
This analysis focuses on operational capability and the revenues needed to support this capability. Because Fund 274 makes annual appropriations for normal capital expenditures, the analysis includes these ordinary and ongoing capital costs. However, sometimes Fund 274 transfers funds to a separate capital fund, and expenditures are made from this fund to support DCPD operations. In the last five years, this occurred only once, as part of a capital project to purchase body cameras. Because the Institute research team does not know whether this capital expenditure will become an ordinary and ongoing cost, the analysis includes only the capital costs that have already been incorporated into the Fund 274 operational budget. However, if this new capital expenditure does become ongoing, DeKalb County would incur approximately $120,000 in additional annual expenditures. After subtracting the savings from not needing to
158 “Assessed value” in DeKalb County represents 40% of the fair market value set by tax assessors. 159 Data on assessed values for the study areas (e.g., Tucker, Stonecrest, and the unincorporated area) were provided by the DeKalb County Tax Commissioner’s Office. Data for the cities of Tucker and Stonecrest were extracted from the Consolidated Tax Digest, State Department of Revenue. The gross Consolidated Digest values were adjusted to exclude utility taxes, motor vehicle, heavy equipment, and personal property taxes.

167
support capital expenditures in the Stonecrest area (estimated at $15,509.54), the research team estimated the impact on expenditures needed to support police services in the remaining service area. In this case, the revenue surplus in the remaining DCPD service area would be approximately $104,490 less than what was estimated above (see Tables 4.17 and 4.18). Were DeKalb County to adjust the millage rate to address this change in the revenue surplus, the amount of the increase would be miniscule, about a hundredth of a mill.
State Court -Traffic Court (Fund 272)
As discussed in Chapters 2 and 3, the county’s revenue collection for traffic citations is directly tied to police enforcement of traffic laws. To the extent the DCPD no longer provides police services in an area, so too will the county lose traffic citation revenue. This section estimates the financial impact to the county’s Traffic Court and traffic citation revenue if the City of Stonecrest had provided its own police services in FY 2018.
The workload of DeKalb County’s Traffic Court is tied to the number of moving violations tickets that county police issue. Because the exact location of every ticket is unknown, workload (and therefore revenues and expenditures) is distributed by population. The City of Stonecrest represents 10.46% of the county’s population, and thus workload (see Table 4.4).160 If Stonecrest were to provide its own police services, traffic court would lose an estimated $872,837 in revenue (see Table 4.22).
The DCPD issued 48,691 tickets in FY 2018 (see Chapter 2 for more details), with an average collection of $171.45 per ticket.161 If Stonecrest were to provide its own police services, the county would issue an estimated 5,091 fewer tickets.162
Table 4.22. Stonecrest Traffic Court Revenue
Revenue Division Total Stonecrest State Court Traffic $6,971,875 $728,947 State Court Costs $1,376,074 $143,876 Misc. Revenue $132 $14 Traffic Court Revenue $8,348,081 $872,837
Table 4.23 shows the estimated cost reductions and the net impact to the county in regard to traffic court if Stonecrest began providing its own police services. As with revenues, associated
160 50,189 / 480,023 = 10.46%. Includes the entire unincorporated area plus the cities of Tucker and Stonecrest. 161 $8,348,081 / 48,691 = $171.45 162 $872,837 / $171.45 = 5090.9
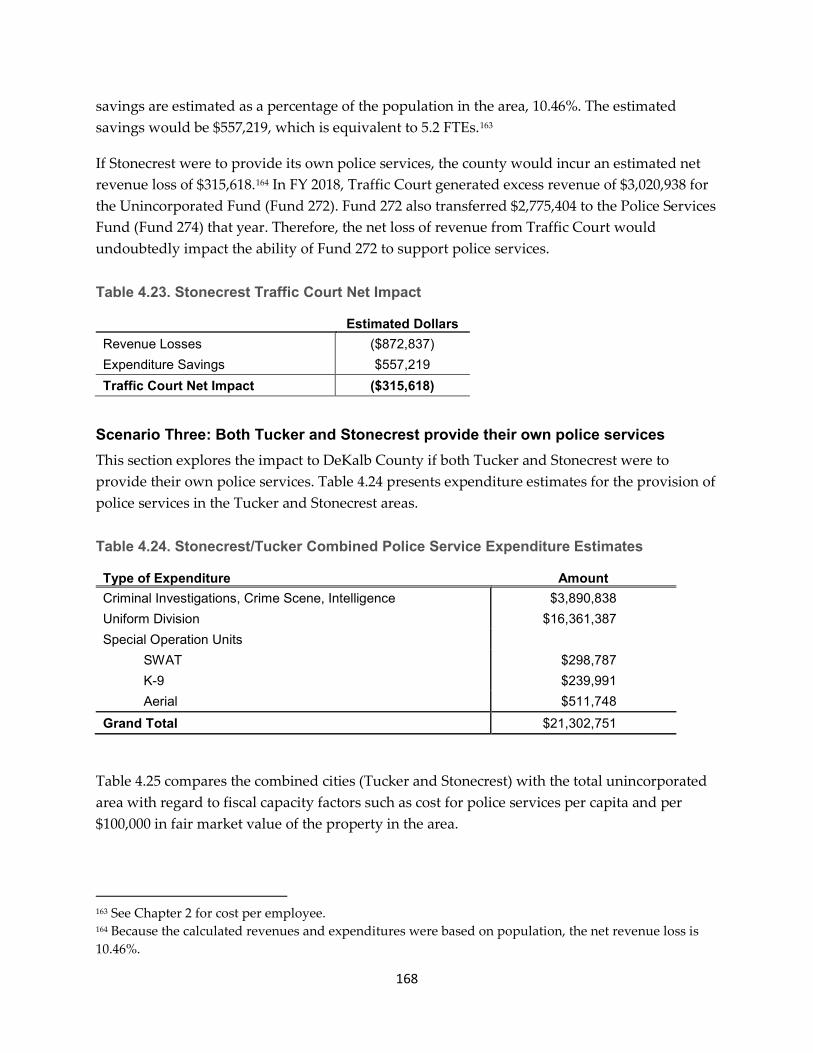
168
savings are estimated as a percentage of the population in the area, 10.46%. The estimated savings would be $557,219, which is equivalent to 5.2 FTEs.163
If Stonecrest were to provide its own police services, the county would incur an estimated net revenue loss of $315,618.164 In FY 2018, Traffic Court generated excess revenue of $3,020,938 for the Unincorporated Fund (Fund 272). Fund 272 also transferred $2,775,404 to the Police Services Fund (Fund 274) that year. Therefore, the net loss of revenue from Traffic Court would undoubtedly impact the ability of Fund 272 to support police services.
Table 4.23. Stonecrest Traffic Court Net Impact
Estimated Dollars Revenue Losses ($872,837) Expenditure Savings $557,219 Traffic Court Net Impact ($315,618)
Scenario Three: Both Tucker and Stonecrest provide their own police services This section explores the impact to DeKalb County if both Tucker and Stonecrest were to provide their own police services. Table 4.24 presents expenditure estimates for the provision of police services in the Tucker and Stonecrest areas.
Table 4.24. Stonecrest/Tucker Combined Police Service Expenditure Estimates
Type of Expenditure Amount Criminal Investigations, Crime Scene, Intelligence $3,890,838 Uniform Division $16,361,387 Special Operation Units
SWAT $298,787 K-9 $239,991 Aerial $511,748
Grand Total $21,302,751
Table 4.25 compares the combined cities (Tucker and Stonecrest) with the total unincorporated area with regard to fiscal capacity factors such as cost for police services per capita and per $100,000 in fair market value of the property in the area.
163 See Chapter 2 for cost per employee. 164 Because the calculated revenues and expenditures were based on population, the net revenue loss is 10.46%.

169
Table 4.25. Cities of Tucker and Stonecrest Police Services, Fiscal Factors
Service Area Total Cost
Percent of Total Service
Area Expenditures
Population 2010
Cost Per Capita
Fair Market Value
Cost per $100,000 in FMV
Tucker and Stonecrest $21,302,750 20.9% 83,586 $254.86 $7,996,700,802 $266.39
Unincorporated (without Tucker and Stonecrest)
$80,670,766 79.11% 396,437 $203.49 $30,717,763,683 $262.62
Note: FMV = fair market value
Staffing. Assuming that expenditures will be used to support officers at a cost similar to that which DeKalb County currently incurs, the research team was able to estimate the number of officers that the combined cities would need. Table 4.26 presents the number of officers needed in Tucker and Stonecrest and in the remaining unincorporated area per 1,000 residents.
Table 4.26. Officers Needed
Service Area Officers Needed Officers Per 1,000 Pop. Tucker and Stonecrest 149.68 1.79 Unincorporated Only (without Tucker and Stonecrest) 566.82 1.43
Vehicles. Were the two cities to equip their police officers and staff with vehicles using the same ratio of vehicles to officers as is currently the case in the DCPD, then approximately 223 vehicles would be needed.
Revenues and Expenditures
If both the City of Stonecrest and the City of Tucker were to provide their own police services, the DCPD would be relieved of the law enforcement workload in both of these areas, resulting in some savings to DeKalb County. However, Fund 274, which supports the DCPD’s service delivery, would also lose some funding. Tables 4.27 and 4.28 present data on the likely revenue loss, expenditure savings, and net impacts on the remaining DCPD service area.
Table 4.27 summarizes the findings presented in Chapter 2 and Appendix A regarding the loss of revenue for DeKalb County (Fund 274) had Tucker and Stonecrest provided their own police services in FY 2018.

170
Table 4.27. FY 2018 Revenue Impact of Stonecrest and Tucker Providing Police Services In-House
Revenue Category Amount Percent Taxes $16,160,833 75.25% Insurance Premium $5,081,310 23.66% Licenses and Permits $137,992 0.64% Charges for Services $68,085 0.32% Fines and Forfeitures $0 0.00% Investment Income $15,354 0.07% Transfers from Other Funds $0 0.00% Miscellaneous $11,968 0.06% Total $21,475,542 100.00%
Table 4.27 shows that the cities of Tucker and Stonecrest in FY 2018 contributed their portion of insurance premium tax revenue to support DCPD services (Fund 274). This contribution to Fund 274 occurred by default because these cities had not yet qualified for their share of the tax revenue, as stipulated in O.C.G.A. § 33-8-8. As of FY 2019, these cities began receiving it, and as a result, DeKalb County’s share of these revenues decreased, negatively impacting the county.
If in FY 2018, the cities’ share of insurance premium tax revenue had not been use to support county police services, this analysis on the impact of these cities choosing to operate their own police department would have shown a substantial net financial gain to the county (Tucker and Stonecrest combined). That is, without the additional insurance premium coming from Stonecrest and Tucker to support police services in those areas, the DCPD operates at a financial loss to serve them.
Table 4.28 summarizes the revenue losses, expenditure savings, and net impact from Tucker and Stonecrest providing their own police services. Expenditure savings include funds for uniform services, criminal investigations, special operations, and all the support services needed to provide these direct law enforcement actions to the cities of Tucker and Stonecrest. The remaining DCPD service area would save because the DCPD would no longer need to make these expenditures. The net impact depends on whether the expenditure savings are larger or smaller than the revenue losses.
Table 4.28. Net Impact of the Cities of Tucker and Stonecrest No Longer Receiving Services from DCPD
Revenue Loss ($21,475,541) Expenditure Savings $21,302,750 Net Impact ($172,791)

171
Potential Response Options
DeKalb County could address the impact of a net loss of this much revenue in three primary ways. First, the county could reduce the level of service in the remaining DCPD service area. Second, DeKalb could raise taxes and fees in the remaining DCPD service area in order to provide the same level of service that residents currently receive. Third, the county could use a combination of some increase in taxes and fees with some level of reduction in service. The next section discusses the implications if the county were to choose either Option 1 or 2. The implications of the county choosing the third option would range somewhere between those of Options 1 and 2.
Option 1. Reduce the Level of Service
The level of service could be reduced in a variety of ways: The DCPD could cut back on training; it could eliminate certain special units; it could cut down on patrol routes; it could increase response times; or it could enact any combination of these cost reduction strategies. To illustrate the impact of a reduction in service, the research team used two straightforward metrics — number of officers and officers per 1,000 residents — because they can be easily calculated from figures on available revenue. Attempting to translate revenue loss into something like an increase in police response time would be problematic because the calculation would depend on numerous factors other than revenues.
Tables 4.29 and 4.30 show how removing Stonecrest and Tucker from the DCPD service area would affect DCPD’s capacity to deliver services in the remaining unincorporated area. Table 4.29 shows how the remaining revenue translates into a deficit in the number of officers that can be funded with the remaining revenue.

172
Table 4.29. Impact of the Cities of Tucker and Stonecrest Providing Their Own Police Services on the Number of Officers Needed to Service the Remaining DCPD Service Area
Event
Officers Needed to Service Remaining DCPD Service
Area Net Officers Surplus Removal of Tucker and Stonecrest from DCPD Service Area 566.82 –1.2
Table 4.30 shows how the ratio of officers to population would change if Tucker and Stonecrest were removed from the DCPD service area. The deficit in officers per 1,000 residents indicates the net impact in service delivery capacity if the two cities were removed from the DCPD service area. This figure is the difference between the number officers per 1,000 residents needed to police the remaining area and the number of officers per 1,000 residents that the remaining service area would be able to afford at current levels of taxes and fees.
Table 4.30. Impact of the Cities of Tucker and Stonecrest Providing Their Own Police Services in Terms of Officers Per 1,000 Population in the Remaining DCPD Service Area
Event
Officers Per 1,000 Pop. Needed to Serve
Remaining Service Area at Current Service Level
Officers Per 1,000 Pop. Available after Service Reduction
Deficit Officers Per 1,000 Population
Removal of Tucker & Stonecrest from DCPD Service Area
1.430 1.427 -0.003
Option 2. Raise Taxes
If DeKalb County chose to maintain the current level of police services in the remaining DCPD service area, additional revenue would need to be raised through increases in either taxes or fees or both. Some revenue amounts like insurance premiums are essentially set, and some fees, such as charges for fingerprinting and background checks, are relatively minor sources of revenue for the county and therefore cannot practically be increased through rate hikes. Thus, property taxes are the only feasible revenue source for raising the kind of revenue needed to fill the revenue gap created by the DCPD no longer providing police services in Tucker and Stonecrest.
Although a number of property taxes (e.g., real, personal, motor vehicle, intangible, utility, recording, etc.) could potentially be raised to fill the fiscal gap, the Raise Taxes Option is illustrated solely through the real property tax. This is done in part because of the lack of accurate information on personal property, motor vehicle property (subject to the old ad valorem tax), and utility property in the areas of the county that do not currently form tax

173
jurisdictions, i.e., Vista Grove and the area above Hwy. 78. Consequently, the estimate of the millage rate increase will be higher than the actual millage rate increase that a real property owner would likely experience. An analysis of the property taxes raised for Fund 274 suggests that real property taxes represent approximately 87.4% of all property taxes that the county has the ability to adjust.165 To illustrate impact, the research team assumed that all of the revenue gap that needs to be covered through increases in taxes and fees is borne by an increase in the real property tax.
The research team’s aim was to estimate how much the real property millage rate would need to increase to fill the gap in revenues required to provide the same level of service as the DCPD currently offers in the service area. The researchers began by identifying the area of analysis as the area where DCPD provides full services. This primary service area includes all of the unincorporated area as well as the cities of Tucker and Stonecrest. The other cities serviced by the DCPD receive only nonbasic or minimal basic services, with total expenditures of less than $500,000. The area of analysis is thus limited by the assumption that these smaller cities will continue to pay for the services they receive. Consequently, total DCPD expenditures are adjusted to include only expenditures on services delivered in the primary service area.
The research team next identified the total amount of taxable assessed value166 of the real property in the various portions of the primary service area, i.e., unincorporated DeKalb and the cities of Tucker and Stonecrest.167 From the sum of these assessed values, the researchers subtracted the assessed value of real property in the City of Tucker and the City of Stonecrest to arrive at the assessed value in the DCPD’s primary service area remaining if Tucker and Stonecrest were no longer receiving DCPD services.
Finally, based on the assessed value of real property in the remaining service area, the research team calculated a millage rate applied to this value that would generate the revenue needed to fill the gap. Table 4.31 shows these calculations.
165 The new Title Ad Valorem Tax is set by the state with the revenues shared with local government. This TAVT revenue accounts for the vast majority of motor vehicle taxes collected by DeKalb County. 166 “Assessed value” in DeKalb County represents 40% of the fair market value set by tax assessors. 167 Data on assessed values for the study areas (e.g., Tucker, Stonecrest, and the unincorporated area) were provided by the DeKalb County Tax Commissioner’s Office. Data for the cities of Tucker and Stonecrest were extracted from the Consolidated Tax Digest, State Department of Revenue. The gross Consolidated Digest values were adjusted to exclude utility taxes, motor vehicle, heavy equipment, and personal property taxes.
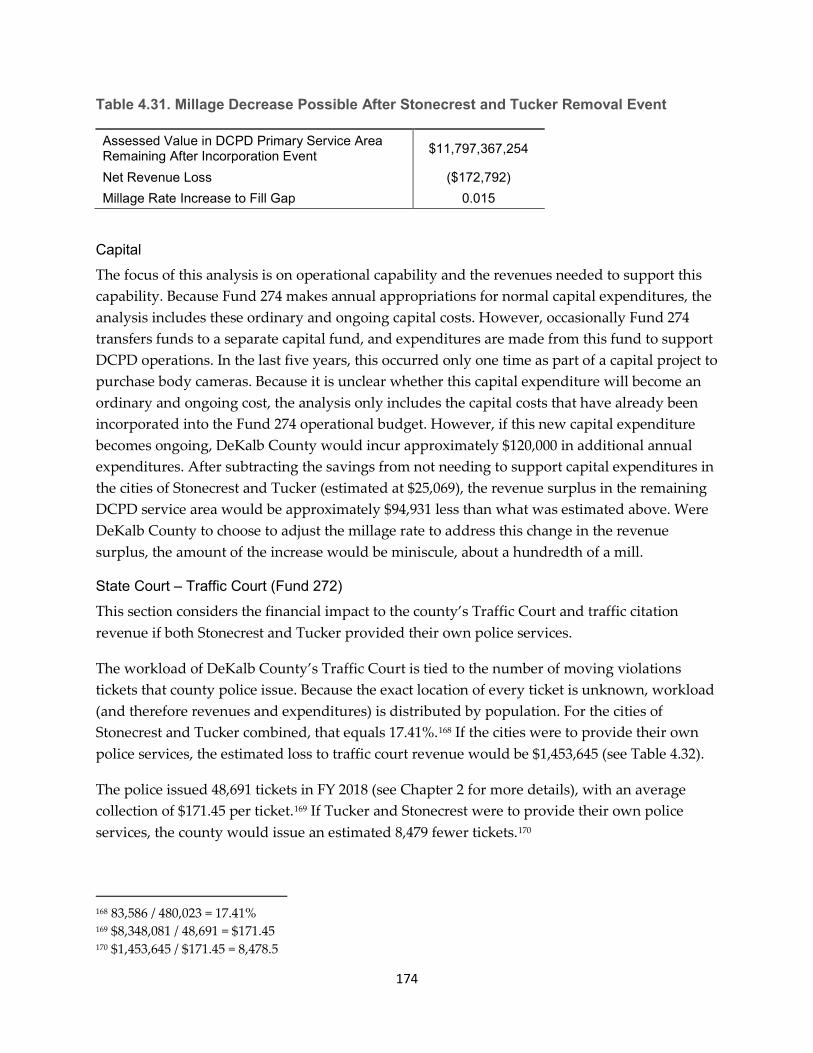
174
Table 4.31. Millage Decrease Possible After Stonecrest and Tucker Removal Event
Assessed Value in DCPD Primary Service Area Remaining After Incorporation Event $11,797,367,254
Net Revenue Loss ($172,792) Millage Rate Increase to Fill Gap 0.015
Capital
The focus of this analysis is on operational capability and the revenues needed to support this capability. Because Fund 274 makes annual appropriations for normal capital expenditures, the analysis includes these ordinary and ongoing capital costs. However, occasionally Fund 274 transfers funds to a separate capital fund, and expenditures are made from this fund to support DCPD operations. In the last five years, this occurred only one time as part of a capital project to purchase body cameras. Because it is unclear whether this capital expenditure will become an ordinary and ongoing cost, the analysis only includes the capital costs that have already been incorporated into the Fund 274 operational budget. However, if this new capital expenditure becomes ongoing, DeKalb County would incur approximately $120,000 in additional annual expenditures. After subtracting the savings from not needing to support capital expenditures in the cities of Stonecrest and Tucker (estimated at $25,069), the revenue surplus in the remaining DCPD service area would be approximately $94,931 less than what was estimated above. Were DeKalb County to choose to adjust the millage rate to address this change in the revenue surplus, the amount of the increase would be miniscule, about a hundredth of a mill.
State Court – Traffic Court (Fund 272)
This section considers the financial impact to the county’s Traffic Court and traffic citation revenue if both Stonecrest and Tucker provided their own police services.
The workload of DeKalb County’s Traffic Court is tied to the number of moving violations tickets that county police issue. Because the exact location of every ticket is unknown, workload (and therefore revenues and expenditures) is distributed by population. For the cities of Stonecrest and Tucker combined, that equals 17.41%.168 If the cities were to provide their own police services, the estimated loss to traffic court revenue would be $1,453,645 (see Table 4.32).
The police issued 48,691 tickets in FY 2018 (see Chapter 2 for more details), with an average collection of $171.45 per ticket.169 If Tucker and Stonecrest were to provide their own police services, the county would issue an estimated 8,479 fewer tickets.170
168 83,586 / 480,023 = 17.41% 169 $8,348,081 / 48,691 = $171.45 170 $1,453,645 / $171.45 = 8,478.5

175
Table 4.32. Stonecrest and Tucker Combined Traffic Court Revenue
Revenue Division Total Stonecrest &Tucker State Court Traffic $6,971,875 $1,214,007 State Court Costs $1,376,074 $239,615 Misc. Revenue $132 $23 Traffic Court Revenue $8,348,081 $1,453,645
Table 4.33 shows the estimated cost reductions and the net impact to the county in regard to traffic court if Stonecrest and Tucker began providing their own police services. As with revenues, the associated savings to the county from no longer providing traffic court services to these cities was estimated as a percentage of the population in the area, 17.41%. The estimated savings would be $927,456, which is equivalent to 8.7 FTEs.171
If Tucker and Stonecrest were to provide their own police services, the county would incur an estimated net revenue loss of $526,189. In FY 2018, Traffic Court generated excess revenue of $3,020,938 for the Unincorporated Fund (Fund 272). Fund 272 also transferred $2,775,404 to the Police Services Fund (Fund 274) that year. Therefore, the net loss of revenue from Traffic Court would undoubtedly impact the ability of Fund 272 to support police services.
Table 4.33. Stonecrest and Tucker Combined Traffic Court Net Impact
Estimated Dollars Revenue Losses ($1,453,644) Expenditure Savings $927,988 Traffic Court Net Impact ($525,656)
COMPLETE MUNICIPALIZATION OF POLICE SERVICES Impacts on Personnel and Budgets If the entire unincorporated area of DeKalb County were to be incorporated and, as a consequence, DeKalb County no longer provided police services, the impact on the county government would be substantial. More than 900 positions would be eliminated, approximately 15% of the total number of employees of DeKalb County (inclusive of enterprise fund positions).172 Similarly, eliminating Fund 274 for police services would reduce total county expenditures by over $101 million (representing approximately 8% of the total DeKalb County budget).
171 See Chapter 2 for cost per employee. 172 These figures are based on the FY2018 Budget Document (in the GOFA format) found at: www.dekalbcountyga.gov/sites/default/files/GFOA%20Budget%20Book%2007-23-2018.pdf.

176
Impacts on Capital Use In addition to the loss of staffing, the county would need to decide whether to sell or repurpose existing but no longer needed capital. This capital would consist primarily of facilities and vehicles used for police services.
Facilities
Table 4.34 shows the facilities currently used to provide police services and their appraised value. As with other publicly owned property, some of the appraised values may be less than what could be realized in a market sale. However, of greater importance, the county could have trouble obtaining the monetary value of the properties due to complicating factors. In the case of both the East and South Precinct 2 properties, the police services facility appears to be shared by other service providers, senior services in one case and fire services in the other. Similarly, the Headquarters and North Central Precinct property appears to share both use and ownership with the Judicial Facilities Authority.
Table 4.34. DeKalb County Police Facilities
East Precinct (Includes Senior Center) $1,133,700 Tucker Precinct $167,200 South Precinct $1,247,900 South Precinct 2 (includes Fire Station) $28,100 Headquarters & North Central Precinct (Co-owned by Judicial Facilities Authority) $17,950,500
East Precinct Substation No Available Data
Vehicles
The DCPD currently owns and maintains approximately 1,068 vehicles, primarily patrol cars and sport utility vehicles (SUVs, approximately 86%). The cost of vehicle replacement is integrated into the DCPD budget.
The total acquisition cost for the vehicles in service is approximately $34.3 million.
Each year, money is set aside to replace vehicles that are due for retirement in the coming year. The DCPD generally operates vehicles for 12,000–13,000 miles per year, and the Sedan Police Package vehicles have a life expectancy of almost five years. The average acquisition cost for vehicles in this category is approximately $30,000.
The value of all the vehicles in the DCPD fleet varies somewhat from year to year due to cycles in vehicle purchases as well as acquisition and replacement costs. To estimate the average value of DCPD’s stock of vehicles, the Institute of Government researchers assumed a five-year life expectancy for vehicles, with a fifth of the vehicle stock being replaced each year. The research

177
team used depreciation rates established by the Bureau of Standards that are specific to police vehicles. Based on these assumptions, the DCPD vehicle stock is valued at approximately $19.4 million.173
Impacts on Service Delivery The de-establishment of a DeKalb County Police Department would not necessarily mean a decrease (or increase) in the employment of police officers and resources in the geographic areas of interest for this study. However, it would likely translate into much less specialization of police services as well as the potential elimination of highly specialized and expensive services that are difficult to justify in smaller jurisdictions. Units most likely to be affected by this scaling down of police services would include the Bomb Unit and the Aerial Unit. Other units such as Gangs, Vice, SWAT, and K-9 as well as the various tactical traffic units operated by the DCPD could also be affected. In place of these specialized units, police services would likely resemble those of a city such as Dunwoody, which is organized around only two divisions, a Uniform Division and an Administrative Services/Criminal Investigation Division. Within the Dunwoody force, which employs 76 officers and civilians, only one employee appears to be in a specialist position, a narcotics officer (see Figure 4.1).
173 US Department of Commerce, National Bureau of Standards. 1978, April. The Police Patrol Car: Economic Efficiency in Acquisition, Operation, and Disposition. Retrieved from www.ncjrs.gov/pdffiles1/digitization/41026ncjrs.pdf.

178
Figure 4.1. Dunwoody Police Department Organizational Chart
If complete municipalization of DeKalb County were to occur and this prognosis for the delivery of police services by smaller municipal jurisdictions is correct, then public officials and law enforcement providers would face difficult choices. They would need to assess whether the community as a whole would benefit from the funding and delivery of the more specialized and expensive services that are currently being provided by the DCPD to wide areas of the community through the nonbasic police service option that is used by a number of cities in the county.
The provision of specialized services presents an organizational dilemma common with public goods: the free-rider problem. That is, once a good or service is provided, often those who choose not to fund it will nevertheless benefit from it. The Bomb Unit and Aerial Unit services are a prime example. Imagine that someone calls in a bomb threat on a school in Brookhaven. It is unlikely that the DCPD would refuse to send the Bomb Unit to deal with the threat even if Brookhaven has not contributed to the service. DCPD and the Bomb Unit currently face this practical problem of trying to exclude a community from the service with regard to the

179
Mercedes-Benz Stadium in Atlanta for large events. Similarly, it would not matter where a child is abducted when deploying the Aerial or SWAT Units in an effort to recover the child.
As these cases suggest, the current model of funding some specialized services through cities’ voluntary participation in the funding and delivery of the service may not be optimal, particularly as cities’ perceived need for such services can vary over time. A more ideal funding and service delivery model might involve identifying services that the municipalities are truly not in a position to provide but that would still be valuable to the county as a whole. These services could then be funded by the county’s General Fund and provided countywide. Likely, only very specialized services would meet these criteria. Some services, such as the Bomb Unit, might in fact be best provided at an even larger scale, across multiple counties.
Sheriff
All counties in Georgia have a sheriff. By virtue of state law, all sheriffs have countywide law enforcement authority regardless of city limits. Because sheriffs are countywide officers, they are funded by the General Fund. Thus, if the county is fully incorporated by cities with their own in-house police services, it could be beneficial to transfer specialized police services to the control and operation of the sheriff and abolish the county police department. As an elected countywide official, the sheriff is directly answerable to the electorate and may have some insulation from complaints from various sections of the county about whether a particular service is needed.
Pensions DeKalb County currently has unfunded pension liabilities that total over $1 billion ($1,082,200,800). The funded portion of the pension obligation is approximately 54.27% (on an actuarial value of assets basis). This proportion is substantially below what is considered to be best practice for funding pensions. This unfunded pension liability figure includes all of the pensions being funded from all of the funds established by DeKalb County. Identifying the exact pension liability for Fund 274 is beyond the scope of this study as it would require a separate actuarial study. However, the research team used available data on the number of active participants in the DeKalb County pension program to roughly sketch out the potential size of such liability. The first step was to identify the proportion of active participants in the program funded through Fund 274 who had pension earnings in 2018. This percentage was calculated to be approximately 13.04%. (Similarly, the percentage of total pension earnings in 2018 by the DCPD was approximately 14.62%.)
Based on the percentage of active Fund 274 pension participants, a rough estimate of the total pension unfunded liability for Fund 274 is approximately $141,171,763.
Were all police services to be municipalized, this liability would continue. However, with complete municipalization of police services, Fund 274 would not be needed other than for

180
paying the pensions of retired police officers. Thus, DeKalb County would have the choice of continuing Fund 274 for this purpose or moving the pension liability to the General Fund.
One of the challenges of the county choosing to maintain Fund 274 for the sole purpose of funding pension liabilities is that the mix of revenues available to support Fund 274 would be less diverse than at present. This de-diversification would occur because the fund would no longer have access to revenues from sources such as insurance premiums, taxes, business license fees, police charges and fees, or excise taxes. Consequently, the only potential remaining revenue sources would be those associated with special service district property taxes. Relying on these taxes would likely be problematic because current law obligates only those cities that choose to participate (in basic or nonbasic or both police services) to pay them. Given that the property tax would likely be seen as double taxation by these cities, few if any would likely participate.
The other funding choice — moving pension liability to the General Fund — has its own challenges. Specifically, this approach could potentially be viewed as unfair by cities that operated their own police departments during the period when the DCPD pension liability was being incurred.
Confiscated Assets The vast majority of expenditures for police services provided by the DCPD are made through Fund 274 and the General Fund, but approximately 1% of expenditures in FY 2018 were made through a Law Enforcement Confiscated Assets Fund. That year, this fund received assets valued at approximately $1.4 million. The majority of these monies were from the federal Justice and Treasury Departments. The following are the specific amounts:
State: $377,948.27
Federal (Justice and Treasury): $1,040,930.26
These expenditures were not included in the analysis of police service expenditures for a few reasons: First, these revenues vary significantly from year to year. Second, there is legislative movement at both the state and federal levels to reform asset forfeiture procedures. Such legislation could severely limit the availability of these funds. Third, asset forfeiture typically occurs in relation to drug crime investigations and seizures. Unfortunately, it is difficult to predict when and where such investigations and seizures will occur, so allocating these revenues to specific geographic areas can be problematic. Finally, an examination of the expenditures made from this fund suggests that the revenues tend to be spent primarily on support goods and services such as equipment and training rather than on direct service operations.

181
Capital Expenditures This study focuses on identifying the common resources needed for the DCPD to provide daily law enforcement services in its service area. The fact that the DCPD incorporates common capital costs into its annual operational budget helps to simplify the analysis. Nevertheless, the DCPD engaged in one capital project in the last five years, which involved the purchase of body cameras for officers. The cost was $600,000, and the purchase was made in 2015. A DCPD representative indicated that in the future body cameras would likely be treated like other capital expenditures, acquired via a yearly allocation for expected replacement costs according to a lifecycle cost.

182
Chapter 5. Annexation
A final issue discussed by DeKalb County representatives when setting the parameters for this study was the possibility that cities might “cherry-pick” areas for annexation that have strong tax bases and low service demand.174 Urbanized county governments in Georgia have raised this as an issue with potential impact akin to new incorporation. Essentially, county governments are concerned about the same possible service displacement that can occur with territory becoming part of a new municipality. In other words, if areas that generate more revenue for a county providing a service than they cost in expenditures on those services are “municipalized,” either through being included in a new city or through annexation into an existing one, there is a negative impact on county finances.
City representatives have identified several reasons why focusing on this one aspect of annexation (and by extension incorporation of new cities) does not capture the full complexity of the issue and therefore all of the potential merits of municipalization. Cities often provide a higher level of service than counties, and the desires of property owners and residents to enjoy these should be afforded a high degree of deference given that local government exists to serve people and not the other way around. Higher levels of service provided by cities can often raise property values and cause annexed areas to generate more revenue for counties from remaining county levies that fund countywide services. These points are discussed further below.175
Early in the discussion of this topic, a county representative proposed that the Institute of Government research team explore the policy concept of “balanced annexation,” defined as encouraging that any proposed annexation include varying types of commercial and residential properties. There was also a desire for the research team to discuss how to ensure appropriate service investments in areas that might be annexed. In other words, proponents of this area of inquiry wanted to see annexations that extend city service delivery, not merely improve the annexing city’s fiscal bottom line. In these early discussions, relatively large annexations within the last decade by the City of Chamblee were pointed to as examples of responsible, balanced annexations that married revenue-producing commercial areas with service-demanding residential areas.
174 Annexation was contemplated as “research area 2” in the work plan adopted by the steering committee. This chapter is placed toward the end of the report because discussion and analysis of the topic demand a somewhat more qualitative analysis than the specific incorporation impact scenarios explored in the earlier chapters. 175 For further elaboration on the merits and challenges associated with municipal annexation, see Paula Steinbauer et al. 2002. Annexation in Georgia and across the United States. Athens, GA: Carl Vinson Institute of Government, University of Georgia.
183
This report uses the term “budget-neutral annexation,” a concept that implies that a city will not incur a net revenue gain from annexation, assuming no changes in tax rates or service levels from the status quo. This chapter presents the benefits and challenges to the budget-neutral annexation concept as well as possible examples of how it could be practically implemented. Because the City of Chamblee has been praised by elected officials representing cities within DeKalb County as a good example of budget-neutral annexation, this chapter reviews some the circumstances and tax data around two of its annexations.
TWO CHAMBLEE ANNEXATIONS In 2010, following several years of citizen-led campaigns in support of annexation, the Georgia General Assembly passed legislation calling for a referendum on annexation of the Huntley Hills area into the City of Chamblee.176 Voters in the area, located north of the then-existing city limits to I-285 along the borders of Dunwoody and Doraville, approved the annexation, which became official on January 1, 2011. The annexation increased Chamblee’s population from approximately 12,500 to approximately 18,000. City leaders at the time predicted that the budgetary impact would be a break-even proposition, citing the need to hire 12 new police officers as expenses that would offset revenues.177
The legislature again passed legislation in 2013 placing an annexation referendum on the ballot that would expand the City of Chamblee’s southern border on Clairmont Road to I-85. The measure, as proposed, would have increased the size of the city from 4.8 square miles to 7.8 square miles and increased the population by approximately 11,000 people. Between the passage of the legislation and the holding of the election in November, however, the neighboring City of Brookhaven approved a petition from a property owner to annex Century Center, a large commercial area included in the footprint of the proposed annexation.178 Litigation ensued and leadership for the City of Chamblee pointed out that loss of the commercial territory would jeopardize plans to invest $2.5 million annually for the next five years for the city police department.179 Voters approved the annexation, and the Court of Appeals found in favor of Chamblee, allowing the commercial area to be annexed into Chamblee, along with the rest of the proposed area, rather than Brookhaven.180
176 House Bill 1122 in 2010. 177 See April Hunt. 2010, October 28. “Chamblee Annexation Could Create Tri-Cities Area in DeKalb.” Atlanta Journal-Constitution. Retrieved from www.ajc.com/news/local/chamblee-annexation-could-create-tri-cities-area-dekalb/sjzA3vdidzSsansnpLZcNI/. 178 See City of Brookhaven v. City of Chamblee, 329 Ga. App. 346 (2014). 179 See Melissa Weinman. 2013, October 19. “Chamblee Voters Prepare for Annexation Referendum.” Reporter Newspapers. Retrieved from www.reporternewspapers.net/2013/10/19/chamblee-voters-prepare-annexation-referendum/. 180 See City of Brookhaven v. City of Chamblee, 329 Ga. App. 346 (2014).

184
Table 5.1 demonstrates how the annexations affected the City of Chamblee’s tax base. The years in which the two large annexations were effective are shaded gray.
Table 5.1. City of Chamblee Tax Digest, 2007–2014
Year Parcels Gross Digest Commercial Residential Industrial 2007 2425 $595,780,127 $299,172,057 $149,593,677 $118,125,663 2008 2518 $592,079,775 $293,385,075 $154,339,117 $116,364,453 2009 2517 $601,984,537 $299,358,165 $161,204,158 $114,533,622 2010 2530 $574,771,792 $291,212,916 $155,281,006 $104,167,919 2011 4069 $822,847,537 $389,792,572 $259,779,634 $148,051,740 2012 4326 $762,107,298 $357,948,828 $232,170,012 $140,783,962 2013 4314 $760,773,454 $350,047,947 $233,262,332 $140,264,686 2014 6693 $1,025,363,535 $457,906,451 $374,389,672 $158,968,342
*Gross digest figures include the value of utility property and motor vehicles, not listed here. Looking at tax digest data for the areas annexed and comparing the makeup of these areas to the city’s tax digest makeup is also instructive (see Tables 5.2 and 5.3).
Table 5.2. Strength of Residential Component in the Annexed Areas
Year Commercial Residential Industrial
Ratio of Residential to Commercial +
Industrial 2011 $98,579,656 $104,498,628 $43,883,821 0.734 2014 $107,858,504 $141,127,340 $18,703,656 1.115
Note: Assessed values equal annexation year value minus prior year value
The higher the ratio of residential to commercial and industrial property within a particular area, the more residential that area is. Higher ratios also signal more service needs and less revenue-producing property relative to service demand.
Table 5.3. Ratio of Residential to Commercial and Industrial Property in the City of Chamblee in the Years Immediately Prior to and During Effective Year of Annexations
Year Commercial Residential Industrial
Ratio of Residential to Commercial +
Industrial 2010 $291,212,916 $155,281,006 $104,167,919 .39 2011 $389,792,572 $259,779,634 $148,051,740 .48 2013 $350,047,947 $233,262,332 $140,264,686 .48 2014 $457,906,451 $374,389,672 $158,968,342 .61

185
Table 5.3 shows that although the overall digest increased for each major category of property — commercial, residential, and industrial — the percentage of the tax digest from residential increased. In 2010, before the first large annexation, the ratio of residential property to commercial and industrial was .39. In 2014, when the second large annexation became effective, the ratio of residential property to commercial and industrial was .61. Thus, both annexations diluted the share of commercial and industrial property compared to the share of residential in the city’s tax base. It is hard to say based on these numbers that the city cherry-picked commercial and industrial properties in an inequitable manner.
Table 5.4 shows Chamblee’s property tax millage rate and its revenues and expenditures during the time of the annexations.
Table 5.4. City of Chamblee Property Tax Rates for Years 2010–2015
Year Property Tax Millage Rate Revenues Expenditures
2010 7.95 $10,910,780 $8,404,776 2011 7.40 $13,223,503 $9,792,456 2012 7.40 $14,091,299 $10,749,770 2013 6.40 $13,380,245 $11,548,512 2014 6.40 $18,403,162 $14,961,581 2015 6.40 $20,864,313 $16,759,638
Data on tax millage rates was retrieved from the Georgia Department of Revenue Consolidated Tax Digest website. See apps.dor.ga.gov/digestconsolidation/default.aspx. Data on revenues and expenditures was retrieved from the Carl Vinson Institute of Government Tax and Expenditure Data Center, see ted.cviog.uga.edu/. Other than a 1 mill decrease from 2012 to 2013, the second year of the two-year period between the large annexations, the city’s property tax millage rate has remained static. As expected, the overall size of the city’s budget increased along with the increasing footprint of the city. The difference between the amount of annual revenues and expenditures has remained fairly consistent, as well. It is hard to gauge the level of the expansion of city services and citizen satisfaction with city service provision without further data, but the financial information suggests that the Chamblee annexations were fairly budget neutral.
Table 5.5 shows the tax digest of the unincorporated area of DeKalb County just prior to the two annexations. Comparing these data to those in Tables 5.2 and 5.3 reveals that the ratio of residential to commercial and industrial property in unincorporated DeKalb was higher than in the annexed areas, and higher than that of the City of Chamblee, both before and after the annexations.181
181 Note that the overall numbers for the unincorporated area decrease by more than the annexations into Chamblee would account for. The City of Brookhaven was incorporated in 2012; thus, our focus is not on

186
Table 5.5. Strength of Residential Component in Unincorporated DeKalb Prior to Annexations
Year Commercial
Digest Residential
Digest Industrial
Digest Ratio of Residential to
Commercial + Industrial 2010 $4,753,114,617 $11,864,535,712 $960,614,331 2.076 2013 $3,745,344,698 $6,331,511,671 $829,292,441 1.384
Thus, even though the annexations appear to have been fairly budget neutral to the city, the impact on the unincorporated area was not necessarily equally neutral.
When expanding the implications of this example to a broader policy realm, a variety of factors must be considered. Municipal and county services and levels of service should be taken into account when contemplating public policy around annexation. Cities, even those located in urbanized counties, often provide a higher level of service than counties. Even though state law in Georgia was changed years ago to allow counties to provide municipal services, state law and policy embodied in the Service Delivery Strategy Act recognizes that this higher level of service is not to be viewed as duplication of service provision.182 In places like DeKalb County, the potential financial impact on the county is driven by the fact that they are in “service competition” with cities that annex. In other words, there is only impact because the county is providing a service partially funded from the area to be annexed that will be displaced by the annexation, and the revenue the county receives for providing the service in this area is greater than the cost of provision. In addition to revenue related directly to service provision, several other streams of revenues are collected by either city or county governments according to simply whether territory generating the revenue is located inside city limits or in the unincorporated area. For example, state law allows local governments to levy a bank shares tax on financial institutions located in their jurisdictions. Expenditure of this revenue is undesignated, meaning it may be spent by the collecting local government as it sees fit.
Another way in which annexation can potentially affect county finances is related to zoning and land use. If zoning in a newly annexed area allows for more intense land use than was possible before annexation, any services that the county continues to provide in the area could be affected. For example, if a city were to allow multifamily housing in an area the county had zoned for single family, this more intense municipal use could strain county water and sewer capacity if the county continues to provide that service. This consideration underlies the current annexation dispute resolution process, enacted in 2007, that allows counties to object to annexations that create a “material increase in burden” on the county.183 The issue was
the ratios of residential to commercial and industrial but rather the overall size of the unincorporated digest. 182 See O.C.G.A. § 36-70-24(1). 183 See O.C.G.A. § 36-36-113.

187
considered complex enough and subject to enough unique factors that the process provides for an evidentiary hearing before a panel of arbitrators.184
It has been suggested by some that higher service levels in cities can help raise property values. This could be difficult to prove given the multiple market factors that impact real estate value. If true, however, it creates the potential for county governments to collect more taxes (those based on property value) from annexed areas for the services that continue to be funded countywide.
Challenging obstacles to creating budget-neutral criteria for annexation include the nature of how cities have developed. Often cities were created around central commercial or industrial hubs, and annexations generally take place at the periphery of cities. Although those annexed areas are unlikely to be as commercially and industrially dense as the annexing city as a whole, they are likely to be urbanized enough (or more than the rest of the unincorporated area) that they may desire a higher level of municipal service.
Finally, note that the Chamblee annexations were distinct in that they were accomplished via statutes passed by the state legislature, albeit acts that required approval at the polls. The overwhelming majority of annexations in Georgia are achieved via petitions filed by property owners or voters seeking to be annexed into an adjacent city. When property owners drive the process, the areas to be annexed in any one petition are likely to have minimal financial impact on the county. Furthermore, because such annexations are property owner– or citizen-driven, it would be quite difficult to impose any concept of balancing the commercial, residential, or industrial tax base of the annexation. The city is stuck reacting to what has been proposed. Only annexation of “unincorporated islands” that existed prior to January 1, 1991 may be unilaterally annexed by a city in Georgia.185 All other forms of local annexation require some type of request or consent from property owners or voters or both.186
Thus, imposing any kind of budget-neutral annexation criteria would create a new level of analysis for many now locally driven actions. Concepts of budget-neutral annexation may, as a practical matter, be limited to larger annexations that take place through the state legislative process.
184 See O.C.G.A. § 36-36-113, et. seq. 185 See O.C.G.A. § 36-36-90. 186 See O.C.G.A. Title 36, Chapter 36.

188
Appendix A – Revenue Allocation Formulas
The following tables briefly explain how each type of revenue that DeKalb County collects was allocated to one of the three areas under review. The data are presented by department and include both primary revenue sources that support operating expenditures and revenues from special revenue funds when applicable. A department or division would have an affiliated special revenue because either staff perform the work for that special revenue or the county has designated the special revenue to support the service. Total revenue collection in FY 2018 from the following funds totaled $180,271,523.
GENERAL TAX FUNDS • Fund 271 – Designated Services (includes revenues associated with the Department of
Recreation, Parks, and Cultural Affairs and the Divisions of Roads & Drainage and Transportation within the Department of Public Works)
• Fund 272 – Unincorporated Services (includes “undesignated” revenues for the unincorporated area only and revenues associated with the Divisions of Business Licenses and Current Planning within the Department of Planning and Sustainability and Traffic Court within State Court). The revenues in Fund 272 exceed the operating expenditures for the services located in this fund. The county annually transfers revenue from Fund 272 to Funds 271 and 274 as a supplement.
• Fund 274 – Police Services (includes revenues assigned to the Police Department)
SPECIAL REVENUE FUNDS To manage revenues and expenditures for one type of revenue
• Fund 201 – Development Charges and Fees • Fund 205 – Foreclosure and Vacant Property Registry • Fund 207 – Recreation Revenues • Fund 211 – Street Lights Assessment • Fund 212 – Speed Hump Assessment • Fund 275 - Hotel/Motel Tax • Fund 280 – Rental Car Tax
A full discussion of DeKalb’s accounting fund structure is provided in Chapter 2, Summary of Current Services and Revenues.

189
FUND 271 AND AFFILIATED SPECIAL REVENUE FUNDS
Revenue Allocation Methods for Recreation, Parks, and Cultural Affairs
Revenue FY 18 Total
Fund
Allocation Methodology1
Real Property Taxes $13,394,509 271 Property taxes assessed – Tax Commissioner Prop. Taxes – Prior Year $563,597 271 Percent assessed value (AV) of real property Personal Property Taxes $924,830 271 Percent AV of commercial property Public Utility Taxes $473,532 271 Percent AV of utility property Mobile Home Taxes $647 271 Percent AV of mobile home property Motor Vehicle Taxes2 $429,143 271 Per capita unincorporated area Intangible Recording Tax $261,663 271 Percent AV of real property Energy Excise Tax $2,830 271 Percent AV of industrial property HOST $1,399,742 271 No impact Department Programs $360,624 271 Percent participation by recreation center Recreation Programs $902,410 2073 Revenue from specific recreation center Nonresident Dept. Prog. $18,062 271 Percent participation by recreation center Concessions $28,306 271 Revenue specific to Browns Mill Rec. Ctr. Swimming Pool4 $367,465 271 Revenue by pool Golf Course Fees $20,048 271 Revenue by golf course Tennis Center Fees $43,245 271 Revenue by tennis center Rental – Other/Tennis Ctr. $31,050 271 Revenue by tennis center Rental – Other/Pavilions $48,682 271 Percent of pavilions in parks Fees – Porter Sanford $62,652 271 Various revenues from Porter Sanford Other Miscellaneous $6,791 271 Percent participation by recreation center Returned Check ($2,316) 271 Percent participation by recreation center Rental Car Tax Fund5 $522,178 280 Location of car rental businesses Investment Income $20,999 271 Percent change of revenue – all other sources Subtotal $19,880,689
1. Includes unincorporated area and Stonecrest. In April of 2018, Tucker assumed responsibility for parks and recreation services. The county refunded Tucker $1,763,630 for excess parks property taxes paid by residents. Reductions to real, personal, and motor vehicle taxes were made proportionally to Tucker’s portion of the respective tax categories of assessed value. The county did not collect motor vehicles taxes from Stonecrest in FY 2018 (per Budget Office data).
2. Fund 207 is a special revenue fund dedicated to recreation services. No permanent personnel are paid through this fund. Within this fund, revenues are specified by specific cost centers (i.e., recreation centers). For three revenue line-items, revenues are distributed based on the type of participant at each recreation center: youth sports/number of youth participants, senior citizens program/number of senior participants, and athletic special events/number of total participants.
3. Includes pool admission fees, rentals, and lessons. 4. Revenue from the Rental Car Tax Fund supports the Porter Sanford Performing Arts Center; $522,178 reflects
total revenue collected for FY 2018, but the amount of money actually transferred to Fund 271 (Parks and Recreation) equaled $487,000.

190
Revenue Allocation Methods for Roads and Drainage and Transportation
Revenue FY 18 Total
Fund
Allocation Methodology1
Real Property Taxes $9,739,838 271 Property taxes assessed – Tax Commissioner Prop. Taxes – Prior Year1 $367,352 271 Percent assessed value (AV) real property Personal Property Taxes1 $723,506 271 Percent AV of commercial property in Public Utility Taxes $308,648 271 Percent AV of utility property Mobile Home Taxes1 $422 271 Percent AV of mobile home property Motor Vehicle Taxes2 $299,257 271 Per capita unincorporated area Intangible Recording Tax1 $170,552 271 Percent AV of real property Energy Excise Tax $1,845 271 Percent AV of industrial property HOST $912,352 271 No impact Parking Lost Assessment $20,862 271 Percent center-lane miles Retention Pond Fees $3,283 271 Percent center-lane miles Stormwater Utility Transfer $952,220 271 Percent of stormwater fees paid Sale of printed material $25 271 Per capita Residential Parking Permit $2,070 271 Specific data from department Investment Income $14,662 271 Percent change of revenue – all other sources Street Lights Assessment $4,664,031 211 Fees from Tax Commissioner2 Speed Hump Assessment $312,106 212 Charges to specific areas Subtotal $18,493,031
1. In FY 2018, the service area for Roads and Drainage and Transportation included the unincorporated area and the cities of Tucker and Stonecrest. Therefore, all percentages include values for these three areas.
2. The streetlight revenue provided by the Tax Commissioner for this area did not sum to the total collections presented by the Budget Office. Therefore, using the Tax Commissioner’s data, the proportion of revenue from each area was multiplied by the total collection amount given by the Budget Office.

191
REVENUES WITHIN FUND 272 AND AFFILIATED SPECIAL REVENUE FUNDS Nondesignated revenues are those the county collects solely in the unincorporated area and are not affiliated with a specific service. Except for the Bank Shares Tax, state law does not allow the county to collect these revenues in incorporated areas.
Revenue Allocation Methods for Nondesignated Revenues
Revenue
FY 2018 Total
Fund
Allocation Methodology
Beverage Taxes $3,088,362 272 Percent of alcohol licenses Bank Shares Taxes $903,863 272 No impact Cable Franchise Fee $5,425,127 272 Per capita Hotel/Motel Fund1 $734,473 275 Location of hotels and motels
Miscellaneous $29,481 272 Per capita – classified as nondepartmental
Subtotal $11,181,306 1. The county’s one full-service hotel is weighted five times more than the other establishments. Weighting was
based on the differential in business license revenue. The distribution of Hotel/Motel taxes is as follows: 37.5% is transferred to support the Porter Sanford Performing Arts Center and other tourism, 18.75% for capital improvement projects, and 43.75% to support the Convention and Visitors Bureau. If revenues decline, the percentage distribution remains unchanged.
Revenue Allocation Methods for Keep DeKalb Beautiful and Code Compliance1
Revenue
FY 2018 Total
Fund
Allocation Methodology
Transfer General Fund $115,000 272 One-time revenue from rent from DFACS assigned to Beautification; no impact
Magistrate Court $924,944 272 Same as percent of expenditures Foreclosure Fees $15,600 205 Percent assessed value of vacant property Vacant Property Fee $21,600 205 Percent assessed value of vacant property Subtotal $1,077,144
1. In FY 2018, the Division of Keep DeKalb Beautiful and Code Compliance were within the same department, Beautification, and thus the revenues are presented together here.
Note: DFACS = Georgia Division of Family and Children Services

192
Revenue Allocation Methods for Business Licenses
Revenue
FY 2018 Total
Fund
Allocation Methodology
Beverage Licenses $664,696 272 Location of licensee Business Licenses – General
$8,060,815 272 Location of licensee
Business Licenses – Adult $125,000 272 Percent alcohol business license revenue Miscellaneous Revenue $75 272 Percent general business licenses revenue Returned Check ($174,242) 272 Percent general business licenses revenue Subtotal $8,676,344
Revenue Allocation Methods for Current Planning
Revenue
FY 2018 Total
Fund
Allocation Methodology
Zoning Fees $52,276 272 Location of property Variance Permits $37,845 272 Location of property Miscellaneous Revenue $365 272 Average of percentages of zoning and variance
permit revenue Subtotal $90,486
Revenue Allocation Methods for Traffic Court
Revenue
FY 2018 Total
Fund
Allocation Methodology
State Court Traffic $6,971,875 272 Per capita State Court Costs $1,376,074 272 Per capita Miscellaneous Revenue $132 272 Per capita Subtotal $8,348,081
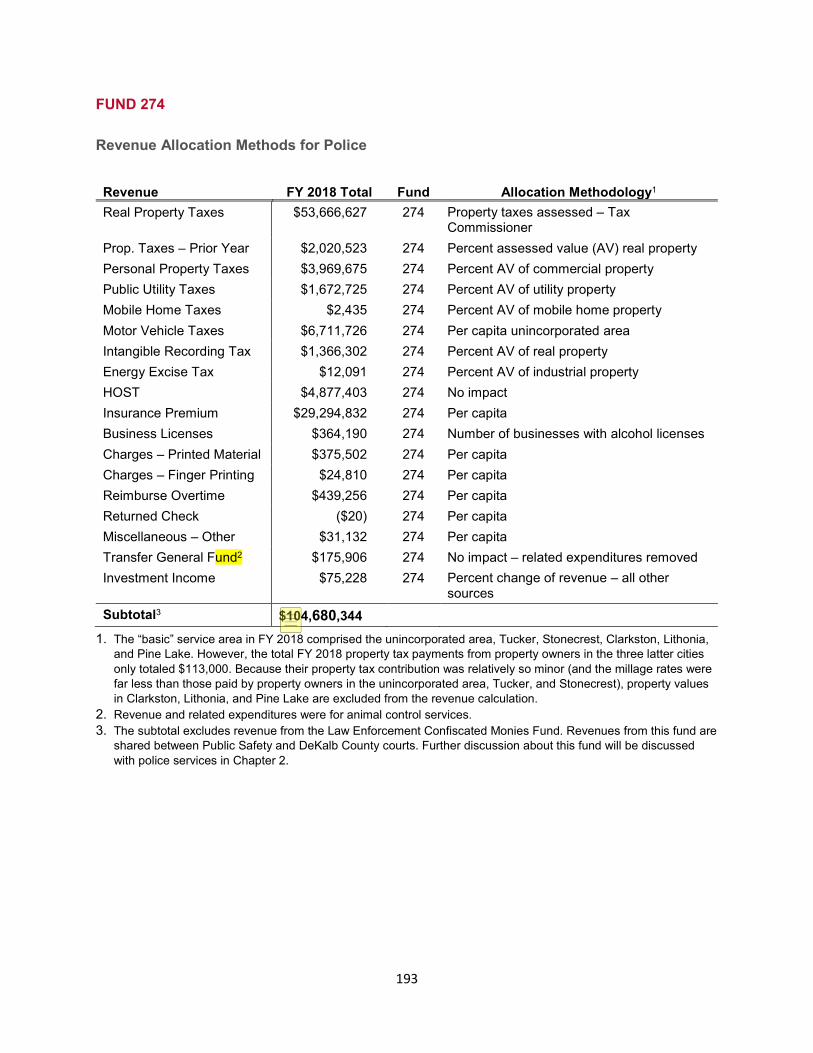
193
FUND 274
Revenue Allocation Methods for Police
Revenue FY 2018 Total
Fund
Allocation Methodology1
Real Property Taxes $53,666,627 274 Property taxes assessed – Tax Commissioner
Prop. Taxes – Prior Year $2,020,523 274 Percent assessed value (AV) real property Personal Property Taxes $3,969,675 274 Percent AV of commercial property Public Utility Taxes $1,672,725 274 Percent AV of utility property Mobile Home Taxes $2,435 274 Percent AV of mobile home property Motor Vehicle Taxes $6,711,726 274 Per capita unincorporated area Intangible Recording Tax $1,366,302 274 Percent AV of real property Energy Excise Tax $12,091 274 Percent AV of industrial property HOST $4,877,403 274 No impact Insurance Premium $29,294,832 274 Per capita Business Licenses $364,190 274 Number of businesses with alcohol licenses Charges – Printed Material $375,502 274 Per capita Charges – Finger Printing $24,810 274 Per capita Reimburse Overtime $439,256 274 Per capita Returned Check ($20) 274 Per capita Miscellaneous – Other $31,132 274 Per capita Transfer General Fund2 $175,906 274 No impact – related expenditures removed Investment Income $75,228 274 Percent change of revenue – all other
sources Subtotal3 $104,680,344
1. The “basic” service area in FY 2018 comprised the unincorporated area, Tucker, Stonecrest, Clarkston, Lithonia, and Pine Lake. However, the total FY 2018 property tax payments from property owners in the three latter cities only totaled $113,000. Because their property tax contribution was relatively so minor (and the millage rates were far less than those paid by property owners in the unincorporated area, Tucker, and Stonecrest), property values in Clarkston, Lithonia, and Pine Lake are excluded from the revenue calculation.
2. Revenue and related expenditures were for animal control services. 3. The subtotal excludes revenue from the Law Enforcement Confiscated Monies Fund. Revenues from this fund are
shared between Public Safety and DeKalb County courts. Further discussion about this fund will be discussed with police services in Chapter 2.
Karen
These add up to $105,080,343 (but the number here does match the number on p. 61 and on p. 64.

194
FUND 201
Revenue Allocation Methods for Development
Revenue
FY 2018 Total
Fund
Allocation Methodology
Certificate of Occupancy $270,703 201 Percent of building inspection revenue Sign Permits $25,809 201 Location of permit Variance Permits $5,031 201 Percent of building inspection revenue Development Permits $378,814 201 Percent of building inspection revenue Subdivision Registration $45,573 201 Percent of building inspection revenue Building Inspections $6,703,208 201 Location of inspection fee Sale of Printed Material $6,996 201 Percent of building inspection revenue NPDES Fees $8,162 201 Percent of building inspection revenue Technology Fees $399,803 201 Percent of building inspection revenue Subtotal $7,844,098
Note: NPDES = National Pollutant Discharge Elimination System

195
Appendix B. Revenue Definitions
Recreation, Parks, and Cultural Affairs
Revenue Definition Real Property Tax Assessed on land, buildings, and permanent improvements less
$1,548,467 due to transfer of park assets to City of Tucker2 Real Property Tax – Prior Year Collections from property taxes assessed in previous fiscal year Personal Property Tax Assessed on equipment, inventories, boats, and airplanes. Includes
current and prior year revenues less $185,181 due to transfer to Tucker
Public Utilities Tax Ad valorem tax on utilities Mobile Home Taxes Property tax on mobile homes Motor Vehicle Tax Assessed on the value of motor vehicles, TAVT “true up,” and heavy
equipment. Revenue reduced by $29,982 due to transfer to Tucker Intangible Recording Tax Tax on long-term real estate notes and real estate transfers.
Distributed to parks based on percentage of property taxes affiliated with service
Energy Excise Tax Excise tax on energy used in manufacturing Homestead Option Sales Tax Remaining revenues from this abolished tax. Property taxes or
reduced spending will be required to compensate for lost revenue Department Programs Charges for departmental programs Recreation Programs Charges for recreation programs in Fund 207 Non-Resident Dept. Programs Charges for departmental programs for those who live out of county Concessions Sales from food and drinks specific to Browns Mill Swimming Pool Entrance fees, lessons, rentals Golf Course Green fees and other fees Tennis Center Fees Tennis charges and Mason Mill rental charges Rental – Other/Tennis Center Rental charges affiliated with tennis centers Rental – Other/Pavilions Rental charges from park pavilions Miscellaneous – Other Revenues that are not appropriate for other revenue classifications
per the Uniform Chart of Accounts for Local Governments in Georgia
Returned Checks Reductions in revenue Rental Car Tax Fund Tax assessed on rental of vehicles transfer to Fund 271 Investment Income Earnings from fund balance
1. All revenues are from Fund 271 unless otherwise indicated 2. In FY 2018, DeKalb refunded the City of Tucker $1,763,630 because the City assumed ownership and
maintenance of the parks and recreation facilities within its geographic boundaries. This revenue has been removed from the table.

196
Roads and Drainage and Transportation1
Revenue Definition Real Property Taxes Assessed on land, buildings, and permanent improvements Prop. Taxes – Prior Year1 Collections from property taxes assessed in previous fiscal year Personal Property Taxes1 Assessed on equipment, inventories, boats, and airplanes. Includes
current and prior year revenues Public Utility Taxes Ad valorem tax on utilities Mobile Home Taxes1 Property tax on mobile homes Motor Vehicle Taxes2 Assessed on the value of motor vehicles, TAVT “true up,” and heavy
equipment Intangible Recording Tax1 Tax on long-term real estate notes and real estate transfers.
Distributed to parks based on percentage of property taxes affiliated with service
Energy Excise Tax Excise tax on energy used in manufacturing Homestead Option Sales Tax Remaining revenues from this abolished tax. Property taxes or
reduced spending will be required to compensate for lost revenue Parking Lot Assessment Assessed on multifamily property with on-street parking when
county paves and stripes those areas Retention Pond Fees Fees for maintaining retention ponds in residential neighborhoods Stormwater Utility Transfer Revenue transfer to support administrative support of service Sale of printed material Charges for printed items Residential Parking Permit Charges for parking decal in resident-only parking districts Investment Income Earnings from fund balance Street Lights Assessment Charges for street lights in Fund 211 Speed Hump Assessment Charges to build speed humps in Fund 212
1. All revenues are from Fund 271 unless otherwise indicated
Nondesignated Revenues1
Revenue Definition Beverage Taxes Excise tax on alcohol Bank Shares Taxes Business license tax on financial institutions Cable Franchise Fee Franchise charge on cable TV in unincorporated area Hotel/Motel Fund Tax on hotel/motel charges. Distribution of revenue is based on
formula Miscellaneous Revenues that are not appropriate for other revenue classifications
per the Uniform Chart of Accounts for Local Governments in Georgia
1. All revenues are from Fund 272

197
Keep DeKalb Beautiful and Code Compliance Revenues1
Revenue Definition Transfer General Fund One-time revenue from rent from DFACS assigned to Beautification Magistrate Court Fines related to code compliance are held in the Magistrate Court Foreclosure Fees Assessed on foreclosed property in Fund 205 Vacant Property Fee Assessed on vacant property in Fund 205
1. All revenues are from Fund 272 unless otherwise indicated
Business License Revenues1
Revenue Definition Beverage Licenses Fee to sell alcoholic beverages in the unincorporated area Business Licenses – General Fee to conduct business in the unincorporated area Business Licenses – Adult Fee to operate and adult entertainment establishment Miscellaneous Revenue Revenues that are not appropriate for other revenue classifications
per the Uniform Chart of Accounts for Local Governments in Georgia
Returned Check Reductions in revenue 1. All revenues are from Fund 272
Current Planning Revenues1
Revenue Definition Zoning Fees Charge to rezone the zoning map Variance Permits Applicant cost for requesting variance to the zoning standard Miscellaneous Revenue Revenues that are not appropriate for other revenue classifications
per the Uniform Chart of Accounts for Local Governments in Georgia
1. All revenues are from Fund 272
Traffic Court Revenues1
Revenue Definition State Court Traffic Fines for traffic citations State Court Costs Traffic fine–related revenue Miscellaneous Revenue Revenues that are not appropriate for other revenue classifications
per the Uniform Chart of Accounts for Local Governments in Georgia
1. All revenues are from Fund 272

198
Police Revenues1
Revenue Definition Real Property Tax Assessed on land, buildings, and permanent improvements Real Property Tax – Prior Year Collections from property taxes assessed in previous fiscal year Personal Property Tax Assessed on equipment, inventories, boats, and airplanes. Includes
current and prior year revenues Public Utilities Tax Ad valorem tax on utilities Mobile Home Taxes Property taxes on mobile homes Motor Vehicle Tax Includes motor vehicle tax, TAVT “true up,” and heavy equipment Intangible Recording Tax Tax on long-term real estate notes and real estate transfers Energy Excise Tax Excise tax on energy used in manufacturing Homestead Option Sales Tax Remaining revenues from this abolished tax. Property taxes or
reduced spending will be required to compensate for lost revenue Insurance Premium Tax Tax assessed on life insurance premiums. DeKalb receives portion
based unincorporated-only population Business Licenses Fees for licensee background investigations and business permits Sale of Printed Material Charges for printed items like police reports Finger Printing Fees Charges for fingerprinting services for the public Reimburse Overtime Outside entities pay for police personnel Returned Checks Reductions in revenue Miscellaneous – Other Revenues that are not appropriate for other revenue classifications
per the Uniform Chart of Accounts for Local Governments in Georgia
Transfer from General Fund Transfer to Fund 274 for animal control services Investment Income Earnings from fund balance investments
1. All revenues are from Fund 274
Development Revenues1
Revenue Definition Certificate of Occupancy Charge for documenting building code compliance Sign Permits Fee for signage Variance Permits Charge for administrative variance for zoning Development Permits Building and trade permits Subdivision Registration For all new subdivisions Building Inspections Fees to inspect adherence to building codes Sale of Printed Material Charges for printed items NPDES Fees Stormwater discharge fees associated with construction Technology Fees Account no longer used. No definition given from department
1. All revenues are from Fund 201

199
Appendix C. DeKalb County Police Department Grants, FYs 2014–2018
2014
Grant Name Award
Amount
Funding Source Begin Date
End Date
COPS Hiring Recovery Program $1,388,397.00 US Department of Justice (DOJ) 10/01/14 08/31/17 Electronic Crimes Task Force – Secret Service $1,850.00 Secret Service 02/20/14 05/01/14 Electronic Crimes Task Force – Secret Service $750.00 Secret Service 11/14/14 01/02/15 Hazardous Materials Emergency Preparedness (LEPC)
$5,000.00 Georgia Emergency Management Agency (GEMA)
10/01/14 07/31/15
High Intensity Drug Trafficking Areas $276,156.00 Office of National Drug Control Policy 01/01/14 12/31/15 Homeland Security Grant Program $100,000.00 Georgia Office of Homeland Security 11/18/14 06/30/15 Homeland Security Grant Program $6,000.00 Georgia Office of Homeland Security 11/18/14 06/30/15 Justice Assistance Grant $31,085.00 DOJ 10/01/14 09/30/18 Metro Atlanta Multijurisdictional DUI Task Force – HEAT
$68,300.00 Governor's Office of Highway Safety 10/01/14 09/30/15
Performance Partnership Award $100,500.00 GEMA 07/01/14 06/30/15 Pre-Disaster Mitigation Program/Hazard Mitigation Assistance
$63,000.00 GEMA 07/01/14 01/09/16
Urban Area Security Initiative $ 50,000.00 Georgia Office of Homeland Security 06/20/14 OPEN Wal-Mart $ 1,500.00 Wal-Mart 08/18/14 N/A Wal-Mart $1,500.00 Wal-Mart 07/02/14 N/A Total Grant Awards 2014 $2,094,038

200
2015
Grant Name Award Amount
Funding Source Begin Date
End Date
Cardiff Model for Violence Prevention $76,000.00 CDC Foundation 01/15/15 07/14/16
Electronic Crimes Task Force – Secret Service $3,400.00 Secret Service 10/01/15 09/30/16
Hazardous Materials Emergency Preparedness (LEPC)
$6,000.00 GEMA 10/01/15 06/30/16
High Intensity Drug Trafficking Areas $276,156.00 Office of National Drug Control Policy 01/01/15 12/31/16 Homeland Security Grant Program $127,014.00 Georgia Office of Homeland Security 10/27/15 08/31/16 Homeland Security Grant Program (Canine) $6,000.00 Georgia Office of Homeland Security 10/27/15 08/31/16 Justice Assistance Grant $34,511.00 DOJ 10/01/15 09/30/19 Metro Atlanta Multijurisdictional DUI Task Force – HEAT
$68,200.00 Governor's Office of Highway Safety 10/01/15 09/30/16
Performance Partnership Award $100,500.00 GEMA 07/01/15 08/31/16 Urban Areas Security Initiative $385,198.00 Department of Homeland Security 04/01/15 OPEN Urban Areas Security Initiative $211,594.63 Georgia Office of Homeland Security 04/01/15 OPEN Urban Areas Security Initiative $660,498.50 Georgia Office of Homeland Security May-15 OPEN Urban Area Security Initiative $4,698.21 Georgia Office of Homeland Security 07/01/15 OPEN Wal-Mart $1,000.00 Wal-Mart 11/01/15 OPEN Total Grant Awards 2015 $1,960,770.34

201
2016
Grant Name Award Amount
Funding Source Begin Date
End Date
Bulletproof Vest Program $240.98 Bureau of Justice Assistance 10/01/16 08/31/18 Electronic Crimes Task Force – Secret Service $6,000.00 Secret Service 10/01/16 07/31/17 Hazardous Materials Emergency Preparedness (LEPC)
$4,000.00 Georgia Emergency Management Agency 10/01/16 08/31/17
High Intensity Drug Trafficking Areas $276,156.00 Office of National Drug Control Policy 01/01/16 12/31/17 Homeland Security Grant Program $75,000.00 Georgia Office of Homeland Security 12/01/16 08/31/17 Homeland Security Grant Program $6,000.00 Georgia Office of Homeland Security 12/01/16 08/31/17 Metro Atlanta Multijurisdictional DUI Task Force – HEAT
$69,707.83 Governor's Office of Highway Safety 10/01/16 09/30/17
Performance Partnership Award $100,500.00 Georgia Emergency Management Agency 07/01/16 06/30/17 Urban Area Security Initiative $48,340.87 Georgia Office of Homeland Security 03/08/16 OPEN Urban Area Security Initiative $14,327.50 Georgia Office of Homeland Security 03/08/16 OPEN Total Grant Awards 2016 $600,273.18

202
2017
Grant Name Award
Amount
Funding Source Begin Date
End Date
Digital Evidence $100,000.00 National Institute of Justice (DOJ) 01/01/17 12/31/18 Electronic Crimes Task Force – Secret Service $6,000.00 Secret Service 01/03/17 07/31/17 High Intensity Drug Trafficking Areas $276,156.00 Office of National Drug Control Policy 01/01/17 12/31/18 Homeland Security Grant Program – Explosive Ordinance Disposal
$75,000.00 Georgia Office of Homeland Security 10/01/17 10/31/18
Homeland Security Grant Program (Canine) $6,000.00 Georgia Office of Homeland Security 10/01/17 10/31/18 Metro Atlanta Multijurisdictional DUI Task Force –HEAT
$32,674.03 Governor's Office of Highway Safety 10/01/17 09/30/18
NCS-X Implementation Assistance Grant $481,692.00 DOJ 12/01/17 11/30/19 Performance Partnership Award $77,426.00 GEMA 0701/17 06/30/18 Urban Area Security Initiative $74,686.89 Georgia Office of Homeland Security 07/27/17 OPEN Wal-Mart $250.00 Sams 12/01/17 OPEN Total Grant Awards 2017 $1,129,884.92

203
2018
Grant Name Award
Amount
Funding Source Begin Date
End Date
Bulletproof Vest Program $67,179.88 Bureau of Justice Assistance 10/01/18 08/31/20 COPS School Violence Prevention Program $370,826.00 DOJ 10/01/18 09/30/20 Electronic Crimes Task Force – Secret Service $4,000.00 Secret Service 01/01/18 07/31/18 High Intensity Drug Trafficking Areas $276,156.00 Office of National Drug Control Policy 01/01/18 12/31/19 Homeland Security Grant Program $6,000.00 Georgia Office of Homeland Security 10/01/18 11/30/19 Homeland Security Grant Program $74,980.00 Georgia Office of Homeland Security 10/01/18 11/30/19 Justice Assistance Grant $38,101.00 DOJ 06/26/18 09/30/20 Kroger (Gift Card) $250.00 Kroger OPEN Metro Atlanta Multijurisdictional DUI Task Force – HEAT
$34,342.65 Governor's Office of Highway Safety 10/01/18 09/30/19
Performance Partnership Award $50,000.00 Georgia Emergency Management Agency 07/01/18 06/30/19 Urban Area Security Initiative $376,251.21 Georgia Office of Homeland Security 01/01/18 07/31/18 Wal-Mart $1,000.00 Wal-Mart 01/01/18 N/A Total Grant Awards 2018 $1,299,086.74

204
Appendix D. Expenditure Allocation Formulas for the Department of Recreation, Parks, and Cultural Affairs
Expenditure Fund 271 Division Allocation Methodology1 Administration Parks & Recreation Recreation by total participants and Parks
by park acres Special Populations Parks & Recreation Recreation by total participants and Parks
by park acres Summer Programs Recreation Youth participation by recreation center Recreation Division Administration Recreation Percent total recreation participation Recreation Centers Recreation Percent total recreation participation Mason Mill Tennis Center Parks Study Area 3 Mystery Valley Golf Parks Study Area 1 Sugar Creek Golf Parks Study Area 1 Planning and Development Parks & Recreation Recreation by total participants and Parks
by park acres Aquatics Parks Aquatic revenue Parks Division Administration Parks Percent park acres District 1 Service Center Parks Percent park acres District 2 Service Center Parks Percent park acres District 3 Service Center Parks Percent park acres Support Services Parks & Recreation Recreation by total participants and Parks
by park acres Horticulture and Forestry Parks Percent park acres Planning and Development Parks & Recreation Recreation by total participants and Parks
by park acres Sugar Creek Tennis Center Parks Study area 1 Natural Resource Management Parks Percent park acres Marketing and Promotion Parks & Recreation Recreation by total participants and Parks
by park acres Cultural Affairs Recreation Porter Sanford Center, Study Area 1 Youth Athletics Recreation Youth participation by recreation center Little Creek Horse Farm Parks Remaining unincorporated area
1. Includes unincorporated area and Stonecrest. In 2018, Tucker assumed responsibility for parks and recreation services.

205
Expenditure Fund 207 Division Allocation Methodology Recreation Center Recreation Location of recreation center Therapeutic Rec. Program Recreation TRP participation by recreation center Playground Day Camp Recreation Youth participation by recreation center –
Redan Center does not have camp Youth Sports Recreation Youth participation by recreation center Outdoor Recreation Parks Park Acres – less Arabia Mountain (3,336.3
acres total)