Table of Contents - Caltrans · 3 State Route 71 Concept Rationale Traffic volumes on State Route...
18
Transcript of Table of Contents - Caltrans · 3 State Route 71 Concept Rationale Traffic volumes on State Route...


ii State Route 71
Table of Contents
About the Transportation Concept Report ....................................................................................... 1
Executive Summary ........................................................................................................................... 2
Corridor Overview ............................................................................................................................. 4
Route Segmentation ............................................................................................................. 4
Route Description ................................................................................................................. 5
Route Designation and Characteristics ................................................................................ 6
Community Characteristics and Land Use ............................................................................ 7
System Characteristics ......................................................................................................... 7
Bicycle Facility....................................................................................................................... 8
Pedestrian Facility ................................................................................................................ 8
Transit Facility....................................................................................................................... 8
Freight .................................................................................................................................. 8
Corridor Performance........................................................................................................................ 9
Key Corridor Issues ............................................................................................................................ 9
Corridor Concept ............................................................................................................................... 10
Concept Rationale ................................................................................................................ 10
Planned and Programmed Projects and Strategies .............................................................. 10
Projects and Strategies to Achieve Concept ........................................................................ 10
Appendices ........................................................................................................................................ 11
A: Glossary of Terms and Acronyms ..................................................................................... 11
B: Resources ......................................................................................................................... 16

1 State Route 71
ABOUT THE TRANSPORTATION CONCEPT REPORT
System Planning is the long-range transportation planning process for the California Department of Transportation (Caltrans). The System Planning process fulfills Caltrans’ statutory responsibility as owner/operator of the State Highway System (SHS) (Gov. Code §65086) by identifying deficiencies and proposing improvements to the SHS. Through System Planning, Caltrans focuses on developing an integrated multimodal transportation system that meets Caltrans’ goals of safety, mobility, delivery, stewardship, and service.
The System Planning process primarily produces four products: the District System Management Plan (DSMP), the Transportation System Development Plan (TSDP), the Transportation Concept Report (TCR), and the Corridor System Management Plan (CSMP). The district-wide DSMP is a strategic policy and planning document that focuses on maintaining, operating, managing, and developing the transportation system. The TSDP is a list of planned and partially programmed transportation projects used to recommend projects for funding. The TCR evolves from the development of the DSMP and TSDP and is used to document the existing and future route conditions as well as future needs for each route on the SHS. Similar to the TCR, the CSMP is a more complex multi-jurisdictional planning document that identifies future needs within corridors experiencing or expected to experience high levels of congestion. The CSMP serves as a TCR for segments covered by the CSMP. These System Planning products are also intended as resources for stakeholders, the public, partners, and regional and local agencies.
TCR Purpose California’s State Highway System needs long-range planning documents to guide the logical development of transportation systems as required by law and as necessitated by public, stakeholders, and system users. The purpose of the TCR is to evaluate current and projected conditions along the route and communicate the vision for the development of each route in each Caltrans District during a 20-25 year planning horizon. The TCR is developed with the goals of increasing safety, improving mobility, providing excellent stewardship, and meeting community and environmental needs along the corridor through integrated management of the transportation network, including the highway, transit, pedestrian, bicycle, freight, operational improvements and travel demand management components of the corridor.

2 State Route 71
EXECUTIVE SUMMARY: STATE ROUTE 71
Concept Summary Table
CONCEPT – 2035 Facility
Seg ADT Dir. Split
Peak Hour
Truck Peak Hour
Planned
SCAG RTP
LOS “D” Minimum
Requirement Concept No-Build
1 143,300 52% 12,470 (8.7%)
835 (6.7%)
6 MF/2 HOV 6 MF/2 HOV
8 MFE 6 MF/2 ML V/C LOS V/C LOS
0.83 D 0.84 D
2 126,700 52% 11,280 (8.9%)
710 (6.3%)
4 MF/2 HOV 4 MF/2 HOV
8 MFE 6 MF/2 ML V/C LOS V/C LOS
1.10 F 1.10 F
3 138,100 53% 12,150 (8.8%)
730 (6.0%)
4 MF 6 MF
8 MFE 6 MF/2 ML V/C LOS V/C LOS
1.64 F 1.10 F

3 State Route 71
Concept Rationale Traffic volumes on State Route 71 (SR-71) are projected to increase largely due to the anticipated growth in Ontario, Chino, Chino Hills, and the county of San Bernardino. Segment 1 traffic volumes are not expected to grow beyond capacity of facility; however, traffic volumes are expected to exceed capacity on Segments 2 and 3.
Proposed Projects and Strategies To achieve the SR-71 concept, improvements are needed beyond those listed as financially constrained in the 2012 RTP. The addition of two mixed-flow lanes is recommended for Segment 2 and the addition of two managed lanes is recommended for Segment 3.

4 State Route 71
CORRIDOR OVERVIEW
ROUTE SEGMENTATION
State Route 71
Segment County Post Miles Description
1 SBd R0.0-R5.7 Los Angeles-San Bernardino County line to 1 mile north of Pine Avenue
2 SBd R5.7-R8.4 1 mile north of Pine Avenue to San Bernardino – Riverside County line
3 Riv 0.0-3.0 San Bernardino-Riverside County line to SR-91
STATE ROUTE 71 SEGMENTATION MAP

5 State Route 71
ROUTE DESCRIPTION State Route 71 (SR-71) begins at its junction with Interstate 10 (I-10) in the city of Pomona in Los Angeles County and extends southeasterly through San Bernardino County ending at its junction with State Route 91 (SR-91) in Riverside County. The total route length is 15.9 miles. In District 8, SR-71 begins at the Los Angeles-San Bernardino County line and ends at its junction with SR-91 in Riverside County, a distance of 8.4 miles in San Bernardino County and 3.0 miles in Riverside County. In the District 8 portion, at the San Bernardino/Riverside County line is where the freeway portion of the route ends, and it transitions to a divided four-lane expressway, terminating at its junction with the SR-91 freeway in the city of Corona. The route serves a high volume of traffic from the cities of Riverside, Corona, Chino, Chino Hills, and Ontario, as well as Orange and Los Angeles Counties. SR-71 is a connecting link for major east-west corridors including I-210, I-10, SR-57, SR-60, SR-91, and SR-210. SR-71 also serves as an intraregional route circulating significant volumes of local traffic.

6 State Route 71
Route Designation and Characteristics
Seg.
Freeway and
Expressway System
National Highway System
Strategic Highway Network
Scenic Highway
Interregional Road System
Route
High Emphasis
Route
Focus Route
Federal Functional
Classification
Goods Movement
Route
Truck Designation
Rural/ Urban/
Urbanized
Metropolitan Planning
Organization
Regional Transportation
Planning Agency
Congestion Management
Agency
Local Agencies
Tribes Air District Terrain
1 Yes Yes No No Yes No No Other
Freeway or Expressway
Yes Terminal Access (STAA)
Urbanized SCAG SCAG SANBAG
Chino, Chino Hills,
SBd Co., SANBAG
No South Coast
AQMD Rolling
2 Yes Yes No No Yes No No Other
Freeway or Expressway
Yes Terminal Access (STAA)
Urbanized SCAG SCAG SANBAG
Chino, Chino Hills,
SBd Co., SANBAG
No South Coast
AQMD Rolling
3 Yes Yes No No Yes No No Other
Freeway or Expressway
Yes Terminal Access (STAA)
Rural SCAG SCAG RCTC SBd Co., SANBAG
No South Coast
AQMD Rolling

7 State Route 71
COMMUNITY CHARACTERISTICS AND LAND USE
Segment 1 traverses mostly developed and a few undeveloped areas of Pomona, Chino, Chino Hills, Ontario, and a small portion of San Bernardino County. The city of Pomona is a community of approximately 162,140 residents and the city of Chino has approximately 79,060 residents. The population of Chino Hills is approximately 75,345 and the city of Ontario has approximately 163,924 residents. Land uses within these communities include residential and commercial. Northeasterly of Segment 2 is the Prado Regional Park. Within Prado Regional Park are the El Prado Golf Course, the Prado Tiro Shooting Range and Recreation Area, the Oranco Bowmen Archery Range, and proposed additional recreation areas. Segment 3 traverses mostly undeveloped areas of Corona. Within that part of Corona are the Prado Dam and Spillway, the Prado Flood Control Basin, the Chino Hills State Park, and the proposed Santa Ana River Regional Park. Segment 3 serves Corona and other travelers mostly from the south and the east. The city of Corona has approximately 153,484 residents.
SYSTEM CHARACTERISTICS
Existing Facility
Segment Facility Type Mixed-Flow
Lanes Managed Lanes Centerline Miles Lane Miles
1 Freeway 6 2 5.7 45.6
2 Freeway 4 2 2.7 16.2
3 Expressway 4 0 3.0 12.0
Concept Facility
Segment Facility Type Mixed-Flow
Lanes Managed Lanes Centerline Miles Lane Miles
1 Freeway 6 2 5.7 45.6
2 Freeway 6 2 2.7 21.6
3 Freeway 6 2 3.0 24.0
TMS Elements
Segment Signalized
Intersections 2008
Planned Additional Signalized
Intersections 2035 Ramp Meters 2008 Ramp Meters 2035
1 0 0 4 4
2 0 0 1 1
3 0 0 1 1

8 State Route 71
BICYCLE FACILITY
Bicycles are permitted on SR-71.
Bicycle Facility Table
Segment
Bicycle Access
Prohibited Facility Description
1 Yes Bicycles are not permitted on this segment. Peyton Drive, Edison Ave., and Central Ave. can be used as an alternate route.
2 Yes Bicycles are not permitted on this segment. Butterfield Ranch Rd. and Euclid Ave. can be used as an alternate route.
3 Yes Bicycles are not permitted on this segment. Pine Ave., Chino Corona Rd., and River Rd. can be used as an alternate route.
PEDESTRIAN FACILITY Pedestrians are permitted on SR-71.
Pedestrian Facility Table
Segment Pedestrian
Access Prohibited
Facility Description
1 Yes Pedestrians are not permitted on the freeway 2 Yes Pedestrians are not permitted on the freeway 3 Yes Pedestrians are not permitted on the freeway
TRANSIT FACILITY
Transit Facility Table Segment Mode & Collateral Facility Name Route End Points
1-2 Bus Omnitrans Chino/Chino Hills/ Ontario 3 N/A N/A N/A
FREIGHT Freight traffic is moderate. Manufacturing and warehousing are located at various locations on the easterly side of the facility.
Freight Facility Table
Facility Type/Freight Generator Location Mode Name
Warehousing Pomona, Chino, Chino Hills Trucks Various
Manufacturing Pomona, Chino, Chino Hills Trucks Various
9 State Route 71
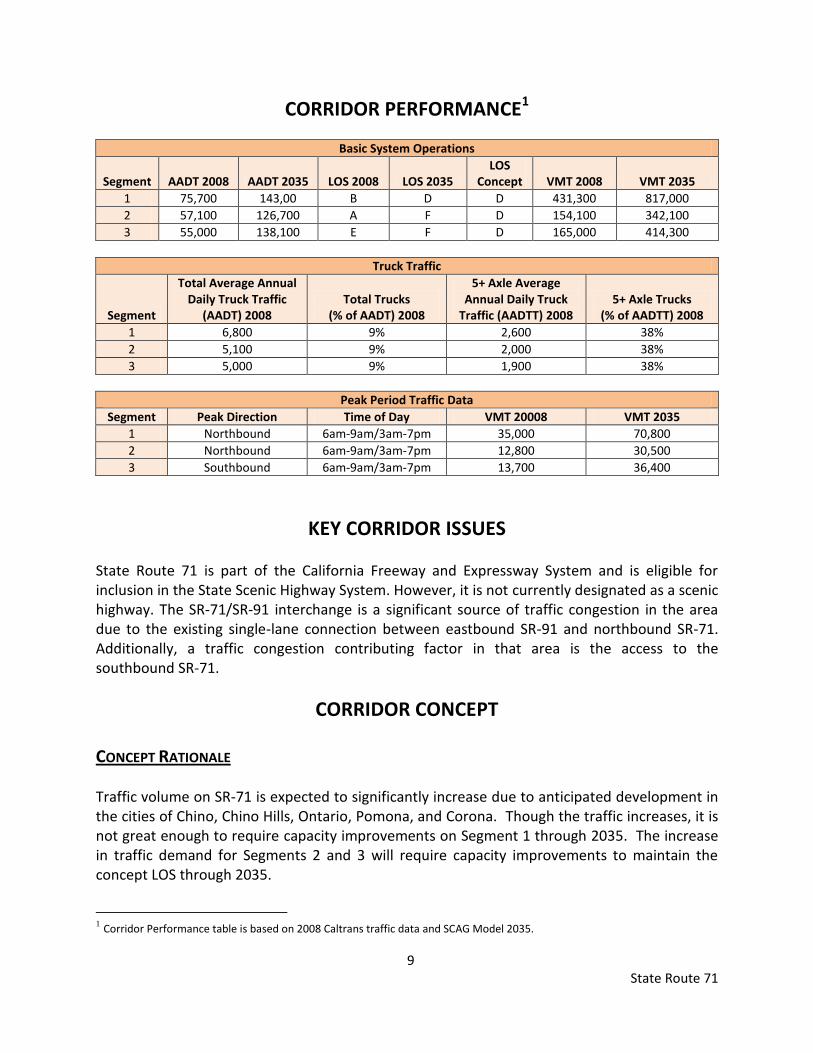
CORRIDOR PERFORMANCE1
Basic System Operations
Segment AADT 2008 AADT 2035 LOS 2008 LOS 2035 LOS
Concept VMT 2008 VMT 2035
1 75,700 143,00 B D D 431,300 817,000
2 57,100 126,700 A F D 154,100 342,100
3 55,000 138,100 E F D 165,000 414,300
Truck Traffic
Segment
Total Average Annual Daily Truck Traffic
(AADT) 2008 Total Trucks
(% of AADT) 2008
5+ Axle Average Annual Daily Truck
Traffic (AADTT) 2008 5+ Axle Trucks
(% of AADTT) 2008
1 6,800 9% 2,600 38%
2 5,100 9% 2,000 38%
3 5,000 9% 1,900 38%
Peak Period Traffic Data
Segment Peak Direction Time of Day VMT 20008 VMT 2035
1 Northbound 6am-9am/3am-7pm 35,000 70,800
2 Northbound 6am-9am/3am-7pm 12,800 30,500
3 Southbound 6am-9am/3am-7pm 13,700 36,400
KEY CORRIDOR ISSUES State Route 71 is part of the California Freeway and Expressway System and is eligible for inclusion in the State Scenic Highway System. However, it is not currently designated as a scenic highway. The SR-71/SR-91 interchange is a significant source of traffic congestion in the area due to the existing single-lane connection between eastbound SR-91 and northbound SR-71. Additionally, a traffic congestion contributing factor in that area is the access to the southbound SR-71.
CORRIDOR CONCEPT CONCEPT RATIONALE Traffic volume on SR-71 is expected to significantly increase due to anticipated development in the cities of Chino, Chino Hills, Ontario, Pomona, and Corona. Though the traffic increases, it is not great enough to require capacity improvements on Segment 1 through 2035. The increase in traffic demand for Segments 2 and 3 will require capacity improvements to maintain the concept LOS through 2035.
1 Corridor Performance table is based on 2008 Caltrans traffic data and SCAG Model 2035.

10 State Route 71
PLANNED AND PROGRAMMED PROJECTS AND STRATEGIES
Segment County Post Miles Location Lead
Agency Project
2012 Regional Transportation Improvement Program (RTIP) Projects
No projects are planned 2012 Financially Constrained Regional Transportation Plan (RTP) Projects
3 Riv 0.0-3.0 Prado Flood
Control Basin
RCTC Widen to 3 lanes in each direction
3 Riv 2.6-3.0 Corona Caltrans Bridge widen to 4 lanes and ramp modification
Strategic Plan Projects (Unconstrained)
No projects are planned
PROJECTS AND STRATEGIES TO ACHIEVE CONCEPT
Segment Location Description
2 Chino, Chino Hills Widen to 6MF/2ML
3 Prado Flood Control Basin Widen to 6MF/2ML

11 State Route 71
Appendix A GLOSSARY OF TERMS AND ACRONYMS
Acronyms
AADT – Annual Average Daily Traffic ADT – Average Daily Traffic
AQMD – Air Quality Management District Caltrans – California Department of Transportation
CMA – Congestion Management Plan CSS – Context Sensitive Solutions
FHWA – Federal Highway Administration GHG – Green House Gas HCP – Habitat Conservation Plan HCS – Highway Capacity Software
HOV – High Occupancy Vehicle Lane HOT – High Occupancy Toll Lane
IC – Interchange ITS – Intelligent Transportation System
LOS – Level of Service MF – Mixed-Flow Lane
MFE – Mixed-Flow Lane Equivalent ML – Managed Lane
MPO – Metropolitan Planning Organizations NOA – Naturally Occurring Asbestos
NCCP – Natural Community Conservation Plan OC – Overcrossing PID – Project Initiation Document PM – Post Mile PSR – Project Study Report
RCTC – Riverside County Transportation Commission Riv – Riverside County
RTP – Regional Transportation Plan RTIP – Regional Transportation Improvement Program
RTPA – Regional Transportation Planning Agency SANBAG – San Bernardino Associated Governments
SBd – San Bernardino County SCAG – Southern California Association of Governments
SCS – Sustainable Community Strategies SHOPP – State Highway Operation Protection Program
STIP – State Transportation Improvement Program T – Truck Lane
TDM – Transportation Demand Management TMS – Transportation Management System TSN – Transportation System Network UC – Undercrossing
V/C – Volume to Capacity Ratio VMT – Vehicle Miles Travel

12 State Route 71
Definitions Annual Average Daily Traffic (AADT) – Annual Average Daily Traffic is the total volume for the year divided by 365 days. The traffic count year is from October 1st through September 30th. Traffic counting is generally performed by electronic counting instruments moved from location throughout the State in a program of continuous traffic count sampling. The resulting counts are adjusted to an estimate of annual average daily traffic by compensating for seasonal influence, weekly variation and other variables which may be present. Annual ADT is necessary for presenting a statewide picture of traffic flow, evaluating traffic trends, computing accident rates, planning and designing highways, and other purposes. Bikeway Class I (Bike Path) – Provides a completely separated right of way for the exclusive use of bicycles and pedestrians with cross flow by motorists minimized. Bikeway Class II (Bike Lane) – Provides a striped lane for one-way bike travel on a street or highway. Bikeway Class III (Bike Route) – Provides for shared use with pedestrian or motor vehicle traffic. Capacity – The maximum sustainable hourly flow rate at which persons or vehicles reasonably can be expected to traverse a point or a uniform section of a lane or roadway during a given time period under prevailing roadway, environmental, traffic, and control conditions. Capital Facility Concept – The 20-25 year vision of future development on the route to the capital facility. The capital facility can include capacity increasing, state highway, bicycle facility, pedestrian facility, transit facility (Intercity Passenger rail, Mass Transit Guideway etc.), grade separation, and new managed lanes. Concept LOS – The minimum acceptable level of service over the next 20-25 years. Conceptual Project – A conceptual improvement or action is a project that is needed to maintain mobility or serve multimodal users, but is not currently included in a financially constrained plan and is not currently programmed. It could be included in a General Plan or in the unconstrained section of a long-term plan. Corridor – A broad geographical band that follows a general directional flow connecting major sources of trips that may contain a number of streets, highways, bicycle, pedestrian, and transit route alignments. Off system facilities are included for informational purposes and not analyzed in the TCR. Facility Concept – Describes the facility and strategies that may be needed within 20-25 years. This can include capacity increasing, state highway, bicycle facility, pedestrian facility, transit facility, non-capacity increasing operational improvements, new managed lanes, conversion of existing managed lanes to another managed lane type or characteristic, TMS field elements, transportation demand management, and incident management. Facility Type – The facility type describes the state highway facility type. The facility could be freeway, expressway, conventional, or one-way city street.

13 State Route 71
Freight Generator – Any facility, business, manufacturing plant, distribution center, industrial development, or other location (convergence of commodity and transportation system) that produces significant commodity flow, measured in tonnage, weight, carload, or truck volume.
Headway – The time between two successive vehicles as they pass a point on the roadway, measured from the same common feature of both vehicles.
Intelligent Transportation System (ITS) – Improves transportation safety and mobility and enhances productivity through the integration of advanced communications technologies into the transportation infrastructure and in vehicles. Intelligent transportation systems encompass a broad range of wireless and wire line communications-based information and electronics technologies to collect information, process it, and take appropriate actions.
Level of Service (LOS) – It is a qualitative measure describing operational conditions within a traffic stream and their perception by motorists. A LOS definition generally describes these conditions in terms of speed, travel time, freedom to maneuver, traffic interruption, comfort, and convenience. LOS can generally be categorized as follows:
LOS A describes free flowing conditions. The operation of vehicles is virtually unaffected by the presence of other vehicles, and operations are constrained only by the geometric features of the highway.
LOS B is also indicative of free-flow conditions. Average travel speeds are the same as in LOS A, but drivers have slightly less freedom to maneuver.
LOS C represents a range in which the influence of traffic density on operations becomes marked. The ability to maneuver with the traffic stream is now clearly affected by the presence of other vehicles.
LOS D demonstrates a range in which the ability to maneuver is severely restricted because of the traffic congestion. Travel speed begins to be reduced as traffic volume increases.
LOS E reflects operations at or near capacity and is quite unstable. Because the limits of the level of service are approached, service disruptions cannot be damped or readily dissipated.

14 State Route 71
LOS F is a stop and go, low speed conditions with little or poor maneuverability. Speed and traffic flow may drop to zero and considerable delays occur. For intersections, LOS F describes operations with delay in excess of 60 seconds per vehicle. This level, considered by most drivers unacceptable often occurs with oversaturation, that is, when arrival flow rates exceed the capacity of the intersection.
Mainline – Includes travelway for through traffic but not freeway to freeway interchanges, local road interchanges, ramps, or auxiliary lanes. Multimodal – The availability of transportation options using different modes within a system or corridor, such as automobile, subway, bus, rail, or air. Peak Hour – The hour of the day in which the maximum volume occurs across a point on the highway. Peak Hour Volume – The hourly volume during the highest hour traffic volume of the day traversing a point on a highway segment. It is generally between six percent and 10 percent of the Annual Daily Traffic (ADT). The lower values are generally found on roadways with low volumes. Planned Project – A planned improvement or action is a project in a financially constrained section of a long-term plan, such as an approved Regional or Metropolitan Transportation Plan (RTP or MTP), Capital Improvement Plan, or measure. Post-25 Year Concept – This dataset may be defined and re-titled at the District’s discretion. In general, the Post-25 Year concept could provide the maximum reasonable and foreseeable roadway needed beyond a 20-25 year horizon. The post-25 year concept can be used to identify potential widening, realignments, future facilities, and rights-of-way required to complete the development of each corridor. Post Mile (PM) – A post mile is an identified point on the State Highway System. The milepost values increase from the beginning of a route within a count to the next county line. The milepost values start over again at each county line. Mile post values usually increase from south to north or west to east depending upon the general direction the route follows within the state. The mile post at a given location will remain the same year after year. When a section of road is relocated, new milepost (usually noted by an alphabetical prefix such as "R" or "M") are established for it. If relocation results in a change in length, "mile post equations" are introduced at the end of each relocated portion so that mile posts on the reminder of the route within the county will remain unchanged. Programmed Project – A programmed improvement or action is a project in a near-term programming document identifying funding amounts by year, such as the State Transportation Improvement Program or the State Highway Operations and Protection Program. Route Designation –A route’s designation is adopted through legislation and identifies what system the route is associated with on the State Highway System. A designation denotes what design standards

15 State Route 71
should apply during project development and design. Typical designations include but not limited to National Highway System (NHS), Interregional Route System (IRRS), and Scenic Highway System. Rural – Fewer than 5,000 in population designates a rural area. Limits are based upon population density as determined by the U.S. Census Bureau. Segment – A portion of a facility between two points. System Operations and Management Concept – Describes the system operations and management elements that may be needed within 20-25 years. This can include Non-capacity increasing operational improvements (Auxiliary lanes, channelization’s, turnouts, etc.), conversion of existing managed lanes to another managed lane type or characteristic (e.g. HOV lane to HOT lane), TMS Field Elements, Transportation Demand Management, and Incident Management. Transportation Demand Management (TDM) – Programs designed to reduce or shift demand for transportation through various means, such as the use of public transportation, carpooling, telework, and alternative work hours. Transportation Demand Management strategies can be used to manage congestion during peak periods and mitigate environmental impacts. Transportation Management System (TMS) – Is the business processes and associated tools, field elements, and communications systems that help maximize the productivity of the transportation system. TMS includes, but is not limited to, advanced operational hardware, software, communications systems, and infrastructure, for integrated Advanced Transportation Management Systems and Information Systems, and for Electronic Toll Collection System. Urban – 5,000 to 49,999 in population designates an urban area. Limits are based upon population density as determined by the U.S. Census Bureau. Urbanized – Over 50,000 in population designates an urbanized area. Limits are based upon population density as determined by the U.S. Census Bureau. Vehicle Miles Traveled (VMT) – Is the total number of miles traveled by motor vehicles on a road or highway segments.

16 State Route 71
Appendix B RESOURCES
California Department of Transportation: District 8 District System Management Plan, December 2011.