TABLE OF CONTENTS - St Lucie TPO
142
Transcript of TABLE OF CONTENTS - St Lucie TPO

DingY
Rectangle

TABLE OF CONTENTS SECTION PAGE
A. INTRODUCTION A. 1 How to Use the TIP A-1A. 2 Project Index and TIP/LRTP Cross Reference A-2A. 3 TIP Project Location Maps A-4A. 4 Glossary of Abbreviations and Phase/Funding Source Codes A-6A. 5 TPO Metropolitan Planning Area Map A-7
B. NARRATIVE B. 1 Purpose B-1B. 2 Financial Plan B-2B. 3 Project Selection B-6B. 4 Consistency with Other Plans B-6B. 5 Project Priority Statement B-6B. 6 Public Involvement B-7B. 7 TIP Amendments B-7B. 8 Annual Listing of Obligated Federal Funding/Implemented Projects B-8B. 9 Certifications B-12B. 10 Congestion Management Process (CMP) B-12B. 11 St. Lucie Transportation Disadvantaged (TD) Program B-13B. 12 Transportation Regional Incentive Program (TRIP) B-14
C. DETAILED PROJECT LISTINGSC. 1 Highway/Roadway/Sidewalk C 1-1 C. 2 Aviation C 2-1 C. 3 Transit Projects C 3-1 C. 4 Miscellaneous Projects C 4-1 C. 5 Planning Projects C 5-1 C. 6 Bridge C 6-1 C. 7 Turnpike Enterprise Projects C 7-1 C. 8 Seaport Projects C 8-1
D. LIST OF PRIORITY PROJECTS D-1
E. PERFORMANCE AND ASSET MANAGEMENTE.1 Performance Management E-1E.2 Asset Management E-4E.3 Florida Transportation Performance Measures Consensus Planning Document E-5
APPENDICES Appendix A: Example Public Comment Notice Appendix B: Local Projects‐City of Fort Pierce Appendix C: Local Projects‐City of Port St. Lucie Appendix D: Local Projects‐St. Lucie County Appendix E: Summary of Comments Appendix F: TIP Comparison Table Appendix G: TIP Amendment Forms

St. Lucie TPO Transportation Improvement Program - FY 2019/20 - FY 2023/2024
A-1
A. INTRODUCTION
A.1 HOW TO USE THE TIP
The intent of the Transportation Improvement Program (TIP) is to identify and prioritize the transportation improvement projects over thenext five years that are receiving State and Federal funding and are located within the Metropolitan Planning Area (MPA) of the St. LucieTransportation Planning Organization (St. Lucie TPO). The St. Lucie TPO MPA is identified on the map on page A-8.
To use the TIP:
Locate the project in the Project Index in Section A.2 or on either of the Project Location Maps in Section A.3 to identify the ProjectNumber or Project Name.Using the Project Name, reference directly the alphabetically-listed projects in the Detailed Project Listing pages or, by using theProject Number, identify the TIP Page Number for the project from the Project Index.Refer to the corresponding TIP Page Number to obtain information regarding the project in the Detailed Project Listings pages.Refer to the corresponding LRTP Page Number in the Project Index or in the Detailed Project Listings pages to cross-reference theproject, if applicable, in the Go2040 Long Range Transportation Plan (LRTP).Refer to Section A.4 for a Glossary of Abbreviations and Phase/Funding Codes.Refer to Section B for information on Federal and State requirements for development of the TIP.Refer to Section C for the Detailed Project Listings which include whether the project is located on the Florida Strategic IntermodalSystem (SIS) and the Total Project Cost.Refer to Section D for the TPO List of Priority Projects.Refer to Section E for an evaluation of project and system performanceRefer to the Appendices for an Example Public Comment Notice and for information on locally-funded projects and TIP amendmentsthat have been adopted.Refer to the contact information on the cover of the TIP if you have any questions or comments.
Explanations of the SIS and Total Project Costs
SIS: The SIS is a network of high priority transportation facilities in Florida which includes the State’s largest and most significantcommercial service airports, spaceport, deep-water seaports, freight and passenger rail terminals, intercity bus terminals, rail corridors,waterways and highways. All projects on the SIS will have a SIS identifier in the top right corner of the Detailed Project Listings pages inSection C of the TIP.
Total Project Costs: A typical project production sequence is to have a Project Development and Environment (PD&E) phase, followed bya Design (PE) phase, a Right of Way (ROW) phase and a Construction (CST) phase. Some projects may not include a ROW phase if landacquisition is not needed to complete the project. Costs in the Detailed Project Listing pages in Section C of the TIP may include thehistorical costs (Prior Year Cost), the costs in the five years of the current TIP, the costs in the years beyond the current TIP (Future YearCost), and the sum of all of these costs which is the Total Project Cost. For some projects such as resurfacing, safety, or operationalprojects, there may not be a Total Project Cost identified, but additional details on that program will be included.

St. Lucie TPO Transportation Improvement Program - FY 2019/20 - FY 2023/2024
A-2
A.2 PROJECT INDEX AND TIP/RLRTP CROSS REFERENCE
PROJECT NAME PROJECT LIMITS FROM PROJECT LIMITS TO DESCRIPTIONPROJECT
NUMBER
LRTP
Page
TIP
Page
TIP
MAP
Page
A1A NORTH CAUSEWAY BRIDGE ENTIRE BRIDGE ENTIRE BRIDGE BRIDGE REPLACEMENT 4299362 6-2 C 6-2 A-4
ALCANTARRA BLVD SAVONA BLVD PORT ST.LUCIE BLVD SIDEWALK 4443491 6-11 C 1-2 A-5
CURTIS STREET PRIMA VISTA BLVD FLORESTA DRIVE SIDEWALK 4443481 6-10 C 1 -3 A-5
FEC OVERPASS SAVANNAS RECREATION AREA SOUTH OF SAVANNAH RD. BIKE PATH/TRAIL 4400321 6-11 C 1-5 A-4
GATLIN BLVD WEST OF I-95 PORT ST LUCIE BLVDTRAFFIC CONTROL
DEVICES/SYSTEM4447071 6-5 C 1-6 A-5
I-95 @ BECKER ROAD
INTERCHANGERAMPS AT BECKER RD RAMPS AT BECKER RD LANDSCAPING 4413141 7-1 C 1-7 A-5
I-95 @ ST. LUCIE WEST BLVD INTERCHANGE INTERCHANGE INTERCHANGE - ADD LANES 4353371 6-2 C 1-8 A-5
I-95 FROM GATLIN TO ST. LUCIE
WESTNORTH OF GATLIN BLVD
SOUTH OF ST. LUCIE WEST
BLVDSKID HAZARD OVERLAY 4438471 7-1 C 1-10 A-5
I-95 OFF-RAMPS AT GATLIN BLVD NB OFF-RAMPS AT GATLIN BLVD SB OFF-RAMPS AT GATLIN BLVD INTERCHANGE - ADD LANES 4397611 6-2 C 1-11 A-5
I-95 OFF-RAMPS AT MIDWAY ROAD NB OFF-RAMPS AT MIDWAY RD SB OFF-RAMPS AT MIDWAY RD INTERCHANGE - ADD LANES 4397541 6-2 C 1-12 A-4, 5
KING'S HIGHWAY @ INDIO ROAD INTERSECTION INTERSECTION ADD TURN LANE(S) 4241431 6-2 C 1-13 A-4
KING'S HIGHWAY NORTH OF COMMERCIAL CIRCLE ST LUCIE BLVD ADD LANES & RECONSTRUCT 4383792 6-2 C 1-14 A-4
KING'S HIGHWAY N OF I-95 OVERPASS N OF COMMERCIAL CIR ADD LANES & RECONSTRUCT 4383791 6-5 C 1-15 A-4
KING'S HIGHWAY 400 feet S OF OKEECHOBEE RD NORTH OF PICOS ROAD ADD LANES & RECONSTRUCT 2302566 6-5 C 1-16 A-4
KING'S HIGHWAY NORTH OF PICOS RD NORTH OF I-95 OVERPASS ADD LANES & RECONSTRUCT 2302567 6-2 C 1-17 A-4
KING'S HIGHWAY NORTH OF PICOS RD NORTH OF I-95 OVERPASS LANDSCAPING 4380411 6-2 C 1-18 A-4
KING'S HIGHWAY ST LUCIE BOULEVARD SOUTH OF INDRIO ROAD ADD LANES & RECONSTRUCT 4383793 6-5 C 1-19 A-4
KING'S HIGHWAY 800 feet S OF OKEECHOBEE RD NORTH OF PICOS RD LANDSCAPING 2302568 6-5 C 1-20 A-4
MACEDO BLVD SELVITZ RD ST JAMES DR SIDEWALK 4400181 6-10 C 1-25 A-5
MIDWAY ROAD GLADES CUT OFF ROAD SELVITZ ROAD PD&E/EMO STUDY 2314403 6-5 C 1-22 A-4, 5
MIDWAY ROAD S. 25TH STREET US-1 ADD LANES & RECONSTRUCT 2314402 6-2 C 1-23 A-4, 5
N. 25th STREET NORTH OF AVE Q ST LUCIE BLVD RESURFACING 4439971 7-1 C 1-24 A-4
OKEECHOBEE ROAD @ MIDWAY
ROADINTERSECTION INTERSECTION NEW LIGHTING INSTALLATION 4436851 7-1 C 1-26 A-4
OLEANDER AVENUE MIDWAY ROAD SOUTH MARKET AVENUE SIDEWALK 4415661 6-10 C 1-27 A-4, 5
PARK & RIDE LOT BRESCIA STREET EDGARCE STREET PARK AND RIDE LOTS 4226814 6-2 C 3-2 A-5
PORT OF FORT PIERCE SOUTH
DOCKSOUTH DOCK SOUTH DOCK REHABILITATION 4444571 7-1 C 8-2 A-4
PORT ST. LUCIE BLVD LONG CREEK N FORK ST LUCIE RIVER BRIDGE-REPAIR/REHABILITATION 4435951 7-1 C 6-3 A-5

St. Lucie TPO Transportation Improvement Program - FY 2019/20 - FY 2023/2024
A-3
PORT ST. LUCIE BLVD GATLIN BLVD DARWIN BLVD ADD LEFT TURN LANE(S) 4317524 6-6 C 1-28 A-5
PORT ST. LUCIE BLVD BECKER ROAD PAAR DRIVE ADD LANES & RECONSTRUCT 4317523 6-6 C 1-29 A-5
PORT ST. LUCIE BLVD PAAR DRIVE DARWIN BLVD ADD LANES & RECONSTRUCT 4317522 6-5 C 1-30 A-5
PORT ST. LUCIE BLVD SOUTH OF ALCANTARRA BLVD SOUTH OF DARWIN BLVD ADD LANES & RECONSTRUCT 4317526 6-6 C 1-31 A-5
PORT ST. LUCIE BLVD @ FLORESTA
DRINTERSECTION INTERSECTION TRAFFIC ENGINEERING STUDY 4405681 6-5 C 5-3 A-5
PRIMA VISTA BLVD @ AIROSO
BLVDINTERSECTION INTERSECTION INTERSECTION IMPROVEMENT 4447061 6-5 C 1-32 A-5
SAVANNAS PRESERVE STATE PARK
GAPLENNARD RD SAVANNAS RECREATION AREA BIKE PATH/TRAIL 4399993 6-11 C 1-33 A-4, 5
SAVANNAS PRESERVE STATE PARK
GAPWALTON RD LENNARD RD BIKE PATH/TRAIL 4399992 6-11 C 1-34 A-5
SAVANNAS PRESERVE STATE PARK
GAPWALTON RD. SAVANNAS RECREATION AREA BIKE PATH/TRAIL 4399991 6-11 C 1-35 A-4, 5
US HIGHWAY 1 S. OF PORT ST. LUCIE BLVD. NE RIOMAR DRIVE RESURFACING 4398471 7-1 C 1-38 A-5
US HIGHWAY 1 @ VIRGINIA
AVENUEINTERSECTION INTERSECTION ADD RIGHT TURN LANE(S) 4368681 6-2 C 1-36 A-4

St. Lucie TPO Transportation Improvement Program - FY 2019/20 - FY 2023/2024
A-4
A.3 TIP PROJECT LOCATION MAPS

St. Lucie TPO Transportation Improvement Program - FY 2019/20 - FY 2023/2024
A-5

St. Lucie TPO Transportation Improvement Program - FY 2019/20 - FY 2023/2024
A-6
A.4 GLOSSARY OF ABBREVIATIONS AND PHASE/FUNDING SOURCE CODESADM Administration MNT Contract Maintenance
BPAC Bicycle Pedestrian Advisory Committee MPO Metropolitan Planning Organization
BRDG Bridge MSC Grant to Local Government
CAC Citizens Advisory Committee OPS Operations
CAP Capital PD&E Project Development and Environmental
CEI Construction, Engineering, & Inspection PE Preliminary Engineering
CIP Capital Improvements Program PIP Public Involvement Program
CLV Culvert PLN Planning
CMP Congestion Management Process PST DES Post Design
CST Construction PTO Public Transportation Office
CTC Community Transportation Coordinator RELOC Right of Way Relocation
DCA Department of Community Affairs RLRTP Regional Long Range Transportation Plan
DSB Design Build ROW Right of Way Support
E/D Engineering & Design ROW LND Right of Way Land
ENV Environmental RR CST Railroad Construction
EPA Environmental Protection Agency RRX Railroad Crossing
FAA Federal Aviation Administration RRU Railroad/Utilities Construction
FDOT Florida Department of Transportation SAFETEA-LUSafe, Accountable, Flexible, Efficient Transportation
Equity Act–a Legacy for Users
FHWA Federal Highway Administration SLC St. Lucie County
FTA Federal Transit Administration SRA Senior Resource Association, Inc.
INC Construction Incentive TAC Technical Advisory Committee
IRC Indian River County TD Transportation Disadvantaged
LAR Local Agency Reimbursement TDC Transportation Disadvantaged Commission
LCB Local Coordinating Board TIP Transportation Improvement Program
LOPP List of Priority Projects TMA Transportation Management Area
MAP - 21Moving Ahead for Progress
in the 21st CenturyTPO Transportation Planning Organization
MC Martin County UPWP Unified Planning Work Program
MIT Mitigation UTL Utility Coordination

St. Lucie TPO Transportation Improvement Program - FY 2019/20 - FY 2023/2024
A-7
A.5 TPO METROPOLITAN PLANNING AREA MAP

St. Lucie TPO Transportation Improvement Program - FY 2019/20 - FY 2023/2024
B-1
B. NARRATIVE
B.1 PURPOSE
The purpose of the TIP is to identify and prioritize transportation improvement projects receiving Federal and State funding over a five-yearperiod that are located within the St. Lucie TPO MPA. In addition, the TIP is used to coordinate the transportation improvement projects ofthe U.S. Department of Transportation (USDOT), the Florida Department of Transportation (FDOT), and the local governments locatedwithin the MPA. Projects in the TIP are presented in Year of Expenditure (YOE), which takes into account the inflation rate over the fiveyears in the TIP. Therefore the programmed cost estimate for each project is inflated to the year that the funds are expended based onreasonable inflation factors developed by the State and its partners. The TIP is also used to identify all regionally significant transportationprojects for which Federal action is required, whether or not the projects receive Federal funding. As the St. Lucie TPO is in an air qualityattainment area, there are no regionally significant air quality-related transportation improvement projects in the TIP.
B.2 Financial Plan
The Financial Plan of the TIP is based upon the FDOT District 4 Tentative Work Program for FY 2019/20 – FY 2023/24; the previous year'sTIP; the Go2040 Long Range Transportation Plan (LRTP); and information provided by St. Lucie County, the City of Port St. Lucie, and theCity of Fort Pierce. The Financial Plan includes Federal, State, and local transportation funding sources which are identified in the followingtables based on the type of transportation improvement:

St. Lucie TPO Transportation Improvement Program - FY 2019/20 - FY 2023/2024
B-2
B.2 FINANCIAL PLAN
HIGHWAY/ROADWAY/SIDEWALK FUNDING SOURCES
FUND CODE DESCRIPTION FUND 2020 2021 2022 2023 2024 TOTAL
ADVANCE CONSTRUCTION (ER) ACER 2,675,926 - - - - 2,675,926
AC FREIGHT PROG (NFP) ACFP - 20,000 3,709,879 - - 3,729,879
ADVANCE CONSTRUCTION NHPP ACNP - - - - 550,000 550,000
ADVANCE CONSTRUCTION (SS,HSP) ACSS 1,068,972 1,209,788 10,000 10,263,824 - 12,552,584
ADVANCE CONSTRUCTION (SU) ACSU 1,161,202 - - - - 1,161,202
DISTRICT DEDICATED REVENUE DDR 21,333,070 1,296,051 14,616,785 28,949,908 1,068,076 67,263,890
STATE IN-HOUSE PRODUCT SUPPORT DIH 485,907 210,495 499,417 942,729 77,524 2,216,072
STATE PRIMARY HIGHWAYS & PTO DS 5,138,295 236,525 6,947,501 29,547,333 - 41,869,654
GF STPBG ANY AREA GFSA 65,007 - - - - 65,007
LOCAL FUNDS LF 152,683 2,566,203 3,577,052 - - 6,295,938
LOCAL FUNDS FOR PARTICIPATING LFP 2,464,071 - - - - 2,464,071
STP, ANY AREA SA 2,231,124 614,898 5,000 - 1,413,097 4,264,119
STP, URBAN AREAS > 200K SU 2,686,235 3,496,561 10,000 2,962,084 5,414,532 14,569,412
TRANSPORTATION ALTS- ANY AREA TALT 343,309 390,172 669,510 - - 1,402,991
TRANSPORTATION ALTS- >200K TALU 308,437 307,287 22,376 - - 638,100
SB2514A-TRAIL NETWORK 2015 TLWR 75,000 6,045,350 400,000 2,912,498 - 9,432,848
TRANS REGIONAL INCENTIVE PROGM TRIP - 1,006,345 2,113,636 - 3,242,078 6,362,059
SB2514A-TRAN REG INCT PRG 2015 TRWR - 1,323,655 565,884 - 693,281 2,582,820
GRAND TOTAL 180,096,572
AVIATION FUNDING SOURCES
FUND CODE DESCRIPTION FUND 2020 2021 2022 2023 2024 TOTAL
STATE - PTO DPTO 2,510,475 - - - - 2,510,475
FEDERAL AVIATION ADMIN FAA 1,988,550 - - - - 1,988,550
LOCAL FUNDS LF 710,475 - - - - 710,475
GRAND TOTAL 5,209,500

St. Lucie TPO Transportation Improvement Program - FY 2019/20 - FY 2023/2024
B-3
TRANSIT OPERATIONS FUNDING SOURCES
FUND CODE DESCRIPTION FUND 2020 2021 2022 2023 2024 TOTAL
DISTRICT DEDICATED REVENUE DDR 3,360,883 - - 703,638 752,024 4,816,545
STATE IN-HOUSE PRODUCT SUPPORT DIH 131,513 - - - - 131,513
STATE - PTO DPTO 1,138,686 829,627 682,108 - - 2,650,421
STATE PRIMARY HIGHWAYS & PTO DS 1,013,000 537,956 1,752,641 - - 3,303,597
STATE PRIMARY/FEDERAL REIMB DU 56,256 59,069 62,023 65,124 64,613 307,085
FEDERAL TRANSIT ADMINISTRATION FTA 2,891,400 2,891,400 2,891,400 2,892,000 2,892,000 14,458,200
LOCAL FUNDS LF 1,014,942 708,696 744,131 768,762 816,637 4,053,168
GRAND TOTAL 29,720,529
MISCELLANEOUS FUNDING SOURCES
FUND CODE DESCRIPTION FUND 2020 2021 2022 2023 2024 TOTAL
UNRESTRICTED STATE PRIMARY D 1,928,972 1,927,000 1,927,000 1,927,000 - 7,709,972
DISTRICT DEDICATED REVENUE DDR 8,094,216 323,931 333,539 376,795 388,059 9,516,540
STATE IN-HOUSE PRODUCT SUPPORT DIH 97,311 - - - - 97,311
STATEWIDE ITS - STATE 100%. DITS 257,338 263,771 270,372 243,422 250,726 1,285,629
STATE PRIMARY HIGHWAYS & PTO DS 10,000 - - - - 10,000
GRAND TOTAL 18,619,452
PLANNING FUNDING SOURCES
FUND CODE DESCRIPTION FUND 2020 2021 2022 2023 2024 TOTAL
COUNTY INCENTIVE GRANT PROGRAM CIGP - 500,000 - - - 500,000
STATE IN-HOUSE PRODUCT SUPPORT DIH - 10,000 - - - 10,000
STATE - PTO DPTO 11,529 9,190 9,466 9,190 9,190 48,565
STATE PRIMARY/FEDERAL REIMB DU 71,465 73,518 75,724 73,518 73,518 367,743
LOCAL FUNDS LF 11,529 509,190 9,466 9,190 9,190 548,565
METRO PLAN (85% FA; 15% OTHER) PL 536,231 547,631 547,631 547,631 - 2,179,124
STP, URBAN AREAS > 200K SU 300,000 300,000 300,000 300,000 300,000 1,500,000
GRAND TOTAL 5,153,997

St. Lucie TPO Transportation Improvement Program - FY 2019/20 - FY 2023/2024
B-4
BRIDGE FUNDING SOURCES
FUND CODE DESCRIPTION FUND 2020 2021 2022 2023 2024 TOTAL
ADVANCE CONSTRUCTION (BRT) ACBR 774,582 9,317,241 500,000 3,837,532 - 14,429,355
AMENDMENT 4 BONDS (BRIDGES) BNBR - - 65,880,638 - - 65,880,638
STATE BRIDGE REPLACEMENT BRP 1,454,305 59,410 22,351 - - 1,536,066
STATE BRIDGE REPAIR & REHAB BRRP 210,000 5,000 806,169 - - 1,021,169
UNRESTRICTED STATE PRIMARY D 50,000 50,000 50,000 50,000 - 200,000
DISTRICT DEDICATED REVENUE DDR - - 20,333,244 - 630,000 20,963,244
STATE IN-HOUSE PRODUCT SUPPORT DIH 10,000 - 689,364 - - 699,364
STATE PRIMARY HIGHWAYS & PTO DS 750,000 - 129,720 - - 879,720
STP, ANY AREA SA - - - 50,000 - 50,000
GRAND TOTAL 105,659,556
TURNPIKE ENTERPRISE FUNDING SOURCES
FUND CODE DESCRIPTION FUND 2020 2021 2022 2023 2024 TOTAL
TURNPIKE RENEWAL & REPLACEMENT PKYR 188,000 3,295,630 - - - 3,483,630
GRAND TOTAL 3,483,630
SEAPORT FUNDING SOURCES
FUND CODE DESCRIPTION FUND 2020 2021 2022 2023 2024 TOTAL
LOCAL FUNDS LF 413,177 - - - - 413,177
SEAPORTS PORT 413,177 - - - - 413,177
GRAND TOTAL 826,354
FINANCIAL PLAN GRAND TOTAL 348,769,590

St. Lucie TPO Transportation Improvement Program - FY 2019/20 - FY 2023/2024
B-5
The TIP is financially constrained each year with the project cost estimates equal to the funding source estimates as demonstrated in theFinancial Summary below:
PROJECT FUNDING SOURCE ESTIMATES 2020 2021 2022 2023 2024 Total Program
Highway/Roadway/Sidewalk 40,189,238 18,723,330 33,147,040 75,578,376 12,458,588 180,096,572
Aviation 5,209,500 0 0 0 0 5,209,500
Transit Operations 9,606,680 5,026,748 6,132,303 4,429,524 4,525,274 29,720,529
Miscellaneous 10,387,837 2,514,702 2,530,911 2,547,217 638,785 18,619,452
Planning 930,754 1,949,529 942,287 939,529 391,898 5,153,997
Bridge 3,248,887 9,431,651 88,411,486 3,937,532 630,000 105,659,556
Turnpike Enterprise 188,000 3,295,630 0 0 0 3,483,630
Seaport 826,354 0 0 0 0 826,354
348,769,590
PROJECT COST ESTIMATES 2020 2021 2022 2023 2024 Total Program
Highway/Roadway/Sidewalk 40,189,238 18,723,330 33,147,040 75,578,376 12,458,588 180,096,572
Aviation 5,209,500 0 0 0 0 5,209,500
Transit Operations 9,606,680 5,026,748 6,132,303 4,429,524 4,525,274 29,440,529
Miscellaneous 10,387,837 2,514,702 2,530,911 2,547,217 638,785 18,619,452
Planning 930,754 1,949,529 942,287 939,529 391,898 5,153,997
Bridge 3,248,887 9,431,651 88,411,486 3,937,532 630,000 105,659,556
Turnpike Enterprise 188,000 3,295,630 0 0 0 3,483,630
Seaport 826,354 0 0 0 0 826,354
348,769,590
FUND SOURCE 2020 2021 2022 2023 2024 Total Program
Federal 17,158,696 19,227,565 8,803,543 20,991,713 10,707,760 76,889,277
Federal Earmark - - - - - 0
Local 4,766,877 3,784,089 4,330,649 777,952 825,827 14,485,394
R/W and Bridge Bonds - - 65,880,638 - - 65,880,638
State 100% 48,473,677 14,634,306 52,149,197 65,662,513 7,110,958 188,030,651
Toll/Turnpike 188,000 3,295,630 - - - 3483,630
GRAND TOTAL FROM ALL JURISDICTIONS 70,587,250 40,941,590 131,164,027 87,432,178 18,644,545 348,769,590
Note: See Section A-8 for Fund Code Source and Fund Code Description

St. Lucie TPO Transportation Improvement Program - FY 2019/20 - FY 2023/2024
B-6
B.3 PROJECT SELECTION
The selection of federally-funded projects within the St. Lucie TPO MPA for the TIP is consistent with Federal regulations [23CFR450.330(c)] and is carried out by the TPO in cooperation with FDOT and the transit operator. The TIP has been developed incoordination with the USDOT, FDOT, St. Lucie TPO Advisory Committees, local governments, port and aviation authorities, transitoperators, and the general public as summarized in Section B.6 of the TIP.
For the TPO’s FY 2019/20 – FY 2023/24 TIP, the project selection and TIP development process started in May 2018 with a meeting withstaffs from the St. Lucie TPO, FDOT District 4, and the local governments to informally discuss the priority projects. The List of PriorityProjects (LOPP) then was developed based on the LRTP and other plans as identified in Section B.4, local agency input, and publiccomments. The LOPP was reviewed by the St. Lucie TPO Advisory Committees and was adopted by the St. Lucie TPO Board and submittedto FDOT District 4 in August 2018. The LOPP was utilized by FDOT District 4 to develop their Draft Tentative Work Program for FY 2019/20– FY 2023/24. The Draft Tentative Work Program was reviewed and endorsed by the Board in December 2018. The Final Tentative WorkProgram was received from FDOT in April of 2019. The Final Tentative Work Program is the primary component of the TIP. The TPO LOPP isreproduced in Section D of the TIP.
B.4 CONSISTENCY WITH OTHER PLANS
The projects in the TIP are based on the LRTP, the St. Lucie Transit Development Plan, the Transportation Disadvantaged Service Plan/Coordinated Public Transit – Human Services Transportation Plan, and other transportation plans of the St. Lucie TPO. These plans arecross-referenced in the LOPP, and the TIP projects are cross-referenced with the LRTP in the Project Index and TIP/LRTP Cross Reference inSection A.2. The projects also are consistent with the St. Lucie County Airport Master Plan, the Port of Fort Pierce Master Plan, and the2060 Florida Transportation Plan.
In addition, the TIP has been developed to be consistent with adopted local Comprehensive Plans including the St. Lucie County, City ofFort Pierce, City of Port St. Lucie, and St. Lucie Village Comprehensive Plans. The transportation network in the TPO MPA contains thetraffic circulation elements included in the adopted St. Lucie County, City of Fort Pierce, City of Port St. Lucie, and St. Lucie VillageComprehensive Plans. Projections of future traffic volumes and levels of service were developed based on the Future Land Use Elements ofthe respective plans. The projections, as identified in the LRTP, served as a basis for determining the need for new or expandedtransportation facilities and transportation management systems to support proposed development and to maintain or improve adoptedlevel of service standards.
B.5 PROJECT PRIORITY STATEMENT
The projects selected in the TIP are based upon the TPO LOPP and the corresponding prioritization methodology and the goals, objectivesand performance measures identified in Table 2-5 of the LRTP. The project prioritization was based on qualitative and quantitative analysesof the transportation projects in the TPO MPA which included the scoring and ranking of multimodal project priorities as identified in Table3-5 of the LRTP. The project priorities were further refined with the development of transportation alternatives and scenarios planning assummarized in Chapter 5 of the LRTP and the consideration of public comment as summarized in Chapter 6 of the LRTP.

St. Lucie TPO Transportation Improvement Program - FY 2019/20 - FY 2023/2024
B-7
B.6 PUBLIC INVOLVEMENT
Public involvement in the development of the LOPP and the TIP is continuous, cooperative, and comprehensive and was conducted inaccordance with the adopted Public Involvement Program (PIP) of the St. Lucie TPO and with Federal regulations [23 CFR 450.316 and 23CFR 450.324(b)]. Reasonable opportunity to comment on the LOPP and the TIP was provided to all interested parties including, but notlimited to, citizens, affected public agencies, public transit providers, freight shippers, private transportation providers, bicycle/pedestrianrepresentatives, and the disabled. The process included those traditionally underserved and underrepresented consistent with the principlesof Title VI. The process is followed for all projects funded in whole or part by the Federal Transit Administration (FTA) or the FederalHighway Administration (FHWA) pursuant to the Federal requirements.
B.7 TIP AMENDMENTS
TIP Amendments are completed in accordance with applicable requirements [23 CFR 324 and 326] when a project is added or deleted,when the fiscal constraint of the TIP is impacted by a project, and/or when there are significant changes in the scope of a project. Theamendment of the TIP includes the preparation of a TIP Amendment Form that summarizes the nature of the changes.
Prior to the adoption of a TIP amendment by the TPO Board, notice and public comment opportunities are provided regarding theamendment consistent with Section B.6. Upon adoption of the amendment by the TPO Board, the TIP Amendment Form is incorporatedinto Appendix G of the TIP.

St. Lucie TPO Transportation Improvement Program - FY 2019/20 - FY 2023/2024
B-8
B.8 ANNUAL LISTING OF OBLIGATED FEDERAL FUNDING/IMPLEMENTED PROJECTS
FHWA OBLIGATED FUNDING
PROJECT
NUMBERPROJECT NAME DESCRIPTION LENGTH FUND TOTAL FUND CODE PROJECT TOTAL
2303384INDRIO ROAD FROM WEST OF I-95 TO EAST OF
EMERSON AVADD LANES & RECONSTRUCT 2.709 6,805,353 NHPP
115,741 NHPP
-15,220 SA 6,905,874
2314402 MIDWAY RD FROM S. 25TH STREET TO US-1 ADD LANES & RECONSTRUCT 1.803 -1,801 CM
3,838,581 SA
173,198 SU
-2,828 EB
1,200 SA
-1,102 SA
223,963 SA
-555,903 SU 3,675,308
2314403MIDWAY RD FROM GLADES CUT OFF RD. TO
SELVITZ RDADD LANES & RECONSTRUCT 1.577 15,000 SA
195,513 SU 210,513
4108444CROSSTOWN PARKWAY FROM MANTH LANE TO
US-1NEW BRIDGE CONSTRUCTION 2.651 8,195 SA 8,195
4108445CROSSTOWN PARKWAY FROM MANTH LANE TO
US-1NEW BRIDGE CONSTRUCTION 2.651 11,640 EB
243,780 HPP
4,482,340 SA

St. Lucie TPO Transportation Improvement Program - FY 2019/20 - FY 2023/2024
B-9
PROJECT
NUMBERPROJECT NAME DESCRIPTION LENGTH FUND TOTAL FUND CODE PROJECT TOTAL
14,138 SA 4,751,898
4287281 US-1 FROM N. OF MIDWAY RD TO EDWARDS RD RESURFACING 2.362 4,353 NHRE 4,353
4299362 A1A NORTH BRIDGE OVER ICWW BRIDGE #940045 BRIDGE REPLACEMENT 1 922,843 NHBR 922,843
4317351SAVONA BLVD FROM SW BECKER ROAD TO SW
GATLIN BLVDSIDEWALK 3.72 242 TALT 242
4317381DARWIN BLVD FROM SW BECKER RD. TO SW PAAR
DR.SIDEWALK 1.248 16 EB
-80,486 TALT
5,784 TALT
-19,133 TALU -93,819
4317522PORT ST. LUCIE BLVD FROM PAAR DRIVE TO
DARWIN BLVDADD LANES & RECONSTRUCT 1.946 4,575 SA
1,484,361 SA
87,252 SA
470,915 SU 2,047,103
4343601MCCARTY RD. BRDG #940031 OVER TEN MILE
CREEK, REPLACEMENTBRIDGE REPLACEMENT 0.12 1,612,159 NHBR
119,576 SA
-8,480 NHBR
35,067 SA
456 NHBR
2,542 SA 1,761,320
4351351 PORT ST. LUCIE BLVD @ GATLIN BLVD INTERSECTION IMPROVEMENT 0.642 80,000 SA

St. Lucie TPO Transportation Improvement Program - FY 2019/20 - FY 2023/2024
B-10
PROJECT
NUMBERPROJECT NAME DESCRIPTION LENGTH FUND TOTAL FUND CODE PROJECT TOTAL
500,000 SU
38,470 SU
1,340 SA 619,810
4352631SELVITZ ROAD FROM NORTH OF BAYSHORE BLVD.
TO NORTH MACEDO BLVD.SIDEWALK 0.37 -25,663 TALT
-128,320 TALU
-1,303 TALT -155,286
4368591TULIP BLVD. FROM COLLEGE PARK RD. TO CHERRY
HILL RD.SIDEWALK 1.664 60 TALT
425,068 TALU
27,327 TALU 452,455
4400181 MACEDO BLVD FROM SELVITZ RD TO ST JAMES DR BIKE PATH/TRAIL 1.049 5,000 TALU 5,000
4393261 ST. LUCIE UPWP FY 2016/2017-2017/2018 TRANSPORTATION PLANNING 0 397,026 PL 397,026
4393262 ST. LUCIE FY 2018/2019-2019/2020 UPWP TRANSPORTATION PLANNING 0 161,839 PL 161,839
2302566KINGS HWY FROM 500 feet S OF OKEECHOBEE
ROAD TO NORTH OF PICOS ROADADD LANES & RECONSTRUCT 2.2 6,375,807 SA
1,577,051 SU
16,778 TALT 7,969,636
GRAND TOTAL 29,644,310

St. Lucie TPO Transportation Improvement Program - FY 2019/20 - FY 2023/2024
B-11
FTA OBLIGATED FUNDING
FTA GRANT
NUMBERCOUNTY
FTA
GRANTEE
FEDERAL
FUND
CODE
FTA PROJECT
DESCRIPTION
TOTAL FTA
FUNDS
IN TIP
TOTAL
FEDERAL
FUNDS
OBLIGATED
TOTAL
LOCAL
FUNDS
TOTAL
FL-2018-054-00 SLC SLC 5307 Capital/Operating $2,694,000 $2,124,103 $1,142,701 $5,960,804
FL-2018-053-00 SLC SLC 5339 Bus and Bus Facilities $197,400 $193,773.00 $0 $391,173
G1478 (FDOT) SLC SLC 5311 Operating $219,668 $53,147.00 $53,147.00 $325,962
Section 5310 (FDOT) SLC SLC 5310
Elderly and
individuals with
disabilities
$0 $70,456.00 $17,614.00 $88,070
TOTAL $3,111,068 $2,441,479 $1,213,462 $6,766,009

St. Lucie TPO Transportation Improvement Program - FY 2019/20 - FY 2023/2024
B-12
B.9 CERTIFICATIONS
To ensure Federal requirements are being met, the FHWA and FTA conduct Federal certification reviews on a quadrennial basis of the urbanized areas of TPOs/MPOs which also are designated by census as Transportation Management Areas (TMAs) because the population exceeds 200,000 people. The urbanized area of the St. Lucie TPO is designated as the Port St. Lucie TMA. The last Federal review of the TMA was completed in September 2017 and resulted in no corrective actions, five noteworthy practices, and six recommendations were identified to improve the current planning process of the TPO. The next FHWA/FTA quadrennial certification review is expected to be completed by September 2021.
The TPO and FDOT also perform joint certification reviews annually to ensure that State and Federal requirements are being met. The last joint certification review was completed in May 2019 which resulted in the joint certification of the St. Lucie TPO. Support documentation concerning the Federal and joint certification reviews is on file at the St. Lucie TPO offices and available for review during normal business hours.
B.10 CONGESTION MANAGEMENT PROCESS (CMP)
The development and implementation of a CMP is a requirement to be eligible for Federal funding. CMP Box Funds in the amount of$300,000 - $400,000 annually have been established by the St. Lucie TPO. Beyond the five fiscal years of the TIP, the LRTP continues to allocate a total of approximately $3.25 million in funding towards the CMP through 2040.
The overall purpose of the St. Lucie TPO CMP is to create a better quality of life for St. Lucie residents and visitors through lowering travel delay, reducing harmful emissions, and improving safety. The CMP identifies areas with congestion or safety issues, develops strategies to address the issues, and prioritizes projects based a ranking criteria.
The St. Lucie TPO CMP was adopted in 2018, and a two-tiered approach (Phase I and Phase II) was utilized in the CMP to identify projects. The Phase I analysis provided a system-wide screening for areas of concern. The Phase II analysis included a detailed evaluation of the identified areas of concern. Based on the results of the Phase II evaluation, CMP projects were identified, and a project scoring criteria and the basis for the CMP Implementation Plan were developed.
Incorporating multimodal performance measures, the CMP Implementation Plan utilizes both traditional and non-traditional strategies to address the areas of concern, to reduce vehicle miles traveled, and to consider climate adaptation and proposes improvements which support multimodal elements and safety. The CMP projects from the CMP Implementation Plan that are not funded in the TIP may be added to CMP List of the TPO�s LOPP for future funding with the CMP Box Funds.

St. Lucie TPO Transportation Improvement Program - FY 2019/20 - FY 2023/2024
B-13
B.11 TRANSPORTATION DISADVANTAGED (TD) PROGRAM
TD services are facilitated by the St. Lucie TPO pursuant to Florida Statute 427.015. The projects and costs of the St. Lucie TPO TDProgram are summarized in the following:
Commission for the Transportation Disadvantaged
Trip & Equipment Grant Allocations
FY 2018-2019
COUNTYTRIP/EQUIP
GRANT
LOCAL
TRIP/EQUIP
MATCH
TOTAL
TRIP/EQUIP
FUNDS
VOLUNTARY
DOLLARS FM/Job #
43202818401
VOLUNTARY
DOLLARS LOCAL
MATCH
TOTAL
VOLUNTARY
DOLLARS
PLANNING GRANT
ALLOCATION
TOTAL
ESTIMATED
PROJECT
FUNDING
Saint Lucie $573,002 $63,667 $636,669 $56 $6 $62 $25,777 $662,508

St. Lucie TPO Transportation Improvement Program - FY 2019/20 - FY 2023/2024
B-14
B.12 TRANSPORTATION REGIONAL INCENTIVE PROGRAM (TRIP)
In 2005, the Florida Legislature enacted the Florida TRIP through Senate Bill 360. The stated purpose of the program is to encourageregional planning by providing state matching funds for improvements to regionally-significant transportation facilities identified andprioritized by regional partners. According to FDOT, two primary program requirements are as follows:
Eligible recipients must be a partner, through an Interlocal Agreement, to a regional transportation planning entity; and,The partners must represent a regional transportation planning area and develop a plan that identifies and prioritizes regionallysignificant facilities.
To satisfy the application requirements for TRIP funding, an Interlocal Agreement was executed by the St. Lucie TPO, Martin MPO, andIndian River MPO to create a regional transportation planning entity known as the Treasure Coast Transportation Council (TCTC). The TCTCsubsequently adopted a plan to identify and prioritize regionally significant facilities for the selection of projects for TRIP funding. This plansubsequently was updated in 2016.
St. Lucie TPO projects currently programmed in this TIP include $6,362,059 of TRIP funding. The PORT ST LUCIE BLVD project (#4317524and #4317526) is receiving $4,248,423 in TRIP funding, and the I-95 AT ST LUCIE WEST BLVD project (#4353371) is receiving$2,113,636 in TRIP funding.

St. Lucie TPO Transportation Improvement Program - FY 2019/20 - FY 2023/2024
C 1-1
C. DETAILED PROJECT LISTINGS
C.1 HIGHWAY/ROADWAY/SIDEWALK

St. Lucie TPO Transportation Improvement Program - FY 2019/20 - FY 2023/2024
ALCANTARRA BLVD FROM SW SAVONA BLVD TO SW PORT ST.LUCIE BLVD4443491 Non-SIS
Project Description: SIDEWALKExtra Description: 2019 TPO TAP PRIORITY #2 LAP W/ THE CITY OF PORT ST. LUCIELead Agency: MANAGED BY FDOTLength: 0.8
From: SW SAVONA BLVDTo: SW PORT ST.LUCIE BLVD
Phase Group: PRELIMINARY ENGINEERING, CONSTRUCTION
Phase Fund Code 2020 2021 2022 2023 2024 Total
PE TALU 5,000 0 0 0 0 5,000
CST TALT 0 0 325,398 0 0 325,398
CST TALU 0 0 22,376 0 0 22,376
CST LF 0 0 253,791 0 0 253,791
5,000 601,565 606,565
Prior Year Cost: 0Future Year Cost: 0Total Project Cost: 606,565LRTP: Page 6-11
Notes
C 1-2

St. Lucie TPO Transportation Improvement Program - FY 2019/20 - FY 2023/2024
CURTIS STREET FROM NW PRIMA VISTA BLVD TO NW FLORESTA DRIVE4443481 Non-SIS
Project Description: SIDEWALKExtra Description: 2019 TPO TAP PRIORITY #1 LAP WITH CITY OF PORT ST.LUCIELead Agency: MANAGED BY FDOTLength: 0.543
From: NW PRIMA VISTA BLVDTo: NW FLORESTA DRIVE
Phase Group: PRELIMINARY ENGINEERING, CONSTRUCTION
Phase Fund Code 2020 2021 2022 2023 2024 Total
PE TALU 5,000 0 0 0 0 5,000
CST TALT 0 0 344,112 0 0 344,112
CST LF 0 0 223,261 0 0 223,261
5,000 567,373 572,373
Prior Year Cost: 0Future Year Cost: 0Total Project Cost: 572,373LRTP: Page 6-10
Notes
C 1-3

St. Lucie TPO Transportation Improvement Program - FY 2019/20 - FY 2023/2024
EDWARDS ROAD SINKHOLE REPAIR - HURRICANE IRMA PERMANENT RESTORATION4432241 Non-SIS
Project Description: EMERGENCY OPERATIONSExtra Description: GOVERNOR EXECUTIVE ORDER #17-235, DTD 09/04/2017 PERMANENT REPAIRPH:58 DDIR#IR-94-003 SIGNED BY M.CLASGENS 01/02/2018 LIMITS: W. OLEANDER AVE TO US-1Lead Agency: MANAGED BY FDOTLength: 0.493
From:To:
Phase Group: PRELIMINARY ENGINEERING, CONSTRUCTION
Phase Fund Code 2020 2021 2022 2023 2024 Total
CST ACER 2,675,926 0 0 0 0 2,675,926
2,675,926 2,675,926
Prior Year Cost: 15,000Future Year Cost: 0Total Project Cost: 2,690,926LRTP: Page 7-1
Notes
C 1-4

St. Lucie TPO Transportation Improvement Program - FY 2019/20 - FY 2023/2024
FEC OVERPASS FROM SAVANNAS RECREATION AREA TO SOUTH OF SAVANNAH ROAD4400321 Non-SIS
Project Description: BIKE PATH/TRAILExtra Description: SUNTRAILLead Agency: MANAGED BY FDOTLength: 0.14
From: SAVANNAS RECREATION AREATo: SOUTH OF SAVANNAH RD.
Phase Group: P D & E, PRELIMINARY ENGINEERING, RIGHT OF WAY, RAILROAD & UTILITIES,ENVIRONMENTAL
Phase Fund Code 2020 2021 2022 2023 2024 Total
PE DIH 0 0 5,000 0 0 5,000
PE TLWR 0 0 305,000 0 0 305,000
ROW DIH 0 0 0 12,000 0 12,000
ROW DS 0 0 0 47,377 0 47,377
RRU TLWR 0 0 20,000 0 0 20,000
ENV TLWR 0 0 0 115,000 0 115,000
330,000 174,377 504,377Prior Year Cost: 106,220Future Year Cost: 0Total Project Cost: 610,597LRTP: Page 6-11
Notes
C 1-5

St. Lucie TPO Transportation Improvement Program - FY 2019/20 - FY 2023/2024
GATLIN BLVD FROM WEST OF I-95 TO PORT ST LUCIE BLVD4447071 Non-SIS
Project Description: TRAFFIC CONTROL DEVICES/SYSTEMExtra Description: 2019 TPO CMP PRIORITY #4 LAP WITH PORT ST LUCIE INSTALL TRAFFICCAMERAS AT SIGNALIZED INTERSECTIONS; OPTIMIZE GREEN TIME, ADD ADAPTIVE TRAFFIC SIGNALCONTROLLead Agency: MANAGED BY FDOTLength: 0
From: WEST OF I-95To: PORT ST LUCIE BLVD
Phase Group: PRELIMINARY ENGINEERING, CONSTRUCTION
Phase Fund Code 2020 2021 2022 2023 2024 Total
PE SA 0 0 5,000 0 0 5,000
CST SU 0 0 0 0 293,400 293,400
5,000 293,400 298,400
Prior Year Cost: 0Future Year Cost: 0Total Project Cost: 298,400LRTP: Page 6-5
Notes
C 1-6

St. Lucie TPO Transportation Improvement Program - FY 2019/20 - FY 2023/2024
I-95 @ BECKER ROAD INTERCHANGE4413141 SIS
Project Description: LANDSCAPINGExtra Description: STANDALONE INDEPENDENT PROJECTLead Agency: MANAGED BY FDOTLength: 0.478
From: I-95To: BECKER ROAD INTERCHANGE
Phase Group: PRELIMINARY ENGINEERING, CONSTRUCTION, ENVIRONMENTAL
Phase Fund Code 2020 2021 2022 2023 2024 Total
CST DDR 0 0 762,207 0 0 762,207
CST DIH 0 0 51,242 0 0 51,242
813,449 813,449
Prior Year Cost: 138,940Future Year Cost: 0Total Project Cost: 952,389LRTP: Page 7-1
Notes
C 1-7

St. Lucie TPO Transportation Improvement Program - FY 2019/20 - FY 2023/2024
I-95 @ ST LUCIE WEST BLVD4353371 SIS
Project Description: INTERCHANGE - ADD LANESExtra Description: 2017 TPO PRIORITY #5 FROM COMMERCE CENTER DRIVE TO PEACOCK BLVD.,WIDENING OF ROADWAY TO ACCOMMODATE THREE EB LANES AND TWO WB LANES ACROSS THEBRIDGE OVER I-95 AND BUILD A NEW EB BRIDGE. WIDENING THE SOUTHBOUND OFF RAMPINTERSECTION TO PROVIDE TWO LEFT TURN LANES AND ONE RIGHT TURN LANE. WIDENING THE...Lead Agency: MANAGED BY FDOTLength: 1.814
From: SR-9/I-95To: ST LUCIE WEST BLVD
Phase Group: PRELIMINARY ENGINEERING, RAILROAD & UTILITIES, CONSTRUCTION, CONTRACTINCENTIVES, ENVIRONMENTAL
Phase Fund Code 2020 2021 2022 2023 2024 Total
RRU DDR 0 400,000 0 0 0 400,000
CST LF 0 0 3,100,000 0 0 3,100,000
CST DDR 0 0 10,153,103 0 0 10,153,103
CST DIH 0 0 108,786 0 0 108,786
CST TRIP 0 0 2,113,636 0 0 2,113,636
CST TRWR 0 0 565,884 0 0 565,884
INC DDR 0 0 150,000 0 0 150,000
ENV DDR 30,000 0 0 0 0 30,000
30,000 400,000 16,191,409 16,621,409
Prior Year Cost: 1,196,654Future Year Cost: 0Total Project Cost: 17,818,063LRTP: Page 6-2
Notes
C 1-8

St. Lucie TPO Transportation Improvement Program - FY 2019/20 - FY 2023/2024
I-95 FROM MARTIN/ST. LUCIE COUNTY LINE TO OKEECHOBEE ROAD4226816 SIS
Project Description: PD&E/EMO STUDYLead Agency: MANAGED BY FDOTLength: 15.499
From: MARTIN/ST. LUCIE COUNTY LINETo: OKEECHOBEE ROAD
Phase Group: P D & E
Phase Fund Code 2020 2021 2022 2023 2024 Total
PDE ACNP 0 0 0 0 550,000 550,000
550,000 550,000
Prior Year Cost: 2,536,059Future Year Cost: 2,110,000Total Project Cost: 11,992,052LRTP: Page 7-1
Notes
C 1-9
St. Lucie TPO Transportation Improvement Program - FY 2019/20 - FY 2023/2024
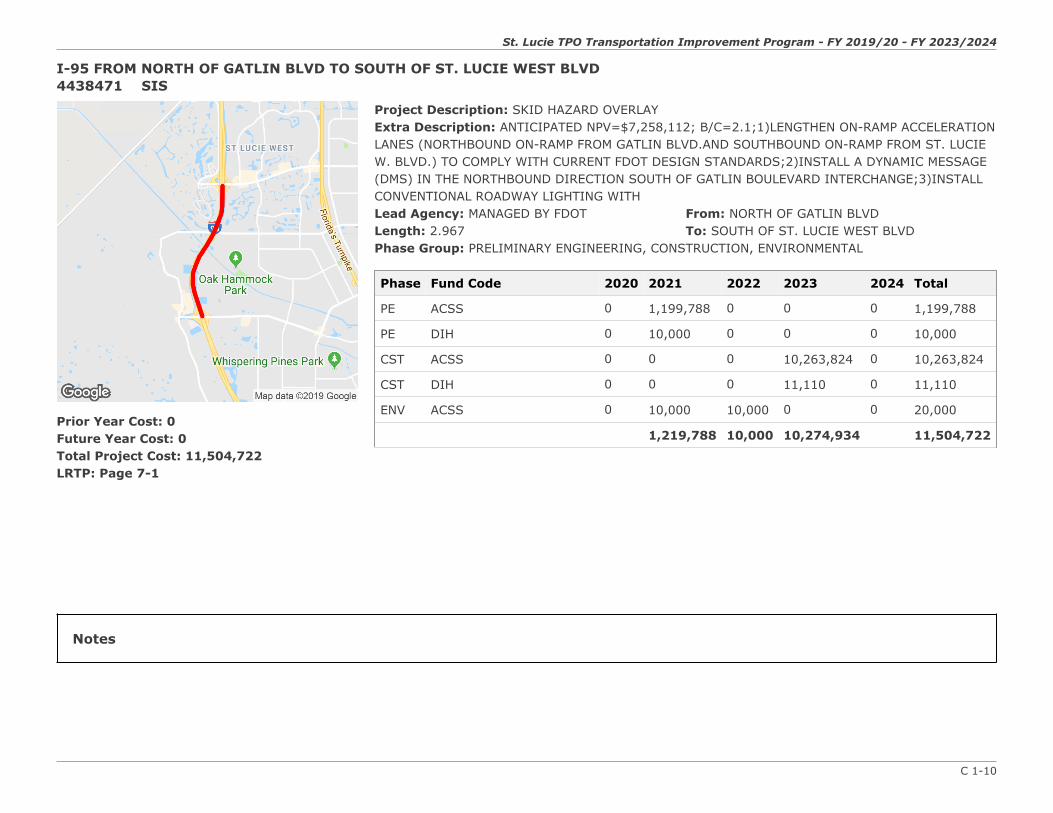
I-95 FROM NORTH OF GATLIN BLVD TO SOUTH OF ST. LUCIE WEST BLVD4438471 SIS
Project Description: SKID HAZARD OVERLAYExtra Description: ANTICIPATED NPV=$7,258,112; B/C=2.1;1)LENGTHEN ON-RAMP ACCELERATIONLANES (NORTHBOUND ON-RAMP FROM GATLIN BLVD.AND SOUTHBOUND ON-RAMP FROM ST. LUCIEW. BLVD.) TO COMPLY WITH CURRENT FDOT DESIGN STANDARDS;2)INSTALL A DYNAMIC MESSAGE(DMS) IN THE NORTHBOUND DIRECTION SOUTH OF GATLIN BOULEVARD INTERCHANGE;3)INSTALLCONVENTIONAL ROADWAY LIGHTING WITHLead Agency: MANAGED BY FDOTLength: 2.967
From: NORTH OF GATLIN BLVDTo: SOUTH OF ST. LUCIE WEST BLVD
Phase Group: PRELIMINARY ENGINEERING, CONSTRUCTION, ENVIRONMENTAL
Phase Fund Code 2020 2021 2022 2023 2024 Total
PE ACSS 0 1,199,788 0 0 0 1,199,788
PE DIH 0 10,000 0 0 0 10,000
CST ACSS 0 0 0 10,263,824 0 10,263,824
CST DIH 0 0 0 11,110 0 11,110
ENV ACSS 0 10,000 10,000 0 0 20,000
1,219,788 10,000 10,274,934 11,504,722Prior Year Cost: 0Future Year Cost: 0Total Project Cost: 11,504,722LRTP: Page 7-1
Notes
C 1-10

St. Lucie TPO Transportation Improvement Program - FY 2019/20 - FY 2023/2024
I-95 NORTHBOUND AND SOUTHBOUND OFF-RAMPS AT GATLIN BLVD.4397611 SIS
Project Description: INTERCHANGE - ADD LANESExtra Description: GATLIN BLVD AT NORTHBOUND & SOUTHBOUND OFF-RAMP INTERSECTIONSHORT TERM IMPROVEMENTS: A)ADD A THIRD LEFT AND TRIPLE RIGHT TURN LANES ON SB OFF-RAMP WITH MINOR WIDENING TO RECEIVING LANES ON GATLIN BLVD. B) ADD THIRD LEFT TURNLANE AND DUAL RIGHT TURN LANES ON NB OFF-RAMP.Lead Agency: MANAGED BY FDOTLength: 0.954
From: OFF-RAMPSTo: GATLIN BLVD
Phase Group: PRELIMINARY ENGINEERING, RAILROAD & UTILITIES, CONSTRUCTION,ENVIRONMENTAL
Phase Fund Code 2020 2021 2022 2023 2024 Total
RRU ACFP 0 20,000 0 0 0 20,000
CST ACFP 0 0 3,709,879 0 0 3,709,879
ENV DDR 0 20,000 0 0 0 20,000
40,000 3,709,879 3,749,879
Prior Year Cost: 991,152Future Year Cost: 0Total Project Cost: 4,741,031LRTP: Page 6-2
Notes
C 1-11

St. Lucie TPO Transportation Improvement Program - FY 2019/20 - FY 2023/2024
I-95 NORTHBOUND AND SOUTHBOUND OFF-RAMPS AT MIDWAY ROAD4397541 SIS
Project Description: INTERCHANGE - ADD LANESExtra Description: MIDWAY ROAD AT I-95 NB & SB OFF-RAMP INTERSECTION SHORT TERMIMPROVEMENTS; A)ADD SECOND LEFT TURN LANES TO BOTH NB AND SB OFF-RAMPSLead Agency: MANAGED BY FDOTLength: 0.775
From: OFF-RAMPSTo: MIDWAY RD
Phase Group: PRELIMINARY ENGINEERING, RAILROAD & UTILITIES, CONSTRUCTION,ENVIRONMENTAL
Phase Fund Code 2020 2021 2022 2023 2024 Total
PE DIH 20,000 0 0 0 0 20,000
PE DS 230,000 0 0 0 0 230,000
RRU DS 10,000 0 0 0 0 10,000
CST DIH 0 0 57,472 0 0 57,472
CST DS 0 0 1,468,717 0 0 1,468,717
ENV DS 10,000 30,000 0 0 0 40,000
270,000 30,000 1,526,189 1,826,189Prior Year Cost: 0Future Year Cost: 0Total Project Cost: 1,826,189LRTP: Page 6-2
Notes
C 1-12

St. Lucie TPO Transportation Improvement Program - FY 2019/20 - FY 2023/2024
KINGS HIGHWAY @ INDRIO ROAD4241431 Non-SIS
Project Description: ADD TURN LANE(S)Extra Description: INTERSECTION IMPROVEMENT; CIGP/TRIP FOR R/W; 2013 TPO #4 REPROGRAMAS DOT PROJECT TO ACQUIRE R/W**DO NOT FEDERALIZE** DOT AND COUNTY TO SPLIT ROW;COUNTY TO PAY FOR CONSTRUCTION REC CHECK FROM ST.LUCIE CO. FOR $3,817,948 ON 07/09/09REC CHECK FROM ST.LUCIE CO. FOR $2,709,534 ON 06/13/13 **VERIFY LF EXPENDITURESW/COMPTROLLER PRIOR TO UPDATING**Lead Agency: MANAGED BY FDOTLength: 1.084
From: SR-713To: SR-614
Phase Group: PRELIMINARY ENGINEERING, RIGHT OF WAY, ENVIRONMENTAL
Phase Fund Code 2020 2021 2022 2023 2024 Total
ROW LFP 2,464,071 0 0 0 0 2,464,071
2,464,071 2,464,071
Prior Year Cost: 8,711,221Future Year Cost: 0Total Project Cost: 11,175,292LRTP: Page 6-2
Notes
C 1-13

St. Lucie TPO Transportation Improvement Program - FY 2019/20 - FY 2023/2024
KINGS HIGHWAY FROM NORTH OF COMMERCIAL CIRCLE TO NORTH OF ST LUCIE BLVD4383792 Non-SIS
Project Description: ADD LANES & RECONSTRUCTExtra Description: 2017 TPO PRIORITY #4 WIDENING FROM 2 TO 4 LANES; PD&E UNDER 230256-5Lead Agency: MANAGED BY FDOTLength: 1.21
From: NORTH OF COMMERCIAL CIRCLETo: NORTH OF ST LUCIE BLVD
Phase Group: PRELIMINARY ENGINEERING, RIGHT OF WAY, CONSTRUCTION, ENVIRONMENTAL
Phase Fund Code 2020 2021 2022 2023 2024 Total
ROW SU 0 656,819 0 0 0 656,819
ROW DDR 1,004,226 684,559 2,000,000 0 0 3,688,785
ROW DIH 133,673 0 0 0 0 133,673
CST DDR 0 0 0 12,829,249 0 12,829,249
CST DIH 0 0 0 387,010 0 387,010
CST DS 0 0 0 16,583,548 0 16,583,548
ENV DDR 75,000 0 0 0 0 75,000
1,212,899 1,341,378 2,000,000 29,799,807 34,354,084Prior Year Cost: 4,342,411Future Year Cost: 0Total Project Cost: 83,222,192LRTP: Page 6-5
Notes
C 1-14

St. Lucie TPO Transportation Improvement Program - FY 2019/20 - FY 2023/2024
KINGS HWY FR N OF I-95 OVERPASS TO N OF COMMERCIAL CIR4383791 Non-SIS
Project Description: ADD LANES & RECONSTRUCTExtra Description: 2017 TPO PRIORITY #4 WIDENING 2 TO 4 LANES PD&E UNDER 230256-5Lead Agency: MANAGED BY FDOTLength: 1.4
From: N OF I-95 OVERPASSTo: N OF COMMERCIAL CIR
Phase Group: PRELIMINARY ENGINEERING, RIGHT OF WAY, CONSTRUCTION, ENVIRONMENTAL
Phase Fund Code 2020 2021 2022 2023 2024 Total
ROW DDR 12,740,314 64,992 0 0 0 12,805,306
ROW DIH 106,090 106,090 0 0 0 212,180
CST DDR 0 0 0 16,120,659 0 16,120,659
CST DIH 0 0 0 396,144 0 396,144
CST DS 0 0 0 12,916,408 0 12,916,408
ENV DDR 5,000 0 60,000 0 0 65,000
12,851,404 171,082 60,000 29,433,211 42,515,697
Prior Year Cost: 4,342,411Future Year Cost: 0Total Project Cost: 83,222,192LRTP: Page 6-5
Notes
C 1-15

St. Lucie TPO Transportation Improvement Program - FY 2019/20 - FY 2023/2024
KINGS HWY FROM 500 FEET S OF OKEECHOBEE ROAD TO NORTH OF PICOS ROAD2302566 SIS
Project Description: ADD LANES & RECONSTRUCTExtra Description: PE/ENGINEERING UNDER 230256-2 2012 TPO PRIORITY #2 1,550 FT OFPROJECT WILL BE CONCRETE, BALANCE IS FLEXIBLE PAVEMENT PH5202=LFA WITH ST LUCIECOUNTY; $187,669 LF REC'D 3/1/17Lead Agency: MANAGED BY FDOTLength: 2.2
From: 500 feet S OF OKEECHOBEETo: NORTH OF PICOS ROAD
Phase Group: RIGHT OF WAY, RAILROAD & UTILITIES, CONSTRUCTION, ENVIRONMENTAL
Phase Fund Code 2020 2021 2022 2023 2024 Total
ROW GFSA 65,007 0 0 0 0 65,007
ROW SA 192,741 0 0 0 0 192,741
ROW SU 656,235 0 0 0 0 656,235
ROW DDR 1,907,675 0 0 0 0 1,907,675
ROW DS 7,000 0 0 0 0 7,000
2,828,658 2,828,658
Prior Year Cost: 71,626,501Future Year Cost: 0Total Project Cost: 83,381,682LRTP: Page 6-5
Notes
C 1-16
St. Lucie TPO Transportation Improvement Program - FY 2019/20 - FY 2023/2024
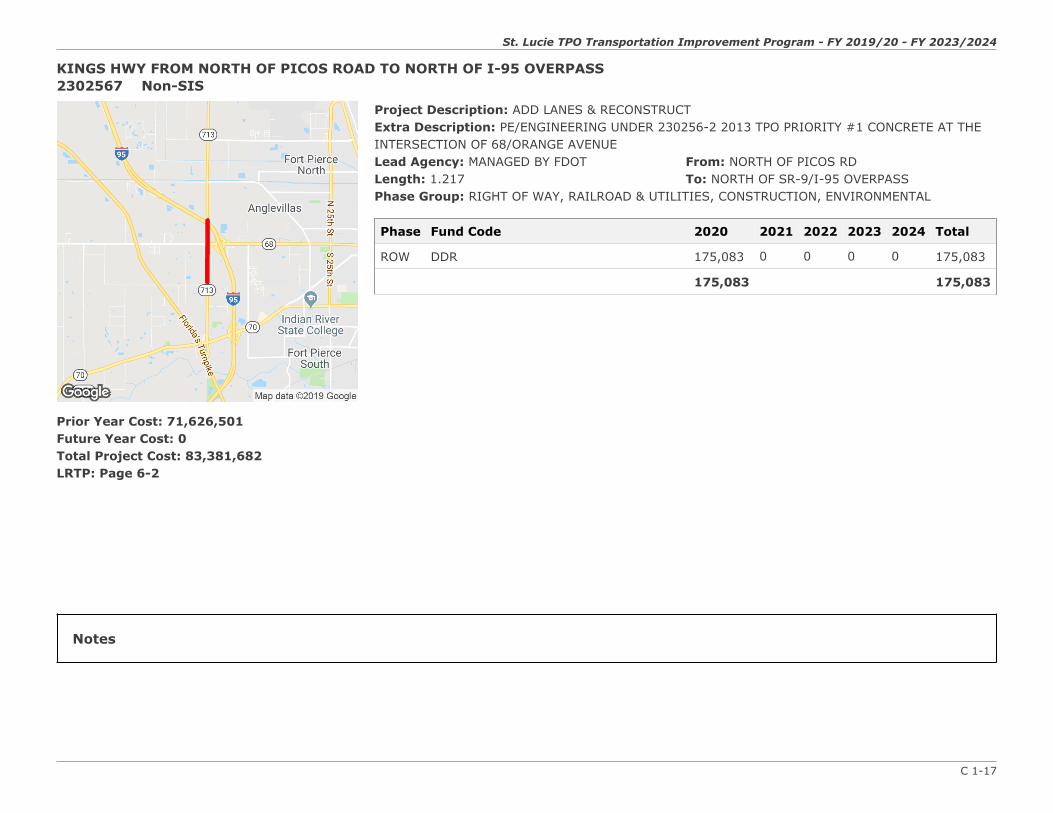
KINGS HWY FROM NORTH OF PICOS ROAD TO NORTH OF I-95 OVERPASS2302567 Non-SIS
Project Description: ADD LANES & RECONSTRUCTExtra Description: PE/ENGINEERING UNDER 230256-2 2013 TPO PRIORITY #1 CONCRETE AT THEINTERSECTION OF 68/ORANGE AVENUELead Agency: MANAGED BY FDOTLength: 1.217
From: NORTH OF PICOS RDTo: NORTH OF SR-9/I-95 OVERPASS
Phase Group: RIGHT OF WAY, RAILROAD & UTILITIES, CONSTRUCTION, ENVIRONMENTAL
Phase Fund Code 2020 2021 2022 2023 2024 Total
ROW DDR 175,083 0 0 0 0 175,083
175,083 175,083
Prior Year Cost: 71,626,501Future Year Cost: 0Total Project Cost: 83,381,682LRTP: Page 6-2
Notes
C 1-17

St. Lucie TPO Transportation Improvement Program - FY 2019/20 - FY 2023/2024
KINGS HWY FROM NORTH OF PICOS ROAD TO NORTH OF I-95 OVERPASS4380411 Non-SIS
Project Description: LANDSCAPINGExtra Description: STANDALONE DEPENDENT PROJECT FOR 230256-7Lead Agency: MANAGED BY FDOTLength: 1.552
From: NORTH OF PICOS RDTo: NORTH OF I-95 OVERPASS
Phase Group: PRELIMINARY ENGINEERING, CONSTRUCTION, ENVIRONMENTAL
Phase Fund Code 2020 2021 2022 2023 2024 Total
PE DIH 0 5,000 0 0 0 5,000
PE DS 0 131,525 0 0 0 131,525
CST DDR 0 0 0 0 466,440 466,440
CST DIH 0 0 0 0 33,856 33,856
ENV DS 0 5,000 0 0 0 5,000
141,525 500,296 641,821
Prior Year Cost: 0Future Year Cost: 0Total Project Cost: 641,821LRTP: Page 6-2
Notes
C 1-18

St. Lucie TPO Transportation Improvement Program - FY 2019/20 - FY 2023/2024
KINGS HWY FROM NORTH OF ST LUCIE BLVD TO SOUTH OF INDRIO ROAD4383793 Non-SIS
Project Description: ADD LANES & RECONSTRUCTExtra Description: 2019 TPO PRIORITY #6 WIDENING FROM 2 TO 4 LANES; PD&E UNDER 230256-5R/W REQUIREDLead Agency: MANAGED BY FDOTLength: 2.19
From: ST LUCIE BOULEVARDTo: SOUTH OF INDRIO ROAD
Phase Group: PRELIMINARY ENGINEERING
Phase Fund Code 2020 2021 2022 2023 2024 Total
PE DDR 2,000,000 0 0 0 0 2,000,000
PE DIH 10,000 0 0 0 0 10,000
2,010,000 2,010,000
Prior Year Cost: 4,342,411Future Year Cost: 0Total Project Cost: 83,222,192LRTP: Page 6-5
Notes
C 1-19

St. Lucie TPO Transportation Improvement Program - FY 2019/20 - FY 2023/2024
KINGS HWY FROM SOUTH OF OKEECHOBEE ROAD TO NORTH OF PICOS ROAD2302568 Non-SIS
Project Description: LANDSCAPINGExtra Description: STANDALONE DEPENDENT PROJECT FOR 230256-6Lead Agency: MANAGED BY FDOTLength: 1.89
From: 800 feet S OF OKEECHOBEETo: NORTH OF PICOS RD
Phase Group: PRELIMINARY ENGINEERING, CONSTRUCTION
Phase Fund Code 2020 2021 2022 2023 2024 Total
PE DDR 0 126,500 0 0 0 126,500
PE DIH 0 10,000 0 0 0 10,000
CST DDR 0 0 0 0 601,636 601,636
CST DIH 0 0 0 0 43,668 43,668
136,500 645,304 781,804
Prior Year Cost: 71,626,501Future Year Cost: 0Total Project Cost: 83,381,682LRTP: Page 6-5
Notes
C 1-20

St. Lucie TPO Transportation Improvement Program - FY 2019/20 - FY 2023/2024
MIDWAY ROAD FROM GLADES CUT OFF ROAD TO SELVITZ ROAD2314403 Non-SIS
Project Description: ADD LANES & RECONSTRUCTExtra Description: 2019 TPO PRIORITY #2 WIDENING FROM 2 TO 4 LANES LFA WITH ST. LUCIECOUNTY FOR PD&E AND DESIGN CK #09828620 REC'D FR ST. LUCIE CO. BCC FOR 1.65M ON 10/7/14FOR PD&E.THIS IS A CAT2; CST RESERVE ON 438543-1 CHECK REC'D 1/25/2017 FROM ST.LUCIE CO.$2,108,000 PH32/37Lead Agency: MANAGED BY FDOTLength: 1.577
From: GLADES CUT OFF ROADTo: SELVITZ ROAD
Phase Group: PRELIMINARY ENGINEERING, RIGHT OF WAY, RAILROAD & UTILITIES,ENVIRONMENTAL, P D & E
Phase Fund Code 2020 2021 2022 2023 2024 Total
ROW ACSU 143,202 0 0 0 0 143,202
ROW SA 0 582,781 0 0 0 582,781
ROW SU 0 2,692,273 0 0 0 2,692,273
ENV SU 20,000 0 0 0 0 20,000
163,202 3,275,054 3,438,256Prior Year Cost: 70,091,340Future Year Cost: 0Total Project Cost: 77,542,534LRTP: Page 6-5
Notes
C 1-21

St. Lucie TPO Transportation Improvement Program - FY 2019/20 - FY 2023/2024
MIDWAY ROAD FROM GLADES CUT OFF ROAD TO SELVITZ ROAD - RESERVE4385431 Non-SIS
Project Description: FUNDING ACTIONExtra Description: 2019 TPO PRIORITY #2 RESERVE FOR FM 231440-3Lead Agency: MANAGED BY FDOTLength: 0
From: GLADES CUT OFF ROADTo: SELVITZ ROAD
Phase Group: CONSTRUCTION
Phase Fund Code 2020 2021 2022 2023 2024 Total
CST SA 0 0 0 0 1,000,000 1,000,000
CST SU 0 0 0 0 1,000,000 1,000,000
2,000,000 2,000,000
Prior Year Cost: 0Future Year Cost: 0Total Project Cost: 2,000,000LRTP: Page 6-5
Notes
C 1-22

St. Lucie TPO Transportation Improvement Program - FY 2019/20 - FY 2023/2024
MIDWAY ROAD FROM S. 25TH STREET TO US-12314402 Non-SIS
Project Description: ADD LANES & RECONSTRUCTExtra Description: WIDEN 2 LANES TO 4 LANES/10MPO PRIORITY# 1 REPLACE EXISTINGBRIDGE,ADA RAMPS AT 3 SIGNALIZED INTERSEC CONSTRUCT 5'SIDEWALKS,LANDSCAPING,LIGHTING,BRICK PAVERS, DRAINAGE,4' BIKE LANE ON ROADWAY/PD&EBY COUNTY=SEG#1 LFA WITH COUNTY FOR PHASE 4B $246,723=LFF PH 4B (SEE IC) R/WFUNDED/SAFETEA-LU EARMARK HPP 610 (FOR C2 DESC SEE SC)Lead Agency: MANAGED BY FDOTLength: 1.803
From: S. 25TH STREET/SR-615To: SR-5/US-1
Phase Group: PRELIMINARY ENGINEERING, RAILROAD & UTILITIES, CONSTRUCTION,ENVIRONMENTAL, RIGHT OF WAY
Phase Fund Code 2020 2021 2022 2023 2024 Total
ROW ACSU 100,000 0 0 0 0 100,000
ROW SA 0 27,117 0 0 0 27,117
100,000 27,117 127,117
Prior Year Cost: 70,091,340Future Year Cost: 0Total Project Cost: 77,542,534LRTP: Page 6-2
Notes
C 1-23

St. Lucie TPO Transportation Improvement Program - FY 2019/20 - FY 2023/2024
N. 25TH ST FROM NORTH OF AVE Q TO ST LUCIE BLVD4439971 Non-SIS
Project Description: RESURFACINGLead Agency: MANAGED BY FDOTLength: 1.207
From: NORTH OF AVE QTo: ST LUCIE BLVD
Phase Group: PRELIMINARY ENGINEERING, CONSTRUCTION, ENVIRONMENTAL
Phase Fund Code 2020 2021 2022 2023 2024 Total
PE DDR 299,939 0 0 0 0 299,939
PE DIH 15,000 0 0 0 0 15,000
CST DDR 0 0 1,491,475 0 0 1,491,475
CST DIH 0 0 58,362 0 0 58,362
ENV DS 10,000 5,000 0 0 0 15,000
324,939 5,000 1,549,837 1,879,776
Prior Year Cost: 0Future Year Cost: 0Total Project Cost: 1,879,776LRTP: Page 7-1
Notes
C 1-24

St. Lucie TPO Transportation Improvement Program - FY 2019/20 - FY 2023/2024
NORTH MACEDO BLVD FROM SELVITZ RD TO ST JAMES DR4400181 Non-SIS
Project Description: BIKE PATH/TRAILExtra Description: 2016 TPO TAP PRIORITY #1 LAP W/CITY OF PORT ST. LUCIELead Agency: MANAGED BY FDOTLength: 1.049
From: SELVITZ RDTo: ST JAMES DR
Phase Group: PRELIMINARY ENGINEERING, CONSTRUCTION
Phase Fund Code 2020 2021 2022 2023 2024 Total
CST TALT 343,309 0 0 0 0 343,309
CST TALU 298,437 0 0 0 0 298,437
CST LF 152,683 0 0 0 0 152,683
794,429 794,429
Prior Year Cost: 5,000Future Year Cost: 0Total Project Cost: 804,429LRTP: Page 6-10
Notes
C 1-25

St. Lucie TPO Transportation Improvement Program - FY 2019/20 - FY 2023/2024
OKEECHOBEE ROAD @ MIDWAY ROAD4436851 SIS
Project Description: LIGHTINGExtra Description: ANTICIPATED NPV=$326,460; B/C=1.93; INSTALL NEW LIGHTING AT THESUBJECT INTERSECTION TO BE COMPLIANT WITH THE CURRENT FDOT STANDARDS.Lead Agency: MANAGED BY FDOTLength: 0.1
From: INTERSECTIONTo: INTERSECTION
Phase Group: PRELIMINARY ENGINEERING, CONSTRUCTION
Phase Fund Code 2020 2021 2022 2023 2024 Total
CST ACSS 326,226 0 0 0 0 326,226
326,226 326,226
Prior Year Cost: 71,651Future Year Cost: 0Total Project Cost: 397,877LRTP: Page 7-1
Notes
C 1-26

St. Lucie TPO Transportation Improvement Program - FY 2019/20 - FY 2023/2024
OLEANDER AVENUE FROM MIDWAY ROAD TO SOUTH MARKET AVENUE4415661 Non-SIS
Project Description: SIDEWALKExtra Description: 2017 TAP TPO PRIORITY #1 LAP W/ ST. LUCIE COUNTYLead Agency: MANAGED BY ST LUCIE COUNTYLength: 1.257
From: MIDWAY ROADTo: SOUTH MARKET AVENUE
Phase Group: CONSTRUCTION, PRELIMINARY ENGINEERING
Phase Fund Code 2020 2021 2022 2023 2024 Total
CST TALT 0 390,172 0 0 0 390,172
CST TALU 0 307,287 0 0 0 307,287
CST LF 0 236,203 0 0 0 236,203
933,662 933,662
Prior Year Cost: 5,000Future Year Cost: 0Total Project Cost: 938,662LRTP: Page 6-10
Notes
C 1-27

St. Lucie TPO Transportation Improvement Program - FY 2019/20 - FY 2023/2024
PORT ST LUCIE BLVD FROM DARWIN BLVD TO GATLIN BLVD4317524 Non-SIS
Project Description: ADD LEFT TURN LANE(S)Extra Description: TRIP JPA WITH CITY OF PORT ST LUCIE SIDEWALK, PED LIGHTING & CLOSEDDRAINAGELead Agency: RESPONSIBLE AGENCY NOTAVAILABLELength: 0.58
From: DARWIN BLVDTo: GATLIN BLVD
Phase Group: CONSTRUCTION
Phase Fund Code 2020 2021 2022 2023 2024 Total
CST LF 0 2,330,000 0 0 0 2,330,000
CST TRIP 0 1,006,345 0 0 0 1,006,345
CST TRWR 0 1,323,655 0 0 0 1,323,655
4,660,000 4,660,000
Prior Year Cost: 3,852,918Future Year Cost: 0Total Project Cost: 23,896,662LRTP: Page 6-6
Notes
C 1-28

St. Lucie TPO Transportation Improvement Program - FY 2019/20 - FY 2023/2024
PORT ST. LUCIE BLVD FROM BECKER ROAD TO PAAR DRIVE4317523 Non-SIS
Project Description: ADD LANES & RECONSTRUCTExtra Description: 2019 TPO PRIORITY #4 WIDENING FROM 2 TO 4 LANES FUND -5 BEFORE -3Lead Agency: MANAGED BY FDOTLength: 1.119
From: BECKER ROADTo: PAAR DRIVE
Phase Group: PRELIMINARY ENGINEERING, RIGHT OF WAY, ENVIRONMENTAL
Phase Fund Code 2020 2021 2022 2023 2024 Total
PE SU 2,010,000 0 0 0 0 2,010,000
ROW SU 0 0 0 2,657,773 0 2,657,773
ENV SU 0 50,000 10,000 0 0 60,000
2,010,000 50,000 10,000 2,657,773 4,727,773
Prior Year Cost: 3,852,918Future Year Cost: 0Total Project Cost: 23,896,662LRTP: Page 6-6
Notes
C 1-29

St. Lucie TPO Transportation Improvement Program - FY 2019/20 - FY 2023/2024
PORT ST. LUCIE BLVD FROM PAAR DRIVE TO DARWIN BLVD4317522 Non-SIS
Project Description: ADD LANES & RECONSTRUCTExtra Description: 2019 TPO PRIORITY #2 WIDENING FROM 2 TO 4 LANES CONSTRUCTION SPLITOUT TO SEG 5 AND 6 PH43 INCLUDES $121 TO COVER RECORDING FEESLead Agency: MANAGED BY FDOTLength: 1.946
From: PAAR DRIVETo: DARWIN BLVD
Phase Group: ENVIRONMENTAL, PRELIMINARY ENGINEERING, RIGHT OF WAY
Phase Fund Code 2020 2021 2022 2023 2024 Total
ROW SU 0 97,469 0 0 0 97,469
97,469 97,469
Prior Year Cost: 3,852,918Future Year Cost: 0Total Project Cost: 23,896,662LRTP: Page 6-5
Notes
C 1-30

St. Lucie TPO Transportation Improvement Program - FY 2019/20 - FY 2023/2024
PORT ST. LUCIE BLVD FROM SOUTH OF ALCANTARRA BV TO SOUTH OF DARWIN BLVD 4317526 Non-SIS
Project Description: ADD LANES & RECONSTRUCTExtra Description: 2019 TPO PRIORITY #2 WIDENING FROM 2 TO 4 LANES DESIGN AND RIGHT OFWAY ON 431752-2Lead Agency: MANAGED BY FDOTLength: 0.713
From: SOUTH OF ALCANTARRA BLVDTo: SOUTH OF DARWIN BLVD
Phase Group: RAILROAD & UTILITIES, CONSTRUCTION
Phase Fund Code 2020 2021 2022 2023 2024 Total
RRU SU 0 0 0 41,811 0 41,811
CST SA 0 0 0 0 413,097 413,097
CST SU 0 0 0 0 4,121,132 4,121,132
CST TRIP 0 0 0 0 3,242,078 3,242,078
CST TRWR 0 0 0 0 693,281 693,281
41,811 8,469,588 8,511,399
Prior Year Cost: 3,852,918Future Year Cost: 0Total Project Cost: 23,896,662LRTP: Page 6-6
Notes
C 1-31

St. Lucie TPO Transportation Improvement Program - FY 2019/20 - FY 2023/2024
PRIMA VISTA BLVD @ AIROSO BLVD4447061 Non-SIS
Project Description: INTERSECTION IMPROVEMENTExtra Description: 2019 TPO CMP PRIORITY #3 LAP WITH CITY OF PORT ST LUCIE ADD RAISEDMEDIANS; EMERGENCY SIGNAL AT SW SRAVENSWOOD LN; ADD MID-BLOCK CROSSWALKLead Agency: MANAGED BY FDOTLength: 0
From: INTERSECTIONTo: INTERSECTION
Phase Group: PRELIMINARY ENGINEERING, CONSTRUCTION
Phase Fund Code 2020 2021 2022 2023 2024 Total
PE SA 0 5,000 0 0 0 5,000
CST SU 0 0 0 262,500 0 262,500
5,000 262,500 267,500
Prior Year Cost: 0Future Year Cost: 0Total Project Cost: 267,500LRTP: Page 6-5
Notes
C 1-32

St. Lucie TPO Transportation Improvement Program - FY 2019/20 - FY 2023/2024
SAVANNAS PRESERVE STATE PARK FR LENNARD RD TO SAVANNAS RECREATION AREA4399993 Non-SIS
Project Description: BIKE PATH/TRAILExtra Description: SUNTRAIL FY2017 PD&E PHASE 2; DESIGN ON 439999-1Lead Agency: MANAGED BY FDOTLength: 0
From: LENNARD RDTo: SAVANNAS RECREATION AREA
Phase Group: CONSTRUCTION, ENVIRONMENTAL
Phase Fund Code 2020 2021 2022 2023 2024 Total
CST DIH 0 0 0 136,465 0 136,465
CST TLWR 0 0 0 2,797,498 0 2,797,498
ENV TLWR 0 0 75,000 0 0 75,000
75,000 2,933,963 3,008,963
Prior Year Cost: 1,365,726Future Year Cost: 0Total Project Cost: 10,574,444LRTP: Page 6-11
Notes
C 1-33

St. Lucie TPO Transportation Improvement Program - FY 2019/20 - FY 2023/2024
SAVANNAS PRESERVE STATE PARK GAP FROM WALTON RD TO LENNARD RD4399992 Non-SIS
Project Description: BIKE PATH/TRAILExtra Description: SUNTRAIL FY2017 PD&E PHASE 1, DESIGN ON 439999-1Lead Agency: MANAGED BY FDOTLength: 0
From: WALTON RD.To: SAVANNAS RECREATION AREA
Phase Group: CONSTRUCTION
Phase Fund Code 2020 2021 2022 2023 2024 Total
CST DIH 0 79,405 0 0 0 79,405
CST TLWR 0 6,045,350 0 0 0 6,045,350
6,124,755 6,124,755
Prior Year Cost: 1,365,726Future Year Cost: 0Total Project Cost: 10,574,444LRTP: Page 6-11
Notes
C 1-34

St. Lucie TPO Transportation Improvement Program - FY 2019/20 - FY 2023/2024
SAVANNAS PRESERVE STATE PARK GAP WALTON ROAD TO SAVANNAS RECREATION AREA4399991 Non-SIS
Project Description: BIKE PATH/TRAILExtra Description: SUNTRAIL FY2017 PD&E CONSTRUCTION ON 439999-2, 439999-3Lead Agency: MANAGED BY FDOTLength: 0
From: WALTON RD.To: SAVANNAS RECREATION AREA
Phase Group: P D & E, PRELIMINARY ENGINEERING, ENVIRONMENTAL
Phase Fund Code 2020 2021 2022 2023 2024 Total
ENV TLWR 75,000 0 0 0 0 75,000
75,000 75,000
Prior Year Cost: 1,365,726Future Year Cost: 0Total Project Cost: 10,574,444LRTP: Page 6-11
Notes
C 1-35

St. Lucie TPO Transportation Improvement Program - FY 2019/20 - FY 2023/2024
US-1 @ VIRGINIA AVENUE4368681 SIS
Project Description: ADD RIGHT TURN LANE(S)Extra Description: 2015 TPO #3 SOUTH BOUND RIGHT TURN LANELead Agency: MANAGED BY FDOTLength: 0.071
From: SR-5/US-1To: SR-70/VIRGINIA AVENUE
Phase Group: PRELIMINARY ENGINEERING, RIGHT OF WAY, RAILROAD & UTILITIES,CONSTRUCTION, ENVIRONMENTAL
Phase Fund Code 2020 2021 2022 2023 2024 Total
ROW ACSU 918,000 0 0 0 0 918,000
CST DDR 899,503 0 0 0 0 899,503
CST DIH 60,471 0 0 0 0 60,471
1,877,974 1,877,974
Prior Year Cost: 904,547Future Year Cost: 0Total Project Cost: 2,782,521LRTP: Page 6-2
Notes
C 1-36

St. Lucie TPO Transportation Improvement Program - FY 2019/20 - FY 2023/2024
US-1 FROM EDWARDS ROAD TO VIRGINIA AVENUE4417141 Non-SIS
Project Description: DRAINAGE IMPROVEMENTSExtra Description: DRAINAGE/STORM WATER UPGRADES G/W 441715-1Lead Agency: MANAGED BY FDOTLength: 1.05
From: EDWARDS ROADTo: SR-70/VIRGINIA AVENUE
Phase Group: PRELIMINARY ENGINEERING, RAILROAD & UTILITIES, CONSTRUCTION,ENVIRONMENTAL
Phase Fund Code 2020 2021 2022 2023 2024 Total
PE DIH 10,000 0 0 0 0 10,000
PE DS 429,828 0 0 0 0 429,828
RRU DS 0 40,000 0 0 0 40,000
CST DIH 0 0 116,161 0 0 116,161
CST DS 0 0 2,968,880 0 0 2,968,880
ENV DS 20,000 25,000 0 0 0 45,000
459,828 65,000 3,085,041 3,609,869Prior Year Cost: 0Future Year Cost: 0Total Project Cost: 3,609,869LRTP: Page 7-1
Notes
C 1-37

St. Lucie TPO Transportation Improvement Program - FY 2019/20 - FY 2023/2024
US-1 FROM S. OF PORT ST. LUCIE BLVD. TO NE RIOMAR DRIVE4398471 Non-SIS
Project Description: RESURFACINGExtra Description: NPV = 7,586,090; B/C RATIO = 21Lead Agency: MANAGED BY FDOTLength: 4.97
From: S. OF PORT ST. LUCIE BLVD.To: NE RIOMAR DRIVE
Phase Group: PRELIMINARY ENGINEERING, RAILROAD & UTILITIES, CONSTRUCTION,ENVIRONMENTAL
Phase Fund Code 2020 2021 2022 2023 2024 Total
RRU ACSS 2,500 0 0 0 0 2,500
CST ACSS 740,246 0 0 0 0 740,246
CST SA 2,038,383 0 0 0 0 2,038,383
CST DDR 2,196,330 0 0 0 0 2,196,330
CST DIH 120,673 0 0 0 0 120,673
CST DS 4,080,467 0 0 0 0 4,080,467
9,178,599 9,178,599Prior Year Cost: 1,321,793Future Year Cost: 0Total Project Cost: 10,500,392LRTP: Page 7-1
Notes
C 1-38

St. Lucie TPO Transportation Improvement Program - FY 2019/20 - FY 2023/2024
VIRGINIA AVENUE4417151 SIS
Project Description: DRAINAGE IMPROVEMENTSExtra Description: G/W 441714-1Lead Agency: MANAGED BY FDOTLength: 0.185
From: VIRGINIA AVENUETo: VIRGINIA AVENUE
Phase Group: PRELIMINARY ENGINEERING, CONSTRUCTION
Phase Fund Code 2020 2021 2022 2023 2024 Total
PE DIH 10,000 0 0 0 0 10,000
PE DS 341,000 0 0 0 0 341,000
CST DIH 0 0 102,394 0 0 102,394
CST DS 0 0 2,509,904 0 0 2,509,904
351,000 2,612,298 2,963,298
Prior Year Cost: 0Future Year Cost: 0Total Project Cost: 2,963,298LRTP: Page 7-1
Notes
C 1-39

St. Lucie TPO Transportation Improvement Program - FY 2019/20 - FY 2023/2024
C 2-1
C.2 AVIATION

St. Lucie TPO Transportation Improvement Program - FY 2019/20 - FY 2023/2024
C 2-2
TREASURE COAST INTERNATIONAL AIRPORT AIRFIELD SIGNAGE & LIGHTING4346351 Non-SIS
Project Description: AVIATION PRESERVATION PROJECTLead Agency: RESPONSIBLE AGENCY NOTAVAILABLELength: 0
From:To:
Phase Group: CAPITAL
Phase Fund Code 2020 2021 2022 2023 2024 Total
CAP FAA 1,620,000 0 0 0 0 1,620,000
CAP LF 90,000 0 0 0 0 90,000
CAP DPTO 90,000 0 0 0 0 90,000
1,800,000 1,800,000
Prior Year Cost: 0Future Year Cost: 0Total Project Cost: 1,800,000LRTP: Page 7-1
Notes

St. Lucie TPO Transportation Improvement Program - FY 2019/20 - FY 2023/2024
C 2-3
TREASURE COAST INTERNATIONAL AIRPORT CONSTRUCT MICROSURFACING RW 14/124421021 Non-SIS
Project Description: AVIATION PRESERVATION PROJECTLead Agency: RESPONSIBLE AGENCY NOTAVAILABLELength: 0
From:To:
Phase Group: CAPITAL
Phase Fund Code 2020 2021 2022 2023 2024 Total
CAP LF 560,000 0 0 0 0 560,000
CAP DPTO 2,240,000 0 0 0 0 2,240,000
2,800,000 2,800,000
Prior Year Cost: 0Future Year Cost: 0Total Project Cost: 2,800,000LRTP: Page 7-1
Notes

St. Lucie TPO Transportation Improvement Program - FY 2019/20 - FY 2023/2024
C 2-4
TREASURE COAST INTERNATIONAL AIRPORT EXTENSION FOR RWY 28L/10R EA4416091 Non-SIS
Project Description: AVIATION ENVIRONMENTAL PROJECTLead Agency: RESPONSIBLE AGENCY NOTAVAILABLELength: 0
From:To:
Phase Group: CAPITAL
Phase Fund Code 2020 2021 2022 2023 2024 Total
CAP FAA 368,550 0 0 0 0 368,550
CAP LF 20,475 0 0 0 0 20,475
CAP DPTO 20,475 0 0 0 0 20,475
409,500 409,500
Prior Year Cost: 0Future Year Cost: 0Total Project Cost: 409,500LRTP: Page 7-1
Notes

St. Lucie TPO Transportation Improvement Program - FY 2019/20 - FY 2023/2024
C 2-5
TREASURE COAST INTERNATIONAL RUNWAY 14/32 AIRFIELD LIGHTING & SIGNAGE4401061 Non-SIS
Project Description: AVIATION PRESERVATION PROJECTLead Agency: RESPONSIBLE AGENCY NOTAVAILABLELength: 0
From:To:
Phase Group: CAPITAL
Phase Fund Code 2020 2021 2022 2023 2024 Total
CAP LF 40,000 0 0 0 0 40,000
CAP DPTO 160,000 0 0 0 0 160,000
200,000 200,000
Prior Year Cost: 0Future Year Cost: 0Total Project Cost: 200,000LRTP: Page 7-1
Notes

St. Lucie TPO Transportation Improvement Program - FY 2019/20 - FY 2023/2024
C 3-1
C.3 TRANSIT PROJECTS

St. Lucie TPO Transportation Improvement Program - FY 2019/20 - FY 2023/2024
C 3-2
GATLIN BLVD. BETWEEN BRESCIA STREET AND EDGARCE STREET (JOBS EXPRESS TERMINAL) 4226814 Non-SIS
Project Description: PARK AND RIDE LOTSExtra Description: 2014 TPO #4Lead Agency: MANAGED BY FDOTLength: 0.08
From: BRESCIA STREETTo: EDGARCE STREET
Phase Group: PRELIMINARY ENGINEERING, RIGHT OF WAY, CONSTRUCTION, ENVIRONMENTAL
Phase Fund Code 2020 2021 2022 2023 2024 Total
ROW DS 813,000 537,956 1,752,641 0 0 3,103,597
CST DDR 3,360,883 0 0 0 0 3,360,883
CST DIH 131,513 0 0 0 0 131,513
ENV DS 200,000 0 0 0 0 200,000
4,505,396 537,956 1,752,641 6,795,993
Prior Year Cost: 2,536,059Future Year Cost: 2,110,000Total Project Cost: 11,992,052LRTP: Page 6-2
Notes

St. Lucie TPO Transportation Improvement Program - FY 2019/20 - FY 2023/2024
C 3-3
ST. LUCIE COUNTY FARE FREE TRANSIT PILOT 4415971 Non-SIS
Project Description: OPERATING FOR FIXED ROUTEExtra Description: SERVICE DEVELOPMENT GRANTLead Agency: MANAGED BY ST. LUCIE COUNTYLength: 0
From:To:
Phase Group: OPERATIONS
Phase Fund Code 2020 2021 2022 2023 2024 Total
OPS DPTO 140,000 0 0 0 0 140,000
140,000 140,000
Prior Year Cost: 556,000Future Year Cost: 0Total Project Cost: 836,000LRTP:
Notes

St. Lucie TPO Transportation Improvement Program - FY 2019/20 - FY 2023/2024
C 3-4
ST. LUCIE COUNTY BLOCK GRANT OPERATING ASSISTANCE4071873 Non-SIS
Project Description: OPERATING/ADMIN. ASSISTANCELead Agency: MANAGED BY ST. LUCIE COUNTYLength: 0
From:To:
Phase Group: OPERATIONS
Phase Fund Code 2020 2021 2022 2023 2024 Total
OPS LF 618,686 649,627 682,108 703,638 752,024 3,406,083
OPS DDR 0 0 0 703,638 752,024 1,455,662
OPS DPTO 618,686 649,627 682,108 0 0 1,950,421
1,237,372 1,299,254 1,364,216 1,407,276 1,504,048 6,812,166
Prior Year Cost: 0Future Year Cost: 0Total Project Cost: 6,812,166LRTP: Page 7-1
Notes

St. Lucie TPO Transportation Improvement Program - FY 2019/20 - FY 2023/2024
C 3-5
ST. LUCIE COUNTY FIXED ROUTE4425681 Non-SIS
Project Description: OPERATING FOR FIXED ROUTEExtra Description: ROUTE 1 IMPROVEMENTSLead Agency: MANAGED BY ST. LUCIE COUNTYLength: 0
From:To:
Phase Group: OPERATIONS
Phase Fund Code 2020 2021 2022 2023 2024 Total
OPS LF 200,000 0 0 0 0 200,000
OPS DPTO 200,000 0 0 0 0 200,000
400,000 400,000
Prior Year Cost: 368,000Future Year Cost: 0Total Project Cost: 768,000LRTP: Page 7-1
Notes

St. Lucie TPO Transportation Improvement Program - FY 2019/20 - FY 2023/2024
C 3-6
ST. LUCIE COUNTY SECTION 5307 FORMULA FUNDS4134941 Non-SIS
Project Description: CAPITAL FOR FIXED ROUTEExtra Description: FY11 - GRANT FL-90-X727 EXECUTED PER K.SCOTT-ST.LUCIE CO EMAIL FROM J.MELI 10/13/10. GRANT FL90-X765 EXECUTED 10/20/11 $1,407,322 EMAIL FROM K. SCOTT/SLC1-11-12 TO J. MELI. ST.LUCIE COUNTY SEC 5307 OPERATING ASSISTANCELead Agency: MANAGED BY ST. LUCIE COALength: 0
From:To:
Phase Group: OPERATIONS, CAPITAL
Phase Fund Code 2020 2021 2022 2023 2024 Total
OPS FTA 2,200,000 2,200,000 2,200,000 2,200,000 2,200,000 11,000,000
CAP FTA 494,000 494,000 494,000 494,000 494,000 2,470,000
2,694,000 2,694,000 2,694,000 2,694,000 2,694,000 13,470,000
Prior Year Cost: 25,966,273Future Year Cost: 0Total Project Cost: 39,436,273LRTP: Page 7-1
Notes

St. Lucie TPO Transportation Improvement Program - FY 2019/20 - FY 2023/2024
C 3-7
ST. LUCIE COUNTY SECTION 5311 OPERATING RURAL FUNDS4071853 Non-SIS
Project Description: OPERATING/ADMIN. ASSISTANCELead Agency: MANAGED BY ST. LUCIE COUNTYLength: 0
From:To:
Phase Group: OPERATIONS
Phase Fund Code 2020 2021 2022 2023 2024 Total
OPS DU 56,256 59,069 62,023 65,124 64,613 307,085
OPS LF 56,256 59,069 62,023 65,124 64,613 307,085
112,512 118,138 124,046 130,248 129,226 614,170
Prior Year Cost: 0Future Year Cost: 0Total Project Cost: 614,170LRTP: Page 7-1
Notes

St. Lucie TPO Transportation Improvement Program - FY 2019/20 - FY 2023/2024
C 3-8
ST. LUCIE COUNTY SECTION 5339 CAPITAL FOR BUS & BUS FACILITIES4345481 Non-SIS
Project Description: CAPITAL FOR FIXED ROUTEExtra Description: ST.LUCIE CO. SECTION 5339 CAPITAL FOR BUS & BUS FACILITIES PROGRAM 16.CAPITAL FOR FIXED ROUTELead Agency: MANAGED BY ST. LUCIE COUNTYLength: 0
From:To:
Phase Group: CAPITAL
Phase Fund Code 2020 2021 2022 2023 2024 Total
CAP FTA 197,400 197,400 197,400 198,000 198,000 988,200
197,400 197,400 197,400 198,000 198,000 988,200
Prior Year Cost: 1,184,314Future Year Cost: 0Total Project Cost: 2,172,514LRTP: Page 7-1
Notes

St. Lucie TPO Transportation Improvement Program - FY 2019/20 - FY 2023/2024
C 3-9
ST. LUCIE TRANSIT CORRIDOR LAKEWOOD PARK REGIONAL ROUTE4446641 Non-SIS
Project Description: OPERATING FOR FIXED ROUTEExtra Description: REGIONAL ROUTE, ST. LUCIE - INDIAN RIVER COUNTIESLead Agency: MANAGED BY ST. LUCIE COUNTYLength: 0
From:To:
Phase Group: OPERATIONS
Phase Fund Code 2020 2021 2022 2023 2024 Total
OPS DPTO 180,000 180,000 0 0 0 360,000
180,000 180,000 360,000
Prior Year Cost: 180,000Future Year Cost: 0Total Project Cost: 540,000LRTP: Page 6-12
Notes

St. Lucie TPO Transportation Improvement Program - FY 2019/20 - FY 2023/2024
C 4-1
C.4 MISCELLANEOUS PROJECTS

St. Lucie TPO Transportation Improvement Program - FY 2019/20 - FY 2023/2024
C 4-2
CITY OF FT. PIERCE JPA SIGNAL MAINTENANCE & OPERATIONS ON SHS4379751 Non-SIS
Project Description: TRAFFIC SIGNALSLead Agency: MANAGED BY CITY OF FORTPIERCELength: 0
From:To:
Phase Group: OPERATIONS
Phase Fund Code 2020 2021 2022 2023 2024 Total
OPS DDR 0 183,941 188,961 194,063 199,845 766,810
OPS DITS 0 99,096 101,573 104,315 107,445 412,429
283,037 290,534 298,378 307,290 1,179,239
Prior Year Cost: 0Future Year Cost: 0Total Project Cost: 1,179,239LRTP: Page 7-1
Notes

St. Lucie TPO Transportation Improvement Program - FY 2019/20 - FY 2023/2024
C 4-3
CITY OF FT. PIERCE JPA SIGNAL MAINTENANCE & OPERATIONS ON STATE HWY SYS4278057 Non-SIS
Project Description: TRAFFIC SIGNALSLead Agency: MANAGED BY CITY OF FORTPIERCELength: 0
From:To:
Phase Group: OPERATIONS
Phase Fund Code 2020 2021 2022 2023 2024 Total
OPS DDR 178,114 0 0 0 0 178,114
OPS DITS 96,679 0 0 0 0 96,679
274,793 274,793
Prior Year Cost: 1,655,364Future Year Cost: 0Total Project Cost: 2,225,948LRTP: Page 7-1
Notes

St. Lucie TPO Transportation Improvement Program - FY 2019/20 - FY 2023/2024
C 4-4
CITY OF PORT ST. LUCIE JPA SIGNAL MAINT & OPERATIONS ON STATE HWY SYS4278059 Non-SIS
Project Description: TRAFFIC SIGNALSLead Agency: MANAGED BY CITY OF PORT ST.LUCIELength: 0
From:To:
Phase Group: OPERATIONS
Phase Fund Code 2020 2021 2022 2023 2024 Total
OPS DDR 35,000 0 0 0 0 35,000
OPS DITS 76,890 0 0 0 0 76,890
111,890 111,890
Prior Year Cost: 1,655,364Future Year Cost: 0Total Project Cost: 2,225,948LRTP: Page 7-1
Notes

St. Lucie TPO Transportation Improvement Program - FY 2019/20 - FY 2023/2024
C 4-5
CITY OF PORT ST. LUCIE JPA SIGNAL MAINTENANCE & OPERATIONS ON SHS4379771 Non-SIS
Project Description: TRAFFIC SIGNALSLead Agency: MANAGED BY CITY OF PORT ST.LUCIELength: 0
From:To:
Phase Group: OPERATIONS
Phase Fund Code 2020 2021 2022 2023 2024 Total
OPS DDR 0 36,435 37,916 73,190 75,386 222,927
OPS DITS 0 78,812 80,789 48,720 50,182 258,503
115,247 118,705 121,910 125,568 481,430
Prior Year Cost: 0Future Year Cost: 0Total Project Cost: 481,430LRTP: Page 7-1
Notes

St. Lucie TPO Transportation Improvement Program - FY 2019/20 - FY 2023/2024
C 4-6
ST. LUCIE - PRIMARY MOWING AND LITTER CONTRACT2340036 Non-SIS
Project Description: ROUTINE MAINTENANCELead Agency: MANAGED BY FDOTLength: 0
From:To:
Phase Group: BRDG/RDWY/CONTRACT MAINT
Phase Fund Code 2020 2021 2022 2023 2024 Total
MNT D 226,972 0 0 0 0 226,972
226,972 226,972
Prior Year Cost: 453,945Future Year Cost: 0Total Project Cost: 1,355,917LRTP: Page 7-1
Notes

St. Lucie TPO Transportation Improvement Program - FY 2019/20 - FY 2023/2024
C 4-7
ST. LUCIE - PRIMARY MOWING AND LITTER CONTRACT2340038 Non-SIS
Project Description: ROUTINE MAINTENANCELead Agency: MANAGED BY FDOTLength: 0
From:To:
Phase Group: BRDG/RDWY/CONTRACT MAINT
Phase Fund Code 2020 2021 2022 2023 2024 Total
MNT D 0 225,000 225,000 225,000 0 675,000
225,000 225,000 225,000 675,000
Prior Year Cost: 453,945Future Year Cost: 0Total Project Cost: 1,355,917LRTP: Page 7-1
Notes

St. Lucie TPO Transportation Improvement Program - FY 2019/20 - FY 2023/2024
C 4-8
Project Description: ROUTINE MAINTENANCEExtra Description: PH 70 INCLUDES IN-HOUSE BRIDGE INSPECTIONSLead Agency: MANAGED BY FDOTLength: 0
From:To:
Phase Group: BRDG/RDWY/CONTRACT MAINT
Phase Fund Code 2020 2021 2022 2023 2024 Total
MNT D 2,000 2,000 2,000 2,000 0 8,000
2,000 2,000 2,000 2,000 8,000
ST. LUCIE COUNTY INTERSTATE BRIDGES 2343762 SIS
Prior Year Cost: 6,170,773Future Year Cost: 0Total Project Cost: 6,578,773LRTP: Page 7-1
Notes

St. Lucie TPO Transportation Improvement Program - FY 2019/20 - FY 2023/2024
C 4-9
ST. LUCIE COUNTY ATMS4352451 SIS
Project Description: ATMS - ARTERIAL TRAFFIC MGMTExtra Description: 2015 TPO PRIORITY #4 US-1 FROM SAVANA CLUB BLVD. TO KINGS HWY , FROMKINGS HWY TO US-1Lead Agency: MANAGED BY FDOTLength: 21.767
From:To:
Phase Group: PRELIMINARY ENGINEERING, RAILROAD & UTILITIES, ENVIRONMENTAL, DESIGNBUILD
Phase Fund Code 2020 2021 2022 2023 2024 Total
ENV DDR 16,000 0 0 0 0 16,000
DSB DDR 7,764,970 0 0 0 0 7,764,970
DSB DIH 97,311 0 0 0 0 97,311
DSB DS 10,000 0 0 0 0 10,000
7,888,281 7,888,281
Prior Year Cost: 525,378Future Year Cost: 0Total Project Cost: 8,413,659LRTP: Page 7-1
Notes

St. Lucie TPO Transportation Improvement Program - FY 2019/20 - FY 2023/2024
C 4-10
ST. LUCIE COUNTY INTERSTATE-ROADWAY2343761 SIS
Project Description: ROUTINE MAINTENANCELead Agency: MANAGED BY FDOTLength: 0
From:To:
Phase Group: BRDG/RDWY/CONTRACT MAINT
Phase Fund Code 2020 2021 2022 2023 2024 Total
MNT D 100,000 100,000 100,000 100,000 0 400,000
100,000 100,000 100,000 100,000 400,000
Prior Year Cost: 6,170,773Future Year Cost: 0Total Project Cost: 6,578,773LRTP: Page 7-1
Notes

St. Lucie TPO Transportation Improvement Program - FY 2019/20 - FY 2023/2024
C 4-11
ST. LUCIE COUNTY JPA SIGNAL MAINTENANCE & OPERATIONS ON SHS4379761 Non-SIS
Project Description: TRAFFIC SIGNALSLead Agency: MANAGED BY ST LUCIE COUNTYLength: 0
From:To:
Phase Group: OPERATIONS
Phase Fund Code 2020 2021 2022 2023 2024 Total
OPS DDR 0 103,555 106,662 109,542 112,828 432,587
OPS DITS 0 85,863 88,010 90,387 93,099 357,359
189,418 194,672 199,929 205,927 789,946
Prior Year Cost: 0Future Year Cost: 0Total Project Cost: 789,946LRTP: Page 7-1
Notes

St. Lucie TPO Transportation Improvement Program - FY 2019/20 - FY 2023/2024
C 4-12
ST. LUCIE COUNTY JPA SIGNAL MAINTENANCE & OPERATIONS ON STATE HWY SYS4278058 Non-SIS
Project Description: TRAFFIC SIGNALSLead Agency: MANAGED BY ST LUCIE COUNTYLength: 0
From:To:
Phase Group: OPERATIONS
Phase Fund Code 2020 2021 2022 2023 2024 Total
OPS DDR 100,132 0 0 0 0 100,132
OPS DITS 83,769 0 0 0 0 83,769
183,901 183,901
Prior Year Cost: 1,655,364Future Year Cost: 0Total Project Cost: 2,225,948LRTP: Page 7-1
Notes

St. Lucie TPO Transportation Improvement Program - FY 2019/20 - FY 2023/2024
C 4-13
ST. LUCIE COUNTY STATE HIGHWAY SYSTEM ROADWAY2338591 Non-SIS
Project Description: ROUTINE MAINTENANCELead Agency: MANAGED BY FDOTLength: 0
From:To:
Phase Group: BRDG/RDWY/CONTRACT MAINT
Phase Fund Code 2020 2021 2022 2023 2024 Total
MNT D 1,600,000 1,600,000 1,600,000 1,600,000 0 6,400,000
1,600,000 1,600,000 1,600,000 1,600,000 6,400,000
Prior Year Cost: 54,093,157Future Year Cost: 0Total Project Cost: 60,693,157LRTP: Page 7-1
Notes

St. Lucie TPO Transportation Improvement Program - FY 2019/20 - FY 2023/2024
C 5-1
C.5 PLANNING PROJECTS

St. Lucie TPO Transportation Improvement Program - FY 2019/20 - FY 2023/2024
C 5-2
PORT ST. LUCIE BLVD @ FLORESTA DR4405681 Non-SIS
Project Description: TRAFFIC ENGINEERING STUDYExtra Description: 2017 TPO CMP PRIORITY #2 LFA WITH PORT ST LUCIE PROJECT NEEDS RIGHTOF WAYLead Agency: MANAGED BY FDOTLength: 0.02
From: SR-716/PORT ST LUCIE BLVDTo: FLORESTA DR
Phase Group: PRELIMINARY ENGINEERING
Phase Fund Code 2020 2021 2022 2023 2024 Total
PE LF 0 500,000 0 0 0 500,000
PE CIGP 0 500,000 0 0 0 500,000
PE DIH 0 10,000 0 0 0 10,000
1,010,000 1,010,000
Prior Year Cost: 0Future Year Cost: 0Total Project Cost: 1,010,000LRTP: Page 6-5
Notes

St. Lucie TPO Transportation Improvement Program - FY 2019/20 - FY 2023/2024
C 5-3
ST. LUCIE FY 2018/2019-2019/2020 UPWP4393262 Non-SIS
Project Description: TRANSPORTATION PLANNINGExtra Description: 2019 TPO PRIORITY #1Lead Agency: RESPONSIBLE AGENCY NOTAVAILABLELength: 0
From:To:
Phase Group: PLANNING
Phase Fund Code 2020 2021 2022 2023 2024 Total
PLN PL 536,231 0 0 0 0 536,231
PLN SU 300,000 0 0 0 0 300,000
836,231 836,231
Prior Year Cost: 854,001Future Year Cost: 0Total Project Cost: 5,091,990LRTP: Page 7-1
Notes

St. Lucie TPO Transportation Improvement Program - FY 2019/20 - FY 2023/2024
C 5-4
ST. LUCIE FY 2020/2021-2021/2022 UPWP4393263 Non-SIS
Project Description: TRANSPORTATION PLANNINGExtra Description: 2019 TPO PRIORITY #1Lead Agency: RESPONSIBLE AGENCY NOTAVAILABLELength: 0
From:To:
Phase Group: PLANNING
Phase Fund Code 2020 2021 2022 2023 2024 Total
PLN PL 0 547,631 547,631 0 0 1,095,262
PLN SU 0 300,000 300,000 0 0 600,000
847,631 847,631 1,695,262
Prior Year Cost: 854,001Future Year Cost: 0Total Project Cost: 5,091,990LRTP: Page 7-1
Notes

St. Lucie TPO Transportation Improvement Program - FY 2019/20 - FY 2023/2024
C 5-5
ST. LUCIE FY 2022/2023-2023/2024 UPWP4393264 Non-SIS
Project Description: TRANSPORTATION PLANNINGExtra Description: 2019 TPO PRIORITY #1Lead Agency: RESPONSIBLE AGENCY NOTAVAILABLELength: 0
From:To:
Phase Group: PLANNING
Phase Fund Code 2020 2021 2022 2023 2024 Total
PLN PL 0 0 0 547,631 0 547,631
PLN SU 0 0 0 300,000 300,000 600,000
847,631 300,000 1,147,631
Prior Year Cost: 854,001Future Year Cost: 0Total Project Cost: 5,091,990LRTP: Page 7-1
Notes

St. Lucie TPO Transportation Improvement Program - FY 2019/20 - FY 2023/2024
C 5-6
ST. LUCIE TPO SECTION 5305D TRANSIT PLANNING4137372 Non-SIS
Project Description: PTO STUDIESExtra Description: TRANSIT PLANNING STUDIESLead Agency: MANAGED BY ST. LUCIE MPOLength: 0
From:To:
Phase Group: PLANNING
Phase Fund Code 2020 2021 2022 2023 2024 Total
PLN DU 71,465 0 0 0 0 71,465
PLN LF 11,529 0 0 0 0 11,529
PLN DPTO 11,529 0 0 0 0 11,529
94,523 94,523
Prior Year Cost: 506,159Future Year Cost: 0Total Project Cost: 971,032LRTP: Page 7-1
Notes

St. Lucie TPO Transportation Improvement Program - FY 2019/20 - FY 2023/2024
C 5-7
ST. LUCIE TPO SECTION 5305D TRANSIT PLANNING4137373 Non-SIS
Project Description: PTO STUDIESExtra Description: TRANSIT PLANNING STUDIESLead Agency: MANAGED BY ST. LUCIE MPOLength: 0
From:To:
Phase Group: PLANNING
Phase Fund Code 2020 2021 2022 2023 2024 Total
PLN DU 0 73,518 75,724 73,518 73,518 296,278
PLN LF 0 9,190 9,466 9,190 9,190 37,036
PLN DPTO 0 9,190 9,466 9,190 9,190 37,036
91,898 94,656 91,898 91,898 370,350
Prior Year Cost: 506,159Future Year Cost: 0Total Project Cost: 971,032LRTP: Page 7-1
Notes

St. Lucie TPO Transportation Improvement Program - FY 2019/20 - FY 2023/2024
C 6-1
C.6 BRIDGE

St. Lucie TPO Transportation Improvement Program - FY 2019/20 - FY 2023/2024
C 6-2
A1A NORTH BRIDGE OVER ICWW BRIDGE #9400454299362 Non-SIS
Project Description: BRIDGE REPLACEMENTLead Agency: MANAGED BY FDOTLength: 1
From: ENTIRE BRIDGETo: ENTIRE BRIDGE
Phase Group: P D & E, PRELIMINARY ENGINEERING, RIGHT OF WAY, RAILROAD & UTILITIES,CONSTRUCTION, CONTRACT INCENTIVES, ENVIRONMENTAL
Phase Fund Code 2020 2021 2022 2023 2024 Total
ROW ACBR 0 0 0 3,837,532 0 3,837,532
ROW BNBR 0 0 6,272,681 0 0 6,272,681
ROW BRP 0 59,410 22,351 0 0 81,761
RRU ACBR 0 700,000 500,000 0 0 1,200,000
CST BNBR 0 0 59,607,957 0 0 59,607,957
CST DDR 0 0 20,333,244 0 0 20,333,244
CST DIH 0 0 497,856 0 0 497,856
CST DS 0 0 129,720 0 0 129,720
INC DDR 0 0 0 0 630,000 630,000
ROW ACBR 774,582 8,617,241 0 0 0 9,391,823
ROW SA 0 0 0 50,000 0 50,000
ROW BRP 1,454,305 0 0 0 0 1,454,305
ROW DIH 0 0 137,312 0 0 137,312
PE DS 750,000 0 0 0 0 750,000
2,978,887 9,376,651 87,501,121 3,887,532 630,000 104,374,191
Prior Year Cost: 10,697,315Future Year Cost: 0Total Project Cost: 115,994,349LRTP: Page 6-2
Notes

St. Lucie TPO Transportation Improvement Program - FY 2019/20 - FY 2023/2024
C 6-3
PORT ST LUCIE BLVD OVER LONG CREEK & N FORK ST LUCIE RIVER BRDG4435951 Non-SIS
Project Description: BRIDGE-REPAIR/REHABILITATIONExtra Description: BRIDGE 940139, 940144, 940140, 940145 SCOUR COUNTERMEASURESLead Agency: MANAGED BY FDOTLength: 0.227
From: LONG CREEKTo: N FORK ST LUCIE RIVER
Phase Group: PRELIMINARY ENGINEERING, CONSTRUCTION, ENVIRONMENTAL
Phase Fund Code 2020 2021 2022 2023 2024 Total
PE BRRP 200,000 0 0 0 0 200,000
PE DIH 10,000 0 0 0 0 10,000
CST BRRP 0 0 806,169 0 0 806,169
CST DIH 0 0 54,196 0 0 54,196
ENV BRRP 10,000 5,000 0 0 0 15,000
220,000 5,000 860,365 1,085,365
Prior Year Cost: 0Future Year Cost: 0Total Project Cost: 1,085,365LRTP: Page 7-1
Notes

St. Lucie TPO Transportation Improvement Program - FY 2019/20 - FY 2023/2024
C 6-4
ST. LUCIE COUNTY STATE HIGHWAY SYSTEM BRIDGES2338592 Non-SIS
Project Description: ROUTINE MAINTENANCEExtra Description: PH 70 INCLUDES IN-HOUSE BRIDGE INSPECTIONSLead Agency: MANAGED BY FDOTLength: 0
From:To:
Phase Group: BRDG/RDWY/CONTRACT MAINT
Phase Fund Code 2020 2021 2022 2023 2024 Total
MNT D 50,000 50,000 50,000 50,000 0 200,000
50,000 50,000 50,000 50,000 200,000
Prior Year Cost: 54,093,157Future Year Cost: 0Total Project Cost: 60,693,157LRTP: Page 7-1
Notes

St. Lucie TPO Transportation Improvement Program - FY 2019/20 - FY 2023/2024
C 7-1
C.7 TURNPIKE ENTERPRISE PROJECTS

St. Lucie TPO Transportation Improvement Program - FY 2019/20 - FY 2023/2024
C 7-2
PAINT BRIDGES - TPK MAINLINE OVER CR 709 (MP 150.7) (940076, 940951)4385501 SIS
Project Description: BRIDGE - PAINTINGLead Agency: MANAGED BY FDOTLength: 0.2
From:To:
Phase Group: PRELIMINARY ENGINEERING, RAILROAD & UTILITIES, CONSTRUCTION
Phase Fund Code 2020 2021 2022 2023 2024 Total
RRU PKYR 150,000 0 0 0 0 150,000
CST PKYR 0 1,529,038 0 0 0 1,529,038
150,000 1,529,038 1,679,038
Prior Year Cost: 129,414Future Year Cost: 0Total Project Cost: 1,808,452LRTP: Page 7-1
Notes

St. Lucie TPO Transportation Improvement Program - FY 2019/20 - FY 2023/2024
C 7-3
PAINT BRIDGES - TPK MAINLINE OVER RIM DITCH (MP142.2) (940049,940082)4385511 SIS
Project Description: BRIDGE - PAINTINGLead Agency: MANAGED BY FDOTLength: 0.2
From:To:
Phase Group: PRELIMINARY ENGINEERING, CONSTRUCTION
Phase Fund Code 2020 2021 2022 2023 2024 Total
CST PKYR 0 1,070,518 0 0 0 1,070,518
1,070,518 1,070,518
Prior Year Cost: 86,033Future Year Cost: 0Total Project Cost: 1,156,551LRTP: Page 7-1
Notes

St. Lucie TPO Transportation Improvement Program - FY 2019/20 - FY 2023/2024
C 7-4
PAINT BRIDGES IN ST. LUCIE COUNTY (940050 @ MP 150.5)(940072 @ MP 152.4354101 SIS
Project Description: BRIDGE - PAINTINGLead Agency: MANAGED BY FDOTLength: 0.132
From:To:
Phase Group: PRELIMINARY ENGINEERING, CONSTRUCTION
Phase Fund Code 2020 2021 2022 2023 2024 Total
PE PKYR 38,000 0 0 0 0 38,000
CST PKYR 0 696,074 0 0 0 696,074
38,000 696,074 734,074
Prior Year Cost: 180,449Future Year Cost: 0Total Project Cost: 914,523LRTP: Page 7-1
Notes

St. Lucie TPO Transportation Improvement Program - FY 2019/20 - FY 2023/2024
C 8-1
C.8 SEAPORT PROJECTS

St. Lucie TPO Transportation Improvement Program - FY 2019/20 - FY 2023/2024
C 8-2
PORT OF FORT PIERCE MASTER PLAN UPDATE4444561 Non-SIS
Project Description: SEAPORT CAPACITY PROJECTLead Agency: RESPONSIBLE AGENCY NOTAVAILABLELength: 0
From:To:
Phase Group: CAPITAL
Phase Fund Code 2020 2021 2022 2023 2024 Total
CAP LF 100,000 0 0 0 0 100,000
CAP PORT 100,000 0 0 0 0 100,000
200,000 200,000
Prior Year Cost: 0Future Year Cost: 0Total Project Cost: 200,000LRTP: Page 7-1
Notes

St. Lucie TPO Transportation Improvement Program - FY 2019/20 - FY 2023/2024
C 8-3
PORT OF FORT PIERCE REHABILITATION OF SOUTH DOCK4444571 Non-SIS
Project Description: SEAPORT CAPACITY PROJECTExtra Description: SEQ01 INCLUDING WAREHOUSE DEMO,SITE PREP, AND NEW CONCRETE.Lead Agency: RESPONSIBLE AGENCY NOTAVAILABLELength: 0
From: PORT OF FORT PIERCETo: PORT OF FORT PIERCE
Phase Group: CAPITAL
Phase Fund Code 2020 2021 2022 2023 2024 Total
CAP LF 313,177 0 0 0 0 313,177
CAP PORT 313,177 0 0 0 0 313,177
626,354 626,354
Prior Year Cost: 596,146Future Year Cost: 0Total Project Cost: 1,222,500LRTP: Page 7-1
Notes

St. Lucie TPO Transportation Improvement Program - FY 2019/20 - FY 2023/2024
D-1
D. LIST OF PRIORITY PROJECTS

Transportation Planning for Fort Pierce, Port St. Lucie, St. Lucie Village and St. Lucie County
Coco Vista Centre 466 SW Port St. Lucie Boulevard, Suite 111
Port St. Lucie, Florida 34953 772-462-1593 www.stlucietpo.org
2018/19 List of Priority Projects (LOPP) (Adopted August 1, 2018; Amended October 3, 2018)
Master List
2018/19 Priority Ranking
Major Gateway
Corridor?1 Facility
Project Limits Project Description Project Status/Notes
In LRTP2
Cost Feasible Plan?
Estimated Cost 2017/18 Priority Ranking From To
1 N/A3 St. Lucie TPO Planning/administration as detailed in the Unified Planning Work Program
Allocated by TPO Board for FY 2018/19 and FY 2019/20
N/A $300,000 1
2 Yes Port St. Lucie Boulevard Paar Drive Darwin
Boulevard Add 2 lanes, sidewalks, bicycle lanes
PE4 and ROW5 in process Yes $19,200,0006 2
3 Yes Midway Road Glades Cut Off Road
Selvitz Road
Add 2 lanes, sidewalks, bicycle lanes
PE in process, ROW to start in FY 2018/19 Yes $38,700,00066 3
4 Yes Port St. Lucie Boulevard
Becker Road Paar Drive Add 2 lanes, sidewalks,
bicycle lanes
PE to start in FY 2020/21, ROW to start in FY 2022/23
Yes $16,800,0006 4
5 Yes U.S. Highway 1 at Ohio Avenue Intersection
Improvements Install Traffic Signal Mast Arms
Yes (US-1 Corridor
Retrofit) $505,9017 NR8
6 Yes Kings Highway St. Lucie Boulevard
Indrio Road
Add 2 lanes, sidewalks, bicycle lanes
PE to start in FY 2019/20 Yes $57,700,0009 7
710 Yes Northern/Airport Connector
Florida’s Turnpike
Kings Highway
New multimodal corridor with interchanges at Florida’s Turnpike and I-95
Feasibility Study to start in FY 2018/19
Yes (Northern Connector)
$122,580,00011 8
1Landscape funding eligibility for capacity projects based on 2012 FDOT Landscape Policy 2LRTP: Go2040 Long Range Transportation Plan, February 2016 3N/A: Not Applicable 4PE: Preliminary Engineering 5ROW: Right-of-Way Acquisition 6Source of Estimated Cost: Florida Department of Transportation District 4, July 2018 7Source of Estimated Cost: City of Fort Pierce, July 2018 8NR: Not Ranked in this List. However, the Project was the #3-Ranked Project in the CMP List of the 2017/18 LOPP. 9Source of Estimated Cost: St. Lucie TPO Transportation Improvement Program FY 2018/19 - FY 2022/23 10Any funding allocated to this project shall not reduce the funding to be allocated to higher-ranked projects that are not on the State Highway System 11Source of Estimated Cost: Go2040 Long Range Transportation Plan, February 2016

2018/19 LOPP Adopted August 1, 2018; Amended October 3, 2018 Page 2 of 7
Congestion Management Process (CMP) List
(The St. Lucie TPO’s allocation of Surface Transportation Block Grant funds to CMP projects is $300,000 - $400,000 annually)
1Source of Estimated Cost: CMP Plan, unless otherwise noted 2CMP Plan: St. Lucie Transportation Planning Organization Congestion Management Process Major Update, June 2018 3NR: Not Ranked, typically because this is the first year that the project is in the list
2018/19 Priority Ranking
Facility/Intersection Project Description Project Status/Notes
Estimated Cost1
CMP Plan2 Ranking
2017/18 Priority Ranking
1 Easy Street from U.S. Highway 1 to Yucca Drive
Reconstruct east leg of intersection at U.S. Highway 1 to consist of three lanes westbound, two lanes eastbound, sidewalks, and wide, paved shoulders for bike lanes
$300,000 1 NR3
2 Prima Vista Boulevard at Floresta Drive
Install fiber optic cable and traffic cameras at the signalized intersection and incorporate signal timing adjustments $50,000 2 NR
3 Prima Vista Boulevard at Airoso Boulevard
Add raised medians at intersection approaches, emergency signal at SW Ravenswood Lane, and mid-block crosswalk $250,000 3 NR
4 Gatlin Boulevard from West of I-95 to Port St. Lucie Boulevard
Install traffic cameras at signalized intersections, optimize green time, and add adaptive traffic signal control, if needed $280,000 7 NR
4 Port St. Lucie Boulevard from Tulip Boulevard to Gatlin Boulevard
Install fiber optic cable along Port St. Lucie Boulevard and traffic cameras at signalized intersections $275,000 7 NR
6 Cashmere Boulevard from St. Lucie West Boulevard to Peacock Boulevard
Extend the existing 4-lane, divided section to north of the intersection at Swan Lake Circle and evaluate the need for a traffic signal at the main entrance at the West Gate K-8 School
$335,000 9 NR

2018/19 LOPP Adopted August 1, 2018; Amended October 3, 2018 Page 3 of 7
Transit
2018/19 Priority Ranking
Facility/Equipment/Service Project Location/Description Is Funding for Capital and/or
Operating?
In LRTP1 or TDP2? Estimated Cost3
2017/18 Priority Ranking
1 Vehicle Purchases New/replacement buses as specified in the Transit Asset Management Plan Capital Yes $425,0004 2
2 Bus Route Infrastructure Miscellaneous locations along the fixed routes with priority at transfer locations Capital Yes $75,000
(total for bus shelters) 3
3 Expanded Local Services Route 1 – Improve frequency to 30 minutes Operating Yes $380,000 5
4 New Bus Services New bus service along 25th Street via intermodal facility
Capital & Operating Yes $800,000 4
5 Jobs Express Commuter Service Regional bus service to West Palm Beach Operating Yes $400,0005 NR6
6 Treasure Coast Transit Center Centralized facility for bus maintenance with park-and-ride component Capital Yes $8,300,000 1
7 Micro-Transit (Pilot Project) On-demand flex service to augment the fixed route, address first and last mile connections, and redesign existing Route 6 for improved efficiency
Operating Yes $300,000 NR
8 Community Bike Share Sustain and expand multimodal options Capital & Operating Yes $200,000 NR
1LRTP: Go2040 Long Range Transportation Plan, February 2016 2TDP: St. Lucie County FY 2015-FY 2024 Transit Development Plan Major Update, June 2014 3Source of Estimated Cost: St. Lucie County Transit Staff, July 2018, unless otherwise noted 4Source of Estimated Cost: Transit Asset Management Plan, Community Transit 5Source of Estimated Cost: Community Transit Memorandum, October 2011 6Not Ranked, typically because this is the first year that the project is in the list

2018/19 LOPP Adopted August 1, 2018; Amended October 3, 2018 Page 4 of 7
Transportation Alternatives (TA) Projects
2018/19 Priority Ranking
Score1 Facility Project Limits Project
Description Project Source Estimated
Cost2
2017/18 Priority Ranking From To
1 42.0 Curtis Street Prima Vista Boulevard Marion Avenue Sidewalk-0.3 miles 2018 TA Grant Application3 and St. Lucie WBN4
$573,5685 16
2 38.5 Alcantarra Boulevard Port St. Lucie Boulevard Savona Boulevard Sidewalk-0.8 miles
2018 TA Grant Application3 and St. Lucie WBN
$606,4025 14
3 58.0 East Torino Parkway Volucia Drive Conus Street Sidewalk-0.4 miles St. Lucie WBN $220,080 9
4 52.5 St. James Drive Royce Avenue Lazy River Parkway Sidewalk-0.3 miles 2017 TA Grant Application and St. Lucie WBN
$260,0006 6
5 50.0 Florida SUN Trail, Historic Fort Pierce Downtown Retrofit Georgia Avenue North State Route A1A
Bicycle Boulevard, Roadway Section Connections, and Railroad Crossing Improvements
Florida SUN Trail Grant and St. Lucie WBN
TBD7 3
6 49.0 Floresta Drive Port St. Lucie Boulevard Southbend Boulevard Sidewalk-0.6 miles St. Lucie WBN $489,8216 6
6 49.0 Floresta Drive Port St. Lucie Boulevard Streamlet Avenue Sidewalk-1.0 mile St. Lucie WBN $850,8988 11
8 48.5 Walton Road Lennard Road Green River Parkway Sidewalk-1.1 miles St. Lucie WBN $3,040,0009 5
9 46.0 Rosser Boulevard Openview Bamberg Street Sidewalk-2.1 miles St. Lucie WBN $708,8898 27
9 46.0 East Torino Parkway Vizcaya Falls Midway Road Sidewalk-1.3 miles St. Lucie WBN $851,0008 NR10
9 46.0 Torino Parkway Cashmere Boulevard California Boulevard Sidewalk-1.0 miles St. Lucie WBN $645,0008 NR
12 44.0 Florida SUN Trail, Historic Highwayman Trail Gap Indian Hills Drive Georgia Avenue
Multi-Use Trail and Roadway Section Connections
Florida SUN Trail Grant and St. Lucie WBN
TBD 4
12 44.0 Paar Drive Bamberg Street Savona Boulevard Sidewalk-0.9 miles St. Lucie WBN $1,136,4958 26
14 43.5 Selvitz Road Milner Drive Peachtree Boulevard Sidewalk-0.8 miles St. Lucie WBN $582,0008 10
14 43.5 Orange Avenue Rock Road North Kings Highway Sidewalk-0.5 miles St. Lucie WBN $500,0006 NR
16 42.5 Selvitz Road Floresta Drive Bayshore Boulevard Sidewalk-0.1 miles St. Lucie WBN $1,077,9278 30
16 42.5 Oleander Avenue Edwards Road South Market Avenue Sidewalk-1.3 miles St. Lucie WBN $1,500,0006 NR
16 42.5 Oleander Avenue Saeger Avenue Beach Avenue Sidewalk-1.4 miles St. Lucie WBN $1,650,0006 NR
19 42.0 Lakehurst Drive Bayshore Boulevard Airoso Boulevard Sidewalk-1.3 miles St. Lucie WBN $825,0008 NR

2018/19 LOPP Adopted August 1, 2018; Amended October 3, 2018 Page 5 of 7
2018/19 Priority Ranking
Score1 Facility Project Limits Project
Description Project Source Estimated
Cost2
2017/18 Priority Ranking From To
19 42.0 Sandia Drive Crosstown Parkway Thornhill Drive Sidewalk-0.5 miles St. Lucie WBN $323,0008 NR
19 42.0 Sandia Drive Lakehurst Drive Crosstown Parkway Sidewalk-0.8 miles St. Lucie WBN $516,0008 NR
19 42.0 North Kings Highway North of I-95 State Project Indrio Road Sidewalk-5.0 miles St. Lucie WBN $5,219,9826 NR
23 41.5 Morningside Boulevard Treasure Island Road Cambridge Street Sidewalk-1.3 miles St. Lucie WBN $342,0008 NR
23 41.5 Indrio Road U.S. Highway 1 Old Dixie Highway Sidewalk-0.2 miles St. Lucie WBN $225,0006 NR
25 41.0 Savage Boulevard Import Drive Gatlin Boulevard Sidewalk-1.8 miles St. Lucie WBN $1,448,3838 20
25 41.0 Import Drive Gatlin Boulevard Savage Boulevard Sidewalk-2.3 miles St. Lucie WBN $1,405,7818 20
25 41.0 West Torino Parkway Blanton Road California Boulevard Sidewalk-1.6 miles St. Lucie WBN $1,710,0008 NR
25 41.0 Blanton Boulevard East Torino Parkway West Torino Parkway Sidewalk-0.5 miles St. Lucie WBN $690,0008 NR
29 40.5 Volucia Drive Blanton Boulevard Torino Parkway Sidewalk-1.0 mile St. Lucie WBN $645,0008 23
29 40.5 Indrio Road Kings Highway U.S. Highway 1 Sidewalk-2.6 miles St. Lucie WBN $3,050,7906 NR
31 40.0 Oleander Avenue Midway Road Saeger Avenue Sidewalk-1.5 miles St. Lucie WBN $1,323,840 23
32 39.5 Southbend Boulevard Oakridge Drive Eagle Drive Sidewalk-0.3 miles St. Lucie WBN $1,709,2158 11
33 39.0 Hillmoor Drive Hospital Woodstork Trail Sidewalk-0.5 miles St. Lucie WBN $348,0008 NR
33 39.0 Hillmoor Drive Lennard Road Playground Sidewalk-0.1 miles St. Lucie WBN $71,0008 NR
35 38.0 Emil Avenue Oleander Avenue U.S. Highway 1 Sidewalk-1.7 miles St. Lucie WBN $347,487 31
36 37.0 Florida SUN Trail, Savannas Preserve State Park Gap Walton Road Savannas Recreation
Area Multi-Use Trail Florida SUN Trail Grant and St. Lucie WBN
$6,820,00011 2
37 36.5 Angle Road Kings Highway North 53rd Street Sidewalk-1.3 miles St. Lucie WBN $1,461,5956 NR
38 36.0 17th Street Sidewalk Gaps Georgia Avenue Avenue Q Sidewalk-1.7 miles St. Lucie WBN $222,700 6
38 36.0 Boston Avenue 25th Street 13th Street Sidewalk-0.8 miles St. Lucie WBN $123,200 16
38 36.0 North Torino Parkway East Torino Parkway Blanton Road Sidewalk-1.0 miles St. Lucie WBN $652,0008 NR
41 35.0 Florida SUN Trail, Florida East Coast Railroad Overpass
Savannas Recreation Area Savannah Road Railroad Overpass
for Multi-Use Trail
Florida SUN Trail Grant and St. Lucie WBN
$2,210,00012 15
41 35.0 29th Street Sidewalk Gaps Avenue I Avenue Q Sidewalk-0.5 miles St. Lucie WBN $77,000 16

2018/19 LOPP Adopted August 1, 2018; Amended October 3, 2018 Page 6 of 7
2018/19 Priority Ranking
Score1 Facility Project Limits Project
Description Project Source Estimated
Cost2
2017/18 Priority Ranking From To
41 35.0 29th Street Avenue Q Avenue T Sidewalk-0.1 miles St. Lucie WBN $197,000 25
41 35.0 Abingdon Avenue Import Drive Savona Boulevard Sidewalk-0.9 miles St. Lucie WBN $575,0008 NR
41 35.0 Brescia Street Savage Boulevard Gatlin Boulevard Sidewalk-1.3 miles St. Lucie WBN $323,0008 NR
41 35.0 Cadima Street Fairgreen Road Galiano Road Sidewalk-0.2 miles St. Lucie WBN $96,0008 NR
41 35.0 Fairgreen Road Cadima Street Crosstown Parkway Sidewalk-0.8 miles St. Lucie WBN $523,0008 NR
41 35.0 Galiano Road Cadima Street Import Drive Sidewalk-0.5 miles St. Lucie WBN $290,0008 NR
41 35.0 Kestor Drive Darwin Boulevard Becker Road Sidewalk-1.3 miles St. Lucie WBN $865,0008 NR
41 35.0 Volucia Drive Blanton Boulevard East Torino Parkway Sidewalk-1.3 miles St. Lucie WBN $645,0008 NR
51 33.5 Tiffany Avenue Grand Drive Green River Parkway Sidewalk-1.0 mile St. Lucie WBN $670,4608 13
51 33.5 Weatherbee Road U.S. Highway 1 Oleander Avenue Sidewalk-0.5 miles St. Lucie WBN $445,220 22
53 32.0 Range Line Road Glades Cut Off Road Martin County Line Sidewalk-6.1 miles St. Lucie WBN $5,300,0006 NR
53 32.0 West Midway Road West of Glades Cut Off Road Shinn Road Area Sidewalk-5.0 miles St. Lucie WBN $5,753,5806 NR
55 31.5 St. Lucie Boulevard Kings Highway North 25th Street Sidewalk-3.0 miles St. Lucie WBN $2,600,0006 NR
56 30.5 Sunrise Boulevard Edwards Road Midway Road Sidewalk-2.8 miles St. Lucie WBN $2,250,0006 NR
57 29.5 Bell Avenue Oleander Avenue 25th Street Sidewalk-1.0 miles St. Lucie WBN $600,0006 NR
57 29.5 Fort Pierce Boulevard Indrio Road Sebastian Road Sidewalk-1.0 miles St. Lucie WBN $870,0006 NR
59 27.0 Old Dixie Highway St. Lucie Boulevard Turnpike Feeder Road Sidewalk-5.2 miles St. Lucie WBN $6,066,7806 NR
60 26.5 Glades Cut Off Road Port St. Lucie City Boundary Range Line Road Sidewalk-2.4 miles St. Lucie WBN $2,830,3906 NR
60 26.5 Keen Road Angle Road St. Lucie Boulevard Sidewalk-1.0 miles St. Lucie WBN $1,160,0006 NR
62 25.5 Easy Street US Highway 1 Silver Oak Drive Sidewalk-1.0 miles St. Lucie WBN $1,090,3966 NR
62 25.5 Selvitz Road Edwards Road Midway Road Sidewalk-2.4 miles St. Lucie WBN $2,760,7906 NR
64 24.5 Juanita Avenue Bridge U.S. Highway 1 Sidewalk-0.2 miles St. Lucie WBN $2,041,5926 NR
64 24.5 Juanita Avenue North 53rd Street North 25th Street Sidewalk-1.8 miles St. Lucie WBN $2,041,5926 NR

2018/19 LOPP Adopted August 1, 2018; Amended October 3, 2018 Page 7 of 7
2018/19 Priority Ranking
Score1 Facility Project Limits Project
Description Project Source Estimated
Cost2
2017/18 Priority Ranking From To
66 15.5 Silver Oak Drive Easy Street East Midway Road Sidewalk-1.8 miles St. Lucie WBN $2,076,3926 NR
67 15.0 Taylor Dairy Road Angle Road St. Lucie Boulevard Sidewalk-1.0 miles St. Lucie WBN $1,160,0006 NR
1Scores are based on the St. Lucie TPO TA Project Prioritization Methodology 2Source of Estimated Cost: Go2040 Long Range Transportation Plan, February 2016, unless otherwise noted 3Project is anticipated to be programmed for construction in the FDOT FY 2019/20 - FY 2023/24 Work Program as a result of the 2018 TA Grant Cycle 4WBN: Walk-Bike Network 5Source of Estimated Cost: 2018 TA Grant Application 6Source of Estimated Cost: St. Lucie County Citing FDOT Cost Per Mile @ $226,656 7TBD: To be Determined 8Source of Estimated Cost: City of Port St. Lucie Sidewalk Master Plan (Design and Construction) July 2017 9Source of Estimated Cost: Walton Road Multimodal Improvements Feasibility Study, April 2017 10NR: Not Ranked, typically because this is the first year that the project is in the list 11Source of Estimated Cost: Feasibility Study, SUN Trail Savannas Preserve State Park Gap, June 2018 12Source of Estimated Cost: Feasibility Study for SUN Trail Florida East Coast Railroad Overpass, June 2018
St. Lucie TPO Transportation Improvement Program – FY 2019/20 – FY 2023/2024
E-1
E. PERFORMANCE AND ASSET MANAGEMENT E.1 PERFORMANCE MANAGEMENT Even before Federal legislation such as the Moving Ahead for Progress in the 21st Century Act (MAP-21) and the Fixing America’s Surface Transportation (FAST) Act required Metropolitan Planning Organizations (MPOs) and State Departments of Transportation (DOTs) to implement transportation performance management, the St. Lucie TPO and the Florida Department of Transportation (FDOT) were using performance management to connect investment and policy decisions to help achieve performance goals. Performance measures are quantitative criteria used to evaluate progress toward meeting those goals, and performance measure targets are the benchmarks against which the data collected for the criteria are compared to evaluate the progress. Consistent with MAP-21 and the FAST Act, the St. Lucie TPO conducts performance-based planning, tracks performance measures, and establishes data-driven targets to evaluate the progress. Performance-based planning ensures the most efficient investment of Federal transportation funds by increasing accountability, transparency, and providing for better investment decisions that focus on key outcomes related to the following seven national goals:
• Improving Safety; • Maintaining Infrastructure Condition; • Reducing Traffic Congestion; • Improving the Efficiency of the System and Freight Movement; • Protecting the Environment; and, • Reducing Delays in Project Delivery.
According to MAP-21 and the FAST Act, State DOTs are required to establish Statewide performance targets, and MPOs have the option to support the Statewide targets or adopt their own targets. In addition to the Federally-required performance targets, the St. Lucie TPO has established targets for local performance measures in the Go2040 Long Range Transportation Plan (LRTP) related to local goals. The performance targets adopted to date by the St. Lucie TPO and the FDOT are identified in the TIP/LRTP System Performance Report. The TIP reflects the investment priorities established by the St. Lucie TPO in the Go2040 LRTP by including projects that support the goals and objectives of the Go2040 LRTP. By using the prioritization and project selection process described in Section B.3, the TIP has the anticipated effect of contributing toward the progress in meeting the performance targets. For example, the TPO will make progress toward achieving the adopted performance targets of the Safety Performance Measures by selecting and supporting the implementation of projects which address safety issues such as sidewalk and bicycle lane construction and intersection improvements. Likewise, the TPO will make progress toward achieving performance targets upon adoption in the Florida Freight Mobility and Trade Plan, dated January 2018, by selecting and supporting freight projects in the TPO area which address freight issues such as freight bottlenecks. This anticipated effect and the progress toward meeting the performance targets are confirmed annually by the TIP/LRTP System Performance Report which also demonstrates the linking of the investment priorities to the targets. The TIP/LRTP System Performance Report is presented as follows:

E-2
2014 2015 2016 2017 2018
√ 100 100 100 100 coming soon 75% (13), 70%(14) 70%
√ 77 68 60 95 coming soon 50% (14) 50%
√ 1.13 1.11 1.10 1.12 coming soon 1.75 (13), 2(14) 2 +
10 (2) 10.3 (2) 10.5 (2) 16 +
7 (3) 7 (3) 7 (3) 7 +
26 (4) 26.3 (4) 27.9 (4) 43 +
86 (4) 86 (4) 88 (4) 86 +
74(5)/98.9(6) 82.5(5)/108.8(6) 82.5(5)/108.8(6) 74 +
24.2 (2) 26.6 (2) 26.9 (2) 19 +
√ 96.3% coming soon 60% (14) 60%
√ 0% coming soon 5% (14) 5%
√ 41.1% coming soon 40% (13, 14) 40%
√ 0.8% coming soon 5% (13, 14) 5%
√ 72.3% 81.9% 50% (13, 14) 50%
√ 0% 0% 10% (13, 14) 10%
√ 0 (3) 0 (3) 0 (3) 0 +
√ 0 (3) 0 (3) 0 (3) 0 +
√ 0 (3) 0 (3) 0 (3) 0 +
√ 0 (3) 0 (3) 0 (3) 0 +
0.4 (3) 0.52 (3) 0.51 (3) 0.57
484 (4) 445 (4) 484 (4)
34 (4) 61 (4) 46 (4) 8 +
20 (4) 17 (4) 23 (4) 4 +
6 (4) 6 (4) 7 (4)
26 (8) 26.5 (8) 26.5 (8)
480 (9) 788 (9) 858 (9)
0 (4) 0 (4) 0 (4) 0 +
√ 30 (10) 31 (10) 34 (10) 33 (10) coming soon 0 38/0(12)
√ 0.96 (10) 0.96 (10) 1.01 (10) 1.02 (10) coming soon 0 1.10/0(12)
√ 174 (10) 167 (10) 165 (10) 158 (10) coming soon 0 159/0(12)
√ 5.59 (10) 5.18 (10) 4.96 (10) 4.58 (10) coming soon 0 4.64/0(12)
√ 28 (10) 27 (10) 24 (10) 25 (10) coming soon 0 25/0(12)
Go2040 LRTP Goals Go2040 LRTP Objectives Go2040 and/or FAST Act Performance Measures Federal Requirement
TIP/LRTP System Performance ReportData FDOT
Performance Target
St. Lucie TPO Performance
Target
0Number of projects permanently inundated by Mean Sea Level + 5 inches 0 (11) 0 (11)
% of non-Interstate National Highway System pavement in good condition
Miles of fixed route transit service
% of low-income, older adults, persons with disabilities within ¼ mile of transit route
Maintain the condition and improve the efficiency of transportation assets and services
Maintain condition of existing transportation assets.
% of Interstate pavement in good condition
% of Interstate pavement in poor condition
% of facilities (Fort Pierce/Port St. Lucie intermodal facilities) with condition rating below 3.0 on FTA TERM Scale
Improve efficiency of existing transportation services.
% of non-Interstate National Highway System pavement in poor condition
Passenger trips per vehicle mile of service
% of rolling stock (fixed route vehicles) met or exceeded Useful Life Benchmark
% of National Highway System bridges by deck area classified as in good condition% of National Highway System bridges by deck area classified as in poor condition
% of equipment (non-revenue support/service and maintenance vehicles) met or exceeded Useful Life Benchmark
Provide for efficient transportation that serves local and regional needs and stimulates economic prosperity and growth
Enable people and goods to move around efficiently.
% of person-miles traveled on the Interstate that are reliable
Truck travel time reliability index
Increase transportation options and improve access to destinations that support prosperity and growth.
% population within ¼ mile of Activity Centers
Transit routes providing access to Activity Centers
% of person-miles traveled on the non-Interstate National Highway System that are reliable
Ensure transportation choices for all residents, visitors, and businesses
Improve bike/pedestrian and public transportation networks.
% of roadways with sidewalks and bike lanes
% of transit stops with sidewalk access
Provide for transportation needs of transportation disadvantaged that may include use of automated vehicles.
Number of bicycle riders
Serious injury rate per 100 million vehicle miles traveled
% of rolling stock (demand response vehicles) met or exceeded Useful Life Benchmark
Improve land use and transportation decision-making through community participation and intergovernmental cooperation
Facilitate unified transportation decision-making through intergovernmental cooperation.
Attendance at TPO meetings
Collaboration opportunities with local and resource agencies
Ensure community participation is representative.Collaboration opportunities with community and public groups
Opportunities for engagement in traditionally underserved areas
Make transportation investments that minimize impacts to natural environment and allocate resources toward mitigation.
Number of additional roadway lane miles impacting environmentally-sensitive areas
Increase transit frequency and span of service
Fatality rate per 100 million vehicle miles traveled
Number of serious injuries
Rts 1-3: 60 min, Mon-Sat;
Rts 4-7: 60 min, Mon-Fri
Rts 1-6: 60 min, Mon-Sat;
Rts 7: 60 min, Mon-Fri
Progress Towards Meeting
Target
1-Tindale Oliver data; 2 - ACS 5-year estimates; 3 - St. Lucie County Community Service Department Transit Division; 4- St. Lucie TPO; 5 -Miles of fixed route on major road network, Tindale Oliver; 6 - Miles of fixed route on all road network, SLC; 7 - FDOT Transportation Data and Analytics Office; 8 – Estimation based on datafrom walkscore.com; 9 - Estimation based on Strava data; 10 - 5-year rolling average; 11 - Results from Florida Sea Level Scenario Sketch Planning Tool, based on USACE High projections in 2040; 12 - Interim Benchmark/Target; 13 - FDOT 2-year target; 14 - FDOT 4-year target
+0 (11)
Rts 1-6: 60 min, Mon-Sat;
Rts 7: 60 min, Mon-Fri
Provide safer and more secure transportation
Improve safety of transportation system that may include incorporation of infrastructure in support of automated vehicles.
Number of fatalities
Number of fatalities/serious Injuries, non-motorized
Improve the transportation system’s stability/resiliency in the event of climate change, emergencies or disasters.
Protect and enhance public health and the environment
Support healthy living strategies, programs, and improvements.
Community walkscores
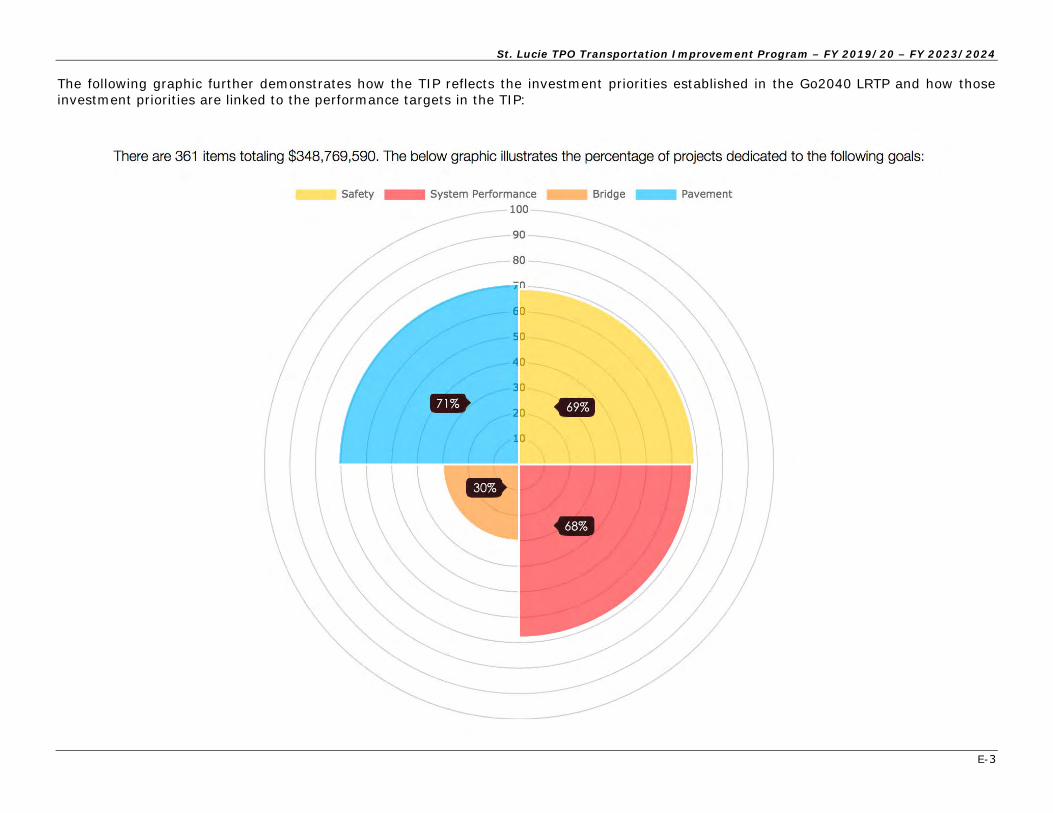
St. Lucie TPO Transportation Improvement Program – FY 2019/20 – FY 2023/2024
E-3
The following graphic further demonstrates how the TIP reflects the investment priorities established in the Go2040 LRTP and how those investment priorities are linked to the performance targets in the TIP:

St. Lucie TPO Transportation Improvement Program – FY 2019/20 – FY 2023/2024
E-4
E.2 ASSET MANAGEMENT
MAP-21 and the FAST Act require transit providers to adopt performance targets for transit asset management, also known as “State of Good Repair” targets, in cooperation with the MPOs. The performance targets adopted to date by the St. Lucie TPO and St. Lucie County, which is the local transit provider, are identified in the TIP/LRTP System Performance Report.
In addition, MAP-21 and the FAST Act require the development of a risk-based TAMP for all pavement and bridges on the National Highway System. The initial Florida Transportation Asset Management Plan (TAMP) was completed by FDOT on April 30, 2018. The TAMP will serve as the basis for establishing in future TIPs the targets for the pavement and bridge condition performance measures identified in the TIP/LRTP System Performance Report. The TPO will make progress toward achieving performance targets upon adoption in the TAMP by selecting and supporting asset management projects in the TPO area which address asset management issues such as pavement resurfacing and bride replacement projects.
The St. Lucie TPO will continue to coordinate with St. Lucie County and FDOT to establish performance targets and meet the other requirements of the Federal performance management process.

St. Lucie TPO Transportation Improvement Program – FY 2019/20 – FY 2023/2024
E-5
E.3 FLORIDA TRANSPORTATION PERFORMANCE MEASURES CONSENSUS PLANNING DOCUMENT
In accordance with 23 CFR 450.314(h), the St. Lucie TPO, FDOT, and St. Lucie County (as the provider of public transportation) have agreed upon and developed specific written provisions for cooperatively developing and sharing information related to transportation performance data, the selection of performance targets, the reporting of performance targets, the reporting of performance to be used in tracking progress toward attainment of critical outcomes for the St. Lucie TPO area, and the collection of data for FDOT’s asset management plan for the National Highway System. These provisions are documented as follows:
Purpose and Authority
This document has been cooperatively developed by the FDOT and Florida’s 27 Metropolitan Planning Organizations (MPOs) through the Florida Metropolitan Planning Organization Advisory Council (MPOAC), and, by representation on the MPO boards and committees, the providers of public transportation in the MPO planning areas.
The purpose of the document is to outline the minimum roles of FDOT, the MPOs, and the providers of public transportation in the MPO planning areas to ensure consistency to the maximum extent practicable in satisfying the transportation performance management requirements promulgated by the United States Department of Transportation in Title 23 Parts 450, 490, 625, and 673 of the Code of Federal Regulations (23 CFR). Specifically:
• 23 CFR 450.314(h)(1) requires that “The MPO(s), State(s), and providers of public transportation shall jointly agree upon and developspecific written procedures for cooperatively developing and sharing information related to transportation performance data, the selectionof performance targets, the reporting of performance targets, the reporting of performance to be used in tracking progress towardachievement of critical outcomes for the region of the MPO, and the collection of data for the State asset management plan for theNational Highway System (NHS).”
• 23 CFR 450.314(h)(2) allows for these provisions to be “Documented in some other means outside the metropolitan planning agreementsas determined cooperatively by the MPO(s), State(s), and providers of public transportation.”
Section 339.175(11), Florida Statutes creates the MPOAC to “Assist MPOs in carrying out the urbanized area transportation planning process by serving as the principal forum for collective policy discussion pursuant to law” and to “Serve as a clearinghouse for review and comment by MPOs on the Florida Transportation Plan and on other issues required to comply with federal or state law in carrying out the urbanized transportation planning processes.” The MPOAC Governing Board membership includes one representative of each MPO in Florida.
This document was developed, adopted, and subsequently updated by joint agreement of the FDOT Secretary and the MPOAC Governing Board. Each MPO will adopt this document by incorporation in its annual Transportation Improvement Program (TIP) or by separate board action as documented in a resolution or meeting minutes, which will serve as documentation of agreement by the MPO and the provider(s) of public transportation in the MPO planning area to carry out their roles and responsibilities as described in this general document.

St. Lucie TPO Transportation Improvement Program – FY 2019/20 – FY 2023/2024
E-6
Roles and Responsibilities This document describes the general processes through which FDOT, the MPOs, and the providers of public transportation in MPO planning areas will cooperatively develop and share information related to transportation performance management. Email communications will be considered written notice for all portions of this document. Communication with FDOT related to transportation performance management generally will occur through the Administrator for Metropolitan Planning in the Office of Policy Planning. Communications with the MPOAC related to transportation performance management generally will occur through the Executive Director of the MPOAC. 1. Transportation performance data:
a) FDOT will collect and maintain data, perform calculations of performance metrics and measures, and provide to each MPO the results of the calculations used to develop statewide targets for all applicable federally required performance measures. FDOT also will provide to each MPO the results of calculations for each applicable performance measure for the MPO planning area, and the county or counties included in the MPO planning area. FDOT and the MPOAC agree to use the National Performance Management Research Data Set as the source of travel time data and the defined reporting segments of the Interstate System and non-Interstate National Highway System for the purposes of calculating the travel time-based measures specified in 23 CFR 490.507, 490.607, and 490.707, as applicable.
b) Each MPO will share with FDOT any locally generated data that pertains to the federally required performance measures, if applicable,
such as any supplemental data the MPO uses to develop its own targets for any measure. c) Each provider of public transportation is responsible for collecting performance data in the MPO planning area for the transit asset
management measures as specified in 49 CFR 625.43 and the public transportation safety measures as specified in the National Public Transportation Safety Plan. The providers of public transportation will provide to FDOT and the appropriate MPO(s) the transit performance data used to support these measures.
2. Selection of performance targets: FDOT, the MPOs, and providers of public transportation will select their respective performance targets in coordination with one another. Selecting targets generally refers to the processes used to identify, evaluate, and make decisions about potential targets prior to action to formally establish the targets. Coordination will include as many of the following opportunities as deemed appropriate for each measure: in-person meetings, webinars, conferences calls, and email/written communication. Coordination will include timely sharing of information on proposed targets and opportunities to provide comment prior to establishing final comments for each measure. The primary forum for coordination between FDOT and the MPOs on selecting performance targets and related policy issues is the regular meetings of the MPOAC. The primary forum for coordination between MPOs and providers of public transportation on selecting transit performance targets is the TIP development process.

St. Lucie TPO Transportation Improvement Program – FY 2019/20 – FY 2023/2024
E-7
Once targets are selected, each agency will take action to formally establish the targets in its area of responsibility.
a) FDOT will select and establish a statewide target for each applicable federally required performance measure.
i. To the maximum extent practicable, FDOT will share proposed statewide targets at the MPOAC meeting scheduled in the calendar quarter prior to the dates required for establishing the target under federal rule. FDOT will work through the MPOAC to provide email communication on the proposed targets to the MPOs not in attendance at this meeting. The MPOAC as a whole, and individual MPOs as appropriate, will provide comments to FDOT on the proposed statewide targets within sixty (60) days of the MPOAC meeting. FDOT will provide an update to the MPOAC at its subsequent meeting on the final proposed targets, how the comments received from the MPOAC and any individual MPOs were considered, and the anticipated date when FDOT will establish final targets.
ii. FDOT will provide written notice to the MPOAC and individual MPOs within two (2) business days of when FDOT establishes
final targets. This notice will provide the relevant targets and the date FDOT established the targets, which will begin the 180-day time-period during which each MPO must establish the corresponding performance targets for its planning area.
b) Each MPO will select and establish a target for each applicable federally required performance measure. To the extent practicable,
MPOs will propose, seek comment on, and establish their targets through existing processes such as the annual TIP update. For each performance measure, an MPO will have the option of either:
i. Choosing to support the statewide target established by FDOT, and providing documentation (typically in the form of meeting
minutes, a letter, a resolution, or incorporation in a document such as the TIP) to FDOT that the MPO agrees to plan and program projects so that they contribute toward the accomplishments of FDOT’s statewide targets for that performance measure.
ii. Choosing to establish its own target, using a quantifiable methodology for its MPO planning area. If the MPO chooses to
establish its own target, the MPO will coordinate with FDOT and, as applicable, providers of public transportation regarding the approach used to develop the target and the proposed target prior establishment of a final target. The MPO will provide FDOT and, as applicable, providers of public transportation, documentation (typically in the form of meeting minutes, a letter, a resolution, or incorporation in a document such as the TIP) that includes the final targets and the date when the targets were established.
c) The providers of public transportation in MPO planning areas will select and establish performance targets annually to meet the
federal performance management requirements for transit asset management and transit safety under 49 U.S.C. 5326(c) and 49 U.S.C. 5329(d).
i. The Tier I providers of public transportation will establish performance targets to meet the federal performance management
requirements for transit asset management. Each Tier I provider will provide written notice to the appropriate MPO and FDOT when it establishes targets. This notice will provide the final targets and the date when the targets were established, which will begin the 180- day period within which the MPO must establish its transit-related performance targets. MPOs may choose

St. Lucie TPO Transportation Improvement Program – FY 2019/20 – FY 2023/2024
E-8
to update their targets when the Tier I provider(s) updates theirs, or when the MPO amends its long-range transportation plan by extending the horizon year in accordance with 23 CFR 450.324(c).
ii. FDOT is the sponsor of a Group Transit Asset Management plan for subrecipients of Section 5311 and 5310 grant funds. The
Tier II providers of public transportation may choose to participate in FDOT’s group plan or to establish their own targets. FDOT will notify MPOs and those participating Tier II providers following of establishment of transit-related targets. Each Tier II provider will provide written notice to the appropriate MPO and FDOT when it establishes targets. This notice will provide the final targets and the date the final targets were established, which will begin the 180-day period within which the MPO must establish its transit-related performance targets. MPOs may choose to update their targets when the Tier II provider(s) updates theirs, or when the MPO amends its long-range transportation plan by extending the horizon year in accordance with 23 CFR 450.324(c).
iii. FDOT will draft and certify a Public Transportation Agency Safety Plan for any small public transportation providers (defined
as those who are recipients or subrecipients of federal financial assistance under 49 U.S.C. 5307, have one hundred (100) or fewer vehicles in peak revenue service, and do not operate a rail fixed guideway public transportation system). FDOT will coordinate with small public transportation providers on selecting statewide public transportation safety performance targets, with the exception of any small operator that notifies FDOT that it will draft its own plan.
iv. All other public transportation service providers that receive funding under 49 U.S. Code Chapter 53 (excluding sole recipients
of sections 5310 and/or 5311 funds) will provide written notice to the appropriate MPO and FDOT when they establish public transportation safety performance targets. This notice will provide the final targets and the date the final targets were established, which will begin the 180-day period within which the MPO must establish its transit safety performance targets. MPOs may choose to update their targets when the provider(s) updates theirs, or when the MPO amends its long-range transportation plan by extending the horizon year in accordance with 23 CFR 450.324(c).
v. If the MPO chooses to support the asset management and safety targets established by the provider of public transportation,
the MPO will provide to FDOT and the provider of public transportation documentation that the MPO agrees to plan and program MPO projects so that they contribute toward achievement of the statewide or public transportation provider targets. If the MPO chooses to establish its own targets, the MPO will develop the target in coordination with FDOT and the providers of public transportation. The MPO will provide FDOT and the providers of public transportation documentation (typically in the form of meeting minutes, a letter, a resolution, or incorporation in a document such as the TIP) that includes the final targets and the date the final targets were established. In cases where two or more providers operate in an MPO planning area and establish different targets for a given measure, the MPO has the options of coordinating with the providers to establish a single target for the MPO planning area, or establishing a set of targets for the MPO planning area.
3. Reporting performance targets:
a) Reporting targets generally refers to the process used to report targets, progress achieved in meeting targets, and the linkage between targets and decision making processes FDOT will report its final statewide performance targets to the Federal Highway Administration (FHWA) and the Federal Transit Administration (FTA) as mandated by the federal requirements.

St. Lucie TPO Transportation Improvement Program – FY 2019/20 – FY 2023/2024
E-9
i. FDOT will include in future updates or amendments of the statewide long-range transportation plan a description of allapplicable performance measures and targets and a system performance report, including progress achieved in meeting theperformance targets, in accordance with 23 CFR 450.216(f).
ii. FDOT will include in future updates or amendments of the statewide transportation improvement program a discussion of theanticipated effect of the program toward achieving the state’s performance targets, linking investment priorities to thoseperformance targets, in accordance with 23 CFR 450.218 (q).
iii. FDOT will report targets and performance data for each applicable highway performance measure to FHWA, in accordancewith the reporting timelines and requirements established by 23 CFR 490; and for each applicable public transit measure toFTA, in accordance with the reporting timelines and requirements established by 49 CFR 625 and 40 CFR 673.
b) Each MPO will report its final performance targets as mandated by federal requirements to FDOT. To the extent practicable, MPOswill report final targets through the TIP update or other existing documents.
i. Each MPO will include in future updates or amendments of its metropolitan long- range transportation plan a description ofall applicable performance measures and targets and a system performance report, including progress achieved by the MPOin meeting the performance targets, in accordance with 23 CFR 450.324(f)(3-4).
ii. Each MPO will include in future updates or amendments of its TIP a discussion of the anticipated effect of the TIP towardachieving the applicable performance targets, linking investment priorities to those performance targets, in accordance with23 CFR 450.326(d).
iii. Each MPO will report target-related status information to FDOT upon request to support FDOT’s reporting requirements toFHWA.
c) Providers of public transportation in MPO planning areas will report all established transit asset management targets to the FTANational Transit Database (NTD) consistent with FTA’s deadlines based upon the provider’s fiscal year and in accordance with 49 CFRParts 625 and 630, and 49 CFR Part 673.
4. Reporting performance to be used in tracking progress toward attainment of performance targets for the MPO planning area:
a) FDOT will report to FHWA or FTA as designated, and share with each MPO and provider of public transportation, transportationperformance for the state showing the progress being made towards attainment of each target established by FDOT, in a format tobe mutually agreed upon by FDOT and the MPOAC.
b) If an MPO establishes its own targets, the MPO will report to FDOT on an annual basis transportation performance for the MPO areashowing the progress being made towards attainment of each target established by the MPO, in a format to be mutually agreed uponby FDOT and the MPOAC. To the extent practicable, MPOs will report progress through existing processes including, but not limitedto, the annual TIP update.

St. Lucie TPO Transportation Improvement Program – FY 2019/20 – FY 2023/2024
E-10
c) Each provider of public transportation will report transit performance annually to the MPO(s) covering the provider’s service area,showing the progress made toward attainment of each target established by the provider.
5. Collection of data for the State asset management plans for the National Highway System (NHS):
a) FDOT will be responsible for collecting bridge and pavement condition data for the State asset management plan for the NHS. Thisincludes NHS roads that are not on the State highway system but instead are under the ownership of local jurisdictions, if such roadsexist.

-
APPENDICES
St. Lucie TPO Transportation Improvement Program – FY 2019/20 – FY 2023/2024

-
APPENDIX A: EXAMPLE PUBLIC COMMENT NOTICE
St. Lucie TPO Transportation Improvement Program – FY 2019/20 – FY 2023/2024

Coco Vista Centre 466 SW Port St. Lucie Blvd, Suite 111
Port St. Lucie, Florida 34953 772-462-1593 www.stlucietpo.org
TRANSPORTATION IMPROVEMENT PROGRAM
PUBLIC COMMENT OPPORTUNITIES Public comment opportunities are provided for the draft FY 2019/20–FY 2023/24 Transportation Improvement Program (TIP) of the St. Lucie Transportation Planning Organization (TPO). The TIP identifies the phases of the transportation projects that are expected to occur within the TPO area over the next 5 years. To Obtain the TIP for Review 1) Appear in person or write to the St. Lucie TPO at 466 SW Port St. Lucie Boulevard,
Suite 111, Port St. Lucie, Florida, 34953 2) Call 772-462-1593 3) Access the TPO website at www.stlucietpo.org To Provide Comments on the TIP 1) Write to the St. Lucie TPO at 466 SW Port St. Lucie Blvd, Suite 111, Port St. Lucie,
Florida, 34953 2) Call 772-462-1593 3) Email [email protected] 4) Appear in person at the following public St. Lucie TPO Board Meeting:
June 5, 2019, 2:00pm Coco Vista Centre 466 SW Port St. Lucie Boulevard, Suite 111 Port St. Lucie, Florida
For Special Assistance Disabled: Persons who require special accommodations under the Americans with Disabilities Act (ADA) or persons who require translation services (free of charge) should contact Marceia Lathou at 772-462-1593 at least five days prior to the meeting. Persons who are hearing or speech impaired may use the Florida Relay System by dialing 711. Kreyol Ayisyen: Si ou ta renmen resevwa enfòmasyon sa a nan lang Kreyòl Aysiyen, tanpri rele nimewo 772-462-1593. Español: Si usted desea recibir esta informaciòn en español, por favor llame al 772-462-1593. Title VI Statement: The St. Lucie TPO satisfies the requirements of various nondiscrimination laws and regulations including Title VI of the Civil Rights Act of 1964. Public participation is welcome without regard to race, color, national origin, age, sex, religion, disability, income, or family status. Persons wishing to express their concerns about nondiscrimination should contact Marceia Lathou, the Title VI/ADA Coordinator of the St. Lucie TPO, at 772-462-1593 or via email at [email protected].
Transportation Planning for Fort Pierce, Port St. Lucie, St. Lucie Village and St. Lucie County

-
APPENDIX B: LOCAL PROJECTS CITY OF FORT PIERCE
(For informational purposes)
St. Lucie TPO Transportation Improvement Program – FY 2019/20 – FY 2023/2024

DRAFT Revised Date: 6/5/2019
TRANSPORTATION
STREET PROJECTS
1 Ohio Avenue Realignment (US 1 @ Ohio Ave.) 1,237,436$ 135,875$ 1,101,561$ -$ -$ -$ CITY-R, SMU Design Construction/
Testing/CEI FDOT, FPUA
2 Citrus Overpass Bridge Repairs 950,000$ -$ -$ 950,000$ -$ -$ -$ City-R, Sur-Tax
3 Street Resurfacing (Citywide) 16,246,580$ 971,754$ $14,974,826 300,000$ -$ -$ -$ CITY-GF Construction CITY-R, Sur-
Tax Unfunded
4 17th St - Phase 1 (Orange Ave. North to Ave. D) 1,497,713$ 205,116$ 1,292,597$ -$ -$ -$ FPRA, SMU Design FEMA
5 Pavement Markings (Partial) 205,000$ -$ $205,000 -$ -$ -$ -$ -$ Unfunded
6 S. 7th St Reconstruction (Wendell to 10th St) 848,186$ -$ 848,186$ -$ -$ -$ -$ CITY GF, SMU, Sur-Tax, FPUA
7 13th St - Phase 3 (Ave. E to Ave. Q) 2,124,605$ 263,445$ $1,861,160 -$ -$ -$ -$ -$ FPRA Design Unfunded
STREET PROJECTS TOTAL (this page) 23,109,520$ 1,576,190$ $17,040,986 848,186$ 3,644,158$ -$ -$ -$
FOR MORE DETAILS
Capital Improvement Plan Fiscal Years 2018/2019 through 2022/2023
TOTAL PROJECT COST
ITEM NO. PROJECT NAME PREVIOUSLY
APPROPIATEDUNFUNDED
AMOUNT FY 18/19 FY 19/20 FY 20/21 FY 21/22 FY 22/23 FUNDING SOURCES
Description: Project includes reconstruction of roadway, drainage, sidewalk, limited landscaping and street lighting. Sanitary sewer, water main, and overhead utilities conversion to underground anticipated, but not, included in project costs.
Description: Project includes reconstruction of roadway, drainage, sidewalk, limited landscaping and street lighting. Sanitary sewer, water main, and overhead utilities conversion to underground anticipated, but not, included in project costs.
Description: Realignment of east leg of intersection. Construction includes paving, drainage, sidewalk, mast arm installation, signalization upgrades and landscaping.
Description: Milling, curb reconstruction and asphalt overlay.
Description: Replacement of pavement markings to comply with MUTCD Standards for marking retroreflectivity.
Description: Roadway reconstruction, drainage, and sidewalk. Water, sewer,and electrical replacement is not included in total project cost.
Description: Project entails maintenance work as outlined by the biennial bridge inspection report. Deficiencies include; concrete spalling, exposed rebar, failed compression joints, understructure paint and deck joint seals.
T-2 STREET PROJECTS

DRAFT Revised Date: 6/5/2019
TRANSPORTATION
STREET PROJECTS
9 Wendell Road (8th to Chipola Road) 1,344,111$ -$ $1,344,111 -$ -$ -$ -$ -$ Unfunded
10 Ohio Avenue (Sunrise Blvd. to US1) 1,346,535$ -$ $1,346,535 -$ -$ -$ -$ -$ Unfunded
11 13th St - Phase 4 (Georgia Ave. to Orange Ave.) 4,584,896$ 274,880$ $4,310,016 -$ -$ -$ -$ -$ FPRA Design Unfunded
12 Avenue I Corridor (13th St. to 25th St.) 2,824,545$ 164,474$ $2,660,071 -$ -$ -$ -$ -$ FPRA Design Unfunded
13 13th St. - Phase 5 (Virginia Ave. to Georgia Ave.) 6,256,782$ -$ $6,256,782 -$ -$ -$ -$ -$ Unfunded
14 US 1 @ Virginia Ave. 3,410,445$ 421,115$ $0 -$ 100,000$ 2,889,330$ -$ -$ FDOTUtilities Construction/
Land
15 Indian River Dr. (Ave. A to Seaway Drive) 2,070,000$ -$ $2,070,000 -$ -$ -$ -$ -$ Unfunded
STREET PROJECTS TOTAL (this page) 21,837,314$ 860,469$ $17,987,515 -$ 100,000$ 2,889,330$ -$ -$
Description: Reconstruction of roadway, drainage, sidewalks, street lighting, and landscaping. Conversion of overhead utilities to undergroundand water/sewer replacement anticipated, but not part of total project cost.
FOR MORE DETAILSPROJECT NAME TOTAL PROJECT
COSTPREVIOUSLY
APPROPIATED
Description: Project includes reconstruction of roadway, drainage, sidewalk, limited landscaping and street lighting. Sanitary sewer, water main, and overhead utilities conversion to underground anticipated, but not, included in project costs.
Description: A joint project by the city and Fort Pierce Utilities Authority primarly for the replacement of utilities. The project will entail water and sewer main replacement, drainage improvements, sidewalk replacement and roadway reconstruction.
Description: A joint project by the city and Fort Pierce Utilities Authority primarly for the replacement of utilities. The project will entail water and sewer main replacement, drainage improvements, sidewalk replacement and roadway reconstruction.
Capital Improvement Plan Fiscal Years 2018/2019 through 2022/2023
UNFUNDED AMOUNT FY 18/19 FY 19/20 FY 20/21 FY 21/22 FY 22/23 FUNDING
SOURCES
Description: Addition of right turn lane on US 1. Preliminary design, land acquisition, and final design currently funded. Construction funding by FDOT currently beyond five year outlook.
Description: Project includes reconstruction of roadway, drainage, canal enclosure, sidewalk, limited landscaping and street lighting. Sanitary sewer, water main, and overhead utilities conversion to underground anticipated, but not, included in project costs.
Description: Project includes reconstruction of roadway, drainage, sidewalk, limited landscaping and street lighting. Sanitary sewer, water main, and overhead utilities conversion to underground anticipated, but not, included in project costs.
ITEM NO.
T-3 STREET PROJECTS

DRAFT Revised Date: 6/5/2019
TRANSPORTATION
STREET PROJECTS
16 Port Streets (Port Ave., Harbor St.) 317,500$ -$ $317,500 -$ -$ -$ -$ -$ Unfunded
17 Granada Street Paving 296,250$ -$ $296,250 -$ -$ -$ -$ -$ Unfunded
STREET PROJECTS TOTAL (this page) 613,750$ -$ $613,750 -$ -$ -$ -$ -$
STREET PROJECTS TOTAL (previous pages) 44,946,834$ 2,436,659$ $35,028,501 848,186$ 3,744,158$ 2,889,330$ -$ -$
STREET PROJECTS TOTAL 45,560,584$ 2,436,659$ $35,642,251 848,186$ 3,744,158$ 2,889,330$ -$ -$
(Porpoise Avenue to North of Gulfstream) Description: Paving, drainage, and sidewalks for unpaved section of Granada Street.
Capital Improvement Plan Fiscal Years 2018/2019 through 2022/2023
ITEM NO. PROJECT NAME TOTAL PROJECT
COSTPREVIOUSLY
APPROPIATEDUNFUNDED
AMOUNT FY 18/19 FY 19/20 FY20/21
Description: Project scope includes drainage improvements, replacement of curbing, roadway reconstruction and sidewalks.
FY 21/22 FY 22/23 FUNDING SOURCES
FOR MORE DETAILS
T-4 STREET PROJECTS

-
APPENDIX C: LOCAL PROJECTS CITY OF PORT ST. LUCIE
(For informational purposes)
St. Lucie TPO Transportation Improvement Program – FY 2019/20 – FY 2023/2024

5/3/2019
ROAD & BRIDGE CAPITAL IMPROVEMENT BUDGET - #304TEN YEAR PROJECTION
FY 2019-20 & FY 2020-21 BIENNAL BUDGET2018-2019 2019-2020 2020-2021 2021-2022 2022-2023 2023-2024 2024-2025 2025-2026 2026-2027 2027-2028 2028-2029
------- ------- ------- ------- ------- ------- ------- ------- ------- ------- -------REVENUES: Estimated Budget Budgeted Cash Carryforward 2,500,000$ 2,618,499$ 2,800,974$ 36,798$ 515,478$ 1,287,023$ 2,257,867$ 1,033,530$ 50,797$ 1,662,921$ 3,125,045$ Budgeted Cash Carryforward - PSL Blvd. Widening - Developer Contribution from 10-11 - 606,385 606,385 - - - - Budgeted Cash Carryforward - Bucket Truck - - - - - - - Local Option Gas Tax - 2 cents/gal. - renewed 1,654,440 1,687,529 1,721,279 1,755,705 1,790,819 1,826,635 1,863,168 1,900,432 1,938,440 1,938,440 1,977,209 Local Option Gas Tax - 3 cents/gal. - renewed 2,472,000 2,546,160 2,622,545 2,701,221 2,755,246 2,810,350 2,866,557 2,923,889 2,982,366 2,982,366 3,042,014 Road Impact Fees 2,500,000 2,525,000 2,525,000 2,525,000 2,525,000 2,525,000 2,525,000 2,525,000 2,525,000 2,525,000 2,525,000 Interest Income & Other 478,728 110,000 110,000 110,000 110,000 200,000 250,000 110,000 110,000 110,000 110,000 PSL Floresta Intersection County Incentive Grant - 125,000 FDOT - TRIP Agreement - SW Port St. Lucie Blvd North Reconstruction - - 2,330,000 - - - - FDOT - New Sidewalks Paar Drive 368,728 - - - - - - FDOT - New Sidewalks - North Macedo Blvd 613,756 FDOT - New Sidewalk - Curtis Street - - - 317,909 - - - FDOT - New Sidewalk - Alcantarra Boulevard - - - 330,886 - - -
Total Revenues 9,973,896$ 10,707,329$ 12,841,183$ 7,777,519$ 7,696,542$ 8,649,009$ 9,762,592$ 8,492,850$ 7,606,603$ 9,218,728$ 10,779,268$
EXPENDITURES:OPERATIONS/ADMINISTRATION - PUBLIC WORKS - #304-4105
Project Management Costs for Capital Improvements (531000) 100,000$ 100,000$ 100,000$ 100,000$ 100,000$ 100,000$ 100,000$ 100,000$ 100,000$ 100,000$ 100,000$ New Sidewalks (534000) - Citywide (local funds) (Y1420) 1,000,000 1,000,000 1,000,000 1,000,000 1,000,000 1,000,000 1,000,000 1,000,000 1,000,000 1,000,000 1,000,000
50,000 Traffic Calming (563000) 75,000 150,000 150,000 150,000 150,000 150,000 150,000 150,000 150,000 150,000 150,000
368,728 - - - - - - FDOT - New Sidewalks - North Macedo Blvd 766,439 PSL Floresta Intersection County Incentive Grant - - 250,000 - - - -FDOT - New Sidewalk - Curtis Street - - 317,909 - - -FDOT - New Sidewalk - Alcantarra Boulevard - - 330,886 - - - Building Improvements 2,000,000 2,000,000 -
Sub-Totals 1,593,728$ 2,016,439$ 1,500,000$ 1,898,795$ 1,250,000$ 1,250,000$ 3,250,000$ 3,250,000$ 1,250,000$ 1,250,000$ 1,250,000$
ADA Compliance/Curb Ramps (534000)
CITY OF PORT ST. LUCIE5/3/19 DRAFTNOT APPROVED BY CITY COUNCIL

5/3/2019
CITY OF PORT ST. LUCIEROAD & BRIDGE CAPITAL IMPROVEMENT BUDGET - #304
FIVE YEAR PROJECTIONFY 2018-19 & FY 2020-21 BIENNAL BUDGET
2018-2019 2019-2020 2020-2021 2021-2022 2022-2023 2023-2024 2024-2025 2025-2026 2026-2027 2027-2028 2028-2029------- ------- ------- ------- ------- ------- ------- ------- ------- ------- -------
TRAFFIC CONTROL DIVISION - PUBLIC WORKS - #304-4121ADA Improvements - signals various locations (531000) 40,000$ 40,000$ 40,000$ 40,000$ 40,000$ 40,000$ 40,000$ 40,000$ 40,000$ 40,000$ 40,000$ SW Port St. Lucie Blvd. North Reconstruction (Y1717) Dev. Contribution $606,385 - - 6,000,000 - - - -
Savona & Paar Intersection Improvements 300,000 1,200,000
Bayshore & Lakehurst Signalization 100,000 800,000
100,000 Replace PW-6619 2007 Ford F-450 Pickup with Ford F-250 Utility Body - 43,472 - - - - Replace PW-5976 2006 Ford F-150 Pickup with Ford F-250 Utility Body - 43,472 - - - - Replace PW-9909 2005 Ford F-150 Pickup with Ford F-250 Utility Body - - 43,472 - - - - Replace PW-3049 2006 Bucket Truck - - - 199,500 - - Replace PW- 5647 Platform Truck 146,107 Replace PW- 8618 2006 Bucket Truck 300,000 Replace PW - 5975 2006 For F-150 Pickup with Ford F-250 Utility Body 43,472 Replace PW-5979 2006 For F-150 Pickup with Ford F-250 Utility Body - 43,472 Replace PW-3960 2008 Ford F-450 Pickup with Ford F-250 Utility Body - 43,472
Sub-Totals 140,000$ 126,944$ 6,083,472$ 729,079$ 160,000$ 1,540,000$ 1,676,944$ 1,890,000$ 1,390,000$ 40,000$ 40,000$
STREETS DIVISION - PUBLIC WORKS - #304-4125Annual Resurfacing Program (534132) 3,000,000$ 3,000,000$ 3,000,000$ 3,000,000$ 3,000,000$ 3,000,000$ 3,000,000$ 3,000,000$ 3,000,000$ 4,500,000$ 6,000,000$
450,000 -Contract Repair / ADA Improvements of Sidewalks & Curb Ramps(534133) 200,000 250,000 250,000 250,000 250,000 250,000 250,000 250,000 250,000 250,000 250,000Village Green Drive Improvements - 150,000 300,000 - - - -Port St. Lucie Blvd Resurfacing - - - - 400,000 - -Glenwood Rehabilitation 500,000
58,794 - - - - - -58,794 - - - - - -
Replace PW-9440 1999 New Holland Skid Steer 61,645 Replace PWS-5731 2009 Tymco 600 Street Sweeper 300,000 Replace PWD-3962 2008 Ford F-450 Pickup 61,653 Replace-PWD-7134 2004 Ford F-450 Pickup 61,653 Replace PWD-3871 2007 Ford F-450 Pickup 61,653 Replace PWD-2013 2005 Ford F-450 Pickup 61,653 Replace PW-8940 2007 Pothole Patch Truck - - 250,000 - - - - - Replace PWD-3870 2006 Ford F-450 Pickup 61,653 Replace PWS-2930 2015 Tymco 600 Street Sweeper 300,605
Sub-Totals 3,767,588$ 3,884,951$ 3,923,306$ 3,311,653$ 3,650,000$ 3,550,605$ 3,750,000$ 3,250,000$ 3,250,000$ 4,750,000$ 6,250,000$
Administrative Charge from the General Fund 47,696$ 47,636$ 49,127$ 49,065$ 50,601$ 50,537$ 52,119$ 52,053$ 53,682$ 53,682$ 53,615$Fund Transfer to Road & Bridge - Debt Payment 1,200,000 1,224,000 1,248,480 1,273,450 1,298,919 - -
Sub-Totals 1,247,696$ 1,271,636$ 1,297,607$ 1,322,515$ 1,349,519$ 50,537$ 52,119$ 52,053$ 53,682$ 53,682$ 53,615$
ROAD & BRIDGE CIP FUND TOTALS 6,749,012$ 7,299,970$ 12,804,385$ 7,262,042$ 6,409,519$ 6,391,142$ 8,729,063$ 8,442,053$ 5,943,682$ 6,093,682$ 7,593,615$
-$ -$ -$ -$ -$ -$ -$Designated CIP Reserve -$ -$ -$ -$ -$ -$ -$ -$ -$ -$ -$
SURPLUS/<DEFICIT> 3,224,884$ 3,407,359$ 36,798$ 515,478$ 1,287,023$ 2,257,867$ 1,033,530$ 50,797$ 1,662,921$ 3,125,045$ 3,185,653$
5/3/19 DRAFTNOT APPROVED BY CITY COUNCIL

-
APPENDIX D: LOCAL PROJECTS: ST. LUCIE COUNTY
(For informational purposes)
St. Lucie TPO Transportation Improvement Program – FY 2019/20 – FY 2023/2024

PROJECT NAME 19/20 BUDGET PM CONSULTANTSCOPINGGlades Cut-Off Road at Selvitz Road Intersection $300,000.00Jenkins Road PD&E Study (Midway Rd to Orange Ave) $0.00Johnston Road at Canal 1 $350,000.00Johnston Road at FPFWCD Canal 16 $15,000.00Keen Road Bridge over Taylor Creek $300,000.00Oleander Avenue Vision Study $0.00DESIGNEdwards Road from Oleander Ave to U.S. 1 $1,500,000.00Gordy Road Bridge over 10-Mile Creek $1,250,000.00Midway Road at NSLRWCD Canal 22 $80,000.00Old Dixie Highway Bridge over Taylor Creek $250,000.00Orange Avenue Culvert Repair MP 2.2 - 4.0 $225,000.00School Zone Upgrades $120,000.00Selvitz Road over NSLRWCD Canal 102 $0.00St. James Boulevard - Sidewalk $260,000.00Traffic Communication Conduit and Fiber $300,000.00CONSTRUCTIONBridge Repairs and Rehabilitation $500,000.00Prima Vista Boulevard - Resurfacing $1,500,000.00

-
APPENDIX E: SUMMARY OF COMMENTS
St. Lucie TPO Transportation Improvement Program – FY 2019/20 – FY 2023/2024

FY 2019/20 – FY 2023/24 Transportation Improvement Program Summary of Public Comments
Comment Commenter Date/Method Received Incorporation into Study
Summary Start Date: May 15, 2019 Summary Completion Date: June 15, 2019
Recommend for adoption Citizens Advisory Committee
(CAC) May 21, 2019/Presentation to CAC Not Applicable
Recommend for adoption Technical Advisory Committee
(TAC) May 21, 2019/Presentation to TAC Not Applicable
Recommend for adoption Bicycle-Pedestrian Advisory
Committee (BPAC) May 23, 2019/Presentation to BPAC Not Applicable
Adopted TPO Board June 5, 2019/Presentation to Board Not Applicable

-
APPENDIX F: TIP COMPARISON TABLE
St. Lucie TPO Transportation Improvement Program – FY 2019/20 – FY 2023/2024

Category Project ID PH Phase DescriptionFY in
Last TIP
FY inCurrent
TIP
Comments
ADVANCES 4317523 32 Design 2021 2020 Phase advanced at MPO requestC2 Environmental 2022 2021 Phase advanced at MPO request
4383791 C2 Environmental 2022 2020 Phase advanced to align with production schedule4397541 C2 Environmental 2021 2020 Phase advanced to align with production schedule4421021 94 Capital Grant 2021 2020 Phase advanced at request of locals
DELAYS 4299362 52 Construction 2021 2022 Phase deferred to align with production schedule56 Utility 2020 2021 Phase deferred to align with production schedule62 CEI 2021 2022 Phase deferred to align with production schedule
4383792 45 ROW Relocate 2020 2021 Phase deferred to align with production schedule4400321 32 Design 2020 2022 Phase deferred to meet Department needs
37 Rail 2020 2022 Phase deferred to meet Department needsC2 Environmental 2021 2023 Phase deferred to meet Department needs
4413141 52 Construction 2020 2022 Phase deferred to meet Landscaping statutory requirement62 CEI 2020 2022 Phase deferred to meet Landscaping statutory requirement
DELETIONS 4385441 52 Construction 2022 Reserve deleted to fund MPO priorities4399991 52 Construction 2021 Phase deleted; services to be completed under 439999-2 & 439999-3
62 CEI 2021 Phase deleted; services to be completed under 439999-2 & 439999-44405681 22 PD&E 2021 Phase deleted; converted to design4420171 94 Capital Grant 2021 Phase deleted at request of local
MOVED OUT (DELAY)
4385431 52 Construction
PORT ST. LUCIE BLVD FROM BECKER ROAD TO PAAR DRIVEPORT ST. LUCIE BLVD FROM BECKER ROAD TO PAAR DRIVESR-713/KINGS HWY FR N OF SR-9/I-95 OVERPASS TO N OF COMMERCIAL CIRSR-9/I-95 NORTHBOUND AND SOUTHBOUND OFF-RAMPS AT MIDWAY RD. TREASURE COAST INTERNATIONAL AIRPORT CONSTRUCT MICROSURFACING RW 14/12 SR-A1A NORTH BRIDGE OVER ICWW BRIDGE #940045SR-A1A NORTH BRIDGE OVER ICWW BRIDGE #940045SR-A1A NORTH BRIDGE OVER ICWW BRIDGE #940045SR-713/KINGS HWY FROM NORTH OF COMMERCIAL CIRCLE TO ST LUCIE BLVDFEC OVERPASS FROM SAVANNAS RECREATION AREA TO SOUTH OF SAVANNAH RD. FEC OVERPASS FROM SAVANNAS RECREATION AREA TO SOUTH OF SAVANNAH RD. FEC OVERPASS FROM SAVANNAS RECREATION AREA TO SOUTH OF SAVANNAH RD. SR-9/I-95 @ BECKER ROAD INTERCHANGESR-9/I-95 @ BECKER ROAD INTERCHANGEPORT ST. LUCIE BLVD FROM PAAR DRIVE TO DARWIN BLVD - RESERVESAVANNAS PRESERVE STATE PARK GAP WALTON RD.TO SAVANNAS RECREATION AREA SAVANNAS PRESERVE STATE PARK GAP WALTON RD.TO SAVANNAS RECREATION AREA SR-716/PORT ST LUCIE BLVD @ FLORESTA DRTREASURE COAST INTERNATIONAL AIRPORT CONSTRUCT NORTH PARALLEL TAXIWAY W. MIDWAY RD/CR-712 FROM GLADES CUT OFF ROAD TO SELVITZ ROAD - RESERVE 2023 2024 Phase deferred to align with fund availability
Projects in the current TIP that have phases with different dates than were in the last TIP
Project Description
Project ID Project Description Project Type
4108444 CROSSTOWN PARKWAY NEW BRIDGE CONSTRUCTION4400332 HISTORIC DOWNTOWN FT. PIERCE RETROFIT BIKE PATH/TRAIL4400342 HISTORIC HIGHWAYMAN TRAIL GAP BIKE PATH/TRAIL4366171 I-95 BRIDGE DECK REPLACEMENT @ GLADES CUT OFF RD & FEC RR BRIDGE REHABILITATION4399971 INDIAN HILLS RECREATION AREA BIKE PATH/TRAIL2303384 INDRIO RD FROM WEST OF I-95 TO EAST OF EMERSON AV ADD LANES & RECONSTRUCT4381301 PAAR DRIVE FROM PORT ST LUCIE BLVD TO DARWIN BLVD SIDEWALK4407031 PORT OF FORT PIERCE FISHERMANS WHARF BULKHEAD SEAPORT CAPACITY PROJECT4419571 TREASURE COAST AIRPORT CONNECTOR STUDY FEASIBILITY STUDY4287281 US HIGHWAY 1 FROM MIDWAY RD TO EDWARDS RD RESURFACING
Projects that are in the last TIP and not in the current TIP

-
APPENDIX G: TIP AMENDMENT FORMS
St. Lucie TPO Transportation Improvement Program – FY 2019/20 – FY 2023/2024