Table of Contents RANGE BREAK & PULLBACKS · 2019-06-03 · For swing trading you can always use...
19
CUSTOM STRATEGIES BUILT BY TRADE IDEAS PROFESSIONALS RANGE BREAK & PULLBACKS
Transcript of Table of Contents RANGE BREAK & PULLBACKS · 2019-06-03 · For swing trading you can always use...
1 Trade Ideas | The SetupTable of Contents
CUSTOM STRATEGIES BUILT BY TRADE IDEAS PROFESSIONALS
RANGE BREAK& PULLBACKS
2 Trade Ideas | The SetupA quick passage
The ideal situation for me is
a stock that has recently hit a
6 month to year high, then a
pullback on the 5 day time frame,
price is above the 50 day SMA,
and then puts out a bullish daily
setup bar.
3 Trade Ideas | The SetupTable of Contents
CHAPTER
CHAPTER
01
02
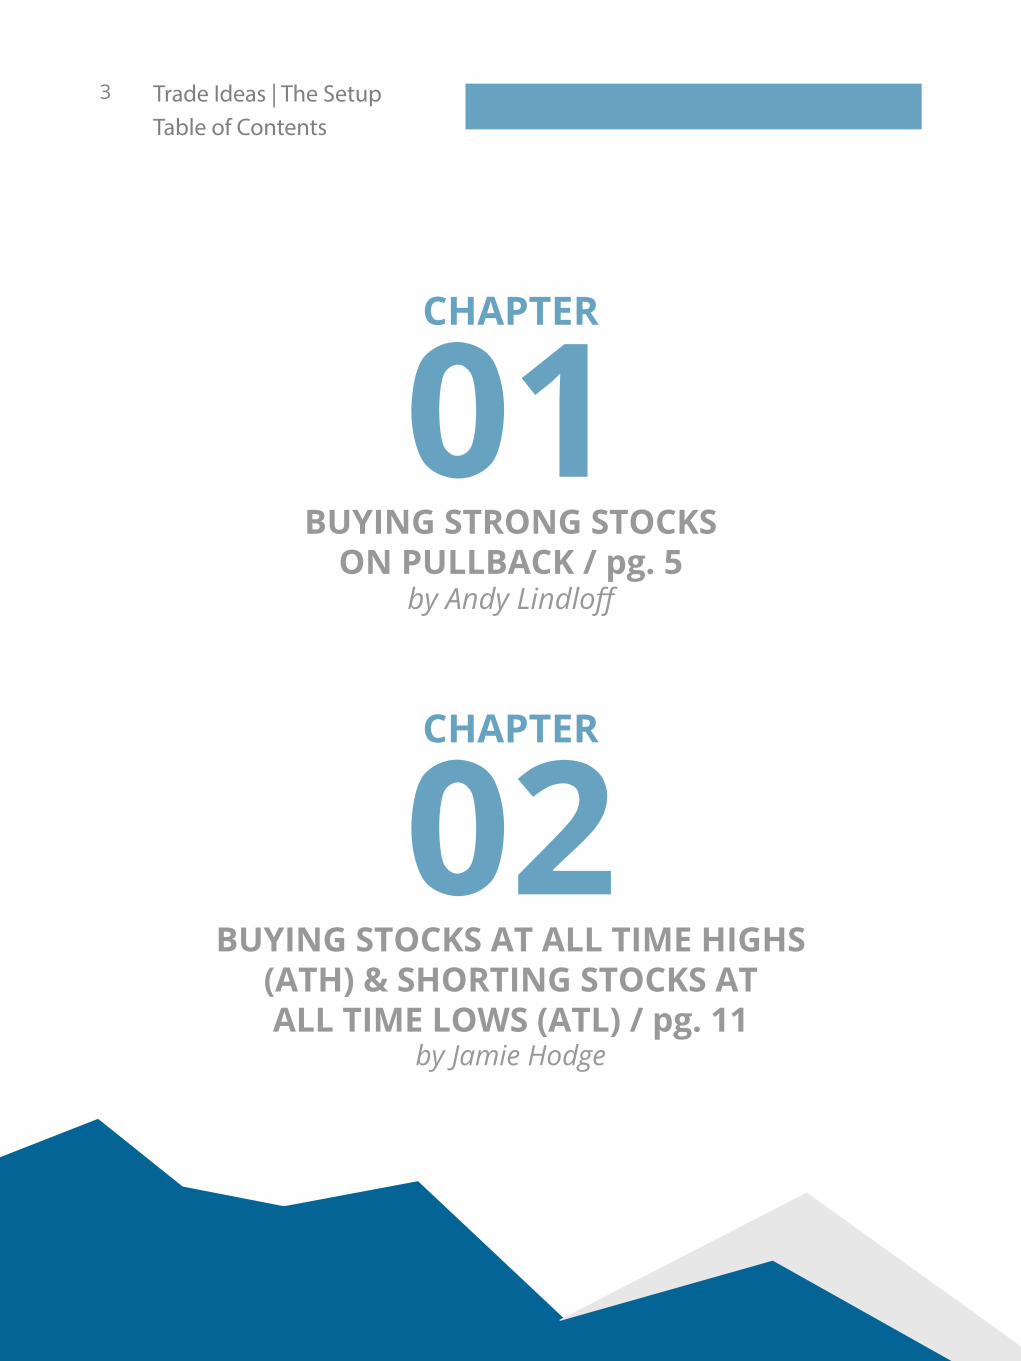
BUYING STRONG STOCKS ON PULLBACK / pg. 5
by Andy Lindloff
BUYING STOCKS AT ALL TIME HIGHS (ATH) & SHORTING STOCKS ATALL TIME LOWS (ATL) / pg. 11
by Jamie Hodge

4 Trade Ideas | The SetupIntroduction
Trading markets is an art not a science. If it was a science everyone
would be following the “rules.” Since trading methods are subjective
in each approach to the market, there really is no one correct way to
approach trading for success. You have to find a niche that works best for
you, your tolerances, strengths and weaknesses. Swing trading is a multi-
day time frame of trading that is becoming more popular as it does not
require constant monitoring of your positions like day trading. People
can afford to work or even have side hustles while still managing a swing
trading account.
For this reason, we have decided to make the concepts of our latest Trade
Ideas eBooks focused on our favorite swing trading setups here at Trade
Ideas. Steve, Andy, Sean, Jamie, Michael and Barrie have each dedicated
a chapter in this series of eBooks to spell out their favorite swing trading
setup and why.
We hope you enjoy this diverse approach to sharing some specific ideas
and methods for swing trading time frames. Some of the chapters will
even include the Trade Ideas scan configuration cloud link for you to
download and use yourself. Enjoy!
INTRODUCTION
5 Trade Ideas | The SetupChapter 01
CHAPTER 01 BUYING STRONGSTOCKS ON PULLBACKcompiled by Andy Lindloff
When it comes to swing trading, I’m not one who likes to chase 52 week
highs, unless it’s a major range break and I’m able to catch it early. I
prefer buying strong stocks on pullbacks after the selling has potentially
subsided. The ideal situation for me is a stock that has recently hit a
6 month to year high, then a pullback on the 5 day time frame, price
is above the 50 day SMA, and then puts out a bullish daily setup bar
(described below). One thing I love about Trade Ideas is if you can imagine
a chart pattern in your head, in most cases you can build a scan to
generate ideas based on the pattern with our “Position in Range” filters.
On the next page (pg. 6) is the configuration of the setup I mentioned
above.
6 Trade Ideas | The SetupChapter 01
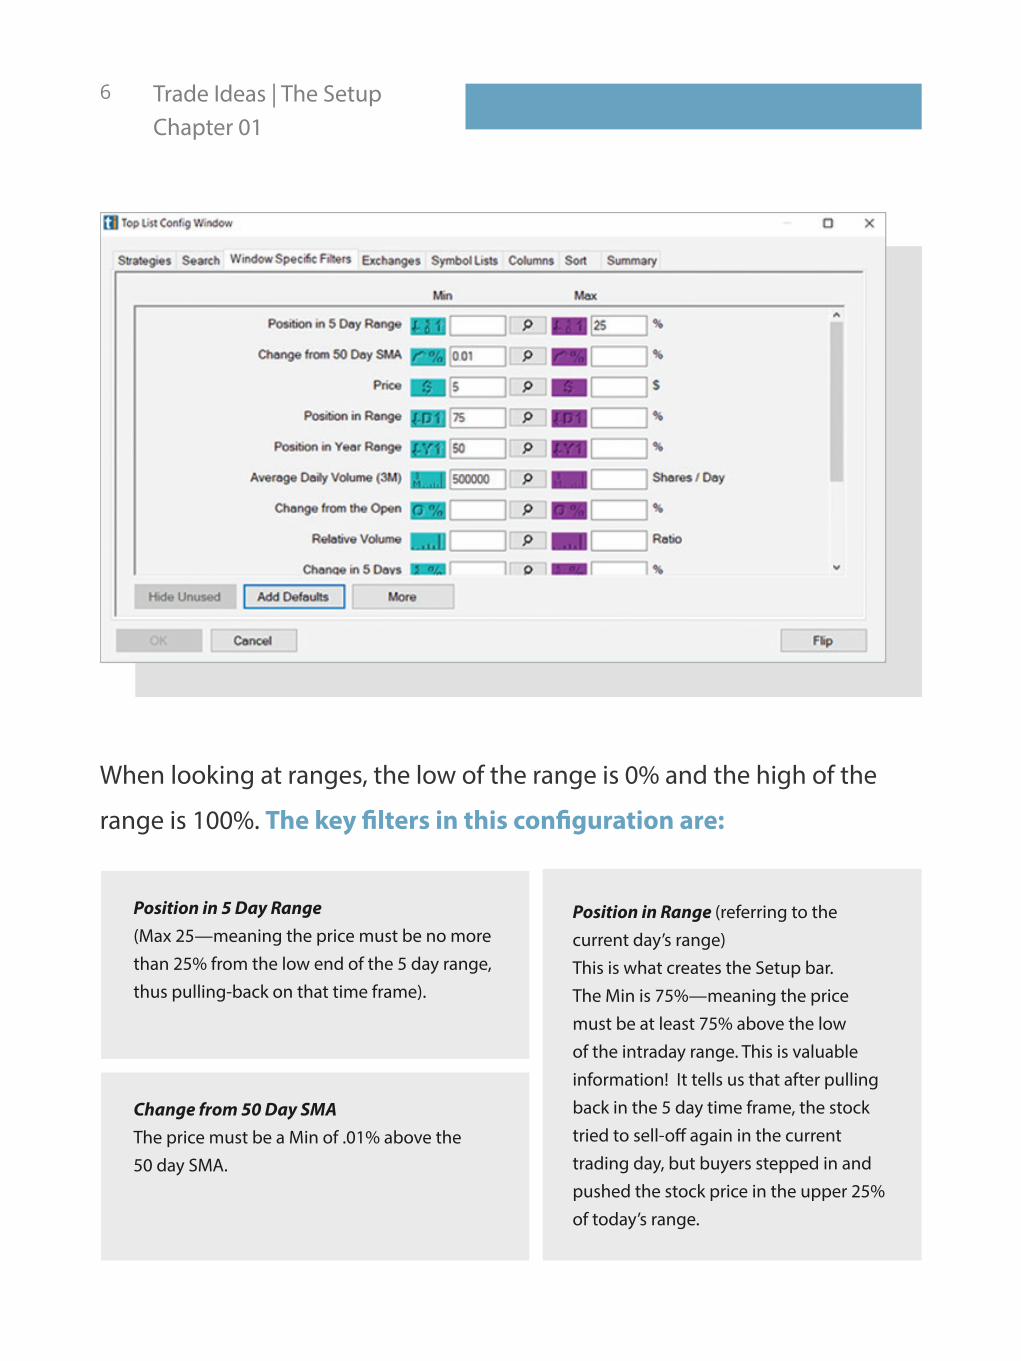
When looking at ranges, the low of the range is 0% and the high of the
range is 100%. The key filters in this configuration are:
Position in 5 Day Range (Max 25—meaning the price must be no more than 25% from the low end of the 5 day range, thus pulling-back on that time frame).
Change from 50 Day SMA The price must be a Min of .01% above the 50 day SMA.
Position in Range (referring to the current day’s range) This is what creates the Setup bar. The Min is 75%—meaning the price must be at least 75% above the low of the intraday range. This is valuable information! It tells us that after pulling back in the 5 day time frame, the stock tried to sell-off again in the current trading day, but buyers stepped in and pushed the stock price in the upper 25% of today’s range.
7 Trade Ideas | The SetupChapter 01
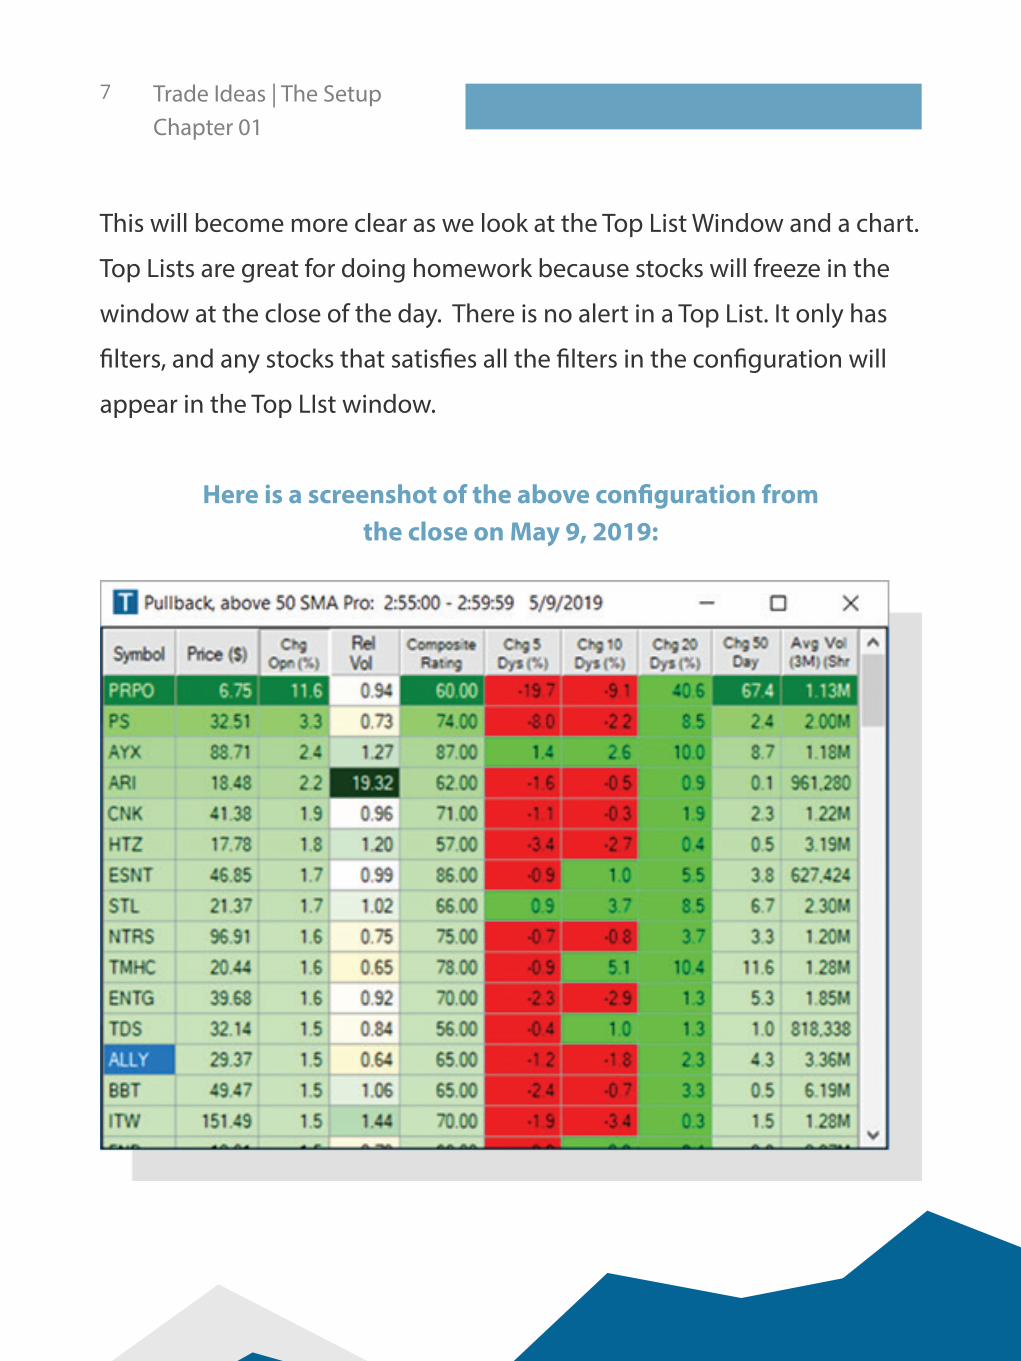
This will become more clear as we look at the Top List Window and a chart.
Top Lists are great for doing homework because stocks will freeze in the
window at the close of the day. There is no alert in a Top List. It only has
filters, and any stocks that satisfies all the filters in the configuration will
appear in the Top LIst window.
Here is a screenshot of the above configuration from the close on May 9, 2019:
8 Trade Ideas | The SetupChapter 01
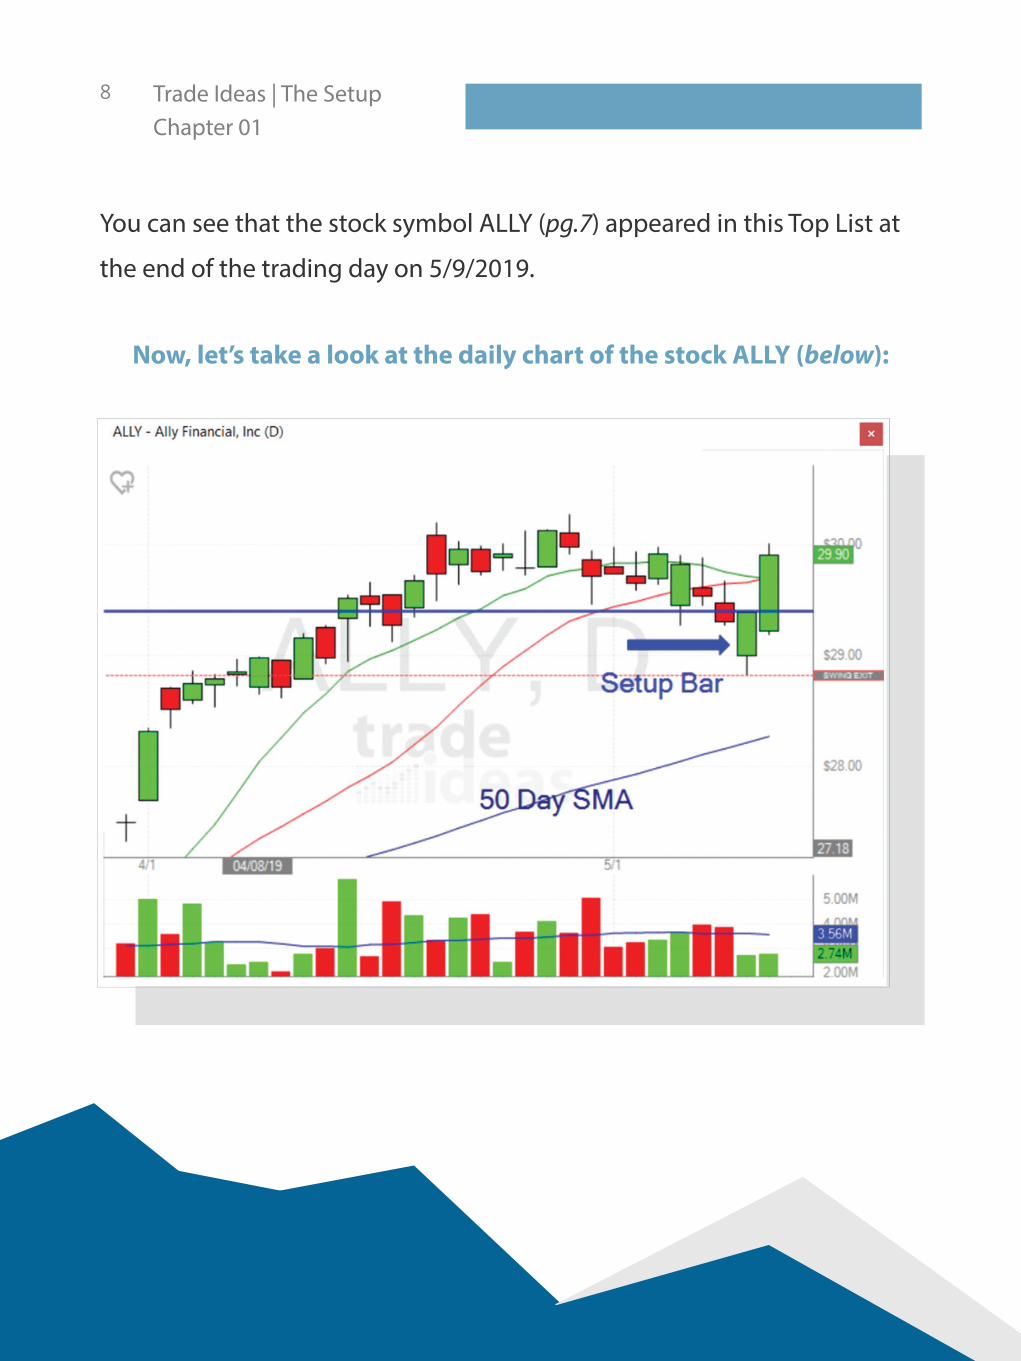
You can see that the stock symbol ALLY (pg.7) appeared in this Top List at
the end of the trading day on 5/9/2019.
Now, let’s take a look at the daily chart of the stock ALLY (below):

9 Trade Ideas | The SetupChapter 01
As you can see from the ALLY chart on the previous page, all of the filters
were satisfied. The price has pulled back and is in the lower 25% of its 5
day range, its above the 50-day SMA, and tried to sell off more on 5/9.
But, buyers came in and pushed it higher to close in the upper 25% of the
intraday range, thus forming the setup bar.
The theory behind this strategy is not to buy it on the day of the setup
bar. Ideally, you would like to see the price action trade above the high
of the setup bar the following day, and that would be the trigger to buy
(although be careful about buying in the first 15 min of trading the next
day). The price has a much better chance of reversing for swing trade
once it trades above the setup bar’s high. The entry is the most important
part of a trade, and this has the potential to be a great entry. Now that
we know we have a good entry, the rest is just managing risk. Every trade
needs to have a stop price and it needs to be defined the moment you
enter the trade. In this strategy, I like to use a print below the low of the
setup bar as the stop. In this example it happens to line up with the “swing
exit” generated by Trade Ideas software. Obviously this is subjective, and
depends on other variables such as trade size, holding time, and
risk tolerance.
10 Trade Ideas | The SetupChapter 01
What I really like about this strategy is that the entry price and stop
price is defined, taking away a lot of the guess work that you will find in
many trading strategies. The way I like to trade this strategy is to do my
homework the night before and place price alerts on the patterns I really
like just above the high of the setup bar. If it triggers the next day, I will
of course always gauge the current market conditions and other variables
that may influence the trade. Also, I will seldom take a trade in the first
15 min to avoid head-fakes. Keep in mind that this is a swing trade, so
paying a little higher price is better than getting whiplashed by early algo
price action.
Whether you’re an experienced trader or new to trading, this is a
swing trading strategy that will allow you to buy strong stocks without
chasing highs. All it takes is a little homework and applying good
risk management rules. Of course, it never hurts to have a great idea
generating software like Trade Ideas to let it do a lot of the work for you.

11 Trade Ideas | The SetupChapter 02
CHAPTER 02 BUYING STOCKS AT ALL TIME HIGHS (ATH)& SHORTING STOCKS ATALL TIME LOWS (ATL)compiled by Jamie Hodge
In our previous book (5 Ways to Win in a Post BTFD Market), I discussed the
Intraday Range Break, otherwise known as an ORB (Opening Range Break).
In this book, we’re going to take it one step further and apply the same
methodology but with a new twist—playing the ORB on stocks that are at
Lifetime Highs or Lifetime lows.
When we trade an ORB for a stock that is “Range Bound” on the daily—not
at all time highs (ATH) or all time lows (ATL)—we typically look to the left
in order to try and determine how much ‘room’ we may have if the stock
moves in our direction. In other words, if we’re long, how much room is
there before the stock hits potential resistance? If we’re short, how much
downside ‘room’ might there be before we encounter potential support?

12 Trade Ideas | The SetupChapter 02
Example of an ORB (range bound on daily) going long in COLD. (Intraday - 15 Minute)
Now the daily chart, looking to the left.

13 Trade Ideas | The SetupChapter 02
Here’s an example of an ORB with a stock at ATH. Notice when we look to
the left (daily -2nd image below), there’s nothing. It’s what I like to refer to
as ‘Blue Sky’ or ‘Out of the Box.’ Because there’s basically nothing as far as
resistance goes, these offer some great swing trade potential.
Intraday ORB Setup
Daily, at ATH

14 Trade Ideas | The SetupChapter 02
So to summarize, if we can make a good entry, based on the intraday ORB
with acceptable risk, and the stock is at ATH—while it’s no guarantee it
may have dramatic upside potential—it’s certainly a positive attribute. You
never know if you’ll get 1-2-3 days or more of run once this happens. Of
course as always, market conditions play a factor. For swing trading you
can always use the Trade Ideas ‘Swing Exit’ which is always visible on the
right margin of every chart. (Note: For Short trades, we simply flip swing
exit and profit target.)
I’ve included intraday risk on the 15 minute chart because some traders
out there will only swing things that they are profitable heading into the
close. Which swing exit you end up selecting may be different depending
on your risk tolerance. I’ll review the 2 different risk options at the end
of the chapter. This methodology also gives us the potential to meld the
two techniques of intraday and swing trading—in essence creating a
hybrid. We key our entry off of the intraday strength, and assuming the
trade remains strong into the close, we’re starting with much greater
momentum entering the swing phase.

15 Trade Ideas | The SetupChapter 02
Now for a Short Example of a stock at ATL.
Intraday Setup
Daily at ATL. “In The Hole“ or “In The Abyss“ No Support
16 Trade Ideas | The SetupChapter 02
Just like the upside version, being short with no apparent support
is a good thing assuming proper risk management and acceptable
risk on the intraday. With some good timing and patience, there are
some trades where you have the potential to be nicely in the money
while the new range materializes. Remember, every trade starts out as a
day trade, whether we swing it or not is based on different factors.

17 Trade Ideas | The SetupChapter 02
Now, for the Alert windows that will help us identify these types of
opportunities. I’ll be including 2 of my favorite windows that I’ve built for
this specific task, Turbo Up and Turbo Down.
CLOUD LINK
CLOUD LINK

18 Trade Ideas | The SetupChapter 02
Q: What’s so special about these two “MultiStrategy” windows?
A: Each window contains 3 different versions of the same strategy. The
different versions are based on market cap. This helps us get ahead on
whether it’s the big caps, mid caps, or small caps presenting the most
action on any given day.
In addition, as these stocks are hitting their respective intraday highs/lows
(because they have to do this if they’re breaking out or down in an ORB)
they must be exhibiting a minimum of 3x normal volume or higher on the
1 minute time frame. Remember, volume is not the Holy Grail, but it can
be The Great Equalizer. More than likely, you will also notice very healthy
‘Relative Volume’ readings accompanying these signals as well.
GREEN BLUE YELLOW
Market Cap of $4 Billion or greater.
Market Cap between
$2-$3.99 Billion
Market Cap of less than $2 Billion
19 Trade Ideas | The SetupChapter 02
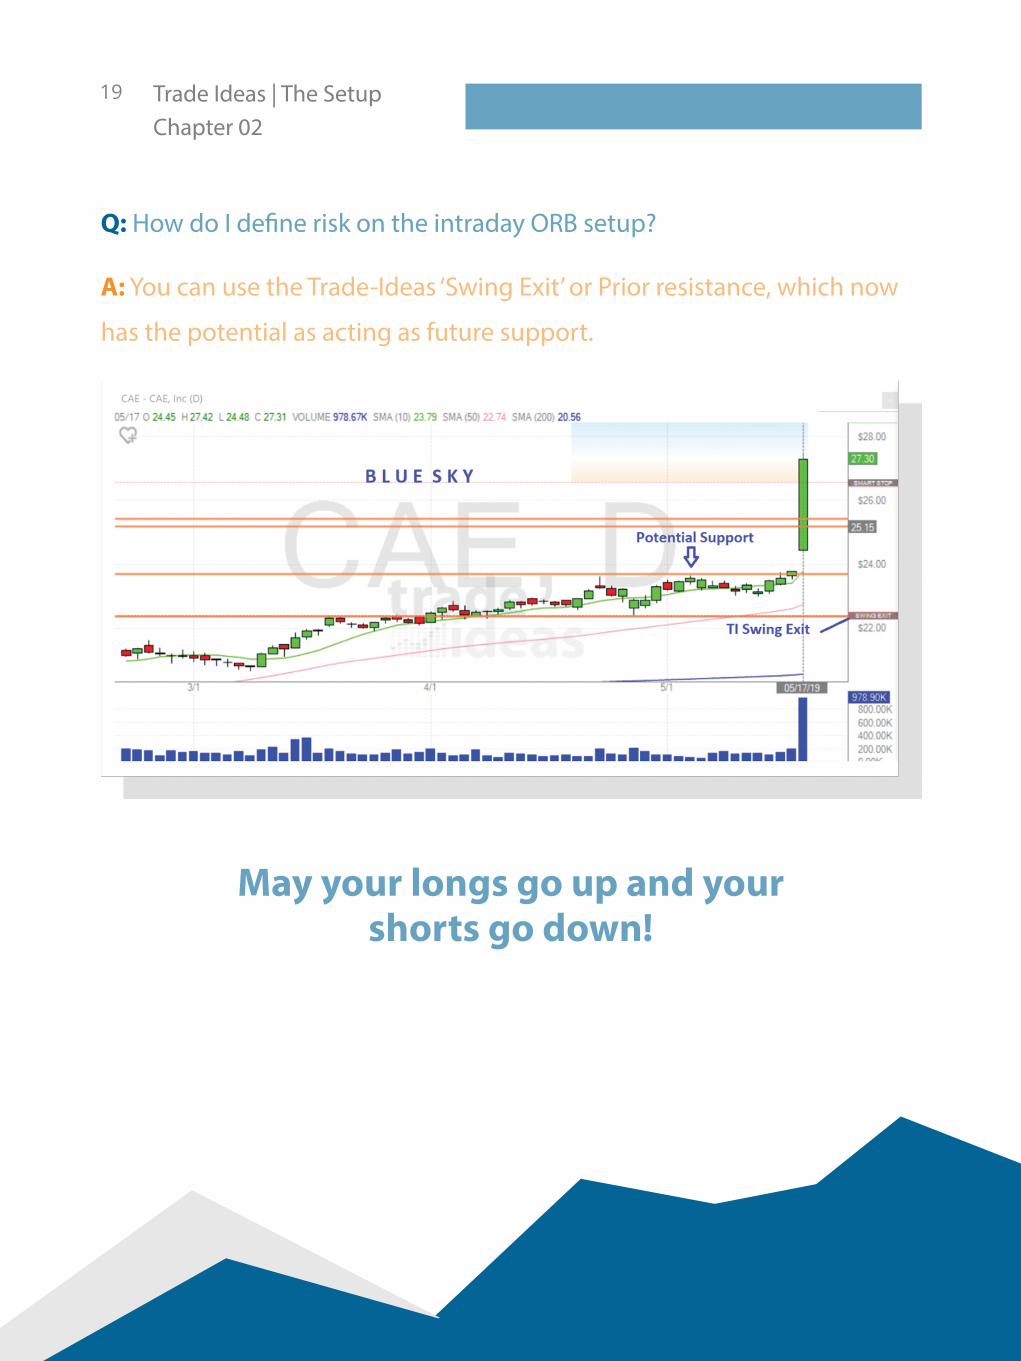
Q: How do I define risk on the intraday ORB setup?
A: You can use the Trade-Ideas ‘Swing Exit’ or Prior resistance, which now
has the potential as acting as future support.
May your longs go up and your shorts go down!