

TABLE OF CONTENTS - Phoenix, Arizona...Awareness Markers (PAMs) on existing catch basins through the...
182
Transcript of TABLE OF CONTENTS - Phoenix, Arizona...Awareness Markers (PAMs) on existing catch basins through the...


Appendix B City of Phoenix MS4 Stormwater Permit
AZPDES Permit No. AZS000003 Page i
TABLE OF CONTENTS
Page
PART 1: GENERAL INFORMATION .................................................................................................. 1
PART 2: ANNUAL REPORT CERTIFICATION .................................................................................. 1
PART 3: NARRATIVE SUMMARY OF STORMWATER MANAGEMENT PROGRAM ACTIVITIES .. 3
PART 4: SUMMARY OF STORMWATER MANAGEMENT PROGRAM ACTIVITIES (NUMERIC) . 21
PART 5: EVALUATION OF THE STORMWATER MANAGEMENT PROGRAM ............................. 25
PART 6: STORMWATER MANAGEMENT PROGRAM MODIFICATIONS ...................................... 27
PART 7: MONITORING LOCATIONS .............................................................................................. 29
AC33 ..................................................................................................................................... 30
IB08 ....................................................................................................................................... 31
SR03 ..................................................................................................................................... 32
SR30 ..................................................................................................................................... 33
SR45 ..................................................................................................................................... 34
SR49 ..................................................................................................................................... 35
SC046 ................................................................................................................................... 36
PART 8: STORM EVENT RECORDS .............................................................................................. 37
PART 9: SUMMARY OF MONITORING DATA (BY LOCATION) ..................................................... 41
PART 10: ASSESSMENT OF MONITORING DATA ........................................................................ 83
PART 11: ESTIMATE OF ANNUAL POLLUTANT LOADINGS ........................................................ 89
PART 12: ANNUAL EXPENDITURES ............................................................................................ 109
PART 13: ATTACHMENTS ............................................................................................................ 111

Appendix B City of Phoenix MS4 Stormwater Permit
AZPDES Permit No. AZS000003 Page ii
LIST OF TABLES
Table 3-1 Stormwater Outreach Activities ................................................................................... 3 Table 3-2 City Owned/Operated Facilities Subject to MSGP .................................................... 11 Table 3-3 Stormwater Management Program Fiscal Expenditures ........................................... 19 Table 8-1 Storm Event Data for Reporting Year 2010-2011...................................................... 39 Table 10-1 Designated Uses for Monitoring Locations ................................................................ 83 Table 10-2 Analytical Results Exceeding SWQS from IB08 Winter 2010/2011 Event ................ 84 Table 11-1 2008-2009 Pollutant Load for Permitted Receiving Waters ....................................... 90 Table 11-2 Pollutant Concentration Factors Used for Each Land-Use Category ........................ 94 Table 11-3 East Fork of Cave Creek Basin Pollutant Loadings ................................................... 96 Table 11-4 Grand Canal Basin Pollutant Loadings ..................................................................... 97 Table 11-5 Indian Bend Wash Basin Pollutant Loadings............................................................. 98 Table 11-6 Old Cross Cut Canal Basin Pollutant Loadings ......................................................... 99 Table 11-7 Arizona Canal Diversion Channel Basin Pollutant Loadings ................................... 100 Table 11-8 Cave Creek Basin Pollutant Loadings ..................................................................... 101 Table 11-9 Skunk Creek Basin Pollutant Loadings ................................................................... 102 Table 11-10 Papago Diversion Channel Basin Pollutant Loadings ............................................. 103 Table 11-11 Salt River Basin Pollutant Loadings ........................................................................ 104 Table 11-12 Scatter Wash Basin Pollutant Loadings .................................................................. 105 Table 11-13 Emile Zola Tributary of IB Pollutant Loadings ......................................................... 106 Table 11-14 Arizona Canal Pollutant Loadings ........................................................................... 107 Table 11-15 Upper Cave Creek Wash Basin Pollutant Loadings ................................................ 108 Table 12-1 Annual Expenditures Stormwater Program Implementation .................................... 109


Appendix B City of Phoenix MS4 Stormwater Permit
AZPDES Permit No. AZS000003 Page 3
PART 3: NARRATIVE SUMMARY OF STORMWATER MANAGEMENT PROGRAM ACTIVITIES
Attach a status summary addressing each of the following in the approximate order referenced below. Briefly describe implementation, progress, and challenges in each area during the reporting year. Also, explain any significant developments or changes to the number or type of activities, frequency or schedule of activities, or the priorities or procedures for specific management practices.
A. Summarize public awareness activities including outreach
Report outreach events, topics, number of people reached, number and type of materials distributed and the Target groups.
Stormwater Outreach The City of Phoenix conducts a variety of stormwater-related public awareness activities. For example, this year the City participated in several public events, including three separate Earth Day celebrations. Staff distributed handouts and encouraged participants to learn about stormwater pollution through a trivia game. Staff presented information on the City‟s stormwater program to several industry groups, including contractors and the Chamber of Commerce.
The City of Phoenix also participates in Stormwater Outreach for Regional Municipalities (STORM) to provide coordinated stormwater outreach throughout the Phoenix metropolitan area. This year STORM ran movie trailers to educate the public on stormwater pollution and conducted a radio campaign on the importance of recycling used oil to prevent stormwater pollution. STORM also conducted a seminar on stormwater construction requirements with the Arizona Chapter of the Associated General Contractors of America. The seminar featured presentations by member municipalities, as well as county and state agency representatives regarding the regulatory requirements.
The following is a summary of the stormwater outreach activities for FY10/11.
Table 3-1 Stormwater Outreach Activities
Date(s) Event / Activity Audience Message Handouts*
November 2010 Movie Trailers (STORM)
Movie Audiences
1,100,000 people (estimate)
General stormwater pollution awareness
Not Applicable
November 16, 2010
Home Builders Association
Home Builders
7 Companies represented
Green Building Code and recent stormwater inspection findings
Not Applicable
December 2010 Radio Ads (STORM) English & Spanish
General Public
3,100,000 people (estimate)
Proper management and disposal of used oil
Not Applicable
December 8, 2010
Arizona Manufacturers Council, Environmental Issues Breakfast
Local Businesses
50 attendees (estimate)
General information on Phoenix Stormwater Management Program
Not Applicable
February 15, 2011
Arizona Chapter of Associated General Contractors
Contractors
12 Companies represented
MS4 permit require-ments and inspection findings
Not Applicable

Appendix B City of Phoenix MS4 Stormwater Permit
AZPDES Permit No. AZS000003 Page 4
Date(s) Event / Activity Audience Message Handouts*
April 2011 PHX11 WaterWorks (also available on the Department‟s web page)
General Public
No information available on number of viewers.
General information on the Phoenix Stormwater Program
Not Applicable
April 20, 2011 Earth Day at Phoenix College
College Students
150 attendees (estimate)
General stormwater pollution awareness
95 Travel Mugs 60 Bookmarks 100 Erasers
April 22, 2011 Earth Day at Cesar Chavez Plaza
General Public
10,000 attendees (estimate)
General stormwater pollution awareness
300 Bookmarks 300 Coloring Books 195 Bags on Board 110 Note Pads 425 Erasers
April 29, 2011 Earth Day at Pioneer Living History Museum
School Children
500 attendees (estimate)
General stormwater pollution awareness
300 Bookmarks 720 Coloring Books 150 Footballs 100 Wristbands
May 22, 2011 Phoenix Today Radio Program (1480 AM) KPHX
General Public
No information available on number of listeners.
General information on the Phoenix Stormwater Program
Not Applicable
May – June, 2011
Water Spot Public Service Announce-ments on PHX11
General Public
No information available on number of viewers.
General stormwater pollution awareness
Not Applicable
June 1, 2011 Associated General Contractors of America (STORM)
General Contractors
80 attendees (estimate)
Stormwater Pollution Prevention Plans; Common Construction General Permit Mistakes; City Code Requirements
40 Note Pads 33 Magnets 12 SWPPP Handbooks 139 Bookmarks
March 2011 – present
Phoenix Water Services Department On-Hold Message
Water Service Department Phone Customers
Stormwater pollution awareness – Oil and Grease
Not Applicable
March 2011 – present
Twitter messages Water Services Twitter recipients (300)
Stormwater pollution awareness – Oil and Grease
Not Applicable
*Note: A goal of the City‟s Sustainability Program is to reduce the volume of paper that is printed and distributed.
B. Summarize public involvement activities including outreach
Identify activities, number of people involved, number and type of materials distributed if applicable.
Household Hazardous Waste Collection The Public Works Department (PWD) provided the public with 10 Household Hazardous Waste (HHW) programs in Fiscal Year 2010/2011. Over 9,400 City of Phoenix residents participated in the HHW events. Close to 132,000 gallons of oil based paint and related materials were collected, along with 63,300 gallons of flammable liquids and over 5,900 gallons of used oil. Other items collected included the following: latex paint, antifreeze, pesticides, herbicides, and other hazardous and toxic materials. Non-hazardous materials brought to HHW events were sorted out and disposed of as Municipal Solid Waste (MSW), such as shampoo, lotions, and quart-sized latex paint.

Appendix B City of Phoenix MS4 Stormwater Permit
AZPDES Permit No. AZS000003 Page 5
Describe MS4 system for public reporting of spills, dumping, discharges, and related stormwater issues.
The City of Phoenix continues to offer a Stormwater Hotline for anyone who wishes to call in a complaint concerning illicit discharges or releases to the storm drain system. The City received over 270 complaints during the year from several sources including the telephone hotline and email.
C. Summarize Illicit Discharge, Detection and Elimination (IDDE) program activities. Include:
Illicit discharge prevention activities.
The City of Phoenix has continued to educate the public about stormwater pollution and discourage discharges to the storm drain system. The City continued to place Pollution Awareness Markers (PAMs) on existing catch basins through the year. This year, more than 1,300 PAMs were added to existing catch basins using a two part epoxy, and more than 12,500 PAMs have been installed since the program started.
The City standard for managing hazardous waste and hazardous materials at municipal facilities is the Hazardous Materials Management Plan (HMMP) Manual (AR 2.314). The manual is available to City employees online through the City‟s intranet. HMMP procedures apply to all City of Phoenix departments unless stated otherwise and were developed to ensure the City operations are in full compliance with federal, state, and local environmental and safety regulations. The HMMP Manual directs personnel to locate storage areas as far away as possible from washes, drains, and drywells and requires that they be protected from weather. This can be accomplished by locating the storage areas indoors or by using an appropriate canopy for outdoor storage. Guidance is provided on secondary containment, security, permitting requirements, required safety and spill response equipment, proper signs, and labeling requirements. Container storage requirements such as aisle spacing, limitations on drum stacking, segregation of incompatible materials, and types and condition of containers are presented.
The HMMP contains a comprehensive stormwater policy, which, for most facilities, serves as the facility stormwater management plan required by City Code. The policy applies to all city facilities with the potential to impact stormwater and addresses permit applicability [including the Multi-Sector General Permit (MSGP) and De Minimis General Permit (DMGP)], training and inspection requirements, and best management practices for solid waste/litter control, parking lots and building washing, scrap metal and equipment, bulk material piles, and maintenance of stormwater management devices.
The HMMP is maintained by the Office of Environmental Programs (OEP) Pollution Prevention (P2) staff. Each HMMP procedure is reviewed at least once every two years and revised as necessary. Revisions may be made more frequently if regulatory requirements change. Individual HMMP procedures are reviewed on a cyclical staggered schedule, rather than all at once. The city personnel with stormwater expertise included in the review process include the Environmental Programs Manager and/or OEP Environmental Quality Specialists, Water Services Stormwater Program Coordinator, and Environmental Coordinators from the major operating departments. Revisions are typically drafted by the OEP P2 staff, evaluated by the Law and Human Resources Departments, and reviewed by city operating departments, with opportunity for comment, prior to implementation.

Appendix B City of Phoenix MS4 Stormwater Permit
AZPDES Permit No. AZS000003 Page 6
Eight of thirteen HMMP procedures were either reviewed or added during FY 2010/11. As a result of the review, two new procedures were added (Hazardous Building Materials, and Spill Prevention Response and Reporting) and two were removed as independent procedures and consolidated into the Container Management Procedure. (Paints and Solvents Procedures are being incorporated into the Container Management Procedure.)
Training dates and topics:
Stormwater training on IDDE is accomplished through training offered by various departments, including Water Services, Public Works, Parks and Recreation, and OEP. Municipal employee stormwater training is coordinated by the OEP P2 Program.
The Phoenix MS4 permit requires IDDE training for two major groups of employees: (1) field staff without direct stormwater program responsibilities; and (2) employees with direct stormwater program responsibilities (Stormwater Field Staff). In addition, the training is divided into three (3) frequencies:
Annual (for select field staff with “no direct stormwater responsibility” only)
New Employee Training (for Stormwater Field Staff – offered twice a year)
Refresher Training (for Stormwater Field Staff – offered every two years)
Other specific training requirements include municipal, industrial, and construction site inspections, hazardous materials handling, spill management, street maintenance and repair and water/sewer maintenance and is limited to employees working in functions with the potential to impact stormwater. Those specific staff are outlined in the stormwater training plan in the city‟s Stormwater Management Plan (SWMP). The training is offered by various departments and is divided into two frequencies:
New Employee Training (conducted twice per year)
Refresher Training (conducted once every two years)
Annual
Stormwater Awareness Training. Awareness Training on IDDE is provided to select field staff with no direct stormwater responsibilities. Topics taken from the City MS4 stormwater permit requirements include identification of harmful/prohibited practices (illegal dumpling or spills) into the City‟s stormwater system and proper management procedures (reporting to the Stormwater Management Program). Thirty-three training sessions were held on the following dates with 583 employees attending:
2010 2011
September 1, 9, 13, 27 January 26 October 1, 7, 25 February 9, 24, 25 November 4 March 1, 2, 8, 9, 18, 21 (2), 24, 25 December 1 April 11 (2), 14, 15, 18, 19, 20 (2), 25 May 4 June 1

Appendix B City of Phoenix MS4 Stormwater Permit
AZPDES Permit No. AZS000003 Page 7
New Employee Training and Biennial Refreshers
IDDE for Stormwater Inspection Staff. Topics covered include federal and local regulatory requirements, (including MS4 permit requirements) pollution prevention policies, Phoenix City code, detecting, investigating, and identifying illicit discharges, De Minimis discharges, and other sources of non-stormwater discharges. Outfall sampling and visual assessment training sessions were conducted during 2010 on July 14, 15, 20, 21, 22, 28, and August 3 for a total of 27 employees. IDDE training for new and existing stormwater inspectors was conducted on May 18, 2011, with a total of 21 personnel trained.
Street Repair and Road Improvement for Street Maintenance Staff. Training is provided to all field staff in the Street Maintenance Division of STR. Training covers IDDE awareness, pollution prevention, and best management practices to minimize discharges to storm drains. Specific topics include BMPs for hazardous material use and storage, street sweeping, painting and striping, sediment pile management, paving, vehicle maintenance and washing, handling spills, solid waste, and concrete washout areas. A total of 369 employees were trained during sessions held on:
2011
April 7, 8, 12, 14, 19, 21, 27, 28, 29 May 4, 11
Spill Prevention and Management Practices. Training covers site specific spill prevention and response procedures/responsibilities and trains spill management practices to prevent or minimize discharges to the storm sewer system and drywells. One thousand one hundred twelve employees were trained during twenty training sessions held on the following dates:
2010 2011
July 27 January 29, 30, 31 October 10 February 1, 2, 3, 4, 5, 7, 10, 11, 13, 26 November 3 March 11, 23 May 5, 19
Hazardous Material Handling. Training covers responsibilities for spill prevention and reporting, compliance with regulatory and City hazardous materials management procedures (proper handling, storage, transportation, and disposal) to prevent contamination of stormwater runoff. Ten training sessions were held on the following dates:
2010 2011
September 29 March 29 October 13, 27 April 4, 8 December 1 May 25 June 1, 9
One hundred twenty-six employees completed this training.
Water/Sewer Maintenance. Training is provided to field staff in Water Distribution and Wastewater Collection and includes protocols to minimize discharges including those found in the Water Services Department (WSD) Stormwater Pollution Prevention Plan, Emergency

Appendix B City of Phoenix MS4 Stormwater Permit
AZPDES Permit No. AZS000003 Page 8
Response Plan and Field Incident Response Plan. Two hundred twenty-six employees completed this training during eighteen training sessions held on the following dates:
2010 2011
September 1, 9, 13, 27 January 26 October 1, 7, 25 February 9 November 4 March 9, 21 December 1 April 11, 20, 25 May 4 June 1
Municipal Stormwater Inspections. Training includes federal and local regulatory requirements (including MS4 permit requirements), stormwater best management practices, municipal facility inspection procedures, illicit discharges and De Minimis discharges, pollution prevention policies and Phoenix City Code Chapter 32C. For this reporting period, there were no new employees in the section nor biennial refresher training required.
Industrial Stormwater Inspections. Training is provided to all inspectors in the WSD Environmental Services Stormwater section. Topics include applicable permits and codes, stormwater pollution prevention policies, structural and non-structural best management practices, and inspection and enforcement procedures. A training session was conducted on June 1, 2011 for 22 new and existing employees.
Construction Sites Plan Review and Inspection Training. Training is provided to Planning and Development Department, OEP, and other construction site inspection staff. Topics include grading and drainage design and review practices, and City Code as it relates to stormwater management (32A and 32C). Training also includes an overview of the Arizona Pollutant Discharge Elimination System (AZPDES) Construction General Permit requirements, construction site best management practices for sediment and erosion control, inspection procedures and enforcement procedures. Sessions were held on October 15, 2010 and May 18 and 25, 2011 with 59 staff trained.
IDDE screening program and investigations – including an overview of industrial facility inspections, identified sources, and any significant corrective or enforcement actions.
In FY10/11, the City began revising the Stormwater Policy and Procedures Manual dealing with IDDE. The Field Sampling Chapter (Chapter 2) is being revised to clarify when a dry-weather flow is considered „significantly polluted‟ and the IDDE Chapter (Chapter 7) is being revised to clarify priorities and procedures for tracking illicit flows. It is expected that the revisions will be finalized and implemented in Fall 2011, and will be included with the next Annual Report.
The IDDE program continues to track illicit flows discovered in the storm drain system to identify their sources. Dry-weather flows are investigated by opening manholes and following the flow upstream. Flow changes (typically volume) are observed by the IDDE crew when the manholes are opened. Once the suspected illicit tap is determined to be nearby, the video system is then inserted in the storm drain pipe to track the flow directly to its source. By using the video system the City can then determine where the illicit connection or tap is located and then conduct the appropriate inspection.

Appendix B City of Phoenix MS4 Stormwater Permit
AZPDES Permit No. AZS000003 Page 9
This Fiscal Year, the IDDE crew identified several sources of non-stormwater discharges to the storm drain system. Flows from SR027 and SR028 were found to be originating from a leaking fire hydrant. The fire hydrant was replaced, and the flow was eliminated. Flow from OC008 was found to be originating from a leaking water main in the area of 52nd Street and McDowell Road. The water main was repaired, and the flow was eliminated. Flows from SR32 and SR35 were found to originate from Salt River Project (SRP) irrigation in the areas of Broadway Road and Roeser Road, respectively. The water was not considered „significantly polluted‟ and irrigation water is an allowable non-stormwater discharge under City Code. Dry-weather flow was observed at SR011 at Central Avenue and the Salt River and tracked to the Arizona Department of Transportation (ADOT) canal. This IDDE investigation was referred to to ADOT, though the City will work closely with ADOT, when needed.
In June, the City hired a consultant to assist with two specific IDDE investigations, where City staff had been unable to determine the source(s) of dry-weather flow. The consultant‟s work is ongoing, and their findings will be included in the next Annual Report.
During the reporting period, the Stormwater Management Section responded to over 270 complaints of illicit discharge. Most complaints involved the discharge of pool water into the street. Each complaint investigation includes the dissemination of information related to stormwater pollution prevention.
Industrial facility inspections are discussed in Section E.
D. Municipal Facilities
Status of identification and inventory of these facilities.
The Municipal Facility Inventory was generated from the Environmental Data Management System (EDMS), which is the City‟s web-based chemical inventory management system. Initiated in 1997, the EDMS includes all facilities owned and operated by City staff that store or use hazardous chemicals and is used to track chemicals stored onsite at each municipal facility. It is accessible at every computer work station through the City‟s intranet. There were 337 municipal facilities on the inventory as of July 1, 2011. Over the course of 2010/11, the municipal facility inventory was revised and has slightly fewer facilities than in the previous year. Revisions were based upon facility openings, closures/consolidations, operational changes resulting in fewer chemicals onsite (<5 gallon containers), deletions of facilities not within Phoenix jurisdictional limits, and where total facility operations at municipal facilities have been assumed by independent contractors. Such contractor-operated facilities were moved from the municipal facility inventory to the industrial facility inventory.
Information maintained in the inventory includes: address, latitude and longitude, chemicals stored or used and their material safety data sheets, operational status (operational or closed), Standard Industrial Classification (SIC) codes, date of last assessment, brief description of operations, facility contact, as well as other compliance-related information. Compilation of the latitude and longitude data was completed in December, 2010. The number of facilities may change based on new facilities becoming operational or existing facilities undergoing a change/cessation of operations. Such changes to the Municipal Facility Inventory are tracked through EDMS and through OEP surveys of the operating departments for information on facility openings, closures, or operational changes.

Appendix B City of Phoenix MS4 Stormwater Permit
AZPDES Permit No. AZS000003 Page 10
High-Risk Facilities Identification and Prioritization The high-risk facility identification and prioritization was finalized on June 30, 2011. There are 54 municipal facilities which met the criteria for placement on this inventory. The high risk identification process considered each of the following: 1) quantity of chemicals stored onsite (based on Tier II Reports), 2) potential for exposure of such chemicals to stormwater based on storage location, 3) likelihood of a spill or release to occur and discharge offsite based on structural BMPs and site drainage characteristics, 4) potential severity of impact on surface waters for a worst-case scenario release, and 5) MSGP coverage. Quantity, MSGP, and exposure criteria were based on a yes/no response and likelihood of a release to reach MS4 and severity of impact were each rated on a scale of 0-4. The ranking criteria were used to evaluate all city facilities that had submitted Tier II Reports in 2010. Facilities that have MSGP-2010 coverage were ranked lower in risk with respect to the MS4 permit, since these facilities have their own comprehensive stormwater pollution prevention plans and inspection programs.
The prioritization of the high-risk facilities, relative to one another, is based upon the cumulative sum of numeric risk ratings and yes/no (0/1) responses for each facility and ranged from 4-8 out of a possible score of 0-11, with 11 being the highest risk. Each municipal high-risk facility shall undergo an additional stormwater site inspection between now and the end of the permit term. The current OEP Environmental Facility Assessment inspection checklist already includes a section on stormwater BMPs and the facility‟s Stormwater Management Plan, so this checklist is used to meet the Facility Assessment Measurable Goal at Appendix A Section III.B.(1) and the Municipal Facility Inspection Measurable Goal at Appendix A Section IV.C.(2).
Overview of inspection findings (i.e., number inspected, number with follow-up actions needed, significant findings).
The OEP P2 Section conducts Environmental Facility Assessments (EFAs) of City owned and operated facilities to acquire a baseline of information, ensure compliance with select environmental and safety requirements (which includes ensuring effective spill response and hazardous material handling procedures are in place), and identify opportunities to reduce hazardous material use and hazardous waste generation. The EFAs are part of a joint agreement with the Fire, Human Resources, and WSD for a more comprehensive approach to hazardous materials and stormwater compliance.
One hundred twenty-three EFAs were completed at facilities on the Municipal Facility Inventory this fiscal year. Fifty-four facilities had recommended follow-up action items, summarized in the following section. No significant findings were reported.
Activities needed and performed in response to inspections (Environmental Facility Assessments).
The OEP P2 Section records and tracks all activities needed as a result of an EFA until resolution, or closure. Upon an inspection, the facility contact and/or Department Director is provided a memo with the inspection results. Findings (corrective actions needed) are identified in an Action Plan that is attached to the memo. In addition, facility status updates identifying any uncorrected findings are provided to Department Directors every 6 months. Each memo also includes recommended training for facility staff based on their function. Below summarizes the categories of activities performed during the 2010/2011 assessment cycle.

Appendix B City of Phoenix MS4 Stormwater Permit
AZPDES Permit No. AZS000003 Page 11
2010/2011 BMPs Implemented
Spill Response BMPs: provided additional spill response equipment, required posting of emergency response procedures and contacts at facilities.
Structural BMPs (to minimize exposure to stormwater and prevent spills): Provided weather protection & provided and/or repaired secondary containments.
Improved chemical reporting (updated EDMS chemical inventories, ensured Tier II reporting).
Non-structural container management BMPs: ensured practices such as proper closure and labeling of containers, proper management of Universal Waste lamps and batteries.
Identification and tracking of municipal owned and operated facilities subject to permitting under the MSGP.
Below is a listing of the eleven (11) City owned and operated facilities subject to permitting under the MSGP, based on their industry sector and/or SIC code. A No Exposure Certification was submitted for the City Clerk Customer Services facility in July 2010. The other 10 facilities all submitted NOIs prior to May 31, 2011 for coverage under the new AZPDES MSGP-2010. Where those authorization numbers have been received from the Agency at the time of this report, they have been included in the table below. Finally, site inspections were conducted and “Sector L Closure Certifications” submitted to the Arizona Department of Environmental Quality (ADEQ) Water Quality Division for 15 city properties located on closed landfill sites determined to be exempt from MSGP-2010 coverage.
Table 3-2 City Owned/Operated Facilities Subject to MSGP
Department Facility Address POC Authorization
# Comments
Public Works Skunk Creek Landfill 3165 W Happy Valley Rd Phoenix, AZ 85027
Civil Eng II Joy Bell 602-256-5605
AZMSG-61708
27th Avenue Solid Waste Management Facility
3060 S 27th Ave Phoenix, AZ 85009
AZMSG-62581
SR 85 28361 W Patterson Rd Buckeye, AZ 85326
AZMSG-14391
North Gateway Transfer Station
30205 N. Black Canyon Hwy, Phoenix, AZ 85085
AZMSG-61710
Aviation Sky Harbor International Airport
3400 E Sky Harbor Blvd, Ste 3300 Phoenix, AZ 85034
Environmental Qual Spec Lisa Farinas 602-273-2787
Not yet received NOI Submitted
Deer Valley Airport 702 W Deer Valley Rd Phoenix, AZ 85027
Not yet received NOI Submitted
Phoenix/Goodyear Airport
1658 S Litchfield Rd Goodyear, AZ 85338
AZMSG-61934
Water Services 91st Avenue Wastewater Treatment Plant
5616 S 91st Ave Tolleson, AZ 85353
Environmental Qual Spec Doug Taylor 602-534-5081
AZMSG-61871
23rd Avenue Waste-water Treatment Plant
2470 S 22nd Ave Phoenix, AZ 85009
AZMSG-61896
Cave Creek Water Reclamation Plant
22841 N Cave Creek Rd Phoenix, AZ 85024
AZMSG-61713
City Clerk Customer Service Center (Print Shop)
2640 S 22nd Ave Phoenix, AZ
Environmental Qual Specialist Monica Rabb 602-256-3447
No Exposure Certification July 2010

Appendix B City of Phoenix MS4 Stormwater Permit
AZPDES Permit No. AZS000003 Page 12
Status of all inventories, maps, and map studies required by the permit to be developed including completion dates.
Two new Geographic Information System (GIS) Technician positions have been filled and a vendor has been hired to develop an updated GIS database and data input application. The record drawings for the data conversion project have been collected and the data conversion project will commence upon final acceptance of the database and application. A consultant has also been hired to complete the stormwater GIS feature feasibility study. The estimated completion date is September 30, 2013.
In addition to the GIS, various databases are maintained to track and update permit-required inventories. The WSD maintains a stormwater database to track complaints, outfalls, industrial facilities, and enforcement actions. OEP maintains the municipal facility inventory. PDD maintains the construction inventory.
For the Outfall inspection program, describe the status of:
o Staff training
Outfall inspection training is described in Section H.
o Outfall inventory
The outfall inventory is described in Section H.
o Inspection tracking system
The outfall inspection tracking system is described in Section H.
o Overview of Inspection and screening procedures, and any significant findings
Inspection and screening procedures and findings are discussed in Section H.
E. Industrial Facilities
Status of identification and inventory of these facilities.
The City purchases an inventory of industrial facilities from InfoUSA, a database marketing firm. The data indicate that the City of Phoenix currently has over 3,000 industrial facilities. The City also included information on select commercial facilities such as restaurants, garages, and gasoline stations in the inventory. With the addtion of these commercial businesses, the current database contains more than 8,000 facilities.
The City uses GIS to plot industrial facilities within the city limits. This information was used to prioritize industrial inspections within a ¼ mile radius of the impaired section of the Salt River. The information will also be used to coordinate industrial inspections in other key geograhic areas.
Because lead and copper have been identified in wet-weather samples in quantities exceeding surface water quality standards, facilities that use or store lead or copper have been identified for priority inspections.
In addition to the industrial inspections, the City has incorporated a stormwater assessment into many of the inspections conducted by the Commercial Inspection Section. Stormwater

Appendix B City of Phoenix MS4 Stormwater Permit
AZPDES Permit No. AZS000003 Page 13
assessments are conducted at commerical businesses including restaurants, car washes, and service stations. When significant stormwater issues are noted, the Inspector forwards the information to the Stormwater Section for follow-up.
An overview of inspection findings and note significant findings.
The City has filled seven newly created Water Quality Inspector positions. The additional staff have made tremendous progress in increasing industrial inspections and enforcement. In FY10/11, the City conducted 393 industrial and commercial inspections and issued 210 enforcement letters.
The most common violation identified continues to be a failure to develop a Stormwater Management Plan (SWMP) or Stormwater Pollution Prevention Plan (SWPPP), as requried by City code. For those facilities that have the potential to release pollutants to the MS4, the City ordinance requires that each facility develop and implement a SWMP, containing facility-specific BMPs.
Significant findings included a scrap yard that had wash water running off onto a neighboring property. The Inspector worked with the property owner, who made modifications to his operations and site grading to eliminate the runoff. Another significant finding involved a sham roofing material recycler. Two stormwater inspectors worked with staff from the Fire Department and Neighborhood Services Department as well as the property owner to ensure the proper removal of a significant volume of roofing materials that had been abandoned on the property.
An additional 120 stormwater inspections were conducted by the Commercial Section. Where stormwater issues were significant, the commercial inspector referred the facility to the Stormwater Section for follow-up. Most stormwater issues noted during commercial inspections involved housekeeping related issues that were easily addressed (e.g., spills around tallow bins and open dumpsters).
Corrective and enforcement actions needed and taken in response to inspections.
The 210 formal enforcement actions ranged from inspection notices and SWMP revision requests through Notices of Concern (NOC) and Notices of Violation (NOV). Most enforcement actions were resolved quickly, with 86 percent of all industrial inpsections closed within one year of the initial inspection.
F. Construction Program Activities
The City of Phoenix Storm Drain Design Manual requires retention areas for buildings to account for drainage collected from the roof tops, parking lots, and other drainage areas. When the PDD reviews grading plans, staff ensure that the site retention volume is adequate to prevent runoff for the required storm event. If inspectors find that the plans are not being followed, they may stop work on the project. If the problem continues, court-ordered injunctions may be served or civil penalties assessed.
Chapter 32A, the City‟s Grading and Drainage Ordinance, establishes minimum requirements for regulating grading and drainage and establishes implementation and enforcement procedures. Grading and Drainage Permits are issued to applicants who fulfill the application requirements, including the submittal of a Stormwater Management Plan when applicable. Activities regulated by the Grading and Drainage Ordinance are subject to

Appendix B City of Phoenix MS4 Stormwater Permit
AZPDES Permit No. AZS000003 Page 14
inspection and enforcement action. Enforcement steps begin with a verbal warning, and may lead to a written warning, halting project inspections on the building, and/or a civil citation. The PDD Civil and Site Inspection team includes 12 members tasked with enforcing the ordinance.
Staff from PDD hold pre-construction meetings with private developers to discuss many issues, including on-site retention of stormwater, controlling erosion, and the installation of other BMPs. Communications with developers occur during periodic observations by inspection staff and during formal inspections.
An overview of the PDD process for stormwater related submittals is provided below:
The customer submits grading/drainage and stormwater plans for review
PDD provides red lines on plans
The customer address the red lines
Plans are approved for construction by PDD
The customer applies for required permits
Permits are created by PDD, including Civil Grading & Drainage and Civil Stormwater
PDD office staff obtain a copy of the AZPDES Construction General Permit authorization number before the customer can purchase permits
The customer schedules a Pre-Construction Meeting prior to beginning work
BMPs are implemented by the customer prior to the start of construction
Inspector verifies that track out and BMPs are properly maintained during each inspection
The customer submits an NOT (Notice of Termination) when the project is completed
Warranty inspection is performed by PDD, one-year after completion.
Status of inventory/plan review of these facilities.
The PDD database contains a comprehensive inventory of developments for which permits have been issued, plans have been reviewed, and inspections have been conducted. The permits are categorized in the database according to the type of work requested to be performed. For example, the database lists 109 Stormwater Management Civil Permits and 185 Grading/Drainage Civil Permits for Fiscal Year 2010/2011. In the reporting year, 95 Construction/Grading Plans were reviewed.
An overview of Inspection findings and significant findings.
Inspection findings are documented in the PDD database. During Fiscal Year 2010/2011, a total of 322 construction sites were inspected. There were 19 documented deficiencies where corrective action was requested. Three projects had multiple occurrences that required follow-up. There were two state projects, one federal project, one municipal project,

Appendix B City of Phoenix MS4 Stormwater Permit
AZPDES Permit No. AZS000003 Page 15
and 15 private developer projects that required corrective action. The nature of the violations, in order of frequency, was:
o Deficient track out o BMPs not installed (or not per plan) o Deficient paperwork o Holding retention water for longer than 36 hours, and o Storm wash out.
In addition to the private construction projects, 26 municipal construction projects were inspected for adequate stormwater best management practices and compliance with the local stormwater ordinance. There were seven documented deficiencies, including chemical storage issues, (housekeeping/secondary containment), sediment controls improperly installed or in need of repair (silt fence, straw wattles), and missing sediment controls around perimeter of material stockpiles not actively being worked.
Corrective and enforcement actions needed and taken in response to inspections.
Most documented deficiencies, as discussed above, were corrected by the next day. No escalated enforcement was required to bring the project into compliance (i.e., suspension of work), and most violations were corrected upon first request.
PDD requires that the developer provide a “letter of explanation” when they cannot obtain a Notice of Termination (NOT) at the end of the project. These are forwarded to ADEQ twice a year. PDD provided project names and locations, along with contact information for the owner/developer contractor for four projects in Fiscal Year 2010/2011.
Staff Training: The PDD Municipal Stormwater Inspection Training for Construction Inspectors trains plan review and inspection staff on administrative procedures (NOI, SWPPP) compliance and appropriate BMPs to reduce pollution from construction activities.
Training sessions covering construction site stormwater requirements and inspections were conducted by an independent stormwater consulting firm on October 15, 2010, May 18, 2011, and May 25, 2011. The course included both classroom and field site activities, and topics covered included the MS4 permit and local ordinance requirements for construction, the Construction General Permit requirements, construction site stormwater erosion and sediment control BMPs, and a sample inspection at an active construction site. The first course was attended by inspectors and other staff from PDD, OEP, Aviation, WSD Stormwater section, and Street Transportation Department (STR). The May 2011 sessions were attended by STR inspectors and project managers only. The course sessions served to meet both new employee and refresher training requirements. Not all of the session attendees were required to complete this training per the city Stormwater Training Plan.
G. Post Construction Controls
Summary of any new post-construction controls for municipal projects.
The City requires that stormwater retention areas be sized to contain the volume of water required by the latest (April 2011) edition of the Storm Water Policies and Standards Manual. Currently, the standard requires retention of the 100-year, 2-hour duration storm, except in those areas exempted by law or excluded in a technical appeals process.

Appendix B City of Phoenix MS4 Stormwater Permit
AZPDES Permit No. AZS000003 Page 16
The Phoenix City Council adopted “Green Building” Guidelines to design and build all new bond-funded municipal buildings to the U.S. Green Building Council‟s Leadership in Energy and Environmental Design (LEED) Certified standard in 2005.
In FY10/11, the City completed the final stage of the Taylor Mall project, a pedestrian area which is located on Taylor Street between Central Avenue and 3rd Street. Low Impact Development practices were used to increase retention and minimize stormwater runoff. For example, curb cuts were utilized to allow stormwater from the street to drain into the right-of-way retention areas between the sidewalk and the curb and on-street parking spaces where paved with permeable pavers. Permeable pavers will be incorporated into the sidewalk in the upcoming pedestrian enhancements along 1st Street, from McKinley Street to Filmore Street and permeable recycled-glass paving will be added bus stops along 11th Street between Moreland and Washington Streets.
An overview of the City’s post-construction inspection program.
PDD inspectors conduct a one-year warranty inspection on each construction project within their jurisdiction. This inspection provides an opportunity to identify corrective action to be implemented by the developer or responsible sub-contractor for a variety of items, including stormwater and grading and drainage controls.
OEP conducts post-construction inspections for municipal projects within one year of the project completion.
During FY 10/11, post-construction stormwater inspections were conducted at 126 private construction projects and 23 municipal construction projects.
Corrective and enforcement actions needed and taken in response to post-construction inspections.
The PDD database contains directives for items identified for follow-up during the warranty inspection. No corrective or enforcement actions were initiated as a result of a post-construction warranty inspection.
There was one instance on a municipal project where a drainage channel lined with rock, designed to control site erosion, had failed after a heavy rain event. The feature was corrected under warranty by the city‟s contractor.
Summary of any new or revised post-construction requirements related to permits the City issues.
No new or revised post-construction requirements were identified by PDD personnel.
H. Outfall inspection program; describe the status of
Staff training.
Stormwater staff members are trained on sampling procedures and techniques during the first year of their employment with the City. As part of this, they are required to familiarize themselves with the applicable federal regulations at 40 CFR 122 and 40 CFR 136 and the section in the Stormwater Management Program Policy and Procedures Manual concerning

Appendix B City of Phoenix MS4 Stormwater Permit
AZPDES Permit No. AZS000003 Page 17
sampling and QA/QC. Refresher training is provided informally throughout the year and formally at least every two years.
Outfall sampling and visual assessment training sessions were conducted during 2010 on July 14, 15, 20, 21, 22, 28, and August 3 for a total of 27 employees, and on May 18, 2011 for 21 new employees.
Outfall inventory.
The City maintains a database to document stormwater outfalls. The inventory includes approximately 765 total outfalls this fiscal year with 488 of these designated as “Major” outfalls according to EPA guidelines. Thirty-nine outfalls are designated as “priority”, either due to observed flow within the past five years, or because they discharge to the impaired segment of the Salt River. The outfall inventory is included as an attachment to this report.
Inspection tracking system.
Each outfall inspection is conducted by a trained team of inspectors who use a form specifically designed to capture the data as they are observed. Once the inspection is completed and the inspectors return to the office, all data are entered into a database created exclusively for the stormwater program. Entered data include the documentation and tracking of all (both major and minor) outfall inspections. All items required in 40 CFR 122 are found on the form including both visual and field screening activities.
Inspection and screening procedures and significant findings.
The inspection crew visits each “priority” outfall annually and the remaining major outfalls at least once during the five-year permit cycle. The inspection begins with an overall visual observation of the outfall structure and surrounding area. Visual items are noted such as residue, staining, dead animals, and differences in plant life near the outfall. If a flow (greater than 0.03 gpm) is observed, a sample is collected for the field screening activity. Field screening includes pH, temperature, total chlorine, sulfide, ammonia, phenol, detergent, lead, and copper. All observations are recorded on a standard inspection checklist.
As discussed in Section E, the field sampling procedure is being modified and simplified. The revised procedure will rely more heavily on field screening to determine whether dry-weather discharges are „significantly polluted‟. The revised procedure will be finalized and implemented in FY11/12. Details will be included in the next Annual Report.
I. Description of any new or revised ordinances, rules or policies related to stormwater management or control, if applicable.
Staff from WSD, STR, and PDD worked with the Law Department to revise City Code Chapter 32 (Subdivisions), 32A (Grading and Drainage), 32B (Floodplains), and 32C (Stormwater Quality Protection). The proposed revisions were presented to the Ordinance Review Committee in April, and are expected to go before Council in FY11/12. Copies of the revised City Code will be included in the next Annual Report.

Appendix B City of Phoenix MS4 Stormwater Permit
AZPDES Permit No. AZS000003 Page 18
In FY10/11, the Stormwater Section began revising the Stormwater Policy and Procedure Manual to clarify and simplify field screening and IDDE procedures. These revisions will be finalized and implemented next Fiscal Year.
The Stormwater Section finalized a Quality Assurance Project Plan (QAPP) for stormwater field activities and the document is available for review.
J. Fiscal Expenditures; provide a brief report on expenditures related to implementation of the City’s stormwater program for the previous fiscal year.
The City collects a stormwater fee to defray the costs of operating the stormwater management program. In April 2010, City Council approved an increase to the stormwater fee, effective July 1, 2010. Several organizational changes were also made to the program.
Stormwater program charges from STR, WSD, and OEP are paid out of the stormwater Fund. The fee does not cover the costs for most maintenance of the drainage system or infrastructure improvements, nor does it cover ancillary stormwater activities, such as street sweeping or the HHW program. Stormwater program costs for PDD are funded by construction permit fees.
Water Services Department WSD coordinates the City‟s Stormwater Program. In addition to overall program administration, WSD conducts stormwater outreach, complaint investigations, outfall inspections and IDDE investigations, industrial inspections, wet-weather monitoring, and reporting.
WSD filled seven newly created Water Quality Inspector positions in FY10/11. In addition to the new staff, the Stormwater Section acquired several used vehicles from other WSD divisions. The budget for the Section was over $1,400,000 in FY10/11.
Street Transportation Department STR conducts storm drain maintenance and inspections, wash maintenance, and is responsible for the stormwater GIS. The stormwater budget for STR was over $1,300,000 in FY10/11.
Office of Environmental Programs OEP conducts municipal facility assessments and oversees the stormwater training plan. OEP also advises city departments on regulatory compliance issues. In FY 2010/11, OEP assumed the responsibility of conducting stormwater inspections for those municipal construction and post-construction projects which did not go through the PDD permit process. The stormwater budget for OEP was approximately $150,000 in FY10/11.
Planning and Development Services Department PDD conducts grading and drainage plan reviews and inspections. PDD costs are covered by construction permit fees, and their budget may vary significantly depending on the number of permitted construction projects.

Appendix B City of Phoenix MS4 Stormwater Permit
AZPDES Permit No. AZS000003 Page 19
Table 3-3 Stormwater Management Program Fiscal Expenditures
City of Phoenix Department Fiscal Year 2010/2011
Actual Fiscal Year 2011/2012
Projected
Water Services Department
Stormwater Program Support $1,438,427 $1,711,086
Street Transportation Department
Wash Maintenance $1,001,690 $1,169,513
Geographic Information System $389,549 $1,861,970
Planning and Development Department
Grading and Drainage – Plan Review $213,705 $215,000
Grading & Drainage – Inspections $193,726 $195,000
Office of Environmental Programs
Stormwater Program Support $150,348 $109,330


Appendix B City of Phoenix MS4 Stormwater Permit
AZPDES Permit No. AZS000003 Page 21
PART 4: SUMMARY OF STORMWATER MANAGEMENT PROGRAM ACTIVITIES (NUMERIC)
Provide a summary of stormwater management practices and activities performed each year as indicated in the Table below.
ANNUAL REPORTING YEAR (July 1- June 30)
STORMWATER MANAGEMENT PRACTICE OR ACTIVITY
2008-2009 2009-2010 2010-2011 2011-2012 2012-2013 2013-2014
Illicit Discharge Detection & Elimination Program
1. Municipal Employee Training
Number of training sessions (on non-stormwater discharges and the IDDE program)
2 55 41
Number of employees attending training 385 852 610
2. Spill Prevention
Number of municipal facilities identified with hazardous materials
444 353 337
Number of spills at municipal facilities with hazardous materials, that occurred in outside areas
0 0 0
Number of Facility Assessments completed* (*identify any issues found requiring follow-up in narrative and
summarize new practices to minimize exposure)
46 115 123
Date of last review of HMMP* (*Identify committee participant with stormwater expertise in
narrative)
06/2009 06/2010 06/2011
3. Outfall Inspections
Total Number inspected* (*attach or forward electronic copy of inventory or map of major
out falls and priority outfalls)
136 127 201
Number of „Priority Outfalls‟ identified to date* (*summarize findings and follow-up actions in narrative)
40 40 39
Number of „Priority outfalls‟ inspected* (*summarize findings and follow-up actions in narrative)
40 40 39
Number of dry weather flows detected 29 13 11
Number of dry weather flows investigated 8 12 11
Number of major outfalls sampled 29 13 11
Number of illicit discharges identified 3 0 5
Number of illicit discharges eliminated 0 0 3
Amount of storm drain inspected (length) 6.4 miles 0.3 miles 0.5 miles

Appendix B City of Phoenix MS4 Stormwater Permit
AZPDES Permit No. AZS000003 Page 22
ANNUAL REPORTING YEAR (July 1- June 30)
STORMWATER MANAGEMENT PRACTICE OR ACTIVITY
2008-2009 2009-2010 2010-2011 2011-2012 2012-2013 2013-2014
Number of storm drain cross connection investigations 14a 31 0
Number of illicit connections detected 0 0 0
Number of illicit connections eliminated 0 0 0
Number of corrective or enforcement actions initiated within 60 days of identification
0a 0 N/A
Percent of cases resolved within 1 calendar year of original Level One action*
N/A N/A N/A
Number of illicit discharge reports received from public 230 282 294
Percent of illicit discharge reports responded to 99% 100% 93%
Percent of responses initiated within 15 days of receipt 98% 99% 100%
Municipal Facilities
1. Employee Training
Number of training events* (*dates and topics to be included in narrative)
21 97 59
Number of staff trained 835 1709 1833
2. Inventory/Map/Database of MS4 Owned & Operated Facilities
Total number of facilities on inventory 444 353 337
Date identification of “high risk” facilities completed 06/30/2011
Date prioritization of municipal facilities completed 06/30/2011
3. Inspections
Miles of MS4 drainage system prioritized for inspection 0 0b 0
b
Miles visually inspected 6.4 0.3 0.5
Number of „high risk‟ municipal facilities inspected 0 0 0
Number of „high risk‟ municipal facilities found needing improved stormwater controls
0 0 0
4. System Maintenance
Linear miles of drainage system cleaned each year* (*City to maintain records documenting specific street cleaning
events)
181,778 166,675 152,396
Record amount of waste collected from street and lot sweeping (reported in tons)
22,996 14,065 13,553
Total number of catch basins 16,000 16,000 16,000
Number of catch basins cleaned 11,927 14,352 8,213

Appendix B City of Phoenix MS4 Stormwater Permit
AZPDES Permit No. AZS000003 Page 23
ANNUAL REPORTING YEAR (July 1- June 30)
STORMWATER MANAGEMENT PRACTICE OR ACTIVITY
2008-2009 2009-2010 2010-2011 2011-2012 2012-2013 2013-2014
Industrial Sites Not Owned by the MS4
Number of training events for MS4 staff 0 6 1
Number of municipal staff trained 0 43 22
Number of industrial facilities on Part V.B. Inventory inspected 176 221 393
Number of corrective or enforcement actions initiated on industrial facilities
98 75 210
Percent of cases resolved within 1 calendar year of original Level One action
89% 87% 86%
Construction Program Activities
Number of training events for MS4 staff* (*include topics in narrative summary)
0 2 3
Number of municipal staff trained 0 35 59
Number of construction/grading plans submitted for review 363 98 95
Number of construction/grading plans reviewed 363 98 95
Number of construction sites inspected 363 403 322 26 (municipal)
Number of corrective or enforcement actions initiated on construction facilities*
(*identify the type of actions in narrative summary)
Not Available
11 19 7 (municipal)
Post Construction Program Activities
Number of post-construction inspections completed 122 111 126 23 (municipal)
Number of corrective or enforcement actions initiated for post-construction activities *
(*identify the type of actions in narrative summary)
0 0 0 1 (municipal)
(a) Revised.
(b) The City does not measure linear miles of drainage system prioritized for inspection. Rather, these areas are listed by location. The lists are included in the SWMP, and updated annually.


Appendix B City of Phoenix MS4 Stormwater Permit
AZPDES Permit No. AZS000003 Page 25
PART 5: EVALUATION OF THE STORMWATER MANAGEMENT PROGRAM
In accordance with Section 5.4 of the permit, provide an evaluation of the progress and success of the stormwater management program each year, including an assessment of the effectiveness of stormwater management practices in reducing the discharge of pollutants to and from the municipal storm sewer system.
Program Management
The City recently committed significant resources to the Stormwater Program in the form of new funding and staff. Many new stormwater-related positions were filled in the past year, including seven new Stormwater Inspectors. Much of the time spent over the last twelve months involved training the new staff on stormwater-related policies, procedures, and requirements.
Staff identified several areas where City Code Chapters 32 (Subdivisions), 32A (Grading and Drainage), 32B (Floodplains), and 32C (Stormwater Quality Protection) could be improved. Though changes to the Code have been proposed to the Law Department, the revisions are still working their way through the City‟s formal process. The proposed changes should serve to strengthen and clarify the stormwater program.
Several Stormwater procedures were identified that needed to be revised. Staff worked to improve and simplify the field screening procedure and the IDDE procedure. These revisions will be finalized and implemented during the next Fiscal Year.
IDDE staff has had difficulty identifying some sources of dry-weather flow. Therefore, the City hired a consultant to assist with identifying the source(s) on two IDDE projects. The staff has been working with the consultant to review their procedures, and to learn from their methodology.
In addition to evaluating management of the stormwater program, the City plans to continue assessing the program with respect to social indicators like public education and outreach efforts and water quality indicators like pollutant concentrations/loads.
Public Education and Outreach
The City commissioned a study to monitor resident‟s knowledge of storm drains and storm drain pollution. This year‟s study was conducted by telephone and included 418 interviews with heads of households. The study examined the following topics:
Where does stormwater entering the storm drain end up?
How serious is storm drain pollution?
What contributes to storm drain pollution?
Where should citizens report instances of illegal dumping?
How do you personally dispose of wastes?
Where would you find information on proper waste disposal?
How much are you willing to pay to be in compliance with the MS4 Permit?

Appendix B City of Phoenix MS4 Stormwater Permit
AZPDES Permit No. AZS000003 Page 26
The Behavior Research Center performed this survey in April 2011 and has conducted similar surveys for the City of Phoenix since 1995. The results indicate that about one in four residents is aware that stormwater ends up in local rivers. This awareness level can be categorized as consistent with surveys performed in previous years. Respondents viewed the seriousness of storm drain pollution as a less serious problem than in previous years. The mean rating was 6.1 (1-10 scale) from 7.0 in 2007. Lawn and garden chemicals were identified by the most residents as the greatest contributor to storm drain pollution, followed by chemicals and materials from construction sites, automotive fluids, chemicals and materials from industrial plants, household cleaning products (detergents, paints, degreasers, and bleaches), and animal waste. This result has been consistent for the past seven years.
The number of Phoenix residents reporting that they dispose of household chemicals properly was 56%. This number is slightly lower than in previous years. Although fewer residents are relying on the internet to get information on how to dispose of waste properly, 27% in 2011 versus 33% in 2009, 38% indicated that they would contact their city government for information. The highest number of residents indicated that they would report illegal dumping to the police department: city government was the next most popular choice. These two responses have been consistently identified by residents since the survey program was first initiated.
Sixty-nine percent of Phoenix residents indicated that they would be willing to pay an additional $6 or more each year to support the stormwater program. Fifty-seven percent of Phoenix residents would be willing to pay an additional $20 per year. These percentages increased since the question was first asked in 2010.
Pollutant Load
Annual and seasonal pollutant load estimates have been calculated for pollutants identified in Section 7.4 of the City‟s AZPDES Permit. Total pollutant load estimates for all watershed basins within the Phoenix MS4 are presented in Part 11 of this report.

Appendix B City of Phoenix MS4 Stormwater Permit
AZPDES Permit No. AZS000003 Page 27
PART 6: STORMWATER MANAGEMENT PROGRAM MODIFICATIONS
In accordance with Section 5.5 of the permit, provide a description of modifications, if applicable, to the stormwater management program each year as follows:
1. Addition of New BMPs: Summarize the development and implementation of any new stormwater management practices or pollution controls each year.
No BMPs were added during this reporting year.
2. Addition of Temporary BMPs: Specify the occasions when these controls were initiated and terminated, and the perceived success of these temporary BMPs.
No temporary BMPs have been initiated.
3. Increase of Existing BMPs: Summarize modifications to existing stormwater management practices that increase the number of activities, increase the frequency of activities, or other increases in the level of implementation.
No existing BMPs were increased during the reporting year.
4. Replacement of Existing BMPs: Briefly summarize any replacements made with prior approval of ADEQ per section 5.5(4) of the permit.
No BMPs were replaced during the reporting year.
Programmatic Changes
An increase in the Stormwater Fee became effective in July 2010. The additional resources have been used to hire more staff, including seven new stormwater inspectors, five wash maintenance crew, and three GIS technicians. In addition, the stormwater program has full Management attention and support. A Stormwater Working Group, with representatives from five departments, meets on a monthly basis. An Executive Committee meets quarterly to review program goals and resources.
Note: Modifications to reduce the number of stormwater management practices or activities, frequencies, time frames, level of implementation, or any other program standard specified in Appendix A of the permit requires permit modification (refer to Section 5.6 of the permit).


Appendix B City of Phoenix MS4 Stormwater Permit
AZPDES Permit No. AZS000003 Page 29
PART 7: MONITORING LOCATIONS
For the year one Annual Report, provide a brief description of each stormwater monitoring location (outfall), including the following information. For subsequent Annual Reports, advise if any of the information has changed or is updated.
No changes to the stormwater monitoring locations were made in FY10/11.
The monitoring sites are described on the following pages. The information for each site corresponds to the requirements in Part 7 of Appendix B of the Permit. Latitude and longitude coordinates have been revised for some outfalls. Land-use data and catchment area information are approximate values based on a review of the available data and best engineering judgment.
Note: Modifications to monitoring locations shall not be implemented without permit modification.

Appendix B City of Phoenix MS4 Stormwater Permit
AZPDES Permit No. AZS000003 Page 30
Name and Description of Receiving Water
AZ Canal Diversion Channel (ACDC)
Outfall Identification Number
AC33
Address/Physical Location of the Site
Dunlap and 7th Avenue just south of Hatcher
Latitude/Longitude
33° 34' 7"
-112° 4' 58"
Discharge Structure
60-inch box outlet
Size (acres) of Drainage Area
1084 acres
Land Uses
Industrial 1.9% Commercial 3.0% Transportation 0.1% Open Land 65.7% Institutional 7.6% Residential 12.9% Heavy Residential 8.5% Type of Monitoring Equipment
Campbell Scientific Instruments CR10 datalogger and SM192 storage module; Sierra Misco Environmental model 2500 tipping bucket; Druck PDCR 940 pressure transducer; Isco Environmental model 3700 pumping sampler; and Motorola MC310 cellular phone (analog phone service terminated in February 2008).

Appendix B City of Phoenix MS4 Stormwater Permit
AZPDES Permit No. AZS000003 Page 31
Name and Description of Receiving Water
Indian Bend Wash
Outfall Identification Number
IB08
Address/Physical Location of the Site
12499 North 40th Street
Latitude/Longitude
33° 35' 55.8"
-111° 59' 44"
Discharge Structure
66-inch round inlet pipe (original) discharging to two 30-inch outlet pipes
48-inch round inlet pipe (new in 2005) discharging to one 48-inch outlet pipe
Size (acres) of Drainage Area
804.5 acres
Land Uses
Industrial 0.7% Commercial 9.5% Transportation 0.1% Open Land 2.8% Institutional 6.6% Agriculture 0.0% Residential 78.7% Heavy Residential 1.7% Type of Monitoring Equipment
Sigma tipping bucket; Sigma integral area velocity flow meter; Sigma model 900 MAX pumping sampler; and hard-wired telephone.

Appendix B City of Phoenix MS4 Stormwater Permit
AZPDES Permit No. AZS000003 Page 32
Name and Description of Receiving Water
Salt River
Outfall Identification Number
SR03
Address/Physical Location of the Site
3501 West Elwood Street
Latitude/Longitude
33° 25' 6"
-112° 8' 5"
Discharge Structure
75-inch round pipe
Size (acres) of Drainage Area
1886 acres
Land Uses
Industrial 17.8% Commercial 17.1% Transportation 1.1% Open Land 12.4% Institutional 19.8% Residential 27.3% Heavy Residential 3.3% Utilities 1.1 Miscellaneous 0.02% Type of Monitoring Equipment
Campbell Scientific Instruments CR10 datalogger and SM192 storage module; Sierra Misco Environmental model 2500 tipping bucket; Druck PDCR 940 pressure transducer; Isco Environmental model 3700 pumping sampler; and Motorola MC310 cellular phone (analog phone service terminated in February 2008).

Appendix B City of Phoenix MS4 Stormwater Permit
AZPDES Permit No. AZS000003 Page 33
Name and Description of Receiving Water
Salt River
Outfall Identification Number
SR30
Address/Physical Location of the Site
27th Avenue at the Salt River (south bank)
Latitude/Longitude
33° 24' 30.4"
-112° 06' 59"
Discharge Structure
108-inch round pipe
Size (acres) of Drainage Area
1620 acres
Land Uses
Industrial 8.4% Commercial 4.3% Transportation 1.1% Open Land 50.0% Institutional 1.1% Residential 35.0% Heavy Residential 0.02% Type of Monitoring Equipment
Campbell Scientific Instruments CR10 datalogger and SM192 storage module; Sierra Misco Environmental model 2500 tipping bucket; Druck PDCR 940 pressure transducer; Conoflow and pressure-regulator system; Isco Environmental model 3700 pumping sampler; and Motorola MC310 cellular phone (analog phone service terminated in February 2008).

Appendix B City of Phoenix MS4 Stormwater Permit
AZPDES Permit No. AZS000003 Page 34
Name and Description of Receiving Water
Salt River
Outfall Identification Number
SR45
Address/Physical Location of the Site
2401 South 40th Street
Latitude/Longitude
33° 25' 34.0"
-111° 59' 44.0"
Discharge Structure
54-inch round pipe
Size (acres) of Drainage Area
879.7 acres
Land Uses
Industrial 37.5% Commercial 25.5% Transportation 0.8% Open Land 24.9% Institutional 10.5% Residential 0.2% Heavy Residential 0.0% Utilities 0.1% Type of Monitoring Equipment
Campbell Scientific Instruments CR10 datalogger and SM192 storage module; Sierra Misco Environmental model 2500 tipping bucket; Druck PDCR 940 pressure transducer; Conoflow and pressure-regulator system; Isco Environmental model 3700 pumping sampler; and Motorola MC310 cellular phone

Appendix B City of Phoenix MS4 Stormwater Permit
AZPDES Permit No. AZS000003 Page 35
Name and Description of Receiving Water
Salt River
Outfall Identification Number
SR49
Address/Physical Location of the Site
5400 South 67th Avenue
Latitude/Longitude
33° 24' 01"
-112° 12' 14.2"
Discharge Structure
96-inch round pipe
Size (acres) of Drainage Area
4761.9 acres
Land Uses
Industrial 26.0% Commercial 8.2% Transportation 3.4% Open Land 40.4% Institutional 3.4% Residential 16.9% Heavy Residential 01.2% Utilities 0.5% Type of Monitoring Equipment
Campbell Scientific Instruments CR10 datalogger and SM192 storage module; Sierra Misco Environmental model 2500 tipping bucket; Druck PDCR 1830 pressure transducer; Isco Environmental model 3700 pumping sampler; and Motorola MC310 cellular phone (analog phone service terminated in February 2008).

Appendix B City of Phoenix MS4 Stormwater Permit
AZPDES Permit No. AZS000003 Page 36
Name and Description of Receiving Water
Skunk Creek Wash (Tributary to New River)
Outfall Identification Number
SC046
Address/Physical Location of the Site
35206 North 27th Avenue
Latitude/Longitude
33° 48' 12"
-112° 7' 7"
Discharge Structure
Three 36-inch round pipes
Size (acres) of Drainage Area
46 acres
Land Uses
Industrial 0.0% Commercial 0.0% Transportation 0.0% Open Land 26.7% Public-owned Land 0.0% Residential 73.3% Heavy Residential 0.0% Type of Monitoring Equipment
Automated composite sampler (Isco Environmental model 3700 or equivalent), a Sierra Misco rain gauge, and a flow meter for depth and flow measurement.

Appendix B City of Phoenix MS4 Stormwater Permit
AZPDES Permit No. AZS000003 Page 37
PART 8: STORM EVENT RECORDS
For each outfall identified in Part 7.0, Table 1.0 of the permit, summarize all measurable storm events (greater than 0.1 inch rainfall) occurring in the drainage area of each outfall within the winter and summer wet seasons, respectively, until samples have been collected for the outfall. Include the date of each event, the amount of precipitation (inches) for each event, and whether a sample was collected, or if not collected, information on the conditions that prevented sampling. (Note: If unable to collect stormwater samples due to adverse climatic conditions, provide, in lieu of sampling data, a description of the conditions that prevented sampling. Adverse climatic conditions which may prevent the collection of samples include weather conditions that create dangerous conditions for personnel, such as local flooding, high winds, electrical storms, etc.).
In accordance with 40 CFR Part 122.21(g) (7), the City of Phoenix AZPDES Permit Section 7.3.1 defines a representative storm as rainfall in the amount of 0.2 inches or more. The section further directs that “Stormwater samples shall be collected from discharges resulting from a storm event producing 0.2 inches or more of rainfall and at least 72 hours after the previously measured storm event (greater than 0.1 inch rainfall).” The definition of a representative storm event was modified in the new permit so that more stormwater monitoring data might be collected during the new 5-year permit term.
The U.S. Geological Survey (USGS) conducts outfall monitoring under an intergovernmental agreement (IGA) with the City of Phoenix. There were representative storm events at each outfall during the reporting year, resulting in the collection of fourteen sets of data from July 1, 2010 through June 30, 2011. Rainfall totals and sample collection information by outfall are provided in Table 8-1 in this section.
Storm events during which stormwater samples were collected are discussed by season below:
Summer Wet Season Sampling Summary
July 29, 2010: Grab and composite samples were collected from SR45.
July 31, 2010: Grab and composite samples were collected from IB08 and SR03.
August 28, 2010: Grab and composite samples were collected from SR30 and AC33.
October 5, 2010: Grab and composite samples were collected from SC046 and SR49.
Winter Wet Season Sampling Summary
December 16, 2010: Grab and composite samples were collected from IB08.
December 22 and 23: Grab and composite samples were collected from SC046, AC33, SR03, SR30, SR45, and SR49.

Appendix B City of Phoenix MS4 Stormwater Permit
AZPDES Permit No. AZS000003 Page 38
The City was notified by the laboratory that the recommended holding time was exceeded for total cyanide on all of the grab samples taken on December 22, 2010. Therefore, additional grab samples were collected on February 19, 2011 at AC33, SR03, SR30, SR45, and SR49 and on February 27, 2011 at SC046. These samples were only analyzed for total cyanide.
All reported data were validated by the USGS to ensure that the data quality objectives of the AZPDES program have been met. The data validation was then verified by URS Corporation and it was determined that the data and associated quality assurance and quality control (QAQC) information appear to be complete. No data anomalies were identified that would have rendered the data unusable. The reviewer did note that results for four analytes total from samples collected during the August 28, 2010 rain event may potentially be biased as low. It was also noted that the samples collected on August 28 and October 5, 2010 for azobenzene may be biased high, as they were detected in the method blank at the same concentration and flagged accordingly. The laboratory used the method detection limit as the reporting limit for Methods 625 and 608. Accordingly, all values between the method detection limit (MDL) and the laboratory‟s practical quantitation limit (PQL) should be considered estimated. The laboratory was unable to provide additional verification of the azobenzene detection when contacted by the City.
However, based on the QAQC presented, the analytical results appear to be generally usable for their intended purpose.
The following procedures were used in validating the data:
Analytical methods used in the monitoring program were reviewed to assess the appropriateness of sample collection, transport methods, and holding times.
Original laboratory reports and the corresponding chain of custody forms were reviewed to determine if quality assurance/quality control requirements were met. Evaluation criteria including holding times, duplicate results, field blank results, method blank results, matrix spike results, equipment calibration information, and sample collection and transport information (to the extent practical.)

Appendix B City of Phoenix MS4 Stormwater Permit
AZPDES Permit No. AZS000003 Page 39
Table 8-1 Storm Event Data for Reporting Year 2010-2011
Date Outfall IB-08
Rainfall inches
Outfall SR-49
Rainfall inches
Outfall SR-45
Rainfall inches
Outfall SR-03
Rainfall inches
Outfall SR-30
Rainfall inches
Outfall AC-33
Rainfall inches
Outfall SC-46
Rainfall inches
Su
mm
er
(June 1
– O
cto
ber
31)
07/22/10 - - - - - - - - - - - - NR 0.18
07/27/10 - - - - - - - - - - - - NR 0.12
07/29/10 - - NR 0.04 SC 0.55 NR 0.04 NR 0.10 NR
72hr
0.17
0.12 NR 0.16
07/31/10 SC 0.71 NR 0.10 PS 0.64 SC 0.24 NR 0.13 72hr 0.44 NR 0.16
08/01/10 - - - - - - - - - - - - NR 0.17
08/07/10 - - NR 0.13 NR 0.12 - - NR 0.11 NR 0.18 - -
08/17/10 - - NR 0.14 NR 0.16 PS 0.27 NR 0.16 NR 0.16 - -
08/18/10 PS 0.34 - -
08/22/10 PS 0.28 NR 0.18 - - - - NR 0.17 NR 0.17 NR 0.18
08/28/10 PS 0.28 NR 0.10 PS, NR 0.02 PS 0.37 SC 0.59 SC 0.50 - -
09/22/10 PS 0.42 - - - - - - - - - - - -
10/05/10 PS 0.32 SC 1.01 PS 0.41 PS 1.04 PS 1.04 PS 1.17 SC 1.07

Appendix B City of Phoenix MS4 Stormwater Permit
AZPDES Permit No. AZS000003 Page 40
Date Outfall IB-08
Rainfall inches
Outfall SR-49
Rainfall inches
Outfall SR-45
Rainfall inches
Outfall SR-03
Rainfall inches
Outfall SR-30
Rainfall inches
Outfall AC-33
Rainfall inches
Outfall SC-46
Rainfall inches
Win
ter
(Novem
ber
1 –
May 3
1)
11/21/10 NR 0.12 - - - - - - - - NR 0.11 - -
12/16/10 SC 0.34 NR 0.10 NR 0.11 NR 0.11 NR 0.18 NR 0.17 NR 0.15
12/23/10 PS 0.55 SC 0.41 SC 0.28 SC 0.43 SC 0.56 SC 0.45 SC 0.69
12/30/10 PS 1.11 PS 0.65 PS 0.42 PS 0.65 PS 1.16 PS 1.16 PS 1.23
02/19/111 PS 0.47 SC 0.35 SC 0.25 SC 0.33 SC 0.44 SC 0.44
NF
72 hr
0.25
0.16
2/20/11 - - NR 0.10 - - - - NR 0.14 NR 0.17 72hr 0.24
02/27/111 PS 0.51 PS 0.43 PS 0.24 PS 0.33 PS 0.32 PS 0.55 SC 0.45
1 – Samples collected were analyzed for total cyanide only.
KEY: NR Not Representative (storm event of less than 0.2 inches) SC Sample Collected IS Insufficient Sample (for analysis) IF Insufficient Flow (for sample collection) NF No Flow DC Dangerous Conditions PS Previously Sampled (in Current Season) 72hr Occurred within 72 hours of another storm event.

Appendix B City of Phoenix MS4 Stormwater Permit
AZPDES Permit No. AZS000003 Page 41
NOTES: NS = no standard applicable to the designated use. T = Total D = Dissolved D
a = Result is assumed based upon a 1:1 ratio to total metals.
T&D = Total and Dissolved Bold text indicates a sample result greater than the SWQS Italicized text indicated a laboratory detection limit higher that the SWQS.
Footnotes 1 The Permittee shall report on any additional parameters that were monitored for seasonal stormwater sampling as required by Section 6.0 of this permit (Special Conditions). 2 Analytical results shall be reported in the units specified for each category or parameter. 3 Report the average flow rate for the sampling period (no more than 6 hours). 4 Standard for total PCBs of 11 μg/L A&We and 19 μg/L PBC.
5 SWQS value based on a maximum hardness of 400 mg/L. Actual hardness results were higher. 6 Results for cyanide were collected on 2/19/11 (SC046 on 2/27/11) due to missed hold time on previous samples. 7 The method blanks used by the laboratory contained the same concentration of Azobenzene as the outfall sample.
PART 9: SUMMARY OF MONITORING DATA (BY LOCATION)
Use a separate table for each outfall monitoring location. Provide the outfall identification number, the receiving water designated uses, and the lowest surface water quality standards applicable to the receiving water. Enter the analytical results for the stormwater samples collected for each season of the reporting period for each year. Enter subsequent monitoring data for each location on the same form. Include, as an attachment, the laboratory reports for stormwater samples.
OUTFALL ID: IB08 RECEIVING WATER: Indian Bend Wash DESIGNATED USES: PBC and A&We
MONITORING SEASONS Summer: June 1 – October 31 Winter: November 1 – May 31
Winter 2008-09
Summer
2009
Winter 2009-10
Summer
2010
Winter 2010-11
Summer
2011
Winter 2011-12
Summer
2012
Winter 2012-13
Summer
2013
Winter 2013-14
SAMPLING DATE(S): SWQS 4/11/09 SWQS 8/13/09 SWQS 12/7/09 SWQS 7/31/10 SWQS 12/16/10 SWQS SWQS SWQS SWQS SWQS SWQS
MONITORING PARAMETERS 1, 2
Conventional Parameters
Flow 3 (cfs) NS 8.76 cfs NS 2.10 cfs NS 6.02 cfs NS 19.44 NS 4.04
pH 6.5-9 7.1 6.5-9 7.5 6.5-9 7.85 6.5-9 7.28 6.5-9 8.90
Temperature Varies 17.2 Varies 29 Varies 12.5 Varies 27.5 Varies 18.5
Hardness (mg/L) 400 67 400 150 400 58 400 98 400 90.6
Total Dissolved Solids (TDS) (mg/L)
2
NS 130 NS 370 NS 110 NS 160 NS 185
Total Suspended Solids (TSS) (mg/L)
2
NS 130 NS 180 NS 110 NS 290 NS 76.0
Biochemical Oxygen Demand (BOD) (mg/L)
2
NS 52 NS 39 NS 20 NS 49 NS 35.9
Chemical Oxygen Demand (COD) (mg/L)
2
NS 360 NS 240 NS 140 NS 240 NS 360
IB08 Winter
2008-09 Summer
2009 Winter
2009-10 Summer
2010 Winter
2010-11 Summer
2011 Winter
2011-12 Summer
2012 Winter
2012-13 Summer
2013 Winter
2013-14
Inorganics SWQS 4/11/09 SWQS 8/13/09 SWQS 12/7/09 SWQS 7/31/10 SWQS 12/16/10 SWQS SWQS SWQS SWQS SWQS SWQS
Cyanide, total (µg/L) 2 84 <5.0 84 <5.0 84 <5.0 84 <5.0 84 <5.0
Nutrients (mg/L) 2
Nitrate + Nitrite as N NS 1.2 NS 2.6 NS 2.2 NS 1.1 NS 1.14
Ammonia as N NS 1.9 NS 2.0 NS 1.9 NS 1.8 NS 1.64
Total Kjeldahl Nitrogen (TKN) NS 7.0 NS 9.4 NS 4.0 NS 6.9 NS 6.90
Total Phosphorus as P NS 1.2 NS 1.0 NS 0.62 NS 1.2 NS 0.413
Ortho-Phosphorus as P NS 0.32 NS 0.37 NS 0.32 NS 0.40 NS 0.190

Appendix B City of Phoenix MS4 Stormwater Permit
AZPDES Permit No. AZS000003 Page 42
NOTES: NS = no standard applicable to the designated use. T = Total D = Dissolved D
a = Result is assumed based upon a 1:1 ratio to total metals.
T&D = Total and Dissolved Bold text indicates a sample result greater than the SWQS Italicized text indicated a laboratory detection limit higher that the SWQS.
Footnotes 1 The Permittee shall report on any additional parameters that were monitored for seasonal stormwater sampling as required by Section 6.0 of this permit (Special Conditions). 2 Analytical results shall be reported in the units specified for each category or parameter. 3 Report the average flow rate for the sampling period (no more than 6 hours). 4 Standard for total PCBs of 11 μg/L A&We and 19 μg/L PBC.
5 SWQS value based on a maximum hardness of 400 mg/L. Actual hardness results were higher. 6 Results for cyanide were collected on 2/19/11 (SC046 on 2/27/11) due to missed hold time on previous samples. 7 The method blanks used by the laboratory contained the same concentration of Azobenzene as the outfall sample.
IB08 Winter
2008-09 Summer
2009 Winter
2009-10 Summer
2010 Winter
2010-11 Summer
2011 Winter
2011-12 Summer
2012 Winter
2012-13 Summer
2013 Winter
2013-14
Microbiological SWQS 4/11/09 SWQS 8/13/09 SWQS 12/7/09 SWQS 7/31/10 SWQS 12/16/10
Escherichia coli (E. coli) (CFU/100 mg or MPN/100 mL)
2
575 69000 575 7,490 575 3,840 575 8130 575 5380
Total Metals (μg/L) 2
Antimony 747 T <25.0 T&D
747 T <25.0 T&D
747 T <25 T&D
747 T <25 T&D
747 T <25 T&D
Arsenic 280 T 440 D
<10.0 T&D
280 T 440 D
<10.0 T&D
280 T 440 D
<10 T&D
280 T 440 D
<10 T&D
280 T 440 D
<10 T&D
Barium 98,000 T 120 (T) 22 (D)
98,000 T 110T 51 D
98,000 T 64 T 16 D
98,000 T 190 T 29 D
98,000 T 61 T 14 D
Beryllium 1,867T <2.0 T&D 1,867T <2.0 T&D
1,867T <2.0 T&D
1,867T <2.0 T&D
1,867T <2
T&D
Cadmium 700 T 15.45
<3.0 T&D 700 T
33.82 D <3.0 T&D
700 T 13.42 D
<3.0 T&D
700 T 22.36 D
<3.0 T&D
700 T 20.70 D
<3 T&D
Chromium
1,400,000 T CrIII
2,800 T CrVI
1377 CrIII 34D CrVI
11 T <10.0 D
NS <10 T&D NS <10 T&D
NS 24 T <10D
NS <10 T&D
Copper 1,300 T 15.95 D
63.0 T 20.0 D
1,300 T 34.08 D
71 T 30 D
1,300 T 13.92 D
61 T 15 D
1,300 T 22.82 D
120 T 18 D
1,300 T 22.18 D
41 T <10 D
Lead 15 T
87.90 D 22.0 T
<10.0 D 15 T
211.32 D 20 T
<10 D 15 T
74.96 D 11 T
<10 D 15 T
133.33 D 27 T 10 D
15 T 122.28 D
<10 T&D
Mercury 280 T 5.0 D
<0.20 T&D
280 T 5 D
<0.2 T&D
280 T 5 D
<0.2 T&D
280 T 5 D
<0.2 T&D
280 T 5 D
<0.20 T&D
Nickel 28,000 T 2,963 D
13.0T <10D
28,000 T 5,860 D
14 T <10 D
28,000 T 2,623 D
<10 T&D
28,000 T 4088 D
24 T <10D
28,000 T 3822 D
<10 T&D
Selenium 33 T <2.0 T&D
33 T <2.0 T&D
33 T <2.0 T&D
33 T <2.0 T&D
33 T <2.00 T&D
Silver 4,667 T 1.62 D
<5.0 T&D
4,667 T 6.46 D
<5.0 T&D
4,667 T 1.26 D
<5.0 T <5.0 D
4,667 T 3.11 D
<5.0 T&D
4,667 T 2.71 D
<5 T <5 D
Thallium 75 T <0.5 T&D 75 T <5.0 T&D
75 T <0.5 T <1.0 D
75 T <0.5 T&D
75 T <0.50 T&D
Zinc 280,000 T
792 D
280 T 60 D
280,000 T 1,568 D
270 T 89 D
280,000 T 701 D
150 T <50 D
280,000 T
1093 D 520 T 74 D
280,000 T
1023 D 115 T <50 D

Appendix B City of Phoenix MS4 Stormwater Permit
AZPDES Permit No. AZS000003 Page 43
NOTES: NS = no standard applicable to the designated use. T = Total D = Dissolved D
a = Result is assumed based upon a 1:1 ratio to total metals.
T&D = Total and Dissolved Bold text indicates a sample result greater than the SWQS Italicized text indicated a laboratory detection limit higher that the SWQS.
Footnotes 1 The Permittee shall report on any additional parameters that were monitored for seasonal stormwater sampling as required by Section 6.0 of this permit (Special Conditions). 2 Analytical results shall be reported in the units specified for each category or parameter. 3 Report the average flow rate for the sampling period (no more than 6 hours). 4 Standard for total PCBs of 11 μg/L A&We and 19 μg/L PBC.
5 SWQS value based on a maximum hardness of 400 mg/L. Actual hardness results were higher. 6 Results for cyanide were collected on 2/19/11 (SC046 on 2/27/11) due to missed hold time on previous samples. 7 The method blanks used by the laboratory contained the same concentration of Azobenzene as the outfall sample.
IB08 Winter
2008-09 Summer
2009 Winter
2009-10 Summer
2010 Winter
2010-11 Summer
2011 Winter
2011-12 Summer
2012 Winter
2012-13 Summer
2013 Winter
2013-14
Organic Toxic Pollutants SWQS 4/11/09 SWQS 8/13/09 SWQS 12/7/09 SWQS 7/31/10 SWQS 12/16/10 SWQS SWQS SWQS SWQS SWQS SWQS
Total Petroleum Hydrocarbons (TPH) (mg/L)
2
NS <5.0 NS <5.0 NS <5.0 NS <5.0 NS <5.00
Total Oil and Grease (mg/L) 2 NS <5.0 NS <5.0 NS <5.0 NS <5.0 NS <5.00
VOCs, Semi-VOCs, & Pesticides (μg/L)
2
Acrolein 467 <50 467 <50 467 <50 467 <50 467 <50.0
Acrylonitrile 37,333 <5.0 37,333 <5.0 37,333 <5.0 37,333 <5.0 37,333 <5.00
Benzene 3,733 <0.50 3,733 <0.50 3,733 <0.50 3,733 <0.50 3,733 <0.500
Bromoform 18,667 <1.0 18,667 <1.0 18,667 <1.0 18,667 <1.0 18,667 <0.500
Carbon tetrachloride 1,307 <0.50 1,307 <0.50 1,307 <0.50 1,307 <0.50 1,307 <1.00
Chlorobenzene 18,667 <0.50 18,667 <0.50 18,667 <0.50 18,667 <0.50 18,667 <0.500
Chlorodibromomethane 18,667 <0.50 18,667 <0.50 18,667 <0.50 18,667 <0.50 18,667 <0.500
Chloroethane (ethyl chloride) NS <5.0 NS <5.0 NS <5.0 NS <5.0 NS <5.00
2-chloroethylvinyl ether NS <2.0 NS <2.0 NS <2.0 NS <2.0 NS <2.00
Chloroform 9,333 <0.50 9,333 <0.50 9,333 <0.50 9,333 <0.50 9,333 <0.500
Dichlorobromomethane 18,667 <0.50 18,667 <0.50 18,667 <0.50 18,667 <0.50 18,667 <0.500
1,1-dichloroethane NS <1.0 NS <1.0 NS <1.0 NS <1.0 NS <1.00
1,2-dichloroethane 186,667 <1.0 186,667 <1.0 186,667 <1.0 186,667 <1.0 186,667 <1.00
1,1-dichloroethylene 46,667 <1.0 46,667 <1.0 46,667 <1.0 46,667 <1.0 46,667 <1.00
1,2-dichloropropane 84,000 <0.50 84,000 <0.50 84,000 <0.50 84,000 <0.50 84,000 <0.500
1,3-dichloropropylene 28,000 cis <1.0
trans <0.5 28,000 cis <1.0 28,000 cis <1.0 28,000 cis <1.0 28,000 <1.00
Ethylbenzene 93,333 <2.0 93,333 <2.0 93,333 <2.0 93,333 <2.0 93,333 <2.00
Methyl bromide 1,307 <5.0 1,307 <5.0 1,307 <5.0 1,307 <5.0 1,307 <5.00
Methyl chloride NS <5.0 NS <5.0 NS <5.0 NS <5.0 NS <5.00
Methylene chloride 56,000 <3.0 56,000 <3.0 56,000 <3.0 56,000 <3.0 56,000 <3.00
1,1,2,2-tetrachloroethane 93,333 <.50 93,333 <0.50 93,333 <0.50 93,333 <0.50 93,333 <0.500
Tetrachloroethylene 9,333 <0.50 9,333 <0.50 9,333 <0.50 9,333 <0.50 9,333 <0.500
Toluene 373,333 <3.0 373,333 <3.0 373,333 <3.0 373,333 <3.0 373,333 <3.00
1,2-trans-dichloroethylene 18,667 <0.50 18,667 <0.50 18,667 <0.50 18,667 <0.50 18,667 <0.500
1,1,1-trichloroethane 1,866,667 <0.50 1.867x
10+6
<0.50
1.867x 10
+6
<0.50 1.867x
10+6
<0.50
1.867x 10
+6
<0.500
1,1,2-trichloroethane 3,733 <0.50 3,733 <0.50 3,733 <0.50 3,733 <0.50 3,733 <0.500
Trichloroethylene 280 <0.50 280 <0.50 280 <0.50 280 <0.50 280 >0.500
1,2,4-Trimethylbenzene 1,3,5-Trimethylbenzene
NS <2.0 <1.5
NS <2.0 <1.5
NS <2.0 <1.5
NS <2.0 <1.5
NS <2.0 <1.5
Vinyl chloride 2,800 <0.50 2,800 <0.50 2,800 <0.50 2,800 <0.50 2,800 <0.500
Xylenes, Total 186,667 <3.0 186,667 <3.0 186,667 <3.0 186,667 <3.0 186,667 <1.00

Appendix B City of Phoenix MS4 Stormwater Permit
AZPDES Permit No. AZS000003 Page 44
NOTES: NS = no standard applicable to the designated use. T = Total D = Dissolved D
a = Result is assumed based upon a 1:1 ratio to total metals.
T&D = Total and Dissolved Bold text indicates a sample result greater than the SWQS Italicized text indicated a laboratory detection limit higher that the SWQS.
Footnotes 1 The Permittee shall report on any additional parameters that were monitored for seasonal stormwater sampling as required by Section 6.0 of this permit (Special Conditions). 2 Analytical results shall be reported in the units specified for each category or parameter. 3 Report the average flow rate for the sampling period (no more than 6 hours). 4 Standard for total PCBs of 11 μg/L A&We and 19 μg/L PBC.
5 SWQS value based on a maximum hardness of 400 mg/L. Actual hardness results were higher. 6 Results for cyanide were collected on 2/19/11 (SC046 on 2/27/11) due to missed hold time on previous samples. 7 The method blanks used by the laboratory contained the same concentration of Azobenzene as the outfall sample.
IB08 Winter
2008-09 Summer
2009 Winter
2009-10 Summer
2010 Winter
2010-11 Summer
2011 Winter
2011-12 Summer
2012 Winter
2012-13 Summer
2013 Winter
2013-14
Acid Compounds (μg/L) 2 SWQS 4/11/09 SWQS 8/13/09 SWQS 12/7/09 SWQS 7/31/10 SWQS 12/16/10
2-chlorophenol 4,667 <12 4,667 <12 4,667 <4.9 4,667 <12 4,667 <12.3
2,4-dichlorophenol 2,800 <6.9 2,800 <6.9 2,800 <2.8 2,800 <6.9 2,800 <6.90
2,4-dimethylphenol 18,667 <15 18,667 <15 18,667 <5.9 18,667 <15 18,667 <14.7
4,6-dinitro-o-cresol 3,733 <14 3,733 <14 3,733 <5.4 3,733 <14 3,733 <13.6
2,4-dinitrophenol 1,867 <10 1,867 <10 1,867 <4.1 1,867 <10 1,867 <10.2
2-nitrophenol NS <7.3 NS <7.3 NS <2.9 NS <7.3 NS <7.30
4-nitrophenol NS <2.1 NS <2.1 NS <0.8 NS <2.1 NS 7.75
p-chloro-m-cresol 48,000 <6.2 48,000 <6.2 48,000 <2.5 48,000 <6.2 48,000 <6.25
Pentachlorophenol 28,000 40.65
<15 60.758 <15 82.138 <6.0 48.743 <15 248.117 <14.9
Phenol 180,000 <3.5 180,000 <3.5 180,000 <1.4 180,000 <3.5 180,000 <3.48
2,4,6-trichlorophenol 130 <7.5 130 <7.5 130 <3.0 130 <7.5 130 <7.52
Bases/Neutrals (μg/L) 2
Acenaphthene 56,000 <3.5 56,000 <3.5 56,000 <1.4 56,000 <3.5 56,000 <3.52
Acenaphthylene NS <14 NS <14 NS <5.5 NS <14 NS <13.8
Anthracene 280,000 <3.5 280,000 <3.5 280,000 <1.4 280,000 <3.5 280,000 <3.50
Benz(a)anthracene 0.2 <3.9 0.2 <3.9 0.2 <1.5 0.2 <3.9 0.2 <3.86
Benzo(a)pyrene 0.2 <3.7 0.2 <3.7 0.2 <1.5 0.2 <3.7 0.2 <3.72
Benzo(b)fluoranthene 1.9 <3.7 NS <3.7 NS <1.5 NS <3.7 NS <3.74
Benzo(g,h,i)perylene NS <3.8 NS <3.8 NS <1.5 NS <3.8 NS <3.85
Benzo(k)fluoranthene 1.9 <3.9 1.9 <3.9 1.9 <1.6 1.9 <3.9 1.9 <3.90
Chrysene 19 <4.0 19 <4.0 19 <1.6 19 <4.0 19 <4.00
Dibenz(a,h)anthracene 1.9 <3.7 1.9 <3.7 1.9 <1.5 1.9 <3.7 1.9 <3.72
1,2-dichlorobenzene 5,900 <13 5,900 <13 5,900 <5.4 5,900 <13 5,900 <13.5
1,3-dichlorobenzene NS <12 NS <12 NS <4.8 NS <12 NS <12.0
1,4-dichlorobenzene 6,500 <14 6,500 <14 6,500 <5.5 6,500 <14 6,500 <13.7
3,3-dichlorobenzidine 3 <16 3 <16 3 <6.3 3 <16 3 <15.8
Diethyl phthalate 746,667 <3.9 746,667 <3.9 746,667 <1.6 746,667 <3.9 746,667 <3.89
Dimethyl phthalate NS <3.9 NS <3.9 NS <1.6 NS <3.9 NS <3.94
Di-n-butyl phthalate 1,100 <3.5 1,100 <5.1 1,100 <2.0 1,100 <5.1 1,100 <5.13
2,4-dinitrotoluene 1,867 <14 1,867 <15 1,867 <6.0 1,867 <15 1,867 <15.0
2,6-dinitrotoluene 3,733 <3.5 3,733 <3.8 3,733 <1.5 3,733 <3.8 3,733 <3.77
Di-n-octyl phthalate 373,333 <3.9 373,333 <6.7 373,333 <2.7 373,333 <6.7 373,333 <6.73
1,2-diphenylhydrazine (as azobenzene)
1.8 <3.7 1.8 <3.6 1.8 <1.4 1.8 <3.6 1.8 <3.57
Fluroranthene 37,333 <3.7 37,333 <4.2 37,333 <1.7 37,333 <4.2 37,333 <4.21
Fluorene 37,333 <3.8 37,333 <3.6 37,333 <1.4 37,333 <3.6 37,333 <3.56
Hexachlorobenzene 747 <3.9 747 <2.9 747 <1.1 747 <2.9 747 <2.88
Hexachlorobutadiene 187 <4.0 187 <15 187 <5.9 187 <15 187 <14.7

Appendix B City of Phoenix MS4 Stormwater Permit
AZPDES Permit No. AZS000003 Page 45
NOTES: NS = no standard applicable to the designated use. T = Total D = Dissolved D
a = Result is assumed based upon a 1:1 ratio to total metals.
T&D = Total and Dissolved Bold text indicates a sample result greater than the SWQS Italicized text indicated a laboratory detection limit higher that the SWQS.
Footnotes 1 The Permittee shall report on any additional parameters that were monitored for seasonal stormwater sampling as required by Section 6.0 of this permit (Special Conditions). 2 Analytical results shall be reported in the units specified for each category or parameter. 3 Report the average flow rate for the sampling period (no more than 6 hours). 4 Standard for total PCBs of 11 μg/L A&We and 19 μg/L PBC.
5 SWQS value based on a maximum hardness of 400 mg/L. Actual hardness results were higher. 6 Results for cyanide were collected on 2/19/11 (SC046 on 2/27/11) due to missed hold time on previous samples. 7 The method blanks used by the laboratory contained the same concentration of Azobenzene as the outfall sample.
IB08 Winter
2008-09 Summer
2009 Winter
2009-10 Summer
2010 Winter
2010-11 Summer
2011 Winter
2011-12 Summer
2012 Winter
2012-13 Summer
2013 Winter
2013-14
Hexachlorocyclopentadiene 11,200 <3.7 11,200 <16 11,200 <6.2 11,200 <16 11,200 <15.5
Hexachloroethane 850 <13 850 <15 850 <6.0 850 <15 850 <15.0
Indeno(1,2,3-cd)pyrene 1.9 <12 1.9 <3.8 1.9 <1.5 1.9 <3.8 1.9 <3.84
Isophorone 186,667 <3.5 186,667 <3.5 186,667 <1.4 186,667 <3.5 186,667 <3.53
Naphthalene 18,667 <14 18,667 <12 18,667 <5.0 18,667 <12 18,667 <12.4
Nitrobenzene 467 <3.5 467 <3.6 467 <1.4 467 <3.6 467 <3.59
N-nitrosodimethylamine 0.03 <11 0.03 <11 0.03 <4.4 0.03 <11 0.03 <10.9
N-nitrosodi-n-propylamine 88,667 <3.6 88,667 <3.6 88,667 <1.5 88,667 <3.6 88,667 <3.63
N-nitrosodiphenylamine 290 <16 290 <16 290 <6.5 290 <16 290 <16.2
Phenanthrene NS <3.6 NS <3.6 NS <1.4 NS <3.6 NS <3.56
Pyrene 28,000 <4.2 28,000 <4.2 28,000 <1.7 28,000 <4.2 28,000 <4.18
1,2,4-trichlorobenzene 9,333 <13 9,333 <13 9,333 <5.3 9,333 <13 9,333 <13.2
Pesticides (μg/L) 2
Aldrin 4.5 <0.057 4.5 <0.30 4.5 <0.60 4.5 <0.60 4.5 <0.120
Alpha-BHC 1,600 <0.075 1,600 <0.25 1,600 <0.50 1,600 <0.50 1,600 <0.100
Beta-BHC 560 <0.081 560 <0.25 560 <0.50 560 <0.50 560 <0.100
Gamma-BHC 11 <0.075 11 <0.25 11 <0.50 11 <0.50 11 <0.100
Delta-BHC 1,600 <0,079 1,600 <0.25 1,600 <0.50 1,600 <0.50 1,600 <0.100
Chlordane 3.2 <0.16 3.2 <3.5 3.2 <7.0 3.2 <7.0 3.2 <1.40
4,4‟-DDT 1.1 <0.081 1.1 <0.30 1.1 <0.60 1.1 <0.60 1.1 <0.120
4,4‟-DDE 1.1 <0.056 1.1 <0.25 1.1 <0.50 1.1 <0.50 1.1 <0.100
4,4‟-DDD 1.1 <0.056 1.1 <0.25 1.1 <0.50 1.1 <0.50 1.1 <0.100
Dieldrin 4 <0.056 4 <0.25 4 <0.50 4 <0.50 4 <0.100
Alpha-endosulfan 3 T <0.059 3 T <0.25 3 T <0.50 3 T <0.50 3 T <0.100
Beta-endosulfan 3 T <0.065 3 T <0.25 3 T <0.50 3 T <0.50 3 T <0.100
Endosulfan sulfate 3 <0.068 3 <0.25 3 <0.50 3 <0.50 3 <0.100
Endrin 0.7 <0.078 0.7 <0.30 0.7 <0.60 0.7 <0.60 0.7 <0.120
Endrin aldehyde 0.7 <0.098 0.7 <0.25 0.7 1.3 0.7 <0.50 0.7 <0.100
Heptachlor 0.9 <0.057 0.9 <0.30 0.9 <0.60 0.9 <0.60 0.9 <0.120
Heptachlor epoxide 0.9 <0.057 0.9 <0.25 0.9 <0.50 0.9 <0.50 0.9 <0.100
PCB-1242 4
<0.57 4
<1.5 4 <3.0 4
<3.0 4 <0.600
PCB-1254 4 <0.52
4 <2.5
4 <5.0 4
<5.0 4 <1.00
PCB-1221 4 <2.0
4 <4.5
4 <9.0 4
<9.0 4 <1.80
PCB-1232 4 <1.1
4 <0.35
4 <0.70 4
<0.70 4 <0.140
PCB-1248 4 <0.64
4 <1.0
4 <2.0 4
<2.0 4 <0.400
PCB-1260 4 <0.29
4 <2.0
4 <4.0 4
<4.0 4 <0.800
PCB-1016 4 <0.39
4 <2.0
4 <4.0 4
<4.0 4 <0.800
Toxaphene 11 <1.2 933 11
<3.5 11 <7.0 11 <7.0 11 <1.40


Appendix B City of Phoenix MS4 Stormwater Permit
AZPDES Permit No. AZS000003 Page 47
NOTES: NS = no standard applicable to the designated use. T = Total D = Dissolved D
a = Result is assumed based upon a 1:1 ratio to total metals.
T&D = Total and Dissolved Bold text indicates a sample result greater than the SWQS Italicized text indicated a laboratory detection limit higher that the SWQS.
Footnotes 1 The Permittee shall report on any additional parameters that were monitored for seasonal stormwater sampling as required by Section 6.0 of this permit (Special Conditions). 2 Analytical results shall be reported in the units specified for each category or parameter. 3 Report the average flow rate for the sampling period (no more than 6 hours). 4 Standard for total PCBs of 11 μg/L A&We and 19 μg/L PBC.
5 SWQS value based on a maximum hardness of 400 mg/L. Actual hardness results were higher. 6 Results for cyanide were collected on 2/19/11 (SC046 on 2/27/11) due to missed hold time on previous samples. 7 The method blanks used by the laboratory contained the same concentration of Azobenzene as the outfall sample.
OUTFALL ID: SC046 RECEIVING WATER: Skunk Creek Wash DESIGNATED USES: A&We, PBC
MONITORING SEASONS Summer: June 1 – October 31 Winter: November 1 – May 31
Winter 2008-09
Summer
2009
Winter
2009-10
Summer
2010
Winter
2010-11
Summer
2011
Winter
2011-12
Summer
2012
Winter
2012-13
Summer
2013
Winter
2013-14
SAMPLING DATE(S): SWQS None SWQS 8/13/09 SWQS 12/7/09 SWQS 10/5/10 SWQS 12/22/10 SWQS SWQS SWQS SWQS SWQS SWQS
MONITORING PARAMETERS 1, 2
Conventional Parameters
Flow 3 (cfs) NS 0.736 NS 0.34 NS 2.46 NS 0.405
pH 6.5-9 7.27 6.5-9 7.99 6.5-9 7.55 6.5-9 7.25
Temperature Varies 29 Varies 11.5 Varies 22.0 Varies 13.0
Hardness (mg/L) 400 54 400 27 400 147 400 28
Total Dissolved Solids (TDS) (mg/L) 2 NS 120 NS 50 NS 95.0 NS 30.0
Total Suspended Solids (TSS) (mg/L) 2 NS 22 NS 10 NS 2,150 NS 89.0
Biochemical Oxygen Demand (BOD) (mg/L)
2
NS 34 NS 10 NS 19.7 NS 5.80
Chemical Oxygen Demand (COD) (mg/L)2 NS 200 NS 140 NS 160 NS 60.0
SC046 Winter
2008-09 Summer
2009 Winter
2009-10 Summer
2010 Winter
2010-11 Summer
2011 Winter
2011-12 Summer
2012 Winter
2012-13 Summer
2013 Winter
2013-14
Inorganics SWQS None SWQS 8/13/09 SWQS 12/7/09 SWQS 10/5/10 SWQS 12/22/10 SWQS SWQS SWQS SWQS SWQS SWQS
Cyanide, total (µg/L) 2 84 <5.0 84 <5.0 84 <5.0 84 <5.0
Nutrients (mg/L) 2
Nitrate + Nitrite as N 233 1 233 0.51 233 1.16 233 0.460
Ammonia as N NS 1.4 NS 0.51 NS 0.699 NS 0.285
Total Kjeldahl Nitrogen (TKN) NS 4.2 NS 1.1 NS 6.10 NS 1.00
Total Phosphorus as P NS 0.76 NS 0.25 NS 2.79 NS 0.241
Ortho-Phosphorus as P NS 0.18 NS 0.13 NS 0.227 NS 3.05
Microbiological
Escherichia coli (E. coli) (CFU/100 mg or MPN)
2
575 24,196 575 2,160 575 563 575 200

Appendix B City of Phoenix MS4 Stormwater Permit
AZPDES Permit No. AZS000003 Page 48
NOTES: NS = no standard applicable to the designated use. T = Total D = Dissolved D
a = Result is assumed based upon a 1:1 ratio to total metals.
T&D = Total and Dissolved Bold text indicates a sample result greater than the SWQS Italicized text indicated a laboratory detection limit higher that the SWQS.
Footnotes 1 The Permittee shall report on any additional parameters that were monitored for seasonal stormwater sampling as required by Section 6.0 of this permit (Special Conditions). 2 Analytical results shall be reported in the units specified for each category or parameter. 3 Report the average flow rate for the sampling period (no more than 6 hours). 4 Standard for total PCBs of 11 μg/L A&We and 19 μg/L PBC.
5 SWQS value based on a maximum hardness of 400 mg/L. Actual hardness results were higher. 6 Results for cyanide were collected on 2/19/11 (SC046 on 2/27/11) due to missed hold time on previous samples. 7 The method blanks used by the laboratory contained the same concentration of Azobenzene as the outfall sample.
SC046 Winter
2008-09 Summer
2009 Winter
2009-10 Summer
2010 Winter
2010-11 Summer
2011 Winter
2011-12 Summer
2012 Winter
2012-13 Summer
2013 Winter
2013-14
Total Metals (μg/L) 2 SWQS None SWQS 8/13/09 SWQS 12/7/09 SWQS 10/5/10 SWQS 12/22/10
Antimony 747 T <25 T 747 T <25 T&D 747 T 25 T&D 747 T <25 T&D
Arsenic 280 T 440 D
<10 T&D
280 T 440 D
<10 T&D
280 T 440 D
26 T <10 D
280 T 440 D
<10 T&D
Barium 98,000 T 29 T 98,000 T 16 T
<10 D 98,000 T
425 T 14 D
98,000 T 37 T
<10 D
Beryllium 1,867T <2.0 T 1,867T <2.0 T&D
1,867T <2
T&D 1,867T <2 T&D
Cadmium 700 T
12.52 D <3.0 T <3.0 D
700 T 6.37 D
<3.0 T&D
700 T 33.16 D
<3 T&D
700 T 6.60 D
<3 T&D
Chromium NS <10 T NS <10 T&D
NS 21 T
<10 D NS <10 T&D
Copper 1,300 T 13.02 D
16 T 10 D
1,300 T 6.77 D
<10 T <10 D
1,300 T 33.44 D
61 T <10 D
1,300 T 7.01 D
<10 T <10 D
Lead 15 T
69.26 D <10 T <10 D
15 T 31.95 D
<10 T&D
15 T 206.78 D
85 T <10 D
15 T 33.28 D
<10 T&D
Mercury 280 T
5 D
<0.2 T <0.2 D
280 T 5 D
<0.2 T&D
280 T 5 D
<0.20 T <0.2 D
280 T 5 D
<0.20 T&D
Nickel 28,000 T 2,469 D
<10 T <10 D
28,000 T 1,374 D
<10 T&D
28,000 T 5761 D
29 T <10 D
28,000 T 1416 D
<10 T&D
Selenium 33 T <2.0 T&D
33 T <2.0 T&D
33 T <2.00 T <2.00 D
33 T <2.00 T&D
Silver 4,667 T 1.11 D
<5 T <5 D
4,667 T 0.34 D
<5.0 T <5.0 D
4,667 T 6.24 D
<5 T <5 D
4,667 T 0.36 D
<5 T <5 D
Thallium 75 T <0.5 T 75 T <0.5 T&D
75 T <0.5 T&D
75 T
<0.5 T&D
Zinc 280,000 T
660 D
83 T 58 D
280,000 T 367 D
56 T <50 D
280,000 T 1541 D
543 T <50 D
280,000 T 378 D
134 T <50 D
SC046 Winter
2008-09 Summer
2009 Winter
2009-10 Summer
2010 Winter
2010-11 Summer
2011 Winter
2011-12 Summer
2012 Winter
2012-13 Summer
2013 Winter
2013-14
Organic Toxic Pollutants SWQS SWQS 8/13/09 SWQS 12/7/09 SWQS 10/5/10 SWQS 12/22/10 SWQS SWQS SWQS SWQS SWQS SWQS
Total Petroleum Hydrocarbons (TPH) (mg/L)
2
NS <5.0 NS <5.0 NS <5.00 NS <5.00
Total Oil and Grease (mg/L) 2 NS <5.0 NS <5.0 NS <5.00 NS <5.00
VOCs, Semi-VOCs, & Pesticides (μg/L)
2
Acrolein 467 <50 467 <50 467 <50.0 467 <50.0
Acrylonitrile 37,333 <5.0 37,333 <5.0 37,333 <5.00 37,333 <5.00
Benzene 3,733 <0.50 3,733 <0.50 3,733 <0.500 3,733 <0.500
Bromoform 18,667 <1.0 18,667 <1.0 18,667 <1.0 18,667 <1.00

Appendix B City of Phoenix MS4 Stormwater Permit
AZPDES Permit No. AZS000003 Page 49
NOTES: NS = no standard applicable to the designated use. T = Total D = Dissolved D
a = Result is assumed based upon a 1:1 ratio to total metals.
T&D = Total and Dissolved Bold text indicates a sample result greater than the SWQS Italicized text indicated a laboratory detection limit higher that the SWQS.
Footnotes 1 The Permittee shall report on any additional parameters that were monitored for seasonal stormwater sampling as required by Section 6.0 of this permit (Special Conditions). 2 Analytical results shall be reported in the units specified for each category or parameter. 3 Report the average flow rate for the sampling period (no more than 6 hours). 4 Standard for total PCBs of 11 μg/L A&We and 19 μg/L PBC.
5 SWQS value based on a maximum hardness of 400 mg/L. Actual hardness results were higher. 6 Results for cyanide were collected on 2/19/11 (SC046 on 2/27/11) due to missed hold time on previous samples. 7 The method blanks used by the laboratory contained the same concentration of Azobenzene as the outfall sample.
SC046 Winter
2008-09 Summer
2009 Winter
2009-10 Summer
2010 Winter
2010-11 Summer
2011 Winter
2011-12 Summer
2012 Winter
2012-13 Summer
2013 Winter
2013-14
Carbon tetrachloride 1,307 <0.50 1,307 <0.50 1,307 <0.500 1,307 <0.500
Chlorobenzene 18,667 <0.50 18,667 <0.50 18,667 <0.500 18,667 <0.500
Chlorodibromomethane 18,667 <0.50 18,667 <0.50 18,667 <0.500 18,667 <0.500
Chloroethane (ethyl chloride) NS <5.0 NS <5.0 NS <5.00 NS <5.00
2-chloroethylvinyl ether NS <2.0 NS <2.0 NS <2.00 NS <2.00
Chloroform 9,333 <0.50 9,333 <0.50 9,333 <0.500 9,333 <0.500
Dichlorobromomethane 18,667 <0.50 18,667 <0.50 18,667 <0.500 18,667 <0.500
1,1-dichloroethane NS <1.0 NS <1.0 NS <1.00 NS <1.00
1,2-dichloroethane 186,667 <1.0 186,667 <1.0 186,667 <1.00 186,667 <1.00
1,1-dichloroethylene 46,667 <1.0 46,667 <1.0 46,667 <1.00 46,667 <1.00
1,2-dichloropropane 84,000 <0.50 84,000 <0.50 84,000 <0.500 84,000 <0.500
1,3-dichloropropylene 28,000 <1.0 28,000 <1.0 28,000 <1.00 28,000 <1.00
Ethylbenzene 93,333 <2.0 93,333 <2.0 93,333 <2.00 93,333 <2.00
Methyl bromide 1,307 <5.0 1,307 <5.0 1,307 <5.00 1,307 <5.00
Methyl chloride NS <5.0 NS <5.0 NS <5.00 NS <5.00
Methylene chloride 56,000 <3.0 56,000 <3.0 56,000 <3.00 56,000 <3.00
1,1,2,2-tetrachloroethane 93,333 <0.50 93,333 <0.50 93,333 <0.500 93,333 <0.500
Tetrachloroethylene 9,333 <0.50 9,333 <0.50 9,333 <0.500 9,333 <0.500
Toluene 373,333 <3.0 373,333 <3.0 373,333 <3.00 373,333 <3.00
1,2-trans-dichloroethylene 18,667 <0.50 18,667 <0.50 18,667 <0.500 18,667 <0.500
1,1,1-trichloroethane 1.867x
10+6
<0.50
1.867x 10
+6
<0.50 1.867x
10+6
<0.500
1.867x 10
+6
<0.500
1,1,2-trichloroethane 3,733 <0.50 3,733 <0.50 3,733 <0.500 3,733 <0.500
Trichloroethylene 280 <0.50 280 <0.50 280 <0.500 280 <0.500
Trimethylbenzene NS <1.5 NS <1.5 NS 1,2,4 <2.00 1,3,5 <1.50
NS <2.00 <1.50
Vinyl chloride 2,800 <0.50 2,800 <0.50 2,800 <0.500 2,800 <0.500
Xylenes, Total 186,667 <3.0 186,667 <3.0 186,667 <1.00 186,667 <1.00
Acid Compounds (μg/L) 2
2-chlorophenol 4,667 <12 4,667 <4.9 4,667 <2.46 4,667 <2.46
2,4-dichlorophenol 2,800 <6.9 2,800 <2.8 2,800 <1.38 2,800 <1.38
2,4-dimethylphenol 18,667 <15 18,667 <5.9 18,667 3.02 18,667 <2.93
4,6-dinitro-o-cresol 3,733 <14 3,733 <5.4 3,733 <2.71 3,733 <2.71
2,4-dinitrophenol 1,867 <10 1,867 <4.1 1,867 <2.04 1,867 <2.04
2-nitrophenol NS <7.3 NS <2.9 NS <1.46 NS <1.46
4-nitrophenol NS <2.1 NS <0.8 NS 0.480 NS <0.423
p-chloro-m-cresol 48,000 <6.2 48,000 <2.5 48,000 <1.25 48,000 <1.25
Pentachlorophenol 49.69 <15 100.42 <6.0 63.970 <2.98 47.319 <2.98
Phenol 180,000 <3.5 180,000 <1.4 180,000 <0.695 180,000 <0.695
2,4,6-trichlorophenol 130 <7.5 130 <3.0 130 <1.50 130 <1.50

Appendix B City of Phoenix MS4 Stormwater Permit
AZPDES Permit No. AZS000003 Page 50
NOTES: NS = no standard applicable to the designated use. T = Total D = Dissolved D
a = Result is assumed based upon a 1:1 ratio to total metals.
T&D = Total and Dissolved Bold text indicates a sample result greater than the SWQS Italicized text indicated a laboratory detection limit higher that the SWQS.
Footnotes 1 The Permittee shall report on any additional parameters that were monitored for seasonal stormwater sampling as required by Section 6.0 of this permit (Special Conditions). 2 Analytical results shall be reported in the units specified for each category or parameter. 3 Report the average flow rate for the sampling period (no more than 6 hours). 4 Standard for total PCBs of 11 μg/L A&We and 19 μg/L PBC.
5 SWQS value based on a maximum hardness of 400 mg/L. Actual hardness results were higher. 6 Results for cyanide were collected on 2/19/11 (SC046 on 2/27/11) due to missed hold time on previous samples. 7 The method blanks used by the laboratory contained the same concentration of Azobenzene as the outfall sample.
SC046 Winter
2008-09 Summer
2009 Winter
2009-10 Summer
2010 Winter
2010-11 Summer
2011 Winter
2011-12 Summer
2012 Winter
2012-13 Summer
2013 Winter
2013-14
Bases/Neutrals (μg/L) 2 SWQS None SWQS 8/13/09 SWQS 12/7/09 SWQS 10/5/10 SWQS 12/22/10
Acenaphthene 56,000 <3.5 56,000 <1.4 56,000 <0.704 56,000 <0.704
Acenaphthylene NS <14 NS <5.5 NS <2.77 NS <2.77
Anthracene 280,000 <3.5 280,000 <1.4 280,000 <0.700 280,000 <0.700
Benz(a)anthracene 0.2 <3.9 0.2 <1.5 0.2 <0.772 0.2 <0.772
Benzo(a)pyrene 0.2 <3.7 0.2 <1.5 0.2 <0.743 0.2 <0.743
Benzo(b)fluoranthene NS <3.7 NS <1.5 NS <0.747 NS <0.747
Benzo(g,h,i)perylene NS <3.8 NS <1.5 NS <0.770 NS <0.770
Benzo(k)fluoranthene 1.9 <3.9 1.9 <1.6 1.9 <0.779 1.9 <0.779
Chrysene 19 <4.0 19 <1.6 19 <0.800 19 <0.800
Dibenz(a,h)anthracene 1.9 <3.7 1.9 <1.5 1.9 <0.743 1.9 <0.743
1,2-dichlorobenzene 5,900 <13 5,900 <5.4 5,900 <2.70 5,900 <2.70
1,3-dichlorobenzene NS <12 NS <4.8 NS <2.39 NS <2.39
1,4-dichlorobenzene 6,500 <14 6,500 <5.5 6,500 <2.73 6,500 <2.73
3,3-dichlorobenzidine 3 <16 3 <6.3 3 <3.17 3 <3.17
Diethyl phthalate 746,667 <3.9 746,667 <1.6 746,667 <0.777 746,667 <0.777
Dimethyl phthalate NS <3.9 NS <1.6 NS <0.788 NS <0.788
Di-n-butyl phthalate 1,100 <5.1 1,100 <2.0 1,100 <1.03 1,100 <1.03
2,4-dinitrotoluene 1,867 <15 1,867 <6.0 1,867 <3.00 1,867 <3.00
2,6-dinitrotoluene 3,733 <3.8 3,733 <1.5 3,733 <0.753 3,733 <0.753
Di-n-octyl phthalate 373,333 <6.7 373,333 <2.7 373,333 <1.35 373,333 <1.35
1,2-diphenylhydrazine (as azobenzene) 1.8 <3.6 1.8 <1.4 1.8 1.827 1.8 <0.714
Fluoranthene 37,333 <4.2 37,333 <1.7 37,333 <0.841 37,333 <0.841
Fluorene 37,333 <3.6 37,333 <1.4 37,333 <0.711 37,333 <0.711
Hexachlorobenzene 747 <2.9 747 <1.1 747 <0.575 747 <0.575
Hexachlorobutadiene 187 <15 187 <5.9 187 <2.94 187 <2.94
Hexachlorocyclopentadiene 11,200 <16 11,200 <6.2 11,200 <3.10 11,200 <3.10
Hexachloroethane 850 <15 850 <6.0 850 <3.00 850 <3.00
Indeno(1,2,3-cd)pyrene 1.9 <3.8 1.9 <1.5 1.9 <0.768 1.9 <0.768
Isophorone 186,667 <3.5 186,667 <1.4 186,667 <0.706 186,667 <0.706
Naphthalene 18,667 <12 18,667 <5.0 18,667 <2.48 18,667 <2.48
Nitrobenzene 467 <3.6 467 <1.4 467 <0.718 467 <0.718
N-nitrosodimethylamine 0.03 <11 0.03 <4.4 0.03 <2.18 0.03 <2.18
N-nitrosodi-n-propylamine 88,667 <3.6 88,667 <1.5 88,667 <0.725 88,667 <0.725
N-nitrosodiphenylamine 290 <16 290 <6.5 290 <3.24 290 <3.24
Phenanthrene NS <3.6 NS <1.4 NS <0.711 NS <0.711
Pyrene 28,000 <4.2 28,000 <1.7 28,000 <0.835 28,000 <0.835
1,2,4-trichlorobenzene 9,333 <13 9,333 <5.3 9,333 <2.64 9,333 <2.64

Appendix B City of Phoenix MS4 Stormwater Permit
AZPDES Permit No. AZS000003 Page 51
NOTES: NS = no standard applicable to the designated use. T = Total D = Dissolved D
a = Result is assumed based upon a 1:1 ratio to total metals.
T&D = Total and Dissolved Bold text indicates a sample result greater than the SWQS Italicized text indicated a laboratory detection limit higher that the SWQS.
Footnotes 1 The Permittee shall report on any additional parameters that were monitored for seasonal stormwater sampling as required by Section 6.0 of this permit (Special Conditions). 2 Analytical results shall be reported in the units specified for each category or parameter. 3 Report the average flow rate for the sampling period (no more than 6 hours). 4 Standard for total PCBs of 11 μg/L A&We and 19 μg/L PBC.
5 SWQS value based on a maximum hardness of 400 mg/L. Actual hardness results were higher. 6 Results for cyanide were collected on 2/19/11 (SC046 on 2/27/11) due to missed hold time on previous samples. 7 The method blanks used by the laboratory contained the same concentration of Azobenzene as the outfall sample.
SC046 Winter
2008-09 Summer
2009 Winter
2009-10 Summer
2010 Winter
2010-11 Summer
2011 Winter
2011-12 Summer
2012 Winter
2012-13 Summer
2013 Winter
2013-14
Pesticides (μg/L) 2 SWQS None SWQS 8/13/09 SWQS 12/7/09 SWQS 10/5/10 SWQS 12/22/10
Aldrin 4.5 <0.30 4.5 <0.60 4.5 <0.600 4.5 <0.060
Alpha-BHC 1,600 <0.25 1,600 <0.50 1,600 <0.500 1,600 <0.050
Beta-BHC 560 <0.25 560 <0.50 560 <0.500 560 <0.050
Gamma-BHC 11 <0.25 11 <0.50 11 <0.500 11 <0.050
Delta-BHC 1,600 <0.25 1,600 <0.50 1,600 <0.500 1,600 <0.050
Chlordane 3.2 <3.5 3.2 <7.0 3.2 <7.00 3.2 <0.700
4,4‟-DDT 1.1 <0.30 1.1 <0.60 1.1 <0.600 1.1 <0.060
4,4‟-DDE 1.1 <0.25 1.1 <0.50 1.1 <0.500 1.1 <0.050
4,4‟-DDD 1.1 <0.25 1.1 <0.50 1.1 <0.500 1.1 <0.050
Dieldrin 4 <0.25 4 <0.50 4 <0.500 4 <0.050
Alpha-endosulfan 3 T <0.25 3 T <0.50 3 T <0.500 3 T <0.050
Beta-endosulfan 3 T <0.25 3 T <0.50 3 T <0.500 3 T <0.050
Endosulfan sulfate 3 <0.25 3 <0.50 3 <0.500 3 <0.050
Endrin 0.7 <0.30 0.7 <0.60 0.7 <0.600 0.7 <0.060
Endrin aldehyde 0.7 <0.25 0.7 <0.50 0.7 <0.500 0.7 <0.050
Heptachlor 0.9 <0.30 0.9 <0.60 0.9 <0.600 0.9 <0.060
Heptachlor epoxide 0.9 <0.25 0.9 <0.50 0.9 <0.500 0.9 <0.050
PCB-1242 4 <1.5
4 <3.0 4 <3.00
4 <0.300
PCB-1254 4 <2.5
4 <5.0 4 <5.00
4 <0.500
PCB-1221 4 <4.5
4 <9.0 4 <9.00
4 <0.900
PCB-1232 4 <0.35
4 <0.70 4 <0.700
4 <0.070
PCB-1248 4 <1.0
4 <2.0 4 <2.00
4 <0.200
PCB-1260 4 <2.0
4 <4.0 4 <4.00
4 <0.400
PCB-1016 4
<2.0 4 <4.0
4 <4.00 4 <0.400
Toxaphene 11 <3.5 11 <7.0 11 <7.00 11 <0.700


Appendix B City of Phoenix MS4 Stormwater Permit
AZPDES Permit No. AZS000003 Page 53
NOTES: NS = no standard applicable to the designated use. T = Total D = Dissolved D
a = Result is assumed based upon a 1:1 ratio to total metals.
T&D = Total and Dissolved Bold text indicates a sample result greater than the SWQS Italicized text indicated a laboratory detection limit higher that the SWQS.
Footnotes 1 The Permittee shall report on any additional parameters that were monitored for seasonal stormwater sampling as required by Section 6.0 of this permit (Special Conditions). 2 Analytical results shall be reported in the units specified for each category or parameter. 3 Report the average flow rate for the sampling period (no more than 6 hours). 4 Standard for total PCBs of 11 μg/L A&We and 19 μg/L PBC.
5 SWQS value based on a maximum hardness of 400 mg/L. Actual hardness results were higher. 6 Results for cyanide were collected on 2/19/11 (SC046 on 2/27/11) due to missed hold time on previous samples. 7 The method blanks used by the laboratory contained the same concentration of Azobenzene as the outfall sample.
OUTFALL ID: AC33 RECEIVING WATER: Arizona Canal Diversion Canal DESIGNATED USES: AgI, AgL
MONITORING SEASONS Summer: June 1 – October 31 Winter: November 1 – May 31
Winter 2008-09
Summer
2009
Winter
2009-10
Summer
2010
Winter
2010-11
Summer
2011
Winter
2011-12
Summer
2012
Winter
2012-13
Summer
2013
Winter
2013-14
SAMPLING DATE(S): NS SWQS 8/13/09 SWQS 12/7/09 SWQS 8/28/10 SWQS 12/23/10 SWQS SWQS SWQS SWQS SWQS SWQS
MONITORING PARAMETERS 1, 2
Conventional Parameters
Flow 3 (cfs) NS 2.36 NS 1.13 NS 4.95 NS 0.993
pH 4.5-9.0 7.56 4.5-9.0 7.85 4.5-9.0 8.50 4.5-9.0 8.02
Temperature Varies 28 Varies 13 Varies 29.5 Varies 13.5
Hardness (mg/L) 400 100 400 85 400 133 400 30.1
Total Dissolved Solids (TDS) (mg/L) 2 NS 170 NS 76 NS 77.0 NS 45.0
Total Suspended Solids (TSS) (mg/L) 2 NS 400 NS 440 NS 812 NS 84.0
Biochemical Oxygen Demand (BOD) (mg/L)
2
NS 19 NS 49 NS 16.5 NS 9.50
Chemical Oxygen Demand (COD) (mg/L)
2
NS 280 NS 470 NS 140 NS 106
AC33 Winter
2008-09 Summer
2009 Winter
2009-10 Summer
2010
Winter 2010-11
Summer 2011
Winter 2011-12
Summer 2012
Winter 2012-13
Summer 2013
Winter 2013-14
Inorganics SWQS NS SWQS 8/13/09 SWQS 12/7/09 SWQS 8/28/10 SWQS 12/22/10 SWQS SWQS SWQS SWQS SWQS SWQS
Cyanide, total (µg/L) 2 200 T <5.0 200 T <5.0 200 T <5.0 200 T <5.0
Nutrients (mg/L) 2
Nitrate + Nitrite as N NS 1.1 NS 0.71 NS 1.14 NS 0.583
Ammonia as N NS 0.96 NS 1.2 NS 0.890 NS 0.459
Total Kjeldahl Nitrogen (TKN) NS 5.4 NS 4.2 NS 4.50 NS 1.41
Total Phosphorus as P NS 1.3 NS 1.4 NS 1.21 NS 0.310
Ortho-Phosphorus as P NS 0.32 NS 0.29 NS 0.229 NS 0.158
Microbiological
Escherichia coli (E. coli) (CFU/100 mg or MPN/100 mL)
2
575 410 575 1,870 575 5210 575 38,730

Appendix B City of Phoenix MS4 Stormwater Permit
AZPDES Permit No. AZS000003 Page 54
NOTES: NS = no standard applicable to the designated use. T = Total D = Dissolved D
a = Result is assumed based upon a 1:1 ratio to total metals.
T&D = Total and Dissolved Bold text indicates a sample result greater than the SWQS Italicized text indicated a laboratory detection limit higher that the SWQS.
Footnotes 1 The Permittee shall report on any additional parameters that were monitored for seasonal stormwater sampling as required by Section 6.0 of this permit (Special Conditions). 2 Analytical results shall be reported in the units specified for each category or parameter. 3 Report the average flow rate for the sampling period (no more than 6 hours). 4 Standard for total PCBs of 11 μg/L A&We and 19 μg/L PBC.
5 SWQS value based on a maximum hardness of 400 mg/L. Actual hardness results were higher. 6 Results for cyanide were collected on 2/19/11 (SC046 on 2/27/11) due to missed hold time on previous samples. 7 The method blanks used by the laboratory contained the same concentration of Azobenzene as the outfall sample.
AC33 Winter
2008-09 Summer
2009 Winter
2009-10 Summer
2010
Winter 2010-11
Summer 2011
Winter 2011-12
Summer 2012
Winter 2012-13
Summer 2013
Winter 2013-14
Total Metals (μg/L) 2 SWQS NS SWQS 8/13/09 SWQS 12/7/09 SWQS 8/28/10 SWQS 12/22/10
Antimony
NS <25 T&D
NS <25 T&D
NS <25 T&D
NS <25 T&D
Arsenic
200 T 12 T
<10 D 200 T
<10 T&D
200 T <10 T&D
200 T <10 T&D
Barium
NS 160 T 26 D
NS 210 T 13 D
NS 265 T 15 D
NS 42 T
<10 D
Beryllium
NS <2.0 T&D
NS <2.0 T&D
NS <2
T&D NS
<2 T&D
Cadmium
50 <3.0 T&D
50 <3.0 T&D
50 <3
T&D 50
<3 T&D
Chromium NS CrIII
CrVI 1,000 T
16 T <10 D
NS CrIII CrVI
1,000 T
18 T <10 D
NS CrIII CrVI
1,000 T
30 T <10 D
NS CrIII CrVI
1,000 T
<10 T <10 D
Copper
500 T 86 T 23 D
500 T 96 T 13 D
500 T 94 T
<10 D 500 T
22 T <10 D
Lead
100 T 95 T
<10 D 100 T
78 T <10 D
100 T 164 T <10 D
100 T 17 T
<10 D
Mercury
10 T <0.2 T&D
10 T <0.2 T&D
10 T <0.20 T&D
10 T <0.20 T&D
Nickel
NS 19 T
<10 D NS
19 T <10 D
NS 29 T
<10 D NS
<10 T&D
Selenium
20 T <2.0 T&D
20 T <2.0 T&D
20 T <2.00 T&D
20 T <2.00 T&D
Silver
NS <5.0 T&D
NS <5.0 T&D
NS <5
T&D NS
<5 T&D
Thallium
NS <0.5 T&D
NS <0.5 T <1.0 D
NS <0.5 T <1 D
NS <0.5 T&D
Zinc
10,000 T 410 T 63 D
10,000 T 530 T <50 D
10,000 T 452 T <50 D
10,000 T 145 T <50 D
AC33 Winter
2008-09 Summer
2009 Winter
2009-10 Summer
2010 Winter
2010-11 Summer
2011 Winter
2011-12 Summer
2012 Winter
2012-13 Summer
2013 Winter
2013-14
Organic Toxic Pollutants SWQS NS SWQS 8/13/09 SWQS 12/7/09 SWQS 8/28/10 SWQS 12/22/10 SWQS SWQS SWQS SWQS SWQS SWQS
Total Petroleum Hydrocarbons (TPH) (mg/L)
2
NS <5.0 NS <5.0 NS <5.00 NS <5.00
Total Oil and Grease (mg/L) 2 NS <5.0 NS <5.0 NS <5.00 NS <5.00
VOCs, Semi-VOCs, & Pesticides (μg/L)
2
Acrolein NS <50 NS <50 NS <50.0 NS <50.0
Acrylonitrile NS <5.0 NS <5.0 NS <1.00 NS <5.00
Benzene NS <0.50 NS <0.50 NS <0.500 NS <0.500
Bromoform NS <1.0 NS <1.0 NS <1.00 NS <1.00

Appendix B City of Phoenix MS4 Stormwater Permit
AZPDES Permit No. AZS000003 Page 55
NOTES: NS = no standard applicable to the designated use. T = Total D = Dissolved D
a = Result is assumed based upon a 1:1 ratio to total metals.
T&D = Total and Dissolved Bold text indicates a sample result greater than the SWQS Italicized text indicated a laboratory detection limit higher that the SWQS.
Footnotes 1 The Permittee shall report on any additional parameters that were monitored for seasonal stormwater sampling as required by Section 6.0 of this permit (Special Conditions). 2 Analytical results shall be reported in the units specified for each category or parameter. 3 Report the average flow rate for the sampling period (no more than 6 hours). 4 Standard for total PCBs of 11 μg/L A&We and 19 μg/L PBC.
5 SWQS value based on a maximum hardness of 400 mg/L. Actual hardness results were higher. 6 Results for cyanide were collected on 2/19/11 (SC046 on 2/27/11) due to missed hold time on previous samples. 7 The method blanks used by the laboratory contained the same concentration of Azobenzene as the outfall sample.
AC33 Winter
2008-09 Summer
2009 Winter
2009-10 Summer
2010 Winter
2010-11 Summer
2011 Winter
2011-12 Summer
2012 Winter
2012-13 Summer
2013 Winter
2013-14
Carbon tetrachloride NS <0.50 NS <0.50 NS <0.500 NS <0.500
Chlorobenzene NS <0.50 NS <0.50 NS <0.500 NS <0.500
Chlorodibromomethane NS <0.50 NS <0.50 NS <0.500 NS <0.500
Chloroethane (ethyl chloride) NS <5.0 NS <5.0 NS <5.00 NS <5.00
2-chloroethylvinyl ether NS <2.0 NS <2.0 NS <5.00 NS <2.00
Chloroform NS <0.50 NS <0.50 NS <0.500 NS <0.500
Dichlorobromomethane NS <0.50 NS <0.50 NS <0.500 NS <0.500
1,1-dichloroethane NS <1.0 NS <1.0 NS <1.00 NS <1.00
1,2-dichloroethane NS <1.0 NS <1.0 NS <1.00 NS <1.00
1,1-dichloroethylene NS <1.0 NS <1.0 NS <1.00 NS <1.00
1,2-dichloropropane NS <0.50 NS <0.50 NS <0.500 NS <0.500
1,3-dichloropropylene NS <1.0 NS <1.0 NS <1.00 NS <1.00
Ethylbenzene NS <2.0 NS <2.0 NS <2.00 NS <2.00
Methyl bromide NS <5.0 NS <5.0 NS <5.00 NS <5.00
Methyl chloride NS <5.0 NS <5.0 NS <5.00 NS <5.00
Methylene chloride NS <3.0 NS <3.0 NS <3.00 NS <3.00
1,1,2,2-tetrachloroethane NS <0.50 NS <0.50 NS <0.500 NS <0.500
Tetrachloroethylene NS <0.50 NS <0.50 NS <0.500 NS <0.500
Toluene NS <3.0 NS <3.0 NS <3.00 NS <3.00
1,2-trans-dichloroethylene NS <0.50 NS <0.50 NS <0.500 NS <0.500
1,1,1-trichloroethane 1000 <0.50 1000 <0.50 1000 <0.500 1000 <0.500
1,1,2-trichloroethane NS <0.50 NS <0.50 NS <0.500 NS <0.500
Trichloroethylene NS <0.50 NS <0.50 NS <0.500 NS <0.500
1,2,4-Trimethylbenzene 1,3,5-Trimethylbenzene
NS <2.0 <1.5
NS <2.0 <1.5
NS <2.00 <1.50
NS <2.00 >1.50
Vinyl chloride NS <0.50 NS <0.50 NS <0.500 NS <0.500
Xylenes, Total NS <3.0 NS <3.0 NS <1.00 NS <1.00
Acid Compounds (μg/L) 2
2-chlorophenol NS <4.9 NS <4.9 NS <36.7 NS <2.46
2,4-dichlorophenol NS <2.8 NS <2.8 NS <20.6 NS <1.38
2,4-dimethylphenol NS <5.9 NS <5.9 NS <43.7 NS <2.93
4,6-dinitro-o-cresol NS <5.4 NS <5.4 NS <40.4 NS <2.71
2,4-dinitrophenol NS <4.1 NS <4.1 NS <30.4 NS <2.04
2-nitrophenol NS <2.9 NS <2.9 NS <21.8 NS <1.46
4-nitrophenol NS <0.8 NS <0.8 NS 9.25 NS <0.423
p-chloro-m-cresol NS <2.5 NS <2.5 NS <18.6 NS <1.25
Pentachlorophenol NS <6.0 NS <6.0 NS <44.5 NS <2.98
Phenol NS <1.4 NS <1.4 NS <10.4 NS <0.695
2,4,6-trichlorophenol NS <3.0 NS <3.0 NS <22.4 NS <1.50

Appendix B City of Phoenix MS4 Stormwater Permit
AZPDES Permit No. AZS000003 Page 56
NOTES: NS = no standard applicable to the designated use. T = Total D = Dissolved D
a = Result is assumed based upon a 1:1 ratio to total metals.
T&D = Total and Dissolved Bold text indicates a sample result greater than the SWQS Italicized text indicated a laboratory detection limit higher that the SWQS.
Footnotes 1 The Permittee shall report on any additional parameters that were monitored for seasonal stormwater sampling as required by Section 6.0 of this permit (Special Conditions). 2 Analytical results shall be reported in the units specified for each category or parameter. 3 Report the average flow rate for the sampling period (no more than 6 hours). 4 Standard for total PCBs of 11 μg/L A&We and 19 μg/L PBC.
5 SWQS value based on a maximum hardness of 400 mg/L. Actual hardness results were higher. 6 Results for cyanide were collected on 2/19/11 (SC046 on 2/27/11) due to missed hold time on previous samples. 7 The method blanks used by the laboratory contained the same concentration of Azobenzene as the outfall sample.
AC33 Winter
2008-09 Summer
2009 Winter
2009-10 Summer
2010 Winter
2010-11 Summer
2011 Winter
2011-12 Summer
2012 Winter
2012-13 Summer
2013 Winter
2013-14
Bases/Neutrals (μg/L) 2
Acenaphthene NS <1.4 NS <1.4 NS <10.5 NS <0.704
Acenaphthylene NS <5.5 NS <5.5 NS <41.3 NS <2.77
Anthracene NS <1.4 NS <1.4 NS <10.4 NS <0.700
Benz(a)anthracene NS <1.5 NS <1.5 NS <11.5 NS <0.772
Benzo(a)pyrene NS <1.5 NS <1.5 NS <11.1 NS <0.743
Benzo(b)fluoranthene NS <1.5 NS <1.5 NS <11.1 NS <0.747
Benzo(g,h,i)perylene NS <1.5 NS <1.5 NS <11.5 NS <0.770
Benzo(k)fluoranthene NS <1.6 NS <1.6 NS <11.6 NS <0.779
Chrysene NS <1.6 NS <1.6 NS <11.9 NS <0.800
Dibenzo(a,h)anthracene NS <1.5 NS <1.5 NS <11.1 NS <0.743
1,2-dichlorobenzene NS <5.4 NS <5.4 NS <40.3 NS <2.70
1,3-dichlorobenzene NS <4.8 NS <4.8 NS <35.7 NS <2.39
1,4-dichlorobenzene NS <5.5 NS <5.5 NS <40.8 NS <2.73
3,3-dichlorobenzidine NS <6.3 NS <6.3 NS <47.3 NS <3.17
Diethyl phthalate NS <1.6 NS <1.6 NS <11.6 NS <0.777
Dimethyl phthalate NS <1.6 NS <1.6 NS <11.8 NS <0.788
Di-n-butyl phthalate NS <2.6 NS <2.0 NS <15.3 NS <1.03
2,4-dinitrotoluene NS <6.0 NS <6.0 NS <44.8 NS <3.00
2,6-dinitrotoluene NS <1.5 NS <1.5 NS <11.2 NS <0.753
Di-n-octyl phthalate NS <2.7 NS <2.7 NS <20.1 NS <1.35
1,2-diphenylhydrazine (as azobenzene) NS <1.4 NS <1.4 NS <10.7 NS <0.714
Fluoranthene NS <1.7 NS <1.7 NS <12.6 NS <0.841
Fluorene NS <1.4 NS <1.4 NS <10.6 NS <0.711
Hexachlorobenzene NS <1.1 NS <1.1 NS <8.58 NS <0.575
Hexachlorobutadiene NS <5.9 NS <5.9 NS <43.9 NS <2.94
Hexachlorocyclopentadiene NS <6.2 NS <6.2 NS <46.3 NS <3.10
Hexachloroethane NS <6.0 NS <6.0 NS <44.8 NS <3.00
Indeno(1,2,3-cd)pyrene NS <1.5 NS <1.5 NS <11.5 NS <0.768
Isophorone NS <1.4 NS <1.4 NS <10.5 NS <0.706
Naphthalene NS <5.0 NS <5.0 NS <37.0 NS <2.48
Nitrobenzene NS <1.4 NS <1.4 NS <10.7 NS <0.718
N-nitrosodimethylamine NS <4.4 NS <4.4 NS <32.5 NS <2.18
N-nitrosodi-n-propylamine NS <1.5 NS <1.5 NS <10.8 NS <0.725
N-nitrosodiphenylamine NS <6.5 NS <6.5 NS <48.4 NS <3.24
Phenanthrene NS <1.4 NS <1.4 NS <10.6 NS <0.711
Pyrene NS <1.7 NS <1.7 NS <12.5 NS <0.835
1,2,4-trichlorobenzene NS <5.3 NS <5.3 NS <39.4 NS <2.64

Appendix B City of Phoenix MS4 Stormwater Permit
AZPDES Permit No. AZS000003 Page 57
NOTES: NS = no standard applicable to the designated use. T = Total D = Dissolved D
a = Result is assumed based upon a 1:1 ratio to total metals.
T&D = Total and Dissolved Bold text indicates a sample result greater than the SWQS Italicized text indicated a laboratory detection limit higher that the SWQS.
Footnotes 1 The Permittee shall report on any additional parameters that were monitored for seasonal stormwater sampling as required by Section 6.0 of this permit (Special Conditions). 2 Analytical results shall be reported in the units specified for each category or parameter. 3 Report the average flow rate for the sampling period (no more than 6 hours). 4 Standard for total PCBs of 11 μg/L A&We and 19 μg/L PBC.
5 SWQS value based on a maximum hardness of 400 mg/L. Actual hardness results were higher. 6 Results for cyanide were collected on 2/19/11 (SC046 on 2/27/11) due to missed hold time on previous samples. 7 The method blanks used by the laboratory contained the same concentration of Azobenzene as the outfall sample.
AC33 Winter
2008-09 Summer
2009 Winter
2009-10 Summer
2010 Winter
2010-11 Summer
2011 Winter
2011-12 Summer
2012 Winter
2012-13 Summer
2013 Winter
2013-14
Pesticides (μg/L) 2 SWQS NS SWQS 8/13/09 SWQS 12/7/09 SWQS 8/28/10 SWQS 12/22/10 SWQS SWQS SWQS SWQS SWQS SWQS
Aldrin 0.003 <0.30 0.003 <1.2 0.003 <0.060 0.003 <0.120
Alpha-BHC NS <0.25 NS <1.0 NS <0.050 NS <0.100
Beta-BHC NS <0.25 NS <1.0 NS <0.050 NS <0.100
Gamma-BHC NS <0.25 NS <1.0 NS <0.050 NS <0.100
Delta-BHC NS <0.25 NS <1.0 NS <0.050 NS <0.100
Chlordane NS <3.5 NS <14 NS <0.700 NS <1.40
4,4‟-DDT 0.001 <0.30 0.001 <1.2 0.001 <0.060 0.001 <0.120
4,4‟-DDE 0.001 <0.25 0.001 <1.0 0.001 <0.050 0.001 <0.100
4,4‟-DDD 0.001 <0.25 0.001 <1.0 0.001 <0.050 0.001 <0.100
Dieldrin 0.003 <0.25 0.003 <1.0 0.003 <0.050 0.003 <0.100
Alpha-endosulfan NS <0.25 NS <1.0 NS <0.050 NS <0.100
Beta-endosulfan NS <0.25 NS <1.0 NS <0.050 NS <0.100
Endosulfan sulfate NS <0.25 NS <1.0 NS <0.050 NS <0.100
Endrin 0.004 <0.30 0.004 <1.2 0.004 >0.060 0.004 <0.120
Endrin aldehyde NS <0.25 NS <1.0 NS <0.050 NS <0.100
Heptachlor NS <0.30 NS <1.2 NS <0.060 NS <0.120
Heptachlor epoxide NS <0.25 NS <1.0 NS <0.050 NS <0.100
PCB-1242 0.001 <1.5 0.001 <6.0 0.001 <0.300 0.001 <0.600
PCB-1254 0.001 <2.5 0.001 <10 0.001 <0.500 0.001 <1.00
PCB-1221 0.001 <4.5 0.001 <18 0.001 <0.900 0.001 <1.80
PCB-1232 0.001 <0.35 0.001 <1.4 0.001 <0.070 0.001 <0.140
PCB-1248 0.001 <1.0 0.001 <4.0 0.001 <0.200 0.001 <0.400
PCB-1260 0.001 <2.0 0.001 <8.0 0.001 <0.400 0.001 <0.800
PCB-1016 0.001 <2.0 0.001 <8.0 0.001 <0.400 0.001 <0.800
Toxaphene 0.005 <3.5 0.005 <14 0.005 <0.700 0.005 <1.40


Appendix B City of Phoenix MS4 Stormwater Permit
AZPDES Permit No. AZS000003 Page 59
NOTES: NS = no standard applicable to the designated use. T = Total D = Dissolved D
a = Result is assumed based upon a 1:1 ratio to total metals.
T&D = Total and Dissolved Bold text indicates a sample result greater than the SWQS Italicized text indicated a laboratory detection limit higher that the SWQS.
Footnotes 1 The Permittee shall report on any additional parameters that were monitored for seasonal stormwater sampling as required by Section 6.0 of this permit (Special Conditions). 2 Analytical results shall be reported in the units specified for each category or parameter. 3 Report the average flow rate for the sampling period (no more than 6 hours). 4 Standard for total PCBs of 11 μg/L A&We and 19 μg/L PBC.
5 SWQS value based on a maximum hardness of 400 mg/L. Actual hardness results were higher. 6 Results for cyanide were collected on 2/19/11 (SC046 on 2/27/11) due to missed hold time on previous samples. 7 The method blanks used by the laboratory contained the same concentration of Azobenzene as the outfall sample.
OUTFALL ID: SR03 RECEIVING WATER: Salt River DESIGNATED USES: A&Wedw, PBC, FC, AgI, AgL
MONITORING SEASONS Summer: June 1 – October 31 Winter: November 1 – May 31
Winter 2008-09
Summer
2009
Winter
2009-10
Summer
2010
Winter
2010-11
Summer
2011
Winter
2011-12
Summer
2012
Winter
2012-13
Summer
2013
Winter
2013-14
SAMPLING DATE(S): SWQS NS SWQS 9/05/09 SWQS 1/19/10 SWQS 7/31/2010 SWQS 12/23/10 SWQS SWQS SWQS SWQS SWQS SWQS
MONITORING PARAMETERS 1, 2
Conventional Parameters
Flow 3 (cfs) NS 2.98 NS 4.286 NS 1.6425 NS 0.465
pH 6.5-9 8.32 6.5-9 8.65 6.5-9 7.54 6.5-9 8.19
Temperature Varies 27.0 Varies 14.5 Varies 24.0 Varies 16.5
Hardness (mg/L) 400 77 400 40 400 120 400 70.9
Total Dissolved Solids (TDS) (mg/L) 2 NS 84 NS 67 NS 330 NS 144
Total Suspended Solids (TSS) (mg/L) 2 NS 310 NS 90 NS 160 NS 90.0
Biochemical Oxygen Demand (BOD) (mg/L)
2
NS 6.9 NS 11 NS 37 NS 10.2
Chemical Oxygen Demand (COD) (mg/L)
2
NS 200 NS 100 NS 160 NS 84.0
SR03 Winter
2008-09 Summer
2009 Winter
2009-10 Summer
2010 Winter
2010-11 Summer
2011 Winter
2011-12 Summer
2012 Winter
2012-13 Summer
2013 Winter
2013-14
Inorganics SWQS NS SWQS 9/5/09 SWQS 1/19/10 SWQS 7/31/2010 SWQS 12/23/10 SWQS SWQS SWQS SWQS SWQS SWQS
Cyanide, total (µg/L) 2 41T <5.0 41T <5.0 41T <5.0 41T 5.00
Nutrients (mg/L) 2
Nitrate + Nitrite as N NS 0.94 NS 0.79 NS 1.5 NS 0.784
Ammonia as N 4.71 0.89 2.42 0.68 18.74 1.3 5.843 0.559
Total Kjeldahl Nitrogen (TKN) NS 2.9 NS 1.8 NS 5.5 NS 1.80
Total Phosphorus as P NS 0.70 NS 0.48 NS 0.76 NS 0.357
Ortho-Phosphorus as P NS 0.49 NS 0.30 NS 0.19 NS 0.275
Microbiological
Escherichia coli (E. coli) (CFU/100 mg or MPN/100 mL)
2
575 14,800 575 >2,419.6 575 594,000 575 23,590

Appendix B City of Phoenix MS4 Stormwater Permit
AZPDES Permit No. AZS000003 Page 60
NOTES: NS = no standard applicable to the designated use. T = Total D = Dissolved D
a = Result is assumed based upon a 1:1 ratio to total metals.
T&D = Total and Dissolved Bold text indicates a sample result greater than the SWQS Italicized text indicated a laboratory detection limit higher that the SWQS.
Footnotes 1 The Permittee shall report on any additional parameters that were monitored for seasonal stormwater sampling as required by Section 6.0 of this permit (Special Conditions). 2 Analytical results shall be reported in the units specified for each category or parameter. 3 Report the average flow rate for the sampling period (no more than 6 hours). 4 Standard for total PCBs of 11 μg/L A&We and 19 μg/L PBC.
5 SWQS value based on a maximum hardness of 400 mg/L. Actual hardness results were higher. 6 Results for cyanide were collected on 2/19/11 (SC046 on 2/27/11) due to missed hold time on previous samples. 7 The method blanks used by the laboratory contained the same concentration of Azobenzene as the outfall sample.
SR03 Winter
2008-09 Summer
2009 Winter
2009-10 Summer
2010 Winter
2010-11 Summer
2011 Winter
2011-12 Summer
2012 Winter
2012-13 Summer
2013 Winter
2013-14
Total Metals (μg/L) 2 SWQS NS SWQS 9/05/09 SWQS 1/19/10 SWQS 7/31/2010 SWQS 12/23/10
Antimony 640 T
1000 D <50 T <25 D
640 T 1000 D
<25 T&D
640 T 1000 D
<25 T&D
640 T 1000 D
<25 T&D
Arsenic 80 T
340 D <20 T <10 D
80 T 340 D
<10 T&D
80 T 340 D
<10 T&D
80 T 340 D
<10 T&D
Barium 98,000 T 110 T 16 D
98,000 T
65 T 13 D
98,000 T
110 T 54 D
98,000 T 53 T 20 D
Beryllium 84 T <4.0 T <2.0 D
84 T <2.0 T&D
84 T <2.0 T&D
84 T <2
T&D
Cadmium 50 T
6.10D <6.0 T <3.0 D
50 T 3.23 D
<3.0 T <3.0 D
50 T 9.40 D
<3.0 T <3.0 D
50 T 5.63 D
<3 T <3 D
Chromium 1,000 <20 T <10 D
1,000 <10 T&D
1,000 <10 T&D
1,000 <10 T&D
Copper 500 T
10.51 D 47 T 10 D
500 T 5.67 D
44 T <10 D
500 T 15.96 D
70 T 31 D
500 T 9.71 D
21 T <10 D
Lead 15 T
48.53 D 40 T
<10 D 15 T
23.51 D 24 T
<10 D 15 T
78.72 D 27 T
<10 D 15 T
44.22 D 14 T
<10 D
Mercury 10 T 2.4 D
<0.2 T&D
10 T 2.4 D
<0.2 T&D
10 T 2.4 D
<0.2 T&D
10 T 2.4 D
<0.2000 T&D
Nickel 511 T 375 D
21 T <10 D
511 T 216 D
<10 T&D
511 T 546 D
16 T <10 D
511 T 349 D
<10 T&D
Selenium 20 T <2.0 T&D
20 T <2.0 T&D
20 T <2.0 T&D
20 T <2.00 T&D
Silver 4667T 2.05 D
<10 T <5.0 D
4667T 0.67 D
<5.0 T <5.0 D
4667T 4.40 D
<5.0 T <5.0 D
4667T 1.77 D
<5 T <5 D
Thallium 1 T
700 D <0.5 T&D
1 T 700 D
<0.5 T&D
1 T 700 D
<0.5 T&D
1 T 700 D
<0.50 T <0.5 D
Zinc 5,106T 93.9 D
250 T <50 D
5,106T 53.9 D
190 T <50 D
5,106T 136.8 D
270 T 77 D
5,106T 87.5
141 T <50 D
SR03 Winter
2008-09 Summer
2009 Winter
2009-10 Summer
2010 Winter
2010-11 Summer
2011 Winter
2011-12 Summer
2012 Winter
2012-13 Summer
2013 Winter
2013-14
Organic Toxic Pollutants SWQS NS SWQS 9/5/09 SWQS 1/19/10 SWQS 7/31/2010 SWQS 12/23/10 SWQS SWQS SWQS SWQS SWQS SWQS
Total Petroleum Hydrocarbons (TPH) (mg/L)
2
NS <5.0 NS <5.0 NS <5.0 NS <5.00
Total Oil and Grease (mg/L) 2 NS <5.0 NS <5.0 NS <5.0 NS <5.00
VOCs, Semi-VOCs, & Pesticides (μg/L)
2
Acrolein 1.9 <50 1.9 <50 1.9 <50 1.9 <50.0
Acrylonitrile 0.2 <5.0 0.2 <5.0 0.2 <5.0 0.2 <5.00
Benzene 114 <5.0 114 <0.50 114 <0.50 114 <0.500
Bromoform 133 <1.0 133 <1.0 133 <1.0 133 <1.00
Carbon tetrachloride 2 <0.50 2 <0.50 2 <0.50 2 <0.500

Appendix B City of Phoenix MS4 Stormwater Permit
AZPDES Permit No. AZS000003 Page 61
NOTES: NS = no standard applicable to the designated use. T = Total D = Dissolved D
a = Result is assumed based upon a 1:1 ratio to total metals.
T&D = Total and Dissolved Bold text indicates a sample result greater than the SWQS Italicized text indicated a laboratory detection limit higher that the SWQS.
Footnotes 1 The Permittee shall report on any additional parameters that were monitored for seasonal stormwater sampling as required by Section 6.0 of this permit (Special Conditions). 2 Analytical results shall be reported in the units specified for each category or parameter. 3 Report the average flow rate for the sampling period (no more than 6 hours). 4 Standard for total PCBs of 11 μg/L A&We and 19 μg/L PBC.
5 SWQS value based on a maximum hardness of 400 mg/L. Actual hardness results were higher. 6 Results for cyanide were collected on 2/19/11 (SC046 on 2/27/11) due to missed hold time on previous samples. 7 The method blanks used by the laboratory contained the same concentration of Azobenzene as the outfall sample.
SR03 Winter
2008-09 Summer
2009 Winter
2009-10 Summer
2010 Winter
2010-11 Summer
2011 Winter
2011-12 Summer
2012 Winter
2012-13 Summer
2013 Winter
2013-14
Chlorobenzene 1553 <0.50 1553 <0.50 1553 <0.50 1553 <0.500
Chlorodibromomethane 13 <0.50 13 <0.50 13 <0.50 13 <0.500
Chloroethane (ethyl chloride) NS <5.0 NS <5.0 NS <5.0 NS <5.00
2-chloroethylvinyl ether 180,000 <2.0 180,000 <2.0 180,000 <2.0 180,000 <2.00
Chloroform 2,133 <0.50 2,133 <0.50 2,133 <0.50 2,133 <0.500
Dichlorobromomethane 17 <5.0 17 <0.50 17 <0.50 17 <0.500
1,1-dichloroethane NS <1.0 NS <1.0 NS <1.0 NS <1.00
1,2-dichloroethane 37 <1.0 37 <1.0 37 <1.0 37 <1.00
1,1-dichloroethylene 7,143 <1.0 7,143 <1.0 7,143 <1.0 7,143 <1.00
1,2-dichloropropane 17,518 <0.50 17,518 <0.50 17,518 <0.50 17,518 <0.500
1,3-dichloropropylene 42 <1.0 42 <1.0 42 <1.0 42 <1.00
Ethylbenzene 2,133 <2.0 2,133 <2.0 2,133 <2.0 2,133 <2.00
Methyl bromide 299 <5.0 299 <5.0 299 <5.0 299 <5.00
Methyl chloride 270,000 <5.0 270,000 <5.0 270,000 <5.0 270,000 <5.00
Methylene chloride 593 <3.0 593 <3.0 593 <3.0 593 <3.00
1,1,2,2-tetrachloroethane 4 <0.50 4 <0.50 4 <0.50 4 <0.500
Tetrachloroethylene 261 <0.50 261 <0.50 261 <0.50 261 <0.500
Toluene 8,700 <3.0 8,700 <3.0 8,700 <3.0 8,700 <3.00
1,2-trans-dichloroethylene 10,127 <0.50 10,127 <0.50 10,127 <0.50 10,127 <0.500
1,1,1-trichloroethane 1,000 <0.50 1,000 <0.50 1,000 <0.50 1,000 <0.500
1,1,2-trichloroethane 16 <0.50 16 <0.50 16 <0.50 16 <0.500
Trichloroethylene 29 <0.50 29 <0.50 29 <0.50 29 <0.500
Trimethylbenzene NS <1.5 NS <1.5 NS <2.0 <1.5
NS <2.00 <1.50
Vinyl chloride 5 <5.0 5 <0.50 5 <0.50 5 <0.500
Xylenes, Total 186,667 <3.0 186,667 <3.0 186,667 <3.0 186,667 <1.00
Acid Compounds (μg/L) 2
2-chlorophenol 30 <4.9 30 <12 30 <12 30 <2.46
2,4-dichlorophenol 59 <2.8 59 <6.9 59 <6.9 59 <1.38
2,4-dimethylphenol 171 <5.9 171 <15 171 <15 171 <2.93
4,6-dinitro-o-cresol 310 <5.4 310 <14 310 <14 310 <2.71
2,4-dinitrophenol 110 <4.1 110 <10 110 <10 110 <2.04
2-nitrophenol NS <2.9 NS <7.3 NS <7.3 NS <1.46
4-nitrophenol 4,100 <0.8 4,100 <2.1 4,100 <2.1 4,100 <0.423
p-chloro-m-cresol 15 <2.5 15 <6.2 15 <6.2 15 <1.25
Pentachlorophenol 33.498 <6.0 47.680 <15 15.626 <15 30.006 <2.98
Phenol 37 <1.4 37 <3.5 37 <3.5 37 <0.695
2,4,6-trichlorophenol 2 <3.0 2 <7.5 2 <7.5 2 <1.50

Appendix B City of Phoenix MS4 Stormwater Permit
AZPDES Permit No. AZS000003 Page 62
NOTES: NS = no standard applicable to the designated use. T = Total D = Dissolved D
a = Result is assumed based upon a 1:1 ratio to total metals.
T&D = Total and Dissolved Bold text indicates a sample result greater than the SWQS Italicized text indicated a laboratory detection limit higher that the SWQS.
Footnotes 1 The Permittee shall report on any additional parameters that were monitored for seasonal stormwater sampling as required by Section 6.0 of this permit (Special Conditions). 2 Analytical results shall be reported in the units specified for each category or parameter. 3 Report the average flow rate for the sampling period (no more than 6 hours). 4 Standard for total PCBs of 11 μg/L A&We and 19 μg/L PBC.
5 SWQS value based on a maximum hardness of 400 mg/L. Actual hardness results were higher. 6 Results for cyanide were collected on 2/19/11 (SC046 on 2/27/11) due to missed hold time on previous samples. 7 The method blanks used by the laboratory contained the same concentration of Azobenzene as the outfall sample.
SR03 Winter
2008-09 Summer
2009 Winter
2009-10 Summer
2010 Winter
2010-11 Summer
2011 Winter
2011-12 Summer
2012 Winter
2012-13 Summer
2013 Winter
2013-14
Bases/Neutrals (μg/L) 2 SWQS NS SWQS 9/05/09 SWQS 1/19/10 SWQS 7/31/2010 SWQS 12/23/10
Acenaphthene 198 <1.4 198 <3.5 198 <3.5 198 <0.704
Acenaphthylene NS <5.5 NS <14 NS <14 NS <2.77
Anthracene 74 <1.4 74 <3.5 74 <3.5 74 <0.700
Benz(a)anthracene 0.02 <1.5 0.02 <3.9 0.02 <3.9 0.02 <0.772
Benzo(a)pyrene 0.02 <1.5 0.02 <3.7 0.02 <3.7 0.02 <0.743
Benzo(b)fluoranthene 0.02 <1.5 0.02 <3.7 0.02 <3.7 0.02 <0.747
Benzo(g,h,i)perylene NS <1.5 NS <3.8 NS <3.8 NS <0.770
Benzo(k)fluoranthene 0.02 <1.6 0.02 <3.9 0.02 <3.9 0.02 <0.779
Chrysene 0.02 <1.6 0.02 <4.0 0.02 <4.0 0.02 <0.800
Dibenz(a,h)anthracene 0.02 <1.5 0.02 <3.7 0.02 <3.7 0.02 <0.743
1,2-dichlorobenzene 205 <5.4 205 <13 205 <13 205 <2.70
1,3-dichlorobenzene 2,500 <4.8 2,500 <12 2,500 <12 2,500 <2.39
1,4-dichlorobenzene 2,000 <5.5 2,000 <14 2,000 <14 2,000 <2.73
3,3-dichlorobenzidine 0.03 <6.3 0.03 <16 0.03 <16 0.03 <3.17
Diethyl phthalate 8,767 <1.6 8,767 <3.9 8,767 <3.9 8,767 <0.777
Dimethyl phthalate 17,000 <1.6 17,000 <3.9 17,000 <3.9 17,000 <0.788
Di-n-butyl phthalate 470 <2.0 470 <5.1 470 <5.1 470 <1.03
2,4-dinitrotoluene 421 <6.0 421 <15 421 <15 421 <3.00
2,6-dinitrotoluene 3,733 <1.5 3,733 <3.8 3,733 <3.8 3,733 <0.753
Di-n-octyl phthalate 373,333 <2.7 373,333 <6.7 373,333 <6.7 373,333 <1.35
1,2-diphenylhydrazine (as azobenzene) 0.2 <1.4 0.2 <3.6 0.2 <3.6 0.2 <0.714
Fluoranthene 28 <1.7 28 <4.2 28 <4.2 28 <0.841
Fluorene 1067 <1.4 1067 <3.6 1067 <3.6 1067 <0.711
Hexachlorobenzene 0.0003 <1.1 0.0003 <2.9 0.0003 <2.9 0.0003 <0.575
Hexachlorobutadiene 18 <5.9 18 <15 18 <15 18 <2.94
Hexachlorocyclopentadiene 3.5 <6.2 3.5 <16 3.5 <16 3.5 <3.10
Hexachloroethane 3.3 <6.0 3.3 <15 3.3 <15 3.3 <3.00
Indeno(1,2,3-cd)pyrene 0.2 <1.5 0.2 <3.8 0.2 <3.8 0.2 <0.768
Isophorone 961 <1.4 961 <3.5 961 <3.5 961 <0.706
Naphthalene 1,524 <5.0 1,524 <12 1,524 <12 1,524 <2.48
Nitrobenzene 138 <1.4 138 <3.6 138 <3.6 138 <0.718
N-nitrosodimethylamine 0.03 <4.4 0.03 <11 0.03 <11 0.03 <2.18
N-nitrosodi-n-propylamine 0.5 <1.5 0.5 <3.6 0.5 <3.6 0.5 <0.725
N-nitrosodiphenylamine 6 <6.5 6 <16 6 <16 6 <3.24
Phenanthrene 30 <1.4 30 <3.6 30 <3.6 30 <0.711
Pyrene 800 <1.7 800 <4.2 800 <4.2 800 <0.835
1,2,4-trichlorobenzene 70 <5.3 70 <13 70 <13 70 <2.64

Appendix B City of Phoenix MS4 Stormwater Permit
AZPDES Permit No. AZS000003 Page 63
NOTES: NS = no standard applicable to the designated use. T = Total D = Dissolved D
a = Result is assumed based upon a 1:1 ratio to total metals.
T&D = Total and Dissolved Bold text indicates a sample result greater than the SWQS Italicized text indicated a laboratory detection limit higher that the SWQS.
Footnotes 1 The Permittee shall report on any additional parameters that were monitored for seasonal stormwater sampling as required by Section 6.0 of this permit (Special Conditions). 2 Analytical results shall be reported in the units specified for each category or parameter. 3 Report the average flow rate for the sampling period (no more than 6 hours). 4 Standard for total PCBs of 11 μg/L A&We and 19 μg/L PBC.
5 SWQS value based on a maximum hardness of 400 mg/L. Actual hardness results were higher. 6 Results for cyanide were collected on 2/19/11 (SC046 on 2/27/11) due to missed hold time on previous samples. 7 The method blanks used by the laboratory contained the same concentration of Azobenzene as the outfall sample.
SR03 Winter
2008-09 Summer
2009 Winter
2009-10 Summer
2010 Winter
2010-11 Summer
2011 Winter
2011-12 Summer
2012 Winter
2012-13 Summer
2013 Winter
2013-14
Pesticides (μg/L) 2 SWQS NS SWQS 9/05/09 SWQS 1/19/10 SWQS 7/31/2010 SWQS 12/23/10
Aldrin 0.00005 <0.060 0.00005 <0.60 0.00005 <0.12 0.00005 <0.060
Alpha-BHC 0.005 0.060 0.005 <0.50 0.005 <0.10 0.005 <0.050
Beta-BHC 0.02 0.090 0.02 <0.50 0.02 <0.10 0.02 <0.050
Gamma-BHC 1 <0.050 1 <0.50 1 <0.10 1 <0.050
Delta-BHC 1600 <0.050 1600 <0.50 1600 <0.10 1600 <0.050
Chlordane 0.0008 <0.70 0.0008 <7.0 0.0008 <1.4 0.0008 <0.700
4,4‟-DDT 0.0002 <0.060 0.0002 <0.60 0.0002 <0.12 0.0002 <0.060
4,4‟-DDE 0.0002 <0.050 0.0002 <0.50 0.0002 <0.10 0.0002 <0.050
4,4‟-DDD 0.0002 <0.050 0.0002 <0.50 0.0002 <0.10 0.0002 <0.050
Dieldrin 0.00005 <0.050 0.00005 <0.50 0.00005 <0.10 0.00005 <0.050
Alpha-endosulfan 0.2 0.060 0.2 <0.50 0.2 <0.10 0.2 <0.050
Beta-endosulfan 0.2 0.060 0.2 <0.50 0.2 <0.10 0.2 <0.050
Endosulfan sulfate 0.2 <0.050 0.2 <0.50 0.2 <0.10 0.2 <0.050
Endrin 0.004 <0.060 0.004 <0.60 0.004 <0.12 0.004 <0.060
Endrin aldehyde 0.09 <0.050 0.09 <0.50 0.09 <0.10 0.09 <0.050
Heptachlor 0.00008 <0.060 0.00008 <0.60 0.00008 <0.12 0.00008 <0.060
Heptachlor epoxide 0.00004 <0.050 0.00004 <0.50 0.00004 <0.10 0.00004 <0.050
PCB-1242 4 <0.30
4 <3.0 4 <0.60
4 <0.300
PCB-1254 4 <0.50
4 <5.0 4 <1.0
4 <0.500
PCB-1221 4 <0.90
4 <9.0 4 <1.8
4 <0.900
PCB-1232 4 <0.070
4 <0.70 4 <0.14
4 <0.070
PCB-1248 4 <0.20
4 <2.0 4 <0.40
4 <0.200
PCB-1260 4 <0.40
4 <4.0 4 <0.80
4 <0.400
PCB-1016 4 <0.40
4 <4.0 4 <0.80
4 <0.400
Toxaphene 0.0003 <0.70 0.0003 <7.0 0.0003 <1.4 0.0003 <0.700


Appendix B City of Phoenix MS4 Stormwater Permit
AZPDES Permit No. AZS000003 Page 65
NOTES: NS = no standard applicable to the designated use. T = Total D = Dissolved D
a = Result is assumed based upon a 1:1 ratio to total metals.
T&D = Total and Dissolved Bold text indicates a sample result greater than the SWQS Italicized text indicated a laboratory detection limit higher that the SWQS.
Footnotes 1 The Permittee shall report on any additional parameters that were monitored for seasonal stormwater sampling as required by Section 6.0 of this permit (Special Conditions). 2 Analytical results shall be reported in the units specified for each category or parameter. 3 Report the average flow rate for the sampling period (no more than 6 hours). 4 Standard for total PCBs of 11 μg/L A&We and 19 μg/L PBC.
5 SWQS value based on a maximum hardness of 400 mg/L. Actual hardness results were higher. 6 Results for cyanide were collected on 2/19/11 (SC046 on 2/27/11) due to missed hold time on previous samples. 7 The method blanks used by the laboratory contained the same concentration of Azobenzene as the outfall sample.
OUTFALL ID: SR30 RECEIVING WATER: Salt River DESIGNATED USES: A&Wedw, PBC, FC, AgI, and AgL
MONITORING SEASONS Summer: June 1 – October 31 Winter: November 1 – May 31
Winter 2008-09
Summer
2009
Winter
2009-10
Summer
2010
Winter
2010-11
Summer
2011
Winter
2011-12
Summer
2012
Winter
2012-13
Summer
2013
Winter
2013-14
SAMPLING DATE(S): SWQS NS SWQS 7/21/09 SWQS 1/19/10 SWQS 8/28/10 SWQS 12/23/10 SWQS SWQS SWQS SWQS SWQS SWQS
MONITORING PARAMETERS 1, 2
Conventional Parameters
Flow 3 (cfs) NS 1.625 NS 4.119 NS 1.01 NS 0.547
pH 6.5-9 7.41 6.5-9 8.4 6.5-9 7.50 6.5-9 8.20
Temperature Varies 26 Varies 14.5 Varies 29.0 Varies 16.5
Hardness (mg/L) 400 5105 400 500
5 400 169 400 220
Total Dissolved Solids (TDS) (mg/L) 2 NS 230 NS 240 NS 233 NS 177
Total Suspended Solids (TSS) (mg/L) 2 NS 1,200 NS 3,300 NS 550 NS 564
Biochemical Oxygen Demand (BOD) (mg/L)
2
NS 39 NS 37 NS 29.8 NS 20.0
Chemical Oxygen Demand (COD) (mg/L)
2
NS 100 NS 250 NS 125 NS 235
SR30 Winter
2008-09 Summer
2009 Winter
2009-10 Summer
2010 Winter
2010-11 Summer
2011 Winter
2011-12 Summer
2012 Winter
2012-13 Summer
2013 Winter
2013-14
Inorganics SWQS NS SWQS 7/21/09 SWQS 1/19/10 SWQS 8/28/10 SWQS 12/23/10 SWQS SWQS SWQS SWQS SWQS SWQS
Cyanide, total (µg/L) 2 41T <5.0 41T <5.0 41T <5.0 41T <5.00
Nutrients (mg/L) 2
Nitrate + Nitrite as N NS 1.6 NS 1.3 NS 1.13 NS 0.786
Ammonia as N 23.0 0.66 3.88 5.6 19.9 1.12 5.72 0.692
Total Kjeldahl Nitrogen (TKN) NS 3.9 NS 15 NS 4.25 NS 5.04
Total Phosphorus as P NS 2.2 NS 8.1 NS 0.899 NS <0.500
Ortho-Phosphorus as P NS 0.74 NS 5.2 NS 0.213 NS 0.234
Microbiological
Escherichia coli (E. coli) (CFU/100 mg or MPN/100 mL)
2
575 10,540 575 >2,419.6 575 10,810 575 14,140

Appendix B City of Phoenix MS4 Stormwater Permit
AZPDES Permit No. AZS000003 Page 66
NOTES: NS = no standard applicable to the designated use. T = Total D = Dissolved D
a = Result is assumed based upon a 1:1 ratio to total metals.
T&D = Total and Dissolved Bold text indicates a sample result greater than the SWQS Italicized text indicated a laboratory detection limit higher that the SWQS.
Footnotes 1 The Permittee shall report on any additional parameters that were monitored for seasonal stormwater sampling as required by Section 6.0 of this permit (Special Conditions). 2 Analytical results shall be reported in the units specified for each category or parameter. 3 Report the average flow rate for the sampling period (no more than 6 hours). 4 Standard for total PCBs of 11 μg/L A&We and 19 μg/L PBC.
5 SWQS value based on a maximum hardness of 400 mg/L. Actual hardness results were higher. 6 Results for cyanide were collected on 2/19/11 (SC046 on 2/27/11) due to missed hold time on previous samples. 7 The method blanks used by the laboratory contained the same concentration of Azobenzene as the outfall sample.
SR30 Winter
2008-09 Summer
2009 Winter
2009-10 Summer
2010 Winter
2010-11 Summer
2011 Winter
2011-12 Summer
2012 Winter
2012-13 Summer
2013 Winter
2013-14
Total Metals (μg/L) 2
Antimony 640 T
1,000 D <25 T&D
640 T 1,000 D
<25 T&D
640 T 1,000 D
<25 T&D
640 T 1,000 D
<25 T&D
Arsenic 80 T
340 D 18 T
<10 D 80 T
340 D 35 T
<10 D 80 T
340 D <10 T&D
80 T 340 D
<10 T&D
Barium 98,000 T 370 T 37 D
98,000 T 670 T 13 D
98,000 T 206 T 38 D
98,000 T 256 T 21 D
Beryllium 84 T <2
T&D 84 T
2.2 T <2.0 D
84 T <2
T&D 84 T
<2 T&D
Cadmium5 50 T
30.23 D <3 T <3 D
50 T 30.23 D
4.6 T <3.0 D
50 T 13.10 D
<3 T&D
50 T 16.93 D
<3 T&D
Chromium
1,000 46 T
<10 D 1,000
57 T <10 D
1,000 17.8 T <10 D
1,000 28 T
<10 D
Copper5 500 T
49.62 D 95 T 17 D
500 T 49.62 D
210 T 10 D
500 T 22.03 D
75 T 14 D
500 T 28.25 D
110 T 14 D
Lead5 15 T
280.85 D 49 T
<10 D 15 T
280.85 D 110 T <10 D
15 T 113.78 D
71 T <10 D
15 T 150.61 D
62 T <10 D
Mercury 10 T
2.4 D <0.2 T&D
10 T 2.4 D
<0.2 T&D
10 T 2.4 D
<0.20 T <0.20 D
10 T 2.4 D
<0.2000T <0.2000D
Nickel 511 T
1513 D 55 T
<10 D 511 T
1513 D 110 T <10 D
511 T 730 D
23 T <10 D
511 T 912 D
36 T <10 D
Selenium
20 T <2
T&D 20 T
<2.0 T&D
20 T <2.00 T <2.00 D
20 T <2.00 T&D
Silver5 4667 T
34.91 D <5
T&D 4667 T 34.91 D
<5 T&D
4667 T 7.93 D
<5 T&D
4667 T 12.48 D
<5 T&D
Thallium 1 T
700 D <0.5 T&D
1 T 700 D
0.9 T <0.5 D
1 T 700 D
<0.5 T&D
1 T 700 D
<0.50 T <0.5 D
Zinc5 5,106 T
379.3 D 260 T <50 D
5,106 T 379.3 D
770 T <50 D
5,106 T 182.8 D
397 T <50 D
5,106 T 228.6 D
554 T <50 D
SR30 Winter
2008-09 Summer
2009 Winter
2009-10 Summer
2010 Winter
2010-11 Summer
2011 Winter
2011-12 Summer
2012 Winter
2012-13 Summer
2013 Winter
2013-14
Organic Toxic Pollutants SWQS NS SWQS 7/21/09 SWQS 1/19/10 SWQS 8/28/10 SWQS 12/23/10 SWQS SWQS SWQS SWQS SWQS SWQS
Total Petroleum Hydrocarbons (TPH) (mg/L)
2
NS <5.0 NS <5.0 NS <5.00 NS <5.00
Total Oil and Grease (mg/L) 2 NS <5.0 NS <5.0 NS <5.00 NS <5.00
VOCs, Semi-VOCs, & Pesticides (μg/L)
2
Acrolein 1.9 <50 1.9 <500 1.9 <50.0 1.9 <50.0
Acrylonitrile 0.2 <5.0 0.2 <50 0.2 <1.00 0.2 <5.00
Benzene 114 <0.50 114 <0.50 114 <0.500 114 <0.500
Bromoform 133 <1.0 133 <1.0 133 <1.00 133 <1.00
Carbon tetrachloride 2 <0.50 2 <0.50 2 <0.500 2 <0.500

Appendix B City of Phoenix MS4 Stormwater Permit
AZPDES Permit No. AZS000003 Page 67
NOTES: NS = no standard applicable to the designated use. T = Total D = Dissolved D
a = Result is assumed based upon a 1:1 ratio to total metals.
T&D = Total and Dissolved Bold text indicates a sample result greater than the SWQS Italicized text indicated a laboratory detection limit higher that the SWQS.
Footnotes 1 The Permittee shall report on any additional parameters that were monitored for seasonal stormwater sampling as required by Section 6.0 of this permit (Special Conditions). 2 Analytical results shall be reported in the units specified for each category or parameter. 3 Report the average flow rate for the sampling period (no more than 6 hours). 4 Standard for total PCBs of 11 μg/L A&We and 19 μg/L PBC.
5 SWQS value based on a maximum hardness of 400 mg/L. Actual hardness results were higher. 6 Results for cyanide were collected on 2/19/11 (SC046 on 2/27/11) due to missed hold time on previous samples. 7 The method blanks used by the laboratory contained the same concentration of Azobenzene as the outfall sample.
SR30 Winter
2008-09 Summer
2009 Winter
2009-10 Summer
2010 Winter
2010-11 Summer
2011 Winter
2011-12 Summer
2012 Winter
2012-13 Summer
2013 Winter
2013-14
Chlorobenzene 1,553 <0.50 1,553 <0.50 1,553 <0.500 1,553 <0.500
Chlorodibromomethane 13 <0.50 13 <0.50 13 <0.500 13 <0.500
Chloroethane (ethyl chloride) NS <5.0 NS <5.0 NS <5.00 NS <5.00
2-chloroethylvinyl ether 180,000 <2.0 180,000 <20 180,000 <5.00 180,000 <2.00
Chloroform 2,133 <0.50 2,133 <0.50 2,133 <0.500 2,133 <0.500
Dichlorobromomethane 17 <0.50 17 <0.50 17 <0.500 17 <0.500
1,1-dichloroethane NS <1.0 NS <1.0 NS <1.00 NS <1.00
1,2-dichloroethane 37 <1.0 37 <1.0 37 <1.00 37 <1.00
1,1-dichloroethylene 7,143 <1.0 7,143 <1.0 7,143 <1.00 7,143 <1.00
1,2-dichloropropane 17,518 <0.50 17,518 <0.50 17,518 <0.500 17,518 <0.500
1,3-dichloropropylene 42 <1.0 42 <1.0 42 <1.00 42 <1.00
Ethylbenzene 2,133 <2.0 2,133 <2.0 2,133 <2.00 2,133 <2.00
Methyl bromide 299 <5.0 299 <5.0 299 <5.00 299 <5.00
Methyl chloride 270,000 <3.0 270,000 <5.0 270,000 <5.00 270,000 <5.00
Methylene chloride 593 <3.0 593 <3.0 593 <3.00 593 <3.00
1,1,2,2-tetrachloroethane 4 <0.50 4 <0.50 4 <0.500 4 >0.500
Tetrachloroethylene 261 <0.50 261 <0.50 261 <0.500 261 <0.500
Toluene 8,700 <3.0 8,700 <3.0 8,700 <3.00 8,700 <3.00
1,2-trans-dichloroethylene 10,127 <0.50 10,127 <0.50 10,127 <0.500 10,127 <0.500
1,1,1-trichloroethane 1,000 <0.50 1,000 <0.50 1,000 <0.500 1,000 <0.500
1,1,2-trichloroethane 16 <0.50 16 <0.50 16 <0.500 16 <0.500
Trichloroethylene 29 <0.50 29 <0.50 29 <0.500 29 <0.500
Trimethylbenzene NS <1.5 NS <1.5
NS <2.00 <1.5
NS <2.00 <1.50
Vinyl chloride 5 <0.50 5 <0.50 5 <0.500 5 <0.500
Xylenes, Total 186,667 <3.0 186,667 <3.0 186,667 <1.00 186,667 <1.00
Acid Compounds (μg/L) 2
2-chlorophenol 30 <12 30 <12 30 <12.3 30 <4.92
2,4-dichlorophenol 59 <6.9 59 <6.9 59 <6.90 59 <2.76
2,4-dimethylphenol 171 <15 171 <15 171 <14.7 171 <5.86
4,6-dinitro-o-cresol 310 <14 310 <14 310 <13.6 310 <5.42
2,4-dinitrophenol 110 <10 110 <10 110 <10.2 110 <4.07
2-nitrophenol NS <7.3 NS <7.3 NS <7.30 NS <2.92
4-nitrophenol 4,100 <2.1 4,100 <2.1 4,100 <2.12 4,100 <0.846
p-chloro-m-cresol 15 <6.2 15 <6.2 15 <6.25 15 <2.50
Pentachlorophenol 13.558 <15 37.040 <15 14.992 <14.9 30.296 <5.97
Phenol 37 <3.5 37 <3.5 37 <3.48 37 <1.39
2,4,6-trichlorophenol 2 <7.5 2 <7.5 2 <7.52 2 <3.01

Appendix B City of Phoenix MS4 Stormwater Permit
AZPDES Permit No. AZS000003 Page 68
NOTES: NS = no standard applicable to the designated use. T = Total D = Dissolved D
a = Result is assumed based upon a 1:1 ratio to total metals.
T&D = Total and Dissolved Bold text indicates a sample result greater than the SWQS Italicized text indicated a laboratory detection limit higher that the SWQS.
Footnotes 1 The Permittee shall report on any additional parameters that were monitored for seasonal stormwater sampling as required by Section 6.0 of this permit (Special Conditions). 2 Analytical results shall be reported in the units specified for each category or parameter. 3 Report the average flow rate for the sampling period (no more than 6 hours). 4 Standard for total PCBs of 11 μg/L A&We and 19 μg/L PBC.
5 SWQS value based on a maximum hardness of 400 mg/L. Actual hardness results were higher. 6 Results for cyanide were collected on 2/19/11 (SC046 on 2/27/11) due to missed hold time on previous samples. 7 The method blanks used by the laboratory contained the same concentration of Azobenzene as the outfall sample.
SR30 Winter
2008-09 Summer
2009 Winter
2009-10 Summer
2010 Winter
2010-11 Summer
2011 Winter
2011-12 Summer
2012 Winter
2012-13 Summer
2013 Winter
2013-14
Bases/Neutrals (μg/L) 2 SWQS NS SWQS 7/21/09 SWQS 1/19/10 SWQS 8/28/10 SWQS 12/23/10
Acenaphthene 198 <3.5 198 <3.5 198 <3.52 198 <1.41
Acenaphthylene NS <14 NS <14 NS <13.8 NS <5.54
Anthracene 74 <3.5 74 <3.5 74 <3.50 74 <1.40
Benz(a)anthracene 0.02 <3.9 0.02 <3.9 0.02 <3.86 0.02 <1.54
Benzo(a)pyrene 0.02 <3.7 0.02 <3.7 0.02 <3.72 0.02 <1.49
Benzo(b)fluoranthene 0.02 <3.7 0.02 <3.7 0.02 <3.74 0.02 <1.49
Benzo(g,h,i)perylene NS <3.8 NS <3.8 NS <3.85 NS <1.54
Benzo(k)fluoranthene 0.02 <3.9 0.02 <3.9 0.02 <3.90 0.02 <1.56
Chrysene 0.02 <4 0.02 <4.0 0.02 <4.00 0.02 <1.60
Dibenz(a,h)anthracene 0.02 <3.7 0.02 <3.7 0.02 <3.72 0.02 <1.49
1,2-dichlorobenzene 205 <13 205 <13 205 <13.5 205 <5.39
1,3-dichlorobenzene 2,500 <12 2,500 <12 2,500 <12.0 2,500 <4.79
1,4-dichlorobenzene 2,000 <14 2,000 <14 2,000 <13.7 2,000 <5.47
3,3-dichlorobenzidine 0.03 <16 0.03 <16 0.03 <15.8 0.03 <6.34
Diethyl phthalate 8,767 <3.9 8,767 <3.9 8,767 <3.89 8,767 <1.55
Dimethyl phthalate 17,000 <3.9 17,000 <3.9 17,000 <3.94 17,000 <1.58
Di-n-butyl phthalate 470 <5.1 470 <5.1 470 <5.13 470 <2.05
2,4-dinitrotoluene 421 <15 421 <15 421 <15.0 421 <6.00
2,6-dinitrotoluene 3,733 <3.8 3,733 <3.8 3,733 <3.77 3,733 <1.51
Di-n-octyl phthalate 373,333 <6.7 373,333 <6.7 373,333 <6.73 373,333 <2.69
1,2-diphenylhydrazine (as azobenzene)
0.2 <3.6 0.2 <3.6 0.2 9.007 0.2 <1.43
Fluoranthene 28 <4.2 28 <4.2 28 <4.21 28 <1.68
Fluorene 1067 <3.6 1067 <3.6 1067 <3.56 1067 <1.42
Hexachlorobenzene 0.0003 <2.9 0.0003 <2.9 0.0003 <2.88 0.0003 <1.15
Hexachlorobutadiene 18 <15 18 <15 18 <14.7 18 <5.89
Hexachlorocyclopentadiene 3.5 <16 3.5 <16 3.5 <15.5 3.5 <6.20
Hexachloroethane 3.3 <15 3.3 <15 3.3 <15.0 3.3 <6.01
Indeno(1,2,3-cd)pyrene 0.2 <3.8 0.2 <3.8 0.2 <3.84 0.2 <1.54
Isophorone 961 <3.5 961 <3.5 961 <3.53 961 <1.41
Naphthalene 1,524 <12 1,524 <12 1,524 <12.4 1,524 <4.96
Nitrobenzene 138 <3.6 138 <3.6 138 <3.59 138 <1.44
N-nitrosodimethylamine 0.03 <11 0.03 <11 0.03 <10.9 0.03 <4.35
N-nitrosodi-n-propylamine 0.5 <3.6 0.5 <3.6 0.5 <3.63 0.5 <1.45
N-nitrosodiphenylamine 6 <16 6 <16 6 <16.2 6 <6.48
Phenanthrene 30 <3.6 30 <3.6 30 <3.56 30 <1.42
Pyrene 800 <4.2 800 <4.2 800 <4.18 800 <1.67
1,2,4-trichlorobenzene 70 <13 70 <13 70 <13.2 70 <5.29

Appendix B City of Phoenix MS4 Stormwater Permit
AZPDES Permit No. AZS000003 Page 69
NOTES: NS = no standard applicable to the designated use. T = Total D = Dissolved D
a = Result is assumed based upon a 1:1 ratio to total metals.
T&D = Total and Dissolved Bold text indicates a sample result greater than the SWQS Italicized text indicated a laboratory detection limit higher that the SWQS.
Footnotes 1 The Permittee shall report on any additional parameters that were monitored for seasonal stormwater sampling as required by Section 6.0 of this permit (Special Conditions). 2 Analytical results shall be reported in the units specified for each category or parameter. 3 Report the average flow rate for the sampling period (no more than 6 hours). 4 Standard for total PCBs of 11 μg/L A&We and 19 μg/L PBC.
5 SWQS value based on a maximum hardness of 400 mg/L. Actual hardness results were higher. 6 Results for cyanide were collected on 2/19/11 (SC046 on 2/27/11) due to missed hold time on previous samples. 7 The method blanks used by the laboratory contained the same concentration of Azobenzene as the outfall sample.
SR30 Winter
2008-09 Summer
2009 Winter
2009-10 Summer
2010 Winter
2010-11 Summer
2011 Winter
2011-12 Summer
2012 Winter
2012-13 Summer
2013 Winter
2013-14
Pesticides (μg/L) 2 SWQS NS SWQS 7/21/09 SWQS 1/19/10 SWQS 8/28/10 SWQS 12/23/10
Aldrin 0.00005 <0.12 0.00005 <0.060 0.00005 <0.600 0.00005 <0.060
Alpha-BHC 0.005 <0.10 0.005 <0.050 0.005 <0.500 0.005 <0.050
Beta-BHC 0.02 <0.10 0.02 <0.050 0.02 <0.500 0.02 <0.050
Gamma-BHC 1 <0.10 1 <0.050 1 <0.500 1 <0.050
Delta-BHC 1,600 <0.10 1,600 <0.050 1,600 <0.500 1,600 <0.050
Chlordane 0.0008 <1.4 0.0008 <0.70 0.0008 <7.00 0.0008 <0.700
4,4‟-DDT 0.0002 <0.12 0.0002 <0.060 0.0002 <0.600 0.0002 <0.060
4,4‟-DDE 0.0002 <0.10 0.0002 <0.050 0.0002 <0.500 0.0002 <0.050
4,4‟-DDD 0.0002 <0.10 0.0002 <0.050 0.0002 <0.500 0.0002 <0.050
Dieldrin 0.00005 <0.10 0.00005 <0.050 0.00005 <0.500 0.00005 <0.050
Alpha-endosulfan 0.2 <0.10 0.2 <0.050 0.2 <0.500 0.2 <0.050
Beta-endosulfan 0.2 <0.10 0.2 <0.050 0.2 <0.500 0.2 <0.050
Endosulfan sulfate 0.2 <0.10 0.2 <0.050 0.2 <0.500 0.2 <0.050
Endrin 0.004 <0.12 0.004 <0.060 0.004 <0.600 0.004 <0.060
Endrin aldehyde 0.09 <0.10 0.09 <0.050 0.09 <0.500 0.09 <0.050
Heptachlor 0.00008 <0.12 0.00008 <0.060 0.00008 <0.600 0.00008 <0.060
Heptachlor epoxide 0.00004 <0.10 0.00004 <0.050 0.00004 <0.500 0.00004 <0.050
PCB-1242 4 <0.60
4 <0.30 4 <3.00 4 <0.300
PCB-1254 4 <1.0
4 <0.50 4 <5.00 4 <0.500
PCB-1221 4 <1.8
4 <0.90 4 <9.00 4 <0.900
PCB-1232 4 <0.14
4 <0.070 4 <0.700 4 <0.070
PCB-1248 4 <0.40
4 <0.20 4 <2.00 4 <0.200
PCB-1260 4 <0.80
4 <0.40 4 <4.00 4 <0.400
PCB-1016 4 <0.80
4 <0.40 4 <4.00 4 <0.400
Toxaphene 0.0003 <1.4 0.0003 <0.70 0.0003 <7.00 0.0003 <0.700


Appendix B City of Phoenix MS4 Stormwater Permit
AZPDES Permit No. AZS000003 Page 71
NOTES: NS = no standard applicable to the designated use. T = Total D = Dissolved D
a = Result is assumed based upon a 1:1 ratio to total metals.
T&D = Total and Dissolved Bold text indicates a sample result greater than the SWQS Italicized text indicated a laboratory detection limit higher that the SWQS.
Footnotes 1 The Permittee shall report on any additional parameters that were monitored for seasonal stormwater sampling as required by Section 6.0 of this permit (Special Conditions). 2 Analytical results shall be reported in the units specified for each category or parameter. 3 Report the average flow rate for the sampling period (no more than 6 hours). 4 Standard for total PCBs of 11 μg/L A&We and 19 μg/L PBC.
5 SWQS value based on a maximum hardness of 400 mg/L. Actual hardness results were higher. 6 Results for cyanide were collected on 2/19/11 (SC046 on 2/27/11) due to missed hold time on previous samples. 7 The method blanks used by the laboratory contained the same concentration of Azobenzene as the outfall sample.
OUTFALL ID: SR45 RECEIVING WATER: Salt River DESIGNATED USES: A&We, PBC
MONITORING SEASONS Summer: June 1 – October 31 Winter: November 1 – May 31
Winter 2008-09
Summer
2009
Winter
2009-10
Summer
2010
Winter
2010-11
Summer
2011
Winter
2011-12
Summer
2012
Winter
2012-13
Summer
2013
Winter
2013-14
SAMPLING DATE(S): SWQS None SWQS 7/21/09 SWQS 1/19/10 SWQS 7/29/10 SWQS 12/23/10 SWQS SWQS SWQS SWQS SWQS SWQS
MONITORING PARAMETERS 1, 2
Conventional Parameters
Flow 3 (cfs) NS 1.53 NS 0.612 NS 2.728 NS 0.206
pH 6.5-9 7.38 6.5-9 8.80 6.5-9 8.00 6.5-9 7.81
Temperature Varies 26 Varies 13.5 Varies 31.5 Varies 18.0
Hardness (mg/L) 400 92 400 57 400 120 400 60.8
Total Dissolved Solids (TDS) (mg/L) 2 NS 110 NS 66 NS 190 NS 117
Total Suspended Solids (TSS) (mg/L) 2 NS 430 NS 170 NS 480 NS 81.6
Biochemical Oxygen Demand (BOD) (mg/L)
2
NS 37 NS 17 NS 41 NS 34.1
Chemical Oxygen Demand (COD) (mg/L)
2
NS 320 NS 120 NS 260 NS 114
SR45 Winter
2008-09 Summer
2009 Winter
2009-10 Summer
2010 Winter
2010-11 Summer
2011 Winter
2011-12 Summer
2012 Winter
2012-13 Summer
2013 Winter
2013-14
Inorganics SWQS NS SWQS 7/21/09 SWQS 1/19/10 SWQS 7/29/10 SWQS 12/23/10 SWQS SWQS SWQS SWQS SWQS SWQS
Cyanide, total (µg/L) 2 84 <0.50 84 <5.0 84 <5.0 84 5.69
6
Nutrients (mg/L) 2
Nitrate + Nitrite as N NS 1.5 NS 0.82 NS 1.8 NS 0.723
Ammonia as N NS 1.1 NS 0.53 NS 1.4 NS 0.572
Total Kjeldahl Nitrogen (TKN) NS 4 NS 2.3 NS 5.3 NS 2.12
Total Phosphorus as P NS 1.3 NS 0.79 NS 1.2 NS 0.531
Ortho-Phosphorus as P NS 0.43 NS 0.28 NS 0.42 NS 0.467
Microbiological
Escherichia coli (E. coli) (CFU/100 mg or MPN/100 mL)
2
575 36,540 575 >2,419.6 575 860 575 7540

Appendix B City of Phoenix MS4 Stormwater Permit
AZPDES Permit No. AZS000003 Page 72
NOTES: NS = no standard applicable to the designated use. T = Total D = Dissolved D
a = Result is assumed based upon a 1:1 ratio to total metals.
T&D = Total and Dissolved Bold text indicates a sample result greater than the SWQS Italicized text indicated a laboratory detection limit higher that the SWQS.
Footnotes 1 The Permittee shall report on any additional parameters that were monitored for seasonal stormwater sampling as required by Section 6.0 of this permit (Special Conditions). 2 Analytical results shall be reported in the units specified for each category or parameter. 3 Report the average flow rate for the sampling period (no more than 6 hours). 4 Standard for total PCBs of 11 μg/L A&We and 19 μg/L PBC.
5 SWQS value based on a maximum hardness of 400 mg/L. Actual hardness results were higher. 6 Results for cyanide were collected on 2/19/11 (SC046 on 2/27/11) due to missed hold time on previous samples. 7 The method blanks used by the laboratory contained the same concentration of Azobenzene as the outfall sample.
SR45 Winter
2008-09 Summer
2009 Winter
2009-10 Summer
2010 Winter
2010-11 Summer
2011 Winter
2011-12 Summer
2012 Winter
2012-13 Summer
2013 Winter
2013-14
Total Metals (μg/L) 2 SWQS None SWQS 7/21/09 SWQS 1/19/10 SWQS 7/29/10 SWQS 12/23/10
Antimony 747 T <25 T&D
747 T <25 T&D
747 T <25 T&D
747 T <25 T&D
Arsenic 280 T 440 D
<10 T&D 280 T 440 D
<10 T&D 280 T 440 D
<10 T&D
280 T 440 D
<10 T&D
Barium 98,000 T 180 T 20 D
98,000 T 120 T 10 D
98,000 T 250 T 23 D
98,000 T 54 T 15 D
Beryllium 1,867 T <2 T&D 1,867 T <2.0 T&D 1,867 T <2.0 T&D 1,867 T <2 T&D
Cadmium 700 T
21.03 D <3 T&D
700 T 13.20 D
<3.0 T&D 700 T
27.23 D <3.0 T&D
700 T 14.00
<3 T&D
Chromium NS 15 T
<10 D NS <10 T&D NS
24 T <10 D
NS 12 T
<10 D
Copper 1,300 T 21.50 D
330 T 37 D
1,300 T 13.70 D
95 T 15 D
1,300 T 27.62
300 T 46 D
1,300 T 14.55
52 T 22 D
Lead 15 T
124.45 D 43 T
<10 D 15 T
73.54 D 25 T
<10 D 15 T
166.13 63 T
<10 D 15 T 78.98
12 T <10 D
Mercury 280 T 5 D
<0.2 T&D
280 T 5 D
<0.2 T&D 280 T 5 D
<0.2 T&D 280 T 5 D
<0.20 T&D
Nickel 28,000 T 3875 D
19 T <10 D
28,000 T 2585 D
11 T <10 D
28,000 T 4852
32 T <10 D
28,000 T 2722
<10 T <10 D
Selenium 33 T <2 T&D 33 T <2.0 T&D 33 T <2.0 T&D 33 T <2.00 T&D
Silver 4667 T 2.79 D
<5 T <5 D
4667 T 1.22 D
<5.0 T <5.0 D
4667 T 4.40
<5.0 T <5.0 D
4667 T 1.36
<5 T <5 D
Thallium 75 T <0.5 T&D
75 T <0.5 T&D 75 T 1.3 T
<0.5 D 75 T
<0.50 T <0.5 D
Zinc 280,000 T
1036 D 390 T <50 D
280,000 T 691 D
280 T <50 D
280,000 T
1298 D
650 T 120 D
280,000 T
730 D
163 T <50 D
SR45 Winter
2008-09 Summer
2009 Winter
2009-10 Summer
2010 Winter
2010-11 Summer
2011 Winter
2011-12 Summer
2012 Winter
2012-13 Summer
2013 Winter
2013-14
Organic Toxic Pollutants SWQS NS SWQS 7/21/09 SWQS 1/19/10 SWQS 7/20/10 SWQS 12/22/10 SWQS SWQS SWQS SWQS SWQS SWQS
Total Petroleum Hydrocarbons (TPH) (mg/L)
2
NS 5.8 NS <5.0 NS <5.0 NS <5.00
Total Oil and Grease (mg/L) 2 NS <5.0 NS <5.0 NS <5.0 NS <5.00
VOCs, Semi-VOCs, & Pesticides (μg/L)
2
Acrolein 467 <50 467 <50 467 <50 467 <50.0
Acrylonitrile 37,333 <5.0 37,333 <5.0 37,333 <5.0 37,333 <5.00
Benzene 3,733 <0.50 3,733 <0.50 3,733 <0.50 3,733 <0.500
Bromoform 18,667 <1.0 18,667 <1.0 18,667 <1.0 18,667 <1.00
Carbon tetrachloride 1,307 <0.50 1,307 <0.50 1,307 <0.50 1,307 <0.500

Appendix B City of Phoenix MS4 Stormwater Permit
AZPDES Permit No. AZS000003 Page 73
NOTES: NS = no standard applicable to the designated use. T = Total D = Dissolved D
a = Result is assumed based upon a 1:1 ratio to total metals.
T&D = Total and Dissolved Bold text indicates a sample result greater than the SWQS Italicized text indicated a laboratory detection limit higher that the SWQS.
Footnotes 1 The Permittee shall report on any additional parameters that were monitored for seasonal stormwater sampling as required by Section 6.0 of this permit (Special Conditions). 2 Analytical results shall be reported in the units specified for each category or parameter. 3 Report the average flow rate for the sampling period (no more than 6 hours). 4 Standard for total PCBs of 11 μg/L A&We and 19 μg/L PBC.
5 SWQS value based on a maximum hardness of 400 mg/L. Actual hardness results were higher. 6 Results for cyanide were collected on 2/19/11 (SC046 on 2/27/11) due to missed hold time on previous samples. 7 The method blanks used by the laboratory contained the same concentration of Azobenzene as the outfall sample.
SR45 Winter
2008-09 Summer
2009 Winter
2009-10 Summer
2010 Winter
2010-11 Summer
2011 Winter
2011-12 Summer
2012 Winter
2012-13 Summer
2013 Winter
2013-14
Chlorobenzene 18,667 <0.50 18,667 <0.50 18,667 <0.50 18,667 <0.500
Chlorodibromomethane 18,667 <0.50 18,667 <0.50 18,667 <0.50 18,667 <0.500
Chloroethane (ethyl chloride) NS <5.0 NS <5.0 NS <5.0 NS <5.00
2-chloroethylvinyl ether NS <2.0 NS <2.0 NS <2.0 NS <2.00
Chloroform 9,333 <0.50 9,333 <0.50 9,333 <0.50 9,333 <0.500
Dichlorobromomethane 18,667 <0.50 18,667 <0.50 18,667 <0.50 18,667 <0.500
1,1-dichloroethane NS <1.0 NS <1.0 NS <1.0 NS <1.00
1,2-dichloroethane 186,667 <1.0 186,667 <1.0 186,667 <1.0 186,667 <1.00
1,1-dichloroethylene 46,667 <1.0 46,667 <1.0 46,667 <1.0 46,667 <1.00
1,2-dichloropropane 84,000 <0.50 84,000 <0.50 84,000 <0.50 84,000 <0.500
1,3-dichloropropylene 28,000 <1.0 28,000 <1.0 28,000 <1.0 28,000 <1.00
Ethylbenzene 93,333 <2.0 93,333 <2.0 93,333 <2.0 93,333 <2.00
Methyl bromide 1,307 <5.0 1,307 <5.0 1,307 <5.0 1,307 <5.00
Methyl chloride NS <5.0 NS <5.0 NS <5.0 NS <5.00
Methylene chloride 56,000 <3.0 56,000 <3.0 56,000 <3.0 56,000 <3.00
1,1,2,2-tetrachloroethane 93,333 <0.50 93,333 <0.50 93,333 <0.50 93,333 <0.500
Tetrachloroethylene 9,333 <0.50 9,333 <0.50 9,333 <0.50 9,333 <0.500
Toluene 373,333 <3.0 373,333 <3.0 373,333 <3.0 373,333 <3.00
1,2-trans-dichloroethylene 18,667 <1.50 18,667 <0.50 18,667 <0.50 18,667 <0.500
1,1,1-trichloroethane 1,866,667 <0.50 1,866,667 <0.50 1,866,667 <0.50 1,866,667 <0.500
1,1,2-trichloroethane 3,733 <0.50 3,733 <0.50 3,733 <0.50 3,733 <0.500
Trichloroethylene 280 <0.50 280 <0.50 280 <0.50 280 <0.500
Trimethylbenzene NS <1.5 NS <1.5 NS <2.0 <1.5
NS <2.00 <1.50
Vinyl chloride 2,800 <0.50 2,800 <0.50 2,800 <0.50 2,800 <0.500
Xylenes, Total 186,667 <3.0 186,667 <3.0 186,667 <3.0 186,667 <1.00
Acid Compounds (μg/L) 2
2-chlorophenol 4,667 <14 4,667 <12 4,667 <12 4,667 <4.92
2,4-dichlorophenol 2,800 <7.8 2,800 <6.9 2,800 <6.9 2,800 <2.76
2,4-dimethylphenol 18,667 <16 18,667 <15 18,667 <15 18,667 <5.86
4,6-dinitro-o-cresol 3,733 <15 3,733 <14 3,733 <14 3,733 <5.42
2,4-dinitrophenol 1,867 <11 1,867 <10 1,867 <10 1,867 <4.07
2-nitrophenol NS <8.2 NS <7.3 NS <7.3 NS <2.92
4-nitrophenol NS <2.4 NS <2.1 NS <2.1 NS <0.846
p-chloro-m-cresol 48,000 <7.0 48,000 <6.2 48,000 <6.2 48,000 <2.50
Pentachlorophenol 54.949 <17 224.393 <15 100.424 <15 81.270 <5.97
Phenol 180,000 <3.9 180,000 <3.5 180,000 <3.5 180,000 <1.39
2,4,6-trichlorophenol 130 <8.4 130 <7.5 130 <7.5 130 <3.01

Appendix B City of Phoenix MS4 Stormwater Permit
AZPDES Permit No. AZS000003 Page 74
NOTES: NS = no standard applicable to the designated use. T = Total D = Dissolved D
a = Result is assumed based upon a 1:1 ratio to total metals.
T&D = Total and Dissolved Bold text indicates a sample result greater than the SWQS Italicized text indicated a laboratory detection limit higher that the SWQS.
Footnotes 1 The Permittee shall report on any additional parameters that were monitored for seasonal stormwater sampling as required by Section 6.0 of this permit (Special Conditions). 2 Analytical results shall be reported in the units specified for each category or parameter. 3 Report the average flow rate for the sampling period (no more than 6 hours). 4 Standard for total PCBs of 11 μg/L A&We and 19 μg/L PBC.
5 SWQS value based on a maximum hardness of 400 mg/L. Actual hardness results were higher. 6 Results for cyanide were collected on 2/19/11 (SC046 on 2/27/11) due to missed hold time on previous samples. 7 The method blanks used by the laboratory contained the same concentration of Azobenzene as the outfall sample.
SR45 Winter
2008-09 Summer
2009 Winter
2009-10 Summer
2010 Winter
2010-11 Summer
2011 Winter
2011-12 Summer
2012 Winter
2012-13 Summer
2013 Winter
2013-14
Bases/Neutrals (μg/L) 2 SWQS None SWQS 7/21/09 SWQS 1/19/10 SWQS 7/29/10 SWQS 12/23/10
Acenaphthene 56,000 <4.0 56,000 <3.5 56,000 <3.5 56,000 <1.41
Acenaphthylene NS <16 NS <14 NS <14 NS <5.54
Anthracene 280,000 <3.9 280,000 <3.5 280,000 <3.5 280,000 <1.40
Benz(a)anthracene 0.2 <4.3 0.2 <3.9 0.2 <3.9 0.2 <1.54
Benzo(a)pyrene 0.2 <4.2 0.2 <3.7 0.2 <3.7 0.2 <1.49
Benzo(b)fluoranthene 1.9 <4.2 1.9 <3.7 1.9 <3.7 1.9 <1.49
Benzo(g,h,i)perylene NS <4.3 NS <3.8 NS <3.8 NS <1.54
Benzo(k)fluoranthene 1.9 <4.4 1.9 <3.9 1.9 <3.9 1.9 <1.56
Chrysene 19 <4.5 19 <4.0 19 <4.0 19 <1.60
Dibenz(a,h)anthracene 1.9 <4.2 1.9 <3.7 1.9 <3.7 1.9 <1.49
1,2-dichlorobenzene 5,900 <15 5,900 <13 5,900 <13 5,900 <5.39
1,3-dichlorobenzene NS <13 NS <12 NS <12 NS <4.79
1,4-dichlorobenzene 6,500 <15 6,500 <14 6,500 <14 6,500 <5.47
3,3-dichlorobenzidine 3 <18 3 <16 3 <16 3 <6.34
Diethyl phthalate 746,667 <4.4 746,667 <3.9 746,667 <3.9 746,667 <1.55
Dimethyl phthalate NS <4.4 NS <3.9 NS <3.9 NS <1.58
Di-n-butyl phthalate 1,100 <5.8 1,100 <5.1 1,100 <5.1 1,100 <2.05
2,4-dinitrotoluene 1,867 <17 1,867 <15 1,867 <15 1,867 <6.00
2,6-dinitrotoluene 3,733 <4.2 3,733 <3.8 3,733 <3.8 3,733 <1.51
Di-n-octyl phthalate 373,333 <7.6 373,333 <6.7 373,333 <6.7 373,333 <2.69
1,2-diphenylhydrazine (as azobenzene)
1.8 <4.0 1.8 <3.6 1.8 <3.6 1.8 <1.43
Fluoranthene 37,333 <4.7 37,333 <4.2 37,333 <4.2 37,333 <1.68
Fluorene 37,333 <4.0 37,333 <3.6 37,333 <3.6 37,333 <1.42
Hexachlorobenzene 747 <3.2 747 <2.9 747 <2.9 747 <1.15
Hexachlorobutadiene 187 <17 187 <15 187 <15 187 <5.89
Hexachlorocyclopentadiene 11,200 <17 11,200 <16 11,200 <16 11,200 <6.20
Hexachloroethane 850 <17 850 <15 850 <15 850 <6.01
Indeno(1,2,3-cd)pyrene 1.9 <4.3 1.9 <3.8 1.9 <3.8 1.9 <1.54
Isophorone 186,667 <4.0 186,667 <3.5 186,667 <3.5 186,667 <1.41
Naphthalene 18,667 <14 18,667 <12 18,667 <12 18,667 <4.96
Nitrobenzene 467 <4.0 467 <3.6 467 <3.6 467 <1.44
N-nitrosodimethylamine 0.03 <12 0.03 <11 0.03 <11 0.03 <4.35
N-nitrosodi-n-propylamine 86,667 <4.1 86,667 <3.6 86,667 <3.6 86,667 <1.45
N-nitrosodiphenylamine 290 <18 290 <16 290 <16 290 <6.48
Phenanthrene NS <4.0 NS <3.6 NS <3.6 NS <1.42
Pyrene 28,000 <4.7 28,000 <4.2 28,000 <4.2 28,000 <1.67
1,2,4-trichlorobenzene 9,333 <15 9,333 <13 9,333 <13 9,333 <5.29

Appendix B City of Phoenix MS4 Stormwater Permit
AZPDES Permit No. AZS000003 Page 75
NOTES: NS = no standard applicable to the designated use. T = Total D = Dissolved D
a = Result is assumed based upon a 1:1 ratio to total metals.
T&D = Total and Dissolved Bold text indicates a sample result greater than the SWQS Italicized text indicated a laboratory detection limit higher that the SWQS.
Footnotes 1 The Permittee shall report on any additional parameters that were monitored for seasonal stormwater sampling as required by Section 6.0 of this permit (Special Conditions). 2 Analytical results shall be reported in the units specified for each category or parameter. 3 Report the average flow rate for the sampling period (no more than 6 hours). 4 Standard for total PCBs of 11 μg/L A&We and 19 μg/L PBC.
5 SWQS value based on a maximum hardness of 400 mg/L. Actual hardness results were higher. 6 Results for cyanide were collected on 2/19/11 (SC046 on 2/27/11) due to missed hold time on previous samples. 7 The method blanks used by the laboratory contained the same concentration of Azobenzene as the outfall sample.
SR45 Winter
2008-09 Summer
2009 Winter
2009-10 Summer
2010 Winter
2010-11 Summer
2011 Winter
2011-12 Summer
2012 Winter
2012-13 Summer
2013 Winter
2013-14
Pesticides (μg/L) 2 SWQS None SWQS 7/21/09 SWQS 1/19/10 SWQS 7/29/10 SWQS 12/23/10
Aldrin 4.5 <0.66 4.5 <0.60 4.5 <0.30 4.5 <0.060
Alpha-BHC 1,600 <0.55 1,600 <0.50 1,600 <0.25 1,600 <0.050
Beta-BHC 560 <0.55 560 <0.50 560 <0.25 560 <0.050
Gamma-BHC 11 <0.55 11 <0.50 11 <0.25 11 <0.050
Delta-BHC 1,600 <0.55 1,600 <0.50 1,600 <0.25 1,600 <0.050
Chlordane 3.2 <7.7 3.2 <7.0 3.2 <3.5 3.2 <0.700
4,4‟-DDT 1.1 <0.66 1.1 <0.60 1.1 <0.30 1.1 <0.060
4,4‟-DDE 1.1 <0.55 1.1 <0.50 1.1 <0.25 1.1 <0.050
4,4‟-DDD 1.1 <0.55 1.1 <0.50 1.1 <0.25 1.1 <0.050
Dieldrin 4 <0.55 4 <0.50 4 <0.25 4 <0.050
Alpha-endosulfan 3 T <0.55 3 T <0.50 3 T <0.25 3 T <0.050
Beta-endosulfan 3 T <0.55 3 T <0.50 3 T <0.25 3 T <0.050
Endosulfan sulfate 3 <0.55 3 <0.50 3 <0.25 3 <0.050
Endrin 0.7 <0.66 0.7 <0.60 0.7 <0.30 0.7 <0.060
Endrin aldehyde 0.7 <0.55 0.7 <0.50 0.7 <0.25 0.7 <0.050
Heptachlor 0.9 <0.66 0.9 <0.60 0.9 <0.30 0.9 <0.060
Heptachlor epoxide 0.9 <0.55 0.9 <0.50 0.9 <0.25 0.9 <0.050
PCB-1242 4
<3.3 4 <3.0
4 <1.5
4 <0.300
PCB-1254 4 <5.5
4 <5.0
4 <2.5
4 <0.500
PCB-1221 4 <9.9
4 <9.0
4 <4.5
4 <0.900
PCB-1232 4 <0.77
4 <0.70
4 <0.35
4 <0.070
PCB-1248 4 <2.2
4 <2.0
4 <1.0
4 <0.200
PCB-1260 4 <4.4
4 <4.0
4 <2.0
4 <0.400
PCB-1016 4 <4.4
4 <4.0
4 <2.0
4 <0.400
Toxaphene 11 <7.7 11 <7.0 11 <3.5 11 <0.700

Appendix B City of Phoenix MS4 Stormwater Permit
AZPDES Permit No. AZS000003 Page 77
NOTES: NS = no standard applicable to the designated use. T = Total D = Dissolved D
a = Result is assumed based upon a 1:1 ratio to total metals.
T&D = Total and Dissolved Bold text indicates a sample result greater than the SWQS Italicized text indicated a laboratory detection limit higher that the SWQS.
Footnotes 1 The Permittee shall report on any additional parameters that were monitored for seasonal stormwater sampling as required by Section 6.0 of this permit (Special Conditions). 2 Analytical results shall be reported in the units specified for each category or parameter. 3 Report the average flow rate for the sampling period (no more than 6 hours). 4 Standard for total PCBs of 11 μg/L A&We and 19 μg/L PBC.
5 SWQS value based on a maximum hardness of 400 mg/L. Actual hardness results were higher. 6 Results for cyanide were collected on 2/19/11 (SC046 on 2/27/11) due to missed hold time on previous samples. 7 The method blanks used by the laboratory contained the same concentration of Azobenzene as the outfall sample.
OUTFALL ID: SR49 RECEIVING WATER: Salt River DESIGNATED USES: A&Wedw, PBC, FC, AgI, and AgL.
MONITORING SEASONS Summer: June 1 – October 31 Winter: November 1 – May 31
Winter 2008-09
Summer
2009
Winter
2009-10
Summer
2010
Winter
2010-11
Summer
2011
Winter
2011-12
Summer
2012
Winter
2012-13
Summer
2013
Winter
2013-14
SAMPLING DATE(S): SWQS NS SWQS 8/13/09 SWQS 1/19/10 SWQS 10/5/10 SWQS 12/23/10 SWQS SWQS SWQS SWQS SWQS SWQS
MONITORING PARAMETERS 1, 2
Conventional Parameters
Flow 3 (cfs)
NS 3.78 NS 7.305 NS 24.448 NS 7.592
pH 6.5-9 7.75 6.5-9 8.60 6.5-9 9.78 6.5-9 8.17
Temperature Varies 27.5 Varies 15.0 Varies 10.0 Varies 16.0
Hardness (mg/L) 400 140 400 73 400 183 400 92.5
Total Dissolved Solids (TDS) (mg/L) 2 NS 260 NS 58 NS 93.0 NS 160
Total Suspended Solids (TSS) (mg/L) 2
NS 740 NS 400 NS 1360 NS 205
Biochemical Oxygen Demand (BOD) (mg/L)
2
NS 47 NS 16 NS 12.6 NS 17.8
Chemical Oxygen Demand (COD) (mg/L)
2
NS NR NS 130 NS 140 NS 124
SR49 Winter
2008-09 Summer
2009 Winter
2009-10 Summer
2010 Winter
2010-11 Summer
2011 Winter
2011-12 Summer
2012 Winter
2012-13 Summer
2013 Winter
2013-14
Inorganics SWQS NS SWQS 8/13/09 SWQS 1/19/10 SWQS 10/5/10 SWQS 12/23/10 SWQS SWQS SWQS SWQS SWQS SWQS
Cyanide, total (µg/L) 2 41 T <5.0 41 T <5.0 41 T <5.0 41 T <5.00
Nutrients (mg/L) 2
Nitrate + Nitrite as N NS NR NS 0.65 NS 0.655 NS 0.870
Ammonia as N 13.2 NR 2.65 0.86 <1.32 0.861 6.089 1.01
Total Kjeldahl Nitrogen (TKN) NS NR NS 2.9 NS 4.27 NS 3.19
Total Phosphorus as P NS NR NS 0.93 NS 2.01 NS 0.642
Ortho-Phosphorus as P NS 0.41 NS 0.33 NS 0.168 NS 0.253
Microbiological
Escherichia coli (E. coli) (CFU/100 mg or MPN/100 mL)
2
575 2,950 575 >2,419.6 575 >2420 575 14,670

Appendix B City of Phoenix MS4 Stormwater Permit
AZPDES Permit No. AZS000003 Page 78
NOTES: NS = no standard applicable to the designated use. T = Total D = Dissolved D
a = Result is assumed based upon a 1:1 ratio to total metals.
T&D = Total and Dissolved Bold text indicates a sample result greater than the SWQS Italicized text indicated a laboratory detection limit higher that the SWQS.
Footnotes 1 The Permittee shall report on any additional parameters that were monitored for seasonal stormwater sampling as required by Section 6.0 of this permit (Special Conditions). 2 Analytical results shall be reported in the units specified for each category or parameter. 3 Report the average flow rate for the sampling period (no more than 6 hours). 4 Standard for total PCBs of 11 μg/L A&We and 19 μg/L PBC.
5 SWQS value based on a maximum hardness of 400 mg/L. Actual hardness results were higher. 6 Results for cyanide were collected on 2/19/11 (SC046 on 2/27/11) due to missed hold time on previous samples. 7 The method blanks used by the laboratory contained the same concentration of Azobenzene as the outfall sample.
SR49 Winter
2008-09 Summer
2009 Winter
2009-10 Summer
2010 Winter
2010-11 Summer
2011 Winter
2011-12 Summer
2012 Winter
2012-13 Summer
2013 Winter
2013-14
Total Metals (μg/L) 2 SWQS NS SWQS 8/13/09 SWQS 1/19/10 SWQS 10/5/10 SWQS 12/23/10
Antimony 640 T
1,000 D <25 T <25 D
a
640 T 1,000 D
<25 T&D 640 T
1,000 D <25 T&D
640 T 1,000 D
<25 T&D
Arsenic 80 T
340 D <10 T <10 D
a
80 T 340 D
<10 T&D 80 T
340 D 15 T
<10 D 80 T
340 D <10 T&D
Barium 98,000 T <280 T 98,000 T 160 T 11 D
98,000 T 401 T 37 D
98,000 T 123 T 32 D
Beryllium 84 T <2.0 T 84 T <2.0 T&D 84 T <2 T&D 84 T <2 T&D
Cadmium 50 T
10.91 D <3.0 T <3.0 D
a
50 T 5.79 D
<3.0 T <3.0 D
50 T 14.16 D
<3 T <3 D
50 T 7.29 D
<3 T&D
Chromium 1,000 30 T 1,000 14 T
<10 D 1,000
53 T <10 D
1,000 17 T
<10 D
Copper 500 T
18.45 D 180 T 180 D
a
500 T 9.99 D
110 T <10 D
500 T 23.75 D
184 T 19 D
500 T 12.48 D
72 T 16 D
Lead 15 T
92.97 D 48 T 48 D
a
15 T 45.778 D
30 T <10 D
15 T 123.87 D
64 T <10 D
15 T 59.32 D
17 T <10 D
Mercury 10 T 2.4 D
<0.2 T <0.2 D
a
10 T 2.4 D
<0.2 T <0.2 D
10 T 2.4 D
<0.2 T&D
10 T 2.4 D
<0.20 T&D
Nickel 511 T 622 D
43 T 43 D
a
511 T 359 D
24 T <10 D
511 T 781 D
79 T <10 D
511 T 438 D
20 T <10 D
Selenium 20 T <2.0 T 20 T <2.0 T&D 20 T <2.00 T&D
20 T <2.00 T&D
Silver 4667 T 5.74 D
<5.0 T <5.0 D
a
4667 T 1.87 D
<5.0 T <5.0 D
4667 T 9.10 D
<5 T <5 D
4667 T 2.81 D
<5 T <5 D
Thallium 1 T
700 D <0.5 T <0.5 D
a
1 T 700 D
<0.5 T&D 1 T
700 D <0.5 T&D
1 T 700 D
<0.50 T <0.5 D
Zinc 5,106 T 155.8 D
670 T 670 D
a
5,106 T 89.8 D
370 T <50 D
5,106 T 195.5 D
800 T 62 D
5,106 T 109.7 D
298 T <50 D
SR49 Winter
2008-09 Summer
2009 Winter
2009-10 Summer
2010 Winter
2010-11 Summer
2011 Winter
2011-12 Summer
2012 Winter
2012-13 Summer
2013 Winter
2013-14
Organic Toxic Pollutants SWQS NS SWQS 8/13/09 SWQS 1/19/10 SWQS 10/5/10 SWQS 12/23/10 SWQS SWQS SWQS SWQS SWQS SWQS
Total Petroleum Hydrocarbons (TPH) (mg/L)
2
NS <5.0 NS <5.0 NS <5.00 NS <5.00
Total Oil and Grease (mg/L) 2 NS <5.0 NS <5.0 NS <5.00 NS <5.00
VOCs, Semi-VOCs, & Pesticides (μg/L)
2
Acrolein 1.9 <50 1.9 <50 1.9 <50.0 1.9 <50.0
Acrylonitrile 0.2 <5.0 0.2 <5.0 0.2 <5.00 0.2 <5.00
Benzene 114 <0.50 114 <0.50 114 <0.500 114 <0.500
Bromoform 133 <1.0 133 <1.0 133 <1.00 133 <1.00
Carbon tetrachloride 2 <0.50 2 <0.50 2 <0.500 2 <0.500
Chlorobenzene 1,553 <0.50 1,553 <0.50 1,553 <0.500 1,553 <0.500

Appendix B City of Phoenix MS4 Stormwater Permit
AZPDES Permit No. AZS000003 Page 79
NOTES: NS = no standard applicable to the designated use. T = Total D = Dissolved D
a = Result is assumed based upon a 1:1 ratio to total metals.
T&D = Total and Dissolved Bold text indicates a sample result greater than the SWQS Italicized text indicated a laboratory detection limit higher that the SWQS.
Footnotes 1 The Permittee shall report on any additional parameters that were monitored for seasonal stormwater sampling as required by Section 6.0 of this permit (Special Conditions). 2 Analytical results shall be reported in the units specified for each category or parameter. 3 Report the average flow rate for the sampling period (no more than 6 hours). 4 Standard for total PCBs of 11 μg/L A&We and 19 μg/L PBC.
5 SWQS value based on a maximum hardness of 400 mg/L. Actual hardness results were higher. 6 Results for cyanide were collected on 2/19/11 (SC046 on 2/27/11) due to missed hold time on previous samples. 7 The method blanks used by the laboratory contained the same concentration of Azobenzene as the outfall sample.
SR49 Winter
2008-09 Summer
2009 Winter
2009-10 Summer
2010 Winter
2010-11 Summer
2011 Winter
2011-12 Summer
2012 Winter
2012-13 Summer
2013 Winter
2013-14
Chlorodibromomethane 13 <0.50 13 <0.50 13 <0.500 13 <0.500
Chloroethane (ethyl chloride) NS <5.0 NS <5.0 NS <5.00 NS <5.00
2-chloroethylvinyl ether 180,000 <2.0 180,000 <2.0 180,000 <2.00 180,000 <2.00
Chloroform 2,133 <0.50 2,133 <0.50 2,133 <0.500 2,133 <0.500
Dichlorobromomethane 17 <0.50 17 <0.50 17 <0.500 17 <0.500
1,1-dichloroethane NS <1.0 NS <1.0 NS <1.00 NS <1.00
1,2-dichloroethane 37 <1.0 37 <1.0 37 <1.00 37 <1.00
1,1-dichloroethylene 7,143 <1.0 7,143 <1.0 7,143 <1.00 7,143 <1.00
1,2-dichloropropane 17,518 <0.50 17,518 <0.50 17,518 <0.500 17,518 <0.500
1,3-dichloropropylene 42 <1.0 42 <1.0 42 <1.00 42 <1.00
Ethylbenzene 2,133 <2.0 2,133 <2.0 2,133 <2.00 2,133 <2.00
Methyl bromide 299 <5.0 299 <5.0 299 <5.00 299 <5.00
Methyl chloride 270,000 <5.0 270,000 <5.0 270,000 <5.00 270,000 <5.00
Methylene chloride 593 <3.0 593 <3.0 593 <3.00 593 <3.00
1,1,2,2-tetrachloroethane 4 <0.50 4 <0.50 4 <0.500 4 <0.500
Tetrachloroethylene 261 <0.50 261 <0.50 261 <0.500 261 <0.500
Toluene 8,700 <3.0 8,700 <3.0 8,700 <3.00 8,700 <3.00
1,2-trans-dichloroethylene 10,127 <0.50 10,127 <0.50 10,127 <0.500 10,127 <0.500
1,1,1-trichloroethane 1,000 <0.50 1,000 <0.50 1,000 <0.500 1,000 <0.500
1,1,2-trichloroethane 16 <0.50 16 <0.50 16 <0.500 16 <0.500
Trichloroethylene 29 <0.50 29 <0.50 29 <0.500 29 <0.500
Trimethylbenzene NS <1.5 NS <1.5 NS <2.00 <1.5
NS <2.00 <1.50
Vinyl chloride 5 <0.50 5 <0.50 5 <0.500 5 <0.500
Xylenes, Total 186,667 <3.0 186,667 <3.0 186,667 <1.00 186,667 <1.00
Acid Compounds (μg/L) 2
2-chlorophenol 30 <15 30 <12 30 <4.92 30 <4.92
2,4-dichlorophenol 59 <8.4 59 <6.9 59 <2.76 59 <2.76
2,4-dimethylphenol 171 <18 171 <15 171 <5.86 171 <5.86
4,6-dinitro-o-cresol 310 <17 310 <14 310 <5.42 310 <5.42
2,4-dinitrophenol 110 <12 110 <10 110 <4.07 110 <4.07
2-nitrophenol NS <8.9 NS <7.3 NS <2.92 NS <2.92
4-nitrophenol 4,100 <2.6 4,100 <2.1 4,100 <0.846 4,100 <0.846
p-chloro-m-cresol 15 <7.6 15 <6.2 15 <1.29 15 <2.50
Pentachlorophenol 19.30 <18 45.286 <15 164.05 <5.97 29.427 <5.97
Phenol 37 <4.2 37 <3.5 37 <1.39 37 <1.39
2,4,6-trichlorophenol 2 <9.2 2 <7.5 2 <3.01 2 <3.01

Appendix B City of Phoenix MS4 Stormwater Permit
AZPDES Permit No. AZS000003 Page 80
NOTES: NS = no standard applicable to the designated use. T = Total D = Dissolved D
a = Result is assumed based upon a 1:1 ratio to total metals.
T&D = Total and Dissolved Bold text indicates a sample result greater than the SWQS Italicized text indicated a laboratory detection limit higher that the SWQS.
Footnotes 1 The Permittee shall report on any additional parameters that were monitored for seasonal stormwater sampling as required by Section 6.0 of this permit (Special Conditions). 2 Analytical results shall be reported in the units specified for each category or parameter. 3 Report the average flow rate for the sampling period (no more than 6 hours). 4 Standard for total PCBs of 11 μg/L A&We and 19 μg/L PBC.
5 SWQS value based on a maximum hardness of 400 mg/L. Actual hardness results were higher. 6 Results for cyanide were collected on 2/19/11 (SC046 on 2/27/11) due to missed hold time on previous samples. 7 The method blanks used by the laboratory contained the same concentration of Azobenzene as the outfall sample.
SR49 Winter
2008-09 Summer
2009 Winter
2009-10 Summer
2010 Winter
2010-11 Summer
2011 Winter
2011-12 Summer
2012 Winter
2012-13 Summer
2013 Winter
2013-14
Bases/Neutrals (μg/L) 2 SWQS NS SWQS 8/13/09 SWQS 1/19/10 SWQS 10/5/10 SWQS 12/23/10
Acenaphthene 198 <4.3 198 <3.5 198 <1.41 198 <1.41
Acenaphthylene NS <17 NS <14 NS <5.54 NS <5.54
Anthracene 74 <4.3 74 <3.5 74 <1.40 74 <1.40
Benz(a)anthracene 0.02 <4.7 0.02 <3.9 0.02 <1.54 0.02 <1.54
Benzo(a)pyrene 0.02 <4.5 0.02 <3.7 0.02 <1.49 0.02 <1.49
Benzo(b)fluoranthene 0.02 <4.6 0.02 <3.7 0.02 <1.49 0.02 <1.49
Benzo(g,h,i)perylene NS <4.7 NS <3.8 NS <1.54 NS <1.54
Benzo(k)fluoranthene 0.02 <4.8 0.02 <3.9 0.02 <1.56 0.02 <1.56
Chrysene 0.02 <4.9 0.02 <4.0 0.02 <1.60 0.02 <1.60
Dibenzo(a,h)anthracene 0.02 <4.5 0.02 <3.7 0.02 <1.49 0.02 <1.49
1,2-dichlorobenzene 205 <16 205 <13 205 <5.39 205 <5.39
1,3-dichlorobenzene 2,500 <15 2,500 <12 2,500 <4.79 2,500 <4.79
1,4-dichlorobenzene 2,000 <17 2,000 <14 2,000 <5.47 2,000 <5.47
3,3-dichlorobenzidine 0.03 <19 0.03 <16 0.03 <6.34 0.03 <6.34
Diethyl phthalate 8,767 <4.7 8,767 <3.9 8,767 <1.55 8,767 <1.55
Dimethyl phthalate 17,000 <4.8 17,000 <3.9 17,000 <1.58 17,000 <1.58
Di-n-butyl phthalate 470 <6.3 470 <5.1 470 <2.05 470 <2.05
2,4-dinitrotoluene 421 <18 421 <15 421 <6.00 421 <6.00
2,6-dinitrotoluene 3,733 <4.6 3,733 <3.8 3,733 <1.51 3,733 <1.51
Di-n-octyl phthalate 373,333 <8.2 373,333 <6.7 373,333 <2.69 373,333 <2.69
1,2-diphenylhydrazine (as azobenzene) 0.2 <4.4 0.2 <3.6 0.2 3.627 0.2 <1.43
Fluoranthene 28 <5.1 28 <4.2 28 <1.68 28 <1.68
Fluorene 1067 <4.3 1067 <3.6 1067 <1.42 1067 <1.42
Hexachlorobenzene 0.0003 <3.5 0.0003 <2.9 0.0003 <1.15 0.0003 <1.15
Hexachlorobutadiene 18 <18 18 <15 18 <5.89 18 <5.89
Hexachlorocyclopentadiene 3.5 <19 3.5 <16 3.5 <6.20 3.5 <6.20
Hexachloroethane 3.3 <18 3.3 <15 3.3 <6.01 3.3 <6.01
Indeno(1,2,3-cd)pyrene 0.2 <4.7 0.2 <3.8 0.2 <1.54 0.2 <1.54
Isophorone 961 <4.3 961 <3.5 961 <1.41 961 <1.41
Naphthalene 1,524 <15 1,524 <12 1,524 <4.96 1,524 <4.96
Nitrobenzene 138 <4.4 138 <3.6 138 <1.44 138 <1.44
N-nitrosodimethylamine 0.03 <13 0.03 <11 0.03 <4.35 0.03 <4.35
N-nitrosodi-n-propylamine 0.5 <4.4 0.5 <3.6 0.5 <1.45 0.5 <1.45
N-nitrosodiphenylamine 6 <20 6 <16 6 <6.48 6 <6.48
Phenanthrene 30 <4.3 30 <3.6 30 <1.42 30 <1.42
Pyrene 800 <5.1 800 <4.2 800 <1.67 800 <1.67
1,2,4-trichlorobenzene 70 <16 70 <13 70 <5.29 70 <5.29

Appendix B City of Phoenix MS4 Stormwater Permit
AZPDES Permit No. AZS000003 Page 81
NOTES: NS = no standard applicable to the designated use. T = Total D = Dissolved D
a = Result is assumed based upon a 1:1 ratio to total metals.
T&D = Total and Dissolved Bold text indicates a sample result greater than the SWQS Italicized text indicated a laboratory detection limit higher that the SWQS.
Footnotes 1 The Permittee shall report on any additional parameters that were monitored for seasonal stormwater sampling as required by Section 6.0 of this permit (Special Conditions). 2 Analytical results shall be reported in the units specified for each category or parameter. 3 Report the average flow rate for the sampling period (no more than 6 hours). 4 Standard for total PCBs of 11 μg/L A&We and 19 μg/L PBC.
5 SWQS value based on a maximum hardness of 400 mg/L. Actual hardness results were higher. 6 Results for cyanide were collected on 2/19/11 (SC046 on 2/27/11) due to missed hold time on previous samples. 7 The method blanks used by the laboratory contained the same concentration of Azobenzene as the outfall sample.
SR49 Winter
2008-09 Summer
2009 Winter
2009-10 Summer
2010 Winter
2010-11 Summer
2011 Winter
2011-12 Summer
2012 Winter
2012-13 Summer
2013 Winter
2013-14
Pesticides (μg/L) 2 SWQS NS SWQS 8/13/09 SWQS 1/19/10 SWQS 10/5/10 SWQS 12/23/10
Aldrin 0.00005 <0.38 0.00005 <1.2 0.00005 <0.600 0.00005 <0.120
Alpha-BHC 0.005 <0.32 0.005 <1.0 0.005 <0.500 0.005 <0.100
Beta-BHC 0.02 <0.32 0.02 <1.0 0.02 <0.500 0.02 <0.100
Gamma-BHC 1 <0.32 1 <1.0 1 <0.500 1 <0.100
Delta-BHC 1,600 <0.32 1,600 <1.0 1,600 <0.500 1,600 <0.100
Chlordane 0.0008 <4.4 0.0008 <14 0.0008 <7.00 0.0008 <1.40
4,4‟-DDT 0.0002 <0.38 0.0002 <1.2 0.0002 <0.600 0.0002 <0.120
4,4‟-DDE 0.0002 <0.32 0.0002 <1.0 0.0002 <0.500 0.0002 <0.100
4,4‟-DDD 0.0002 <0.32 0.0002 <1.0 0.0002 <0.500 0.0002 <0.100
Dieldrin 0.00005 <0.32 0.00005 <1.0 0.00005 <0.500 0.00005 <0.100
Alpha-endosulfan 0.2 <0.32 0.2 <1.0 0.2 <0.500 0.2 <0.100
Beta-endosulfan 0.2 <0.32 0.2 <1.0 0.2 <0.500 0.2 <0.100
Endosulfan sulfate 0.2 <0.32 0.2 <1.0 0.2 <0.500 0.2 <0.100
Endrin 0.004 >0.38 0.004 <1.2 0.004 <0.600 0.004 <0.120
Endrin aldehyde 0.09 <0.32 0.09 <1.0 0.09 <0.500 0.09 <0.100
Heptachlor 0.00008 <0.38 0.00008 <1.2 0.00008 <0.600 0.00008 <0.120
Heptachlor epoxide 0.00004 <0.32 0.00004 <1.0 0.00004 <0.500 0.00004 <0.100
PCB-1242 4 <1.9
4 <6.0 4 <3.00
4 <0.600
PCB-1254 4 <3.2
4 <10 4 <5.00
4 <1.00
PCB-1221 4 <5.7
4 <18 4 <9.00
4 <1.80
PCB-1232 4 <0.44
4 <1.4 4 <0.700
4 <0.140
PCB-1248 4 <1.3
4 <4.0 4 <2.00
4 <0.400
PCB-1260 4 <2.5
4 <8.0 4 <4.00
4 <0.800
PCB-1016 4 <2.5
4 <8.0 4 <4.00
4 <0.800
Toxaphene 0.0003 <4.4 0.0003 <14 0.0003 <7.00 0.0003 <1.40


Appendix B City of Phoenix MS4 Stormwater Permit
AZPDES Permit No. AZS000003 Page 83
PART 10: ASSESSMENT OF MONITORING DATA
A. Stormwater Quality: Provide an evaluation of the sampling results for each outfall monitoring location, including an assessment of any improvements or degradation of stormwater quality from each drainage area. In the year 4, Annual Report, discuss possible explanations for stormwater quality trends, including the implementation of stormwater management practices to reduce the discharge of pollutants to and from the storm sewer system.
E. coli is the most common contaminant in Phoenix stormwater runoff. It consistently appears in elevated concentrations at each monitoring location. Total lead has also been observed in elevated concentrations at each monitoring location. However, elevated lead only occurred once at SC046 and AC33, and has occurred sporadically at SR03 and SR45. Dissolved copper has been observed in elevated concentrations consistently at SR45, sporadically at IB08, SR49, and infrequently (once) at SR03.
Two years of water quality data is insufficient to adequately evaluate trends in stormwater quality from each drainage area. However, the City will evaluate improvements or degradation of stormwater quality from each drainage area when we have more data to compare.
B. Water Quality Standards (WQS): Compare the sampling results for each outfall monitoring location with the applicable SWQS for the receiving water.
The applicable SWQS for each monitoring station are dependent upon the designated uses for the specific receiving water. Table 10-1 includes the designated uses for each monitoring location:
Table 10-1 Designated Uses for Monitoring Locations
Outfall Receiving Water Designated Uses
AC33 AC/DC AgI, AgL
IB08 Indian Bend Wash A&We, PBC
SR03 Salt River at 35th Avenue A&Wedw, PBC, FC, AgI, and AgL
SR30 Salt River at 27th Avenue A&Wedw, PBC, FC, AgI, and AgL
SR45 Salt River at 40th Street A&We, PBC
SR49 Salt River at 67th Avenue A&Wedw, PBC, FC, AgI, and AgL
SC046 Skunk Creek Wash A&We, PBC
AgI = Agricultural Irrigation
AgL = Agricultural Livestock Watering
A&We = Aquatic and Wildlife, Ephemeral
A&Wedw =Aquatic and Wildlife, Effluent Dependent Water (acute)
PBC = Partial Body Contact
FC = Fish Consumption

Appendix B City of Phoenix MS4 Stormwater Permit
AZPDES Permit No. AZS000003 Page 84
The analytical results reported were compared to the lowest applicable standard, as documented in Part 9.
C. Exceeding a WQS: Note any exceedance of a surface water quality standard (as measured at the outfall) during the reporting year, including, at a minimum, the following information:
1. Sampling dates: See Table 10-2
2. Monitoring location (outfall identification number): See Table 10-2
3. Receiving water and water quality standard exceeded: See Table 10-2
4. Outfall monitoring results (laboratory reports): See Table 10-2
Table 10-2 Analytical Results Exceeding SWQS for FY 10/11
Outfall Parameter Sampling
Date Receiving
Water Designated
Use SWQS Result
IB08
E. Coli 7/31/10 Indian Bend
Wash PBC
575 MPN/100 mL
8,130 MPN/100 mL
E. Coli 12/16/10 Indian Bend
Wash PBC
575 MPN/100 mL
5,380 MPN/100 mL
Lead (Total) 7/31/10 Indian Bend
Wash PBC 15 µg/L 27 µg/L
SC046 Lead (Total) 10/5/10
Skunk Creek Wash
PBC 15 µg/L 85 µg/L
Azobenzene 10/5/10 Skunk Creek
Wash PBC 1.8 µg/L 1.82 µg/L
1
AC33
E. Coli 8/28/10 Arizona Canal
Diversion Canal
PBC 575
MPN/100 mL 5,210
MPN/100 mL
E. Coli 12/22/10 Arizona Canal
Diversion Canal
PBC 575
MPN/100 mL 38,730
MPN/100 mL
Lead (Total) 8/28/10 Arizona Canal
Diversion Canal
PBC 100 µg/L 164 µg/L
SR03
E. Coli 7/31/10 Salt River PBC 575
MPN/100 mL 594,000
MPN/100 mL
E. Coli 12/23/10 Salt River PBC 575
MPN/100 mL 23,590
MPN/100 mL
Copper (Dissolved) 7/31/10 Salt River PBC 15.96 µg/L 31 µg/L
Lead (Total) 7/31/10 Salt River PBC 15 µg/L 27 µg/L
SR30
E. Coli 8/28/10 Salt River PBC 575
MPN/100 mL 10,810
MPN/100 mL
E. Coli 12/23/10 Salt River PBC 575
MPN/100 mL 14,140
MPN/100 mL
Lead (Total) 8/28/10 Salt River PBC 15 µg/L 71 µg/L
Lead (Total) 12/23/10 Salt River PBC 15 µg/L 62 µg/L
Azobenzene 8/29/10 Salt River PBC 0.2 µg/L 9.00 µg/L1

Appendix B City of Phoenix MS4 Stormwater Permit
AZPDES Permit No. AZS000003 Page 85
Outfall Parameter Sampling
Date Receiving
Water Designated
Use SWQS Result
SR45
E. Coli 7/29/10 Salt River PBC 575
MPN/100 mL 860
MPN/100 mL
E. Coli 12/22/10 Salt River PBC 575
MPN/100 mL 7,540
MPN/100 mL
Copper (Dissolved) 7/29/10 Salt River A&We 27.62 µg/L 14.55 µg/L
Copper (Dissolved) 12/22/10 Salt River A&We 46 µg/L 22 µg/L
Lead (Total) 7/29/10 Salt River PBC 15 µg/L 63µg/L
SR49
E. Coli 10/5/10 Salt River PBC 575
MPN/100 mL >2420
MPN/100 mL
E. Coli 12/23/10 Salt River PBC 575
MPN/100 mL 14,670
MPN/100 mL
Copper (Dissolved) 10/5/10 Salt River A&Wedw 15.96 µg/L 19 µg/L
Copper (Dissolved) 12/23/10 Salt River A&Wedw 8.42 µg/L 16 µg/L
Lead (Total) 10/5/10 Salt River PBC 15 µg/L 64 µg/L
Lead (Total) 12/23/10 Salt River PBC 15 µg/L 17 µg/L
pH 10/2/10 Salt River 6.50 - 9.0 9.782
Azobenzene 10/5/10 Salt River A&Wedw 0.2 µg/L 3.62 µg/L1
FC = fish consumption PBC = partial body contact A&We = aquatic and wildlife ephemeral A&Wedw = aquatic and wildlife effluent dependent water (acute) MPN/100 mL = most probable number of bacteria per 100 milliliters µg/L = micrograms per liter 1 Azobenzene was detected at the same concentration in the laboratory method blanks.
2 This storm event included significant hail; the flow, sample temperature, and pH were all unusual.
5. A description of the circumstances that may have caused or contributed to the exceedance of an applicable water quality standard:
Six of the seven monitoring stations showed elevated E. coli levels. These exceedances seem to be independent of predominant land uses. One likely source of E. Coli in stormwater is pet waste. However, other wildlife sources, including birds and bats should also be considered.
Dissolved copper was elevated at three outfalls. Copper is a common component in pesticides, fungicides, and insecticides. This includes algaecides commonly used in pools, spas, and fountains. Copper is also used in automotive parts such as brake pads, brake linings, and moving engine parts. Consequently, sources of elevated copper could include automotive repair shops, roadway run-off, and pool backwashing.
All seven monitoring stations showed elevated lead levels. Lead is used in automotive parts, including tires and batteries. Lead-based paint was also used on buildings and road stripping, and lead was a common additive in gasoline until the 1970‟s and early 1980‟s. Therefore, sources of elevated lead could include automotive repair shops, lead tire weights, roadway run-off, and lead-containing sediment deposited in the past from automotive exhaust.
Three monitoring stations showed elevated levels of azobenzene for the first time. However, the samples collected on August 28, 2010 and October 5, 2010 for azobenzene may be biased high, as they were detected in the method blank at the

Appendix B City of Phoenix MS4 Stormwater Permit
AZPDES Permit No. AZS000003 Page 86
same concentration and flagged accordingly. The laboratory used the method detection limit as the reporting limit for Methods 625 and 608. Accordingly, all values between the method detection limit (MDL) and the laboratory‟s practical quantitation limit (PQL) should be considered estimated. The laboratory was unable to provide additional verification of the azobenzene detection when contacted by the City.
One monitoring station showed an elevated pH. The storm event on October 5, 2010 produced significant hail in the vicinity of the 67th Avenue outfall. The water temperature was 12 degrees Celsius less than the water temperature at the Skunk Creek outfall, and the flow was ten times greater. It is unclear if the unusual storm event could have been a factor in the elevated pH. However, the stormwater runoff from this event should not be considered typical, and there has not been another elevated pH at this location.
6. If a pollutant is noted at levels above the WQS at a particular outfall, more than 1X („reoccurs‟), describe actions taken to determine the source(s) of the pollutant per Sections 4.3 and 4.4 of the permit. Also state any proposed follow-up actions or additional and/or revised management practices or pollution controls to prevent the discharge from causing or contributing to an exceedance of a water quality standard in the future:
In December 2009, the City developed a “Wet Weather Monitoring – SWQS Exceedance Protocol.” The purpose of the procedure is to ensure compliance with Sections 4.2, 4.4, and 8.3 of the MS4 Permit. The procedure discusses how a SWQS exceedance is identified, assigns the responsibility for attempting to identify potential sources of the pollutant(s) of concern and evaluating existing BMPs that may require revision to address the issue(s), provides a schedule for implementation, and outlines the requirements for reporting the occurrence to ADEQ.
This fiscal year, the City identified recurring exceedances of E. coli at six of the seven monitoring stations. SC046 did not have an exceedance of E. coli this fiscal year, though the site has had two past exceedances so far this permit term. The city identified recurring exceedances for total lead at five of the seven monitoring stations and first time exceedances at two monitoring stations (SC046 and AC33). The city identified two recurring exceedances of dissolved copper this year (SR45 & SR49) and one first time exceedance (SR03). One monitoring location (IB08) did not have an exceedance of dissolved copper this fiscal year, but did have two past exceedances, so far this permit term. Though elevated hardness recurred at one outfall, SR30, over the permit term, no elevated hardness was recorded this fiscal year.
The first step in evaluating each exceedance was to research potential sources of these pollutants in stormwater. A summary of these findings is discussed in Part 10, Section 5, above. Water Quality Inspectors were provided with a summary of the potential sources, along with information on the catchment area for each outfall in question. The inspectors then drove through each catchment area, looking for any obvious causes of the exceedances. In most situations, the inspectors were unable to identify a likely source of the elevated levels. A summary of their findings is included below:

Appendix B City of Phoenix MS4 Stormwater Permit
AZPDES Permit No. AZS000003 Page 87
SC046
This is a residential area adjacent to a mountain. The inspector noted abundant wildlife (e.g., reptiles, birds, rabbits, ground squirrels, etc.) as well as several pets. He observed evidence of domestic pet waste in the area. Other than pets and wildlife, the inspector did not identify any likely causes of the E. coli exceedance.
The inspector did not observe any likely causes of the one lead exceedance in this area.
IB08
A team of two inspectors evaluated this area. Much of this drainage area is residential, with a few commercial facilities. Within the residential area, there are two parks and multiple equine properties. A few of the equine properties had visible piles of horse manure. The domestic pets and equestrian properties could be a contributing source for the elevated E. coli levels.
The inspectors did not identify any obvious sources of lead or copper.
AC33
An inspector investigated the E. coli exceedances for this outfall. Other than domestic pets and one homeless individual, no obvious causes were noted.
SR03
A team of three inspectors evaluated this area for obvious sources of E. coli, dissolved copper, and total lead. The inspectors observed no obvious sources of elevated E. coli, other than typical house pets, stray animals, and several transients.
The inspectors noted that the area includes numerous scrap yards, automotive repair businesses, and other commercial businesses, as well as older residential homes. Though these are all possible sources for elevated copper and lead, no obvious sources were identified.
SR30
Two inspectors evaluated this area for obvious sources of E. coli. The area includes a neighborhood park, which could be a source for the E. coli exceedances. Another possible source of the E. coli exceedance is a sanitary sewer overflow (SSO), which was reported in the area in early September, 2010.
Though the drainage area includes many industrial properties, including auto/truck salvage operations, no obvious sources of lead were identified.
SR45
This drainage area is mostly composed of commercial and light industrial properties. The inspector observed a vactor truck at one property. It was unclear what was occurring, therefore, the property was added to the industrial inspection list to follow-up. Much of the area uses septic tank systems for wastewater management. Though

Appendix B City of Phoenix MS4 Stormwater Permit
AZPDES Permit No. AZS000003 Page 88
no leaking leach fields were observed during the reconnaissance, it is possible that failing septic leach fields may contribute to the E. coli readings.
No obvious sources of lead or copper were identified.
SR49
The inspector identified several agricultural properties throughout the catchment area, as well as newer residential and light industrial properties. Farm animals such as cows, goats, chickens, and horses were observed. Many of these properties are irrigated by SRP flood irrigation, which can overflow into the street, which may contribute to the elevated E. coli levels.
No obvious sources of lead were identified.
7. A schedule for implementing the proposed follow-up, stormwater or non-stormwater management practices or pollution controls:
As described above, city inspectors conducted thorough visual reconnaissance of each catchment area, searching for potential sources of the elevated levels. No obvious cause of the elevated E. coli, lead, and copper were identified.
The potential sources for these pollutants are varied. E. coli can come from a variety of sources, including pet waste and bird droppings. Though the city cannot control wild birds, the PWD does enforce pet waste requirements. Phoenix City Code, Chapter 27, Section 27-12 requires all animal owners and custodians to immediately clean up and properly dispose of animal waste left on any public street, alley, gutter, sidewalk, right-of-way, or park. Staff hangs notices on doorknobs to educate the public regarding the need to clean up and properly dispose of pet wastes. The door hangers or similarly worked placards are posted at public facilities such as parks, libraries, and other locations. Pet waste bags are also provided at many city parks.
Lead and copper can come from a variety of residential, commercial, and industrial sources. Therefore, the city has decided to use these chemical constituents as one criterion to prioritize industrial facility inspections. Thirty six facilities were identified through EPA Tier II reports as using or storing large quantities of copper and/or lead on site. In addition, approximately 1,600 facilities were identified through an SIC code search as potentially using these chemicals. These facilities, along with permit-required facilities, will make up the „high priority‟ industrial facility inventory. Inspections of these facilities have already begun, and will continue throughout the permit term.
The city plans to research and analyze additional reduction strategies for these pollutants.

Appendix B City of Phoenix MS4 Stormwater Permit
AZPDES Permit No. AZS000003 Page 89
PART 11: ESTIMATE OF ANNUAL POLLUTANT LOADINGS
Provide an estimate of the pollutant loadings each year from the municipal storm sewer system to waters of the U.S. for each constituent listed in Section 7.4 of the permit detected by stormwater monitoring within the permit term. Pollutant loadings and event mean concentrations may be estimated from sampling data collected at the representative monitoring locations, taking into consideration land uses and drainage areas for the outfall. Include a description of the procedures for estimating pollutant loads and concentrations, including any modeling, data analysis, and calculation methods. Compare the pollutant loadings estimated each year to previous estimates of pollutant loadings.
The City of Phoenix (City) has calculated annual and seasonal pollutant load estimates for pollutants detected in the City‟s stormwater discharges. In accordance with Arizona Revised Statute (A.R.S.) Title 49, Chapter 2, Article 31 and AZPDES Permit Number AZS000003, the estimates include pollutants that are infrequently detected as well as pollutants that are routinely detected in the discharges. Total pollutant load estimates for all watershed basins within the Phoenix Municipal Separate Storm Sewer System (MS4) are presented in Table 11-1.

Appendix B City of Phoenix MS4 Stormwater Permit
AZPDES Permit No. AZS000003 Page 90
Table 11-1 2010-2011 Pollutant Load for Permitted Receiving Waters
Constituent
Summer Pollutant
Load (pounds)
Winter Pollutant
Load (pounds)
Total Annual
Pollutant Load
(pounds)
BOD5 577,941 170,291 748,233
COD High Level 2,342,158 695,352 3,037,510
Residue, Total at 105 Deg.C (TDS) 3,448,714 1,028,673 4,477,387
Nitrogen NO2 + NO3, Total (as N) 46,394 13,830 60,224
Nitrogen Organic, Total Kjeldahl (as N) 92,044 27,480 119,525
Phosphorous, Total, (as P) 10,926 3,233 14,159
Arsenic, Total Recoverable 148 44 191
Antimony, Total Recoverable
Barium, Total Recoverable
Beryllium, Total Recoverable, 6 2 8
Cadmium, Total Recoverable 102 30 133
Chromium, Total Recoverable 392 117 510
Copper, Total Recoverable 1,349 394 1,743
Lead, Total Recoverable 721 215 937
Mercury, Total Recoverable 10 3 13
Nickel, Total Recoverable 475 142 617
Selenium Total Recoverable 46 14 60
Silver, Total Recoverable 0 0 0
Thallium Total Recoverable
Zinc, Total Recoverable 4,267 1,262 5,529
Insufficient Data, Not Calculated
Insufficient Data, Not Calculated
Insufficient Data, Not Calculated

Appendix B City of Phoenix MS4 Stormwater Permit
AZPDES Permit No. AZS000003 Page 91
This section includes an in-depth description of the approach and methods used to determine the pollutant load estimates as well as land use-specific concentration information and tables summarizing pollutant load estimates for individual watershed basins. The method used since the first permit term is the so-called “Simple Method” of Schuler (1987), or,
Lkj = EMCkj * Rk.
where, Ljk = load of pollutant, j from the kth stormwater basin
EMCkj = event mean concentration for the jth pollutant in the kth stormwater basin
Rk = runoff volume of the kth stormwater basin
When reviewing these estimates, it is important to note that there is limited data available. This paucity of data makes it difficult to assess the significance of the pollutant loads. The variability of rainfall and the small number of representative rainfall events that occur in the arid Phoenix environment limit the City‟s ability to collect statistically significant amounts of sampling data. From 1997 to 2011, the City has intermittently experienced severe to moderate drought; the first half of 2011 was a period of severe drought for the Phoenix area.
City Wide Pollutant Loads
Seasonal and annual pollutant load estimates were developed for all of the City‟s thirteen stormwater basins for the period of July 1, 2010 through June 30, 2011 (Table 11-1). Winter, summer, and total annual loads were computed for all water quality parameters where sufficient validated data was available. As in past years, results from the City‟s monitoring data were used to correlate pollutant concentrations with land uses for thirteen stormwater basins in Phoenix. Where data was insufficient to perform this evaluation, information from the City‟s 2001 Permit Renewal Application was used. The “Simple Method” as described in USEPA‟s guidance documents was used in performing this analysis.1 The following methodology was used in developing pollutant loads:
In the Part 1 MS4 NPDES Permit Application, the City was divided into thirteen stormwater basins, based upon outfall locations that impacted specific water conveyance structures or tributaries of the Salt River. The chemical mass conveyed by these structures and tributaries constituted the pollutant load, as characterized by the application. Each year since the Part I report was accepted by EPA, Region IX, the City has calculated the load in this manner.
1 Guidance Manual for the Preparation of Part 2 of the NPDES Permit Applications for Discharges from Municipal Separate Storm Sewer System, November 1992.

Appendix B City of Phoenix MS4 Stormwater Permit
AZPDES Permit No. AZS000003 Page 92
Land-use data for each of the thirteen stormwater basins was obtained from the facility information update presented in the 2001 Permit Renewal Application filed by the City, as updated by previous City of Phoenix Municipal Separate Storm Sewer System Annual Reports. For the purposes of this model, four land-uses were defined from the data: Industrial, Commercial, Residential, and Open Space. The Part 1 application demonstrated that, on a city-wide scale, these four land-use type provide the strongest distinction in stormwater composition.
The Part 1 application also developed pollutant-specific, rainfall-event-normalized, storm-water loading factors for each of the four land-use categories. These factors, called event-mean concentrations, or EMCs represent the concentration of each pollutant of concern in the runoff from the four land-use types. The concentration is normalized to the amount of rainfall in the sampling event to accommodate the dynamic nature of runoff chemistry.
Rainfall runoff was generated from data collected by the thirty-five Maricopa County Flood Control District (MCFCD) ALERT meteorological stations. Stations were located on GIS projections and rainfall records assigned to each of the thirteen catchments. Monthly rainfall amounts were used for the summer (July 2010 to December 2010) and winter (January 2011 to June 2011) total amounts for the permit year.
Rainfall was translated to runoff as part of the load calculation, using (Schuler 1987),
R = Pj (P)(Rv)(A)
where, P = rainfall depth (inches)
Pj = fraction of events that produce runoff (0.9)
Rv = runoff coefficient
A = catchment area (acres)
Catchment areas were measured from GIS projections. Runoff coefficients that were utilized for each land use are as follows (developed specially for Phoenix under the 2001 Permit Renewal Application effort):
Industrial: 0.053
Commercial: 0.745
Residential: 0.236
Open Space: 0.04

Appendix B City of Phoenix MS4 Stormwater Permit
AZPDES Permit No. AZS000003 Page 93
The current AZPDES permit indicates that, if possible, annual monitoring data be used to generate concentration factors in the load model. As in past years, EMCs were taken from the COP Part 1 NPDES MS4 characterization data. These values were compared to USGS monitoring results (Table 11-2) from representative storms.
As in the previous year, several elemental pollutants of concern were not found in Phoenix stormwater at levels above method detection limits. This result, along with the lack of historic stormwater data for thallium, antimony and barium, means that EMCs could not be calculated at this time for these three pollutants of concern and no load was estimated. The silver load has always been estimated at zero, based on eighteen years of data.
EMCs were determined for each land-use type and pollutant of concern, as possible (Table 11-2). For each of the thirteen stormwater basins , EMCs were weighted by the percentage of land-use type, or
EMCk, j = (EMC j, industrial * % areak, industrial) +
(EMC j, commercial * % areak, commercial) +
(EMC j, residential * % areak, residential) +
(EMCj, open space * % areak, open space)
where, EMCk, j = event mean concentration for the kth catchment and the jth pollutant
Thus each catchment has a unique EMC for each pollutant, dependent upon land use.
For each of the thirteen stormwater basins, total runoff was calculated for the summer and winter seasons. These volumes were multiplied by the EMCs and the seasonal load was calculated (Tables 11-3 through 11-15). Seasonal loads were added to give the annual load per pollutant per catchment. Summation over the thirteen stormwater basins produced the estimated annual load to the Salt River for each pollutant over the permit year.

Appendix B City of Phoenix MS4 Stormwater Permit
AZPDES Permit No. AZS000003 Page 94
Table 11-2 Pollutant Concentration Factors Used For Each Land-Use Category
USGS data
(ave all sites)1 PCopen PCresidential PCindustrial PCcommercial2
BOD5 (mg/l) 30.8 31 12 55.3 0
COD High Level (mg/l) 203 130 42.3 68.8 148
Residue, Total at 105 Deg.C (TDS) 551 120 111 122.61 84Nitrogen NO2 + NO3, Total (mg/l as N) 1.21 3.12 1.24 1.14 0.7
Nitrogen Organic, Total Kjeldahl (mg/l as N) 4.7 3.4 3.00 2.73 2.27
Phosphorous Total (mg/l as P) 1.48 0.41 0.26 0.78 0.3
Arsenic Total (ug/l as As) 11.1 2.40 5.24 7.77 2.95
Antimony Total (ug/l as Sb) <0.025
Barium Total (ug/l as Ba) 171
Beryllium Total Recoverable (ug/l as Be) 0.99 1.1 0 0 0
Cadmium Total Recoverable (ug/l as Cd) 1.95 0 3.38 3.68 6.63
Chromium Total Recoverable (ug/l as Cr) 12.2 24.3 12.3 3.68 5.71
Copper, Total Recoverable, (ug/l as Cu) 103 29 23.3 203.7 15
Lead, Total Recoverable, (ug/l as Pb) 48.4 19.9 25.2 29.7 12.5
Mercury, Total Recoverable, (ug/l as Hg) <0.0020 1.08 0.197 0.0843 0.0362
Nickel, Total Recoverable, (ug/l as Ni) 20.7 23.4 13.4 15.4 12.1
Selenium Total Recoverable, (ug/l as Se) <0.0020 7.13 0.0861 1.20 0.388
Silver, Total Recoverable, (ug/l as Ag) <0.0050 0 0 0 0
Thallium Total Recoverable, (ug/l as Th) <0.0005
Zinc, Total Recoverable, (ug/l as Zn) 308 96 109 346 135
Insufficient Data, Not Calculated
Insufficient Data, Not Calculated
Insufficient Data, Not Calculated
NOTES: 1. Censored non detects included in mean as per USACOE 2008, Manual 1110-1-4014, ENVIRONMENTAL STATISTICS
2. Event mean concentrations from 2001 MS4 application, as modif ied by montoring data to date. See text.

Appendix B City of Phoenix MS4 Stormwater Permit
AZPDES Permit No. AZS000003 Page 95
Because of the revisions to the City‟s renewed AZPDES permit, some changes were made in the reporting requirements, including the dropping of several previous pollutants of concern and the adding of others. EMCs were used for each of the four land-use categories as in previous annual reports and the calculation methodology was not changed. The five new pollutants of concern, TKN, antimony, mercury, selenium, barium, and thallium required new EMCs. This presents a problem in that the five elements listed are not commonly found in stormwater at levels above the detection levels of EPA standard methods for waste water. Based upon the results of the original COP M4 Part 1 stormwater characterization (1992), the USGS study of Phoenix area stormwater (Lopes et al. 1995, Fossum et al. 2001), and the EPA Nationwide Urban Runoff Program (EPA 1983), these parameters were previously excluded from both the monitoring requirements and load calculations of the original permit (1997).
Because they were not listed in the original permit requirements, past-year monitoring data for these five elements are not available. Nevertheless, EMCs were calculated for mercury and selenium from the COP MS4 Part 1 characterization data; however the data quality of the EMCs for mercury and selenium are not as high as the other pollutants of concern because of numerous results below detection levels. The loads estimated for these metals should be reviewed with this caveat in mind. In addition, no thallium has ever been detected in Phoenix stormwater at level above detection and only sporadic hits of barium (6 in ACDC only) or antimony (3 in SR45) were reported by the USGS. For this reason, no EMCs were calculated for thallium, antimony, and barium and no load was estimated.
EMCs were determined for each land-use type and pollutant of concern, as possible (Table 11-2). For each of the thirteen stormwater basins , EMCs were weighted by the percentage of land-use type, or
EMCk, j = (EMC j, industrial * % areak, industrial) +
(EMC j, commercial * % areak, commercial) +
(EMC j, residential * % areak, residential) +
(EMCj, open space * % areak, open space)
where, EMCk, j = event mean concentration for the kth catchment and the jth pollutant
Thus each catchment has a unique EMC for each pollutant, dependent upon land use.
For each of the thirteen stormwater basins, total runoff was calculated for the summer and winter seasons. These volumes were multiplied by the EMCs and the seasonal load was calculated (Tables 11-3 to 11-15). Seasonal loads were added to give the annual load per pollutant per catchment. Summation over the thirteen stormwater basins produced the estimated annual load to the Salt River for each pollutant over the permit year.

Appendix B City of Phoenix MS4 Stormwater Permit
AZPDES Permit No. AZS000003 Page 96
Table 11-3: East Fork of Cave Creek Basin Pollutant Loadings
5,903 Residential: 64.97% Industrial : 10.54% Undeveloped: 15.64% Commercial: 8.84%
15,935,571 5,762,350
Nitrogen Organic, Total Kjeldahl (mg/L as N)
Beryllium, Total Recoverable, ( g/L as Be)
Cadmium, Total Recoverable, ( g/L as Cd)
0.42
12.61
2,954
123
57
0.23
12.68
0.17
3.17
463
1,068 4,022
340
2.97
0.34Phosphorous, Total, (mg/L as P)
111.23
1.48
4.86
Mercury, Total Recoverable, ( g/L as Hg)
Lead, Total Recoverable, ( g/L as Pb)
Chromium, Total Recoverable, ( g/L as Cr)
Copper, Total Recoverable, ( g/L as Cu)
Residue, Total at 105 Deg.C (TDS)
BOD5 (mg/L)
COD High Level (mg/L)
Nitrogen NO2 + NO3, Total, (mg/L as N)
Zinc, Total Recoverable, ( g/L as Zn)
Silver, Total Recoverable, ( g/L as Ag)
Selenium Total Recoverable, ( g/L as Se)
0.00
134.03
1.33
Nickel, Total Recoverable, ( g/L as Ni)
23.59
42
Total Annual Pollutant
Load (pounds)
Winter Pollutant Load
(pounds)
40,014 150,672
531 1,999
4.29
24,505 92,272
18.48 18,381 6,647 25,028
68.12
182
0 0
7
0.06
133
8.53 32.13
14.98 5.42
1.33 0.48 1.81
0
48
Summer Pollutant
Load (pounds)
67,767
20.40
4.56 17.17
0.31
110,658
4.83
Total area, acres:
Constituent
Total Winter (Jan-Jun)
Runoff, cubic feet:
Total Summer (July-Dec)
Runoff, cubic feet:
Arsenic, Total, ( g/L as As)
42.44
0.31 0.11
0.17
Land Use
weighted
concentrations
15.06
1.75
3.15 1.14
1,468
23.72
15

Appendix B City of Phoenix MS4 Stormwater Permit
AZPDES Permit No. AZS000003 Page 97
Table 11-4: Grand Canal Basin Pollutant Loadings
267 Residential: 23.06% Industrial : 17.57% Undeveloped: 10.54% Commercial: 48.85%
2,021,135 485,977
Nitrogen Organic, Total Kjeldahl (mg/L as N)
Beryllium, Total Recoverable, ( g/L as Be)
Cadmium, Total Recoverable, ( g/L as Cd)
0.18
3.01
2.22
0.73
1.38
8.07
25.34
0.01 0.03
0.54 0.13
0
1
0.14
0.01
1.11
0.59
0.27
6.50 1.56
4.9120.42
0.02
2.43 0.58
0.43
0.15 0.04
00.00 0
161.87
5
8.83
51.54
1.17
19.23
0.19
14.17
Total area, acres:
2.64
Total Winter (Oct-Mar)
Runoff, cubic feet:
Total Summer (Apr-Sept)
Runoff, cubic feet:
Residue, Total at 105 Deg.C (TDS)
BOD5 (mg/L)
1.16
15.76
0.02
413
12 61
80
0.0035
16,878
0.39
3,27213,606
15,78012,721 3,059
107.84
18135
2,466
Summer Pollutant
Load (pounds)
Winter Pollutant Load
(pounds)
Land Use
weighted
concentrations
Total Annual Pollutant
Load (pounds)
1,988 478
Nickel, Total Recoverable, ( g/L as Ni)
146
100.82
49
333
0.12
Arsenic, Total, ( g/L as As)
Phosphorous, Total, (mg/L as P)
4.27
1.79
Lead, Total Recoverable, ( g/L as Pb)
Chromium, Total Recoverable, ( g/L as Cr)
Copper, Total Recoverable, ( g/L as Cu)
Silver, Total Recoverable, ( g/L as Ag)
Zinc, Total Recoverable, ( g/L as Zn)
Constituent
Mercury, Total Recoverable, ( g/L as Hg)
Selenium Total Recoverable, ( g/L as Se)
COD High Level (mg/L)
Nitrogen NO2 + NO3, Total, (mg/L as N)

Appendix B City of Phoenix MS4 Stormwater Permit
AZPDES Permit No. AZS000003 Page 98
Table 11-5: Indian Bend Wash Basin Pollutant Loadings
14,634 Residential: 80.67% Industrial : 0.00% Undeveloped: 10.67% Commercial: 8.67%
49,130,255 18,938,201
Nitrogen Organic, Total Kjeldahl (mg/L as N)
Beryllium, Total Recoverable, ( g/L as Be)
Cadmium, Total Recoverable, ( g/L as Cd)
Nitrogen NO2 + NO3, Total, (mg/L as N)
Nickel, Total Recoverable, ( g/L as Ni)
23.54
3.30
13.00
Silver, Total Recoverable, ( g/L as Ag)
Selenium Total Recoverable, ( g/L as Se) 0.86
4.74
Phosphorous, Total, (mg/L as P)
Arsenic, Total, ( g/L as As)
0.330.85
Total Winter (Oct-Mar)
Runoff, cubic feet:
Total Summer (Apr-Sept)
Runoff, cubic feet:
60.79
109.63
BOD5 (mg/L)
COD High Level (mg/L)
Residue, Total at 105 Deg.C (TDS)
Total Annual Pollutant
Load (pounds)
Zinc, Total Recoverable, ( g/L as Zn)
Constituent
1.39
2.98
0.28
Copper, Total Recoverable, ( g/L as Cu)
Lead, Total Recoverable, ( g/L as Pb)
Chromium, Total Recoverable, ( g/L as Cr)
0
129,613
15,355
Winter Pollutant Load
(pounds)
Summer Pollutant
Load (pounds)
336,248
186,436
39,836
9,139
5,923
55,191
4,275
465,861
71,865 258,301
3,523 12,662
1,648
0.50
4 14
98
55.2615.37
15
0.28
23.15
6
39.88
71
857 330
0.140.12
1,188
1.18
2.65 1.02 3.67
61.00
27.83 100.01
27
20
0.36
10
0
130
72.19
44.03 16.97
466
0
Total area, acres:
14.36
0.00
109.68
Mercury, Total Recoverable, ( g/L as Hg)
12.99
Land Use
weighted
concentrations
336

Appendix B City of Phoenix MS4 Stormwater Permit
AZPDES Permit No. AZS000003 Page 99
Table 11-6: Old Cross Cut Canal Basin Pollutant Loadings
1,594 Residential: 62.41% Industrial : 6.03% Undeveloped: 16.77% Commercial: 14.79%
5,096,154 1,605,892
Nitrogen Organic, Total Kjeldahl (mg/L as N)
Beryllium, Total Recoverable, ( g/L as Be)
Cadmium, Total Recoverable, ( g/L as Cd)
0.58
9.50
6.28
1.38
5.36
14
52
0.03 0.13
1.46 0.46
0
1.91
0.33
0.059
4.08
1.05
1.28
10.78 3.40
0.10
7.22 2.28
4.77 1.50
13
0.44 0.14
0 0
40
3.31
12.81
33.88
1.38
22.70
0.31
Total area, acres:
2.94
Total Winter (Oct-Mar)
Runoff, cubic feet:
Total Summer (Apr-Sept)
Runoff, cubic feet:
Residue, Total at 105 Deg.C (TDS)
BOD5 (mg/L)
1.47Nitrogen NO2 + NO3, Total, (mg/L as N)
16.02
74.21
45,695
Summer Pollutant
Load (pounds)
615147467
0.077
1,231
32 135
0.018
Total Annual Pollutant
Load (pounds)
31,0497,44023,609
6,7045,098 1,606
Winter Pollutant Load
(pounds)
Land Use
weighted
concentrations
103
936 295
34,746 10,949
0.32
Silver, Total Recoverable, ( g/L as Ag)
Zinc, Total Recoverable, ( g/L as Zn)
109.22
Chromium, Total Recoverable, ( g/L as Cr)
Copper, Total Recoverable, ( g/L as Cu)
4.58
0.18
15.01
0.00
124.78
Constituent
Mercury, Total Recoverable, ( g/L as Hg)
Selenium Total Recoverable, ( g/L as Se)
COD High Level (mg/L)
Nickel, Total Recoverable, ( g/L as Ni)
Phosphorous, Total, (mg/L as P)
Arsenic, Total, ( g/L as As)
Lead, Total Recoverable, ( g/L as Pb)

Appendix B City of Phoenix MS4 Stormwater Permit
AZPDES Permit No. AZS000003 Page 100
Table 11-7: Arizona Canal Diversion Channel Basin Pollutant Loadings
17,165 Residential: 65.19% Industrial : 2.56% Undeveloped: 18.25% Commercial: 14.00%
64,111,813 21,644,906
Nitrogen Organic, Total Kjeldahl (mg/L as N)
Beryllium, Total Recoverable, ( g/L as Be)
Cadmium, Total Recoverable, ( g/L as Cd)
Nitrogen NO2 + NO3, Total, (mg/L as N)
Nickel, Total Recoverable, ( g/L as Ni)
22.57
3.22
13.34
Silver, Total Recoverable, ( g/L as Ag)
Selenium Total Recoverable, ( g/L as Se) 1.44
4.46
Phosphorous, Total, (mg/L as P)
Arsenic, Total, ( g/L as As)
0.451.33
Total Winter (Oct-Mar)
Runoff, cubic feet:
Total Summer (Apr-Sept)
Runoff, cubic feet:
73.75
109.16
BOD5 (mg/L)
COD High Level (mg/L)
Residue, Total at 105 Deg.C (TDS)
Total Annual Pollutant
Load (pounds)
Zinc, Total Recoverable, ( g/L as Zn)
Constituent
1.50
2.96
0.33
Copper, Total Recoverable, ( g/L as Cu)
Lead, Total Recoverable, ( g/L as Pb)
Chromium, Total Recoverable, ( g/L as Cr)
0
147,502
20,129
Winter Pollutant Load
(pounds)
Summer Pollutant
Load (pounds)
436,898
295,174
59,622
11,863
8,057
79,751
6,023
584,399
99,654 394,828
4,005 15,869
2,034
1.07
4 17
149
71.4318.03
18
0.31
27.76
6
53.40
111
1,226 414
0.270.20
1,640
1.78
5.78 1.95 7.73
80.81
30.50 120.83
38
24
0.80
13
0
157
90.33
60.41 20.40
622
0
Total area, acres:
15.09
0.00
116.16
Mercury, Total Recoverable, ( g/L as Hg)
14.90
Land Use
weighted
concentrations
465

Appendix B City of Phoenix MS4 Stormwater Permit
AZPDES Permit No. AZS000003 Page 101
Table 11-8: Cave Creek Basin Pollutant Loadings
8,980 Residential: 65.78% Industrial : 9.41% Undeveloped: 12.12% Commercial: 12.69%
35,531,176 10,586,996
Nitrogen Organic, Total Kjeldahl (mg/L as N)
Beryllium, Total Recoverable, ( g/L as Be)
Cadmium, Total Recoverable, ( g/L as Cd)
88 382
0 0
132.83 295
4.84
0.13
0.00
0.61
2.401.08
32.47
11
Total area, acres:
14.64
12.10
2.93
51.83
88
0.27
23.37
39.88
3.41
8.00
115
67.27
26
15.44
9.67
0.38
0
0.72 3.12
0.18
42.14
34.8420
8
26.84
0.79
3 14
0.30
8,437
2
0.09
10
220
6,501 1,937
72,541 315,997
919 4,002
Total Winter (Oct-Mar)
Runoff, cubic feet:
243,456
737
Total Summer (Apr-Sept)
Runoff, cubic feet:
68.81
Constituent
BOD5 (mg/L)
COD High Level (mg/L)
Land Use
weighted
concentrations
0.33
Chromium, Total Recoverable, ( g/L as Cr)
Arsenic, Total, ( g/L as As)
198,097
1.39
109.76
Phosphorous, Total, (mg/L as P)
45,476152,622
3,083
956
Zinc, Total Recoverable, ( g/L as Zn)
Mercury, Total Recoverable, ( g/L as Hg)
Selenium Total Recoverable, ( g/L as Se)
Lead, Total Recoverable, ( g/L as Pb)
Nickel, Total Recoverable, ( g/L as Ni)
Silver, Total Recoverable, ( g/L as Ag)
Copper, Total Recoverable, ( g/L as Cu)
Nitrogen NO2 + NO3, Total, (mg/L as N)
Residue, Total at 105 Deg.C (TDS)
Total Annual Pollutant
Load (pounds)
16.86 37,392 11,141 48,533
Summer Pollutant
Load (pounds)
Winter Pollutant Load
(pounds)

Appendix B City of Phoenix MS4 Stormwater Permit
AZPDES Permit No. AZS000003 Page 102
Table 11-9: Skunk Creek Basin Pollutant Loadings
3,458 Residential: 44.95% Industrial : 14.29% Undeveloped: 31.95% Commercial: 8.81%
13,735,290 2,835,299
Nitrogen Organic, Total Kjeldahl (mg/L as N)
Beryllium, Total Recoverable, ( g/L as Be)
Cadmium, Total Recoverable, ( g/L as Cd)
Nitrogen NO2 + NO3, Total, (mg/L as N)
Nickel, Total Recoverable, ( g/L as Ni)
23.03
2.63
14.32
Silver, Total Recoverable, ( g/L as Ag)
Selenium Total Recoverable, ( g/L as Se) 2.52
4.49
Phosphorous, Total, (mg/L as P)
Arsenic, Total, ( g/L as As)
0.080.38
Total Winter (Oct-Mar)
Runoff, cubic feet:
Total Summer (Apr-Sept)
Runoff, cubic feet:
83.40
113.16
BOD5 (mg/L)
COD High Level (mg/L)
Residue, Total at 105 Deg.C (TDS)
Total Annual Pollutant
Load (pounds)
Zinc, Total Recoverable, ( g/L as Zn)
Constituent
1.78
3.03
0.45
Copper, Total Recoverable, ( g/L as Cu)
Lead, Total Recoverable, ( g/L as Pb)
Chromium, Total Recoverable, ( g/L as Cr)
0
20,029
4,107
Winter Pollutant Load
(pounds)
Summer Pollutant
Load (pounds)
97,027
71,514
19,898
2,594
1,840
24,005
1,525
117,056
14,762 86,276
535 3,129
315
0.36
0 3
52
14.812.53
4
0.39
50.15
1
12.28
43
331 68
0.060.35
399
0.46
2.16 0.45 2.61
17.35
4.08 23.82
9
5
0.30
2
0
25
19.74
14.38 2.97
146
0
Total area, acres:
16.77
0.00
140.84
Mercury, Total Recoverable, ( g/L as Hg)
23.21
Land Use
weighted
concentrations
121

Appendix B City of Phoenix MS4 Stormwater Permit
AZPDES Permit No. AZS000003 Page 103
Table 11-10: Papago Diversion Channel Basin Pollutant Loadings
19,945 Residential: 66.26% Industrial : 7.96% Undeveloped: 15.43% Commercial: 10.30%
87,265,737 20,150,452
Nitrogen Organic, Total Kjeldahl (mg/L as N)
Beryllium, Total Recoverable, ( g/L as Be)
Cadmium, Total Recoverable, ( g/L as Cd)
9
157
100
22
85.67
252
860
0.39 2
26 6
0
32
4
0.92
69.60
18
16.07
205 47
1.68
127.57 29.46
81.51 18.82
161
7.05 1.63
0 0
699
3.21
12.78
37.64
1.29
23.42
0.31
Total area, acres:
2.96
Total Winter (Oct-Mar)
Runoff, cubic feet:
Total Summer (Apr-Sept)
Runoff, cubic feet:
Residue, Total at 105 Deg.C (TDS)
BOD5 (mg/L)
1.47Nitrogen NO2 + NO3, Total, (mg/L as N)
17.14
68.78
740,829
Summer Pollutant
Load (pounds)
9,8301,8447,986
1.14
19,874
413 2,203
0.21
Total Annual Pollutant
Load (pounds)
461,20186,518374,683
114,92993,369 21,560
Winter Pollutant Load
(pounds)
Land Use
weighted
concentrations
1,790
16,146 3,728
601,856 138,974
0.33
Silver, Total Recoverable, ( g/L as Ag)
Zinc, Total Recoverable, ( g/L as Zn)
110.48
Chromium, Total Recoverable, ( g/L as Cr)
Copper, Total Recoverable, ( g/L as Cu)
4.76
0.17
14.96
0.00
128.29
Constituent
Mercury, Total Recoverable, ( g/L as Hg)
Selenium Total Recoverable, ( g/L as Se)
COD High Level (mg/L)
Nickel, Total Recoverable, ( g/L as Ni)
Phosphorous, Total, (mg/L as P)
Arsenic, Total, ( g/L as As)
Lead, Total Recoverable, ( g/L as Pb)

Appendix B City of Phoenix MS4 Stormwater Permit
AZPDES Permit No. AZS000003 Page 104
Table 11-11: Salt River Basin Pollutant Loadings
63,395 Residential: 46.41% Industrial : 18.09% Undeveloped: 19.34% Commercial: 17.07%
213,742,749 62,322,147
Nitrogen Organic, Total Kjeldahl (mg/L as N)
Beryllium, Total Recoverable, ( g/L as Be)
Cadmium, Total Recoverable, ( g/L as Cd)
Silver, Total Recoverable, ( g/L as Ag)
Selenium Total Recoverable, ( g/L as Se) 1.70
Nitrogen NO2 + NO3, Total, (mg/L as N)
Barium Total ( g/l as Ba)
Nickel, Total Recoverable, ( g/L as Ni)
23.05
3.36
12.05
Phosphorous, Total, (mg/L as P)
Total Winter (Oct-Mar)
Runoff, cubic feet:
Total Summer (Apr-Sept)
Runoff, cubic feet:
82.48
111.25
BOD5 (mg/L)
COD High Level (mg/L)
Residue, Total at 105 Deg.C (TDS)
Total Annual Pollutant
Load (pounds)
Zinc, Total Recoverable, ( g/L as Zn)
Constituent
1.50
2.93
0.32
Copper, Total Recoverable, ( g/L as Cu)
Lead, Total Recoverable, ( g/L as Pb)
Chromium, Total Recoverable, ( g/L as Cr)
Winter Pollutant Load
(pounds)
Summer Pollutant
Load (pounds)
1,484,480
1,100,539
287,897
39,119 11,406
25,934
371,840
20,079
1,917,318
320,890 1,421,430
432,838
83,944
50,525
5,855
3.67
13 58
962
207.6146.87
6,761
217
0.39
55.81
160.74
745
5,235
0.21
6
23 7 29
269
90 397
14
208
1,526
2.84
45
0
602
308
0.83
0
61
2,665
0
Total area, acres:
15.60
0.00
154.62
Mercury, Total Recoverable, ( g/L as Hg)
21.58
Land Use
weighted
concentrations
2,063

Appendix B City of Phoenix MS4 Stormwater Permit
AZPDES Permit No. AZS000003 Page 105
Table 11-12: Scatter Wash Basin Pollutant Loadings
181 Residential: 63.02% Industrial : 17.24% Undeveloped: 12.51% Commercial: 7.22%
800,080 162,066
Nitrogen Organic, Total Kjeldahl (mg/L as N)
Beryllium, Total Recoverable, ( g/L as Be)
Cadmium, Total Recoverable, ( g/L as Cd)
0.071
1.465
0.895
0.19
0.7108
3.27
9.00
0.0028 0.017
0.26 0.05
0
0.31
0.03
0.0069
0.5910
0.16
0.1197
2.72 0.55
0.014
1.218 0.2467
0.7443 0.1508
1.52
0.0591 0.0120
0 0
7.49
3.24
11.83
54.48
1.18
24.39
0.28
Total area, acres:
2.95
Total Winter (Oct-Mar)
Runoff, cubic feet:
Total Summer (Apr-Sept)
Runoff, cubic feet:
Residue, Total at 105 Deg.C (TDS)
BOD5 (mg/L)
1.42Nitrogen NO2 + NO3, Total, (mg/L as N)
20.98
65.44
6,737
Summer Pollutant
Load (pounds)
851471
0.0083
177
3.76 22.30
0.0014
Total Annual Pollutant
Load (pounds)
3,9316623,269
1,2601,048 212
Winter Pollutant Load
(pounds)
Land Use
weighted
concentrations
18.54
147 30
5,602 1,135
0.37
Silver, Total Recoverable, ( g/L as Ag)
Zinc, Total Recoverable, ( g/L as Zn)
112.17
Chromium, Total Recoverable, ( g/L as Cr)
Copper, Total Recoverable, ( g/L as Cu)
5.15
0.14
14.90
0.00
149.88
Constituent
Mercury, Total Recoverable, ( g/L as Hg)
Selenium Total Recoverable, ( g/L as Se)
COD High Level (mg/L)
Nickel, Total Recoverable, ( g/L as Ni)
Phosphorous, Total, (mg/L as P)
Arsenic, Total, ( g/L as As)
Lead, Total Recoverable, ( g/L as Pb)

Appendix B City of Phoenix MS4 Stormwater Permit
AZPDES Permit No. AZS000003 Page 106
Table 11-13: Emile Zola Tributary of IB Pollutant Loadings
320 Residential: 58.98% Industrial : 0.00% Undeveloped: 24.93% Commercial: 16.09%
1,220,670 464,079
Nitrogen Organic, Total Kjeldahl (mg/L as N)
Beryllium, Total Recoverable, ( g/L as Be)
Cadmium, Total Recoverable, ( g/L as Cd)
Nitrogen NO2 + NO3, Total, (mg/L as N)
Nickel, Total Recoverable, ( g/L as Ni)
21.84
3.06
14.23
Silver, Total Recoverable, ( g/L as Ag)
Selenium Total Recoverable, ( g/L as Se) 1.89
4.16
Phosphorous, Total, (mg/L as P)
Arsenic, Total, ( g/L as As)
0.0110.030
Total Winter (Oct-Mar)
Runoff, cubic feet:
Total Summer (Apr-Sept)
Runoff, cubic feet:
81.14
108.90
BOD5 (mg/L)
COD High Level (mg/L)
Residue, Total at 105 Deg.C (TDS)
Total Annual Pollutant
Load (pounds)
Zinc, Total Recoverable, ( g/L as Zn)
Constituent
1.62
2.98
0.39
Copper, Total Recoverable, ( g/L as Cu)
Lead, Total Recoverable, ( g/L as Pb)
Chromium, Total Recoverable, ( g/L as Cr)
0
3,155
429
Winter Pollutant Load
(pounds)
Summer Pollutant
Load (pounds)
8,299
6,183
1,128
227
171
1,557
124
11,454
2,351 8,534
86 314
47
0.0288
0.09 0.32
2
1.49630.412
0.32
0.30
23.36
0.12
1.084
1.78
23 9
0.0080.27
32
0.0411
0.144 0.055 0.199
1.650
0.633 2.2965
0.68
0.44
0.021
0.23
0
3.18
1.664
1.195 0.454
11.55
0
Total area, acres:
15.68
0.00
109.80
Mercury, Total Recoverable, ( g/L as Hg)
14.81
Land Use
weighted
concentrations
8.37

Appendix B City of Phoenix MS4 Stormwater Permit
AZPDES Permit No. AZS000003 Page 107
Table 11-14: Arizona Canal Pollutant Loadings
2,515 Residential: 75.93% Industrial : 6.02% Undeveloped: 14.01% Commercial: 4.55%
7,241,492 2,450,293
Nitrogen Organic, Total Kjeldahl (mg/L as N)
Beryllium, Total Recoverable, ( g/L as Be)
Cadmium, Total Recoverable, ( g/L as Cd)
0.699
14.69
9.034
2
7.998
21
74
0.047 0.19
2 1
0
3
0
0.070
5.976
1
2.022
16 5
0.139
10.975 3.714
6.750 2.284
19
0.522 0.177
0 0
56
3.09
13.22
34.66
1.16
24.28
0.31
Total area, acres:
3.02
Total Winter (Oct-Mar)
Runoff, cubic feet:
Total Summer (Apr-Sept)
Runoff, cubic feet:
Residue, Total at 105 Deg.C (TDS)
BOD5 (mg/L)
1.48Nitrogen NO2 + NO3, Total, (mg/L as N)
16.79
61.17
67,944
Summer Pollutant
Load (pounds)
895226669
0.093
1,828
48 191
0.024
Total Annual Pollutant
Load (pounds)
37,0119,35727,654
10,1567,588 2,568
Winter Pollutant Load
(pounds)
Land Use
weighted
concentrations
143
1,366 462
50,766 17,178
0.32
Silver, Total Recoverable, ( g/L as Ag)
Zinc, Total Recoverable, ( g/L as Zn)
112.30
Chromium, Total Recoverable, ( g/L as Cr)
Copper, Total Recoverable, ( g/L as Cu)
4.91
0.15
14.93
0.00
122.97
Constituent
Mercury, Total Recoverable, ( g/L as Hg)
Selenium Total Recoverable, ( g/L as Se)
COD High Level (mg/L)
Nickel, Total Recoverable, ( g/L as Ni)
Phosphorous, Total, (mg/L as P)
Arsenic, Total, ( g/L as As)
Lead, Total Recoverable, ( g/L as Pb)

Appendix B City of Phoenix MS4 Stormwater Permit
AZPDES Permit No. AZS000003 Page 108
Table 11-15: Upper Cave Creek Wash Basin Pollutant Loadings
1,757 Residential: 51.97% Industrial : 0.00% Undeveloped: 46.97% Commercial: 1.06%
3,617,367 1,628,673
Nitrogen Organic, Total Kjeldahl (mg/L as N)
Beryllium, Total Recoverable, ( g/L as Be)
Cadmium, Total Recoverable, ( g/L as Cd)
Nitrogen NO2 + NO3, Total, (mg/L as N)
Nickel, Total Recoverable, ( g/L as Ni)
22.58
1.82
17.86
Silver, Total Recoverable, ( g/L as Ag)
Selenium Total Recoverable, ( g/L as Se) 3.40
3.88
Phosphorous, Total, (mg/L as P)
Arsenic, Total, ( g/L as As)
0.0620.138
Total Winter (Oct-Mar)
Runoff, cubic feet:
Total Summer (Apr-Sept)
Runoff, cubic feet:
84.59
114.94
BOD5 (mg/L)
COD High Level (mg/L)
Residue, Total at 105 Deg.C (TDS)
Total Annual Pollutant
Load (pounds)
Zinc, Total Recoverable, ( g/L as Zn)
Constituent
2.12
3.18
0.61
Copper, Total Recoverable, ( g/L as Cu)
Lead, Total Recoverable, ( g/L as Pb)
Chromium, Total Recoverable, ( g/L as Cr)
0
11,687
2,115
Winter Pollutant Load
(pounds)
Summer Pollutant
Load (pounds)
25,957
19,102
4,697
718
693
6,811
478
37,643
8,600 27,702
323 1,042
215
0.169
0.19 0.60
8.47
5.8501.816
0.88
0.33
25.86
0.39
4.034
5.84
75 34
0.0530.52
108
0.200
0.768 0.346 1.114
5.922
2.295 7.394
2.63
1.27
0.117
0.41
0
10
5.098
4.084 1.839
34
0
Total area, acres:
18.08
0.00
103.04
Mercury, Total Recoverable, ( g/L as Hg)
20.80
Land Use
weighted
concentrations
23
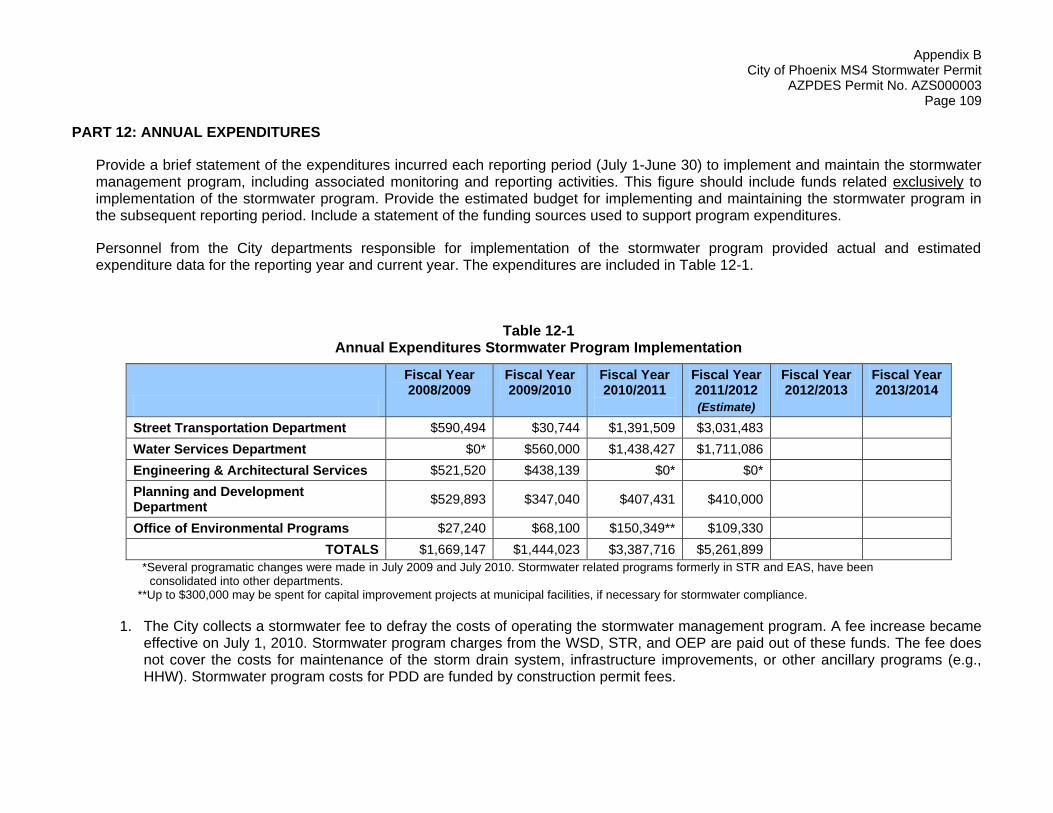
Appendix B City of Phoenix MS4 Stormwater Permit
AZPDES Permit No. AZS000003 Page 109
PART 12: ANNUAL EXPENDITURES
Provide a brief statement of the expenditures incurred each reporting period (July 1-June 30) to implement and maintain the stormwater management program, including associated monitoring and reporting activities. This figure should include funds related exclusively to implementation of the stormwater program. Provide the estimated budget for implementing and maintaining the stormwater program in the subsequent reporting period. Include a statement of the funding sources used to support program expenditures.
Personnel from the City departments responsible for implementation of the stormwater program provided actual and estimated expenditure data for the reporting year and current year. The expenditures are included in Table 12-1.
Table 12-1 Annual Expenditures Stormwater Program Implementation
Fiscal Year 2008/2009
Fiscal Year 2009/2010
Fiscal Year 2010/2011
Fiscal Year 2011/2012
(Estimate)
Fiscal Year 2012/2013
Fiscal Year 2013/2014
Street Transportation Department $590,494 $30,744 $1,391,509 $3,031,483
Water Services Department $0* $560,000 $1,438,427 $1,711,086
Engineering & Architectural Services $521,520 $438,139 $0* $0*
Planning and Development Department
$529,893 $347,040 $407,431 $410,000
Office of Environmental Programs $27,240 $68,100 $150,349** $109,330
TOTALS $1,669,147 $1,444,023 $3,387,716 $5,261,899
**Several programatic changes were made in July 2009 and July 2010. Stormwater related programs formerly in STR and EAS, have been consolidated into other departments.
**Up to $300,000 may be spent for capital improvement projects at municipal facilities, if necessary for stormwater compliance.
1. The City collects a stormwater fee to defray the costs of operating the stormwater management program. A fee increase became effective on July 1, 2010. Stormwater program charges from the WSD, STR, and OEP are paid out of these funds. The fee does not cover the costs for maintenance of the storm drain system, infrastructure improvements, or other ancillary programs (e.g., HHW). Stormwater program costs for PDD are funded by construction permit fees.


Appendix B City of Phoenix MS4 Stormwater Permit
AZPDES Permit No. AZS000003 Page 111
PART 13: ATTACHMENTS
Attach a copy of each of the following documents for the first year Annual Report, and each subsequent year if changes are made. If no changes are made to these during a reporting period, indicate, ‘no changes were made this period, the 2009 submittal is current’.
Drainage System Maps
List of major outfalls
List of changes to the major outfall inventory (new outfalls, outfalls out of service), including drainage area and coordinates for the outfalls listed in Table 1 of the permit (4th year report).
Laboratory reports for stormwater monitoring performed in the reporting period.
New or revised ordinances associated with stormwater management.
No changes were made this period.
New or revised public outreach documents.


Drainage System Maps

List of Major Outfalls

WATER SERVICES DEPARTMENT
City of Phoenix Storm Water ManagementMajor Outfalls
This report contains all active major outfalls 36" or greater serving >50 acres or 12" or greater outfalls serving >2 acres of industrial land use known to the City. 488
Outfall ID Site Address Type Size
LastInspection
Target InspectionLatitude Longitude
oAC001 51ST AVE AND ACDC CHANNEL Pipe 78 Inches 12/09/2010 201533 35 47' " -112 10 11' "o
oAC002 43RD AVE AND PEORIA AVE Pipe 90 Inches 10/11/2010 201533 34 58' " -112 9 6' "o
oAC003 43RD AVE AND PEORIA AVE Pipe 42 Inches 10/12/2010 201533 34 54' " -112 9 0' "o
oAC004 35TH AVE AND ACDC CHANNEL Pipe 96 Inches 12/03/2010 201533 34 21' " -112 8 4' "o
oAC005 30TH AVE AND METROCENTER Pipe 53 Inches 12/03/2010 201533 34 14' " -112 7 32' "o
oAC006 29TH AVE AND METROCENTER Pipe 48 Inches 10/26/2010 201533 34 15' " -112 7 16' "o
oAC007 29TH AVE AND METROCENTER Pipe 43 Inches 06/21/2011 201633 34 15' " -112 7 16' "o
oAC008 I-17 (BLACK CANYON FWY) AND ACDC CHANNEL Pipe 27 Inches 10/26/2010 201533 34 17' " -112 7 3' "o
oAC009 25TH AVE AND ACDC CHANNEL Pipe 12 Inches 10/26/2010 201533 34 18' " -112 6 44' "o
oAC010 19TH AVE AND ACDC CHANNEL Pipe 36 Inches 10/26/2010 201533 34 19' " -112 5 58' "o
oAC011 7TH ST AND ACDC CHANNEL Pipe 42 Inches 12/14/2010 201533 35 47' " -112 49 50' "o
oAC012 18TH PL AND ACDC CHANNEL Pipe 48 Inches 05/15/2007 201233 32 8' " -112 2 32' "o
oAC013 2 MILE TUNNEL AND ACDC CHANNEL Pipe 36 Inches 06/13/2007 201233 31 35' " -112 1 51' "o
oAC014 2 MILE TUNNEL AND ACDC CHANNEL Pipe 36 Inches 06/20/2007 201233 35 47' " -112 10 9' "o
oAC015 33RD DR AND ACDC CHANNEL Pipe 12 Inches 10/26/2010 201533 34 17' " -112 7 51' "o
oAC016 34TH LN AND ACDC CHANNEL Pipe 18 Inches 10/26/2010 201533 34 20' " -112 8 0' "o
oAC017 39TH AVE AND ACDC CHANNEL Pipe 18 Inches 10/14/2010 201533 34 41' " -112 8 39' "o
oAC018 18TH AVE AND HATCHER Pipe 36 Inches 12/03/2010 201533 34 17' " -112 5 50' "o
oAC021 49TH DR AND ACDC CHANNEL Spillway 50 Feet 10/11/2010 201533 35 30' " -112 9 52' "o
oAC022 LUPINE DR AND ACDC CHANNEL Spillway 50 Feet 10/11/2010 201533 35 23' " -112 9 44' "o
oAC023 YUCCA ST AND ACDC CHANNEL Spillway 27 Feet 10/11/2010 201533 35 15' " -112 9 30' "o
oAC024 39TH AVE AND ACDC CHANNEL Spillway 30 Feet 10/14/2010 201533 34 40' " -112 8 38' "o
oAC025 IRONWOOD DR AND ACDC CHANNEL Spillway 30 Feet 10/14/2010 201533 34 34' " -112 8 28' "o
oAC026 3RD ST AND ACDC CHANNEL Spillway 70 Feet 12/14/2010 201533 33 23' " -112 3 45' "o
oAC028 10TH ST AND ACDC CHANNEL Spillway 100 Feet 12/20/2010 201533 33 23' " -112 3 45' "o
oAC029 12TH ST AND ACDC CHANNEL Spillway 16 Feet 12/20/2010 201533 32 45' " -112 3 24' "o
Outfall Identification Legend
AC = Arizona Canal Diversion Canal
AZ = Arizona Canal
CC = Cave Creek Wash
EF = East Fork of the Cave Creek
GC = Grand Canal
IB = Indian Bend Wash
MV = Moon Valley Wash
NM = North Mountain Wash
OC = Old Cross Cut Canal
PD = Papago Diversion Canal
SC = Skunk Creek Wash
SR = Salt River
ST = Sweetwater Tributary of IB
SW = Scatter Wash
TS = Tenth Street Wash
UC = Upper Cave Creek Wash
ZT = Emile Zola Tributary of IB
RID = Roosevelt Irrigation District
AF = Agua Fria (West Hwy loop 101)
AW = Ahwatukee
PV = Paradise Valley
TD = Tempe Drainage Channel
LC = Laveen Area Conveyance Channel
Friday, July 01, 2011 Page 1 of 17

Outfall ID Site Address Type Size
LastInspection
Target InspectionLatitude Longitude
oAC030 13TH ST AND ORANGEWOOD Spillway 50 Feet 12/20/2010 201533 32 41' " -112 3 16' "o
oAC031 14TH ST AND STATE AVE Spillway 90 Feet 03/05/2007 201233 32 37' " -112 3 6' "o
oAC033 7TH AVE AND ACDC CHANNEL Pipe 42 Inches 12/03/2010 201533 34 7' " -112 4 58' "o
oAC034 12TH AVE AND ACDC CHANNEL Pipe 36 Inches 12/03/2010 201533 34 12' " -112 5 29' "o
oAC039 14TH ST AND ACDC CHANNEL Pipe 36 Inches 03/15/2007 201233 34 54' " -112 8 59' "o
oAC044 6TH ST AND ACDC CHANNEL Pipe 36 Inches 12/14/2010 201533 33 29' " -112 3 58' "o
oAC048 10TH ST AND ACDC CHANNEL Pipe 96 Inches 12/20/2010 201533 33 23' " -112 3 45' "o
oAC070 DUNLAP AVE AND SHORT TUNNEL Pipe 60 Inches 12/09/2010 201533 34 15' " -112 7 14' "o
oAC081 2 MILE TUNNEL AND ACDC CHANNEL Box 6 x 6 Feet 05/15/2007 201233 34 17' " -112 7 4' "o
oAC083 2 MILE TUNNEL AND ACDC CHANNEL Pipe 36 Inches 06/13/2007 201233 34 17' " -112 7 4' "o
oAC085 2 MILE TUNNEL AND ACDC CHANNEL Pipe 30 Inches 06/20/2007 201233 34 17' " -112 7 4' "o
oAC093 2 MILE TUNNEL AND ACDC CHANNEL Pipe 30 Inches 06/21/2007 201233 34 17' " -112 53 14' "o
oAC094 2 MILE TUNNEL AND ACDC CHANNEL Pipe 36 Inches 06/25/2007 201233 34 17' " -112 53 14' "o
oAC098 2 MILE TUNNEL AND ACDC CHANNEL Pipe 30 Inches 06/25/2007 201233 34 17' " -112 53 14' "o
oAC100 2 MILE TUNNEL AND ACDC CHANNEL Pipe 30 Inches 06/25/2007 201233 34 19' " -112 54 0' "o
oAC101 2 MILE TUNNEL AND ACDC CHANNEL Pipe 36 Inches 06/25/2007 201233 34 19' " -112 54 0' "o
oAC103 2 MILE TUNNEL AND ACDC CHANNEL Pipe 30 Inches 07/23/2007 201233 34 19' " -112 54 0' "o
oAC106 2 MILE TUNNEL AND ACDC CHANNEL Pipe 36 Inches 07/23/2007 201233 34 19' " -112 54 0' "o
oAC107 2 MILE TUNNEL AND ACDC CHANNEL Pipe 48 Inches 07/23/2007 201233 34 19' " -112 54 0' "o
oAC109 2 MILE TUNNEL AND ACDC CHANNEL Pipe 96 Inches 08/06/2007 201233 34 19' " -112 5 59' "o
oAC110 2 MILE TUNNEL AND ACDC CHANNEL Pipe 96 Inches 08/06/2007 201233 33 27' " -112 56 3' "o
oAC128 7TH AVE AND DUNLAP AVE Pipe 12 Inches 12/03/2010 201533 34 5' " -112 4 48' "o
oAC130 PARADISE DR AND ACDC Spillway 64 Feet 10/11/2010 201533 35 35' " -112 9 56' "o
oAC131 47TH AVE AND ACDC Spillway 64 Feet 10/11/2010 201533 35 19' " -112 9 37' "o
oAC132 46TH AVE AND ACDC Spillway 32 Feet 10/11/2010 201533 35 5' " -112 9 22' "o
oAC133 43RD AVE AND ACDC Spillway 32 Feet 10/11/2010 201533 35 0' " -112 9 12' "o
oAC134 43RD AVE AND ACDC Spillway 32 Feet 10/11/2010 201533 35 0' " -112 9 12' "o
oAC135 43RD AVE AND ACDC Spillway 24 Feet 10/11/2010 201533 34 59' " -112 9 8' "o
oAC136 NORTH LN AND ACDC Spillway 24 Feet 10/12/2010 201533 34 52' " -112 8 58' "o
oAC137 41ST DR AND ACDC Spillway 24 Feet 10/12/2010 201533 34 50' " -112 8 54' "o
Outfall Identification Legend
AC = Arizona Canal Diversion Canal
AZ = Arizona Canal
CC = Cave Creek Wash
EF = East Fork of the Cave Creek
GC = Grand Canal
IB = Indian Bend Wash
MV = Moon Valley Wash
NM = North Mountain Wash
OC = Old Cross Cut Canal
PD = Papago Diversion Canal
SC = Skunk Creek Wash
SR = Salt River
ST = Sweetwater Tributary of IB
SW = Scatter Wash
TS = Tenth Street Wash
UC = Upper Cave Creek Wash
ZT = Emile Zola Tributary of IB
RID = Roosevelt Irrigation District
AF = Agua Fria (West Hwy loop 101)
AW = Ahwatukee
PV = Paradise Valley
TD = Tempe Drainage Channel
LC = Laveen Area Conveyance Channel
Friday, July 01, 2011 Page 2 of 17

Outfall ID Site Address Type Size
LastInspection
Target InspectionLatitude Longitude
oAC138 41ST LN AND ACDC Spillway 24 Feet 10/12/2010 201533 34 49' " -112 8 53' "o
oAC139 41ST AVE AND ACDC Spillway 24 Feet 10/14/2010 201533 34 48' " -112 8 50' "o
oAC140 40TH DR AND ACDC Spillway 24 Feet 10/14/2010 201533 34 46' " -112 8 48' "o
oAC141 40TH LN AND ACDC Spillway 24 Feet 10/14/2010 201533 34 45' " -112 8 45' "o
oAC142 40TH AVE AND ACDC Spillway 24 Feet 10/14/2010 201533 34 44' " -112 8 45' "o
oAC143 39TH LN AND ACDC Spillway 24 Feet 10/14/2010 201533 34 42' " -112 8 41' "o
oAC144 37TH AVE AND ACDC Spillway 64 Feet 10/14/2010 201533 34 27' " -112 8 18' "o
oAC145 36TH AVE AND ACDC Spillway 40 Feet 08/21/2006 201133 34 24' " -112 8 11' "o
oAC146 33RD AVE AND ACDC Spillway 48 Feet 08/31/2006 201133 34 16' " -112 52 12' "o
oAC147 23RD AVE AND ACDC Spillway 40 Feet 09/14/2006 201133 34 24' " -112 6 26' "o
oAC148 21ST DR AND ACDC Spillway 40 Feet 09/14/2006 201133 34 22' " -112 6 16' "o
oAC149 21ST AVE AND ACDC Spillway 60 Feet 09/14/2006 201133 34 21' " -112 6 13' "o
oAC150 20TH DR AND ACDC Spillway 50 Feet 09/29/2006 201133 34 21' " -112 6 11' "o
oAC151 20TH AVE AND ACDC Spillway 40 Feet 09/29/2006 201133 34 20' " -112 6 6' "o
oAC152 20TH DR AND ACDC Spillway 24 Feet 10/11/2006 201133 34 19' " -112 6 2' "o
oAC153 16TH AVE AND ACDC Spillway 36 Feet 10/11/2006 201133 34 13' " -112 5 36' "o
oAC154 15TH AVE AND ACDC Spillway 60 Feet 10/11/2006 201133 34 12' " -112 5 28' "o
oAC155 14TH AVE AND ACDC Spillway 60 Feet 10/11/2006 201133 34 11' " -112 5 24' "o
oAC156 13TH AVE AND ACDC Spillway 60 Feet 10/11/2006 201133 34 10' " -112 5 21' "o
oAC157 9TH AVE AND ACDC Spillway 46 Feet 10/11/2006 201133 34 8' " -112 5 7' "o
oAC158 8TH AVE AND ACDC Spillway 48 Feet 10/18/2006 201133 34 7' " -112 5 4' "o
oAC159 CENTRAL AVE AND SHORT CHANNEL Spillway 30 Feet 11/17/2006 201133 33 42' " -112 4 23' "o
oAC160 8TH ST AND ACDC Spillway 24 Feet 01/02/2007 201233 33 26' " -112 3 51' "o
oAC161 8TH PL AND ACDC Spillway 24 Feet 01/02/2007 201233 33 25' " -112 3 47' "o
oAC162 HARMONT DR AND ACDC Spillway 56 Feet 02/22/2007 201233 33 16' " -112 3 41' "o
oAC163 NORTHERN AVE AND ACDC Spillway 80 Feet 02/22/2007 201233 33 7' " -112 3 40' "o
oAC164 BUD BROWN'S BARN AND ACDC Spillway 40 Feet 02/22/2007 201233 33 1' " -112 3 36' "o
oAC165 E DESERT PARK LN AND ACDC Spillway 40 Feet 02/26/2007 201233 32 59' " -112 3 34' "o
oAC166 HAYWOOD AVE AND ACDC Spillway 40 Feet 02/26/2007 201233 32 57' " -112 3 32' "o
oAC167 BELMONT AVE AND ACDC Spillway 40 Feet 02/26/2007 201233 32 55' " -112 3 32' "o
Outfall Identification Legend
AC = Arizona Canal Diversion Canal
AZ = Arizona Canal
CC = Cave Creek Wash
EF = East Fork of the Cave Creek
GC = Grand Canal
IB = Indian Bend Wash
MV = Moon Valley Wash
NM = North Mountain Wash
OC = Old Cross Cut Canal
PD = Papago Diversion Canal
SC = Skunk Creek Wash
SR = Salt River
ST = Sweetwater Tributary of IB
SW = Scatter Wash
TS = Tenth Street Wash
UC = Upper Cave Creek Wash
ZT = Emile Zola Tributary of IB
RID = Roosevelt Irrigation District
AF = Agua Fria (West Hwy loop 101)
AW = Ahwatukee
PV = Paradise Valley
TD = Tempe Drainage Channel
LC = Laveen Area Conveyance Channel
Friday, July 01, 2011 Page 3 of 17

Outfall ID Site Address Type Size
LastInspection
Target InspectionLatitude Longitude
oAC168 E KALER DR AND ACDC Spillway 24 Feet 02/26/2007 201233 32 53' " -112 3 30' "o
oAC169 MORTEN AVE AND ACDC Spillway 40 Feet 03/05/2007 201233 32 50' " -112 3 28' "o
oAC170 14TH ST AND ACDC Spillway 32 Feet 03/15/2007 201233 32 34' " -112 2 56' "o
oAC171 15TH ST AND ACDC Spillway 24 Feet 03/15/2007 201233 32 31' " -112 2 54' "o
oAC172 16TH PL AND ACDC Spillway 40 Feet 03/20/2007 201233 32 22' " -112 2 48' "o
oAC173 17TH ST AND ACDC Spillway 40 Feet 03/21/2007 201233 32 14' " -112 2 40' "o
oAC174 17TH PL AND ACDC Spillway 48 Feet 03/21/2007 201233 32 12' " -112 2 36' "o
oAC175 18TH ST AND ACDC Spillway 48 Feet 05/15/2007 201233 32 9' " -112 2 33' "o
oAC176 19TH ST AND ACDC Spillway 80 Feet 05/31/2007 201233 31 59' " -112 2 24' "o
oAC177 20TH ST AND ACDC Spillway 40 Feet 05/31/2007 201233 31 55' " -112 2 19' "o
oAC178 MARYLAND AVE AND ACDC Spillway 24 Feet 05/31/2007 201233 31 52' " -112 2 17' "o
oAC179 MARYLAND AVE AND ACDC Spillway 40 Feet 06/07/2007 201233 31 48' " -112 57 42' "o
oAC180 MARYLAND AVE AND ACDC Spillway 32 Feet 06/07/2007 201233 31 47' " -112 2 13' "o
oAC181 MARYLAND AVE AND ACDC Spillway 40 Feet 06/07/2007 201233 31 46' " -112 2 12' "o
oAC182 MARLETTE AVE AND ACDC Spillway 32 Feet 06/07/2007 201233 31 43' " -112 2 9' "o
oAC183 CLAREMONT ST AND ACDC Spillway 32 Feet 06/13/2007 201233 31 42' " -112 2 7' "o
oAC184 SQUAW PEAK WTP AND ACDC Spillway 72 Feet 06/13/2007 201233 31 41' " -112 2 2' "o
oAC185 SQUAW PEAK PKWY AND ACDC Spillway 48 Feet 05/15/2007 201233 32 3' " -112 2 29' "o
oAC186 I-17 AND ACDC Spillway 40 Feet 09/14/2006 201133 34 17' " -112 6 58' "o
oAC187 14TH ST AND ACDC Spillway 50 Feet 03/15/2007 201233 32 36' " -112 3 0' "o
oAC191 I-17 AND ACDC CHANNEL Spillway 31 Feet 09/12/2006 201133 34 17' " -112 7 3' "o
oAC192 3858 W MALAPAI DR, NORTH WALL Spillway 25 Feet 10/14/2010 201533 34 40' " -112 8 38' "o
oAC193 3848 W MALAPAI DR Spillway 25 Feet 10/14/2010 201533 34 38' " -112 8 36' "o
oAC194 3832 W MALAPAI DR Spillway 25 Feet 10/14/2010 201533 34 37' " -112 8 35' "o
oAF002 ENCANTO BLVD AND SR101 WEST (9500 W) Pipe 42 Inches 11/05/2010 201533 28 20' " -112 15 57' "o
oAF003 MCDOWELL RD AND SR101 WEST (9700 W) Box 4 x 11 Feet 11/05/2010 201533 27 55' " -112 16 3' "o
oAF005 CAMELBACK RD AND SR LOOP 101 Pipe 35 Inches 11/10/2010 201533 30 29' " -112 16 6' "o
oAW001 SOUTH CHANDLER BLVD (2700W) AND PECOS RD Pipe 36 Inches 10/10/2007 201233 17 23' " -112 7 2' "o
oAW003 25TH DR AND PECOS RD Pipe 24 Inches 10/10/2007 201233 17 26' " -112 6 38' "o
oAW006 24TH AVE AND PECOS RD Box 4 x 8 Feet 10/22/2007 201233 17 27' " -112 6 42' "o
Outfall Identification Legend
AC = Arizona Canal Diversion Canal
AZ = Arizona Canal
CC = Cave Creek Wash
EF = East Fork of the Cave Creek
GC = Grand Canal
IB = Indian Bend Wash
MV = Moon Valley Wash
NM = North Mountain Wash
OC = Old Cross Cut Canal
PD = Papago Diversion Canal
SC = Skunk Creek Wash
SR = Salt River
ST = Sweetwater Tributary of IB
SW = Scatter Wash
TS = Tenth Street Wash
UC = Upper Cave Creek Wash
ZT = Emile Zola Tributary of IB
RID = Roosevelt Irrigation District
AF = Agua Fria (West Hwy loop 101)
AW = Ahwatukee
PV = Paradise Valley
TD = Tempe Drainage Channel
LC = Laveen Area Conveyance Channel
Friday, July 01, 2011 Page 4 of 17

Outfall ID Site Address Type Size
LastInspection
Target InspectionLatitude Longitude
oAW007 PECOS RD AND 23RD DR Box 4 x 8 Feet 10/22/2007 201233 17 26' " -112 6 19' "o
oAW008 PECOS RD AND 23RD AVE Box 4 x 8 Feet 10/22/2007 201233 17 26' " -112 6 19' "o
oAW009 PECOS RD AND 22ND DR Box 4 x 8 Feet 12/10/2010 201533 17 27' " -112 6 39' "o
oAW010 PECOS RD AND 22ND AVE Box 4 x 8 Feet 10/22/2007 201233 17 27' " -112 6 13' "o
oAW011 PECOS RD AND 21ST DR Box 4 x 8 Feet 10/22/2007 201233 17 26' " -112 6 33' "o
oAW012 PECOS RD AND 21ST DR Box 4 x 8 Feet 11/07/2007 201233 17 26' " -112 6 33' "o
oAW013 PECOS RD AND 21ST AVE Box 4 x 8 Feet 11/07/2007 201233 17 26' " -112 6 29' "o
oAW014 PECOS RD AND 21ST AVE Box 4 x 8 Feet 11/07/2007 201233 17 26' " -112 6 28' "o
oAW015 PECOS RD AND 20TH DR Box 4 x 8 Feet 11/07/2007 201233 17 26' " -112 6 25' "o
oAW016 PECOS RD AND 20TH DR Box 4 x 8 Feet 11/07/2007 201233 17 26' " -112 6 22' "o
oAW017 PECOS RD AND 20TH DR Box 4 x 8 Feet 01/03/2008 201333 17 26' " -112 6 20' "o
oAW018 PECOS RD AND 20TH DR Box 4 x 8 Feet 01/03/2008 201333 17 26' " -112 6 13' "o
oAW020 PECOS RD AND 19TH DR Pipe 18 Inches 01/03/2008 201333 17 26' " -112 6 9' "o
oAW023 PECOS RD AND 19TH AVE Pipe 24 Inches 01/04/2008 201333 17 26' " -112 6 1' "o
oAW024 PECOS RD AND 17TH AVE Pipe 82 Inches 01/04/2008 201333 17 26' " -112 5 50' "o
oAW025 PECOS RD AND 15TH AVE Pipe 54 Inches 01/04/2008 201333 17 26' " -112 5 34' "o
oAW026 PECOS RD AND 14TH AVE Pipe 4 Feet 01/04/2008 201333 17 27' " -112 5 23' "o
oAW028 PECOS RD AND 2ND AVE Pipe 90 Inches 01/17/2008 201333 17 27' " -112 5 6' "o
oAW029 PECOS RD AND CENTRAL AVE Pipe 84 Inches 01/17/2008 201333 17 26' " -112 4 54' "o
oAW031 PECOS RD AND 2ND ST Pipe 72 Inches 01/17/2008 201333 17 26' " -112 4 44' "o
oAW032 PECOS RD AND 2ND PL Pipe 54 Inches 01/18/2008 201333 17 26' " -112 4 24' "o
oAW034 PECOS RD AND 3RD ST Pipe 78 Inches 01/18/2008 201333 17 26' " -112 4 14' "o
oAW035 PECOS RD AND 4TH ST Spillway 4 Feet 01/18/2008 201333 17 27' " -112 4 10' "o
oAW036 PECOS RD AND 6TH ST Pipe 48 Inches 02/13/2008 201333 17 26' " -112 4 5' "o
oAW037 PECOS RD AND S DESERT FOOTHILLS PKWY Pipe 42 Inches 02/13/2008 201333 17 26' " -112 3 39' "o
oAW038 PECOS RD AND 11TH WAY Pipe 8 Feet 02/13/2008 201333 17 26' " -112 3 39' "o
oAW039 PECOS RD AND 12TH WAY Pipe 60 Inches 02/13/2008 201333 17 27' " -112 3 29' "o
oAW041 PECOS RD AND 14TH ST Pipe 6 feet 02/14/2008 201333 17 27' " -112 3 9' "o
oAW042 PECOS RD AND 15TH ST Pipe 66 Inches 02/14/2008 201333 17 26' " -112 3 1' "o
oAW044 PECOS RD AND 17TH ST Pipe 6 Feet 02/14/2008 201333 17 26' " -112 2 50' "o
Outfall Identification Legend
AC = Arizona Canal Diversion Canal
AZ = Arizona Canal
CC = Cave Creek Wash
EF = East Fork of the Cave Creek
GC = Grand Canal
IB = Indian Bend Wash
MV = Moon Valley Wash
NM = North Mountain Wash
OC = Old Cross Cut Canal
PD = Papago Diversion Canal
SC = Skunk Creek Wash
SR = Salt River
ST = Sweetwater Tributary of IB
SW = Scatter Wash
TS = Tenth Street Wash
UC = Upper Cave Creek Wash
ZT = Emile Zola Tributary of IB
RID = Roosevelt Irrigation District
AF = Agua Fria (West Hwy loop 101)
AW = Ahwatukee
PV = Paradise Valley
TD = Tempe Drainage Channel
LC = Laveen Area Conveyance Channel
Friday, July 01, 2011 Page 5 of 17

Outfall ID Site Address Type Size
LastInspection
Target InspectionLatitude Longitude
oAW046 PECOS RD AND 18TH ST Pipe 6 Feet 02/19/2008 201333 17 26' " -112 2 33' "o
oAW047 PECOS RD AND 20TH WAY Pipe 6 Feet 02/19/2008 201333 17 26' " -112 2 15' "o
oAW048 PECOS RD AND 24TH ST Pipe 6 Feet 02/19/2008 201333 17 26' " -112 1 54' "o
oAW049 PECOS RD AND 24TH ST Pipe 6 Feet 02/19/2008 201333 17 26' " -112 1 47' "o
oAW050 PECOS RD AND 24TH PL Pipe 6 Feet 02/19/2008 201333 17 26' " -112 1 47' "o
oAW051 PECOS RD AND 25TH ST Pipe 6 Feet 02/19/2008 201333 17 26' " -112 1 45' "o
oAW054 PECOS RD AND 28TH PL Box 5 x 10 Feet 02/20/2008 201333 17 26' " -112 1 20' "o
oAW056 PECOS RD AND 32ND ST Box 3 x 10 Feet 02/20/2008 201333 17 26' " -112 0 53' "o
oAW057 PECOS RD AND 36TH ST Box 4 x 8 Feet 09/10/2008 201333 17 27' " -112 0 22' "o
oAW058 PECOS RD AND 36TH ST Spillway 8 Feet 02/20/2008 201333 17 27' " -112 0 21' "o
oAW059 PECOS RD AND 37TH ST Pipe 9 Feet 02/25/2008 201333 17 27' " -112 0 13' "o
oAW060 PECOS RD AND 39TH ST Spillway 24 Feet 02/25/2008 201333 17 27' " -111 59 57' "o
oAW061 PECOS RD AND 41ST ST Box 10 x 6 Feet 02/25/2008 201333 17 28' " -111 59 43' "o
oAW062 PECOS RD AND 44TH ST Pipe 9 Feet 02/25/2008 201333 17 29' " -111 59 21' "o
oAZ001 ARIZONA CANAL AND 42ND ST Pipe 36 Inches 02/02/2010 201533 30 26' " -111 59 28' "o
oAZ002 ARIZONA CANAL AND 56TH ST Pipe 48 Inches 01/26/2010 201533 29 21' " -111 57 38' "o
oAZ003 ARIZONA CANAL AND 57TH ST Pipe 48 Inches 01/26/2010 201533 29 22' " -111 57 34' "o
oAZ024 ARIZONA CANAL AND 21ST ST Pipe 36 Inches 02/02/2010 201533 31 38' " -112 2 4' "o
oAZ025 ARIZONA CANAL AND 21ST ST Pipe 36 Inches 02/02/2010 201533 31 38' " -112 2 4' "o
oAZ028 ARIZONA CANAL AND 56TH ST Spillway 6 Feet 01/26/2010 201533 29 20' " -111 57 39' "o
oAZ030 ARIZONA CANAL AND 44TH ST Spillway 6 Feet 02/02/2010 201533 30 15' " -111 59 12' "o
oCC002 23RD AVE AND VOGEL AVE Pipe 48 Inches 02/19/2010 201533 34 26' " -112 6 31' "o
oCC003 PEORIA AVE AND CAVE CREEK WASH Pipe 84 Inches 02/19/2010 201533 34 54' " -112 6 43' "o
oCC004 25TH AVE AND CHOLLA RD Pipe 78 Inches 02/26/2010 201533 35 21' " -112 6 52' "o
oCC005 25TH AVE AND CACTUS RD Pipe 48 Inches 04/06/2010 201533 35 46' " -112 6 43' "o
oCC006 25TH AVE AND LARKSPUR DR Pipe 30 Inches 04/08/2010 201533 35 59' " -112 6 39' "o
oCC008 23RD AVE AND THUNDERBIRD RD Pipe 72 Inches 04/08/2010 201533 36 38' " -112 6 28' "o
oCC010 19TH AVE AND GREENWAY RD Pipe 90 Inches 04/08/2010 201533 37 28' " -112 5 59' "o
oCC024 SHANGRI-LA RD AND CAVE CREEK WASH Pipe 36 Inches 02/26/2010 201533 35 17' " -112 6 53' "o
oCC041 901 W DANBURY RD Spillway 10 Feet 04/27/2010 201533 38 33' " -112 5 5' "o
Outfall Identification Legend
AC = Arizona Canal Diversion Canal
AZ = Arizona Canal
CC = Cave Creek Wash
EF = East Fork of the Cave Creek
GC = Grand Canal
IB = Indian Bend Wash
MV = Moon Valley Wash
NM = North Mountain Wash
OC = Old Cross Cut Canal
PD = Papago Diversion Canal
SC = Skunk Creek Wash
SR = Salt River
ST = Sweetwater Tributary of IB
SW = Scatter Wash
TS = Tenth Street Wash
UC = Upper Cave Creek Wash
ZT = Emile Zola Tributary of IB
RID = Roosevelt Irrigation District
AF = Agua Fria (West Hwy loop 101)
AW = Ahwatukee
PV = Paradise Valley
TD = Tempe Drainage Channel
LC = Laveen Area Conveyance Channel
Friday, July 01, 2011 Page 6 of 17
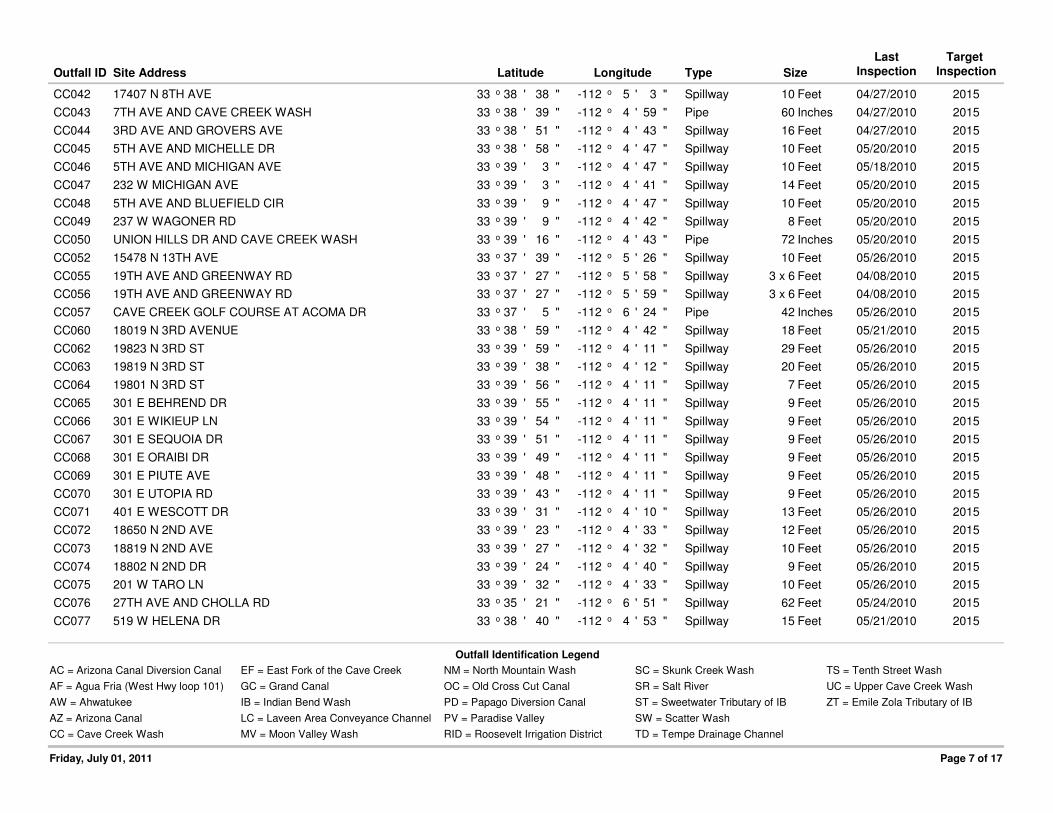
Outfall ID Site Address Type Size
LastInspection
Target InspectionLatitude Longitude
oCC042 17407 N 8TH AVE Spillway 10 Feet 04/27/2010 201533 38 38' " -112 5 3' "o
oCC043 7TH AVE AND CAVE CREEK WASH Pipe 60 Inches 04/27/2010 201533 38 39' " -112 4 59' "o
oCC044 3RD AVE AND GROVERS AVE Spillway 16 Feet 04/27/2010 201533 38 51' " -112 4 43' "o
oCC045 5TH AVE AND MICHELLE DR Spillway 10 Feet 05/20/2010 201533 38 58' " -112 4 47' "o
oCC046 5TH AVE AND MICHIGAN AVE Spillway 10 Feet 05/18/2010 201533 39 3' " -112 4 47' "o
oCC047 232 W MICHIGAN AVE Spillway 14 Feet 05/20/2010 201533 39 3' " -112 4 41' "o
oCC048 5TH AVE AND BLUEFIELD CIR Spillway 10 Feet 05/20/2010 201533 39 9' " -112 4 47' "o
oCC049 237 W WAGONER RD Spillway 8 Feet 05/20/2010 201533 39 9' " -112 4 42' "o
oCC050 UNION HILLS DR AND CAVE CREEK WASH Pipe 72 Inches 05/20/2010 201533 39 16' " -112 4 43' "o
oCC052 15478 N 13TH AVE Spillway 10 Feet 05/26/2010 201533 37 39' " -112 5 26' "o
oCC055 19TH AVE AND GREENWAY RD Spillway 3 x 6 Feet 04/08/2010 201533 37 27' " -112 5 58' "o
oCC056 19TH AVE AND GREENWAY RD Spillway 3 x 6 Feet 04/08/2010 201533 37 27' " -112 5 59' "o
oCC057 CAVE CREEK GOLF COURSE AT ACOMA DR Pipe 42 Inches 05/26/2010 201533 37 5' " -112 6 24' "o
oCC060 18019 N 3RD AVENUE Spillway 18 Feet 05/21/2010 201533 38 59' " -112 4 42' "o
oCC062 19823 N 3RD ST Spillway 29 Feet 05/26/2010 201533 39 59' " -112 4 11' "o
oCC063 19819 N 3RD ST Spillway 20 Feet 05/26/2010 201533 39 38' " -112 4 12' "o
oCC064 19801 N 3RD ST Spillway 7 Feet 05/26/2010 201533 39 56' " -112 4 11' "o
oCC065 301 E BEHREND DR Spillway 9 Feet 05/26/2010 201533 39 55' " -112 4 11' "o
oCC066 301 E WIKIEUP LN Spillway 9 Feet 05/26/2010 201533 39 54' " -112 4 11' "o
oCC067 301 E SEQUOIA DR Spillway 9 Feet 05/26/2010 201533 39 51' " -112 4 11' "o
oCC068 301 E ORAIBI DR Spillway 9 Feet 05/26/2010 201533 39 49' " -112 4 11' "o
oCC069 301 E PIUTE AVE Spillway 9 Feet 05/26/2010 201533 39 48' " -112 4 11' "o
oCC070 301 E UTOPIA RD Spillway 9 Feet 05/26/2010 201533 39 43' " -112 4 11' "o
oCC071 401 E WESCOTT DR Spillway 13 Feet 05/26/2010 201533 39 31' " -112 4 10' "o
oCC072 18650 N 2ND AVE Spillway 12 Feet 05/26/2010 201533 39 23' " -112 4 33' "o
oCC073 18819 N 2ND AVE Spillway 10 Feet 05/26/2010 201533 39 27' " -112 4 32' "o
oCC074 18802 N 2ND DR Spillway 9 Feet 05/26/2010 201533 39 24' " -112 4 40' "o
oCC075 201 W TARO LN Spillway 10 Feet 05/26/2010 201533 39 32' " -112 4 33' "o
oCC076 27TH AVE AND CHOLLA RD Spillway 62 Feet 05/24/2010 201533 35 21' " -112 6 51' "o
oCC077 519 W HELENA DR Spillway 15 Feet 05/21/2010 201533 38 40' " -112 4 53' "o
Outfall Identification Legend
AC = Arizona Canal Diversion Canal
AZ = Arizona Canal
CC = Cave Creek Wash
EF = East Fork of the Cave Creek
GC = Grand Canal
IB = Indian Bend Wash
MV = Moon Valley Wash
NM = North Mountain Wash
OC = Old Cross Cut Canal
PD = Papago Diversion Canal
SC = Skunk Creek Wash
SR = Salt River
ST = Sweetwater Tributary of IB
SW = Scatter Wash
TS = Tenth Street Wash
UC = Upper Cave Creek Wash
ZT = Emile Zola Tributary of IB
RID = Roosevelt Irrigation District
AF = Agua Fria (West Hwy loop 101)
AW = Ahwatukee
PV = Paradise Valley
TD = Tempe Drainage Channel
LC = Laveen Area Conveyance Channel
Friday, July 01, 2011 Page 7 of 17

Outfall ID Site Address Type Size
LastInspection
Target InspectionLatitude Longitude
oCC078 4TH AVE AND MURIEL DR Spillway 24 Feet 05/21/2010 201533 38 47' " -112 4 45' "o
oCC079 4TH AVE AND ANGELA DR Spillway 16 Feet 05/21/2010 201533 38 44' " -112 4 46' "o
oCC080 4TH AVE AND ANGELA DR Spillway 16 Feet 05/21/2010 201533 38 44' " -112 4 46' "o
oCC081 17415 N 6TH AVE Spillway 19 Feet 05/21/2010 201533 38 38' " -112 4 55' "o
oCC082 CAVE CREEK GC AND CAVE CREEK WASH Pipe 42 Inches 06/21/2010 201533 37 26' " -112 6 19' "o
oCC083 23RD AVE AND GREENWAY RD Pipe 48 Inches 06/21/2010 201533 37 25' " 112 6 20' "o
oEF001 CAVE CREEK RD AND GREENWAY PKWY Pipe 72 Inches 08/17/2010 201533 37 54' " -112 1 52' "o
oEF002 16TH ST AND GREENWAY PKWY Pipe 84 Inches 07/13/2010 201533 38 3' " -112 2 38' "o
oEF003 18TH ST AND GREENWAY PKWY Pipe 84 Inches 07/13/2010 201533 38 3' " -112 2 39' "o
oEF004 20TH ST AND GREENWAY PKWY Pipe 96 Inches 08/17/2010 201533 37 56' " -112 2 22' "o
oEF006 9TH ST AND GREENWAY PKWY Pipe 96 Inches 07/12/2010 201533 38 13' " -112 3 40' "o
oEF007 9TH ST AND GREENWAY PKWY Pipe 36 Inches 07/12/2010 201533 38 14' " -112 3 41' "o
oEF008 CAVE CREEK RD AND GREENWAY PKWY Pipe 72 Inches 08/17/2010 201533 37 54' " -112 1 53' "o
oEF009 16TH ST AND GREENWAY PKWY Pipe 48 Inches 07/13/2010 201533 38 10' " -112 2 52' "o
oEF010 7TH ST AND GREENWAY PKWY Pipe 84 Inches 07/12/2010 201533 38 14' " -112 3 57' "o
oEF011 7TH ST AND GREENWAY PKWY Pipe 36 Inches 07/14/2010 201533 38 13' " -112 3 56' "o
oEF012 7TH ST AND GREENWAY PKWY Pipe 36 Inches 07/12/2010 201533 38 14' " -112 3 56' "o
oEF013 CAVE CREEK RD AND GREENWAY PKWY Spillway 22 Feet 08/17/2010 201533 37 54' " -112 1 53' "o
oEF014 22ND PL AND MONTE CRISTO Spillway 50 Feet 08/05/2010 201533 37 56' " -112 2 5' "o
oEF015 22ND ST AND EAST FORK Pipe 36 Inches 08/17/2010 201533 37 56' " -112 2 6' "o
oEF016 22ND ST AND EAST FORK Pipe 36 Inches 08/17/2010 201533 37 56' " -112 2 6' "o
oEF017 22ND ST AND MONTE CRISTO Spillway 40 Feet 08/05/2010 201533 37 56' " -112 2 7' "o
oEF018 21ST ST AND EAST FORK Pipe 36 Inches 08/17/2010 201533 37 56' " -112 2 14' "o
oEF019 21ST ST AND EAST FORK Pipe 42 Inches 08/17/2010 201533 37 56' " -112 2 14' "o
oEF020 20TH PL AND MONTE CRISTO Spillway 12 Feet 08/05/2010 201533 37 56' " -112 2 18' "o
oEF021 2012 E MONTE CRISTO AVE Spillway 21 Feet 08/05/2010 201533 37 56' " -112 2 20' "o
oEF022 20TH ST AND GREENWAY PKWY Spillway 15 Feet 08/05/2010 201533 37 56' " -112 2 21' "o
oEF023 19TH ST AND EAST FORK (1926 E MONTE CRISTO) Spillway 10 Feet 08/05/2010 201533 37 56' " -112 2 26' "o
oEF025 1410 E SANDRA TERRACE Spillway 15 Feet 08/05/2010 201533 38 10' " -112 3 4' "o
oEF026 14TH ST AND GRANDVIEW RD Spillway 21 Feet 07/13/2010 201533 38 10' " -112 3 9' "o
Outfall Identification Legend
AC = Arizona Canal Diversion Canal
AZ = Arizona Canal
CC = Cave Creek Wash
EF = East Fork of the Cave Creek
GC = Grand Canal
IB = Indian Bend Wash
MV = Moon Valley Wash
NM = North Mountain Wash
OC = Old Cross Cut Canal
PD = Papago Diversion Canal
SC = Skunk Creek Wash
SR = Salt River
ST = Sweetwater Tributary of IB
SW = Scatter Wash
TS = Tenth Street Wash
UC = Upper Cave Creek Wash
ZT = Emile Zola Tributary of IB
RID = Roosevelt Irrigation District
AF = Agua Fria (West Hwy loop 101)
AW = Ahwatukee
PV = Paradise Valley
TD = Tempe Drainage Channel
LC = Laveen Area Conveyance Channel
Friday, July 01, 2011 Page 8 of 17

Outfall ID Site Address Type Size
LastInspection
Target InspectionLatitude Longitude
oEF027 12TH ST AND EAST FORK Box 8 x 12 Feet 07/13/2010 201533 38 13' " -112 3 26' "o
oEF028 16431 N 12TH ST Spillway 50 Feet 08/05/2010 201533 38 10' " -112 3 20' "o
oEF033 301 W LEMARCHE AVE Spillway 10 Feet 07/26/2010 201533 37 54' " -112 4 36' "o
oEF034 301 W MONTE CRISTO AVE Pipe 6 Feet 07/26/2010 201533 37 52' " -112 4 37' "o
oEF035 15802 N 4TH AVE Spillway 12 Feet 07/26/2010 201533 37 48' " -112 4 43' "o
oEF036 15803 N 4TH DR Spillway 14 Feet 07/26/2010 201533 37 47' " -112 4 44' "o
oEF037 MOON VALLEY PARK Pipe 5 Feet 07/26/2010 201533 37 38' " -112 4 54' "o
oEF038 214 W KATHLEEN RD Spillway 10 Feet 07/26/2010 201533 37 47' " -112 4 38' "o
oEF039 16042 N 1ST ST Pipe 8 Feet 07/26/2010 201533 37 57' " -112 4 24' "o
oEF040 1407 W BECK LN Spillway 21 Feet 07/06/2010 201533 37 33' " -112 5 26' "o
oEF041 1101 W BECK LN Spillway 19 Feet 07/26/2010 201533 37 34' " -112 5 9' "o
oEF042 15406 N 7TH DR Spillway 25 Feet 07/26/2010 201533 37 32' " -112 5 0' "o
oEF043 1527 W CARIBBEAN LN Spillway 10 Feet 07/27/2010 201533 37 27' " -112 5 35' "o
oEF044 1445 W CARIBBEAN LN Spillway 6 Feet 07/27/2010 201533 37 30' " -112 5 23' "o
oEF045 1455 W CARIBBEAN LN Spillway 10 Feet 07/27/2010 201533 37 30' " -112 5 27' "o
oEF046 1503 W CARIBBEAN LN Spillway 6 Feet 07/27/2010 201533 37 30' " -112 5 31' "o
oEF051 19TH PL AND GREENWAY PKWY Pipe 36 Inches 07/13/2010 201533 37 59' " -112 2 31' "o
oEF052 CAVE CREEK RD AND GREENWAY PKWY Spillway 48 Feet 08/17/2010 201533 37 54' " -112 1 51' "o
oEF053 1802 E PARADISE LN Spillway 18 Feet 08/05/2010 201533 37 59' " -112 4 12' "o
oEF054 16TH ST AND GREENWAY PKWY Spillway 23 Feet 08/05/2010 201533 38 9' " -112 2 53' "o
oEF055 16TH ST AND GREENWAY PKWY Spillway 14 Feet 08/05/2010 201533 38 9' " -112 2 53' "o
oEF056 1610 E SANDRA TERRACE Spillway 16 Feet 08/05/2010 201533 38 6' " -112 2 51' "o
oEF057 1526 W CARIBBEAN LN Spillway 12 Feet 07/27/2010 201533 37 27' " -112 5 35' "o
oEF058 15406 N 7TH DR Pipe 90 Inches 07/26/2010 201533 37 32' " -112 5 0' "o
oEF063 7TH ST AND GREENWAY PKWY Spillway 150 Feet 07/12/2010 201533 38 15' " -112 3 59' "o
oGC001 GRAND AVE AND GRAND CANAL Pipe 24 Inches 01/15/2010 201533 29 21' " -112 7 38' "o
oGC002 GRAND AVE AND GRAND CANAL Pipe 36 Inches 01/15/2010 201533 29 21' " -112 7 40' "o
oGC003 WASHINGTON ST AND HOHOKAM FWY (SR143) Box 10 x 6 Feet 01/12/2010 201533 26 53' " -111 59 26' "o
oGC033 GRAND CANAL AND E OF PUEBLO GRANDE MUSEUM PARK Spillway 14 Feet 01/12/2010 201533 26 40' " -111 58 58' "o
oIB001 52ND ST AND SHEA BLVD Pipe 36 Inches 03/02/2009 201433 34 57' " -111 58 4' "o
Outfall Identification Legend
AC = Arizona Canal Diversion Canal
AZ = Arizona Canal
CC = Cave Creek Wash
EF = East Fork of the Cave Creek
GC = Grand Canal
IB = Indian Bend Wash
MV = Moon Valley Wash
NM = North Mountain Wash
OC = Old Cross Cut Canal
PD = Papago Diversion Canal
SC = Skunk Creek Wash
SR = Salt River
ST = Sweetwater Tributary of IB
SW = Scatter Wash
TS = Tenth Street Wash
UC = Upper Cave Creek Wash
ZT = Emile Zola Tributary of IB
RID = Roosevelt Irrigation District
AF = Agua Fria (West Hwy loop 101)
AW = Ahwatukee
PV = Paradise Valley
TD = Tempe Drainage Channel
LC = Laveen Area Conveyance Channel
Friday, July 01, 2011 Page 9 of 17

Outfall ID Site Address Type Size
LastInspection
Target InspectionLatitude Longitude
oIB002 52ND ST AND SHEA BLVD Pipe 84 Inches 03/02/2009 201433 34 57' " -111 58 8' "o
oIB003 TATUM BLVD AND CHOLLA ST Pipe 66 Inches 03/02/2009 201433 35 28' " -111 58 41' "o
oIB004 TATUM BLVD AND CHOLLA ST Pipe 66 Inches 03/02/2009 201433 35 28' " -111 58 41' "o
oIB005 52ND ST AND INDIAN BEND WASH Box 14 x 3 Feet 03/02/2009 201433 35 1' " -111 58 8' "o
oIB007 36TH ST AND SWEETWATER AVE Pipe 78 Inches 04/24/2009 201433 36 13' " -112 0 15' "o
oIB008 40TH ST AND INDIAN BEND WASH Pipe 66 Inches 05/04/2009 201433 35 58' " -111 59 44' "o
oIB010 32ND ST AND ACOMA DR Pipe 66 Inches 04/27/2009 201433 37 7' " -112 0 47' "o
oIB011 56TH ST AND INDIAN BEND WASH Pipe 66 Inches 03/02/2009 201433 34 26' " -111 57 39' "o
oIB013 CACTUS RD AND INDIAN BEND WASH Pipe 72 Inches 04/28/2009 201433 35 50' " -111 59 35' "o
oIB016 TATUM BLVD AND CHOLLA ST Box 4 x 6 Feet 03/10/2009 201433 35 29' " -111 58 40' "o
oIB018 CACTUS RD AND INDIAN BEND WASH Pipe 72 Inches 04/28/2009 201433 35 50' " -111 59 35' "o
oIB021 10202 N 54TH PL Pipe 36 Inch 05/04/2009 201433 34 45' " -111 57 51' "o
oIB023 3526 E DAHLIA DR Spillway 20 Feet 04/24/2009 201433 36 13' " -112 0 16' "o
oIB024 3631 E DAHLIA DR Spillway 21 Feet 05/12/2009 201433 36 13' " -112 0 10' "o
oIB025 3716 E ASTER DR Spillway 19 Feet 05/12/2009 201433 36 10' " -112 0 9' "o
oIB026 12806 N 37TH CT Spillway 8 Feet 05/12/2009 201433 36 8' " -112 0 4' "o
oIB027 CACTUS RD AND INDIAN BEND WASH Spillway 11 Feet 04/28/2009 201433 35 53' " -111 59 35' "o
oIB035 THUNDERBIRD RD AND INDIAN BEND WASH Pipe 60 Inches 04/27/2009 201433 36 42' " -112 0 32' "o
oIB036 THUNDERBIRD RD AND INDIAN BEND WASH Pipe 60 Inches 04/27/2009 201433 36 43' " -112 0 32' "o
oIB037 THUNDERBIRD RD AND INDIAN BEND WASH Box 6 x 10 Feet 04/27/2009 201433 36 46' " -112 0 36' "o
oIB038 THUNDERBIRD RD AND INDIAN BEND WASH Pipe 84 Inches 04/27/2009 201433 36 46' " -112 0 32' "o
oIB039 13636 N 34TH PL Spillway 10 Feet 05/12/2009 201433 36 39' " -112 0 28' "o
oIB040 13614 N 34TH PL Spillway 10 Feet 05/12/2009 201433 36 36' " -112 0 27' "o
oIB041 PRESIDIO RD AND INDIAN BEND WASH Spillway 30 Feet 05/12/2009 201433 36 33' " -112 0 28' "o
oIB042 13402 N 35TH ST Spillway 30 Feet 05/12/2009 201433 36 29' " -112 0 25' "o
oIB043 10811 N 52ND ST Spillway 18 Feet 05/04/2009 201433 35 5' " -111 58 9' "o
oIB044 11016 N 50TH ST Spillway 12 Feet 05/04/2009 201433 35 14' " -111 58 14' "o
oIB045 4943 E CHOLLA ST Spillway 7 Feet 05/04/2009 201433 35 24' " -111 58 27' "o
oLC001 4532 W ALTA VISTA RD Spillway 9 Feet 05/07/2007 201233 23 18' " -112 9 23' "o
oLC002 6616 S 45TH GLEN Spillway 13 Feet 05/07/2007 201233 23 10' " -112 9 26' "o
Outfall Identification Legend
AC = Arizona Canal Diversion Canal
AZ = Arizona Canal
CC = Cave Creek Wash
EF = East Fork of the Cave Creek
GC = Grand Canal
IB = Indian Bend Wash
MV = Moon Valley Wash
NM = North Mountain Wash
OC = Old Cross Cut Canal
PD = Papago Diversion Canal
SC = Skunk Creek Wash
SR = Salt River
ST = Sweetwater Tributary of IB
SW = Scatter Wash
TS = Tenth Street Wash
UC = Upper Cave Creek Wash
ZT = Emile Zola Tributary of IB
RID = Roosevelt Irrigation District
AF = Agua Fria (West Hwy loop 101)
AW = Ahwatukee
PV = Paradise Valley
TD = Tempe Drainage Channel
LC = Laveen Area Conveyance Channel
Friday, July 01, 2011 Page 10 of 17

Outfall ID Site Address Type Size
LastInspection
Target InspectionLatitude Longitude
oLC003 46TH LN AND VINEYARD RD Spillway 32 Feet 05/07/2007 201233 23 5' " -112 9 30' "o
oLC008 53RD LN AND BASELINE RD Pipe 66 Inches 05/22/2007 201233 22 41' " -112 10 30' "o
oMV001 19TH AVE AND SWEETWATER AVE Pipe 48 Inches 04/08/2008 201333 36 14' " -112 5 59' "o
oMV002 19TH AVE AND SWEETWATER AVE Pipe 24 Inches 04/08/2008 201333 36 14' " -112 5 59' "o
oMV004 14TH DR AND SWEETWATER AVE Spillway 8 Feet 04/11/2008 201333 36 14' " -112 5 27' "o
oMV005 12TH AVE AND THUNDERBIRD RD Pipe 54 Inches 04/11/2008 201333 36 27' " -112 5 16' "o
oMV007 7TH ST AND HEARN RD Pipe 48 Inches 04/11/2008 201333 36 55' " -112 3 56' "o
oMV010 17TH DR AND SWEETWATER AVE Spillway 9 Feet 04/08/2008 201333 36 14' " -112 5 48' "o
oMV011 17TH AVE AND SWEETWATER AVE Spillway 20 Feet 04/16/2008 201333 36 14' " -112 5 43' "o
oMV012 16TH DR AND SWEETWATER AVE Spillway 20 Feet 04/16/2008 201333 36 14' " -112 5 40' "o
oMV013 16TH AVE AND SWEETWATER AVE Spillway 20 Feet 04/16/2008 201333 36 14' " -112 5 37' "o
oMV014 15TH DR AND SWEETWATER AVE Spillway 21 Feet 04/16/2008 201333 36 14' " -112 5 33' "o
oMV015 15TH AVE AND SWEETWATER AVE Spillway 18 Feet 04/16/2008 201333 36 14' " -112 5 30' "o
oMV016 13TH LN AND THUNDERBIRD RD Spillway 11 Feet 04/16/2008 201333 36 27' " -112 5 15' "o
oNM001 6TH ST AND MOUNTAIN VIEW RD Pipe 42 Inches 04/04/2006 201133 34 33' " -112 3 59' "o
oOC001 OLD CROSS CUT AND WASHINGTON ST, SOUTH TUNNEL Pipe 36 Inches 03/25/2009 201433 26 52' " -111 58 50' "o
oOC002 OLD CROSS CUT AND VAN BUREN ST, SOUTH TUNNEL Pipe 42 Inches 03/25/2009 201433 27 4' " -111 58 53' "o
oOC004 46TH ST AND MCDOWELL RD Pipe 42 Inches 06/15/2011 201633 28 5' " -111 58 44' "o
oOC005 48TH ST AND THOMAS RD Pipe 36 Inches 06/16/2011 201633 28 49' " -111 58 41' "o
oOC006 48TH ST AND EARLL DR Pipe 52 Inches 06/15/2011 201633 29 1' " -111 58 41' "o
oOC007 48TH ST AND INDIAN SCHOOL RD Pipe 36 Inches 03/25/2009 201433 29 37' " -111 58 41' "o
oOC008 46TH ST AND MCDOWELL RD Pipe 54 Inches 06/16/2011 201633 27 56' " -111 58 51' "o
oOC022 48TH ST AND OAK ST Pipe 48 Inches 03/25/2009 201433 28 23' " -111 58 42' "o
oOC028 48TH ST AND INDIAN SCHOOL RD Spillway 5 Feet 01/29/2009 201433 29 46' " -111 58 39' "o
oOC039 46TH STREET AND ROOSEVELT STREET - OLD CROSS CUT Box 6 x 5 Feet 04/16/2010 201533 27 29' " -111 58 56' "o
oOC053 48TH ST AND OSBORN RD Pipe 52 Inches 03/25/2009 201433 29 13' " -111 58 41' "o
oOC054 48TH ST AND OSBORN RD Box 8 x 6 Feet 03/25/2009 201433 29 14' " -111 58 41' "o
oOC055 48TH ST AND WELDON AVE Pipe 48 Inches 03/25/2009 201433 29 24' " -111 58 41' "o
oOC062 48TH ST AND THOMAS RD Pipe 36 Inches 03/25/2009 201433 28 44' " -111 58 41' "o
oOC072 OLD CROSS CUT AND GRANADA Pipe 42 Inches 03/25/2009 201433 28 5' " -111 58 41' "o
Outfall Identification Legend
AC = Arizona Canal Diversion Canal
AZ = Arizona Canal
CC = Cave Creek Wash
EF = East Fork of the Cave Creek
GC = Grand Canal
IB = Indian Bend Wash
MV = Moon Valley Wash
NM = North Mountain Wash
OC = Old Cross Cut Canal
PD = Papago Diversion Canal
SC = Skunk Creek Wash
SR = Salt River
ST = Sweetwater Tributary of IB
SW = Scatter Wash
TS = Tenth Street Wash
UC = Upper Cave Creek Wash
ZT = Emile Zola Tributary of IB
RID = Roosevelt Irrigation District
AF = Agua Fria (West Hwy loop 101)
AW = Ahwatukee
PV = Paradise Valley
TD = Tempe Drainage Channel
LC = Laveen Area Conveyance Channel
Friday, July 01, 2011 Page 11 of 17

Outfall ID Site Address Type Size
LastInspection
Target InspectionLatitude Longitude
oOC073 47TH ST AND MELVIN ST Spillway 13 Feet 12/04/2008 201333 27 7' " -111 58 53' "o
oOC074 46TH ST AND TAYLOR ST Spillway 28 Feet 01/26/2009 201433 27 14' " -111 58 55' "o
oOC075 46TH ST AND TAYLOR ST Spillway 12 Feet 01/26/2009 201433 27 15' " -111 58 55' "o
oOC076 46TH ST AND FILLMORE ST Spillway 29 Feet 01/26/2009 201433 27 17' " -111 58 55' "o
oOC077 46TH ST AND PIERCE ST Spillway 30 Feet 01/26/2009 201433 27 20' " -111 58 56' "o
oOC078 46TH ST AND MCKINLEY ST Spillway 27 Feet 01/26/2009 201433 27 22' " -111 58 56' "o
oOC083 48TH ST AND EARLL DR Spillway 03/25/2009 201433 29 1' " -111 58 41' "o
oPD001 91ST AVE AND PAPAGO DIVERSION CHANNEL Pipe 90 Inches 05/27/2009 201433 27 49' " -112 15 20' "o
oPD002 83RD AVE AND PAPAGO DIVERSION CHANNEL Pipe 90 Inches 01/20/2009 201433 27 47' " -112 45 42' "o
oPD003 75TH AVE AND PAPAGO DIVERSION CHANNEL Pipe 90 Inches 11/03/2010 201533 37 49' " -112 13 15' "o
oPD004 67TH AVE AND PAPAGO DIVERSION CHANNEL Pipe 90 Inches 06/16/2009 201433 27 49' " -112 12 13' "o
oPD005 59TH AVE AND PAPAGO DIVERSION CHANNEL Pipe 90 Inches 05/27/2009 201433 27 50' " -112 48 46' "o
oPD006 51ST AVE AND PAPAGO DIVERSION CHANNEL Pipe 84 Inches 06/16/2009 201433 27 50' " -112 10 10' "o
oPD007 43RD AVE AND PAPAGO DIVERSION CHANNEL Pipe 96 Inches 06/09/2009 201433 27 45' " -112 9 6' "o
oPD008 43RD AVE AND PAPAGO DIVERSION CHANNEL Pipe 54 Inches 06/09/2009 201433 27 45' " -112 9 4' "o
oPD009 39TH AVE AND PAPAGO DIVERSION CHANNEL Pipe 78 Inches 06/09/2009 201433 27 44' " -112 8 35' "o
oPD010 35TH AVE AND PAPAGO DIVERSION CHANNEL Pipe 54 Inches 06/10/2009 201433 34 19' " -112 8 1' "o
oPD011 31ST AVE AND PAPAGO DIVERSION CHANNEL Box 10 x 4 Feet 06/10/2009 201433 27 44' " -112 7 33' "o
oPD014 31ST AVE AND PAPAGO DIVERSION CHANNEL Pipe 48 Inches 06/10/2009 201433 27 44' " -112 7 33' "o
oPD015 32ND AVE AND PAPAGO DIVERSION CHANNEL Pipe 40 Inches 06/10/2009 201433 27 45' " -112 7 38' "o
oPD016 34TH AVE AND PAPAGO DIVERSION CHANNEL Pipe 42 Inches 06/10/2009 201433 27 47' " -112 7 54' "o
oPD017 43RD AVE AND PAPAGO DIVERSION CHANNEL Pipe 18 Inches 06/09/2009 201433 27 46' " -112 9 7' "o
oPD023 2901 W CULVER ST IN PAPAGO DIVERSION Spillway 14 Feet 06/16/2009 201433 27 47' " -112 7 17' "o
oPV001 33RD ST AND LINCOLN DR Pipe 36 Inches 04/03/2008 201333 31 55' " -112 0 42' "o
oPV002 34TH ST AND LINCOLN DR Pipe 48 Inches 04/03/2008 201333 31 55' " -112 0 37' "o
oPV004 35TH ST AND LINCOLN DR Pipe 48 Inches 04/03/2008 201333 31 55' " -112 0 24' "o
oPV005 35TH PL AND LINCOLN DR Pipe 36 Inches 04/03/2008 201333 31 55' " -112 0 19' "o
oPV006 3636 E LINCOLN DR Pipe 5 Feet 04/04/2008 201333 31 55' " -112 0 10' "o
oPV007 3762 E LINCOLN DR Pipe 48 Inches 04/04/2008 201333 31 55' " -111 59 59' "o
oPV008 3843 E LINCOLN DR Pipe 36 Inches 04/04/2008 201333 31 55' " -111 59 50' "o
Outfall Identification Legend
AC = Arizona Canal Diversion Canal
AZ = Arizona Canal
CC = Cave Creek Wash
EF = East Fork of the Cave Creek
GC = Grand Canal
IB = Indian Bend Wash
MV = Moon Valley Wash
NM = North Mountain Wash
OC = Old Cross Cut Canal
PD = Papago Diversion Canal
SC = Skunk Creek Wash
SR = Salt River
ST = Sweetwater Tributary of IB
SW = Scatter Wash
TS = Tenth Street Wash
UC = Upper Cave Creek Wash
ZT = Emile Zola Tributary of IB
RID = Roosevelt Irrigation District
AF = Agua Fria (West Hwy loop 101)
AW = Ahwatukee
PV = Paradise Valley
TD = Tempe Drainage Channel
LC = Laveen Area Conveyance Channel
Friday, July 01, 2011 Page 12 of 17

Outfall ID Site Address Type Size
LastInspection
Target InspectionLatitude Longitude
oPV009 3865 E LINCOLN DR Pipe 75 Inches 04/04/2008 201333 31 53' " -111 59 47' "o
oPV010 35TH PLACE AND LINCOLN DR Spillway 6 Feet 04/03/2008 201333 31 55' " -112 0 19' "o
oRID001 114TH AVE AND CAMELBACK RD Pipe 60 Inches 11/10/2010 201533 30 24' " -112 18 15' "o
oSC001 56TH AVE AND UNION HILLS DR Box 10x11 Feet 08/13/2007 201233 39 19' " -112 10 45' "o
oSC002 51ST AVE AND PIUTE AVE Pipe 36 Inches 09/11/2008 201333 39 44' " -112 10 9' "o
oSC006 19432 N 50TH AVE Spillway 10 Feet 08/13/2007 201233 39 46' " -112 10 5' "o
oSC008 19653 N 48TH LN Spillway 16 Feet 08/14/2007 201233 39 49' " -112 9 52' "o
oSC009 19623 N 48TH AVE Spillway 24 Feet 08/14/2007 201233 39 49' " -112 9 46' "o
oSC010 47TH DR AND BEHREND DR Pipe 8 Feet 08/14/2007 201233 39 52' " -112 9 43' "o
oSC012 4790 W ORAIBI DR Spillway 6 Feet 08/13/2007 201233 39 44' " 112 9 52' "o
oSC013 19634 N 47TH DR Pipe 4 Feet 08/14/2007 201233 39 50' " -112 9 40' "o
oSC014 19640 N 47TH AVE Pipe 6 Feet 08/14/2007 201233 39 51' " -112 9 37' "o
oSC015 46TH DR AND BEHREND DR Pipe 6 Feet 08/14/2007 201233 39 54' " -112 9 37' "o
oSC016 19810 N 46TH AVE Pipe 6 Feet 08/14/2007 201233 39 58' " -112 9 33' "o
oSC017 19828 N 45TH LN Spillway 6 Feet 08/14/2007 201233 39 58' " 112 9 31' "o
oSC022 2749 W DARIEN WAY Spillway 10 Feet 09/06/2007 201233 48 10' " -112 7 12' "o
oSC023 27TH CT AND FLORIMOND RD Spillway 50 Feet 09/06/2007 201233 48 13' " -112 7 13' "o
oSC024 27TH LN AND VIA AQUILA Box 4 x 2 Feet 09/06/2007 201233 48 26' " -112 7 11' "o
oSC025 27TH LN AND VIA AQUILA, WEST SIDE Box 4 x 2 Feet 09/06/2007 201233 48 26' " -112 7 12' "o
oSC027 CAREFREE HWY AND 27TH DR Pipe 36 Inches 09/06/2007 201233 47 55' " -112 7 6' "o
oSC031 35TH DR AND SOFT WIND DR Pipe 30 Inches 08/30/2007 201233 42 6' " -112 8 8' "o
oSC032 20659 N 41ST LN Spillway 18 Feet 08/30/2007 201233 40 28' " -112 8 55' "o
oSC033 20669 N 41ST LN Spillway 17 Feet 08/30/2007 201233 40 29' " -112 8 55' "o
oSC034 20657 N 42ND AVE Spillway 18 Feet 08/30/2007 201233 40 28' " -112 8 58' "o
oSC035 20622 N 42ND AVE Spillway 17 Feet 08/30/2007 201233 40 23' " -112 8 59' "o
oSC036 20670 N 41ST AVE Spillway 45 Feet 08/30/2007 201233 40 29' " -112 8 52' "o
oSC037 SC WASH AND SR101 FRONTAGE RD Pipe 36 Inches 09/14/2007 201233 40 12' " -112 9 4' "o
oSC040 VIA PUZZOLA AND VIA DEL DESERTO Pipe 36 Inches 09/14/2007 201233 48 32' " -112 7 18' "o
oSC043 2761 W VIA CALABRIA Spillway 19 Feet 10/01/2007 201233 47 58' " 112 7 12' "o
oSC044 35TH AVE AND PARKSIDE LN Pipe 35 Inches 10/22/2009 201433 41 38' " 112 8 4' "o
Outfall Identification Legend
AC = Arizona Canal Diversion Canal
AZ = Arizona Canal
CC = Cave Creek Wash
EF = East Fork of the Cave Creek
GC = Grand Canal
IB = Indian Bend Wash
MV = Moon Valley Wash
NM = North Mountain Wash
OC = Old Cross Cut Canal
PD = Papago Diversion Canal
SC = Skunk Creek Wash
SR = Salt River
ST = Sweetwater Tributary of IB
SW = Scatter Wash
TS = Tenth Street Wash
UC = Upper Cave Creek Wash
ZT = Emile Zola Tributary of IB
RID = Roosevelt Irrigation District
AF = Agua Fria (West Hwy loop 101)
AW = Ahwatukee
PV = Paradise Valley
TD = Tempe Drainage Channel
LC = Laveen Area Conveyance Channel
Friday, July 01, 2011 Page 13 of 17

Outfall ID Site Address Type Size
LastInspection
Target InspectionLatitude Longitude
oSC046 35206 N 27TH AVENUE Pipe 36 Inches 03/11/2009 201433 48 12' " -112 7 7' "o
oSR001 51ST AVE AND SALT RIVER Pipe 96 Inches 07/08/2010 201533 24 31' " -112 10 10' "o
oSR002 43RD AVE AND SALT RIVER Pipe 90 Inches 09/01/2010 201533 24 44' " -112 9 6' "o
oSR003 35TH AVE AND SALT RIVER Pipe 75 Inches 11/02/2010 201533 24 43' " -112 8 5' "o
oSR004 27TH AVE AND SALT RIVER Pipe 72 Inches 09/03/2010 201533 25 3' " -112 7 1' "o
oSR005 25TH AVE AND SALT RIVER Pipe 102 Inches 09/03/2010 201533 25 0' " -112 6 47' "o
oSR006 22ND AVE AND SALT RIVER Pipe 72 Inches 09/03/2010 201533 25 7' " -112 6 24' "o
oSR007 19TH AVE AND SALT RIVER Pipe 54 Inches 02/24/2011 201633 24 39' " -112 5 59' "o
oSR008 15TH AVE AND SALT RIVER Pipe 96 Inches 10/14/2009 201433 24 53' " -112 5 27' "o
oSR009 11TH AVE AND SALT RIVER Pipe 81 Inches 05/03/2010 201533 25 14' " -112 5 17' "o
oSR010 7TH AVE AND SALT RIVER Pipe 54 Inches 02/08/2011 201633 25 10' " -112 4 56' "o
oSR012 CENTRAL AVE AND SALT RIVER Pipe 42 Inches 08/17/2009 201433 25 24' " -112 4 26' "o
oSR013 CENTRAL AVE AND SALT RIVER Box 10 x 21 Feet 12/09/2010 201533 25 25' " -112 4 25' "o
oSR014 3RD ST AND SALT RIVER Pipe 36 Inches 11/03/2009 201433 25 2' " -112 4 1' "o
oSR015 3RD ST AND SALT RIVER Pipe 84 Inches 11/17/2010 201533 25 21' " -112 4 10' "o
oSR016 10TH ST AND SALT RIVER Pipe 54 Inches 12/11/2009 201433 25 18' " -112 3 37' "o
oSR017 12TH ST AND SALT RIVER Pipe 96 Inches 12/11/2009 201433 25 16' " -112 3 22' "o
oSR018 16TH ST AND SALT RIVER Pipe 66 Inches 10/05/2009 201433 25 11' " -112 2 54' "o
oSR019 20TH ST AND SALT RIVER Box 10 x 21 Feet 12/10/2010 201533 25 13' " -112 2 21' "o
oSR020 24TH ST AND SALT RIVER Pipe 84 Inches 10/27/2009 201433 25 16' " -112 58 9' "o
oSR024 28TH ST AND SALT RIVER Pipe 90 Inches 12/11/2009 201433 25 13' " -112 1 6' "o
oSR026 37TH ST AND SALT RIVER Pipe 42 Inches 10/15/2009 201433 25 37' " -112 0 19' "o
oSR027 36TH ST AND SALT RIVER, UNDER SKY HARBOR Pipe 82 Inches 05/19/2011 201633 25 39' " -112 0 4' "o
oSR029 47TH ST AND SALT RIVER Pipe 78 Inches 01/11/2011 201633 26 0' " -112 58 53' "o
oSR030 27TH AVE AND SALT RIVER Pipe 108 Inches 08/31/2010 201533 24 31' " -112 6 59' "o
oSR031 19TH AVE AND SALT RIVER Pipe 60 Inches 10/14/2009 201433 24 35' " -112 5 59' "o
oSR032 7TH AVE AND SALT RIVER Pipe 72 Inches 12/07/2010 201533 24 59' " -112 4 56' "o
oSR033 CENTRAL AVE AND SALT RIVER Pipe 66 Inches 08/20/2009 201433 25 15' " -112 4 25' "o
oSR035 7TH ST AND SALT RIVER Pipe 72 Inches 11/30/2010 201533 25 13' " -112 3 54' "o
oSR036 15TH ST AND SALT RIVER Pipe 72 Inches 11/16/2009 201433 25 4' " -112 2 59' "o
Outfall Identification Legend
AC = Arizona Canal Diversion Canal
AZ = Arizona Canal
CC = Cave Creek Wash
EF = East Fork of the Cave Creek
GC = Grand Canal
IB = Indian Bend Wash
MV = Moon Valley Wash
NM = North Mountain Wash
OC = Old Cross Cut Canal
PD = Papago Diversion Canal
SC = Skunk Creek Wash
SR = Salt River
ST = Sweetwater Tributary of IB
SW = Scatter Wash
TS = Tenth Street Wash
UC = Upper Cave Creek Wash
ZT = Emile Zola Tributary of IB
RID = Roosevelt Irrigation District
AF = Agua Fria (West Hwy loop 101)
AW = Ahwatukee
PV = Paradise Valley
TD = Tempe Drainage Channel
LC = Laveen Area Conveyance Channel
Friday, July 01, 2011 Page 14 of 17

Outfall ID Site Address Type Size
LastInspection
Target InspectionLatitude Longitude
oSR037 16TH ST AND SALT RIVER Pipe 36 Inches 11/16/2009 201433 25 3' " -112 2 56' "o
oSR038 24TH ST AND SALT RIVER Pipe 72 Inches 12/21/2009 201433 24 55' " -112 1 49' "o
oSR039 28TH ST AND SALT RIVER Pipe 96 Inches 08/20/2009 201433 24 59' " -112 1 15' "o
oSR045 40TH ST AND SALT RIVER Pipe 54 Inches 08/20/2009 201433 25 34' " -111 59 43' "o
oSR046 7TH ST AND SALT RIVER Pipe 24 Inches 08/20/2009 201433 25 17' " -112 3 54' "o
oSR047 51ST AVE AND SALT RIVER Pipe 48 Inches 07/08/2010 201533 24 32' " -112 10 10' "o
oSR048 45TH ST AND SALT RIVER Pipe 48 Inches 02/08/2010 201533 25 44' " -112 59 0' "o
oSR049 67TH AVE AND SALT RIVER Pipe 96 Inches 09/01/2010 201533 24 1' " -112 12 15' "o
oSR052 52ND ST AND HOHOKAM FRWY Box 8 x 5 Feet 01/12/2010 201533 26 27' " -112 58 9' "o
oSR056 28TH ST AND SALT RIVER Pipe 36 Inches 12/11/2009 201433 25 11' " -112 1 11' "o
oSR059 25TH AVE AND SALT RIVER Pipe 60 Inches 09/03/2010 201533 25 0' " -112 8 4' "o
oSR061 32ND ST AND SALT RIVER Box 7 x 5 Feet 03/04/2011 201633 25 23' " -112 0 47' "o
oSR062 38TH ST AND SALT RIVER Pipe 60 Inches 05/06/2010 201533 25 39' " -112 0 4' "o
oSR063 15TH AVE AND SALT RIVER Pipe 60 Inches 10/14/2009 201433 24 53' " -112 5 27' "o
oSR064 19TH AVE AND SALT RIVER Pipe 36 Inches 10/14/2009 201433 24 41' " -112 5 56' "o
oSR068 28TH ST AND SALT RIVER Box 8 x 8 Feet 12/11/2009 201433 25 14' " -112 1 6' "o
oSR069 31ST ST AND SALT RIVER Pipe 60 Inches 10/15/2009 201433 25 22' " -112 0 51' "o
oSR070 33RD ST AND SALT RIVER Pipe 36 Inches 10/15/2009 201433 25 24' " -112 0 44' "o
oSR071 33RD ST AND SALT RIVER Pipe 60 Inches 10/15/2009 201433 25 28' " -112 0 37' "o
oSR072 45TH ST AND SALT RIVER Pipe 48 Inches 05/06/2010 201533 25 52' " -112 59 12' "o
oSR073 45TH ST AND SALT RIVER Pipe 60 Inches 05/06/2010 201533 25 52' " -112 59 12' "o
oSR074 47TH ST AND SALT RIVER Pipe 76 Inches 02/08/2010 201533 25 51' " -112 58 48' "o
oSR075 43RD AVE AND BROADWAY RD Box 10 x 5 Feet 08/31/2010 201533 24 14' " -112 9 5' "o
oSR076 43RD AVE AND BROADWAY RD Pipe 48 Inches 08/31/2010 201533 24 14' " -112 9 4' "o
oSR077 22ND AVE AND RIO SALADO SERVICE YARD Spillway 17 Feet 09/03/2010 201533 25 6' " -112 6 25' "o
oSR079 35TH AVE AND SALT RIVER Pipe 42 Inches 08/31/2010 201533 24 34' " -112 8 4' "o
oSR080 51ST AVE AND SALT RIVER Pipe 42 Inches 07/08/2010 201533 24 15' " -112 10 9' "o
oSR082 75TH AVE S/O BROADWAY RD Pipe 84 Inches 09/01/2010 201533 23 52' " 112 13 14' "o
oST002 33RD PL AND PERSHING AVE Spillway 33 Feet 04/07/2008 201333 36 24' " -112 0 36' "o
oST003 33RD PL AND CAPTAIN DREYFUS AVE Spillway 31 Feet 04/07/2008 201333 36 20' " -112 0 36' "o
Outfall Identification Legend
AC = Arizona Canal Diversion Canal
AZ = Arizona Canal
CC = Cave Creek Wash
EF = East Fork of the Cave Creek
GC = Grand Canal
IB = Indian Bend Wash
MV = Moon Valley Wash
NM = North Mountain Wash
OC = Old Cross Cut Canal
PD = Papago Diversion Canal
SC = Skunk Creek Wash
SR = Salt River
ST = Sweetwater Tributary of IB
SW = Scatter Wash
TS = Tenth Street Wash
UC = Upper Cave Creek Wash
ZT = Emile Zola Tributary of IB
RID = Roosevelt Irrigation District
AF = Agua Fria (West Hwy loop 101)
AW = Ahwatukee
PV = Paradise Valley
TD = Tempe Drainage Channel
LC = Laveen Area Conveyance Channel
Friday, July 01, 2011 Page 15 of 17

Outfall ID Site Address Type Size
LastInspection
Target InspectionLatitude Longitude
oST004 SWEETWATER AVE AND 35TH ST Pipe 36 Inches 04/24/2009 201433 36 15' " -112 0 22' "o
oSW001 33RD AVE AND DEER VALLEY RD Pipe 54 Inches 02/29/2008 201333 41 2' " -112 7 36' "o
oSW006 43RD AVE AND BEHREND DR Pipe 36 Inches 03/05/2008 201333 39 54' " -112 9 7' "o
oSW009 21041 N 33RD AVE Pipe 8 Feet 03/05/2008 201333 40 39' " -112 7 49' "o
oSW010 3201 W SALTER DRIVE Spillway 20 Feet 03/05/2008 201333 40 55' " -112 7 41' "o
oSW011 33RD AVE AND DEER VALLEY RD Pipe 36 Inches 02/29/2008 201333 41 2' " -112 7 37' "o
oSW013 3143 W QUAIL AVE Pipe 8 Feet 03/04/2008 201333 40 45' " -112 7 40' "o
oSW014 3223 W ROSE GARDEN LN Spillway 16 Feet 03/04/2008 201333 40 35' " -112 7 44' "o
oSW015 38TH AVE AND BEARDSLEY RD Pipe 78 Inches 03/06/2008 201333 40 8' " -112 8 27' "o
oSW016 38TH AVE AND BEARDSLEY RD Pipe 18 Inches 03/06/2008 201333 40 8' " -112 8 27' "o
oSW019 31ST DR AND DEER VALLEY RD Pipe 36 Inches 02/29/2008 201333 41 2' " -112 7 36' "o
oSW021 3119 W MELINDA LANE Spillway 12 Feet 03/04/2008 201333 40 59' " -112 7 37' "o
oSW022 3135 W SALTER DRIVE Spillway 14 Feet 03/04/2008 201333 40 57' " -112 7 38' "o
oSW023 3135 W ABRAHAM LANE Spillway 24 Feet 03/04/2008 201333 40 53' " -112 7 39' "o
oSW024 3135 W LONE CACTUS DRIVE Spillway 22 Feet 03/04/2008 201333 40 50' " -112 7 39' "o
oSW025 3240 W ROSS AVE Spillway 17 Feet 03/05/2008 201333 40 32' " -112 7 49' "o
oSW026 31ST AVE AND DEER VALLEY RD Pipe 36 Inches 02/29/2008 201333 41 2' " -112 7 37' "o
oSW027 21064 N 32ND DRIVE Spillway 8 Feet 03/05/2008 201333 40 42' " -112 7 47' "o
oSW028 3204 W LONE CACTUS DR Spillway 11 Feet 03/05/2008 201333 40 50' " -112 7 42' "o
oSW029 22202 N 29TH DRIVE Spillway 4 Feet 03/13/2008 201333 41 15' " -112 7 21' "o
oSW030 22220 N 27TH AVE Spillway 4 Feet 03/18/2008 201333 41 19' " -112 7 2' "o
oSW031 22220 N 27TH AVE Spillway 4 Feet 03/18/2008 201333 41 19' " -112 7 3' "o
oSW032 22125 SANDS DR Pipe 53 Inches 03/18/2008 201333 41 12' " -112 7 17' "o
oTD002 4350 E SUPERIOR AVE Spillway 6 Feet 06/24/2008 201333 25 2' " -111 59 15' "o
oTD003 4302 E SUPERIOR AVE Spillway 6 Feet 06/24/2008 201333 25 2' " -111 59 21' "o
oTD004 4116 E SUPERIOR AVE Spillway 10 Feet 06/24/2008 201333 25 2' " -111 59 28' "o
oTD006 4048 E SUPERIOR AVE Spillway 11 Feet 07/01/2008 201333 25 0' " -111 59 33' "o
oTD007 4031 E SUPERIOR AVE Spillway 6 Feet 07/01/2008 201333 25 0' " -111 59 37' "o
oTD008 3402 S 40TH ST Pipe 36 Inches 07/01/2008 201333 24 57' " -111 59 44' "o
oTS002 11421 N CAVE CREEK RD Pipe 48 Inches 06/19/2008 201333 35 21' " -112 2 43' "o
Outfall Identification Legend
AC = Arizona Canal Diversion Canal
AZ = Arizona Canal
CC = Cave Creek Wash
EF = East Fork of the Cave Creek
GC = Grand Canal
IB = Indian Bend Wash
MV = Moon Valley Wash
NM = North Mountain Wash
OC = Old Cross Cut Canal
PD = Papago Diversion Canal
SC = Skunk Creek Wash
SR = Salt River
ST = Sweetwater Tributary of IB
SW = Scatter Wash
TS = Tenth Street Wash
UC = Upper Cave Creek Wash
ZT = Emile Zola Tributary of IB
RID = Roosevelt Irrigation District
AF = Agua Fria (West Hwy loop 101)
AW = Ahwatukee
PV = Paradise Valley
TD = Tempe Drainage Channel
LC = Laveen Area Conveyance Channel
Friday, July 01, 2011 Page 16 of 17

Outfall ID Site Address Type Size
LastInspection
Target InspectionLatitude Longitude
oTS007 1425 E DESERT COVE RD Pipe 36 Inches 06/16/2008 201333 35 13' " -112 3 7' "o
oTS008 14TH ST AND DESERT COVE AVE Spillway 53 Feet 06/16/2008 201333 35 9' " -112 3 7' "o
oUC001 CAVE CREEK RD AND CAVE BUTTE DAM Box 14 x 15 Feet 06/22/2009 201433 43 18' " -112 0 39' "o
oUC002 29221 N CAVE CREEK RD Box 3 x 15 Feet 06/22/2009 201433 45 1' " -111 59 37' "o
oUC003 CAVE CREEK RD AND TATUM BLVD Box 4 x 14 Feet 06/22/2009 201433 45 20' " -111 59 24' "o
oUC004 40TH ST AND TATUM BLVD Box 4 x 8 Feet 06/19/2009 201433 45 30' " -111 59 44' "o
oUC005 40TH ST AND CASCALOTE DR Box 4 x 9 Feet 06/19/2009 201433 45 40' " -111 59 43' "o
oUC006 40TH ST AND MONTGOMERY RD Box 3 x 10 Feet 06/19/2009 201433 45 47' " -111 59 44' "o
oUC007 40TH ST AND LONE MOUNTAIN RD Box 4 x 8 Feet 06/19/2009 201433 46 11' " -111 59 43' "o
oUC008 BLACK MOUNTAIN PKWY Box 4 x 16 Feet 06/22/2009 201433 47 5' " -111 59 42' "o
oZT001 33RD PL AND SHARON DR Spillway 18 Feet 04/07/2008 201333 36 41' " -112 0 38' "o
oZT002 33RD PL AND EMILE ZOLA AVE Spillway 46 Feet 04/07/2008 201333 36 28' " -112 0 37' "o
Outfall Identification Legend
AC = Arizona Canal Diversion Canal
AZ = Arizona Canal
CC = Cave Creek Wash
EF = East Fork of the Cave Creek
GC = Grand Canal
IB = Indian Bend Wash
MV = Moon Valley Wash
NM = North Mountain Wash
OC = Old Cross Cut Canal
PD = Papago Diversion Canal
SC = Skunk Creek Wash
SR = Salt River
ST = Sweetwater Tributary of IB
SW = Scatter Wash
TS = Tenth Street Wash
UC = Upper Cave Creek Wash
ZT = Emile Zola Tributary of IB
RID = Roosevelt Irrigation District
AF = Agua Fria (West Hwy loop 101)
AW = Ahwatukee
PV = Paradise Valley
TD = Tempe Drainage Channel
LC = Laveen Area Conveyance Channel
Friday, July 01, 2011 Page 17 of 17

List of Changes to the
Major Outfall Inventory

Eliminated Outfalls5
WATER SERVICES DEPARTMENT
City of Phoenix Storm Water ManagementEliminated Outfalls
COMBINED WITH SR027 IN MAY 2011. OUTFALL ELIMINATED. Instructions:
SR028 40TH ST AND SALT RIVER, UNDER SKY HARBOR
PipeDrain Type:
EliminatedStatus:
Description:
06/29/2011As Of:
Type: Impaired WatersMajor Outfall WC
Foot Mark:Latitude Longitude33 25 4' " -112 59 4' "Coordinates:
north side of river. Inspect at the same time as SR027. This outfall has a splitter box at Air Lane on airport property, an 84 inch from the north splits into 2- 72 inch pipes under the airport.
° ° 05/18/2011Last Inspection:
Concrete
E-10Map Number:
Culvert 72 Inch1Count: Size: 72 Inches
It appears that these outfalls are not separate but is one pipe north of the airport. They enter a junction box and the flow is split. Once on the airport they appear to drain different areas.
Reason:
Instructions:
SC041 VIA PUZZOLA AND CLOUD RD
PipeDrain Type:
EliminatedStatus:
Description:
03/16/2011As Of:
Type: Impaired WatersMajor Outfall WC
Foot Mark:Latitude Longitude33 48 45' " -112 7 15' "Coordinates:
150 feet south of Cloud Rd, east of Via Puzzola
° ° 03/14/2011Last Inspection:
Concrete
Map Number:
Culvert 48 Inch2Count: Size: 48 Inches
New outfall - 8/18/03, Outfalls has been eliminated because it does not drain city property/roads.
Reason:
Instructions:
AC127 7TH AVE AND DUNLAP AVE
PipeDrain Type:
EliminatedStatus:
Description:
12/09/2010As Of:
Type: Impaired WatersMajor Outfall WC
66900Foot Mark:Latitude Longitude33 34 4' " -112 4 50' "Coordinates:
north wall
° ° 12/03/2010Last Inspection:
Concrete
J-08Map Number:
Culvert 18 Inch1Count: Size: 18 Inches
outfall has been capped and is no longer in service. Inactive status on Dec 9 2010, mfl
Reason:
Instructions:
AC047 CENTRAL AVE AND SHORT TUNNEL
PipeDrain Type:
EliminatedStatus:
Description:
12/20/2010As Of:
Type: Impaired WatersMajor Outfall WC
70174Foot Mark:Latitude Longitude33 33 42' " -112 4 23' "Coordinates:
SHORT TUNNEL AT 3RD TO CENTRAL. north wall - approx. 300' east of tunnel
° ° 12/14/2010Last Inspection:
Concrete
J-08Map Number:
Culvert 12 Inch1Count: Size: 12 Inches
Approx. 4' below top of channel.Reason:
Instructions:
AC032 7TH AVE AND ACDC CHANNEL
PipeDrain Type:
EliminatedStatus:
Description:
12/09/2010As Of:
Type: Impaired WatersMajor Outfall WC
66154Foot Mark:Latitude Longitude33 34 7' " -112 4 58' "Coordinates: ° ° 12/03/2010Last Inspection:
Concrete
J-08Map Number:
Culvert 12 Inch1Count: Size: 12 Inches
outfall capped, removed from service, inactive on Dec 9, 2010 mflReason:
Friday, July 01, 2011 Page 1 of 1

New Outfalls3
WATER SERVICES DEPARTMENT
City of Phoenix Storm Water ManagementNew Outfalls
M-E-S-A Materials located 7845 W Broadway Rd. This is at the south end of 77th Avenue
Instructions:
SR082 75TH AVE S/O BROADWAY RD
PipeDrain Type:
ActiveStatus:
Description:
06/30/2010As Of:
Type: Impaired WatersMajor Outfall WC
Foot Mark:Latitude Longitude33 23 52' " 112 13 14' "Coordinates:
Outfall is about 1.50 miles s/o Broadway Rd. M-E-S-A Materials is operating in area and require you to checkin and out before entering area.
° °
Concrete
E-04Map Number:
Culvert 84 Inch1Count: Size: 84 Inches
Because of bee hives and a SRP outfall, sampling at the 1st manhole north would be adviseable. This SRP outfall includes drainage from a dairy farm.
Notes:
North side of channel Instructions:
EF064 3RD STREET AND GREENWAY PKWY
PipeDrain Type:
ActiveStatus:
Description:
07/14/2010As Of:
Type: Impaired WatersMajor Outfall WC
Foot Mark:Latitude Longitude33 38 12' " 112 4 9' "Coordinates:
South East corner of intersection of East Fork
° °
Concrete
Map Number:
Culvert 15 Inch1Count: Size: 15 Inches
Notes:
18 Instructions:
AW063 24TH ST. AND PECOS RD
PipeDrain Type:
ActiveStatus:
Description:
12/10/2010As Of:
Type: Impaired WatersMajor Outfall WC
Foot Mark:Latitude Longitude33 17 27' " 112 1 15' "Coordinates:
460 ' east of 24th St
° °
Concrete
A-9Map Number:
Culvert 18 Inch1Count: Size: 18 Inches
Notes:
Friday, July 01, 2011 Page 1 of 1

Laboratory Reports for
Stormwater Monitoring Performed
in the Reporting Period

New or Revised
Public Outreach Documents

Report Suspected Spills and Dumping into Storm Sewers to:Storm Water Management
(602) 256-3190 or (602) 495-0334 en Espanol
Never allow any waste, including vehicle or equipment wash water, to enter:
• storm drains• ditches or catch basins • streets• drywells
Office of Environmental Programs (602) 256-5669November-December 2010 POLLUTION PREVENTION (P2) AT WORK
Protecting the Environment & You

A Newsletter from the City of Phoenix Office of Environmental Programs (OEP)1st Quarter 2011 (January – March)
Pollution Awareness Markers (PAMs) are posted at stormwater inlets around the country to protect rivers and streams from pollution. Often called “storm drain markers”, these little ceramic or metal markers remind citizens not to dump hazardous materials into storm drains.
Unlike sanitary sewer drains, storm drains do not lead to sewage treatment plants. They lead to waterways. In Phoenix that means, eventually, the Salt River. With each rainfall, paved surfaces in cities release millions of gallons of water into adjacent waterways. Stormwater from cities and roads has been determined to be one of the most significant sources of fresh water and ocean pollution.
Phoenix has a Stormwater Discharge Permit that protects local waters, but the city started using PAMs long before the Permit encouraged them. To date 11,750 PAMs have been attached to storm drain catch basins around the city!
Have you ever read Phoenix PAMs? Other cities and counties use PAMs, too. Here are some of the logos you can read on storm drains across the country.
Kudos to the Police Department Range staff for testing MPro7, a non-petroleum weapons cleaner. MPro7 is a less-harmful product that replaces many chemical solvents and degreasers, typically made of petroleum hydrocarbons, flammable liquids, or other toxic chemicals. It is also made here in Phoenix.
Pollution Awareness MarkersPermitsP2 HeroesThree R’s of MarksmanshipDust Monitors
In This Issue:In This Issue: Need a Stormwater Permit for that project you’re planning? Although Phoenix is covered by a Municipal Stormwater General Permit (MSGP), some projects and activities still require a separate one. To learn more check out the Stormwater Policy here: http://inphx:8000/ENVPGM/P2/storm610.pdf
Wheat Ridge, CO – No Dumping, Drains to WaterwaysMelbourne, FL – Flows to Lagoon, Keep Curbs CleanAlexandria, VA – No Dumping, Drains to Four Mile RunOlathe, KS – No Dumping, Only Rain Down the DrainCumberland, MD – No Dumping, Drains to Potomac RiverAlbany, GA – No Dumping, Drains to Flint RiverClyde Hill, WA – Lake Washington Starts Here, Don’t PolluteJacksonville, NC – Drains to the New RiverUniversity of Michigan – Dump No Waste, Keep Your Michigan Waters Blue

Reduce, re-use, recycle – the phrase has been a staple in environmental circles for years. As Police recruits attend the Training Academy, they may not recognize the three R’s in their firearms classes, but all three are in place.
And that’s not just at the indoor firing range, where copper bullets designed to disintegrate (called “frangible”) have replaced lead ones. Officers can’t use copper bullets for qualification shooting or in their duty weapons, but they work great for indoor training. Each round strikes a specially designed steel bullet trap and breaks into small pieces. Later, the copper bullet dust is collected and recycled. That’s two of the three R’s – reduction of lead use and recycling of copper. Using frangible copper bullets indoors also protects indoor air quality.
It’s a little harder to collect, but the lead from outdoor practice and qualifying is recycled as well. Periodically, the range berms are mined for lead. Large machines scoop up the soil, bullets and all, screen out the metal components, and collect them for re-smelting. Sifted soil is replaced on the range. Over 100 tons of lead has been recycled using this method. And another R is also at work – reuse.
There’s a reason reuse comes before recycling, because it’s better for the environment to re-use a manufactured item than to create a new one. That’s the case with spent shell casings. The quantity may surprise you. Approximately twenty tons per year are collected, boxed, and shipped back to manufacturers. That’s a lot of copper ore that won’t have to be processed again. Kudos to the Police Department for finding the greener way to train!
Dust levels in the air are measured at 18 different locations throughout the Valley by monitoring equipment operated by the Maricopa County Air Quality Department.
As you may know from recent headlines, if levels of dust rise above federal health standards, the consequences for our region could include loss of federal highway funds and other punitive sanctions.
It is critical that dust from city construction and other earth-moving operations be minimized to prevent our operations from increasing dust concentrations at these monitors. Please review these monitor locations (by visiting the intranet web page below) before construction and share this information with your contractors.http://inphx:8000/ENVPGM/pm10monitor.pdf
Contact Joe Gibbs of Office of Environmental Programs at (602) 534-1776 if your project will be located within 0.5 mile of a dust monitor.
Sign up to receive email alerts or text messages when a No Burn Day is issued. Visit www.CleanAirMakeMore.comand click “Make the Commitment.”

A Newsletter from the City of Phoenix Office of Environmental Programs (OEP)2nd Quarter 2011 (April - June)
Congratulations to Fire Station 23, for their exemplary efforts in maintaining their station and protecting the environment. This station had zero findings in a recent Environmental Facility Assessment.Kudos to other Fire facilitieswhose EFAs also resultedin zero corrective actionsfor the 2010-2011assessment cycle:Stations 14, 21, 2932, 38, 39, 40, 43,44, 46, 72 and theTraining Academies.
Pictured: Firefighter/Paramedic Paul Barilla, Captain/Paramedic John Zanotti, Engineer David Gammage and Firefighter Ambro Lopez.
Are you signed up to receive High Wind Advisory emails sent by the Office of Environmental Programs (OEP)?
The advisories are generally sent to field operations foremen and supervisors when high winds are predicted, so city staff can better minimize dust emissions from their operations. However, any staff can receive the emails.
Blowing dust that crosses property boundaries is a violation of the County dust rules. This applies not only to dust from active operations but also dust from un-stabilized property. Maricopa County operates 18 dust monitors in the County – 9 of them located within Phoenix. It’s important that city operations don’t contribute to elevated readings at any of these monitors. For their locations, please visit: http://inphx:8000/ENVPGM/P2/mar-apr2011.pdf
To sign up for the High Wind Advisories, contact Joe Gibbs of OEP at (602) 534-1776 or [email protected]
The Phoenix Fire Department designed and constructed its new Training Academy to be a LEED Certified building. LEED stands for Leadership in Energy and Environmental Design and is the US Green Building Council’s process for rating highly efficient buildings. The site’s sustainable design features include:
A slotted drain around each of the two "burn" buildings used for recruit training collects the water used for training, which is stored and used to irrigate the landscape.
Low-flow plumbing fixtures reduce the amount of potable water used.
The station was built to allow natural daylight into most occupied spaces so little or no electrical lighting is needed during the day.
Energy-efficient mechanical units and cool roofs reduce the energy needed to cool the academy.
Environmentally friendlyproducts, such as lowVOC paints have alower odor and lessimpact on air quality.
Photovoltaic (solar)panels supplementthe building’s power,reducing its meteredelectricity needs.
The building contractormanaged the type andamount of constructionwaste generated tominimize space takenat the landfill.

Have you every wondered where the city’s storm drains discharge or why we have stormwaterregulations? Stormwater runoff from municipal facilities, industrial sites, and streets flows acrosspaved areas, picking up pollutants along the way such as litter, sediment, and oil or chemical residues. This stormwaterrunoff enters the city’s storm drain system and flows untreated into natural surface waters, such as the Salt River and the Cave Creek Wash. Because this runoff is untreated, pollutants directly enter these waters and can contribute to deterioration of water quality, either at the point of discharge or further downstream, limiting its uses for wildlife habitat, fishing, and recreation. Want to know what practices you should be following at your facility to prevent pollutants from entering the storm drain system? The city Hazardous Materials Management Program’s (HMMP) Stormwater Policy, which can be found online at http://inphx:8000/ENVPGM/P2/storm610.pdf, does just that - providing guidance and stormwater best management practices (BMPs) for use at city owned and operated facilities. It focuses on non-chemical pollutants, such as sediment, litter, and scrap metal - materials which had not traditionally been addressed in the HMMP. In addition, the practices in the HMMP “Container Management Policy”, which deals with chemical use and storage, should always be followed. Here are a few highlights from the city Stormwater Policy to keep in mind:
Never wash down materials such as sediment, green/organic waste, or chemical spills into storm drains. Use dry clean-up methods.Vehicle wash water from city facilities should never be discharged into the storm drain, even if no detergent is being used.Scrapped vehicles/equipment should have fluids removed from thembefore long-term storage.Facilities with bulk material stockpiles, if the material is small enough to be mobilized by stormwater, should have controls in place to prevent offsite discharge.
Please visit the Hazardous Materials Management Program web page at http://inphx:8000/ENVPGM/P2/hmmp0110.htmlfor more information on this and other city hazardous materials management policies. And remember, “Only rain in the storm drain!”
Jack and Sara, our Green Family Heroes for the month, were tired of paying so much at the fuel pumps. They checked out the top tips for improving fuel economy at the US Department of Energy’s FuelEconomy.gov website. Here’s what they found:
Stay in tune. On average, a tune-up yields about 4% better fuel economy. But if your car has a problem like a bad oxygen sensor, a good repair can add 40% to your fuel economy.
Keep tires properly inflated. Under-inflated tires are an epidemic,costing millions of gallons of gasoline, and millions of miles ofunsafe driving every year. Find the tire pressure sticker insideyour vehicle’s door frame or owner’s manual (not the pressureon the side of the tire) and gauge your tires. This can save3% or more on many cars, more if tires are badly under-inflated.Plus, tires last longer and driving is safer.
Use the right motor oil. Be sure you’re using the viscosityrecommended by your owner’s manual. Using 10W-40 when5W-40 is specified can save about 1.5% in fuel costs.
4 Metric Tons0CO2 Saved
$1650$ Saved at $3.75/Gallon
556600Gallons of Gas Used
12,00012,000Total Miles Per Year
21.6 MPG20 MPGMiles Per Gallon
After TipsBefore Tips
In Jack and Sara’s two car household, they applied these tips to their cars, saving 8% per car.


Standard Operating Procedures
for Field Analyses,
Permit Section 7.5.4

Field Sampling Protocol
April 1, 2009
USGS - Tempe Field Office 1769 W University Drive, Suite 175
Phoenix, Arizona 85281 480-736-1093

1
Sampling Checklist • Refer to PROCEDURE SHEETS • Check sampling status via computer, if available • Gather equipment - coolers, ice, pH/temperature
probes, gloves, etc. • Call lab to alert them about incoming samples • Collect grab samples and return them to lab within 6
hours of collection. Collect grabs in laboratory bottles. • Collect composite samples • Split raw and dissolved composite samples in the field • Preserve composite samples and ice samples
immediately • Turn composite samples in to the lab • Clean station equipment • Download data • Reset program

2
GRAB SAMPLE COLLECTION PROCEDURE
1. Bottles will be loaded from the Warehouse shop area before the storm event. One travel blank is included per cooler.
2. Collect grab samples directly into the lab provided sample bottles.
3. Place all labeled bottles into an ice chest, surrounding the bottles with
ice.
4. Measure pH, air temperature, water temperature, specific conductance, barometric pressure, and dissolved oxygen and record on the Storm Event Log Sheet.
5. Record the time and date on the chain of custody form.

3
COMPOSITE SAMPLE COLLECTION PROCEDURE
1. When program is complete, remove the composite sample jars from the gage house.
Sigma samplers: Using the plastic funnel, composite the 2 liter glass
bottles into the 5 gallon glass bottle in the cooler labeled for the site you are at.
DO NOT RESET THE SAMPLER PROGRAM AT THIS TIME. If this is done, all of the flow data will be erased.
2. Immediately shake up the 5 gallon glass composite bottle and begin decanting the sample into the lab provided raw composite sample bottles. When all raw samples have been decanted, hook up peristaltic pump and capsule filter and split the one filtered sample into the lab provided composite bottle.
3. Place all labeled composite bottles into an ice chest, surrounding the
bottles with ice. 4. Fill out the Chain of Custody sheet indicating time and date on the
form.
5. Take the samples to the contract lab.

4
GLASSWARE CLEANING PROCEDURE
1. Pour out any remaining contents, and rinse thoroughly with tap water.
2. Wash the container with Liquinox® solution. Use a brush to scrub the inside of the container.
3. Thoroughly rinse the container with tap water.
4. Rinse the container with nitric acid. Pour rinsate into waste collection
container.
5. Rinse with deionized water.
6. Rinse with acetone if the vessel is to be used again immediately. If not, allow to air dry. Pour excess acetone into waste collection container.
MSDS sheets are available for nitric acid and acetone, both of which are harmful chemicals.

5
QUALITY CONTROL SAMPLING PROCEDURES TRAVEL BLANKS – Taken each time VOC samples are taken.
1. These are provided by the lab. Submit one bottle for each cooler/container of grab samples.
SPLIT SAMPLES – One site per year per municipality
1. Instruct lab on which station should have a split sample duplicate performed.
EQUIPMENT BLANKS – One site per year per municipality
1. After sample event, clean the automatic samplers as usual. The equipment must be cleaned prior to the sampling. Clean or place clean sample bottles in the sampler base.
2. At one site per year, using the distributor tubing, pump deionized water
through the tubing directly into one set of laboratory provided composite bottles.
3. Give a sample identification number in the form, LBmmddyy, where LB
indicates a line equipment blank and mmddyy is the sample date. Fill out the chain of custody, and place the samples on ice.
4. Pour deionized water into the eight glass jars and then pour the water
into the laboratory provided container in the second set of composite bottles.
5. Give an identification number to the set in the form BBmmddyy, where
BB indicates a bottle equipment blank and mmddyy is the sample date. Fill out the chain-of-custody form and place the samples on ice.

6
EQUIPMENT CLEANING PROCEDURE
1. Pump approximately 1/2 gallon of tap water through the intake tubing.
2. Pump a 1/2 gallon mixture of tap water and Liquinox® through the intake tubing.
3. Pump a large amount of tap water through the intake tubing line to
flush the soap out of the line.
4. Pump a small amount of nitric acid (pH 3-4) through the line.
5. Final rinse of 1/2 to 1 gallon deionized water through the line.
6. Reset the sampler for the next storm event.

7
DATA DOWNLOADING PROCEDURES 900MAX SERIES SIGMA SAMPLERS (PHOENIX and GLENDALE SITES) Download of data from the 900 series samplers requires a program called INSIGHT be installed on a laptop or office computer. INSIGHT allows modem or RS-232 connection to the sampler. If connecting by modem, click on the Modem button in the Insight program. If connecting directly, click on the 900 MAX button in the program. The appropriate site should be chosen for connection. Once connection has been made, the screens will ask for the operation (in this case “Retrieve Logged Data”). 1.0 Priorities Safety of personnel is the highest priority. Care must be exercised when handling samples and sample containers, and when out on busy streets collecting samples and doing maintenance work. Sample integrity and quality is high priority. Collection, preservation, and delivery of samples to the lab take priority over any other activity, such as cleaning stations. Please note the following items: • Always wear latex gloves when handling samples. (Use only latex gloves.) In
addition to the threat of dermal exposure to hazardous compounds, contact between skin and samples can introduce contamination to the samples resulting in false results.
• Use caution when entering manholes to service the sampler intake tubing and depth
sensors. Proper Standard Operating Procedures must be followed for Confined Space Entry. Hardhats are required in manholes to protect from falling objects.
• Always keep samples as cool as possible. The regulations require samples be kept
at 4 degrees Celsius. Lower temperatures discourage bacterial growth and slow the breakdown process of nutrients and organics in the sample. Always use ice during all phases of sample collection and preservation.
• Collect samples as quickly as possible once sampling has ended. • Once composite samples are collected, they should be split, preserved and iced
immediately. Preservation of samples inhibits bacterial growth and breakdown of pollutants.

8
• Follow the Sample Bottle Fill priority sheet located in the Appendix. This will allow
the most important parameters to be analyzed when an insufficient sample has been collected by the sampler.
• QC split samples are required for checking laboratory integrity. Split samples will be
taken on ten percent of all samples.

9
2.0 Site Basics The USGS has 12 stormwater monitoring sites that it currently maintains. There are five land-based sites in Glendale and seven in Phoenix. The sites are identified as follows:
OLIVE 09513925 67th Avenue and Olive Avenue 623-939-8191 ARROW 333751112133801 Skunk Creek at 79th Avenue CITRUS 333840112123601 Grovers at 71st Avenue 623-334-4814 INDPARK 333238112165201 Orangewood/West of New River 623-772-0842 BUTLER 333346112104501 Orchid Lane at 56th Drive 623-930-7101 SR-49 332430112101001 Salt River and 67th Avenue (north bank) SR-03 332333112080301 Salt River and 35th Avenue (north bank) SR-30 09512403 27th Avenue and the Salt River SR-45 332409111594101 Salt River and 40th Street (south bank) 602-470-0127 DUNLAP 333407112045401 Dunlap Avenue and 7th Avenue IB-08 333557111594201 Indian Bend Wash and 40th Street 602-494-9926 SC-046 SC Trib at 27th Avenue and Perrdido Way Pager Service Modem 602-253-4297

10
3.0 Equipment Setup 3.1 Site Specific Equipment
An assortment of equipment is employed in the notification and sampling efforts.
Four sites in Glendale and one site in Phoenix have identical setups. The following equipment is used:
Sigma 900 MAX Automatic sampler with integral flowmeter, modem, raingage and dialout alarm. 8 jar configuration, jar volume = 1900 mL (15.2L total).
Six sites in Phoenix and one site in Glendale have identical setups. The following equipment is used:
CR10 datalogger with an Isco 6700 Automatic sampler, Druck PDCR 1830 pressure transducer, modem, raingage and dialout alarm. 1 jar configuration, jar volume = 5 gallon (19L total).
3.2 Programming of Equipment
Specific programming for each site is included in the Appendix.

11
4.0 Safety
A number of safety issues need to be considered when sampling. There are concerns of traffic safety and sample/chemical handling safety. Furthermore, when performing routine maintenance involving manhole entry, additional precautions must be taken.
4.1 Traffic Safety
Most of the samplers are not located on busy streets. However, a few samplers are adjacent to busy streets. Care should be exercised so that traffic does not endanger work activities.
4.2 Sample / Chemical Safety
The stormwater samples contain contaminants of unknown composition. In most cases, the concentrations of contaminants in the stormwater are so low as to not be of concern. However, since the make up of the stormwater is unknown at the time of sampling, it is required that latex gloves be worn when handling stormwater. The gloves also prevent contamination from being transferred from hands to the samples. Furthermore, the latex gloves will protect skin from contact with the preservatives in some laboratory sample containers. The preservatives are either acids or bases. Both can burn skin.
If contact between skin and stormwater and/or preservatives occur, wash the affected area with large amounts of water to dilute the contamination.
4.3 Maintenance Safety
Entering manholes may cause exposure to unknown vapors and gases. Proper Confined Space Entry procedures must be followed prior to entering manholes.
Confined Space Entry is not covered in this manual. A separate manual covers this subject.

12
5.0 Sampling Procedures 5.1 Sampler Storm Setup
Samplers must be readied for sampling within 3 days after the previous storm event. A number of bottles are necessary for the proper collection and preservation of the samples for analysis. Grab and composite sample bottles will be kept at the District office. Clean sampler jars will be kept at the District office.
Site identification should be placed on the bottles before filling, and before the storm event. It is difficult to write on wet labels, whether it is from sample spillage or from rainwater. The travel blank bottles should have the site identification listed on them also.
5.2 Sample Event
5.2.1 General
All samplers in Glendale and Phoenix are set to activate when 0.05 inch of rain, and the water level has reached a minimum sampling threshold. The samplers have a built-in notification feature. This feature allows the sampler to notify the sampling team via pagers of its status. Furthermore, the FCD ALERT system has rain gauges located near or at some of the sampling sites. 5.2.2 Grab Samples
Grab samples are collected from the discharge as near to the sample intake line as possible. Temperature, pH, Specific Conductance, Barometric Pressure, and Dissolved Oxygen are taken at this time and recorded on the Field Data Sheet. The bacterial sample has a short hold time of six hours. The sample must be transported to the lab within six hours of collection. Proper coordination with the lab must be done to ensure that this six-hour window is met.
As mentioned previously, chilling the samples is extremely important. Ice is to be taken to all sites and placed around the jars in the sampler unit to keep the pumped samples as cool as possible. Samples remaining at ambient temperatures run the risk of having their chemical content altered from bacterial action and/or volatilization.

13
5.2.3 Composite Samples
Along with the grab samples, a flow-weighted composite sample is collected. This sample is based on a set quantity of water passing over the flow sensor between each aliquot collection. Each site has a different flow interval, based on site characteristics.
The composite sample will require from 1 to 6 hours to complete, depending upon the strength and intensity of the storm. In general, sampling is usually complete within a few hours. Sigma sampling equipment will indicate on the sampler unit’s display if the program is complete. Occasionally, insufficient flow is produced from the storm to complete a sampling routine.
5.2.4 Representative Events Rainfall totals must be more than 0.20 inches, and there must be more than 72 hours prior to the event without precipitation. Anything outside these boundaries are automatically rejected and will not require response. 5.2.5 Quality Control Samples
To ensure that the data received from the lab is of highest quality, and to assess the cleanliness of the sample equipment, three types of QC samples will be submitted. Travel blanks, equipment blanks, and split samples will be assessed. Travel blanks have been mentioned previously in the grab sample section. Travel Blanks
The laboratory furnishes the travel blanks. These are used to assess whether contamination was introduced during transport of volatile organic samples to the lab.
There must be one travel blank per cooler/container. Split Samples
Split samples will assess the accuracy of the laboratory analyses. One site will be chosen for split samples for a given year. Splits will be analyzed for the full list of analytes required by the municipality.
Equipment Blanks
The equipment blank will measure the effectiveness of the cleaning program of the sampling equipment.

14
One site will be evaluated per year. The equipment is cleaned in the usual manner according to the instructions. After the cleaning, deionized water is pumped through the intake tubing directly into laboratory bottles for analysis. The equipment blanks will be analyzed for the pollutants required by the municipality in which the sample was taken.
5.3 Post Sample
5.3.1 Flow Data Collection
It is desirable to collect the flow data remotely from the office. However, this is not always possible due to modem problems or lack of a phone line. 5.3.2 Post Event Cleaning
Cleaning of the sample equipment is very important in obtaining high quality samples. The sample jars should be cleaned according to the GLASSWARE CLEANING PROCEDURE, and the intake tubing line should be cleaned according to the EQUIPMENT CLEANING PROCEDURE.

15
6.0 Periodic Maintenance 6.1 Six Month Maintenance (June)
1. Check and calibrate the depth sensor 2. Check and calibrate the pumped sample volume 3. Check and clean rain gauges of debris 4. Inspect sample intake line, connect cables, connections, pump tubing,
distributor tubing, batteries, solar panels, batteries, and charging system.
5. Make any repairs or replacements as necessary. 6.2 Annual Maintenance (October)
1. Perform the Six Month Maintenance 2. Replace sample intake tubing with new Teflon tubing 3. Replace sampler pump tubing 4. Replace distributor tubing 5. Rinse new intake tubing with deionized water
6.3 As Needed Maintenance
Some of the six-month and annual maintenance may be required more frequently. This is determined on a site-by-site basis. As equipment ages and fails, equipment should be replaced as quickly as possible. A small inventory of parts should be on-hand to replace failed parts. Replacement of stocked parts should be done within 2 weeks of problem report. Ordered parts should be replaced within a week of being received. As equipment is replaced, calibrations need to be performed.
6.4 Recordkeeping
Maintenance records should include the date, time, personnel doing the service, and a description of the service done. A specific sheet is available for recording maintenance activities. Copies of all record keeping sheets are in the Appendix. All records are kept at the District offices.

16
Appendix

17
Phoenix (900MAX series) Sigma Stormwater Sampler Program Some Basic Program Notes:
To start sampling: press the RUN/STOP key and follow the directions.
To see the current status, Press the STATUS key from the MAIN MENU.
The MAIN MENU key can be pressed at any time to return to that point.
To look at data, press DISPLAY DATA from the MAIN MENU and follow prompts. 1. Press the MAIN MENU key. 2. Press the SETUP key at the upper right side of the display. 3. Press the MODIFY ALL ITEMS key at the upper right side of the display. 4. Number of bottles: 8
if 8 is displayed, press ACCEPT if 8 is not displayed, press CHANGE CHOICE until 8 appears, then press ACCEPT.
5. Bottle Volume: 1900 mL if 1900 mL is displayed, press ACCEPT if 1900 mL not displayed,
Press CHANGE UNITS to change to mL AND Enter 1900 and press ACCEPT.
6. Intake Tubing Length: IBW at 40th Street 21 ft
if the correct value is displayed, press ACCEPT if the correct value is not displayed, enter the correct value and press ACCEPT.
7. Intake Tubing Type: 3/8" vinyl (tubing is actually Teflon) if 3/8" vinyl is displayed, press ACCEPT if 3/8" vinyl is not displayed, press CHANGE CHOICE until it appears, then press the ACCEPT button.
8. Program Lock: Disabled if disabled is displayed, press ACCEPT if disabled is displayed, press CHANGE CHOICE until it appears, then press the ACCEPT button.
9. Program Delay: Disabled if disabled is displayed, press ACCEPT if enabled is displayed, press CHANGE CHOICE until it appears, then press the ACCEPT button.
10. Sample Collection: Flow Proportional if flow proportional is displayed, press ACCEPT if flow proportional is not displayed, press CHANGE CHOICE until it appears, then press the ACCEPT button.

18
11. Flow Pacing Mode: CONST VOL/VAR TIME if Const Vol/Var Time is displayed, press ACCEPT if Const Vol/Var Time is not displayed, press CHANGE CHOICE until it appears,
then press the ACCEPT button. 12. Flow Meter: Integral
if integral is displayed, press ACCEPT if integral is not displayed, press CHANGE CHOICE until it appears, then press the ACCEPT button.
13. Take Sample Every: (IBW at 40th Street : 2000 cf) if xxxx cf appears in the display, press ACCEPT if xxxx cf does not appear in the display,
press CHANGE UNITS to get CF, AND enter xxxx and press ACCEPT.
14. Timed Override?: Disabled if disabled appears in the display, press ACCEPT if enabled appears in the display, press CHANGE CHOICE until it appears, then press ACCEPT.
15. Take First Sample: Immediately if immediately appears in the display, press ACCEPT if immediately does not appear in the display, press CHANGE CHOICE until it appears, then press ACCEPT.
16. Deliver Each Sample To All Bottles?: No If no appears in the display, press ACCEPT If yes appears in the display, press CHANGE CHOICE until it appears, then press ACCEPT.
17. Choose a Method of Distribution: Samples/Bottle If Samples/Bottle appears in the display, press ACCEPT. If Bottles/Sample appears in the display, press CHANGE CHOICE until it appears, then press ACCEPT.
18. Samples/Bottle: 4 If 4 appears in the display, press ACCEPT. If 4 does not appear in the display, enter 4 and press ACCEPT.
19. Liquid Sensors: Enabled If enabled appears in the display, press ACCEPT If disabled appears in the display, press CHANGE CHOICE until it appears, then press ACCEPT.
20. Sample Volume: 450 mL If 450 mL appears in the display, press ACCEPT If 450 mL does not appear in the display, enter 450 and press ACCEPT.
21. Intake Rinses: 2 If 2 appears in the display, press ACCEPT If 2 does not appear in the display, enter 2 and press ACCEPT.
22. Sample Retries: 2 If 2 appears in the display, press ACCEPT

19
If 2 does not appear in the display, enter 2 and press ACCEPT. 23. Site ID: 00002004 IBW at 40th Street
If the correct ID appears in the display, press ACCEPT If the correct ID does not appear in the display, enter it and press ACCEPT.
24. Do You Wish to Access Advanced Sampling Features?: Yes Press the button for YES.
25. Use the DOWN arrow key to go to STORMWATER and press SELECT. 26. Storm Water: Enabled
If Enabled appears in the display, press ACCEPT If Enabled does not appear in the display, press CHANGE CHOICE until it appears, then press ACCEPT.
27. Storm Water Start Condition: Rain and Level If Rain and Level appears in the display, press ACCEPT If Rain and Level does not appear in the display, press CHANGE CHOICE until it appears, then press ACCEPT.
28. Storm Water Rain Trigger: 0.05 inch If 0.05 inch appears in the display, press ACCEPT If 0.05 inch does not appear in the display, enter 0.05 and press ACCEPT.
29. Rainfall Time Interval: 1:00 If 1:00 (hr:min) appears in the display, press ACCEPT If 1:00 (hr:min) does not appear in the display, enter 100 and press ACCEPT.
30. Storm Water Level Trigger: 0.5 inch If 0.5 inch appears in the display, press ACCEPT If 0.5 inch does not appear in the display, enter 0.5 and press ACCEPT.
31. First Flush Number of Bottles: 1 If 1 appears in the display, press ACCEPT If 1 does not appear in the display, enter 1 and press ACCEPT.
32. First Flush: Samples to Collect: 1 If 1 appears in the display, press ACCEPT If 1 does not appear in the display, enter 1 and press ACCEPT.
33. First Flush Interval 1: 0:05 (hr:min) If 0:05 (hr:min) appears in the display, press ACCEPT AS FINAL If 0:05 (hr:min) does not appear in the display, enter 005 and press ACCEPT AS FINAL.
34. First Flush Sample Volume: 100 mL If 100 mL appears in the display, press ACCEPT If 100 mL does not appear in the display, enter 100 and press ACCEPT.
35. Program Time Limit: Enabled If Enabled appears in the display, press ACCEPT If Disabled appears in the display, press CHANGE CHOICE until it appears, then press ACCEPT.
36. Storm Water Program Time Limit: 8:00 (SUMMER) 16:00 (WINTER) If 8:00/16:00 (hr:min) appears in the display, press ACCEPT

20
If 8:00/16:00 (hr:min) does not appear in the display, enter 800/1600 and press ACCEPT.
37. Press MAIN MENU button. 38. Press OPTIONS from the main menu. 39. Press ADVANCED OPTIONS. 40. Select ALARMS and press SELECT. 41. Scroll to LOW MAIN BATTERY using the down arrow key, and press SELECT. 42. Low Main Battery Alarm Condition: Enabled
If Enabled appears in the display, press ACCEPT. If Disabled appears in the display, press CHANGE CHOICE until it appears, then
press ACCEPT. 43. Report Via Modem (be sure arrow is on in front of ‘Report via modem’). If arrow is present, press RETURN. If arrow is not present, press SELECT, and then press RETURN. 44. Scroll to MEMORY BATTERY. 45. Memory Battery Alarm Condition: Enabled
If Enabled appears in the display, press ACCEPT. If Disabled appears in the display, press CHANGE CHOICE until it appears, then
press ACCEPT. 46. Report Via Modem (be sure arrow is on in front of ‘Report via modem’). If arrow is present, press RETURN. If arrow is not present, press SELECT, and then press RETURN. 47. Scroll to RAINFALL using the down arrow keys, and press SELECT. 48. Rainfall Alarm Condition: Enabled
If Enabled appears in the display, press ACCEPT If Disabled appears in the display, press CHANGE CHOICE until it appears, then press ACCEPT.
49. Rainfall High Trigger Point: 0.05 inch If 0.05 inch appears in the display, press ACCEPT If 0.05 inch does not appear in the display, enter 0.05 and press ACCEPT.
50. Rainfall Time Interval: 1:00 (hr:min) If 1:00 (hr:min) appears in the display, press ACCEPT If 1:00 (hr:min) does not appear in the display, enter 100 and press ACCEPT.
51. Report Via Modem (be sure arrow is on in front of ‘Report via modem’). If arrow is present, press RETURN. If arrow is not present, press SELECT, and then press RETURN. 52. Press RETURN 53. Scroll to CALIBRATION if PT is to be calibrated. 54. Scroll to COMMUNICATION SETUP and press SELECT. 55. Scroll to MODEM SETUP and press SELECT. 56. Modem Power: Enabled
If Enabled appears in the display, press ACCEPT If Disabled appears in the display, press CHANGE CHOICE until it appears and then press ACCEPT.

21
57. Dial Method: Tone If Tone appears in the display, press ACCEPT If Pulse appears in the display, press CHANGE CHOICE until it appears, then press ACCEPT.
58. Phone Number: 6024151084 If 6024151084 appears in the display, press ACCEPT
If 6024151084 does not appear in the display, enter it and press ACCEPT. 59. Cellular Modem Scheduling: Disabled If Disabled appears in the display, press ACCEPT. If Enabled appears in the display, press CHANGE CHOICE until Disabled appears
in the display, then press ACCEPT. 60. Pager Option: Enabled If Enabled appears in the display, press ACCEPT. If Disabled appears in the display, press CHANGE CHOICE until Disabled appears
in the display, then press ACCEPT. 61. Pager Service Phone Number: 602-253-4297 If 6022534297 appears in the display, press ACCEPT. If not, enter 6022534297, and press ACCEPT. 62. Number of Pagers: 2 Enter 2 in the display. 63. Pager #1 Phone Number: Enter 6022270687 64. Pager #2 Phone Number: Enter: 6022275191 65. Reporting Order: Pager Only If Pager Only is in the display, press ACCEPT. If Pager Only is not in the display, press CHANGE CHOICE until Pager Only
appears in the display, then press ACCEPT. 66. Scroll to RS-232 setup and press SELECT. 67. RS-232 Baud Rate: 9600
If 9600 appears in the display, press SELECT If 9600 does not appear in the display, enter 9600 and press ACCEPT.
68. Press RETURN 69. Scroll to DATA LOG and press SELECT. 70. Scroll to SELECT INPUTS and press SELECT. 71. Scroll to RAINFALL and press SELECT. 72. Rainfall Input Data: Logged
If Logged appears in the display, press SELECT If Logged does not appear in the display, press CHANGE CHOICE until it appears, then press ACCEPT.
73. Rainfall Logging Interval: 1 min If 1 min appears in the display, press ACCEPT If 1 min does not appear in the display, enter 1 and press CHANGE CHOICE until minutes appears in the display, then press ACCEPT.

22
74. Scroll to LEVEL/FLOW and press SELECT. 75. Level/Flow Input Data: Logged
If Logged appears in the display, press SELECT If Logged does not appear in the display, press CHANGE CHOICE until it appears, then press ACCEPT.
76. Level/Flow Logging Interval: 1 min If 1 min appears in the display, press ACCEPT If 1 min does not appear in the display, enter 1 and press CHANGE CHOICE until minutes appears in the display, then press ACCEPT.
77. Press RETURN. 78. Scroll to EXTENDED POWER MODE and press SELECT. 79. Extended Power Mode: Disabled
If Disabled appears in the display, press ACCEPT If Enabled appears in the display, press CHANGE CHOICE until it appears, then press ACCEPT.
80. Press RETURN. 81. Scroll to SET MEMORY MODE and press SELECT. 82. Memory Mode: Wrap
If Wrap appears in the display, press ACCEPT If Wrap does not appear in the display, press CHANGE CHOICE until it appears then press ACCEPT.
83. Press RETURN. 84. Scroll to FLOW METER SETUP and press SELECT. 85. Flow Units: cfs
If cfs appears in the display, press ACCEPT If cfs does not appear in the display, press CHANGE CHOICE until it appears then press ACCEPT.
86. Level Units: in If in appears in the display, press ACCEPT If in does not appear in the display, press CHANGE CHOICE until it appears then press ACCEPT.
87. Primary Device: Manning Equation If Manning Equation appears in the display, press ACCEPT If Manning Equation does not appear in the display, press CHANGE CHOICE until it appears then press ACCEPT.
88. Shape: Circular Pipe If Circular Pipe appears in the display, press ACCEPT If Circular Pipe does not appear in the display, press CHANGE CHOICE until it appears then press ACCEPT.
89. Pipe Diameter: IBW at 40th Street 66-inch
If the value in the display is correct, press ACCEPT If the value in the display is incorrect, enter the correct value and press SELECT.

23
90. Pipe Slope: IBW at 40th Street : 0.0032
If the value in the display is correct, press ACCEPT If the value in the display is incorrect, enter the correct value, and press ACCEPT.
91. Pipe Roughness: IBW at 40th Street : 0.020
If the value in the display is correct, press ACCEPT If the value in the display is incorrect, enter the correct value, and press ACCEPT.
92. Total Flow Units: cf If cf appears in the display, press SELECT If cf does not appear in the display, press CHANGE CHOICE until it appears and press ACCEPT.
93. Press RETURN. 94. Scroll to FLOW TOTALIZER, and press SELECT. 95. Scroll to MODIFY SETUP, and press SELECT. 96. Totalizer Scaling: x 1
If x 1 appears in the display, press ACCEPT If x 1 does not appear in the display, press CHANGE CHOICE until it appears, and then press ACCEPT.
97. Total Flow Units: cf If cf appears in the display, press ACCEPT If cf does not appear in the display, press CHANGE CHOICE until it appears, and then press ACCEPT.
98. Press RETURN. 99. Press RETURN. 100. Press MAIN MENU. 101. Ready to Start, press RUN/STOP to begin sampling.

24
Glendale (900MAX series) Sigma Stormwater Sampler Program Some Basic Program Notes:
To start sampling: press the RUN/STOP key and follow the directions.
To see the current status, Press the STATUS key from the MAIN MENU.
The MAIN MENU key can be pressed at any time to return to that point.
To look at data, press DISPLAY DATA from the MAIN MENU and follow prompts. 1. Press the MAIN MENU key. 2. Press the SETUP key at the upper right side of the display. 3. Press the MODIFY ALL ITEMS key at the upper right side of the display. 4. Number of bottles: 8
if 8 is displayed, press ACCEPT if 8 is not displayed, press CHANGE CHOICE until 8 appears, then press ACCEPT.
5. Bottle Volume: 1900 mL if 1900 mL is displayed, press ACCEPT if 1900 mL not displayed,
Press CHANGE UNITS to change to mL AND Enter 1900 and press ACCEPT.
6. Intake Tubing Length: CITRUS 40 ft ARROW 65 ft INDPARK 26 ft BUTLER 63 ft
if the correct value is displayed, press ACCEPT if the correct value is not displayed, enter the correct value and press ACCEPT.
7. Intake Tubing Type: 3/8" vinyl (tubing is actually Teflon) if 3/8" Vinyl is displayed, press ACCEPT if 3/8" Vinyl is not displayed, press CHANGE CHOICE until it appears, then press the ACCEPT button.
8. Program Lock: Disabled if disabled is displayed, press ACCEPT if disabled is displayed, press CHANGE CHOICE until it appears, then press the ACCEPT button.
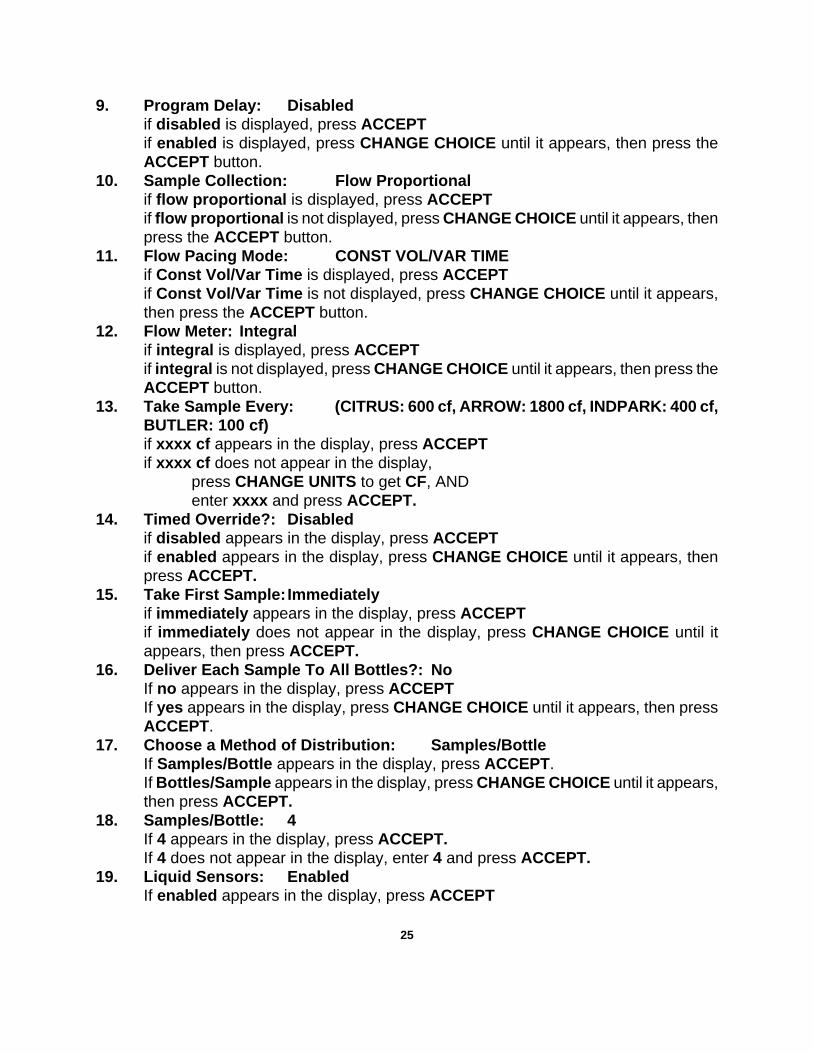
25
9. Program Delay: Disabled if disabled is displayed, press ACCEPT if enabled is displayed, press CHANGE CHOICE until it appears, then press the ACCEPT button.
10. Sample Collection: Flow Proportional if flow proportional is displayed, press ACCEPT if flow proportional is not displayed, press CHANGE CHOICE until it appears, then press the ACCEPT button.
11. Flow Pacing Mode: CONST VOL/VAR TIME if Const Vol/Var Time is displayed, press ACCEPT if Const Vol/Var Time is not displayed, press CHANGE CHOICE until it appears,
then press the ACCEPT button. 12. Flow Meter: Integral
if integral is displayed, press ACCEPT if integral is not displayed, press CHANGE CHOICE until it appears, then press the ACCEPT button.
13. Take Sample Every: (CITRUS: 600 cf, ARROW: 1800 cf, INDPARK: 400 cf, BUTLER: 100 cf) if xxxx cf appears in the display, press ACCEPT if xxxx cf does not appear in the display,
press CHANGE UNITS to get CF, AND enter xxxx and press ACCEPT.
14. Timed Override?: Disabled if disabled appears in the display, press ACCEPT if enabled appears in the display, press CHANGE CHOICE until it appears, then press ACCEPT.
15. Take First Sample: Immediately if immediately appears in the display, press ACCEPT if immediately does not appear in the display, press CHANGE CHOICE until it appears, then press ACCEPT.
16. Deliver Each Sample To All Bottles?: No If no appears in the display, press ACCEPT If yes appears in the display, press CHANGE CHOICE until it appears, then press ACCEPT.
17. Choose a Method of Distribution: Samples/Bottle If Samples/Bottle appears in the display, press ACCEPT. If Bottles/Sample appears in the display, press CHANGE CHOICE until it appears, then press ACCEPT.
18. Samples/Bottle: 4 If 4 appears in the display, press ACCEPT. If 4 does not appear in the display, enter 4 and press ACCEPT.
19. Liquid Sensors: Enabled If enabled appears in the display, press ACCEPT

26
If disabled appears in the display, press CHANGE CHOICE until it appears, then press ACCEPT.
20. Sample Volume: 450 mL If 450 mL appears in the display, press ACCEPT If 450 mL does not appear in the display, enter 450 and press ACCEPT.
21. Intake Rinses: 2 If 2 appears in the display, press ACCEPT If 2 does not appear in the display, enter 2 and press ACCEPT.
22. Sample Retries: 2 If 2 appears in the display, press ACCEPT If 2 does not appear in the display, enter 2 and press ACCEPT.
23. Site ID: 0000xxxx CITRUS 00003001 ARROW 00003002 INDPARK 00003003 BUTLER 00003004
If the correct ID appears in the display, press ACCEPT If the correct ID does not appear in the display, enter xxxx and press ACCEPT.
24. Do You Wish to Access Advanced Sampling Features?: Yes Press the button for YES.
25. Use the DOWN arrow key to go to STORMWATER and press SELECT. 26. Storm Water: Enabled
If Enabled appears in the display, press ACCEPT If Enabled does not appear in the display, press CHANGE CHOICE until it appears, then press ACCEPT.
27. Storm Water Start Condition: Rain and Level If Rain and Level appears in the display, press ACCEPT If Rain and Level does not appear in the display, press CHANGE CHOICE until it appears, then press ACCEPT.
28. Storm Water Rain Trigger: 0.05 inch If 0.05 inch appears in the display, press ACCEPT If 0.05 inch does not appear in the display, enter 0.05 and press ACCEPT.
29. Rainfall Time Interval: 1:00 If 1:00 (hr:min) appears in the display, press ACCEPT If 1:00 (hr:min) does not appear in the display, enter 100 and press ACCEPT.
30. Storm Water Level Trigger: 0.5 inch If 0.5 inch appears in the display, press ACCEPT If 0.5 inch does not appear in the display, enter 0.5 and press ACCEPT.
31. First Flush Number of Bottles: 1 If 1 appears in the display, press ACCEPT If 1 does not appear in the display, enter 1 and press ACCEPT.
32. First Flush: Samples to Collect: 1 If 1 appears in the display, press ACCEPT If 1 does not appear in the display, enter 1 and press ACCEPT.

27
33. First Flush Interval 1: 0:05 (hr:min) If 0:05 (hr:min) appears in the display, press ACCEPT AS FINAL If 0:05 (hr:min) does not appear in the display, enter 005 and press ACCEPT AS FINAL.
34. First Flush Sample Volume: 100 mL If 100 mL appears in the display, press ACCEPT If 100 mL does not appear in the display, enter 100 and press ACCEPT.
35. Program Time Limit: Enabled If Enabled appears in the display, press ACCEPT If Disabled appears in the display, press CHANGE CHOICE until it appears, then press ACCEPT.
36. Storm Water Program Time Limit: 8:00 (SUMMER) 16:00 (WINTER) If 8:00/16:00 (hr:min) appears in the display, press ACCEPT If 8:00/16:00 (hr:min) does not appear in the display, enter 800/1600 and press ACCEPT.
37. Press MAIN MENU button. 38. Press OPTIONS from the main menu. 39. Press ADVANCED OPTIONS. 40. Select ALARMS and press SELECT. 41. Scroll to LOW MAIN BATTERY using the down arrow key, and press SELECT. 42. Low Main Battery Alarm Condition: Enabled
If Enabled appears in the display, press ACCEPT. If Disabled appears in the display, press CHANGE CHOICE until it appears, then
press ACCEPT. 43. Report Via Modem (be sure arrow is on in front of ‘Report via modem’). If arrow is present, press RETURN. If arrow is not present, press SELECT, and then press RETURN. 44. Scroll to MEMORY BATTERY. 45. Memory Battery Alarm Condition: Enabled
If Enabled appears in the display, press ACCEPT. If Disabled appears in the display, press CHANGE CHOICE until it appears, then
press ACCEPT. 46. Report Via Modem (be sure arrow is on in front of ‘Report via modem’). If arrow is present, press RETURN. If arrow is not present, press SELECT, and then press RETURN. 47. Scroll to RAINFALL using the down arrow keys, and press SELECT. 48. Rainfall Alarm Condition: Enabled
If Enabled appears in the display, press ACCEPT If Disabled appears in the display, press CHANGE CHOICE until it appears, then press ACCEPT.
49. Rainfall High Trigger Point: 0.05 inch If 0.05 inch appears in the display, press ACCEPT If 0.05 inch does not appear in the display, enter 0.05 and press ACCEPT.
50. Rainfall Time Interval: 1:00 (hr:min)

28
If 1:00 (hr:min) appears in the display, press ACCEPT If 1:00 (hr:min) does not appear in the display, enter 100 and press ACCEPT.
51. Report Via Modem (be sure arrow is on in front of ‘Report via modem’). If arrow is present, press RETURN. If arrow is not present, press SELECT, and then press RETURN. 52. Press RETURN 53. Scroll to CALIBRATION if PT is to be calibrated. 54. Scroll to COMMUNICATION SETUP and press SELECT. 55. Scroll to MODEM SETUP and press SELECT. 56. Modem Power: Enabled
If Enabled appears in the display, press ACCEPT If Disabled appears in the display, press CHANGE CHOICE until it appears and then press ACCEPT.
57. Dial Method: Tone If Tone appears in the display, press ACCEPT If Pulse appears in the display, press CHANGE CHOICE until it appears, then press ACCEPT.
58. Phone Number: 602-415-1084 If 6024151084 appears in the display, press ACCEPT
If 6024151084 does not appear in the display, enter 4151084 and press ACCEPT. 59. Cellular Modem Scheduling: Disabled If Disabled appears in the display, press ACCEPT. If Enabled appears in the display, press CHANGE CHOICE until Disabled appears
in the display, then press ACCEPT. 60. Pager Option: Enabled If Enabled appears in the display, press ACCEPT. If Disabled appears in the display, press CHANGE CHOICE until Disabled appears
in the display, then press ACCEPT. 61. Pager Service Phone Number: 602-253-4297 If 6022534297 appears in the display, press ACCEPT. If not, enter 6022534297, and press ACCEPT. 62. Number of Pagers: 2 Enter 2 in the display. 63. Pager #1 Phone Number: Enter 6022270687 64. Pager #2 Phone Number: Enter 6022275191 65. Reporting Order: Pager Only If Pager Only is in the display, press ACCEPT. If Pager Only is not in the display, press CHANGE CHOICE until Pager Only
appears in the display, then press ACCEPT. 66. Scroll to RS-232 setup and press SELECT. 67. RS-232 Baud Rate: 9600
If 9600 appears in the display, press SELECT

29
If 9600 does not appear in the display, enter 9600 and press ACCEPT. 68. Press RETURN 69. Scroll to DATA LOG and press SELECT. 70. Scroll to SELECT INPUTS and press SELECT. 71. Scroll to RAINFALL and press SELECT. 72. Rainfall Input Data: Logged
If Logged appears in the display, press SELECT If Logged does not appear in the display, press CHANGE CHOICE until it appears, then press ACCEPT.
73. Rainfall Logging Interval: 1 min If 1 min appears in the display, press ACCEPT If 1 min does not appear in the display, enter 1 and press CHANGE CHOICE until minutes appears in the display, then press ACCEPT.
74. Scroll to LEVEL/FLOW and press SELECT. 75. Level/Flow Input Data: Logged
If Logged appears in the display, press SELECT If Logged does not appear in the display, press CHANGE CHOICE until it appears, then press ACCEPT.
76. Level/Flow Logging Interval: 1 min If 1 min appears in the display, press ACCEPT If 1 min does not appear in the display, enter 1 and press CHANGE CHOICE until minutes appears in the display, then press ACCEPT.
77. Velocity Input Data: Logged If Logged appears in the display, press SELECT If Logged does not appear in the display, press CHANGE CHOICE until it appears, then press ACCEPT.
78. Velocity Logging Interval: 1 min If 1 min appears in the display, press ACCEPT
If 1 min does not appear in the display, enter 1 and press CHANGE CHOICE until minutes appears in the display, then press ACCEPT.
79. Press RETURN. 80. Scroll to EXTENDED POWER MODE and press SELECT. 81. Extended Power Mode: Disabled
If Disabled appears in the display, press ACCEPT If Enabled appears in the display, press CHANGE CHOICE until it appears, then press ACCEPT.
82. Press RETURN. 83. Scroll to SET MEMORY MODE and press SELECT. 84. Memory Mode: Wrap
If Wrap appears in the display, press ACCEPT If Wrap does not appear in the display, press CHANGE CHOICE until it appears then press ACCEPT.
85. Press RETURN. 86. Scroll to FLOW METER SETUP and press SELECT.

30
87. Flow Units: cfs If cfs appears in the display, press ACCEPT If cfs does not appear in the display, press CHANGE CHOICE until it appears then press ACCEPT.
88. Level Units: in If in appears in the display, press ACCEPT If in does not appear in the display, press CHANGE CHOICE until it appears then press ACCEPT.
89. Primary Device: Area Velocity (For BUTLER choose HEAD vs FLOW) If Area Velocity appears in the display, press ACCEPT If Area Velocity does not appear in the display, press CHANGE CHOICE until it appears then press ACCEPT.
90. Calculations based on: Geometry If Geometry appears in the display, press ACCEPT If Geometry does not appear in the display, press CHANGE CHOICE until is
appears then press ACCEPT. 91. Shape: Circular Pipe
If Circular Pipe appears in the display, press ACCEPT If Circular Pipe does not appear in the display, press CHANGE CHOICE until it appears then press ACCEPT.
92. Pipe Diameter: CITRUS 42-inch ARROW 96-inch INDPARK 54-inch
If the value in the display is correct, press ACCEPT If the value in the display is incorrect, enter the correct value and press SELECT.
93. FOR BUTLER SITE Use Lookup Table 1 94. Pipe/Channel Slope:
CITRUS 0.0046 ARROW 0.0010 INDPARK 0.0033
If the value in the display is correct, press ACCEPT If the value in the display is incorrect, enter the correct value (0.0009, 0.0023, etc.), and press ACCEPT.
95. Pipe Roughness: CITRUS: 0.018, ARROW: 0.020, INDPARK: 0.018, BUTLER: 0.015 If xxxx appears in the display, press SELECT If xxxx does not appear in the display, enter xxxx and press ACCEPT.
96. Total Flow Units: cf If cf appears in the display, press SELECT If cf does not appear in the display, press CHANGE CHOICE until it appears and press ACCEPT.
97. Press RETURN.

31
98. Scroll to FLOW TOTALIZER, and press SELECT. 99. Scroll to MODIFY SETUP, and press SELECT. 100. Totalizer Scaling: x 1
If x 1 appears in the display, press ACCEPT If x 1 does not appear in the display, press CHANGE CHOICE until it appears, and then press ACCEPT.
101. Total Flow Units: cf If cf appears in the display, press ACCEPT If cf does not appear in the display, press CHANGE CHOICE until it appears, and then press ACCEPT.
102. Press RETURN. 103. Press RETURN. 104. Press MAIN MENU. 105. Ready to Start, press RUN/STOP to begin sampling.


