Table of Contents - · PDF fileTable of Contents . Letter to Shareholders ... Our Mountain...
87
Table of Contents Letter to Shareholders Form 10-K Part I Item 1. Business. Item 1A. Risk Factors Item 1B. Unresolved Staff Comments Item 2. Properties Item 3. Legal Proceedings Item 4. [RESERVED] Item 4A. Executive Officers and Key Employees of the Registrant Part II Item 5. Market for Registrant’s Common Equity, Related Stockholder Matters and Issuer Purchases of Equity Securities Item 6. Selected Financial Data Item 7. Management’s Discussion and Analysis of Financial Condition and Results of Operations Item 7A. Quantitative and Qualitative Disclosures about Market Risk Item 8. Financial Statements and Supplementary Data Item 9. Changes in and Disagreements with Accountants on Accounting and Financial Disclosure Item 9A. Controls and Procedures Item 9B. Other Information Part III Item 10. Directors, Executive Officers and Corporate Governance Item 11. Executive Compensation Item 12. Security Ownership of Certain Beneficial Owners and Management and Related Stockholder Matters Item 13. Certain Relationships and Related Transactions, and Director Independence Item 14. Principal Accounting Fees and Services Part IV Item 15. Exhibits and Financial Statement Schedules Signatures
Transcript of Table of Contents - · PDF fileTable of Contents . Letter to Shareholders ... Our Mountain...
Table of Contents Letter to Shareholders
Form 10-K
Part I
Item 1. Business.
Item 1A. Risk Factors
Item 1B. Unresolved Staff Comments
Item 2. Properties
Item 3. Legal Proceedings
Item 4. [RESERVED]
Item 4A. Executive Officers and Key Employees of the Registrant
Part II
Item 5. Market for Registrant’s Common Equity, Related Stockholder Matters and Issuer Purchases of Equity Securities
Item 6. Selected Financial Data
Item 7. Management’s Discussion and Analysis of Financial Condition and Results of Operations
Item 7A. Quantitative and Qualitative Disclosures about Market Risk
Item 8. Financial Statements and Supplementary Data
Item 9. Changes in and Disagreements with Accountants on Accounting and Financial Disclosure
Item 9A. Controls and Procedures
Item 9B. Other Information
Part III
Item 10. Directors, Executive Officers and Corporate Governance
Item 11. Executive Compensation
Item 12. Security Ownership of Certain Beneficial Owners and Management and Related Stockholder Matters
Item 13. Certain Relationships and Related Transactions, and Director Independence
Item 14. Principal Accounting Fees and Services
Part IV
Item 15. Exhibits and Financial Statement Schedules
Signatures

2010ANNUAL REPORTTO SHAREHOLDERS
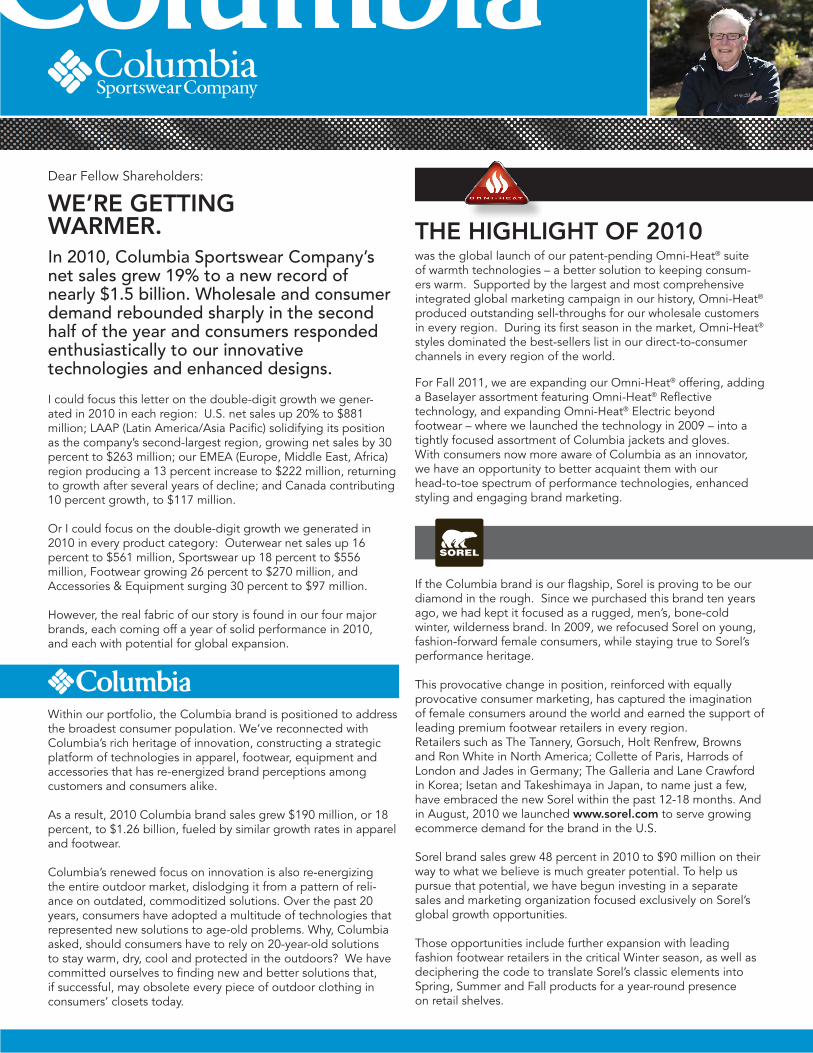
In 2010, Columbia Sportswear Company’s net sales grew 19% to a new record of nearly $1.5 billion. Wholesale and consumer demand rebounded sharply in the second half of the year and consumers responded enthusiastically to our innovative technologies and enhanced designs. I could focus this letter on the double-digit growth we gener-ated in 2010 in each region: U.S. net sales up 20% to $881 million; LAAP (Latin America/Asia Pacific) solidifying its position as the company’s second-largest region, growing net sales by 30 percent to $263 million; our EMEA (Europe, Middle East, Africa) region producing a 13 percent increase to $222 million, returning to growth after several years of decline; and Canada contributing 10 percent growth, to $117 million.
Or I could focus on the double-digit growth we generated in 2010 in every product category: Outerwear net sales up 16 percent to $561 million, Sportswear up 18 percent to $556 million, Footwear growing 26 percent to $270 million, and Accessories & Equipment surging 30 percent to $97 million.
However, the real fabric of our story is found in our four major brands, each coming off a year of solid performance in 2010, and each with potential for global expansion.
Dear Fellow Shareholders:
WE’RE GETTING WARMER. THE HIGHLIGHT OF 2010
Within our portfolio, the Columbia brand is positioned to address the broadest consumer population. We’ve reconnected with Columbia’s rich heritage of innovation, constructing a strategic platform of technologies in apparel, footwear, equipment and accessories that has re-energized brand perceptions among customers and consumers alike.
As a result, 2010 Columbia brand sales grew $190 million, or 18 percent, to $1.26 billion, fueled by similar growth rates in apparel and footwear.
Columbia’s renewed focus on innovation is also re-energizing the entire outdoor market, dislodging it from a pattern of reli-ance on outdated, commoditized solutions. Over the past 20 years, consumers have adopted a multitude of technologies that represented new solutions to age-old problems. Why, Columbia asked, should consumers have to rely on 20-year-old solutions to stay warm, dry, cool and protected in the outdoors? We have committed ourselves to finding new and better solutions that, if successful, may obsolete every piece of outdoor clothing in consumers’ closets today.
If the Columbia brand is our flagship, Sorel is proving to be our diamond in the rough. Since we purchased this brand ten years ago, we had kept it focused as a rugged, men’s, bone-cold winter, wilderness brand. In 2009, we refocused Sorel on young, fashion-forward female consumers, while staying true to Sorel’s performance heritage. This provocative change in position, reinforced with equally provocative consumer marketing, has captured the imagination of female consumers around the world and earned the support of leading premium footwear retailers in every region. Retailers such as The Tannery, Gorsuch, Holt Renfrew, Browns and Ron White in North America; Collette of Paris, Harrods of London and Jades in Germany; The Galleria and Lane Crawford in Korea; Isetan and Takeshimaya in Japan, to name just a few, have embraced the new Sorel within the past 12-18 months. And in August, 2010 we launched www.sorel.com to serve growing ecommerce demand for the brand in the U.S.
Sorel brand sales grew 48 percent in 2010 to $90 million on their way to what we believe is much greater potential. To help us pursue that potential, we have begun investing in a separate sales and marketing organization focused exclusively on Sorel’s global growth opportunities. Those opportunities include further expansion with leading fashion footwear retailers in the critical Winter season, as well as deciphering the code to translate Sorel’s classic elements into Spring, Summer and Fall products for a year-round presence on retail shelves.
was the global launch of our patent-pending Omni-Heat® suite of warmth technologies – a better solution to keeping consum-ers warm. Supported by the largest and most comprehensive integrated global marketing campaign in our history, Omni-Heat® produced outstanding sell-throughs for our wholesale customers in every region. During its first season in the market, Omni-Heat® styles dominated the best-sellers list in our direct-to-consumer channels in every region of the world. For Fall 2011, we are expanding our Omni-Heat® offering, adding a Baselayer assortment featuring Omni-Heat® Reflective technology, and expanding Omni-Heat® Electric beyond footwear – where we launched the technology in 2009 – into a tightly focused assortment of Columbia jackets and gloves.With consumers now more aware of Columbia as an innovator, we have an opportunity to better acquaint them with our head-to-toe spectrum of performance technologies, enhanced styling and engaging brand marketing.
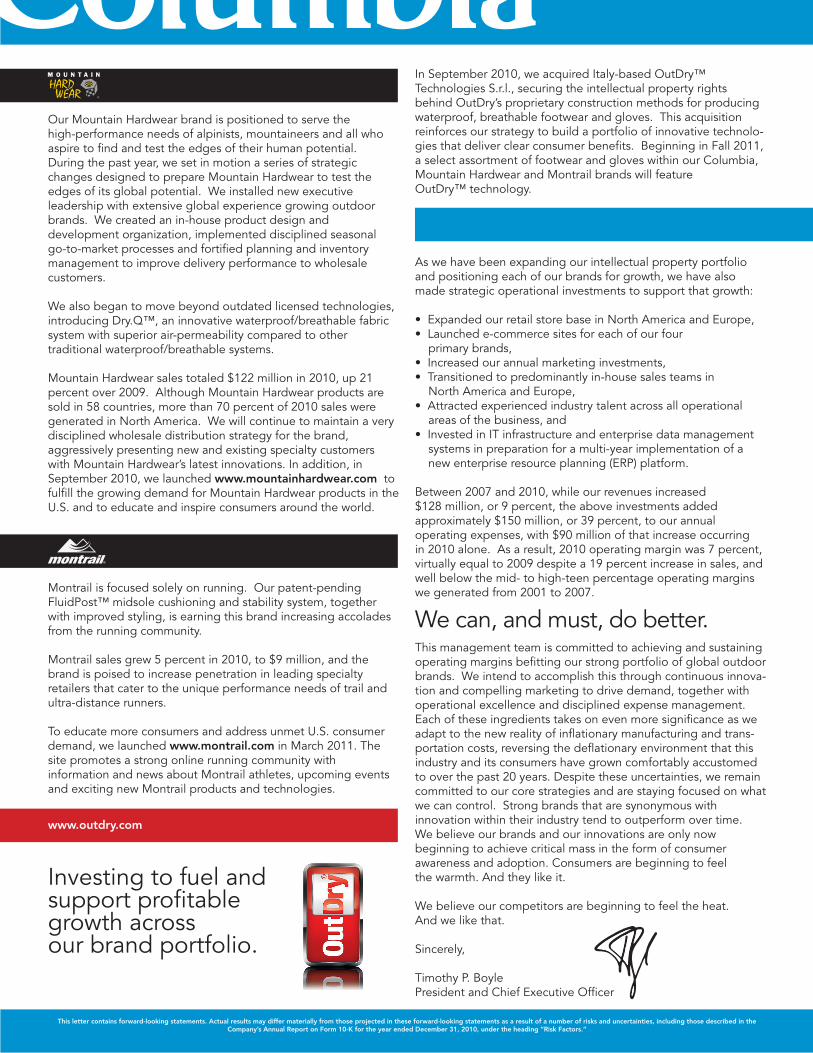
Our Mountain Hardwear brand is positioned to serve the high-performance needs of alpinists, mountaineers and all who aspire to find and test the edges of their human potential. During the past year, we set in motion a series of strategic changes designed to prepare Mountain Hardwear to test the edges of its global potential. We installed new executive leadership with extensive global experience growing outdoor brands. We created an in-house product design and development organization, implemented disciplined seasonal go-to-market processes and fortified planning and inventory management to improve delivery performance to wholesale customers. We also began to move beyond outdated licensed technologies, introducing Dry.Q™, an innovative waterproof/breathable fabric system with superior air-permeability compared to other traditional waterproof/breathable systems.
Mountain Hardwear sales totaled $122 million in 2010, up 21 percent over 2009. Although Mountain Hardwear products are sold in 58 countries, more than 70 percent of 2010 sales were generated in North America. We will continue to maintain a very disciplined wholesale distribution strategy for the brand, aggressively presenting new and existing specialty customers with Mountain Hardwear’s latest innovations. In addition, in September 2010, we launched www.mountainhardwear.com to fulfill the growing demand for Mountain Hardwear products in the U.S. and to educate and inspire consumers around the world.
In September 2010, we acquired Italy-based OutDry™ Technologies S.r.l., securing the intellectual property rights behind OutDry’s proprietary construction methods for producing waterproof, breathable footwear and gloves. This acquisition reinforces our strategy to build a portfolio of innovative technolo-gies that deliver clear consumer benefits. Beginning in Fall 2011, a select assortment of footwear and gloves within our Columbia, Mountain Hardwear and Montrail brands will feature OutDry™ technology.
Investing to fuel and support profitable growth across our brand portfolio.
d www.outdry.com i
Montrail is focused solely on running. Our patent-pending FluidPost™ midsole cushioning and stability system, together with improved styling, is earning this brand increasing accolades from the running community. Montrail sales grew 5 percent in 2010, to $9 million, and the brand is poised to increase penetration in leading specialty retailers that cater to the unique performance needs of trail and ultra-distance runners. To educate more consumers and address unmet U.S. consumer demand, we launched www.montrail.com in March 2011. The site promotes a strong online running community with information and news about Montrail athletes, upcoming events and exciting new Montrail products and technologies.
This letter contains forward-looking statements. Actual results may differ materially from those projected in these forward-looking statements as a result of a number of risks and uncertainties, including those described in the Company’s Annual Report on Form 10-K for the year ended December 31, 2010, under the heading “Risk Factors.”
As we have been expanding our intellectual property portfolio and positioning each of our brands for growth, we have also made strategic operational investments to support that growth:
• Expanded our retail store base in North America and Europe, • Launched e-commerce sites for each of our four primary brands,• Increased our annual marketing investments,• Transitioned to predominantly in-house sales teams in North America and Europe,• Attracted experienced industry talent across all operational areas of the business, and• Invested in IT infrastructure and enterprise data management systems in preparation for a multi-year implementation of a new enterprise resource planning (ERP) platform.
Between 2007 and 2010, while our revenues increased $128 million, or 9 percent, the above investments added approximately $150 million, or 39 percent, to our annual operating expenses, with $90 million of that increase occurring in 2010 alone. As a result, 2010 operating margin was 7 percent, virtually equal to 2009 despite a 19 percent increase in sales, and well below the mid- to high-teen percentage operating margins we generated from 2001 to 2007.
We can, and must, do better.This management team is committed to achieving and sustaining operating margins befitting our strong portfolio of global outdoor brands. We intend to accomplish this through continuous innova-tion and compelling marketing to drive demand, together with operational excellence and disciplined expense management. Each of these ingredients takes on even more significance as we adapt to the new reality of inflationary manufacturing and trans-portation costs, reversing the deflationary environment that this industry and its consumers have grown comfortably accustomed to over the past 20 years. Despite these uncertainties, we remain committed to our core strategies and are staying focused on what we can control. Strong brands that are synonymous with innovation within their industry tend to outperform over time. We believe our brands and our innovations are only now beginning to achieve critical mass in the form of consumer awareness and adoption. Consumers are beginning to feel the warmth. And they like it.
We believe our competitors are beginning to feel the heat.And we like that.
Sincerely, Timothy P. BoylePresident and Chief Executive Officer

2010 Annual Report to Shareholders

UNITED STATESSECURITIES AND EXCHANGE COMMISSION
Washington, DC 20549
FORM 10-KÈ ANNUAL REPORT PURSUANT TO SECTION 13 OR 15(d) OF THE
SECURITIES EXCHANGE ACT OF 1934For the fiscal year ended December 31, 2010
OR‘ TRANSITION REPORT PURSUANT TO SECTION 13 OR 15(d) OF THE
EXCHANGE ACT OF 1934For the transition period from to
Commission File Number 0-23939
COLUMBIA SPORTSWEAR COMPANY(Exact name of registrant as specified in its charter)
Oregon 93-0498284(State or other jurisdiction of
incorporation or organization)(IRS Employer
Identification Number)
14375 NW Science Park Drive Portland, Oregon 97229(Address of principal executive offices) (Zip Code)
(503) 985-4000(Registrant’s telephone number, including area code)
Securities registered pursuant to Section 12(b) of the Act:Title of each class Name of each exchange on which registered
Common Stock The NASDAQ Stock Market LLCSecurities registered pursuant to Section 12(g) of the Act: None
Indicate by check mark if the registrant is a well-known seasoned issuer, as defined in Rule 405 of theSecurities Act. Yes ‘ No È
Indicate by check mark if the registrant is not required to file reports pursuant to Section 13 or Section 15(d)of the Act. Yes ‘ No È
Indicate by check mark whether the registrant (1) has filed all reports required to be filed by Section 13 or15(d) of the Securities Exchange Act of 1934 during the preceding 12 months (or for such shorter period that theregistrant was required to file such reports), and (2) has been subject to such filing requirements for the past90 days. Yes È No ‘
Indicate by check mark whether the registrant has submitted electronically and posted on its corporate website, if any, every Interactive Data File required to be submitted and posted pursuant to Rule 405 of RegulationS-T during the preceding 12 months (or for such short period that the registrant was required to submit and postsuch files). Yes ‘ No ‘
Indicate by check mark if disclosure of delinquent filers pursuant to Item 405 of Regulation S-K is notcontained herein, and will not be contained, to the best of registrant’s knowledge, in definitive proxy orinformation statements incorporated by reference in Part III of this Form 10-K or any amendment to thisForm 10-K. È
Indicate by check mark whether the registrant is a large accelerated filer, an accelerated filer, anon-accelerated filer, or a smaller reporting company. See the definitions of “large accelerated filer,”“accelerated filer” and “smaller reporting company” in Rule 12b-2 of the Exchange Act.
Large accelerated filer ‘ Accelerated filer ÈNon-accelerated filer ‘ (Do not check if a smaller reporting company) Smaller reporting company ‘
Indicate by check mark whether the registrant is a shell company (as defined in Rule 12b-2 of the ExchangeAct). Yes ‘ No È
The aggregate market value of the voting common stock held by non-affiliates of the registrant as ofJune 30, 2010, the last business day of the registrant’s most recently completed second fiscal quarter, was$540,147,000 based on the last reported sale price of the Company’s Common Stock as reported by theNASDAQ Global Select Market System on that day.
The number of shares of Common Stock outstanding on February 25, 2011 was 33,827,350.Part III is incorporated by reference from the registrant’s proxy statement for its 2011 annual meeting of
shareholders to be filed with the Commission within 120 days of December 31, 2010.

COLUMBIA SPORTSWEAR COMPANY
DECEMBER 31, 2010
TABLE OF CONTENTS
Item Page
PART I
Item 1. Business . . . . . . . . . . . . . . . . . . . . . . . . . . . . . . . . . . . . . . . . . . . . . . . . . . . . . . . . . . . . . . . . . . . . . 2Item 1A. Risk Factors . . . . . . . . . . . . . . . . . . . . . . . . . . . . . . . . . . . . . . . . . . . . . . . . . . . . . . . . . . . . . . . . . . 10Item 1B. Unresolved Staff Comments . . . . . . . . . . . . . . . . . . . . . . . . . . . . . . . . . . . . . . . . . . . . . . . . . . . . . 20Item 2. Properties . . . . . . . . . . . . . . . . . . . . . . . . . . . . . . . . . . . . . . . . . . . . . . . . . . . . . . . . . . . . . . . . . . . . 20Item 3. Legal Proceedings . . . . . . . . . . . . . . . . . . . . . . . . . . . . . . . . . . . . . . . . . . . . . . . . . . . . . . . . . . . . . 21Item 4. [RESERVED] . . . . . . . . . . . . . . . . . . . . . . . . . . . . . . . . . . . . . . . . . . . . . . . . . . . . . . . . . . . . . . . . . 21Item 4A. Executive Officers and Key Employees of the Registrant . . . . . . . . . . . . . . . . . . . . . . . . . . . . . . . 21
PART II
Item 5. Market for Registrant’s Common Equity, Related Stockholder Matters and Issuer Purchases ofEquity Securities . . . . . . . . . . . . . . . . . . . . . . . . . . . . . . . . . . . . . . . . . . . . . . . . . . . . . . . . . . . . . 24
Item 6. Selected Financial Data . . . . . . . . . . . . . . . . . . . . . . . . . . . . . . . . . . . . . . . . . . . . . . . . . . . . . . . . . 26Item 7. Management’s Discussion and Analysis of Financial Condition and Results of Operations . . . . 27Item 7A. Quantitative and Qualitative Disclosures about Market Risk . . . . . . . . . . . . . . . . . . . . . . . . . . . . 41Item 8. Financial Statements and Supplementary Data . . . . . . . . . . . . . . . . . . . . . . . . . . . . . . . . . . . . . . . 41Item 9. Changes in and Disagreements with Accountants on Accounting and Financial Disclosure . . . . 73Item 9A. Controls and Procedures . . . . . . . . . . . . . . . . . . . . . . . . . . . . . . . . . . . . . . . . . . . . . . . . . . . . . . . . . 73Item 9B. Other Information . . . . . . . . . . . . . . . . . . . . . . . . . . . . . . . . . . . . . . . . . . . . . . . . . . . . . . . . . . . . . . 75
PART III
Item 10. Directors, Executive Officers and Corporate Governance . . . . . . . . . . . . . . . . . . . . . . . . . . . . . . . 76Item 11. Executive Compensation . . . . . . . . . . . . . . . . . . . . . . . . . . . . . . . . . . . . . . . . . . . . . . . . . . . . . . . . 76Item 12. Security Ownership of Certain Beneficial Owners and Management and Related Stockholder
Matters . . . . . . . . . . . . . . . . . . . . . . . . . . . . . . . . . . . . . . . . . . . . . . . . . . . . . . . . . . . . . . . . . . . . 76Item 13. Certain Relationships and Related Transactions, and Director Independence . . . . . . . . . . . . . . . . 77Item 14. Principal Accountant Fees and Services . . . . . . . . . . . . . . . . . . . . . . . . . . . . . . . . . . . . . . . . . . . . 77
PART IV
Item 15. Exhibits and Financial Statement Schedule . . . . . . . . . . . . . . . . . . . . . . . . . . . . . . . . . . . . . . . . . . 78Signatures . . . . . . . . . . . . . . . . . . . . . . . . . . . . . . . . . . . . . . . . . . . . . . . . . . . . . . . . . . . . . . . . . . . . . . . . . . . . . 79
PART I
Item 1. BUSINESS
General
Founded in 1938 in Portland, Oregon, as a small, family-owned, regional hat distributor and incorporated in1961, Columbia Sportswear Company has grown to become a global leader in the design, sourcing, marketingand distribution of active outdoor apparel, footwear, accessories and equipment. Unless the context indicatesotherwise, the terms “we”, “us”, “our”, “the Company” and “Columbia” refer to Columbia Sportswear Companyand its consolidated subsidiaries.
We design, develop, market and distribute active outdoor apparel, footwear, accessories and equipmentunder four primary brands: Columbia®, Mountain Hardwear®, Sorel® and Montrail®. As one of the largestoutdoor apparel and footwear companies in the world, our products have earned an international reputation forinnovation, quality and performance. Our products feature innovative technologies and designs that protectoutdoor enthusiasts from the elements, increase comfort and make outdoor activities more enjoyable. Our brandscomplement each other to address the diverse outdoor performance needs of a wide variety of outdoor consumersegments.
Our brands are distributed through a mix of wholesale distribution channels, independent distributors, ourown direct-to-consumer channels (retail stores and e-commerce) and licensees. In 2010, our products were soldin over 100 countries. We employ creative marketing strategies designed to increase demand and reinforceconsumer awareness of our brands. All of our products are manufactured by independent factories locatedoutside the United States.
The popularity of outdoor activities, changing design trends and consumer adoption of innovativeperformance technologies affect consumer demand for our products. Therefore, we seek to influence, anticipateand respond to trends and shifts in consumer preferences by adjusting the mix of available product offerings,developing new products with innovative performance features and designs, and by creating persuasive andmemorable marketing communications to drive consumer awareness and demand. Failure to anticipate orrespond to consumer needs and preferences in a timely and adequate manner could have a material adverse effecton our sales and profitability.
Our business is subject to many risks and uncertainties that may have a material adverse effect on ourfinancial condition, results of operations or cash flows. Some of these risks and uncertainties are described belowunder Item 1A, Risk Factors.
Seasonality and Variability of Business
Our business is affected by general seasonal trends common to the outdoor, apparel, footwear, accessoriesand equipment industries and is heavily dependent upon discretionary consumer spending patterns. Our productsare designed to address performance needs of consumers who participate in diverse outdoor activities during thespring/summer and fall/winter seasons. Our annual net sales are weighted more heavily toward the fall/winterseason, while our operating expenses are more equally distributed throughout the year. As a result, the majorityof our operating profits are generated in the second half of the year. Sales and profits tend to be highest in thethird calendar quarter. The expansion of our direct-to-consumer operations beginning in 2008 has increased theproportion of sales and profits that we generate in the fourth calendar quarter.
Results of operations in any period should not be considered indicative of the results to be expected for anyfuture period, particularly in light of persistent volatility in general economic conditions. Sales of our productsare subject to substantial cyclical fluctuation, the effects of unseasonable weather conditions, and the continuedpopularity of outdoor activities as part of an active lifestyle in key markets. The current economic environment in
2

key markets, coupled with challenging supply chain capacity constraints, has reduced the predictability of ourbusiness. In addition, our fourth quarter results are more variable because they rely more heavily on fall weatherpatterns which can stimulate wholesale customer reorders or, conversely, result in cancellations.
For further discussion regarding the effects of the macro-economic environment on our business, see Part II,Item 7, Management’s Discussion and Analysis of Financial Condition and Results of Operations.
Products
We provide high quality apparel, footwear, accessories and equipment for use in a wide range of outdooractivities by men, women and youth, designed to keep the consumer warm or cool, dry and protected. A largepercentage of our products are also worn for casual or leisure purposes. The durability, functionality andaffordability of our products make them ideal for a wide range of outdoor activities. Our products serve a broadrange of consumers including elite mountain climbers, winter outdoor enthusiasts, hunting and fishingenthusiasts, top endurance trail runners, and outdoor-inspired consumers. We also market licensed collegiateapparel and accessories under our Columbia brand.
We develop and manage our merchandise in four principal categories: (1) outerwear, (2) sportswear,(3) footwear and (4) accessories and equipment. The following table presents the net sales and approximatepercentages of net sales attributable to each of our principal product categories for each of the last three yearsended December 31 (dollars in millions):
2010 2009 2008
Net Sales % of Sales Net Sales % of Sales Net Sales % of Sales
Outerwear . . . . . . . . . . . . . . . . . . $ 560.8 37.8% $ 482.5 38.8% $ 491.7 37.3%Sportswear . . . . . . . . . . . . . . . . . 555.8 37.5 472.5 38.0 540.9 41.0Footwear . . . . . . . . . . . . . . . . . . . 270.2 18.2 214.6 17.2 217.2 16.5Accessories and equipment . . . . 96.7 6.5 74.4 6.0 68.0 5.2
Total . . . . . . . . . . . . . . . . . . $1,483.5 100.0% $1,244.0 100.0% $1,317.8 100.0%
Outerwear
We design, develop, market and distribute outerwear products for men, women and youth under ourColumbia and Mountain Hardwear brands. Outerwear is our most established and iconic product category, andincorporates the cumulative design, fabrication, fit and construction technologies that we have pioneered overseveral decades and that we continue to innovate. Our outerwear is designed to protect the wearer from theharsher inclement weather commonly encountered in fall and winter outdoor activities, such as skiing,snowboarding, hiking, hunting, fishing and adventure travel.
Sportswear
We design, develop, market and distribute sportswear products for men, women and youth under our Columbiaand Mountain Hardwear brands. Our sportswear products incorporate various fabrication and constructiontechnologies that protect consumers from the outdoor elements and enable consumers to enjoy the outdoors longerand in greater comfort year round. Our sportswear products are designed to be worn as a layering system with ourouterwear and footwear products during fall and winter outdoor activities, or individually during milder weathercommonly encountered during spring and summer outdoor activities such as hiking, fishing, trail running and watersports. Mountain Hardwear-branded sportswear consists primarily of performance apparel designed formountaineering, backpacking, rock climbing and adventure sports. Our Columbia and Mountain Hardwearsportswear product assortments also include casual styles designed to appeal to a broader consumer base.
3

Footwear
We design, develop, market and distribute footwear products for men and women under our Columbia,Sorel and Montrail brands and for youth under our Columbia and Sorel brands. Our footwear products seek toaddress the needs of outdoor consumers who participate in activities that typically involve challenging or unusualterrain in a variety of weather and trail conditions. Our footwear products include durable, lightweight hikingboots, trail running shoes, rugged cold weather boots for activities on snow and ice, sandals for use inamphibious activities, and casual shoes for everyday use. Our Sorel brand primarily offers premium cold weatherfootwear for men and women with an increasing focus on young, fashion-conscious female consumers.
Accessories and Equipment
We design, develop, market and distribute a line of Columbia-branded accessories and equipment, includingbags, packs, headwear, scarves and gloves. These products incorporate many of our performance technologiesand complement our apparel and footwear collections to protect consumers during a multitude of outdooractivities in virtually any climate. We also design, develop, market and distribute a line of Mountain Hardwearaccessories and equipment that includes technically-advanced tents, sleeping systems, backpacks, headwear andgloves. These products are designed for mountaineering, ultralight backpacking and camping.
Product Design and Innovation
We believe our product innovation efforts are a key factor in our past and future success. We are committedto designing innovative and functional products for consumers who participate in a wide range of competitiveand recreational outdoor activities, enabling them to enjoy those activities longer and in greater comfort bykeeping them warm or cool, dry and protected. We also place significant value on product designs and fit (theoverall appearance and image of our products) that, along with technical performance features, distinguish ourproducts in the marketplace.
Our research and development efforts are led by an internal team of specialists who work closely withindependent suppliers to develop products that provide the unique performance benefits needed by consumersduring outdoor activities. We have established working relationships with specialists in the fields of chemistry,biochemistry, engineering, industrial design, materials research, graphic design, electronics and related fields.We utilize these relationships, along with consumer feedback, to develop and test innovative performanceproducts, processes, packaging and displays. We believe that these efforts, coupled with our technical innovationefforts, represent key factors in the past and future success of our products.
In September 2010, we acquired OutDry Technologies S.r.l., which owns the intellectual property and otherassets comprising the OutDry® brand and related business including patented and patent-pending constructionmethods that bond a waterproof, breathable membrane directly to the inside of the outermost layer of a shoe orglove.
Intellectual Property
We own many trademarks, including Columbia Sportswear Company®, Columbia®, Sorel®, Mountain HardWear®, Montrail®, OutDry®, Pacific Trail®, the Columbia diamond shaped logo, the Mountain Hardwear nutlogo and the Sorel polar bear logo, as well as many other trademarks relating to our brands, products, styles andtechnologies. We believe that our trademarks are an important factor in creating a market for our products, inidentifying the Company, and in differentiating our products from competitors’ products. We have design,process and utility patents as well as pending patent applications in the United States and other nations. We fileapplications for United States and foreign patents for inventions, designs and improvements that we believe havecommercial value; however, these patents may or may not ultimately be issued. We believe our success primarilydepends on our ability to continue offering innovative solutions to consumer needs through design, research,
4
development and production advancements rather than our ability to secure patents. The technologies, processesand designs described in issued patents are incorporated into many of our most important products and expire atvarious times. We vigorously protect these proprietary rights against counterfeit reproductions and otherinfringing activities. Additionally, we license our Columbia trademarks across a range of apparel, footwear,accessories and equipment.
Sales and Distribution
We sell our products through a mix of wholesale distribution channels, independent distributors, our owndirect-to-consumer channels and licensees. The majority of our sales are generated through wholesale channelswhich include small, independently operated specialty outdoor and sporting goods stores, regional, national andinternational sporting goods chains, and large regional, national and international department store chains. Wesell our products to independent distributors in various countries where we generally do not have direct salesoperations.
We sell our products directly to consumers through our own network of branded and outlet retail stores ineach of our geographic segments, and online operations in the United States and LAAP segments, with additionale-commerce sites in other geographic markets planned for 2011. Our direct-to-consumer operations are designedto elevate consumer perception of our brands, increase consumer and retailer awareness of and demand for ourproducts, model compelling retail environments for our products and build stronger emotional brand connectionswith consumers over time. Our branded retail stores allow us to showcase a broad selection of products and tosupport the brand’s positioning with fixtures and imagery that may then be replicated and offered for use by ourwholesale customers. These stores provide high visibility for our brands and products and help us to monitor theneeds and preferences of consumers. In addition, we operate outlet stores, which serve an important role in ouroverall inventory management by allowing us to sell a significant portion of excess, discontinued andout-of-season products while maintaining the integrity of our brands. E-commerce sales are a small but growingportion of our total direct-to-consumer sales.
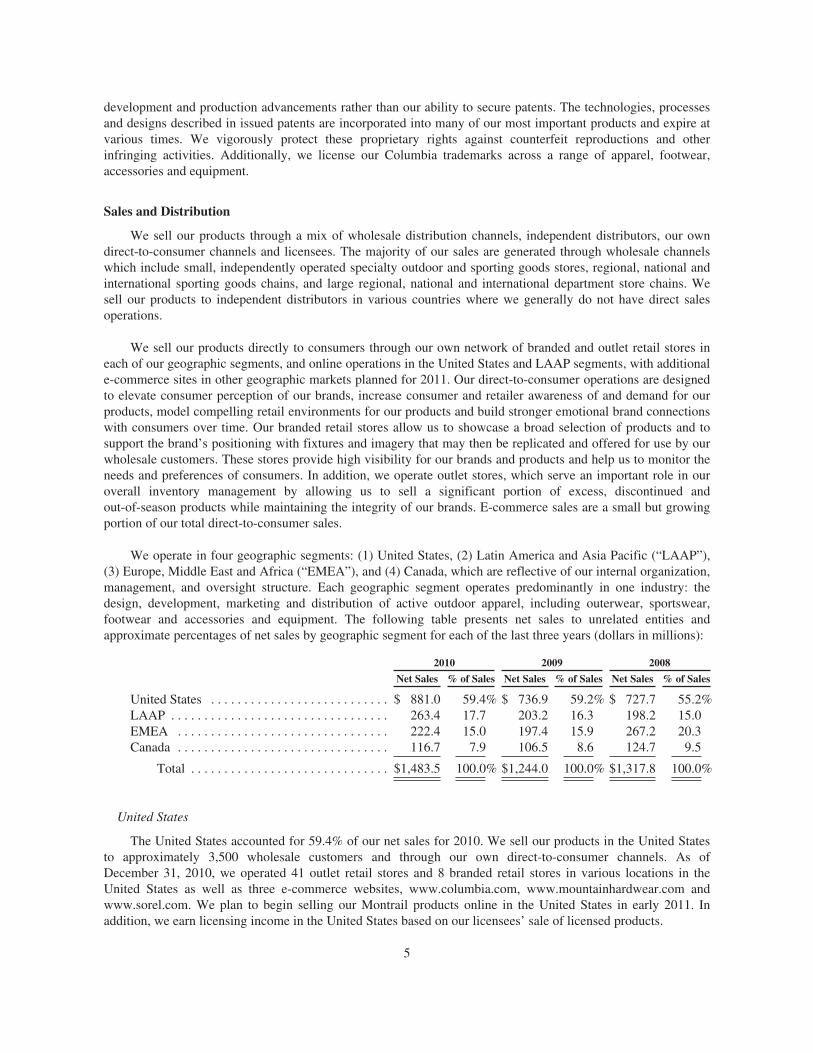
We operate in four geographic segments: (1) United States, (2) Latin America and Asia Pacific (“LAAP”),(3) Europe, Middle East and Africa (“EMEA”), and (4) Canada, which are reflective of our internal organization,management, and oversight structure. Each geographic segment operates predominantly in one industry: thedesign, development, marketing and distribution of active outdoor apparel, including outerwear, sportswear,footwear and accessories and equipment. The following table presents net sales to unrelated entities andapproximate percentages of net sales by geographic segment for each of the last three years (dollars in millions):
2010 2009 2008
Net Sales % of Sales Net Sales % of Sales Net Sales % of Sales
United States . . . . . . . . . . . . . . . . . . . . . . . . . . . $ 881.0 59.4% $ 736.9 59.2% $ 727.7 55.2%LAAP . . . . . . . . . . . . . . . . . . . . . . . . . . . . . . . . . 263.4 17.7 203.2 16.3 198.2 15.0EMEA . . . . . . . . . . . . . . . . . . . . . . . . . . . . . . . . 222.4 15.0 197.4 15.9 267.2 20.3Canada . . . . . . . . . . . . . . . . . . . . . . . . . . . . . . . . 116.7 7.9 106.5 8.6 124.7 9.5
Total . . . . . . . . . . . . . . . . . . . . . . . . . . . . . . $1,483.5 100.0% $1,244.0 100.0% $1,317.8 100.0%
United States
The United States accounted for 59.4% of our net sales for 2010. We sell our products in the United Statesto approximately 3,500 wholesale customers and through our own direct-to-consumer channels. As ofDecember 31, 2010, we operated 41 outlet retail stores and 8 branded retail stores in various locations in theUnited States as well as three e-commerce websites, www.columbia.com, www.mountainhardwear.com andwww.sorel.com. We plan to begin selling our Montrail products online in the United States in early 2011. Inaddition, we earn licensing income in the United States based on our licensees’ sale of licensed products.
5
We distribute the majority of our products sold to United States wholesale customers and our own retailstores from distribution centers that we own and operate in Portland, Oregon and Robards, Kentucky. In someinstances, we arrange to have products shipped from the independent factories that manufacture our productsthrough third party logistics vendors and/or directly to customer-designated facilities in the United States.
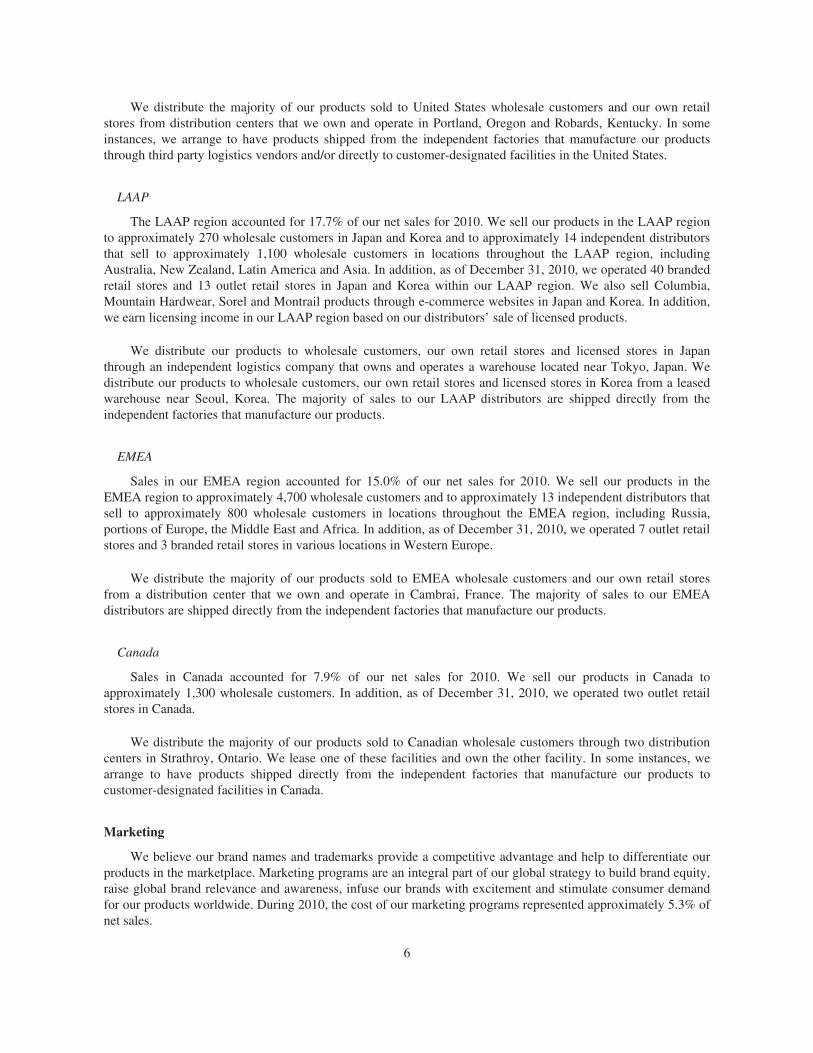
LAAP
The LAAP region accounted for 17.7% of our net sales for 2010. We sell our products in the LAAP regionto approximately 270 wholesale customers in Japan and Korea and to approximately 14 independent distributorsthat sell to approximately 1,100 wholesale customers in locations throughout the LAAP region, includingAustralia, New Zealand, Latin America and Asia. In addition, as of December 31, 2010, we operated 40 brandedretail stores and 13 outlet retail stores in Japan and Korea within our LAAP region. We also sell Columbia,Mountain Hardwear, Sorel and Montrail products through e-commerce websites in Japan and Korea. In addition,we earn licensing income in our LAAP region based on our distributors’ sale of licensed products.
We distribute our products to wholesale customers, our own retail stores and licensed stores in Japanthrough an independent logistics company that owns and operates a warehouse located near Tokyo, Japan. Wedistribute our products to wholesale customers, our own retail stores and licensed stores in Korea from a leasedwarehouse near Seoul, Korea. The majority of sales to our LAAP distributors are shipped directly from theindependent factories that manufacture our products.
EMEA
Sales in our EMEA region accounted for 15.0% of our net sales for 2010. We sell our products in theEMEA region to approximately 4,700 wholesale customers and to approximately 13 independent distributors thatsell to approximately 800 wholesale customers in locations throughout the EMEA region, including Russia,portions of Europe, the Middle East and Africa. In addition, as of December 31, 2010, we operated 7 outlet retailstores and 3 branded retail stores in various locations in Western Europe.
We distribute the majority of our products sold to EMEA wholesale customers and our own retail storesfrom a distribution center that we own and operate in Cambrai, France. The majority of sales to our EMEAdistributors are shipped directly from the independent factories that manufacture our products.
Canada
Sales in Canada accounted for 7.9% of our net sales for 2010. We sell our products in Canada toapproximately 1,300 wholesale customers. In addition, as of December 31, 2010, we operated two outlet retailstores in Canada.
We distribute the majority of our products sold to Canadian wholesale customers through two distributioncenters in Strathroy, Ontario. We lease one of these facilities and own the other facility. In some instances, wearrange to have products shipped directly from the independent factories that manufacture our products tocustomer-designated facilities in Canada.
Marketing
We believe our brand names and trademarks provide a competitive advantage and help to differentiate ourproducts in the marketplace. Marketing programs are an integral part of our global strategy to build brand equity,raise global brand relevance and awareness, infuse our brands with excitement and stimulate consumer demandfor our products worldwide. During 2010, the cost of our marketing programs represented approximately 5.3% ofnet sales.
6

Our integrated marketing efforts are designed to deliver consistent messages about the performance benefits,innovative technologies and styling of our products. We rely most heavily on advertising distributed through theInternet, including e-commerce and social media sites; television and print publications; consumer-focused andcustomer-focused events; branded retail stores in selected high-profile locations; enhanced branded displays andmerchandising techniques executed in stores in partnership with various wholesale customers; and consumer andtrade public relations efforts.
We work closely with our key wholesale customers to reinforce our brand message through cooperativeonline, television, radio and print advertising campaigns, as well as in stores using visual merchandising displaytools dedicated exclusively to selling our merchandise on a year-round basis. We drive alignment throughestablished seasonal initiatives and provide our wholesale customers, regional offices, and internationaldistributors with creative direction and materials to convey consistent messages.
We employ a staff of in-store marketing and merchandising coordinators, who visit our customers’ retaillocations in major cities around the world to ensure that our products are favorably presented. We also reinforceour marketing and product innovation messages through selected sponsorships of key outdoor influencers,organizations and teams who serve as inspirational models of excellence to consumers and also throughsponsorship of selected outdoor events and competitions.
Our global internet marketing sites are used by consumers to research our products’ features and benefits, tointeract with content created to inform and entertain about each brand and its technologies, to be directed tonearby retailers where they can purchase our products, and to directly purchase products for delivery in theUnited States. Other unaffiliated consumer websites provide information about our brands and products and maydirect consumers to our wholesale customers where they can purchase our products.
Working Capital Utilization
We design, develop, market and distribute our products, but do not own or operate manufacturing facilities.As a result, most of our capital is invested in short-term working capital assets, including cash and cashequivalents, short-term investments, accounts receivable from customers, and finished goods inventory. AtDecember 31, 2010, working capital assets accounted for approximately 77% of total assets. As a result, thedegree to which we efficiently utilize our working capital assets can have a significant impact on ourprofitability, cash flows and return on invested capital. The overall goals of our working capital managementefforts are to maintain the minimum level of inventory necessary to deliver goods on time to our customers tosatisfy end consumer demand, and to minimize the cycle time from the purchase of inventory from our suppliersto the collection of accounts receivable balances from our customers.
Demand Planning and Inventory Management
As a branded consumer products company, inventory represents one of the largest and riskiest capitalcommitments in our business model. We design and develop our seasonal product lines 12 to 18 months inadvance of their availability to consumers in retail stores. As a result, our ability to forecast and produce theindividual product styles that match ultimate seasonal wholesale customer and end-consumer demand and todeliver products to our customers in a timely and cost-effective manner can significantly affect our sales, grossmargins and profitability. For this reason, we maintain and continue to make substantial investments ininformation systems, processes and personnel that support our ongoing demand planning efforts. The goals of ourdemand planning efforts are to develop a collaborative forecast that drives the timely purchase of an adequateamount of inventory to satisfy demand, to minimize transportation and expediting costs necessary to deliverproducts to customers by their requested delivery dates, and to minimize excess inventory to avoid liquidatingexcess, end-of-season goods at discounted prices. Failure to achieve our demand planning goals could reduce ourrevenues and/or increase our costs, which would negatively impact our gross margins, profitability and brandstrength.
7

In order to manage inventory risk, we use incentive discounts to encourage our wholesale customers anddistributors to place advance orders at least six months in advance of scheduled delivery. We use those advanceorders, together with forecasted demand from our direct-to-consumer operations, market trends, historical data,customer and sales feedback and other important factors to estimate the volumes of each product to purchasefrom our suppliers around the world. From the time of initial order through production, receipt and delivery, weattempt to manage our inventory to reduce risk.
Our inventory management efforts cannot entirely eliminate inventory risk due to the inherentlyunpredictable nature of consumer demand, the ability of customers to cancel their orders prior to shipment, andother variables that affect our customers’ ability to take delivery of their advance orders when originallyscheduled. To minimize our purchasing costs, the time necessary to fill customer orders and the risk ofnon-delivery, we place a significant amount of orders for our products with independent factories prior toreceiving all of our customers’ orders and we maintain an inventory of select products that we anticipate will bein greater demand. In addition, we build calculated amounts of inventory to support estimated at-once ordersfrom customers and auto-replenishment orders on certain long-lived styles.
Credit and Collection
We extend credit to our customers based on an assessment of each customer’s financial condition, generallywithout requiring collateral. To assist us in scheduling production with our suppliers and delivering seasonalproducts to our customers on time, we offer customers discounts for placing advance orders and extendedpayment terms for taking delivery before peak seasonal shipping periods. These extended payment termsincrease our exposure to the risk of uncollectible receivables. In order to manage the inherent risks of customerreceivables, we maintain and continue to invest in information systems, processes and personnel skilled in creditand collections. In some markets and with some customers we use credit insurance or standby letters of credit tominimize our risk of credit loss.
Sourcing and Manufacturing
We do not own or operate manufacturing facilities and virtually all of our products are manufactured to ourspecifications by independent factories located outside the United States. We generally do not maintain long-term manufacturing commitments. We believe that the use of independent factories enables us to substantiallylimit our capital expenditures and avoid the costs and risks associated with owning and operating largeproduction facilities and managing large labor forces. We also believe that the use of independent factoriesgreatly increases our production capacity, maximizes our flexibility and improves our product pricing. Wemanage our supply chain from a global perspective and adjust as needed to changes in the global productionenvironment, including political risks, factory capacity, import limitations and costs, raw material costs,availability and cost of labor and transportation costs. However, without long-term or reserved commitments,there is no assurance that we will be able to secure adequate or timely production capacity or favorable pricingterms.
Our apparel is manufactured in more than 13 countries with Vietnam and China accounting forapproximately 68% of our 2010 apparel production. Our footwear is manufactured in three countries, with Chinaand Vietnam accounting for approximately 93% of our 2010 footwear production.
Our five largest apparel factory groups accounted for approximately 20% of 2010 global apparel production,with the largest factory group accounting for 7% of 2010 global apparel production. Our five largest footwearfactory groups accounted for approximately 81% of 2010 global footwear production, with the largest factorygroup accounting for 34% of 2010 global footwear production. In addition, a single vendor supplies substantiallyall of the zippers used in our products. These apparel, footwear and zipper suppliers have multiple factorylocations, thus reducing the risk that unfavorable conditions at a single factory or location will have a materialadverse effect on our business.
8

We maintain 13 manufacturing liaison offices in a total of seven Asian countries. We also maintain amanufacturing liaison office in Richmond, California. Personnel in these manufacturing liaison offices are directemployees of Columbia, and are responsible for overseeing production at our independent factories. We believethat having employees physically located in these regions enhances our ability to monitor factories forcompliance with our policies, procedures and standards related to quality, delivery, pricing and labor practices.Our quality assurance process is designed to ensure that our products meet our quality standards. We believe thatour quality assurance process is an important and effective means of maintaining the quality and reputation ofour products. In addition, independent contractors that manufacture products for us are subject to our Standardsof Manufacturing Practices (“SMP”). Columbia manufactures products around the world and values legal, ethicaland fair treatment of people involved in manufacturing our products. Each factory producing products for us ismonitored regularly against these standards. Additional information about SMP and corporate responsibilityprograms may be found at www.columbia.com.
Backlog
We typically receive the majority of our advance orders from our wholesale customers and independentdistributors for the fall and spring seasons by March 31 and September 30, respectively, based upon customerordering deadlines that we establish. As a result, our order backlog at each of March 31 and September 30 hashistorically been a meaningful indicator of anticipated sales to wholesale customers and independent distributorsfor the corresponding future period. Accordingly, we disclose our backlog at March 31 and at September 30 inour Quarterly Reports on Form 10-Q for those respective periods, rather than at December 31. Generally, ordersare subject to cancellation prior to the date of shipment.
Advance orders for our owned retail stores and e-commerce websites are not included in backlog.Accordingly, to the extent that order cancellations from wholesale customers and independent distributorsdeviates from historical averages, and our retail and e-commerce sales grow to represent a larger proportion ofour total sales, our advance order backlog may become less indicative of anticipated sales for correspondingfuture periods.
Competition
The markets for outerwear, sportswear, footwear, accessories and equipment are highly competitive. In eachof our geographic markets, we face significant competition from numerous and varying competitors. Some of ourlarge wholesale customers also market competitive apparel, footwear, accessories and equipment under their ownprivate labels. Our licensees operate in very competitive markets, such as those for apparel, footwear, sunglassesand watches. In addition, our direct-to-consumer channels expose us to competitors who operate retail stores inoutlet malls and key metropolitan markets, as well as competitors who sell product online. We believe that theprimary competitive factors in the market for active outerwear, sportswear, footwear, accessories and equipmentare brand strength, product innovation, product design, functionality, durability and price.
Government Regulation
Many of our international shipments are subject to existing or potential governmental tariff and non-tariffbarriers to trade, such as import duties and potential safeguard measures that may limit the quantity of varioustypes of goods that may be imported into the United States and other countries. These trade barriers oftenrepresent a material portion of the cost of the merchandise. Our products are also subject to domestic and foreignproduct safety and environmental standards, laws and other regulations, which are increasingly restrictive andcomplex. Although we diligently monitor these standards and restrictions, the United States or other countriesmay impose new or adjusted quotas, duties, safety requirements, material restrictions, or other restrictions orregulations, any of which could have a material adverse effect on our financial condition, results of operations orcash flows.
9

Employees
At December 31, 2010, we had the following full-time equivalent employees, based in the followingregions:
United States . . . . . . . . . . . . . . . . . . . . . . . . . . . . . . . . . . . . . . . . 2,096Asia . . . . . . . . . . . . . . . . . . . . . . . . . . . . . . . . . . . . . . . . . . . . . . . . 970Europe . . . . . . . . . . . . . . . . . . . . . . . . . . . . . . . . . . . . . . . . . . . . . 397Canada . . . . . . . . . . . . . . . . . . . . . . . . . . . . . . . . . . . . . . . . . . . . . 163
3,626
Available Information
We file with the Securities and Exchange Commission (“SEC”) our annual report on Form 10-K, quarterlyreports on Form 10-Q, current reports on Form 8-K and all amendments to those reports, proxy statements andregistration statements. You may read and copy any material we file with the SEC at the SEC’s Public ReferenceRoom at 100 F Street, NE, Washington, D.C. 20549. You may also obtain information on the operation of thePublic Reference Room by calling the SEC at 1-800-SEC-0330. In addition, the SEC maintains an internet site athttp://www.sec.gov that contains reports, proxy and information statements, and other information regardingissuers, including us, that file electronically. We make available free of charge on or through our website atwww.columbia.com our annual reports on Form 10-K, quarterly reports on Form 10-Q, current reports on Form8-K and amendments to these reports filed or furnished pursuant to Section 13(a) or 15(d) of the Exchange Act assoon as reasonably practicable after we file these materials with the SEC.
Item 1A. RISK FACTORS
In addition to the other information contained in this Form 10-K, the following risk factors should beconsidered carefully in evaluating our business. Our business, financial condition, results of operations or cashflows may be materially adversely affected by any of these risks. Please note that additional risks not presentlyknown to us or that we currently deem immaterial may also impair our business and operations.
Our Success Depends on Our Business Strategies
Our business strategies are to achieve sustainable, profitable growth by creating innovative products,elevating consumer perception of our brands, increasing consumer and retailer awareness and demand for ourproducts, creating compelling retail environments, and building stronger emotional brand connections withconsumers over time. We intend to pursue these strategies across our portfolio of brands, product categories andgeographic markets. We face many challenges in implementing our business strategies. For example, our focuson innovation depends on our ongoing ability to identify, develop or secure rights to product improvements ordevelopments through internal research, joint developments, acquisitions or licenses. However, these innovationsand developments may not be profitable or have the desired effect of increasing demand for our products. Thefailure to implement our business strategies successfully could have a material adverse effect on our financialcondition, results of operations or cash flows.
To implement our business strategies, we must continue to modify various aspects of our business, tomaintain and enhance our information systems and operations to respond to increased demand and to attract,retain and manage qualified personnel. Changes in our business may place an increasing strain on management,financial, product design, marketing, distribution and other resources, and we may have operating difficulties as aresult. For example, in support of our strategic initiatives, we are making significant investments in our businessprocesses and information technology infrastructure that require significant management attention and corporateresources. In addition, we may need to adapt our information technology systems and business processes to
10
integrate business acquisitions. These business initiatives involve many risks and uncertainties that, if notmanaged effectively, may have a material adverse effect on our financial condition, results of operations or cashflows.
Our business strategies and related increased expenditures could also cause our operating margin to declineif we are unable to offset our increased spending with increased sales or gross margins, or comparable reductionsin other operating costs. If our sales or gross margins decline or fail to grow as planned and we fail to sufficientlyleverage our operating expenses, our profitability will decline. This could result in a decision to delay, reduce,modify or terminate our strategic business initiatives, which could have a material adverse effect on our financialcondition, results of operations or cash flows.
We Depend on Independent Factories
Our products are produced by independent factories worldwide. We do not own or operate any productionfacilities. Although we enter into purchase order commitments with these independent factories each season, wegenerally do not maintain long-term manufacturing commitments with them. Without long-term or reservecommitments, in a capacity-constrained environment, there is no assurance that we will be able to secureadequate or timely production capacity or favorable pricing if growth or product demand differs from ourforecasts. Independent factories may fail to perform as expected or our competitors may obtain productioncapacities that effectively limit or eliminate the availability of these resources to us. If an independentmanufacturer fails to ship orders in a timely manner or to meet our standards or if we are unable to obtainnecessary capacities, we may miss delivery deadlines or incur additional costs, which may result in cancellationof orders, refusal to accept deliveries, a reduction in purchase prices or increased costs, any of which could havea material adverse effect on our financial condition, results of operations or cash flows.
Reliance on independent factories also creates quality control risks. In a capacity-constrained environment,we may need to use sub-contracted manufacturers to fulfill demand and these manufacturers may have lessexperience producing our products or lower overall capabilities, which could result in compromised quality ofour products. A failure in our quality control program may result in diminished product quality, which in turncould result in increased order cancellations and returns, decreased consumer demand for our products, orproduct recalls (or other regulatory actions), any of which could have a material adverse effect on our financialcondition, results of operations or cash flows.
If an independent manufacturer violates labor or other laws, or engages in practices that are not generallyaccepted as ethical in our key markets, we may be subject to production disruptions or significant negativepublicity that could result in long-term damage to our brand images, consumer demand for our products maydecrease, and in some circumstances parties may attempt to assert that we are liable for the independentmanufacturer’s practices, any of which could have a material adverse effect on our financial condition, results ofoperations or cash flows.
We May be Adversely Affected by Volatility in Global Production and Transportation Costs and Capacity
Our product costs are subject to substantial fluctuation based on:
• Availability and quality of raw materials;
• The prices of oil, cotton and other raw materials whose prices are determined by global commoditymarkets and can be very volatile;
• Changes in labor markets and wage rates paid by our independent factory partners, which are oftenmandated by centralized governments in the countries where our products are manufactured,particularly in China and Vietnam;
• Interest rates and currency exchange rates;
11
• Availability of skilled labor and production capacity at independent factories; and
• General economic conditions.
Following a long period of generally stable-to-declining input costs, the apparel and footwear industryappears to be entering what may become a prolonged period of inflationary pressure on some or all of these inputcosts, resulting in increased costs to produce our products.
In addition, since the majority of our products are manufactured outside of our principal sales markets, ourproducts must be transported by third parties over large geographical distances. Shortages in ocean freightcapacity, airfreight capacity and volatile fuel costs can result in rapidly changing transportation costs. Forexample, during 2010, shortages of sourcing and transportation capacity, combined with later-than-optimalproduction of advance orders, caused us to rely more heavily on airfreight to achieve timely delivery to ourcustomers, resulting in significantly higher freight costs. Because we price our products in advance and theexternal cost changes may be difficult to predict, we may not be able to pass all or a portion of such higher costson to our customers or adjust our pricing structure in a timely manner in order to remain competitive, whichcould have a material adverse effect on our financial condition, results of operations or cash flows.
Our Sales and Profitability May be Adversely Affected by Increased Product Costs andReduced Selling Prices
The apparel industry is subject to significant pressures on pricing and input costs caused by many factors,including intense competition, constrained sourcing capacity and related inflationary pressures, consolidation inthe retail industry, pressure from retailers to reduce the costs of products and changes in consumer demand.These factors may cause us to experience increased costs, reduce our sales prices to retailers and consumers orexperience reduced sales in response to increased prices, any of which could cause our operating margin todecline if we are unable to offset these factors with reductions in operating costs and could have a materialadverse effect on our financial condition, results of operations or cash flows.
Attracting superior retail channel partners and improving the sales productivity of our customers eachdepend on various factors, including the strength of our brand names, our ability to design and source innovativeproducts, competitive conditions, the availability of desirable locations and the negotiation of terms withcustomers. Future terms with customers may be less favorable to us than those under which we now operate.Large wholesale customers in particular increasingly seek to transfer various costs of business to their vendors,such as the cost of lost profits from promotional activity and product price markdowns, which could cause ourgross margins to decline if we are unable to offset price reductions with comparable reductions in operatingcosts.
We May be Adversely Affected by Volatile Economic Conditions
We are a consumer products company and are highly dependent on consumer discretionary spendingpatterns and the purchasing patterns of our wholesale customers as they attempt to match their seasonal purchasevolumes to volatile consumer demand. In addition, as we have expanded our base of retail stores, we haveincreased our direct exposure to the risks associated with volatile and unpredictable consumer discretionaryspending patterns. As global economic conditions continue to be volatile or economic uncertainty remains, trendsin consumer discretionary spending also become unpredictable and subject to reductions due to uncertaintiesabout the future and credit constraints. Consumer demand for our products may not reach our sales targets, ormay decline, when there is an economic downturn or economic uncertainty in our key markets, particularlymarkets in North America and our EMEA region. Our sensitivity to economic cycles and any related fluctuationin consumer demand may have a material adverse effect on our financial condition, results of operations or cashflows.
12
We Rely on Our Highly Customized Information Management Systems
Our business is increasingly reliant on information technology. Information systems are used across oursupply chain and retail operations, from design to distribution and sales, and are used as a method ofcommunication among employees, with our subsidiaries and liaison offices overseas and with our customers andretail stores. We also rely on our information systems to allocate resources, manage product data, developdemand and supply plans and forecast operating results. System failures, breaches of confidential information orservice interruptions may occur as the result of a number of factors, including computer viruses, programmingerrors, hacking or other unlawful activities by third parties and disasters, or our failure to properly maintainsystems redundancy or to protect, repair, maintain or upgrade our systems. Any breach or interruption of criticalbusiness information systems could have a material adverse effect on our financial condition, results ofoperations or cash flows.
Our primary enterprise resource planning system is highly customized to our business. As a result, theavailability of internal and external resources with the expertise to maintain our enterprise resource planningsystem is limited. As we implement our direct-to-consumer initiatives and plan for future growth, our customizedenterprise resource planning system may inhibit our ability to operate efficiently, which could have an adverseeffect on our results of operations. For example, our enterprise resource planning system may not be compatiblewith other systems to support desired functionality for our operations.
Initiatives to Upgrade Our Information Technology Infrastructure Involve Many Risks Which CouldResult In, Among Other Things, Business Interruptions and Higher Costs
We regularly implement business process improvement initiatives to optimize our performance. Ourcurrent business process initiatives include, but are not limited to, plans to improve business results throughstandardization of business processes and technology that support our supply chain and go-to-market strategiesthrough implementation of an integrated enterprise resource planning software solution by SAP over the nextfew years. We may experience difficulties when we transition to new or upgraded systems and processes,including loss of data and decreases in productivity as our personnel become familiar with new systems. Inaddition, transitioning to new or upgraded systems will require significant capital investments and personnelresources. Difficulties in implementing new or upgraded information systems or significant system failurescould disrupt our operations and have a material adverse effect on our financial condition, results of operationsor cash flows.
We expect implementation of this new information technology infrastructure to have a pervasive impact onour business processes and information systems across a significant portion of our operations, including ourfinance operations. As a result, we will experience significant changes in our internal controls over financialreporting as our implementation progresses. If we are unable to successfully implement this system, includingharmonizing our systems, data and processes, our ability to process transactions accurately and efficiently maybe affected, and any unsuccessful implementation could have an adverse effect on our capital resources, financialcondition, results of operations and liquidity.
Our Results of Operations Could be Materially Harmed If We Are Unable to Accurately Match SupplyForecast with Consumer Demand for Our Products
Many factors may significantly affect demand for our products, including, among other things, economicconditions, fashion trends, consumer preferences and weather, making it difficult to accurately forecast demandfor our products and our future results of operations. To minimize our purchasing costs, the time necessary to fillcustomer orders and the risk of non-delivery, we place a significant amount of orders for our products withindependent factories prior to receiving all of our customers’ orders, and we maintain an inventory of variousproducts that we anticipate will be in greater demand. In addition, customers are generally allowed to cancelorders prior to shipment with sufficient notice.
13
Factors that could affect our ability to accurately forecast demand for our products include:
• An increase or decrease in consumer demand for our products or for products of our competitors;
• For certain demand and supply planning functions, we rely on manual processes and judgment that aresubject to human error;
• Our failure to accurately forecast customer acceptance of new products;
• New product introductions by competitors;
• Unanticipated changes in general market conditions or other factors, which may result in cancellationsof orders or a reduction or increase in the rate of reorders placed by retailers; and
• Weak economic conditions or consumer confidence, which could reduce demand for discretionaryitems such as our products.
In some cases, our production orders may not match actual demand, which could result in our inability todeliver product in a timely manner, higher transportation costs to expedite delivery and higher inventory levels.During periods of weak economic conditions we may experience a significant increase in the volume of ordercancellations by our customers, including cancellations resulting from the bankruptcy, liquidation or contractionof certain customers’ operations. We may not be able to sell all of the products we have ordered fromindependent factories or that we have in our inventory. Inventory levels in excess of customer demand may resultin inventory write-downs and the sale of excess inventory at discounted prices through discountdirect-to-consumer channels, which could have a material adverse effect on our brand image, financial condition,results of operations or cash flows.
Conversely, if we underestimate demand for our products or if our independent factories are unable tosupply products when we need them, we may experience inventory shortages. Inventory shortages may preventus from fulfilling customer orders, delay shipments to customers, negatively affect customer relationships, resultin increased costs to expedite production and delivery, and diminish our ability to build brand loyalty. Shipmentsdelayed due to limited factory capacity or other factors could result in order cancellations by our customers,which could have a material adverse effect on our financial condition, results of operations or cash flows.
We May be Adversely Affected by Weather Conditions
Our business is adversely affected by unseasonable weather conditions. A significant portion of the sales ofour products is dependent in part on the weather and may decline in years in which weather conditions do notfavor the use of these products. Periods of unseasonably warm weather in the fall or winter or unseasonably coldor wet weather in the spring and summer may have a material adverse effect on our financial condition, results ofoperations or cash flows. Inventory accumulation by our wholesale customers resulting from unseasonableweather in one season may negatively affect orders in future seasons, which may have a material adverse effecton our financial condition, results of operations or cash flows.
Our International Operations Involve Many Risks
We are subject to the risks generally associated with doing business internationally. These risks include theeffects of foreign laws and regulations, changes in consumer preferences, foreign currency fluctuations, politicalunrest, terrorist acts, military operations, disruptions or delays in shipments, disease outbreaks and changes ineconomic conditions in countries in which we manufacture or sell products. These factors, among others, mayaffect our ability to sell products in international markets, our ability to manufacture products or procurematerials, and our cost of doing business. If any of these or other factors make the conduct of business in aparticular country undesirable or impractical, our business may be materially and adversely affected. As weexpand our operations in geographic scope and product categories, we anticipate intellectual property disputes
14

will increase as well, making it more expensive and challenging to establish and protect our intellectual propertyrights and to defend against claims of infringement by others.
As a global company, we determine our income tax liability in various competing tax jurisdictions based ona careful analysis and interpretation of local tax laws and regulations. This analysis requires a significant amountof judgment and estimation and is often based on various assumptions about the future actions of the local taxauthorities. These determinations are the subject of periodic domestic and foreign tax audits. Although we accruefor uncertain tax positions, our accrual may be insufficient to satisfy unfavorable findings, which by their naturecannot be predicted with certainty. Unfavorable audit findings and tax rulings may result in payment of taxes,fines and penalties for prior periods and higher tax rates in future periods, which may have a material adverseeffect on our financial condition, results of operations or cash flows. Changes in tax law or our interpretation oftax laws and the resolution of current and future tax audits could significantly affect the amounts provided forincome taxes in our consolidated financial statements.
Moreover, if we encounter a significant need for liquidity domestically or at a particular location that wecannot fulfill through borrowings, equity offerings or other internal or external sources, we may experienceunfavorable tax and earnings consequences as a result of cash transfers. These adverse consequences wouldoccur, for example, if the transfer of cash into the United States is taxed and no offsetting foreign tax credit isavailable to offset the U.S. tax liability, resulting in lower earnings. Furthermore, we may be prohibited fromtransferring cash from a country such as China. Foreign exchange ceilings imposed by local governments and thesometimes lengthy approval processes that foreign governments require for international cash transfers maydelay our internal cash transfers from time to time.
In addition, many of our imported products are subject to duties, tariffs or other import limitations thataffect the cost and quantity of various types of goods imported into the United States or into our other salesmarkets. Any country in which our products are produced or sold may eliminate, adjust or impose new importlimitations, duties, tariffs, anti-dumping penalties or other charges or restrictions, any of which could have amaterial adverse effect on our financial condition, results of operations or cash flows.
Our Business and Reputation May be Adversely Affected by Actions of Independent Contractors
We contract with many independent contractors outside of the United States to manufacture our products,and we also have license agreements that permit unaffiliated parties to manufacture or contract to manufactureproducts using our trademarks. We impose, and require our licensees to impose, on those contractors Standardsof Manufacturing Practices and other environmental, health and safety standards for the benefit of workers andcompliance with product safety and other laws. However, from time to time contractors may not comply withthese standards or applicable local law, or our licensees may not require their contractors to comply with thesestandards or applicable local law. Significant or continuing noncompliance with these standards and laws by oneor more contractors could harm our reputation and, as a result, could have an adverse effect on our financialcondition, results of operations or cash flows.
We Operate in Very Competitive Markets
The markets for outerwear, sportswear, footwear, accessories and equipment are highly competitive, as arethe markets for our licensed products. In each of our geographic markets, we face significant competition fromglobal and regional branded apparel, footwear, accessories and equipment companies.
Retailers who are our customers often pose our most significant competitive threat by marketing apparel,footwear and equipment under their own private labels. For example, in the United States, several of our largestcustomers have developed significant private label brands during the past decade that compete directly with ourproducts. These retailers have assumed an increasing degree of inventory risk in their private label products and,as a result, may first cancel advance orders with us in order to manage their own inventory levels downwardduring weak economic cycles.
15

We also compete with other companies for the production capacity of independent factories thatmanufacture our products and for import capacity. Many of our competitors are significantly larger than us, havesubstantially greater financial, distribution, marketing and other resources than we have, and have achievedgreater brand strength than we have.
Increased competition may result in reduced access to production capacity, reductions in display areas inretail locations, reductions in sales, or reductions in our profit margins, any of which may have a material adverseeffect on our financial condition, results of operations or cash flows.
We May be Adversely Affected by the Financial Health of our Customers
Sluggish economies and consumer uncertainty regarding future economic prospects in our key markets havehad an adverse effect on the financial health of our customers, some of whom have filed or may file forprotection under bankruptcy laws, which may in turn have a material adverse effect on our results of operationsand financial condition. We extend credit to our customers based on an assessment of the customer’s financialcondition, generally without requiring collateral. To assist in the scheduling of production and the shipping ofseasonal products, we offer customers discounts for placing advance orders and extended payment terms fortaking delivery before the peak shipping season. These extended payment terms increase our exposure to the riskof uncollectible receivables. In addition, we face increased risk of order reduction or cancellation or reducedavailability of credit insurance coverage when dealing with financially ailing retailers or retailers struggling witheconomic uncertainty. Some of our significant wholesale customers have liquidated or reorganized, while othershave had financial difficulties in the past and have recently experienced tightened credit markets and salesdeclines and reduced profitability, which in turn has an adverse effect on our business. We may reduce our levelof business with customers experiencing financial difficulties and may not be able to replace that business withother customers, which could have a material adverse effect on our financial position, results of operations orcash flows.
We May be Adversely Affected by Global Credit Market Conditions
Economic downturns and economic uncertainty generally affect global credit markets. Our vendors,customers and other participants in our supply chain may require access to credit markets in order to dobusiness. Credit market conditions may slow our collection efforts as customers find it more difficult to obtainnecessary financing, leading to higher than normal accounts receivable. This could result in greater expenseassociated with collection efforts and increased bad debt expense. Credit conditions may impair our vendors’ability to finance the purchase of raw materials or general working capital needs to support our productionrequirements, resulting in a delay or non-receipt of inventory shipments during key seasons.
Historically we have limited our reliance on debt to finance our working capital, capital expenditures andinvesting activity requirements. We expect to fund our future capital expenditures with existing cash, expectedoperating cash flows and credit facilities, but if the need arises to finance additional expenditures, we may needto seek additional funding. Our ability to obtain additional financing will depend on many factors, includingprevailing market conditions, our financial condition, and our ability to negotiate favorable terms and conditions.Financing may not be available on terms that are acceptable or favorable to us, if at all.
We May be Adversely Affected by Retailer Consolidation
When our wholesale customers combine their operations through mergers, acquisitions, or othertransactions, their consolidated order volume may decrease while their bargaining power and the competitivethreat they pose by marketing products under their own private labels may increase. Some of our significantcustomers have consolidated their operations in the past, which in turn has had a negative effect on our business.Future retailer consolidations could have a material adverse effect on our financial condition, results ofoperations or cash flows.
16
We Rely on Technical Innovation and Functional Design to Compete in the Market for our Products
Technical innovation and functional design of footwear, apparel, and equipment is essential to distinguishour products in the marketplace and achieve commercial success. Research and development plays a key role intechnical innovation. We rely upon specialists in the fields of chemistry, biochemistry, engineering, industrialdesign, electronics and related fields, guided by consumer feedback, to develop and test innovative performanceproducts. Although we are committed to designing innovative and functional products that deliver relevantperformance benefits to consumers who participate in a wide range of competitive and recreational outdooractivities, if we fail to introduce technical innovation in our products that address consumers’ performanceexpectations, demand for our products could decline.
As we strive to achieve technical innovations, we face a greater risk of inadvertent infringements of thirdparty rights or compliance issues. In addition, technical innovations often involve more complex manufacturingprocesses. More complex manufacturing processes may lead to higher instances of quality issues, and if weexperience problems with the quality of our products, we may incur substantial expense to remedy the problems.Failure to successfully bring to market technical innovations in our product lines could have a material adverseeffect on our financial condition, results of operations or cash flows.
We Face Risks Associated with Consumer Preferences and Fashion Trends
Changes in consumer preferences or consumer interest in outdoor activities may have a material adverseeffect on our business. In addition, changes in fashion trends may have a greater impact than in the past as weexpand our offerings to include more product categories in more geographic areas. We also face risks becauseour business requires us and our customers to anticipate consumer preferences. Our decisions about productdesigns often are made far in advance of consumer acceptance. Although we try to manage our inventory riskthrough early order commitments by retailers, we must generally place a significant portion of our seasonalproduction orders with our independent factories before we have received all of a season’s orders, and ordersmay be cancelled by customers before shipment. If we or our customers fail to anticipate and respond toconsumer preferences, we may have lower sales, excess inventories and lower profit margins, any of which couldhave a material adverse effect on our financial condition, results of operations or cash flows.
Our Success Depends on Our Use and Protection of Intellectual Property Rights
Our registered and common law trademarks and our patented or patent-pending designs and technologieshave significant value and are important to our ability to differentiate our products from our competitors’ and tocreate and sustain demand for our products. We also place significant value on our trade dress, the overallappearance and image of our products. From time to time, we discover products that are counterfeitreproductions of our products or that otherwise infringe on our proprietary rights. Counterfeiting activitiestypically increase as brand recognition increases, especially in markets outside the United States. Increasedinstances of counterfeit manufacture and sales may adversely affect our sales and our brand and result in a shiftof consumer preference away from our products. The actions we take to establish and protect trademarks andother proprietary rights may not be adequate to prevent imitation of our products by others or to prevent othersfrom seeking to block sales of our products as violations of proprietary rights. In markets outside of the UnitedStates, it may be more difficult for us to establish our proprietary rights and to successfully challenge use of thoserights by other parties. We also license our proprietary rights to third parties. Failure to choose appropriatelicensees and licensed product categories may dilute or harm our brand image. In addition to our own intellectualproperty rights, many of the intellectual property rights in the technology, fabrics and processes used tomanufacture our products are generally owned or controlled by our suppliers and are generally not unique to us.In those cases, we may not be able to adequately protect our products or differentiate the performancecharacteristics and fabrications from those of our competitors. Actions or decisions in the management of ourintellectual property portfolio may affect the strength of our brands, which may in turn have a material adverseeffect on our financial condition, results of operations or cash flows.
17

Although we have not been materially inhibited from selling products in connection with patent, trademarkand trade dress disputes, as we focus on innovation in our product lines, extend our brands into new productcategories and expand the geographic scope of our marketing, we may become subject to litigation based onallegations of the infringement of intellectual property rights of third parties, including third party trademark,copyright and patent rights. An increasing number of our products include technologies and/or designs for whichwe have obtained or applied for patent protection. Failure to successfully obtain and maintain patents on theseinnovations could negatively affect our ability to market and sell our products. Future litigation also may benecessary to defend against such claims or to enforce and protect our intellectual property rights. Any intellectualproperty litigation may be costly and may divert management’s attention from the operation of our business.Adverse determinations in any litigation may result in the loss of our proprietary rights, subject us to significantliabilities or require us to seek licenses from third parties, which may not be available on commerciallyreasonable terms, if at all. This may have a material adverse effect on our financial condition, results ofoperations or cash flows.
Our Success Depends on Our Distribution Facilities
Our ability to meet customer expectations, manage inventory, complete sales and achieve objectives foroperating efficiencies depends on the proper operation of our existing distribution facilities, the development orexpansion of additional distribution capabilities and the timely performance of services by third parties, includingthose involved in shipping product to and from our distribution facilities. In the United States, we rely primarilyon our distribution centers in Portland, Oregon and Robards, Kentucky; in Canada, we rely primarily on ourdistribution facilities in Strathroy, Ontario; and in Europe, we rely primarily on our distribution center inCambrai, France.
Our distribution facilities in the United States and France are highly automated, which means that theiroperations are complicated and may be subject to a number of risks related to computer viruses, the properoperation of software and hardware, electronic or power interruptions, and other system failures. Risks associatedwith upgrading or expanding these facilities may significantly disrupt or increase the cost of our operations. Forexample, in addition to supporting our traditional wholesale business, our existing distribution facilities havebeen modified to enable them to also support our new e-commerce sales in the United States. Failure tosuccessfully maintain and update these modifications could disrupt our wholesale and e-commerce shipmentsand may have a material adverse effect on our financial condition, results of operations or cash flows.
Our current distribution facilities are designed to handle significantly greater volumes of product shipmentsthan our business is currently generating, especially our European distribution center in Cambrai, France. Thefixed costs associated with owning, operating and maintaining these large, highly-automated distribution centersduring a period of economic weakness or declining sales could result in lower operating efficiencies and financialdeleverage. This fixed cost structure may make it difficult for us to maintain profitability if sales volumes declinefor an extended period of time and could have a material adverse effect on our financial condition, results ofoperations or cash flows.
Our distribution facilities may also be interrupted by disasters, such as earthquakes (which are known tooccur in the Northwestern United States), tornadoes or fires. We maintain business interruption insurance, but itmay not adequately protect us from the adverse effect that may be caused by significant disruptions in ourdistribution facilities.
We May be Adversely Affected by Currency Exchange Rate Fluctuations
Although the majority of our product purchases are denominated in U.S. dollars, the cost of these productsmay be affected by the relative changes in the value of the local currency of the manufacturer. Price increasescaused by currency exchange rate fluctuations may make our products less competitive or have an adverse effecton our margins. Our international revenues and expenses generally are derived from sales and operations incurrencies other than the U.S. dollar. Because the functional currency of many of our subsidiaries is not the U.S.
18
dollar, we are exposed to potentially material gains or losses from the remeasurement of U.S. dollar monetarytransactions into the respective functional currencies. Currency exchange rate fluctuations may also disrupt thebusiness of the independent factories that produce our products by making their purchases of raw materials moreexpensive and more difficult to finance. As a result, currency fluctuations may have a material adverse effect onour financial condition, results of operations or cash flows.
Our Investments May be Adversely Affected by Market Conditions
Our investment portfolio is subject to a number of risks and uncertainties. Changes in market conditions,such as those that accompany an economic downturn or economic uncertainty, may negatively affect the valueand liquidity of our investment portfolio, perhaps significantly. Our ability to find diversified investments thatare both safe and liquid and that provide a reasonable return may be impaired, resulting in lower interest income,less diversification, longer investment maturities and/or higher other-than-temporary impairments.
We May be Adversely Affected by Labor Disruptions
Our business depends on our ability to source and distribute products in a timely manner. Labor disputes atindependent factories where our goods are produced, shipping ports, transportation carriers, retail stores ordistribution centers create significant risks for our business, particularly if these disputes result in workslowdowns, lockouts, strikes, or other disruptions during our peak manufacturing and importing seasons, andmay have a material adverse effect on our business, potentially resulting in cancelled orders by customers,unanticipated inventory accumulation, and reduced revenues and earnings.
We Depend on Key Suppliers
Some of the materials that we use may be available from only one source or a very limited number ofsources. For example, some specialty fabrics are manufactured to our specification by one source or a fewsources, and a single vendor supplies substantially all of the zippers used in our products. From time to time, wehave difficulty satisfying our raw material and finished goods requirements. Although we believe that we canidentify and qualify additional independent factories to produce these materials as necessary, there are noguarantees that additional independent factories will be available. In addition, depending on the timing, anychanges may result in increased costs or production delays, which may have a material adverse effect on ourfinancial condition, results of operations or cash flows.
We Depend on Key Personnel
Our future success will depend in part on the continued service of key personnel and our ability to attract,retain and develop key managers, designers, sales people and others. We face intense competition for theseindividuals worldwide, and there is a significant concentration of well-funded apparel and footwear competitorsin and around our headquarters in Portland, Oregon. We may not be able to attract qualified new employees orretain existing employees, which may have a material adverse effect on our financial condition, results ofoperations or cash flows.
Our Business Is Affected by Seasonality
Our business is affected by the general seasonal trends common to the outdoor apparel industry. Ourproducts are marketed on a seasonal basis and our product mix is weighted substantially toward the fall season.Our annual net sales are weighted more heavily toward the fall/winter season, while our operating expenses aremore equally distributed throughout the year. As a result, the majority of our operating profits are generated inthe second half of the year. The expansion of our direct-to-consumer operations has had a modest effect on theseasonality of our business, increasing the proportion of sales and profits that we generate in the fourth calendarquarter. This seasonality, along with other factors that are beyond our control and that are discussed elsewhere inthis section, may adversely affect our business and cause our results of operations to fluctuate. Results ofoperations in any period should not be considered indicative of the results to be expected for any future period.
19
Our Products Are Subject to Increasing Product Regulations and We Face Risks of Product Liability andWarranty Claims
Our products are subject to increasingly stringent and complex domestic and foreign product labeling andperformance and safety standards, laws and other regulations. These requirements could result in greater expenseassociated with compliance efforts, and failure to comply with these regulations could result in a delay,non-delivery or mandated recall or destruction of inventory shipments during key seasons or in other financialpenalties. Significant or continuing noncompliance with these standards and laws could harm our reputation and,as a result, could have a material adverse effect on our financial condition, results of operations or cash flows.
Our products are used in outdoor activities, sometimes in severe conditions. Product recalls or productliability claims in the future, resulting from the alleged failure of our products, could have a material adverseeffect on our financial condition, results of operations or cash flows. Some of our products carry warranties fordefects in quality and workmanship. We maintain a warranty reserve for future warranty claims, but the actualcosts of servicing future warranty claims may exceed the reserve, which may also have a material adverse effecton our financial condition, results of operations or cash flows.
Our Common Stock Price May Be Volatile
The price of our common stock has fluctuated substantially since our initial public offering. Our commonstock is traded on the NASDAQ Global Select Market. Factors such as general market conditions, fluctuations infinancial results, variances from financial market expectations, changes in earnings estimates by analysts, orannouncements by us or our competitors may cause the market price of our common stock to fluctuate, perhapssubstantially.
Insiders Control a Majority of Our Common Stock and May Sell Shares
Three related shareholders, Timothy Boyle, Gertrude Boyle and Sarah Bany, beneficially own a majority ofour common stock. As a result, if acting together, they can effectively control matters requiring shareholderapproval without the cooperation of other shareholders. Shares held by these three insiders are available forresale, subject to the requirements of, and the rules under, the Securities Act of 1933 and the Securities ExchangeAct of 1934. The sale or the prospect of the sale of a substantial number of these shares may have an adverseeffect on the market price of our common stock.
Item 1B. UNRESOLVED STAFF COMMENTS
None.
Item 2. PROPERTIES
Following is a summary of principal properties owned or leased by us.
Corporate Headquarters: Europe Headquarters (2):Portland, Oregon (1 location)—owned Geneva, Switzerland (1 location)—leased
U.S. Distribution Facilities: Europe Administrative Operation:Portland, Oregon (1 location)—owned Strasbourg, France (1 location)—ownedRobards, Kentucky (1 location)—owned Europe Distribution Facility:
Canadian Operation and Distribution Facilities (1): Cambrai, France (1 location)—ownedStrathroy, Ontario (2 locations)—1 owned, 1 leased
(1) Lease expires in June 2012.(2) Lease expires in June 2015.
20
In addition, as of December 31, 2010, we leased over 100 locations globally for the operation of our brandedand outlet retail stores. We also have several leases globally for office space, warehouse facilities, storage space,vehicles and equipment, among other things. See Note 13 of Notes to Consolidated Financial Statements forfurther lease-related disclosures.
Item 3. LEGAL PROCEEDINGS
None.
Item 4. [RESERVED]
Item 4A. EXECUTIVE OFFICERS AND KEY EMPLOYEES OF THE REGISTRANT
The following table sets forth our executive officers and certain key employees. All information is as of thedate of the filing of this report.
Name Age Position
Gertrude Boyle . . . . . . . . . . . . . 87 Chairman of the Board (1)Timothy P. Boyle . . . . . . . . . . . 61 President, Chief Executive Officer, Director (1)Michael W. Blackford . . . . . . . . 42 Vice President of Global InnovationKerry W. Barnes . . . . . . . . . . . . 59 Vice President of RetailTimothy C. Bartels . . . . . . . . . . 46 Vice President of Global Footwear SalesPeter J. Bragdon . . . . . . . . . . . . 48 Senior Vice President of Legal and Corporate Affairs, General Counsel
and Secretary (1)Thomas B. Cusick . . . . . . . . . . . 43 Senior Vice President, Chief Financial Officer and Treasurer (1)Daniel A. Dougherty . . . . . . . . . 58 Vice President Global DistributionMitchell C. Fields . . . . . . . . . . . 63 Vice President of Global Apparel SalesJames T. Gorman . . . . . . . . . . . 63 Vice President Footwear ManufacturingDaniel G. Hanson . . . . . . . . . . . 52 Vice President of MarketingLisa A. Kulok . . . . . . . . . . . . . . 45 Vice President Global Marketplace Planning and Customer OperationsMichael W. McCormick . . . . . . 48 Executive Vice President of Global Sales and Marketing (1)Mark J. Nenow . . . . . . . . . . . . . 53 Vice President of Global Footwear MerchandisingSusan S. Parham . . . . . . . . . . . . 52 Vice President Global Apparel, Accessories and EquipmentSusan G. Popp . . . . . . . . . . . . . . 55 Vice President of Global Human Resources (1)Bryan L. Timm . . . . . . . . . . . . . 47 Executive Vice President and Chief Operating Officer (1)William Tung . . . . . . . . . . . . . . 46 Vice President of Latin America and Asia PacificPatrick J. Werner . . . . . . . . . . . . 55 Vice President of Global Apparel ManufacturingPaul E. Zaengle . . . . . . . . . . . . . 39 Vice President of E-Commerce
(1) These individuals are considered Executive Officers of Columbia.
Gertrude Boyle has served as Chairman of the Board of Directors since 1983. Columbia was founded by herparents in 1938 and managed by her husband, Neal Boyle, from 1964 until his death in 1970. Mrs. Boyle alsoserved as our President from 1970 to 1988. Mrs. Boyle is Timothy P. Boyle’s mother.
Timothy P. Boyle joined Columbia in 1971 as General Manager and has served as President and ChiefExecutive Officer since 1988. He has been a member of the Board of Directors since 1978. Mr. Boyle is also amember of the Board of Directors of Northwest Natural Gas Company and Craft Brewers Alliance, Inc.Mr. Boyle is Gertrude Boyle’s son.
Michael W. Blackford joined Columbia in September 2005 as a Senior Apparel Designer and was promotedto Design Director of Men’s Apparel & Equipment in May 2006. In February 2008 he was promoted to Director
21
of Global Innovation and named Vice President of Global Innovation in August 2010. Prior to joining Columbia,Mr. Blackford held various positions in design, brand management and sourcing at Sierra Designs.
Kerry W. Barnes joined Columbia in January 2007 as Vice President of Retail. From 2001 to 2006,Mr. Barnes served as the Director of Retail Stores for adidas AG. From 1981 to 2001, Mr. Barnes held variousretail positions at Foot Locker, Inc. including Director of Outlet Stores and Regional Vice President of the WestCoast.
Timothy C. Bartels joined Columbia in July 2008 as Vice President of Global Footwear Sales. Mr. Bartelsserved as Vice President of Global Sales for Keen Footwear from 2006 to 2008 and Vice President of Sales forDC Shoes, Inc. (a division of Quiksilver, Inc.) from 2002 to 2006. From 1987 to 2002, Mr. Bartels held a varietyof sales management and sales leadership roles at NIKE, Inc.
Peter J. Bragdon became Vice President and General Counsel, Secretary of Columbia in July 2004 and wasnamed Senior Vice President of Legal and Corporate Affairs, General Counsel and Secretary in January 2010.From 1999 to January 2003, Mr. Bragdon served as Senior Counsel and Director of Intellectual Property forColumbia. Mr. Bragdon served as Chief of Staff in the Oregon Governor’s office from January 2003 throughJune 2004. From 1993 to 1999, Mr. Bragdon was an attorney in the corporate securities and finance group atStoel Rives LLP. Mr. Bragdon served as Special Assistant Attorney General for the Oregon Department ofJustice for seven months in 1996.
Thomas B. Cusick joined Columbia in September 2002 as Corporate Controller, was named Vice Presidentand Corporate Controller in March 2006, was named Vice President and Chief Accounting Officer in May 2008,was named Vice President, Chief Financial Officer and Treasurer in January 2009, and was named Senior VicePresident, Chief Financial Officer and Treasurer in January 2010. From 1995 to 2002, Mr. Cusick worked forCadence Design Systems (and OrCAD, a company acquired by Cadence in 1999), which operates in theelectronic design automation industry, in various financial management positions. From 1990 to 1995,Mr. Cusick was an accountant with KPMG LLP.
Daniel A. Dougherty joined Columbia in December 1997 and was named Vice President of GlobalDistribution in October 2009. From 1989 to 1996, Mr. Dougherty worked for Glen Oaks Industries, Inc., wherehe served as Vice President of Distribution. Prior to that, Mr. Dougherty served as Vice President at bothFussell & Associates, Inc. and Burton & Associates, Inc.
Mitchell C. Fields joined Columbia in October 2006 as National Sales Manager of Men’s Apparel and wasnamed Vice President of Global Apparel Sales in June 2008. From 2002 to 2006, Mr. Fields served as Director ofSales for Callaway Golf Footwear. From 1984 to 2001, Mr. Fields held various sales management positions atNIKE, Inc. including Director of Sales for Nike Golf and Director of Replenishment.
James T. Gorman joined Columbia in October 2009 as Vice President Footwear Manufacturing. From 2001to 2009, Mr. Gorman was President and Founder of Momentum Brand Group, LLC. From 1997 to 2000,Mr. Gorman served as President of PUMA North America, Inc., and from 1994 to 1997, Mr. Gorman served asCEO of Diadora America, Inc. From 1990 to 1993, Mr. Gorman was Senior Vice President Logistics for adidasA.G., and from 1972 to 1990, Mr. Gorman held several key positions at NIKE, Inc., including Divisional VicePresident.
Daniel G. Hanson joined Columbia in September 1989 and held various management positions in sales andmarketing until 1996, when he became Director of Marketing Communications. In March 2006 Mr. Hanson wasnamed Vice President of Marketing. From 1982 to 1989, Mr. Hanson worked for Helly Hansen AS, where heserved as United States Marketing Manager from 1986 to 1989.
22

Lisa A. Kulok joined Columbia in February 2008 as Senior Director of Global Planning and was named VicePresident of Global Marketplace Planning and Customer Operations in October 2009. From 1987 to 2007,Ms. Kulok held various leadership positions at NIKE, Inc., including USA Apparel Marketplace PlanningDirector and Director of Regional Planning.
Michael W. McCormick joined Columbia in August 2006 as Vice President of Sales and was namedExecutive Vice President of Global Sales and Marketing in October 2008. From 2003 to 2006, Mr. McCormickserved as Chief Marketing Officer for Golf Galaxy, Inc. From 2000 to 2002, Mr. McCormick served asExecutive Vice President—Global Sales for Callaway Golf Company, and from 1992 to 2000, Mr. McCormickworked for NIKE, Inc. in various sales management positions, including Director of National Sales.
Mark J. Nenow joined Columbia in May 2007 as Vice President of Global Footwear Merchandising. From2006 to 2007, Mr. Nenow served as Vice President of Global Footwear Merchandising at Brooks Sports. From1995 to 2006, Mr. Nenow worked for NIKE, Inc., where he held various product line management positions inthe running and outdoor categories. Prior to his footwear career, Mr. Nenow was a professional track and fieldathlete and held the American track record for the 10,000 meters from 1986 to 2003.
Susan S. Parham joined Columbia in January 2010 as Vice President Global Apparel, Accessories andEquipment. From 1998 to 2010, Ms. Parham served as President and Founder of the consulting firm LessonsLearned. From 1990 to 1998, Ms. Parham held several leadership positions at NIKE, Inc., including Director ofU.S. Apparel Merchandising and General Merchandising Manager of Nike Retail.
Susan G. Popp joined Columbia in April 1997 as Human Resources Manager and was named HumanResources Director in May 2004. In March 2006, Ms. Popp was named Vice President of Global HumanResources. Prior to joining Columbia, Ms. Popp held various Human Resource positions, including at NIKE, Inc.from 1996 to 1997.
Bryan L. Timm joined Columbia in June 1997 as Corporate Controller and was named Chief FinancialOfficer in July 2002. In 2003 Mr. Timm was named Vice President, Chief Financial Officer and Treasurer and inOctober 2008 he was named Executive Vice President and Chief Operating Officer and continued to serve in therole of Chief Financial Officer until January 2009. From 1991 to 1997, Mr. Timm held various financialmanagement positions for Oregon Steel Mills, Inc. From 1986 to 1991, Mr. Timm was an accountant withKPMG LLP. Mr. Timm is a member of the Board of Directors of Umpqua Holdings Corporation.
William Tung joined Columbia in September 2003 and was named Vice President of International Sales andOperations in December 2004. In October 2008, he was named Vice President of Latin America and AsiaPacific. From 2002 to 2003, Mr. Tung worked for The Body Shop International PLC as Regional Director ofNorth Asia. He was employed by The Rockport Company from 1994 to 2002 where he served in a variety ofcapacities, most recently as Vice President of Europe. From 1991 to 1994, Mr. Tung worked for Prince RacquetSports (a division of Benetton Sportsystems) as Sales and Marketing Manager of Asia-Pacific.
Patrick J. Werner joined Columbia in April 2004 as the Director of Apparel Sportswear Sourcing and wasnamed Vice President of Global Apparel Manufacturing in November 2006. Prior to Columbia, Mr. Werner heldseveral key apparel sourcing manufacturing compliance roles at NIKE, Inc., where he worked from 1981 until2004.
Paul E. Zaengle joined Columbia in June 2008 as Senior Director, E-commerce and was named VicePresident E-commerce in August 2010. Prior to joining Columbia, Mr. Zaengle served as Vice President,Interactive Technology at Polo Ralph Lauren where he led the strategy, technology, production and design effortsbehind the award-winning Polo.com e-commerce and interactive marketing platforms. Prior to joining Polo in2001, Mr. Zaengle held leadership positions in the technology services department at the City of Santa Clarita,California.
23
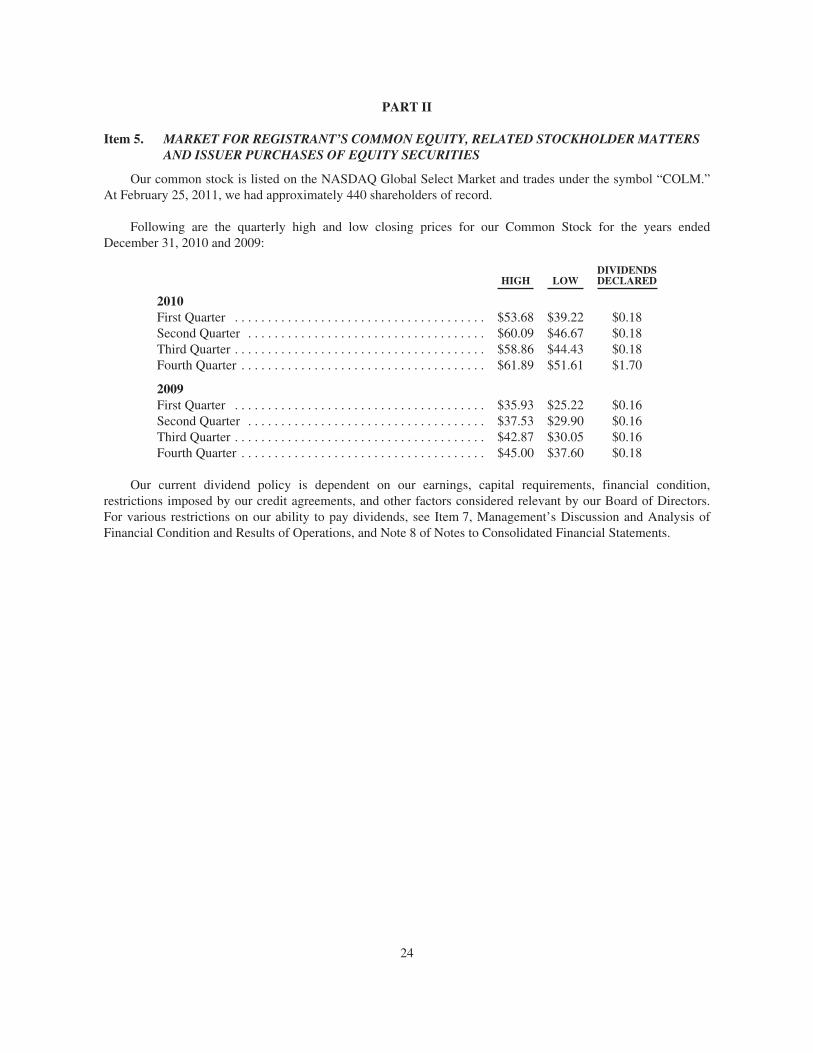
PART II
Item 5. MARKET FOR REGISTRANT’S COMMON EQUITY, RELATED STOCKHOLDER MATTERSAND ISSUER PURCHASES OF EQUITY SECURITIES
Our common stock is listed on the NASDAQ Global Select Market and trades under the symbol “COLM.”At February 25, 2011, we had approximately 440 shareholders of record.
Following are the quarterly high and low closing prices for our Common Stock for the years endedDecember 31, 2010 and 2009:
HIGH LOWDIVIDENDSDECLARED
2010First Quarter . . . . . . . . . . . . . . . . . . . . . . . . . . . . . . . . . . . . . . $53.68 $39.22 $0.18Second Quarter . . . . . . . . . . . . . . . . . . . . . . . . . . . . . . . . . . . . $60.09 $46.67 $0.18Third Quarter . . . . . . . . . . . . . . . . . . . . . . . . . . . . . . . . . . . . . . $58.86 $44.43 $0.18Fourth Quarter . . . . . . . . . . . . . . . . . . . . . . . . . . . . . . . . . . . . . $61.89 $51.61 $1.70
2009First Quarter . . . . . . . . . . . . . . . . . . . . . . . . . . . . . . . . . . . . . . $35.93 $25.22 $0.16Second Quarter . . . . . . . . . . . . . . . . . . . . . . . . . . . . . . . . . . . . $37.53 $29.90 $0.16Third Quarter . . . . . . . . . . . . . . . . . . . . . . . . . . . . . . . . . . . . . . $42.87 $30.05 $0.16Fourth Quarter . . . . . . . . . . . . . . . . . . . . . . . . . . . . . . . . . . . . . $45.00 $37.60 $0.18
Our current dividend policy is dependent on our earnings, capital requirements, financial condition,restrictions imposed by our credit agreements, and other factors considered relevant by our Board of Directors.For various restrictions on our ability to pay dividends, see Item 7, Management’s Discussion and Analysis ofFinancial Condition and Results of Operations, and Note 8 of Notes to Consolidated Financial Statements.
24

Performance Graph
The line graph below compares the cumulative total shareholder return of our Common Stock with thecumulative total return of the Standard & Poor’s (“S&P”) 400 Mid-Cap Index and the Russell 3000 TextilesApparel Manufacturers for the period beginning December 31, 2005 and ending December 31, 2010. The graphassumes that $100 was invested on December 31, 2005, and that any dividends were reinvested.
Historical stock price performance should not be relied on as indicative of future stock price performance.
Columbia Sportswear CompanyStock Price Performance
December 31, 2005—December 31, 2010
Columbia Sportswear Co. S&P 400 Mid-Cap Index Russell 3000 Textiles Apparel Mfrs.
12/31/201012/31/2005 12/31/2006 12/31/2007 12/31/2008 12/31/2009
$0
$20
$40
$60
$80
$100
$120
$140
$160
Total Return Analysis
12/31/2005 12/31/2006 12/31/2007 12/31/2008 12/31/2009 12/31/2010
Columbia Sportswear Co. . . . . . . . . . . . . . . $100.00 $116.98 $ 93.52 $76.25 $ 85.83 $138.27S&P 400 Mid-Cap Index . . . . . . . . . . . . . . . $100.00 $110.32 $119.12 $75.96 $104.36 $132.16Russell 3000 Textiles Apparel Mfrs. . . . . . . $100.00 $128.72 $ 98.77 $58.12 $ 82.38 $108.53
Issuer Purchases of Equity Securities
Since the inception of the Company’s stock repurchase plan in 2004 through December 31, 2010, the Boardof Directors has authorized the repurchase of up to $500,000,000 of the Company’s common stock. As ofDecember 31, 2010, the Company had repurchased 9,190,890 shares under this program for an aggregatepurchase price of approximately $421,237,000. Shares of the Company’s common stock may be purchased in theopen market or through privately negotiated transactions, subject to market conditions. The repurchase programdoes not obligate the Company to acquire any specific number of shares or to acquire shares over any specifiedperiod of time.
The Company did not repurchase any equity securities during the three months ended December 31, 2010.
25
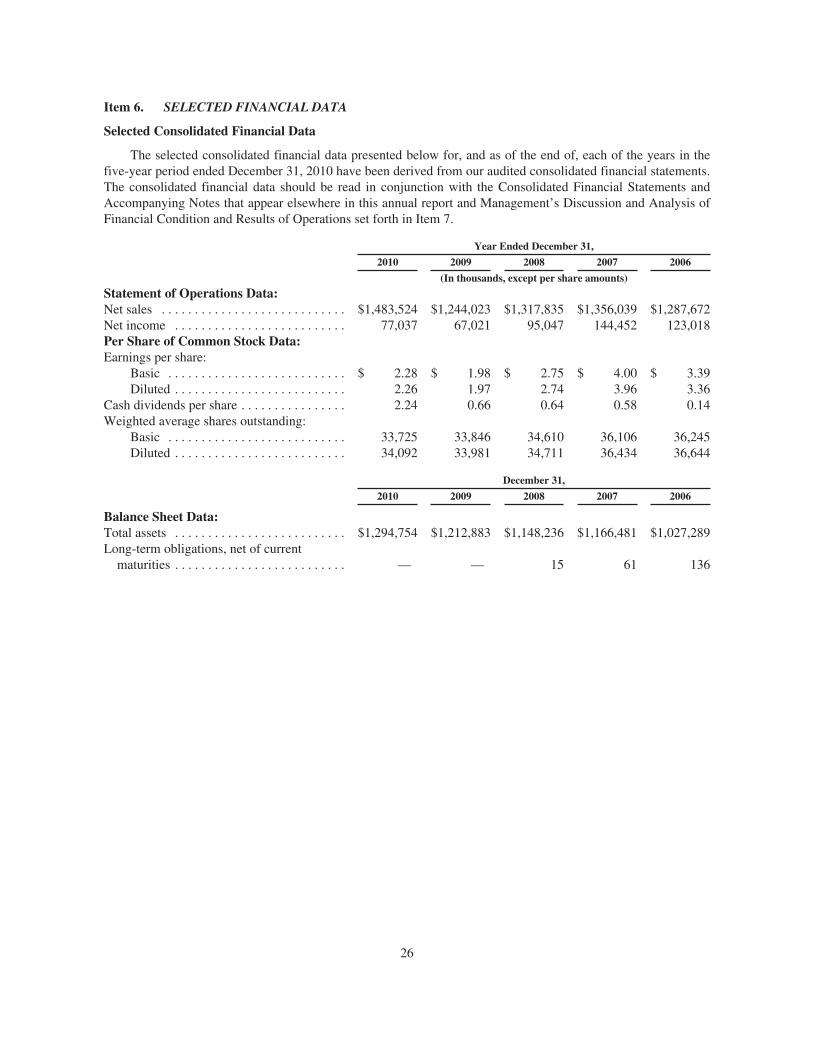
Item 6. SELECTED FINANCIAL DATA
Selected Consolidated Financial Data
The selected consolidated financial data presented below for, and as of the end of, each of the years in thefive-year period ended December 31, 2010 have been derived from our audited consolidated financial statements.The consolidated financial data should be read in conjunction with the Consolidated Financial Statements andAccompanying Notes that appear elsewhere in this annual report and Management’s Discussion and Analysis ofFinancial Condition and Results of Operations set forth in Item 7.
Year Ended December 31,
2010 2009 2008 2007 2006
(In thousands, except per share amounts)
Statement of Operations Data:Net sales . . . . . . . . . . . . . . . . . . . . . . . . . . . . $1,483,524 $1,244,023 $1,317,835 $1,356,039 $1,287,672Net income . . . . . . . . . . . . . . . . . . . . . . . . . . 77,037 67,021 95,047 144,452 123,018Per Share of Common Stock Data:Earnings per share:
Basic . . . . . . . . . . . . . . . . . . . . . . . . . . . $ 2.28 $ 1.98 $ 2.75 $ 4.00 $ 3.39Diluted . . . . . . . . . . . . . . . . . . . . . . . . . . 2.26 1.97 2.74 3.96 3.36
Cash dividends per share . . . . . . . . . . . . . . . . 2.24 0.66 0.64 0.58 0.14Weighted average shares outstanding:
Basic . . . . . . . . . . . . . . . . . . . . . . . . . . . 33,725 33,846 34,610 36,106 36,245Diluted . . . . . . . . . . . . . . . . . . . . . . . . . . 34,092 33,981 34,711 36,434 36,644
December 31,
2010 2009 2008 2007 2006
Balance Sheet Data:Total assets . . . . . . . . . . . . . . . . . . . . . . . . . . $1,294,754 $1,212,883 $1,148,236 $1,166,481 $1,027,289Long-term obligations, net of current
maturities . . . . . . . . . . . . . . . . . . . . . . . . . . — — 15 61 136
26

Item 7. MANAGEMENT’S DISCUSSION AND ANALYSIS OF FINANCIAL CONDITION ANDRESULTS OF OPERATIONS
This Annual Report, including Item 1 of Part I and Item 6 of Part II, contains forward-looking statements.Forward-looking statements include any statements related to our expectations regarding future performance ormarket position, including any statements regarding anticipated sales across markets, distribution channels andproduct categories, access to raw materials and factory capacity, financing and working capital requirements andresources and our exposure to market risk associated with interest rates and foreign currency exchange rates.
These forward-looking statements, and others we make from time to time, are subject to a number of risksand uncertainties. Many factors may cause actual results to differ materially from those projected in forward-looking statements, including the risks described above in Item 1A, Risk Factors. We do not undertake any dutyeither to update forward-looking statements after the date they are made or to conform them to actual results or tochanges in circumstances or expectations.
Our Business
As one of the largest outdoor apparel and footwear companies in the world, we design, source, market anddistribute active outdoor apparel, footwear, accessories and equipment under the Columbia, Mountain Hardwear,Sorel and Montrail brands. Our products are sold through a mix of wholesale distribution channels, independentdistributors, our own direct-to-consumer channels and licensees.
The popularity of outdoor activities, changing design trends and consumer adoption of innovativeperformance technologies affect consumer desire for our products. Therefore, we seek to anticipate and respondto trends and shifts in consumer preferences by adjusting the mix of available product offerings, developing newproducts with innovative performance features and designs, and creating persuasive and memorable marketingcommunications to drive consumer awareness and demand. Failure to anticipate or respond to consumer needsand preferences in a timely and adequate manner could have a material adverse effect on our sales andprofitability.
Seasonality and Variability of Business
Our business is affected by the general seasonal trends common to the outdoor industry and is heavilydependent upon discretionary consumer spending patterns. Our products are marketed on a seasonal basis andour product mix is weighted substantially toward the fall season, resulting in sales and profits being highest in thethird calendar quarter. The expansion of our own direct-to-consumer operations beginning in 2008 has increasedthe proportion of sales and profits that we generate in the fourth calendar quarter. In 2009 and 2010, our profitswere earned entirely in the second half of the year, reflecting the dependence upon our sales results in the latterpart of the year as well as a higher fixed cost structure of our business.
Results of operations in any period should not be considered indicative of the results to be expected for anyfuture period, particularly in light of persistent volatility in economic conditions. Sales of our products aresubject to substantial cyclical fluctuation, the effects of unseasonable weather conditions, and the continuedpopularity of outdoor activities as part of an active lifestyle in key markets. The current economic environment inkey markets, coupled with challenging capacity constraints across the independent manufacturing andtransportation segments of our supply chain, reduced the predictability of our business throughout 2010 and into2011.
27
Business Outlook
The business climate continues to present us with a great deal of uncertainty, with a number of variables thatwe rely on for planning purposes moving in opposing directions making it more difficult to predict future results.Factors that could significantly affect our 2011 outlook include:
• Unseasonable weather conditions affecting consumer demand and the resulting effect on ordercancellations and reorders;
• Changes in mix and volume of full price sales in contrast with closeout product sales;
• Manufacturing and/or transportation capacity constraints;
• The variability of input costs across our supply chain;
• Costs of expedited transportation;
• Incremental sales through our expanding direct-to-consumer operations, which are not included inbacklog;
• Changes in consumer spending activity and sales fluctuations in our own retail stores; and
• Fluctuating currency exchange rates.
Like other branded consumer product companies, our business is heavily dependent upon discretionaryconsumer spending patterns. Continuing high levels of unemployment in our key markets and restricted creditmarkets for consumers and retailers continue to pose significant challenges and risks. As a result, a more cautiousapproach by our wholesale customers may persist, resulting in risk of reduction, delay or cancellation of advanceorders prior to shipment.
Over the past two years we have made significant investments in our go-to-market process to position us forgrowth. Among other things we have:
• Sharpened our focus on product innovation;
• Built a multi-channel direct-to-consumer platform, including expanded retail store and e-commerceoperations;
• Refocused our marketing efforts behind new brand campaigns and media strategies for each of ourmajor brands; and
• Restructured our sales organizations to build relationships with new partners and strengthen those withexisting accounts.
As a result of these continuing efforts, we expect our operating expense levels to increase compared to 2010.In addition, we have begun to make improvements to our operational processes, involving significantinvestments in initiatives to improve our information technology infrastructure and our enterprise data andinformation management across our organization, which is designed to improve operational flexibility andperformance across our supply chain. These investments are the foundation for a multi-year implementation of anew global enterprise resource planning, or ERP, system which began in late 2010 and will accelerate in 2011and beyond.
Wholesale Backlog
We generally solicit orders from wholesale customers and independent distributors for the fall and springseasons by March 31 and September 30, respectively, based on ordering deadlines that we establish to aid ourefforts to plan manufacturing volumes to meet demand for each of our selling seasons. Twice each year we reportour backlog of advance orders, representing the results of these seasonal order-taking processes.
28

We typically ship the majority of our advance fall season orders to wholesale customers and independentdistributors beginning in late June and continuing through October. Similarly, the majority of our advance springseason orders ship to wholesale customers and independent distributors beginning in late December andcontinuing through late April. Generally, orders are subject to cancellation prior to the date of shipment.
Our spring wholesale backlog at September 30, 2010 (our most recent seasonal ordering deadline) increased$43.4 million, or 12%, to $394.2 million from $350.8 million at September 30, 2009. Changes in foreigncurrency exchange rates compared with 2009 affected the spring wholesale backlog comparison by less than 1%.Our spring wholesale backlog reflects growth across each major brand, product category and region. The increasein our spring wholesale backlog was led by the United States, followed by the LAAP region, the EMEA regionand Canada. By product category, the spring wholesale backlog increase was led by sportswear, followed byfootwear, outerwear and accessories and equipment. By brand, the spring wholesale backlog increase was led bythe Columbia brand, followed by the Sorel brand and the Mountain Hardwear brand. Wholesale backlog does notinclude anticipated sales to consumers through our own direct-to-consumer channels. Although we cannot predictwith certainty any future results, our reported spring wholesale backlog is one indicator of our anticipated netsales for the spring 2011 selling season. Many factors, however, could cause actual wholesale sales to differmaterially from the reported spring wholesale backlog, including the potential cancellation of orders bycustomers, capacity constraints at our independent manufacturing partners’ facilities resulting in delivery delays,changes in foreign currency exchange rates and changes in macro-economic conditions. Moreover, our springwholesale backlog should not be used in forecasting sales beyond the spring 2011 selling season.
Results of Operations
The following discussion of our results of operations and liquidity and capital resources should be read inconjunction with the Consolidated Financial Statements and accompanying Notes that appear elsewhere in thisannual report. All references to years relate to the calendar year ended December 31.
Highlights of the Year Ended December 31, 2010
• Net sales increased $239.5 million, or 19%, to $1,483.5 million in 2010 from $1,244.0 million in 2009.Changes in foreign currency exchange rates compared with 2009 contributed approximately onepercentage point of benefit to the consolidated net sales comparison.
• Net income increased 15% to $77.0 million in 2010 from $67.0 million in 2009, and diluted earningsper share increased to $2.26 in 2010 compared to $1.97 in 2009.
• We paid quarterly cash dividends totaling $0.74 per share, or $24.9 million in aggregate, for the yearended December 31, 2010, which included an 11% increase in the quarterly dividend to $0.20 per sharefrom $0.18 per share in October 2010. In addition, we paid a special dividend of $1.50 per share, or$50.5 million in aggregate, in December 2010.
• Cash, cash equivalents and short-term investments as of December 31, 2010 totaled approximately$303.1 million.
29
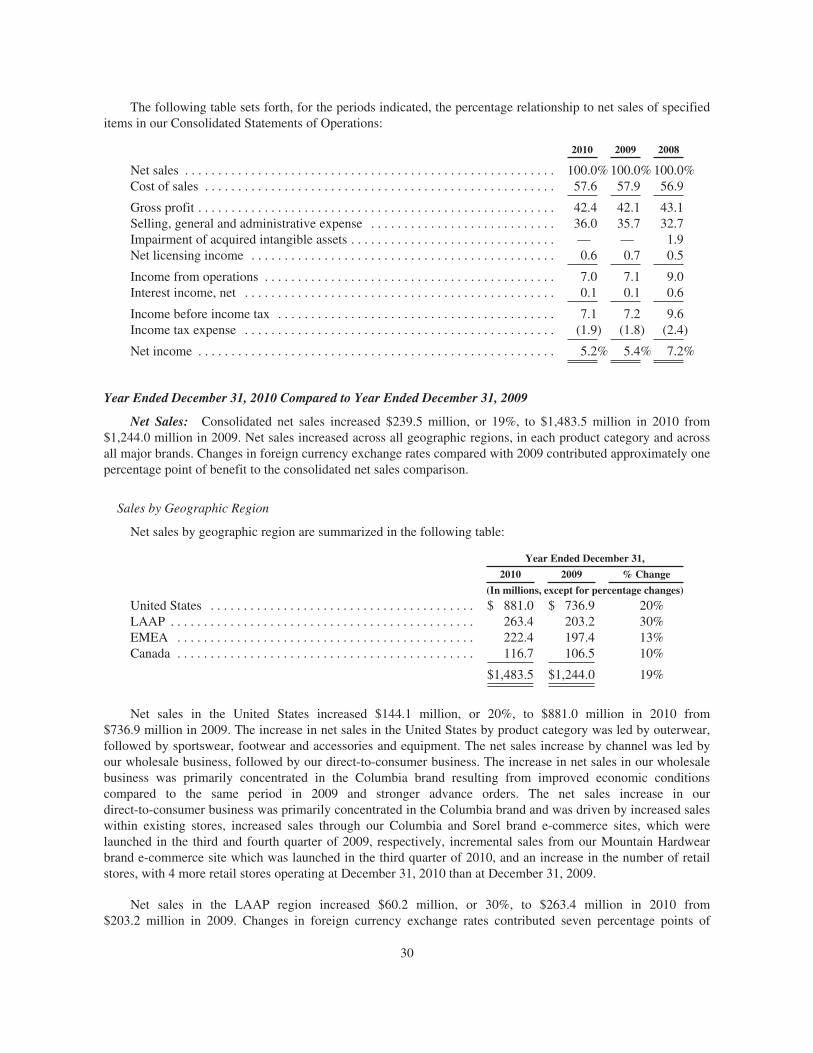
The following table sets forth, for the periods indicated, the percentage relationship to net sales of specifieditems in our Consolidated Statements of Operations:
2010 2009 2008
Net sales . . . . . . . . . . . . . . . . . . . . . . . . . . . . . . . . . . . . . . . . . . . . . . . . . . . . . . . . 100.0% 100.0% 100.0%Cost of sales . . . . . . . . . . . . . . . . . . . . . . . . . . . . . . . . . . . . . . . . . . . . . . . . . . . . . 57.6 57.9 56.9
Gross profit . . . . . . . . . . . . . . . . . . . . . . . . . . . . . . . . . . . . . . . . . . . . . . . . . . . . . . 42.4 42.1 43.1Selling, general and administrative expense . . . . . . . . . . . . . . . . . . . . . . . . . . . . 36.0 35.7 32.7Impairment of acquired intangible assets . . . . . . . . . . . . . . . . . . . . . . . . . . . . . . . — — 1.9Net licensing income . . . . . . . . . . . . . . . . . . . . . . . . . . . . . . . . . . . . . . . . . . . . . . 0.6 0.7 0.5
Income from operations . . . . . . . . . . . . . . . . . . . . . . . . . . . . . . . . . . . . . . . . . . . . 7.0 7.1 9.0Interest income, net . . . . . . . . . . . . . . . . . . . . . . . . . . . . . . . . . . . . . . . . . . . . . . . 0.1 0.1 0.6
Income before income tax . . . . . . . . . . . . . . . . . . . . . . . . . . . . . . . . . . . . . . . . . . 7.1 7.2 9.6Income tax expense . . . . . . . . . . . . . . . . . . . . . . . . . . . . . . . . . . . . . . . . . . . . . . . (1.9) (1.8) (2.4)
Net income . . . . . . . . . . . . . . . . . . . . . . . . . . . . . . . . . . . . . . . . . . . . . . . . . . . . . . 5.2% 5.4% 7.2%
Year Ended December 31, 2010 Compared to Year Ended December 31, 2009
Net Sales: Consolidated net sales increased $239.5 million, or 19%, to $1,483.5 million in 2010 from$1,244.0 million in 2009. Net sales increased across all geographic regions, in each product category and acrossall major brands. Changes in foreign currency exchange rates compared with 2009 contributed approximately onepercentage point of benefit to the consolidated net sales comparison.
Sales by Geographic Region
Net sales by geographic region are summarized in the following table:
Year Ended December 31,
2010 2009 % Change
(In millions, except for percentage changes)
United States . . . . . . . . . . . . . . . . . . . . . . . . . . . . . . . . . . . . . . . . $ 881.0 $ 736.9 20%LAAP . . . . . . . . . . . . . . . . . . . . . . . . . . . . . . . . . . . . . . . . . . . . . . 263.4 203.2 30%EMEA . . . . . . . . . . . . . . . . . . . . . . . . . . . . . . . . . . . . . . . . . . . . . 222.4 197.4 13%Canada . . . . . . . . . . . . . . . . . . . . . . . . . . . . . . . . . . . . . . . . . . . . . 116.7 106.5 10%
$1,483.5 $1,244.0 19%
Net sales in the United States increased $144.1 million, or 20%, to $881.0 million in 2010 from$736.9 million in 2009. The increase in net sales in the United States by product category was led by outerwear,followed by sportswear, footwear and accessories and equipment. The net sales increase by channel was led byour wholesale business, followed by our direct-to-consumer business. The increase in net sales in our wholesalebusiness was primarily concentrated in the Columbia brand resulting from improved economic conditionscompared to the same period in 2009 and stronger advance orders. The net sales increase in ourdirect-to-consumer business was primarily concentrated in the Columbia brand and was driven by increased saleswithin existing stores, increased sales through our Columbia and Sorel brand e-commerce sites, which werelaunched in the third and fourth quarter of 2009, respectively, incremental sales from our Mountain Hardwearbrand e-commerce site which was launched in the third quarter of 2010, and an increase in the number of retailstores, with 4 more retail stores operating at December 31, 2010 than at December 31, 2009.
Net sales in the LAAP region increased $60.2 million, or 30%, to $263.4 million in 2010 from$203.2 million in 2009. Changes in foreign currency exchange rates contributed seven percentage points of
30
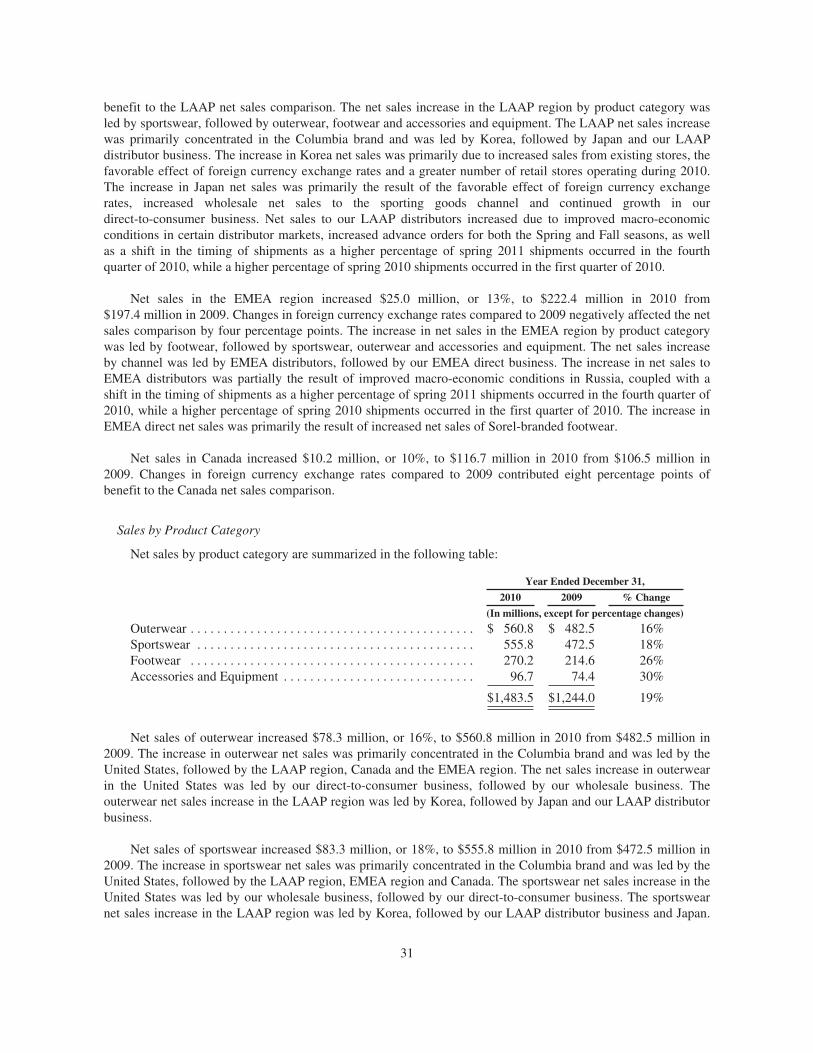
benefit to the LAAP net sales comparison. The net sales increase in the LAAP region by product category wasled by sportswear, followed by outerwear, footwear and accessories and equipment. The LAAP net sales increasewas primarily concentrated in the Columbia brand and was led by Korea, followed by Japan and our LAAPdistributor business. The increase in Korea net sales was primarily due to increased sales from existing stores, thefavorable effect of foreign currency exchange rates and a greater number of retail stores operating during 2010.The increase in Japan net sales was primarily the result of the favorable effect of foreign currency exchangerates, increased wholesale net sales to the sporting goods channel and continued growth in ourdirect-to-consumer business. Net sales to our LAAP distributors increased due to improved macro-economicconditions in certain distributor markets, increased advance orders for both the Spring and Fall seasons, as wellas a shift in the timing of shipments as a higher percentage of spring 2011 shipments occurred in the fourthquarter of 2010, while a higher percentage of spring 2010 shipments occurred in the first quarter of 2010.
Net sales in the EMEA region increased $25.0 million, or 13%, to $222.4 million in 2010 from$197.4 million in 2009. Changes in foreign currency exchange rates compared to 2009 negatively affected the netsales comparison by four percentage points. The increase in net sales in the EMEA region by product categorywas led by footwear, followed by sportswear, outerwear and accessories and equipment. The net sales increaseby channel was led by EMEA distributors, followed by our EMEA direct business. The increase in net sales toEMEA distributors was partially the result of improved macro-economic conditions in Russia, coupled with ashift in the timing of shipments as a higher percentage of spring 2011 shipments occurred in the fourth quarter of2010, while a higher percentage of spring 2010 shipments occurred in the first quarter of 2010. The increase inEMEA direct net sales was primarily the result of increased net sales of Sorel-branded footwear.
Net sales in Canada increased $10.2 million, or 10%, to $116.7 million in 2010 from $106.5 million in2009. Changes in foreign currency exchange rates compared to 2009 contributed eight percentage points ofbenefit to the Canada net sales comparison.
Sales by Product Category
Net sales by product category are summarized in the following table:
Year Ended December 31,
2010 2009 % Change
(In millions, except for percentage changes)
Outerwear . . . . . . . . . . . . . . . . . . . . . . . . . . . . . . . . . . . . . . . . . . . $ 560.8 $ 482.5 16%Sportswear . . . . . . . . . . . . . . . . . . . . . . . . . . . . . . . . . . . . . . . . . . 555.8 472.5 18%Footwear . . . . . . . . . . . . . . . . . . . . . . . . . . . . . . . . . . . . . . . . . . . 270.2 214.6 26%Accessories and Equipment . . . . . . . . . . . . . . . . . . . . . . . . . . . . . 96.7 74.4 30%
$1,483.5 $1,244.0 19%
Net sales of outerwear increased $78.3 million, or 16%, to $560.8 million in 2010 from $482.5 million in2009. The increase in outerwear net sales was primarily concentrated in the Columbia brand and was led by theUnited States, followed by the LAAP region, Canada and the EMEA region. The net sales increase in outerwearin the United States was led by our direct-to-consumer business, followed by our wholesale business. Theouterwear net sales increase in the LAAP region was led by Korea, followed by Japan and our LAAP distributorbusiness.
Net sales of sportswear increased $83.3 million, or 18%, to $555.8 million in 2010 from $472.5 million in2009. The increase in sportswear net sales was primarily concentrated in the Columbia brand and was led by theUnited States, followed by the LAAP region, EMEA region and Canada. The sportswear net sales increase in theUnited States was led by our wholesale business, followed by our direct-to-consumer business. The sportswearnet sales increase in the LAAP region was led by Korea, followed by our LAAP distributor business and Japan.
31
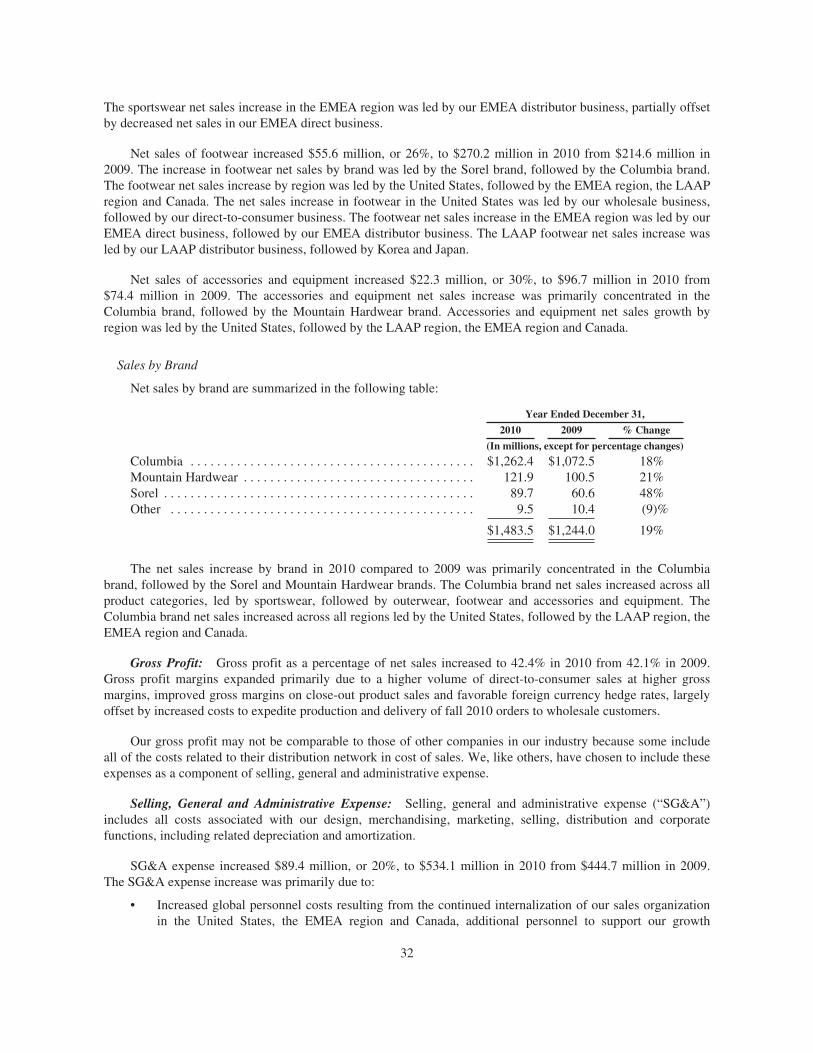
The sportswear net sales increase in the EMEA region was led by our EMEA distributor business, partially offsetby decreased net sales in our EMEA direct business.
Net sales of footwear increased $55.6 million, or 26%, to $270.2 million in 2010 from $214.6 million in2009. The increase in footwear net sales by brand was led by the Sorel brand, followed by the Columbia brand.The footwear net sales increase by region was led by the United States, followed by the EMEA region, the LAAPregion and Canada. The net sales increase in footwear in the United States was led by our wholesale business,followed by our direct-to-consumer business. The footwear net sales increase in the EMEA region was led by ourEMEA direct business, followed by our EMEA distributor business. The LAAP footwear net sales increase wasled by our LAAP distributor business, followed by Korea and Japan.
Net sales of accessories and equipment increased $22.3 million, or 30%, to $96.7 million in 2010 from$74.4 million in 2009. The accessories and equipment net sales increase was primarily concentrated in theColumbia brand, followed by the Mountain Hardwear brand. Accessories and equipment net sales growth byregion was led by the United States, followed by the LAAP region, the EMEA region and Canada.
Sales by Brand
Net sales by brand are summarized in the following table:
Year Ended December 31,
2010 2009 % Change
(In millions, except for percentage changes)
Columbia . . . . . . . . . . . . . . . . . . . . . . . . . . . . . . . . . . . . . . . . . . . $1,262.4 $1,072.5 18%Mountain Hardwear . . . . . . . . . . . . . . . . . . . . . . . . . . . . . . . . . . . 121.9 100.5 21%Sorel . . . . . . . . . . . . . . . . . . . . . . . . . . . . . . . . . . . . . . . . . . . . . . . 89.7 60.6 48%Other . . . . . . . . . . . . . . . . . . . . . . . . . . . . . . . . . . . . . . . . . . . . . . 9.5 10.4 (9)%
$1,483.5 $1,244.0 19%
The net sales increase by brand in 2010 compared to 2009 was primarily concentrated in the Columbiabrand, followed by the Sorel and Mountain Hardwear brands. The Columbia brand net sales increased across allproduct categories, led by sportswear, followed by outerwear, footwear and accessories and equipment. TheColumbia brand net sales increased across all regions led by the United States, followed by the LAAP region, theEMEA region and Canada.
Gross Profit: Gross profit as a percentage of net sales increased to 42.4% in 2010 from 42.1% in 2009.Gross profit margins expanded primarily due to a higher volume of direct-to-consumer sales at higher grossmargins, improved gross margins on close-out product sales and favorable foreign currency hedge rates, largelyoffset by increased costs to expedite production and delivery of fall 2010 orders to wholesale customers.
Our gross profit may not be comparable to those of other companies in our industry because some includeall of the costs related to their distribution network in cost of sales. We, like others, have chosen to include theseexpenses as a component of selling, general and administrative expense.
Selling, General and Administrative Expense: Selling, general and administrative expense (“SG&A”)includes all costs associated with our design, merchandising, marketing, selling, distribution and corporatefunctions, including related depreciation and amortization.
SG&A expense increased $89.4 million, or 20%, to $534.1 million in 2010 from $444.7 million in 2009.The SG&A expense increase was primarily due to:
• Increased global personnel costs resulting from the continued internalization of our sales organizationin the United States, the EMEA region and Canada, additional personnel to support our growth
32

initiatives, reinstatement of personnel and benefit programs that were curtailed or postponed in 2009,and higher incentive compensation;
• Incremental expenses to support our expanded direct-to-consumer businesses in the United States, theEMEA region and Canada;
• Expenses associated with various initiatives to improve our information technology infrastructure,including increased costs associated with our multi-year global ERP implementation; and
• Increased advertising expense.
As a percentage of net sales, SG&A expense increased to 36.0% of net sales in 2010 from 35.7% of netsales in 2009. Depreciation and amortization included in SG&A expense totaled $37.8 million in 2010 comparedto $35.5 million in 2009.
Net Licensing Income: Net licensing income decreased $0.4 million, or 5%, to $8.0 million in 2010 from$8.4 million in 2009.
Interest Income, Net: Net interest income was $1.6 million in 2010 compared to $2.1 million in 2009.The decrease in interest income was primarily driven by lower interest rates in 2010 compared to 2009. Interestexpense was nominal in both 2010 and 2009.
Income Tax Expense: Income tax expense increased to $27.9 million in 2010 from $22.8 million in 2009.This increase resulted from higher income before tax as well as an increase in our effective income tax rate to26.6% in 2010 compared to 25.4% in 2009. Our effective tax rates in 2010 and 2009 were reduced by therecognition of tax benefits associated with the favorable resolution of uncertain tax positions, foreign tax creditsand non-U.S. income generally taxed at lower tax rates.
Net Income: Net income increased $10.0 million, or 15%, to $77.0 million in 2010 from $67.0 in 2009.Diluted earnings per share was $2.26 in 2010 compared to $1.97 in 2009.
Year Ended December 31, 2009 Compared to Year Ended December 31, 2008
Net Sales: Consolidated net sales decreased $73.8 million, or 6%, to $1,244.0 million in 2009 from$1,317.8 million in 2008. Changes in foreign currency exchange rates compared with 2008 negatively affectedthe consolidated net sales comparison by approximately one percentage point. The decrease in net sales was ledby the EMEA region and Canada, partially offset by increased net sales in the United States and the LAAPregion. By product category, the reduction in net sales was led by sportswear, followed by outerwear andfootwear, partially offset by increased net sales of accessories and equipment.
Sales by Geographic Region
Year Ended December 31,
2009 2008 % Change
(In millions, except for percentage changes)
United States . . . . . . . . . . . . . . . . . . . . . . . . . . . . . . . . . . . . . . . . $ 736.9 $ 727.7 1%LAAP . . . . . . . . . . . . . . . . . . . . . . . . . . . . . . . . . . . . . . . . . . . . . . 203.2 198.2 3%EMEA . . . . . . . . . . . . . . . . . . . . . . . . . . . . . . . . . . . . . . . . . . . . . 197.4 267.2 (26)%Canada . . . . . . . . . . . . . . . . . . . . . . . . . . . . . . . . . . . . . . . . . . . . . 106.5 124.7 (15)%
$1,244.0 $1,317.8 (6)%
Net sales in the United States increased $9.2 million, or 1%, to $736.9 million in 2009 from $727.7 millionin 2008. The increase in net sales in the United States was led by outerwear, followed by footwear and
33

accessories and equipment, partially offset by decreased net sales of sportswear. A net sales increase through ourretail channels was partially offset by a net sales decrease in our wholesale business. During 2009, we opened 11new outlet retail stores in the United States, ending the year with 39 outlet retail stores and 6 branded retailstores. In addition, we launched e-commerce websites for the Columbia brand in the third quarter of 2009 and forthe Sorel brand in the fourth quarter of 2009.
Net sales in the LAAP region increased $5.0 million, or 3%, to $203.2 million in 2009 from $198.2 millionin 2008. Changes in foreign currency exchange rates contributed two percentage points of benefit to LAAP netsales compared to 2008. The net sales increase in the LAAP region was led by outerwear, followed byaccessories and equipment and footwear, partially offset by a net sales decrease in sportswear. Net sales growthin the LAAP region was led by our Japan business, which benefited from foreign currency exchange rates,followed by our Korea business, partially offset by a net sales decrease in our LAAP distributor business.
Net sales in the EMEA region decreased $69.8 million, or 26%, to $197.4 million in 2009 from$267.2 million in 2008. Changes in foreign currency exchange rates compared to 2008 negatively affected the netsales comparison by three percentage points. The decrease in net sales in the EMEA region was led bysportswear and outerwear, followed by footwear and accessories and equipment. Net sales decreased for both theEMEA distributor and EMEA direct businesses. The decrease in net sales to EMEA distributors primarilyreflects lower Columbia-branded product net sales to our largest distributor in the region and a shift in the timingof shipments as a smaller percentage of spring 2010 shipments occurred in the fourth quarter of 2009, while ahigher percentage of spring 2009 shipments occurred in the fourth quarter of 2008. The decrease in EMEA directnet sales was consistent with lower advance order volumes due in part to continued product assortment andmarketing challenges.
Net sales in Canada decreased $18.2 million, or 15%, to $106.5 million in 2009 from $124.7 million in2008. Changes in foreign currency exchange rates compared to 2008 negatively affected the net sales comparisonby seven percentage points. The decrease in net sales in Canada was led by sportswear and outerwear, partiallyoffset by increased net sales of footwear and accessories and equipment. The decrease in net sales was consistentwith lower advance order volumes of Columbia-branded products due in part to planned reductions in certainchannels of distribution.
Sales by Product Category
Year Ended December 31,
2009 2008 % Change
(In millions, except for percentage changes)
Outerwear . . . . . . . . . . . . . . . . . . . . . . . . . . . . . . . . . . . . . . . . . . . $ 482.5 $ 491.7 (2)%Sportswear . . . . . . . . . . . . . . . . . . . . . . . . . . . . . . . . . . . . . . . . . . 472.5 540.9 (13)%Footwear . . . . . . . . . . . . . . . . . . . . . . . . . . . . . . . . . . . . . . . . . . . 214.6 217.2 (1)%Accessories and Equipment . . . . . . . . . . . . . . . . . . . . . . . . . . . . . 74.4 68.0 9%
$1,244.0 $1,317.8 (6)%
Net sales of outerwear decreased $9.2 million, or 2%, to $482.5 million in 2009 from $491.7 million in2008. The decrease in outerwear net sales consisted of decreased net sales in the EMEA direct and distributorbusinesses, the LAAP distributor business, Canada and the United States wholesale business, partially offset byincreased net sales in our United States retail business, Japan and Korea. By brand, the decrease in net sales ofColumbia-branded outerwear was partially offset by increased net sales of Mountain Hardwear-brandedouterwear. We primarily attribute the decrease in wholesale net sales of Columbia-branded outerwear to lowerinitial order volumes.
34

Net sales of sportswear decreased $68.4 million, or 13%, to $472.5 million in 2009 from $540.9 million in2008. The decrease in sportswear net sales consisted of decreased net sales in the United States wholesalebusiness, the EMEA direct and distributor businesses, Canada and the LAAP distributor business, partially offsetby increased net sales in our United States retail business, Japan and Korea. By brand, the decrease in net sales ofColumbia-branded sportswear was partially offset by increased net sales of Mountain Hardwear-brandedsportswear. We primarily attribute the decrease in wholesale net sales of Columbia-branded sportswear to lowerinitial order volumes.
Net sales of footwear decreased $2.6 million, or 1%, to $214.6 million in 2009 from $217.2 million in 2008.The decrease in footwear net sales was concentrated in the EMEA distributor business, followed by the UnitedStates wholesale and LAAP distributor businesses, partially offset by increased net sales of footwear in ourUnited States retail business, Japan and Canada. Footwear net sales were essentially flat in the EMEA directbusiness and Korea. By brand, the decrease in net sales of Columbia-branded footwear was partially offset byincreased net sales of Sorel-branded footwear. Net sales of Sorel-branded footwear increased in all regions andbusinesses except the EMEA distributor business. The decrease in footwear net sales to EMEA distributorsprimarily reflects lower Columbia-branded product net sales to our largest customer in that region and a shift inthe timing of shipments as a smaller percentage of spring 2010 shipments occurred in the fourth quarter of 2009,while a higher percentage of spring 2009 shipments occurred in the fourth quarter of 2008.
Net sales of accessories and equipment increased $6.4 million, or 9%, to $74.4 million in 2009 from$68.0 million in 2008. Accessories and equipment sales growth was concentrated in Columbia-brandedaccessories and equipment and led by the United States and the LAAP region, followed by Canada, partiallyoffset by a decrease in net sales in the EMEA region.
Sales by Brand
Year Ended December 31,
2009 2008 % Change
(In millions, except for percentage changes)
Columbia . . . . . . . . . . . . . . . . . . . . . . . . . . . . . . . . . . . . . . . . . . . $1,072.5 $1,162.0 (8)%Mountain Hardwear . . . . . . . . . . . . . . . . . . . . . . . . . . . . . . . . . . . 100.5 95.0 6%Sorel . . . . . . . . . . . . . . . . . . . . . . . . . . . . . . . . . . . . . . . . . . . . . . . 60.6 48.1 26%Other . . . . . . . . . . . . . . . . . . . . . . . . . . . . . . . . . . . . . . . . . . . . . . 10.4 12.7 (18)%
$1,244.0 $1,317.8 (6)%
Gross Profit: Gross profit as a percentage of net sales decreased to 42.1% in 2009 from 43.1% in 2008.Gross profit margins contracted primarily as a result of a higher volume of close-out product sales at lower grossmargins and unfavorable hedge rates.
Selling, General and Administrative Expense: SG&A expense increased $14.3 million, or 3%, to$444.7 million in 2009 from $430.4 million in 2008. As a percentage of net sales, SG&A expense increased to35.7% of net sales in 2009 from 32.7% of net sales in 2008. The increase in SG&A expense as a percentage ofnet sales was largely the result of reduced net sales in our wholesale business coupled with an increased fixedcost base related to our expanding direct-to-consumer operations and increased incentive compensation andprofessional fees, partially offset by reduced advertising and bad debt expense.
Selling expenses, including commissions and advertising, decreased $17.0 million, or 14%, to 8.4% of netsales in 2009 from 9.2% of net sales in 2008. We attribute the decrease in selling expenses as a percentage of netsales to lower commission expense as relationships with certain independent sales agencies in the United Statesand the EMEA region have been discontinued and replaced by in-house sales operations. Operating expenses forthe in-house sales organization are included in general and administrative expenses.
35
General and administrative expenses increased $31.3 million, or 10%, to 27.4% of net sales in 2009 from23.4% of net sales for the comparable period in 2008. The increase in general and administrative expenses as apercentage of net sales was primarily due to incremental operating costs in support our direct-to-consumerinitiatives and the expansion of our in-house sales organization, partially offset by lower bad debt expense.Depreciation and amortization included in SG&A expense totaled $35.5 million for 2009, compared to$30.1 million for the same period in 2008.
Impairment of Acquired Intangible Assets: We did not incur any impairment of acquired intangibleassets in 2009. During the fourth quarter of 2008, we incurred a $24.7 million non-cash pre-tax charge, orapproximately $0.46 per diluted share after tax, for the write-down of acquired intangible assets related to ouracquisitions of the Pacific Trail and Montrail brands in 2006. The impairment charge related primarily togoodwill and trademarks and resulted from our annual evaluation of intangible asset values. These brands had notachieved our sales and profitability objectives and the deterioration in the macro-economic environment andresulting effect on consumer demand have decreased the probability of realizing these objectives in the nearfuture. We remain committed to marketing and distributing Montrail-branded footwear through the outdoorspecialty, running specialty and sporting goods channels. Beginning in 2009, Pacific Trail products are soldprimarily through licensing arrangements.
Net Licensing Income: Net licensing income increased $2.4 million, or 40%, to $8.4 million in 2009 from$6.0 million in 2008. The increase in net licensing income was primarily due to increased apparel and footwearlicensing in the LAAP region. Products distributed by our licensees in 2009 included apparel, footwear, leatheraccessories, eyewear, socks, insulated products including soft-sided coolers, camping gear, bicycles, homeproducts, luggage, watches and other accessories.
Interest Income, Net: Interest income was $2.1 million in 2009 compared to $7.6 million in 2008. Thedecrease in interest income was almost entirely due to significantly lower interest rates in 2009 compared to2008. Interest expense was nominal in 2009 and 2008.
Income Tax Expense: Our provision for income taxes decreased to $22.8 million in 2009 from$31.2 million in 2008. This decrease resulted from lower income before tax, partially offset by an increase in oureffective income tax rate to 25.4% in 2009 compared to 24.7% in 2008. Our 2009 effective tax rate varied fromthe U.S. statutory rate due to foreign tax credits and the favorable settlement of uncertain tax positions.
Liquidity and Capital Resources
Our primary ongoing funding requirements are for working capital, investing activities associated with theexpansion of our global operations and general corporate needs. At December 31, 2010, we had total cash andcash equivalents of $234.3 million compared to $386.7 million at December 31, 2009. In addition, we had short-term investments of $68.8 million at December 31, 2010 compared to $22.8 million at December 31, 2009.
Net cash provided by operating activities was $23.5 million in 2010 compared to $214.4 million in 2009.The decrease in cash provided by operating activities was primarily the result of increases in inventory andaccounts receivable in 2010 compared to decreases in accounts receivable and inventory in 2009, partially offsetby increases in accounts payable and accrued liabilities in 2010 compared to a net decrease in accounts payableand accrued liabilities in 2009. The increase in inventory was due to a larger volume of excess fall 2010inventory designated for sale primarily through our own outlet retail stores compared to fall 2009 inventory,earlier receipt of spring 2011 inventory compared to spring 2010 inventory, increased 2010 replenishmentinventory compared to 2009 and incremental inventory to support increased direct-to-consumer sales. Theincrease in accounts receivable was in line with the 19% increase in net sales and was also due to an increase inclose-out product sales and shipment of spring 2011 advance orders close to the end of the 2010 period.
36

Net cash used in investing activities was $91.2 million in 2010 compared to net cash used in investingactivities of $33.2 million in 2009. For the 2010 period, net cash used in investing activities primarily consistedof $46.1 million for the net purchases of short-term investments, $28.8 million for capital expenditures and$16.3 million for acquisitions. For the 2009 period, net cash used in investing activities primarily consisted ofcapital expenditures of $33.1 million.
Net cash used in financing activities was $82.3 million in 2010 compared to $29.6 million in 2009. For the2010 period, net cash used in financing activities primarily consisted of dividend payments of $75.4 million,including a $50.5 million special dividend paid in December 2010, and the repurchase of common stock at anaggregate price of $13.8 million, partially offset by proceeds from issuance of common stock of $6.5 million. Forthe 2009 period, net cash used in financing activities included dividend payments of $22.3 million and therepurchase of common stock at an aggregate price of $7.4 million.
To fund our domestic working capital requirements, we have an unsecured, committed $125.0 millionrevolving line of credit available. We entered into this credit agreement effective June 15, 2010. AtDecember 31, 2010, no balance was outstanding under this line of credit and we were in compliance with allassociated covenants. Internationally, our subsidiaries have local currency operating lines of credit in placeguaranteed by the parent company with a combined limit of approximately $81.9 million at December 31, 2010,of which $3.4 million is designated as a European customs guarantee. At December 31, 2010, no balance wasoutstanding under these lines of credit.
We expect to fund our future capital expenditures with existing cash, operating cash flows and creditfacilities. If the need arises, we may need to seek additional funding. Our ability to obtain additional financingwill depend on many factors, including prevailing market conditions, our financial condition, and our ability tonegotiate favorable terms and conditions. Financing may not be available on terms that are acceptable orfavorable to us, if at all.
Our operations are affected by seasonal trends typical in the outdoor apparel industry, and have historicallyresulted in higher sales and profits in the third and fourth calendar quarters. This pattern has resulted primarilyfrom the timing of shipments of fall season products to wholesale customers and proportionally higher sales fromour direct-to-consumer operations in the fourth quarter. We believe that our liquidity requirements for at least thenext 12 months will be adequately covered by existing cash, cash provided by operations and existing short-termborrowing arrangements.
The following table presents our estimated contractual commitments (in thousands):
Year ended December 31,
2011 2012 2013 2014 2015 Thereafter Total
Inventory purchase obligations (1) . . . . . $323,327 $ — $ — $ — $ — $ — $323,327Operating leases (2): . . . . . . . . . . . . . . . . 34,115 31,244 29,031 25,332 23,649 110,415 253,786
(1) See Inventory Purchase Obligations in Note 13 of Notes to Consolidated Financial Statements.(2) See Operating Leases in Note 13 of Notes to Consolidated Financial Statements.
We have recorded liabilities for net unrecognized tax benefits related to income tax uncertainties in ourConsolidated Balance Sheet at December 31, 2010 of approximately $19.7 million; however, they have not beenincluded in the table above because we are uncertain about whether or when these amounts may be settled. SeeNote 10 of Notes to Consolidated Financial Statements.
37

Quantitative and Qualitative Disclosures About Market Risk
In the normal course of business, our financial position and results of operations are routinely subject to avariety of risks. These risks include risks associated with global financial and capital markets, primarily exchangerate risk and, to a lesser extent, interest rate risk and equity market risk. We regularly assess these risks and haveestablished policies and business practices designed to result in an appropriate level of protection against an adverseeffect of these risks. We do not engage in speculative trading in any financial or capital market.
Our primary exchange rate risk management objective is to mitigate the uncertainty of anticipated cashflows attributable to changes in exchange rates. We focus on mitigating changes in functional currencyequivalent cash flows resulting from anticipated U.S. dollar denominated inventory purchases by subsidiariesthat use European euros, Canadian dollars, Japanese yen or Korean won as their functional currency. We managethis risk primarily by using currency forward and option contracts. Additionally, we use foreign currency forwardand option contracts to hedge net balance sheet exposures related primarily to intercompany loan agreements andpayables.
The fair value of our hedging contracts was unfavorable by approximately $2.2 million and $0.4 million atDecember 31, 2010 and 2009, respectively. A 10% change in the euro, Canadian dollar, yen and won exchangerates would have resulted in the fair value fluctuating approximately $10.9 million at December 31, 2010 and$9.7 million at December 31, 2009. Changes in fair value resulting from foreign exchange rate fluctuationswould be substantially offset by the change in value of the underlying hedged transactions.
Our investments in fixed-rate bonds create an interest-rate risk exposure for us. Fluctuations in short-terminterest rates cause the fair values of these bonds to increase or decrease which in turn creates unrealized gain/losses in other comprehensive income. We do not currently mitigate this risk through the use of interest ratederivatives such as fixed-to-floating swaps. Despite classifying these as available-for-sale, we have the generalintent and ability to hold these investments to maturity. At December 31, 2010 we had $58.8 million carryingvalue of fixed-rate bonds. Unrealized gain/losses were not material.
Our negotiated credit facilities generally charge interest based on a benchmark rate such as the LondonInterbank Offered Rate (“LIBOR”). Fluctuations in short-term interest rates cause interest payments on drawnamounts to increase or decrease. At December 31, 2010, our credit facilities did not have an outstanding balance.
Critical Accounting Policies and Estimates
Management’s discussion and analysis of our financial condition and results of operations are based on ourconsolidated financial statements, which have been prepared in accordance with accounting principles generallyaccepted in the United States of America. The preparation of these financial statements requires us to makevarious estimates and assumptions that affect reported amounts of assets and liabilities and related disclosure ofcontingent assets and liabilities at the date of the consolidated financial statements and the reported amounts ofrevenue and expenses during the reporting period. We believe that the estimates and assumptions involved in theaccounting policies described below have the greatest potential impact on our financial statements, so weconsider these to be our critical accounting policies and estimates. Because of the uncertainty inherent in thesematters, actual results may differ from the estimates we use in applying the critical accounting policies. We baseour ongoing estimates on historical experience and other various assumptions that we believe to be reasonable inthe circumstances. Many of these critical accounting policies affect working capital account balances, includingthe policy for revenue recognition, the allowance for doubtful accounts, the provision for potential excess,closeout and slow moving inventory, product warranty, income taxes and stock-based compensation.
Management regularly discusses with our Audit Committee each of our critical accounting estimates, thedevelopment and selection of these accounting estimates, and the disclosure about each estimate inManagement’s Discussion and Analysis of Financial Condition and Results of Operations. These discussionstypically occur at our quarterly Audit Committee meetings and include the basis and methodology used in
38

developing and selecting these estimates, the trends in and amounts of these estimates, specific matters affectingthe amount of and changes in these estimates, and any other relevant matters related to these estimates, includingsignificant issues concerning accounting principles and financial statement presentation.
Revenue Recognition
We record wholesale, e-commerce and licensed product revenues when title passes and the risks andrewards of ownership have passed to the customer. Title generally passes upon shipment to or upon receipt by thecustomer depending on the terms of sale with the customer. Retail store revenues are recorded at the time of sale.
Where title passes upon receipt by the customer, predominantly in our Western European wholesalebusiness, precise information regarding the date of receipt by the customer is not readily available. In these cases,we estimate the date of receipt by the customer based on historical and expected delivery times by geographiclocation. We periodically test the accuracy of these estimates based on actual transactions. Delivery times varyby geographic location, generally from one to six days. To date, we have found these estimates to be materiallyaccurate.
At the time of revenue recognition, we also provide for estimated sales returns and miscellaneous claimsfrom customers as reductions to revenues. The estimates are based on historical rates of product returns andclaims. However, actual returns and claims in any future period are inherently uncertain and thus may differ fromthe estimates. If actual or expected future returns and claims are significantly greater or lower than the reservesthat we have established, we will record a reduction or increase to net revenues in the period in which we makesuch a determination.
Allowance for Uncollectible Accounts Receivable
We make ongoing estimates of the uncollectibility of our accounts receivable and maintain an allowance forestimated losses resulting from the inability of our customers to make required payments. In determining theamount of the allowance, we consider our historical level of credit losses and we make judgments about thecreditworthiness of customers based on ongoing credit evaluations. We analyze specific customer accounts,customer concentrations, credit insurance coverage, standby letters of credit, current economic trends, andchanges in customer payment terms. Continued uncertainty in credit and market conditions may slow ourcollection efforts if customers experience difficulty accessing credit and paying their obligations, leading tohigher than normal accounts receivable and increased bad debt expense. Because we cannot predict futurechanges in the financial stability of our customers, actual future losses from uncollectible accounts may differfrom our estimates and may have a material effect on our consolidated financial position, results of operations orcash flows. If the financial condition of our customers deteriorates and results in their inability to makepayments, a larger allowance may be required. If we determine that a smaller or larger allowance is appropriate,we will record a credit or a charge to SG&A expense in the period in which we make such a determination.
Inventory Obsolescence
We make ongoing estimates of potential future excess, close-out or slow moving inventory. We evaluate ourinventory on hand considering our purchase commitments, sales forecasts, and historical experience to identifyexcess, close-out or slow moving inventory and make provisions as necessary to properly reflect inventory valueat the lower of cost or estimated market value. If we determine that a smaller or larger reserve is appropriate, wewill record a credit or a charge to cost of sales in the period in which we make such a determination.
Product Warranty
We make ongoing estimates of potential future product warranty costs. When we evaluate our reserve forwarranty costs, we consider our historical claim rates by season, product mix, current economic trends, and the
39
historical cost to repair, replace, or refund the original sale. If we determine that a smaller or larger reserve isappropriate, we will record a credit or a charge to cost of sales in the period in which we make such adetermination.
Income Taxes
We use the asset and liability method of accounting for income taxes. Under this method, we recognizeincome tax expense for the amount of taxes payable or refundable for the current year and for the amount ofdeferred tax liabilities and assets for the future tax consequences of events that have been recognized in ourfinancial statements or tax returns. We make assumptions, judgments and estimates to determine our currentprovision for income taxes, our deferred tax assets and liabilities, and our uncertain tax positions. Our judgments,assumptions and estimates relative to the current provision for income tax take into account current tax laws, ourinterpretation of current tax laws and possible outcomes of current and future audits conducted by foreign anddomestic tax authorities. Changes in tax law or our interpretation of tax laws and the resolution of current andfuture tax audits could significantly affect the amounts provided for income taxes in our consolidated financialstatements. Our assumptions, judgments and estimates relative to the value of a deferred tax asset take intoaccount predictions of the amount and category of future taxable income. Actual operating results and theunderlying amount and category of income in future years could cause our current assumptions, judgments andestimates of recoverable net deferred taxes to be inaccurate. Changes in any of the assumptions, judgments andestimates mentioned above could cause our actual income tax obligations to differ from our estimates, whichcould materially affect our financial position and results of operations.
Our tax provision for interim periods is determined using an estimate of our annual effective tax rate,adjusted for discrete items, if any, that are taken into account in the relevant period. As the calendar yearprogresses, we periodically refine our estimate based on actual events and earnings by jurisdiction. This ongoingestimation process can result in changes to our expected effective tax rate for the full calendar year. When thisoccurs, we adjust the income tax provision during the quarter in which the change in estimate occurs so that ouryear-to-date provision equals our expected annual effective tax rate.
Stock-Based Compensation
Stock-based compensation cost is estimated at the grant date based on the award’s fair value and isrecognized as expense over the requisite service period using the straight-line attribution method. We estimatestock-based compensation for stock awards granted using the Black-Scholes option pricing model, whichrequires various highly subjective assumptions, including volatility and expected option life. Further, we estimateforfeitures for stock-based awards granted, which are not expected to vest. If any of these inputs or assumptionschanges significantly, stock-based compensation expense may differ materially in the future from that recordedin the current period.
Recent Accounting Pronouncements
See “Recent Accounting Pronouncements” in Note 2 to the notes to the consolidated financial statements.
40

Item 7A. QUANTITATIVE AND QUALITATIVE DISCLOSURES ABOUT MARKET RISK
The information required by this item is included in Management’s Discussion and Analysis of FinancialCondition and Results of Operations and is incorporated herein by this reference.
Item 8. FINANCIAL STATEMENTS AND SUPPLEMENTARY DATA
Our management is responsible for the information and representations contained in this report. Thefinancial statements have been prepared in conformity with accounting principles generally accepted in theUnited States of America, which we consider appropriate in the circumstances and include some amounts basedon our best estimates and judgments. Other financial information in this report is consistent with these financialstatements.
Our accounting systems include controls designed to reasonably assure that assets are safeguarded fromunauthorized use or disposition and which provide for the preparation of financial statements in conformity withaccounting principles generally accepted in the United States of America. These systems are supplemented by theselection and training of qualified financial personnel and an organizational structure providing for appropriatesegregation of duties.
The Audit Committee is responsible for recommending to the Board of Directors the appointment of theindependent registered public accounting firm and reviews with the independent registered public accountingfirm and management the scope and the results of the annual examination, the effectiveness of the accountingcontrol system and other matters relating to our financial affairs as they deem appropriate.
41

REPORT OF INDEPENDENT REGISTERED PUBLIC ACCOUNTING FIRM
To the Board of Directors and ShareholdersColumbia Sportswear CompanyPortland, Oregon
We have audited the accompanying consolidated balance sheets of Columbia Sportswear Company andsubsidiaries (the “Company”) as of December 31, 2010 and 2009, and the related consolidated statements ofoperations, shareholders’ equity and cash flows for each of the three years in the period ended December 31,2010. These financial statements are the responsibility of the Company’s management. Our responsibility is toexpress an opinion on these financial statements based on our audits.
We conducted our audits in accordance with the standards of the Public Company Accounting OversightBoard (United States). Those standards require that we plan and perform the audit to obtain reasonable assuranceabout whether the financial statements are free of material misstatement. An audit includes examining, on a testbasis, evidence supporting the amounts and disclosures in the financial statements. An audit also includesassessing the accounting principles used and significant estimates made by management, as well as evaluatingthe overall financial statement presentation. We believe that our audits provide a reasonable basis for ouropinion.
In our opinion, such consolidated financial statements present fairly, in all material respects, the financialposition of Columbia Sportswear Company and subsidiaries as of December 31, 2010 and 2009, and the resultsof their operations and their cash flows for each of the three years in the period ended December 31, 2010, inconformity with accounting principles generally accepted in the United States of America.
We have also audited, in accordance with the standards of the Public Company Accounting Oversight Board(United States), the Company’s internal control over financial reporting as of December 31, 2010, based on thecriteria established in Internal Control – Integrated Framework issued by the Committee of SponsoringOrganizations of the Treadway Commission, and our report dated March 11, 2011, expressed an unqualifiedopinion on the Company’s internal control over financial reporting.
DELOITTE & TOUCHE LLPPortland, OregonMarch 11, 2011
42
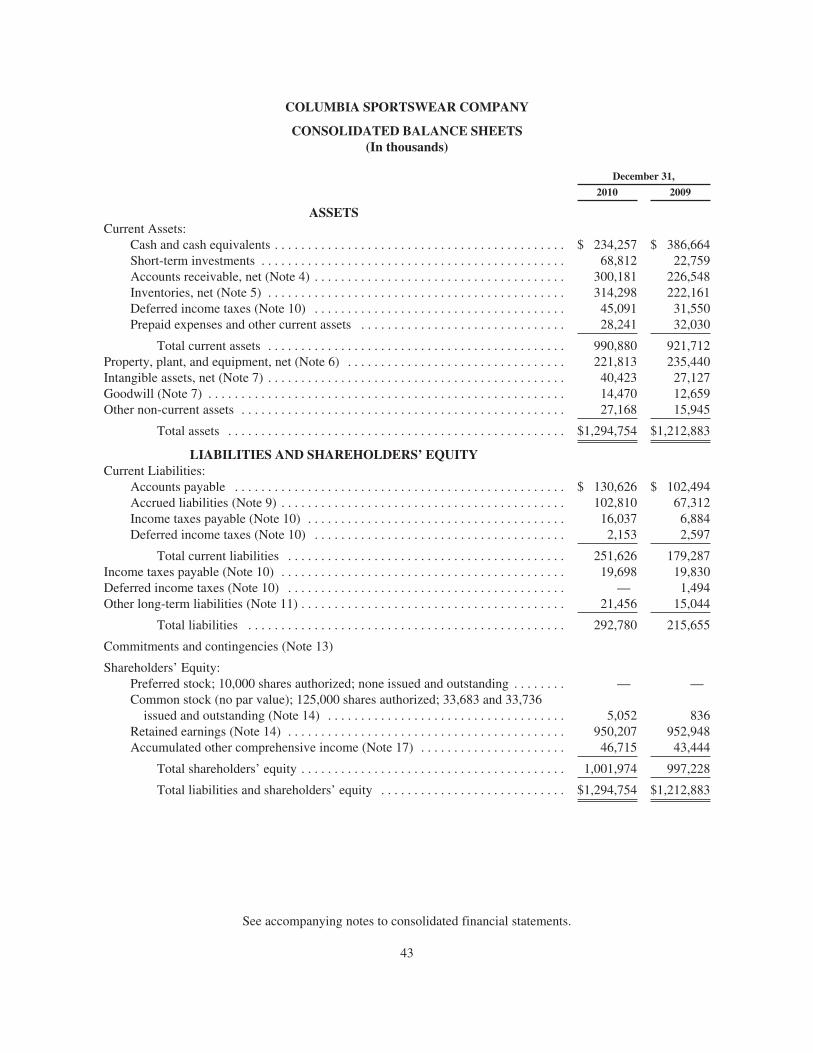
COLUMBIA SPORTSWEAR COMPANY
CONSOLIDATED BALANCE SHEETS(In thousands)
December 31,
2010 2009
ASSETSCurrent Assets:
Cash and cash equivalents . . . . . . . . . . . . . . . . . . . . . . . . . . . . . . . . . . . . . . . . . . . . $ 234,257 $ 386,664Short-term investments . . . . . . . . . . . . . . . . . . . . . . . . . . . . . . . . . . . . . . . . . . . . . . 68,812 22,759Accounts receivable, net (Note 4) . . . . . . . . . . . . . . . . . . . . . . . . . . . . . . . . . . . . . . 300,181 226,548Inventories, net (Note 5) . . . . . . . . . . . . . . . . . . . . . . . . . . . . . . . . . . . . . . . . . . . . . 314,298 222,161Deferred income taxes (Note 10) . . . . . . . . . . . . . . . . . . . . . . . . . . . . . . . . . . . . . . 45,091 31,550Prepaid expenses and other current assets . . . . . . . . . . . . . . . . . . . . . . . . . . . . . . . 28,241 32,030
Total current assets . . . . . . . . . . . . . . . . . . . . . . . . . . . . . . . . . . . . . . . . . . . . . 990,880 921,712Property, plant, and equipment, net (Note 6) . . . . . . . . . . . . . . . . . . . . . . . . . . . . . . . . . 221,813 235,440Intangible assets, net (Note 7) . . . . . . . . . . . . . . . . . . . . . . . . . . . . . . . . . . . . . . . . . . . . . 40,423 27,127Goodwill (Note 7) . . . . . . . . . . . . . . . . . . . . . . . . . . . . . . . . . . . . . . . . . . . . . . . . . . . . . . 14,470 12,659Other non-current assets . . . . . . . . . . . . . . . . . . . . . . . . . . . . . . . . . . . . . . . . . . . . . . . . . 27,168 15,945
Total assets . . . . . . . . . . . . . . . . . . . . . . . . . . . . . . . . . . . . . . . . . . . . . . . . . . . $1,294,754 $1,212,883
LIABILITIES AND SHAREHOLDERS’ EQUITYCurrent Liabilities:
Accounts payable . . . . . . . . . . . . . . . . . . . . . . . . . . . . . . . . . . . . . . . . . . . . . . . . . . $ 130,626 $ 102,494Accrued liabilities (Note 9) . . . . . . . . . . . . . . . . . . . . . . . . . . . . . . . . . . . . . . . . . . . 102,810 67,312Income taxes payable (Note 10) . . . . . . . . . . . . . . . . . . . . . . . . . . . . . . . . . . . . . . . 16,037 6,884Deferred income taxes (Note 10) . . . . . . . . . . . . . . . . . . . . . . . . . . . . . . . . . . . . . . 2,153 2,597
Total current liabilities . . . . . . . . . . . . . . . . . . . . . . . . . . . . . . . . . . . . . . . . . . 251,626 179,287Income taxes payable (Note 10) . . . . . . . . . . . . . . . . . . . . . . . . . . . . . . . . . . . . . . . . . . . 19,698 19,830Deferred income taxes (Note 10) . . . . . . . . . . . . . . . . . . . . . . . . . . . . . . . . . . . . . . . . . . — 1,494Other long-term liabilities (Note 11) . . . . . . . . . . . . . . . . . . . . . . . . . . . . . . . . . . . . . . . . 21,456 15,044
Total liabilities . . . . . . . . . . . . . . . . . . . . . . . . . . . . . . . . . . . . . . . . . . . . . . . . 292,780 215,655
Commitments and contingencies (Note 13)
Shareholders’ Equity:Preferred stock; 10,000 shares authorized; none issued and outstanding . . . . . . . . — —Common stock (no par value); 125,000 shares authorized; 33,683 and 33,736
issued and outstanding (Note 14) . . . . . . . . . . . . . . . . . . . . . . . . . . . . . . . . . . . . 5,052 836Retained earnings (Note 14) . . . . . . . . . . . . . . . . . . . . . . . . . . . . . . . . . . . . . . . . . . 950,207 952,948Accumulated other comprehensive income (Note 17) . . . . . . . . . . . . . . . . . . . . . . 46,715 43,444
Total shareholders’ equity . . . . . . . . . . . . . . . . . . . . . . . . . . . . . . . . . . . . . . . . 1,001,974 997,228
Total liabilities and shareholders’ equity . . . . . . . . . . . . . . . . . . . . . . . . . . . . $1,294,754 $1,212,883
See accompanying notes to consolidated financial statements.
43
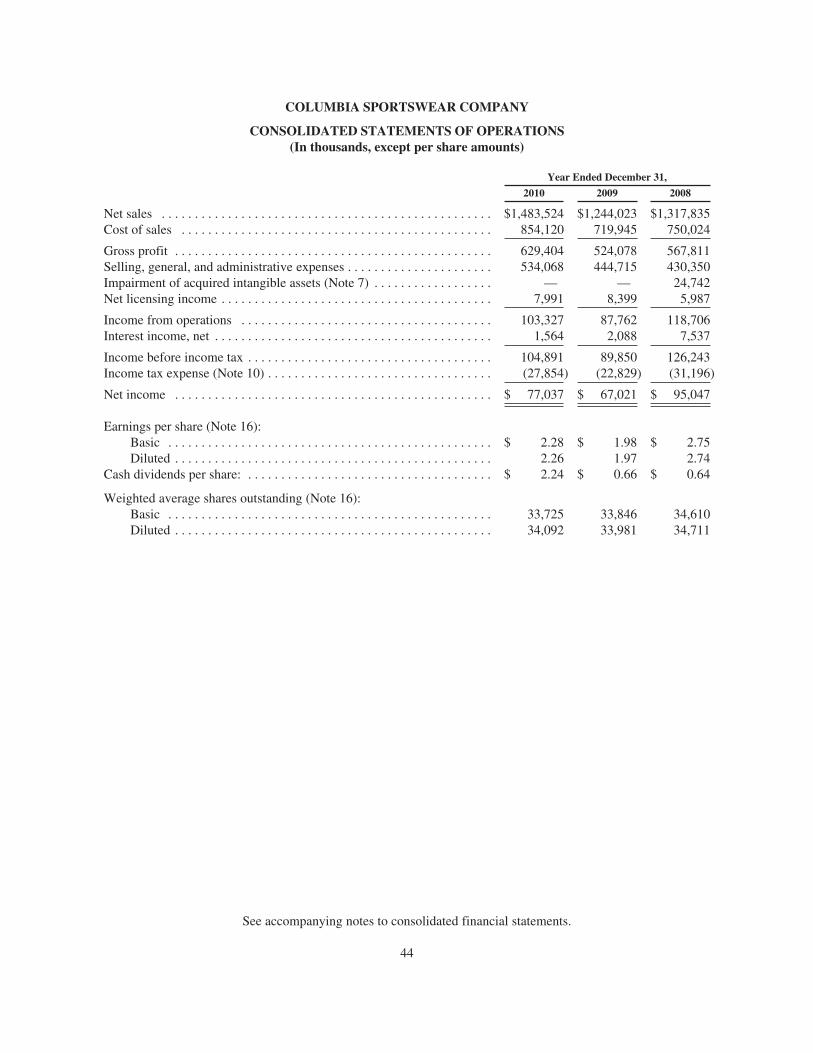
COLUMBIA SPORTSWEAR COMPANY
CONSOLIDATED STATEMENTS OF OPERATIONS(In thousands, except per share amounts)
Year Ended December 31,
2010 2009 2008
Net sales . . . . . . . . . . . . . . . . . . . . . . . . . . . . . . . . . . . . . . . . . . . . . . . . . . $1,483,524 $1,244,023 $1,317,835Cost of sales . . . . . . . . . . . . . . . . . . . . . . . . . . . . . . . . . . . . . . . . . . . . . . . 854,120 719,945 750,024
Gross profit . . . . . . . . . . . . . . . . . . . . . . . . . . . . . . . . . . . . . . . . . . . . . . . . 629,404 524,078 567,811Selling, general, and administrative expenses . . . . . . . . . . . . . . . . . . . . . . 534,068 444,715 430,350Impairment of acquired intangible assets (Note 7) . . . . . . . . . . . . . . . . . . — — 24,742Net licensing income . . . . . . . . . . . . . . . . . . . . . . . . . . . . . . . . . . . . . . . . . 7,991 8,399 5,987
Income from operations . . . . . . . . . . . . . . . . . . . . . . . . . . . . . . . . . . . . . . 103,327 87,762 118,706Interest income, net . . . . . . . . . . . . . . . . . . . . . . . . . . . . . . . . . . . . . . . . . . 1,564 2,088 7,537
Income before income tax . . . . . . . . . . . . . . . . . . . . . . . . . . . . . . . . . . . . . 104,891 89,850 126,243Income tax expense (Note 10) . . . . . . . . . . . . . . . . . . . . . . . . . . . . . . . . . . (27,854) (22,829) (31,196)
Net income . . . . . . . . . . . . . . . . . . . . . . . . . . . . . . . . . . . . . . . . . . . . . . . . $ 77,037 $ 67,021 $ 95,047
Earnings per share (Note 16):Basic . . . . . . . . . . . . . . . . . . . . . . . . . . . . . . . . . . . . . . . . . . . . . . . . . $ 2.28 $ 1.98 $ 2.75Diluted . . . . . . . . . . . . . . . . . . . . . . . . . . . . . . . . . . . . . . . . . . . . . . . . 2.26 1.97 2.74
Cash dividends per share: . . . . . . . . . . . . . . . . . . . . . . . . . . . . . . . . . . . . . $ 2.24 $ 0.66 $ 0.64
Weighted average shares outstanding (Note 16):Basic . . . . . . . . . . . . . . . . . . . . . . . . . . . . . . . . . . . . . . . . . . . . . . . . . 33,725 33,846 34,610Diluted . . . . . . . . . . . . . . . . . . . . . . . . . . . . . . . . . . . . . . . . . . . . . . . . 34,092 33,981 34,711
See accompanying notes to consolidated financial statements.
44
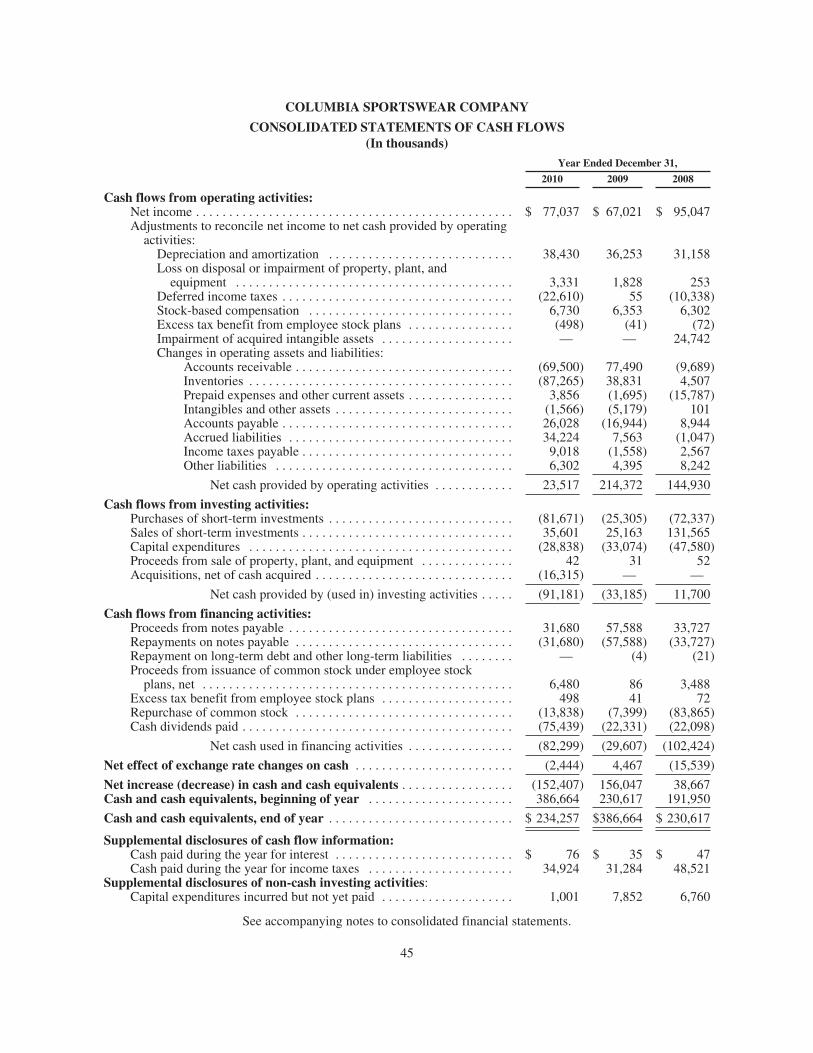
COLUMBIA SPORTSWEAR COMPANY
CONSOLIDATED STATEMENTS OF CASH FLOWS(In thousands)
Year Ended December 31,
2010 2009 2008
Cash flows from operating activities:Net income . . . . . . . . . . . . . . . . . . . . . . . . . . . . . . . . . . . . . . . . . . . . . . . . $ 77,037 $ 67,021 $ 95,047Adjustments to reconcile net income to net cash provided by operating
activities:Depreciation and amortization . . . . . . . . . . . . . . . . . . . . . . . . . . . . 38,430 36,253 31,158Loss on disposal or impairment of property, plant, and
equipment . . . . . . . . . . . . . . . . . . . . . . . . . . . . . . . . . . . . . . . . . . 3,331 1,828 253Deferred income taxes . . . . . . . . . . . . . . . . . . . . . . . . . . . . . . . . . . . (22,610) 55 (10,338)Stock-based compensation . . . . . . . . . . . . . . . . . . . . . . . . . . . . . . . 6,730 6,353 6,302Excess tax benefit from employee stock plans . . . . . . . . . . . . . . . . (498) (41) (72)Impairment of acquired intangible assets . . . . . . . . . . . . . . . . . . . . — — 24,742Changes in operating assets and liabilities:
Accounts receivable . . . . . . . . . . . . . . . . . . . . . . . . . . . . . . . . . (69,500) 77,490 (9,689)Inventories . . . . . . . . . . . . . . . . . . . . . . . . . . . . . . . . . . . . . . . . (87,265) 38,831 4,507Prepaid expenses and other current assets . . . . . . . . . . . . . . . . 3,856 (1,695) (15,787)Intangibles and other assets . . . . . . . . . . . . . . . . . . . . . . . . . . . (1,566) (5,179) 101Accounts payable . . . . . . . . . . . . . . . . . . . . . . . . . . . . . . . . . . . 26,028 (16,944) 8,944Accrued liabilities . . . . . . . . . . . . . . . . . . . . . . . . . . . . . . . . . . 34,224 7,563 (1,047)Income taxes payable . . . . . . . . . . . . . . . . . . . . . . . . . . . . . . . . 9,018 (1,558) 2,567Other liabilities . . . . . . . . . . . . . . . . . . . . . . . . . . . . . . . . . . . . 6,302 4,395 8,242
Net cash provided by operating activities . . . . . . . . . . . . 23,517 214,372 144,930
Cash flows from investing activities:Purchases of short-term investments . . . . . . . . . . . . . . . . . . . . . . . . . . . . (81,671) (25,305) (72,337)Sales of short-term investments . . . . . . . . . . . . . . . . . . . . . . . . . . . . . . . . 35,601 25,163 131,565Capital expenditures . . . . . . . . . . . . . . . . . . . . . . . . . . . . . . . . . . . . . . . . (28,838) (33,074) (47,580)Proceeds from sale of property, plant, and equipment . . . . . . . . . . . . . . 42 31 52Acquisitions, net of cash acquired . . . . . . . . . . . . . . . . . . . . . . . . . . . . . . (16,315) — —
Net cash provided by (used in) investing activities . . . . . (91,181) (33,185) 11,700
Cash flows from financing activities:Proceeds from notes payable . . . . . . . . . . . . . . . . . . . . . . . . . . . . . . . . . . 31,680 57,588 33,727Repayments on notes payable . . . . . . . . . . . . . . . . . . . . . . . . . . . . . . . . . (31,680) (57,588) (33,727)Repayment on long-term debt and other long-term liabilities . . . . . . . . — (4) (21)Proceeds from issuance of common stock under employee stock
plans, net . . . . . . . . . . . . . . . . . . . . . . . . . . . . . . . . . . . . . . . . . . . . . . . 6,480 86 3,488Excess tax benefit from employee stock plans . . . . . . . . . . . . . . . . . . . . 498 41 72Repurchase of common stock . . . . . . . . . . . . . . . . . . . . . . . . . . . . . . . . . (13,838) (7,399) (83,865)Cash dividends paid . . . . . . . . . . . . . . . . . . . . . . . . . . . . . . . . . . . . . . . . . (75,439) (22,331) (22,098)
Net cash used in financing activities . . . . . . . . . . . . . . . . (82,299) (29,607) (102,424)
Net effect of exchange rate changes on cash . . . . . . . . . . . . . . . . . . . . . . . . (2,444) 4,467 (15,539)
Net increase (decrease) in cash and cash equivalents . . . . . . . . . . . . . . . . . (152,407) 156,047 38,667Cash and cash equivalents, beginning of year . . . . . . . . . . . . . . . . . . . . . . 386,664 230,617 191,950
Cash and cash equivalents, end of year . . . . . . . . . . . . . . . . . . . . . . . . . . . . $ 234,257 $386,664 $ 230,617
Supplemental disclosures of cash flow information:Cash paid during the year for interest . . . . . . . . . . . . . . . . . . . . . . . . . . . $ 76 $ 35 $ 47Cash paid during the year for income taxes . . . . . . . . . . . . . . . . . . . . . . 34,924 31,284 48,521
Supplemental disclosures of non-cash investing activities:Capital expenditures incurred but not yet paid . . . . . . . . . . . . . . . . . . . . 1,001 7,852 6,760
See accompanying notes to consolidated financial statements.
45
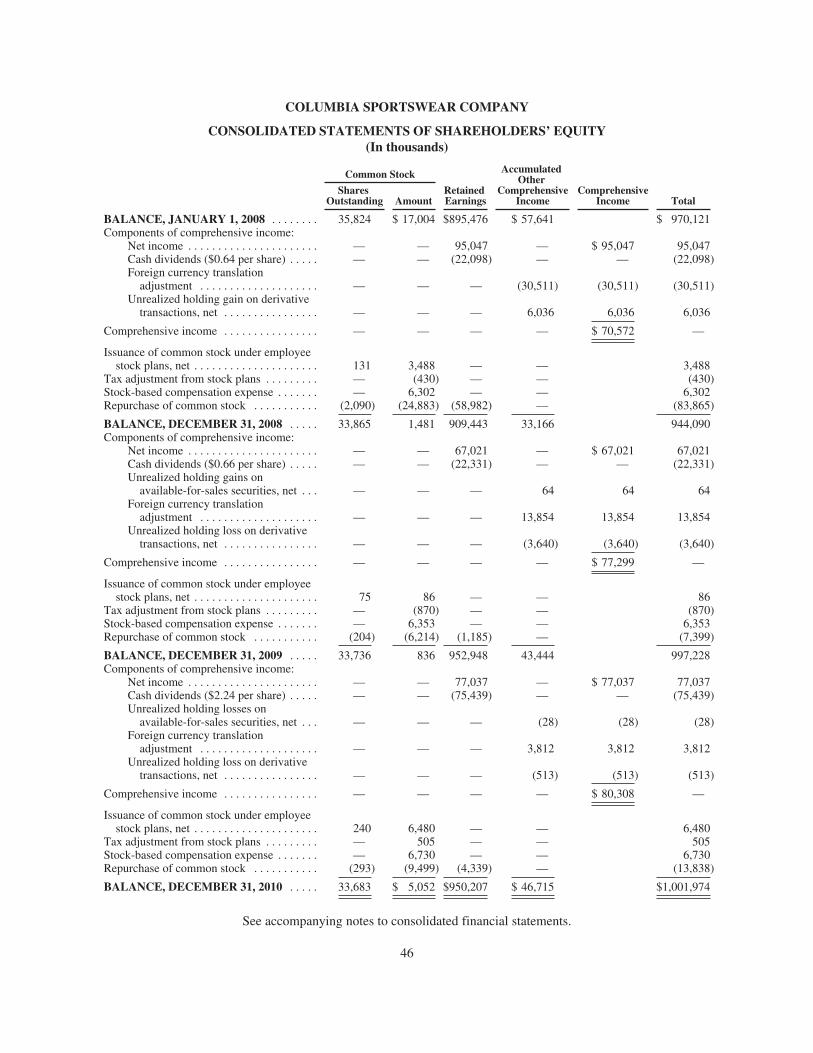
COLUMBIA SPORTSWEAR COMPANY
CONSOLIDATED STATEMENTS OF SHAREHOLDERS’ EQUITY(In thousands)
Common Stock
RetainedEarnings
AccumulatedOther
ComprehensiveIncome
ComprehensiveIncome Total
SharesOutstanding Amount
BALANCE, JANUARY 1, 2008 . . . . . . . . 35,824 $ 17,004 $895,476 $ 57,641 $ 970,121Components of comprehensive income:
Net income . . . . . . . . . . . . . . . . . . . . . . — — 95,047 — $ 95,047 95,047Cash dividends ($0.64 per share) . . . . . — — (22,098) — — (22,098)Foreign currency translation
adjustment . . . . . . . . . . . . . . . . . . . . — — — (30,511) (30,511) (30,511)Unrealized holding gain on derivative
transactions, net . . . . . . . . . . . . . . . . — — — 6,036 6,036 6,036
Comprehensive income . . . . . . . . . . . . . . . . — — — — $ 70,572 —
Issuance of common stock under employeestock plans, net . . . . . . . . . . . . . . . . . . . . . 131 3,488 — — 3,488
Tax adjustment from stock plans . . . . . . . . . — (430) — — (430)Stock-based compensation expense . . . . . . . — 6,302 — — 6,302Repurchase of common stock . . . . . . . . . . . (2,090) (24,883) (58,982) — (83,865)
BALANCE, DECEMBER 31, 2008 . . . . . 33,865 1,481 909,443 33,166 944,090Components of comprehensive income:
Net income . . . . . . . . . . . . . . . . . . . . . . — — 67,021 — $ 67,021 67,021Cash dividends ($0.66 per share) . . . . . — — (22,331) — — (22,331)Unrealized holding gains on
available-for-sales securities, net . . . — — — 64 64 64Foreign currency translation
adjustment . . . . . . . . . . . . . . . . . . . . — — — 13,854 13,854 13,854Unrealized holding loss on derivative
transactions, net . . . . . . . . . . . . . . . . — — — (3,640) (3,640) (3,640)
Comprehensive income . . . . . . . . . . . . . . . . — — — — $ 77,299 —
Issuance of common stock under employeestock plans, net . . . . . . . . . . . . . . . . . . . . . 75 86 — — 86
Tax adjustment from stock plans . . . . . . . . . — (870) — — (870)Stock-based compensation expense . . . . . . . — 6,353 — — 6,353Repurchase of common stock . . . . . . . . . . . (204) (6,214) (1,185) — (7,399)
BALANCE, DECEMBER 31, 2009 . . . . . 33,736 836 952,948 43,444 997,228Components of comprehensive income:
Net income . . . . . . . . . . . . . . . . . . . . . . — — 77,037 — $ 77,037 77,037Cash dividends ($2.24 per share) . . . . . — — (75,439) — — (75,439)Unrealized holding losses on
available-for-sales securities, net . . . — — — (28) (28) (28)Foreign currency translation
adjustment . . . . . . . . . . . . . . . . . . . . — — — 3,812 3,812 3,812Unrealized holding loss on derivative
transactions, net . . . . . . . . . . . . . . . . — — — (513) (513) (513)
Comprehensive income . . . . . . . . . . . . . . . . — — — — $ 80,308 —
Issuance of common stock under employeestock plans, net . . . . . . . . . . . . . . . . . . . . . 240 6,480 — — 6,480
Tax adjustment from stock plans . . . . . . . . . — 505 — — 505Stock-based compensation expense . . . . . . . — 6,730 — — 6,730Repurchase of common stock . . . . . . . . . . . (293) (9,499) (4,339) — (13,838)
BALANCE, DECEMBER 31, 2010 . . . . . 33,683 $ 5,052 $950,207 $ 46,715 $1,001,974
See accompanying notes to consolidated financial statements.
46
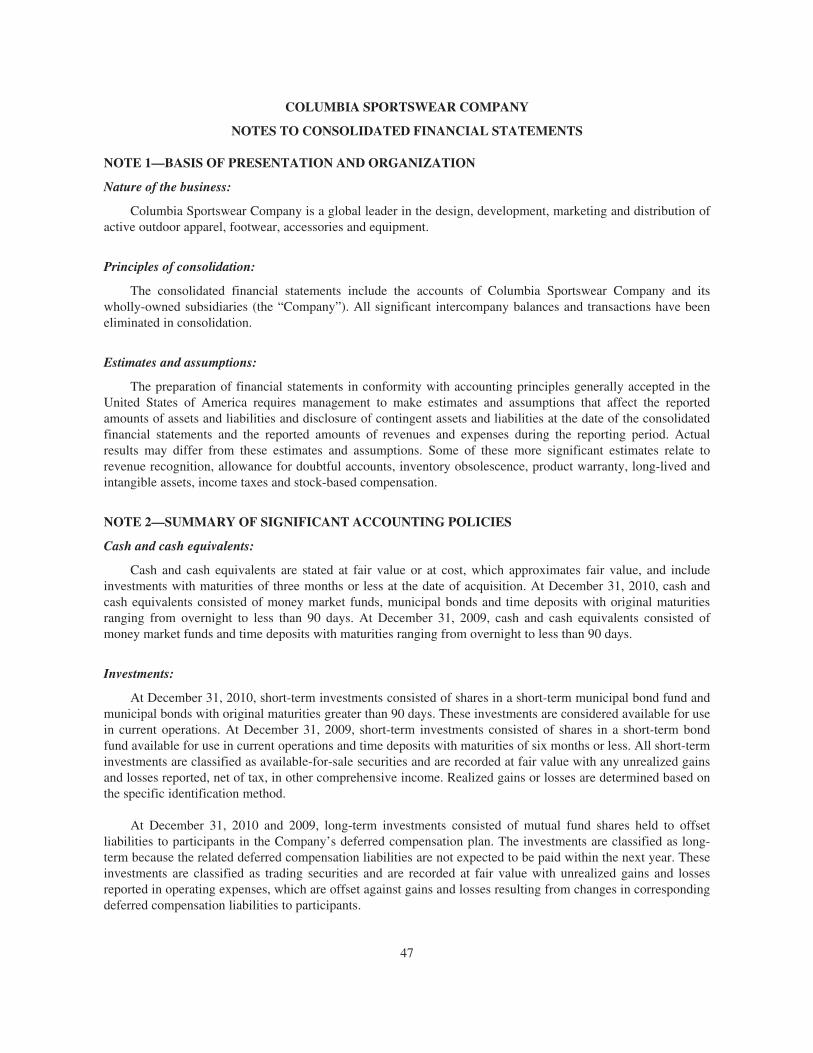
COLUMBIA SPORTSWEAR COMPANY
NOTES TO CONSOLIDATED FINANCIAL STATEMENTS
NOTE 1—BASIS OF PRESENTATION AND ORGANIZATION
Nature of the business:
Columbia Sportswear Company is a global leader in the design, development, marketing and distribution ofactive outdoor apparel, footwear, accessories and equipment.
Principles of consolidation:
The consolidated financial statements include the accounts of Columbia Sportswear Company and itswholly-owned subsidiaries (the “Company”). All significant intercompany balances and transactions have beeneliminated in consolidation.
Estimates and assumptions:
The preparation of financial statements in conformity with accounting principles generally accepted in theUnited States of America requires management to make estimates and assumptions that affect the reportedamounts of assets and liabilities and disclosure of contingent assets and liabilities at the date of the consolidatedfinancial statements and the reported amounts of revenues and expenses during the reporting period. Actualresults may differ from these estimates and assumptions. Some of these more significant estimates relate torevenue recognition, allowance for doubtful accounts, inventory obsolescence, product warranty, long-lived andintangible assets, income taxes and stock-based compensation.
NOTE 2—SUMMARY OF SIGNIFICANT ACCOUNTING POLICIES
Cash and cash equivalents:
Cash and cash equivalents are stated at fair value or at cost, which approximates fair value, and includeinvestments with maturities of three months or less at the date of acquisition. At December 31, 2010, cash andcash equivalents consisted of money market funds, municipal bonds and time deposits with original maturitiesranging from overnight to less than 90 days. At December 31, 2009, cash and cash equivalents consisted ofmoney market funds and time deposits with maturities ranging from overnight to less than 90 days.
Investments:
At December 31, 2010, short-term investments consisted of shares in a short-term municipal bond fund andmunicipal bonds with original maturities greater than 90 days. These investments are considered available for usein current operations. At December 31, 2009, short-term investments consisted of shares in a short-term bondfund available for use in current operations and time deposits with maturities of six months or less. All short-terminvestments are classified as available-for-sale securities and are recorded at fair value with any unrealized gainsand losses reported, net of tax, in other comprehensive income. Realized gains or losses are determined based onthe specific identification method.
At December 31, 2010 and 2009, long-term investments consisted of mutual fund shares held to offsetliabilities to participants in the Company’s deferred compensation plan. The investments are classified as long-term because the related deferred compensation liabilities are not expected to be paid within the next year. Theseinvestments are classified as trading securities and are recorded at fair value with unrealized gains and lossesreported in operating expenses, which are offset against gains and losses resulting from changes in correspondingdeferred compensation liabilities to participants.
47

COLUMBIA SPORTSWEAR COMPANY
NOTES TO CONSOLIDATED FINANCIAL STATEMENTS—(Continued)
Accounts receivable:
Accounts receivable have been reduced by an allowance for doubtful accounts. The Company makesongoing estimates of the uncollectibility of accounts receivable and maintains an allowance for estimated lossesresulting from the inability of the Company’s customers to make required payments.
Inventories:
Inventories are carried at the lower of cost or market. Cost is determined using the first-in, first-out method.The Company periodically reviews its inventories for excess, close-out or slow moving items and makesprovisions as necessary to properly reflect inventory value.
Property, plant, and equipment:
Property, plant and equipment are stated at cost, net of accumulated depreciation. Depreciation is providedusing the straight-line method over the estimated useful lives of the assets. The principal estimated useful livesare: buildings and building improvements, 15-30 years; land improvements, 15 years; furniture and fixtures, 3-10years; and machinery and equipment, 3-5 years. Leasehold improvements are depreciated over the lesser of theestimated useful life of the improvement, which is most commonly 7 years, or the remaining term of theunderlying lease.
Improvements to property, plant and equipment that substantially extend the useful life of the asset arecapitalized. Repair and maintenance costs are expensed as incurred. Internal and external costs directly related tothe development of internal-use software during the application development stage, including costs incurred forthird party contractors and employee compensation, are capitalized and depreciated over a 3-7 year estimateduseful life.
Impairment of long-lived assets:
Long-lived assets are amortized over their useful lives and are measured for impairment only when eventsor circumstances indicate the carrying value may be impaired. In these cases, the Company estimates the futureundiscounted cash flows to be derived from the asset or asset group to determine whether a potential impairmentexists. When reviewing for retail store impairment, identifiable cash flows are measured at the individual storelevel. If the sum of the estimated undiscounted cash flows is less than the carrying value of the asset, theCompany recognizes an impairment loss, measured as the amount by which the carrying value exceeds theestimated fair value of the asset. Impairment charges for long-lived assets are included in selling, general andadministrative (“SG&A”) expense and were immaterial for the years ended December 31, 2010, 2009 and 2008.
Intangible assets and goodwill:
Goodwill and intangible assets with indefinite useful lives are not amortized but are periodically evaluatedfor impairment. Intangible assets that are determined to have finite lives are amortized using the straight-linemethod over their useful lives and are measured for impairment only when events or circumstances indicate thecarrying value may be impaired.
Impairment of goodwill and intangible assets:
The Company reviews and tests its goodwill and intangible assets with indefinite useful lives forimpairment in the fourth quarter of each year and when events or changes in circumstances indicate that thecarrying amount of such assets may be impaired. The Company’s intangible assets with indefinite lives consist of
48
COLUMBIA SPORTSWEAR COMPANY
NOTES TO CONSOLIDATED FINANCIAL STATEMENTS—(Continued)
trademarks and trade names. Substantially all of the Company’s goodwill is recorded in the United Statessegment and impairment testing for goodwill is performed at the reporting unit level. In the impairment test forgoodwill, the two-step process first compares the estimated fair value of the reporting unit with the carryingamount of that reporting unit. The Company estimates the fair value of its reporting units using a combination ofdiscounted cash flow analysis, comparisons with the market values of similar publicly traded companies andother operating performance based valuation methods. If step one indicates impairment, step two compares theestimated fair value of the reporting unit to the estimated fair value of all reporting unit assets and liabilitiesexcept goodwill to determine the implied fair value of goodwill. The Company calculates impairment as theexcess of carrying amount of goodwill over the implied fair value of goodwill. In the impairment test fortrademarks, the Company compares the estimated fair value of the asset to the carrying amount. The fair value oftrademarks is estimated using the relief from royalty approach, a standard form of discounted cash flow analysisused in the valuation of trademarks. If the carrying amount of trademarks exceeds the estimated fair value, theCompany calculates impairment as the excess of carrying amount over the estimate of fair value.
If events or circumstances indicate the carrying value of intangible assets with finite lives may be impaired,the Company estimates the future undiscounted cash flows to be derived from the asset or asset group todetermine whether a potential impairment exists. If the sum of the estimated undiscounted cash flows is less thanthe carrying value of the asset the Company recognizes an impairment loss, measured as the amount by which thecarrying value exceeds the estimated fair value of the asset.
Impairment charges are classified as a component of SG&A expense. The fair value estimates are based ona number of factors, including assumptions and estimates for projected sales, income, cash flows, discount ratesand other operating performance measures. Changes in estimates or the application of alternative assumptionscould produce significantly different results. These assumptions and estimates may change in the future due tochanges in economic conditions, changes in the Company’s ability to meet sales and profitability objectives orchanges in the Company’s business operations or strategic direction.
Income taxes:
Income taxes are provided on financial statement earnings for financial reporting purposes. Income taxes arebased on amounts of taxes payable or refundable in the current year and on expected future tax consequences ofevents that are recognized in the financial statements in different periods than they are recognized in tax returns.As a result of timing of recognition and measurement differences between financial accounting standards andincome tax laws, temporary differences arise between amounts of pre-tax financial statement income and taxableincome and between reported amounts of assets and liabilities in the Consolidated Balance Sheets and theirrespective tax bases. Deferred income tax assets and liabilities reported in the Consolidated Balance Sheetsreflect estimated future tax effects attributable to these temporary differences and to net operating loss and netcapital loss carryforwards, based on tax rates expected to be in effect for years in which the differences areexpected to be settled or realized. Realization of deferred tax assets is dependent on future taxable income inspecific jurisdictions. Valuation allowances are used to reduce deferred tax assets to amounts considered likely tobe realized. U.S. deferred income taxes are not provided on undistributed income of foreign subsidiaries wheresuch earnings are considered to be permanently invested, or to the extent such recognition would result in adeferred tax asset.
Accrued income taxes in the Consolidated Balance Sheets include unrecognized income tax benefits relatingto uncertain tax positions, including related interest and penalties, appropriately classified as current ornoncurrent. The Company recognizes the tax benefit from an uncertain tax position if it is more likely than notthat the tax position will be sustained on examination by the relevant taxing authority based on the technicalmerits of the position. The tax benefits recognized in the financial statements from such positions are then
49
COLUMBIA SPORTSWEAR COMPANY
NOTES TO CONSOLIDATED FINANCIAL STATEMENTS—(Continued)
measured based on the largest benefit that has a greater than 50% likelihood of being realized upon ultimatesettlement with the relevant tax authority. In making this determination, the Company assumes that the taxingauthority will examine the position and that they will have full knowledge of all relevant information. Theprovision for income taxes also includes estimates of interest and penalties related to uncertain tax positions.
Derivatives:
The effective portion of changes in fair values of outstanding cash flow hedges are recorded in othercomprehensive income until earnings are affected by the hedged transaction. In most cases amounts recorded inother comprehensive income will be released to earnings some time after maturity of the related derivative. TheConsolidated Statement of Operations classification of effective hedge results is the same as that of theunderlying exposure. Results of hedges of product costs are recorded in cost of sales when the underlying hedgedtransaction affects earnings. Unrealized derivative gains and losses, which are recorded in current assets andliabilities, respectively, are non-cash items and therefore are taken into account in the preparation of theConsolidated Statement of Cash Flows based on their respective balance sheet classifications. See Note 19 formore information on derivatives and risk management.
Foreign currency translation:
The assets and liabilities of the Company’s foreign subsidiaries have been translated into U.S. dollars usingthe exchange rates in effect at period end, and the net sales and expenses have been translated into U.S. dollarsusing average exchange rates in effect during the period. The foreign currency translation adjustments areincluded as a separate component of accumulated other comprehensive income in shareholders’ equity and arenot currently adjusted for income taxes when they relate to indefinite net investments in non-U.S. operations.
Revenue recognition:
The Company records wholesale, e-commerce and licensed product revenues when title passes and the risksand rewards of ownership have passed to the customer. Title generally passes upon shipment to, or upon receiptby, the customer depending on the terms of sale with the customer. Retail store revenues are recorded at the timeof sale.
In some countries outside of the United States where title passes upon receipt by the customer,predominantly in the Company’s Western European wholesale business, precise information regarding the dateof receipt by the customer is not readily available. In these cases, the Company estimates the date of receipt bythe customer based on historical and expected delivery times by geographic location. The Company periodicallytests the accuracy of these estimates based on actual transactions. Delivery times vary by geographic location,generally from one to six days. To date, the Company has found these estimates to be materially accurate.
At the time of revenue recognition, the Company also provides for estimated sales returns andmiscellaneous claims from customers as reductions to revenues. The estimates are based on historical rates ofproduct returns and claims. However, actual returns and claims in any future period are inherently uncertain andthus may differ from the estimates. If actual or expected future returns and claims are significantly greater orlower than the reserves that had been established, the Company would record a reduction or increase to netrevenues in the period in which it made such determination. For each of the years in the three year period endedDecember 31, 2010, the Company’s actual annual sales returns and miscellaneous claims from customers haveaveraged approximately three percent of net sales. The allowance for outstanding sales returns and miscellaneousclaims from customers was approximately $20,737,000 and $13,889,000 as of December 31, 2010 and 2009,respectively.
50

COLUMBIA SPORTSWEAR COMPANY
NOTES TO CONSOLIDATED FINANCIAL STATEMENTS—(Continued)
Cost of sales:
The expenses that are included in cost of sales include all direct product and conversion-related costs, andcosts related to shipping, duties and importation. Specific provisions for excess, close-out or slow movinginventory are also included in cost of sales. In addition, some of the Company’s products carry limited warrantyprovisions for defects in quality and workmanship. A warranty reserve is established at the time of sale to coverestimated costs based on the Company’s history of warranty repairs and replacements and is recorded in cost ofsales.
Selling, general and administrative expense:
Selling, general and administrative expense consists of commissions, advertising, other selling costs,personnel-related costs, planning, receiving finished goods, warehousing, depreciation and other generaloperating expenses.
Shipping and handling costs:
Shipping and handling fees billed to customers are recorded as revenue. The direct costs associated withshipping goods to customers are recorded as cost of sales. Inventory planning, receiving and handling costs arerecorded as a component of SG&A expenses and were $57,901,000, $55,867,000 and $57,700,000 for the yearsended December 31, 2010, 2009 and 2008, respectively.
Stock-based compensation:
Stock-based compensation cost is estimated at the grant date based on the award’s fair value and isrecognized as expense over the requisite service period using the straight-line attribution method. The Companyestimates stock-based compensation for stock options granted using the Black-Scholes option pricing model,which requires various highly subjective assumptions, including volatility and expected option life. Further, theCompany estimates forfeitures for stock-based awards granted which are not expected to vest. If any of theseinputs or assumptions changes significantly, stock-based compensation expense may differ materially in thefuture from that recorded in the current period. Assumptions are evaluated and revised as necessary to reflectchanges in market conditions and the Company’s experience. Estimates of fair value are not intended to predictactual future events or the value ultimately realized by people who receive equity awards. The fair value ofservice-based and performance-based restricted stock units is discounted by the present value of the estimatedfuture stream of dividends over the vesting period using the Black-Scholes model.
Advertising costs:
Advertising costs are expensed in the period incurred and are included in selling, general and administrativeexpenses. Total advertising expense, including cooperative advertising costs, was $77,978,000, $65,204,000 and$72,237,000 for the years ended December 31, 2010, 2009 and 2008, respectively.
Through cooperative advertising programs, the Company reimburses its wholesale customers for some oftheir costs of advertising the Company’s products based on various criteria, including the value of purchasesfrom the Company and various advertising specifications. Cooperative advertising costs are included in expensesbecause the Company receives an identifiable benefit in exchange for the cost, the advertising may be obtainedfrom a party other than the customer, and the fair value of the advertising benefit can be reasonably estimated.Cooperative advertising costs were $7,259,000, $10,978,000 and $16,351,000 for the years ended December 31,2010, 2009 and 2008, respectively.
51

COLUMBIA SPORTSWEAR COMPANY
NOTES TO CONSOLIDATED FINANCIAL STATEMENTS—(Continued)
Recent Accounting Pronouncements:
In January 2010, the Financial Accounting Standards Board (“FASB”) issued Accounting Standards Update(“ASU”) 2010-06, Improving Disclosures about Fair Value Measurements. ASU 2010-06 requires additionaldisclosures about fair value measurements including transfers in and out of Levels 1 and 2 and a higher level ofdisaggregation for the different types of financial instruments. For the reconciliation of Level 3 fair valuemeasurements, information about purchases, sales, issuances and settlements are presented separately. Thisstandard is effective for interim and annual reporting periods beginning after December 15, 2009 with theexception of revised Level 3 disclosure requirements, which are effective for interim and annual reportingperiods beginning after December 15, 2010. The adoption of this standard did not have a material effect on theCompany’s consolidated financial position, statement of operations or cash flows. See Note 20.
NOTE 3—CONCENTRATIONS
Cash and Cash Equivalents
At December 31, 2010, approximately 70% of the Company’s cash and cash equivalents were concentratedin domestic and international money market mutual funds. All of the Company’s money market mutual fundswere assigned top-tier investment grade credit ratings.
Short-term Investments
At December 31, 2010, approximately 77% of the Company’s short-term investments were concentrated inshort-term municipal debt securities whose interest and principal payments were 100% collateralized in anescrow account by U.S. Treasury Securities, U.S. Government Securities or U.S. Government Agency Securities,and approximately 23% were invested in a short-term municipal bond fund.
Trade Receivables
At December 31, 2010 and 2009, the Company had one customer in its Canadian segment that accounted forapproximately 11.9% and 15.5% of consolidated accounts receivable, respectively. No single customer accountedfor 10% or more of consolidated revenues for any of the years ended December 31, 2010, 2009 or 2008.
Derivatives
The Company uses derivative instruments primarily to hedge the exchange rate risk of anticipatedtransactions denominated in non-functional currencies that are designated and qualify as cash flow hedges. Fromtime to time, the Company also uses derivative instruments to economically hedge the exchange rate risk ofcertain investment positions, to hedge balance sheet re-measurement risk and to hedge other anticipatedtransactions that do not qualify as cash flow hedges. At December 31, 2010, the Company’s derivative contractshad a remaining maturity of approximately two years or less. All the counterparties to these transactions hadinvestment grade short-term credit ratings. The maximum net exposure to any single counterparty, which isgenerally limited to the aggregate unrealized gain of all contracts with that counterparty, was less than$1,000,000 at December 31, 2010. The majority of the Company’s derivative counterparties have strong creditratings and as a result, the Company does not require collateral to facilitate transactions. See Note 19 for furtherdisclosures concerning derivatives.
52
COLUMBIA SPORTSWEAR COMPANY
NOTES TO CONSOLIDATED FINANCIAL STATEMENTS—(Continued)
Country and supplier concentrations:
The Company’s products are produced by independent factories located outside the United States,principally in Southeast Asia. Apparel is manufactured in more than 13 countries, with Vietnam and Chinaaccounting for approximately 68% of 2010 global apparel production. Footwear is manufactured in threecountries, with China and Vietnam accounting for approximately 93% of 2010 global footwear production. Thefive largest apparel factory groups accounted for approximately 20% of 2010 global apparel production, with thelargest factory group accounting for 7% of 2010 global apparel production. The five largest footwear factorygroups accounted for approximately 81% of 2010 global footwear production, with the largest factory groupaccounting for 34% of 2010 global footwear production. In addition, a single vendor supplies substantially all ofthe zippers used in our products. These companies, however, have multiple factory locations, many of which arein different countries, thus reducing the risk that unfavorable conditions at a single factory or location will have amaterial adverse effect on the Company.
NOTE 4—ACCOUNTS RECEIVABLE, NET
Accounts receivable, net, is as follows (in thousands):
December 31,
2010 2009
Trade accounts receivable . . . . . . . . . . . . . . . . . . . . . . . . . . . . . . . . . . . . . . . . . . . $307,279 $233,895Allowance for doubtful accounts . . . . . . . . . . . . . . . . . . . . . . . . . . . . . . . . . . . . . (7,098) (7,347)
Accounts receivable, net . . . . . . . . . . . . . . . . . . . . . . . . . . . . . . . . . . . . . . . . . . . . $300,181 $226,548
A reconciliation of the allowance for doubtful accounts is as follows (in thousands):
Year Ended December 31,
2010 2009 2008
Balance at beginning of period . . . . . . . . . . . . . . . . . . . . . . . . . . . . . . . . . . $ 7,347 $ 9,542 $7,369Bad debt expense . . . . . . . . . . . . . . . . . . . . . . . . . . . . . . . . . . . . . . . . . . . . . 983 768 3,473Write offs . . . . . . . . . . . . . . . . . . . . . . . . . . . . . . . . . . . . . . . . . . . . . . . . . . . (1,304) (3,133) (940)Other . . . . . . . . . . . . . . . . . . . . . . . . . . . . . . . . . . . . . . . . . . . . . . . . . . . . . . 72 170 (360)
Balance at end of period . . . . . . . . . . . . . . . . . . . . . . . . . . . . . . . . . . . . . . . $ 7,098 $ 7,347 $9,542
NOTE 5—INVENTORIES, NET
Inventories, net, consisted of the following (in thousands):
December 31,
2010 2009
Raw materials . . . . . . . . . . . . . . . . . . . . . . . . . . . . . . . . . . . . . . . . . . . . . . . . . . . . $ 1,096 $ 1,021Work in process . . . . . . . . . . . . . . . . . . . . . . . . . . . . . . . . . . . . . . . . . . . . . . . . . . . 659 163Finished goods . . . . . . . . . . . . . . . . . . . . . . . . . . . . . . . . . . . . . . . . . . . . . . . . . . . . 312,543 220,977
$314,298 $222,161
53

COLUMBIA SPORTSWEAR COMPANY
NOTES TO CONSOLIDATED FINANCIAL STATEMENTS—(Continued)
NOTE 6—PROPERTY, PLANT, AND EQUIPMENT, NET
Property, plant, and equipment consisted of the following (in thousands):
December 31,
2010 2009
Land and improvements . . . . . . . . . . . . . . . . . . . . . . . . . . . . . . . . . . . . . . . . . . . $ 16,898 $ 16,557Building and improvements . . . . . . . . . . . . . . . . . . . . . . . . . . . . . . . . . . . . . . . . 144,004 147,093Machinery and equipment . . . . . . . . . . . . . . . . . . . . . . . . . . . . . . . . . . . . . . . . . 193,104 184,721Furniture and fixtures . . . . . . . . . . . . . . . . . . . . . . . . . . . . . . . . . . . . . . . . . . . . . 46,147 44,158Leasehold improvements . . . . . . . . . . . . . . . . . . . . . . . . . . . . . . . . . . . . . . . . . . 62,884 57,866Construction in progress . . . . . . . . . . . . . . . . . . . . . . . . . . . . . . . . . . . . . . . . . . . 9,775 8,932
472,812 459,327Less accumulated depreciation . . . . . . . . . . . . . . . . . . . . . . . . . . . . . . . . . . . . . . (250,999) (223,887)
$ 221,813 $ 235,440
NOTE 7—INTANGIBLE ASSETS AND GOODWILL
Identifiable intangible assets consisted of the following (in thousands):
December 31, 2010 December 31, 2009
GrossCarryingAmount
AccumulatedAmortization
NetCarryingAmount
GrossCarryingAmount
AccumulatedAmortization
NetCarryingAmount
Intangible assets subject to amortization:Patents and purchased technology . . . $14,198 $(1,196) $13,002 $ 898 $(643) $ 255
Intangible assets not subject toamortization:
Trademarks and trade names . . . . . . . 27,421 27,421 26,872 26,872
Identifiable intangible assets, net . . . . $40,423 $27,127
On September 1, 2010, the Company acquired OutDry Technologies S.r.l., which included patents,purchased technology and trademarks. These acquired patents and purchased technology are subject toamortization over 10 years from the date of acquisition.
Amortization expense for the years ended December 31, 2010, 2009, and 2008 was $553,000, $109,000 and$205,000, respectively. Amortization expense for intangible assets subject to amortization is estimated to be$1,402,000 per year in 2011 and 2012 and $1,330,000 in 2013 through 2015.
At December 31, 2010 and December 31, 2009, the Company determined that its goodwill and intangibleassets were not impaired. At December 31, 2008, the Company determined that goodwill and trademarks forcertain acquired brands were impaired. These brands were acquired in 2006 and were not achieving their salesand profitability objectives. For the year ended December 31, 2008, the Company recorded impairment chargesin the United States segment, before income taxes, of $24,742,000, of which $4,614,000 was related to goodwill.
54

COLUMBIA SPORTSWEAR COMPANY
NOTES TO CONSOLIDATED FINANCIAL STATEMENTS—(Continued)
A reconciliation of goodwill is as follows (in thousands):
December 31,
2010 2009
Balance at beginning of period . . . . . . . . . . . . . . . . . . . . . . . . . . . . . . . . . . . . . . . . . $12,659 $12,659Acquisitions . . . . . . . . . . . . . . . . . . . . . . . . . . . . . . . . . . . . . . . . . . . . . . . . . . . . . . . . 1,811 —Impairment charges . . . . . . . . . . . . . . . . . . . . . . . . . . . . . . . . . . . . . . . . . . . . . . . . . . — —
Balance at end of period . . . . . . . . . . . . . . . . . . . . . . . . . . . . . . . . . . . . . . . . . . . . . . $14,470 $12,659
NOTE 8—SHORT-TERM BORROWINGS AND CREDIT LINES
The Company entered into a domestic credit agreement for an unsecured, committed $125,000,000revolving line of credit effective June 15, 2010. The maturity date of this agreement is July 1, 2012. Interest,payable monthly, is based on the Company’s applicable funded debt ratio, ranging from LIBOR plus 100 to 175basis points. This line of credit requires the Company to comply with certain financial covenants covering netincome, tangible net worth and borrowing basis. At December 31, 2010, the Company was in compliance with allassociated covenants. If the Company is in default, it is prohibited from paying dividends or repurchasingcommon stock. At December 31, 2010, no balance was outstanding under this line of credit. At December 31,2009, the Company had domestic unsecured lines of credit with aggregate seasonal limits ranging from$50,000,000 to $125,000,000, of which $25,000,000 to $100,000,000 was committed. These lines of credit wereterminated June 15, 2010 upon entering into the $125,000,000 agreement referred to above.
The Company’s Canadian subsidiary has available an unsecured and uncommitted line of credit guaranteedby the parent company providing for borrowing to a maximum of C$30,000,000 (US$30,060,000) atDecember 31, 2010. The revolving line accrues interest at the bank’s Canadian prime rate. There was no balanceoutstanding under this line at December 31, 2010 and 2009.
The Company’s European subsidiary has available two separate unsecured and uncommitted lines of creditguaranteed by the parent company providing for borrowing up to a maximum of 30,000,000 and 5,000,000 euros,respectively (combined US$46,842,000) at December 31, 2010, of which US$3,346,000 of the 5,000,000 euroline is designated as a European customs guarantee. These lines accrue interest based on the European CentralBank (“ECB”) refinancing rate plus 50 basis points and Euro Overnight Index Average (“EONIA”) plus 75 basispoints, respectively. There was no balance outstanding under either line at December 31, 2010 or 2009.
The Company’s Japanese subsidiary has an unsecured and uncommitted line of credit guaranteed by theparent company providing for borrowing to a maximum of US$5,000,000 at December 31, 2010. The revolvingline accrues interest at LIBOR plus 110 basis points. There was no balance outstanding under this line atDecember 31, 2010 and 2009.
Off-Balance Sheet Arrangements
The Company has arrangements in place to facilitate the import and purchase of inventory through importletters of credit. The Company has available unsecured and uncommitted import letters of credit in the aggregateamount of $25,000,000 subject to annual renewal. At December 31, 2010, the Company had outstanding lettersof credit of $439,000 for purchase orders for inventory under this arrangement.
55

COLUMBIA SPORTSWEAR COMPANY
NOTES TO CONSOLIDATED FINANCIAL STATEMENTS—(Continued)
NOTE 9—ACCRUED LIABILITIES
Accrued liabilities consisted of the following (in thousands):
December 31,
2010 2009
Accrued salaries, bonus, vacation and other benefits . . . . . . . . . . . . . . . . . . . . . . . $ 49,078 $34,711Accrued import duties . . . . . . . . . . . . . . . . . . . . . . . . . . . . . . . . . . . . . . . . . . . . . . . 13,443 1,117Product warranties . . . . . . . . . . . . . . . . . . . . . . . . . . . . . . . . . . . . . . . . . . . . . . . . . . 10,256 12,112Other . . . . . . . . . . . . . . . . . . . . . . . . . . . . . . . . . . . . . . . . . . . . . . . . . . . . . . . . . . . . 30,033 19,372
$102,810 $67,312
A reconciliation of product warranties is as follows (in thousands):
Year Ended December 31,
2010 2009 2008
Balance at beginning of period . . . . . . . . . . . . . . . . . . . . . . . . . . . . . . . . . $12,112 $ 9,746 $10,862Provision for warranty claims . . . . . . . . . . . . . . . . . . . . . . . . . . . . . . . . . 1,371 5,133 2,718Warranty claims . . . . . . . . . . . . . . . . . . . . . . . . . . . . . . . . . . . . . . . . . . . . (3,104) (2,984) (3,364)Other . . . . . . . . . . . . . . . . . . . . . . . . . . . . . . . . . . . . . . . . . . . . . . . . . . . . . (123) 217 (470)
Balance at end of period . . . . . . . . . . . . . . . . . . . . . . . . . . . . . . . . . . . . . . $10,256 $12,112 $ 9,746
NOTE 10—INCOME TAXES
Consolidated income from continuing operations before income taxes consisted of the following (inthousands):
Year Ended December 31,
2010 2009 2008
U.S. operations . . . . . . . . . . . . . . . . . . . . . . . . . . . . . . . . . . . . . . . . . . . $ 59,881 $59,629 $ 44,478Foreign operations . . . . . . . . . . . . . . . . . . . . . . . . . . . . . . . . . . . . . . . . 45,010 30,221 81,765
Income before income tax . . . . . . . . . . . . . . . . . . . . . . . . . . . . . . $104,891 $89,850 $126,243
The components of the provision (benefit) for income taxes consisted of the following (in thousands):
Year Ended December 31,
2010 2009 2008
Current:Federal . . . . . . . . . . . . . . . . . . . . . . . . . . . . . . . . . . . . . . . . . . . . . . $ 24,419 $10,030 $ 22,576State and local . . . . . . . . . . . . . . . . . . . . . . . . . . . . . . . . . . . . . . . . 4,060 2,088 2,459Non-U.S. . . . . . . . . . . . . . . . . . . . . . . . . . . . . . . . . . . . . . . . . . . . . 23,253 10,399 18,568
51,732 22,517 43,603Deferred:
Federal . . . . . . . . . . . . . . . . . . . . . . . . . . . . . . . . . . . . . . . . . . . . . . (18,405) 2,377 (10,444)State and local . . . . . . . . . . . . . . . . . . . . . . . . . . . . . . . . . . . . . . . . (1,223) 12 (1,228)Non-U.S. . . . . . . . . . . . . . . . . . . . . . . . . . . . . . . . . . . . . . . . . . . . . (4,250) (2,077) (735)
(23,878) 312 (12,407)
Income tax expense . . . . . . . . . . . . . . . . . . . . . . . . . . . . . . . . . . . . . . . . $ 27,854 $22,829 $ 31,196
56
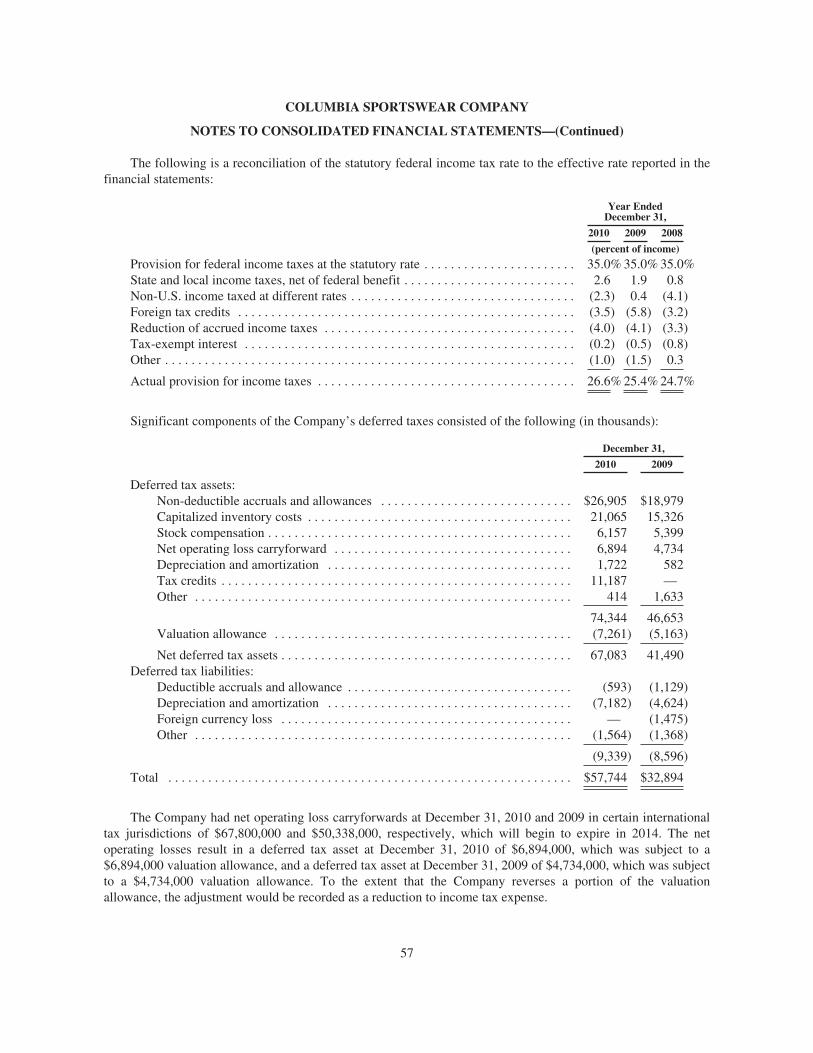
COLUMBIA SPORTSWEAR COMPANY
NOTES TO CONSOLIDATED FINANCIAL STATEMENTS—(Continued)
The following is a reconciliation of the statutory federal income tax rate to the effective rate reported in thefinancial statements:
Year EndedDecember 31,
2010 2009 2008
(percent of income)
Provision for federal income taxes at the statutory rate . . . . . . . . . . . . . . . . . . . . . . . 35.0% 35.0% 35.0%State and local income taxes, net of federal benefit . . . . . . . . . . . . . . . . . . . . . . . . . . 2.6 1.9 0.8Non-U.S. income taxed at different rates . . . . . . . . . . . . . . . . . . . . . . . . . . . . . . . . . . (2.3) 0.4 (4.1)Foreign tax credits . . . . . . . . . . . . . . . . . . . . . . . . . . . . . . . . . . . . . . . . . . . . . . . . . . . (3.5) (5.8) (3.2)Reduction of accrued income taxes . . . . . . . . . . . . . . . . . . . . . . . . . . . . . . . . . . . . . . (4.0) (4.1) (3.3)Tax-exempt interest . . . . . . . . . . . . . . . . . . . . . . . . . . . . . . . . . . . . . . . . . . . . . . . . . . (0.2) (0.5) (0.8)Other . . . . . . . . . . . . . . . . . . . . . . . . . . . . . . . . . . . . . . . . . . . . . . . . . . . . . . . . . . . . . . (1.0) (1.5) 0.3
Actual provision for income taxes . . . . . . . . . . . . . . . . . . . . . . . . . . . . . . . . . . . . . . . 26.6% 25.4% 24.7%
Significant components of the Company’s deferred taxes consisted of the following (in thousands):
December 31,
2010 2009
Deferred tax assets:Non-deductible accruals and allowances . . . . . . . . . . . . . . . . . . . . . . . . . . . . . $26,905 $18,979Capitalized inventory costs . . . . . . . . . . . . . . . . . . . . . . . . . . . . . . . . . . . . . . . . 21,065 15,326Stock compensation . . . . . . . . . . . . . . . . . . . . . . . . . . . . . . . . . . . . . . . . . . . . . . 6,157 5,399Net operating loss carryforward . . . . . . . . . . . . . . . . . . . . . . . . . . . . . . . . . . . . 6,894 4,734Depreciation and amortization . . . . . . . . . . . . . . . . . . . . . . . . . . . . . . . . . . . . . 1,722 582Tax credits . . . . . . . . . . . . . . . . . . . . . . . . . . . . . . . . . . . . . . . . . . . . . . . . . . . . . 11,187 —Other . . . . . . . . . . . . . . . . . . . . . . . . . . . . . . . . . . . . . . . . . . . . . . . . . . . . . . . . . 414 1,633
74,344 46,653Valuation allowance . . . . . . . . . . . . . . . . . . . . . . . . . . . . . . . . . . . . . . . . . . . . . (7,261) (5,163)
Net deferred tax assets . . . . . . . . . . . . . . . . . . . . . . . . . . . . . . . . . . . . . . . . . . . . 67,083 41,490Deferred tax liabilities:
Deductible accruals and allowance . . . . . . . . . . . . . . . . . . . . . . . . . . . . . . . . . . (593) (1,129)Depreciation and amortization . . . . . . . . . . . . . . . . . . . . . . . . . . . . . . . . . . . . . (7,182) (4,624)Foreign currency loss . . . . . . . . . . . . . . . . . . . . . . . . . . . . . . . . . . . . . . . . . . . . — (1,475)Other . . . . . . . . . . . . . . . . . . . . . . . . . . . . . . . . . . . . . . . . . . . . . . . . . . . . . . . . . (1,564) (1,368)
(9,339) (8,596)
Total . . . . . . . . . . . . . . . . . . . . . . . . . . . . . . . . . . . . . . . . . . . . . . . . . . . . . . . . . . . . . $57,744 $32,894
The Company had net operating loss carryforwards at December 31, 2010 and 2009 in certain internationaltax jurisdictions of $67,800,000 and $50,338,000, respectively, which will begin to expire in 2014. The netoperating losses result in a deferred tax asset at December 31, 2010 of $6,894,000, which was subject to a$6,894,000 valuation allowance, and a deferred tax asset at December 31, 2009 of $4,734,000, which was subjectto a $4,734,000 valuation allowance. To the extent that the Company reverses a portion of the valuationallowance, the adjustment would be recorded as a reduction to income tax expense.
57
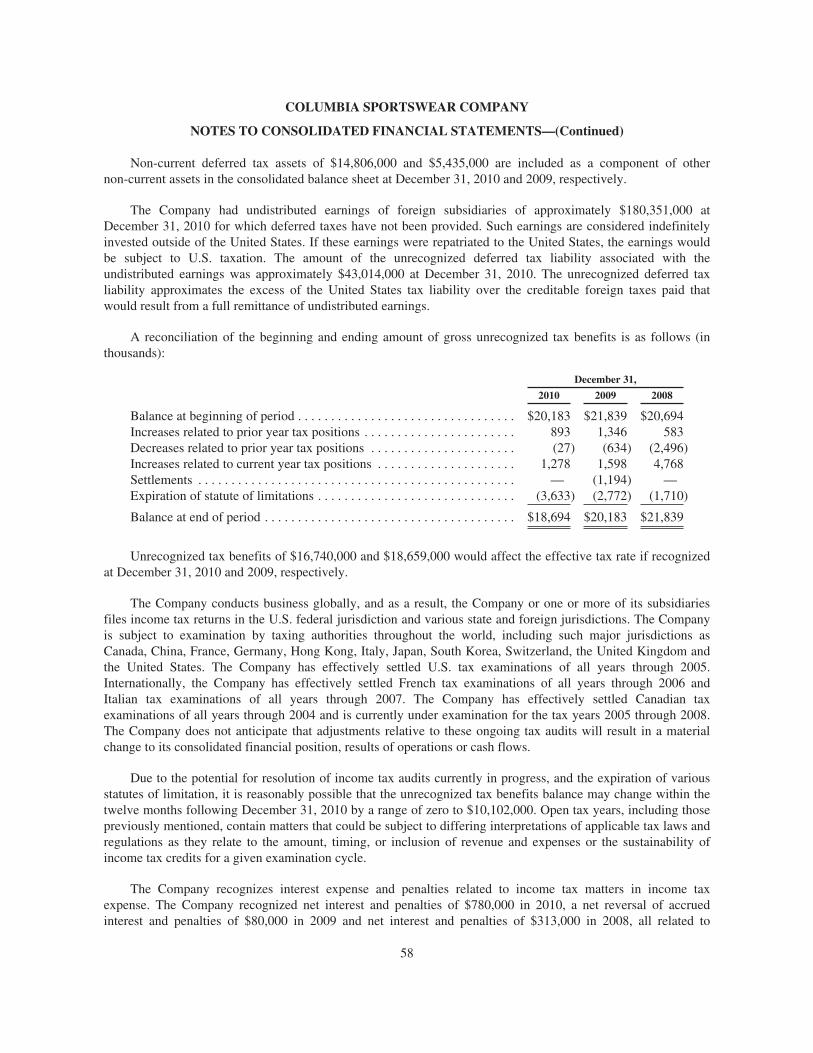
COLUMBIA SPORTSWEAR COMPANY
NOTES TO CONSOLIDATED FINANCIAL STATEMENTS—(Continued)
Non-current deferred tax assets of $14,806,000 and $5,435,000 are included as a component of othernon-current assets in the consolidated balance sheet at December 31, 2010 and 2009, respectively.
The Company had undistributed earnings of foreign subsidiaries of approximately $180,351,000 atDecember 31, 2010 for which deferred taxes have not been provided. Such earnings are considered indefinitelyinvested outside of the United States. If these earnings were repatriated to the United States, the earnings wouldbe subject to U.S. taxation. The amount of the unrecognized deferred tax liability associated with theundistributed earnings was approximately $43,014,000 at December 31, 2010. The unrecognized deferred taxliability approximates the excess of the United States tax liability over the creditable foreign taxes paid thatwould result from a full remittance of undistributed earnings.
A reconciliation of the beginning and ending amount of gross unrecognized tax benefits is as follows (inthousands):
December 31,
2010 2009 2008
Balance at beginning of period . . . . . . . . . . . . . . . . . . . . . . . . . . . . . . . . . $20,183 $21,839 $20,694Increases related to prior year tax positions . . . . . . . . . . . . . . . . . . . . . . . 893 1,346 583Decreases related to prior year tax positions . . . . . . . . . . . . . . . . . . . . . . (27) (634) (2,496)Increases related to current year tax positions . . . . . . . . . . . . . . . . . . . . . 1,278 1,598 4,768Settlements . . . . . . . . . . . . . . . . . . . . . . . . . . . . . . . . . . . . . . . . . . . . . . . . — (1,194) —Expiration of statute of limitations . . . . . . . . . . . . . . . . . . . . . . . . . . . . . . (3,633) (2,772) (1,710)
Balance at end of period . . . . . . . . . . . . . . . . . . . . . . . . . . . . . . . . . . . . . . $18,694 $20,183 $21,839
Unrecognized tax benefits of $16,740,000 and $18,659,000 would affect the effective tax rate if recognizedat December 31, 2010 and 2009, respectively.
The Company conducts business globally, and as a result, the Company or one or more of its subsidiariesfiles income tax returns in the U.S. federal jurisdiction and various state and foreign jurisdictions. The Companyis subject to examination by taxing authorities throughout the world, including such major jurisdictions asCanada, China, France, Germany, Hong Kong, Italy, Japan, South Korea, Switzerland, the United Kingdom andthe United States. The Company has effectively settled U.S. tax examinations of all years through 2005.Internationally, the Company has effectively settled French tax examinations of all years through 2006 andItalian tax examinations of all years through 2007. The Company has effectively settled Canadian taxexaminations of all years through 2004 and is currently under examination for the tax years 2005 through 2008.The Company does not anticipate that adjustments relative to these ongoing tax audits will result in a materialchange to its consolidated financial position, results of operations or cash flows.
Due to the potential for resolution of income tax audits currently in progress, and the expiration of variousstatutes of limitation, it is reasonably possible that the unrecognized tax benefits balance may change within thetwelve months following December 31, 2010 by a range of zero to $10,102,000. Open tax years, including thosepreviously mentioned, contain matters that could be subject to differing interpretations of applicable tax laws andregulations as they relate to the amount, timing, or inclusion of revenue and expenses or the sustainability ofincome tax credits for a given examination cycle.
The Company recognizes interest expense and penalties related to income tax matters in income taxexpense. The Company recognized net interest and penalties of $780,000 in 2010, a net reversal of accruedinterest and penalties of $80,000 in 2009 and net interest and penalties of $313,000 in 2008, all related to
58

COLUMBIA SPORTSWEAR COMPANY
NOTES TO CONSOLIDATED FINANCIAL STATEMENTS—(Continued)
uncertain tax positions. The Company had $3,935,000 and $3,155,000 of accrued interest and penalties related touncertain tax positions at December 31, 2010 and 2009, respectively.
NOTE 11—OTHER LONG-TERM LIABILITIES
Other long-term liabilities consisted of the following (in thousands):
December 31,
2010 2009
Straight-line and deferred rent liabilities . . . . . . . . . . . . . . . . . . . . . . . . . . . . . . . . . . $16,296 $13,497Asset retirement obligations . . . . . . . . . . . . . . . . . . . . . . . . . . . . . . . . . . . . . . . . . . . 1,122 721Deferred compensation plan liability . . . . . . . . . . . . . . . . . . . . . . . . . . . . . . . . . . . . 1,670 826Other . . . . . . . . . . . . . . . . . . . . . . . . . . . . . . . . . . . . . . . . . . . . . . . . . . . . . . . . . . . . . 2,368 —
$21,456 $15,044
NOTE 12—RETIREMENT SAVINGS PLANS
401(k) Profit-Sharing Plan
The Company has a 401(k) profit-sharing plan, which covers substantially all U.S. employees. Participationbegins the first of the quarter following completion of thirty days of service. The Company may elect to makediscretionary matching and/or non-matching contributions. All Company contributions to the plan as determinedby the Board of Directors totaled $4,443,000, $2,610,000 and $3,118,000 for the years ended December 31,2010, 2009 and 2008, respectively.
Deferred Compensation Plan
The Company sponsors a nonqualified retirement savings plan for certain senior management employeeswhose contributions to the tax qualified 401(k) plan would be limited by provisions of the Internal RevenueCode. This plan allows participants to defer receipt of a portion of their salary and incentive compensation and toreceive matching contributions for a portion of the deferred amounts. Company contributions to the plan totaled$155,000 and $108,000 for the years ended December 31, 2010 and 2009, respectively. Participants earn a returnon their deferred compensation based on investment earnings of participant-selected mutual funds. Changes inthe market value of the participants’ investment selections are recorded as an adjustment to deferredcompensation liabilities, with an offset to compensation expense. Deferred compensation, including accumulatedearnings on the participant-directed investment selections, is distributable in cash at participant-specified dates orupon retirement, death, disability or termination of employment. At December 31, 2010 and 2009, the liability toparticipants under this plan was $1,670,000 and $826,000, respectively, and was recorded in other long-termliabilities. The current portion of the participant liability at December 31, 2010 and 2009 was not material.
The Company has purchased specific mutual funds in the same amounts as the participant-directedinvestment selections underlying the deferred compensation liabilities. These investment securities and earningsthereon, held in an irrevocable trust, are intended to provide a source of funds to meet the deferred compensationobligations, subject to claims of creditors in the event of the Company’s insolvency. The mutual funds arerecorded at fair value in intangibles and other non-current assets. At December 31, 2010 and 2009, the fair valueof the mutual fund investments was $1,670,000 and $826,000, respectively. Realized and unrealized gains andlosses on the mutual fund investments are offset against gains and losses resulting from changes in correspondingdeferred compensation liabilities to participants.
59

COLUMBIA SPORTSWEAR COMPANY
NOTES TO CONSOLIDATED FINANCIAL STATEMENTS—(Continued)
NOTE 13—COMMITMENTS AND CONTINGENCIES
Operating Leases
The Company leases, among other things, retail space, office space, warehouse facilities, storage space,vehicles and equipment. Generally, the base lease terms are between 5 and 10 years. Certain lease agreementscontain scheduled rent escalation clauses in their future minimum lease payments. Future minimum leasepayments are recognized on a straight-line basis over the minimum lease term and the pro rata portion ofscheduled rent escalations is included in other long-term liabilities. Certain retail space lease agreements providefor additional rents based on a percentage of annual sales in excess of stipulated minimums (percentage rent).Certain lease agreements require the Company to pay real estate taxes, insurance, common area maintenance(“CAM”), and other costs, collectively referred to as operating costs, in addition to base rent. Percentage rent andoperating costs are recognized as incurred in SG&A expense in the Consolidated Statement of Operations.Certain lease agreements also contain lease incentives, such as tenant improvement allowances and rent holidays.The Company recognizes the benefits related to the lease incentives on a straight-line basis over the applicablelease term.
Rent expense, including percentage rent but excluding operating costs for which the Company is obligated,consisted of the following (in thousands):
Year Ended December 31,
2010 2009 2008
Rent Expense included in SG&A . . . . . . . . . . . . . . . . . . . . . . . . . . . . . . . $39,898 $31,140 $24,230Rent Expense included in Cost of sales . . . . . . . . . . . . . . . . . . . . . . . . . . 1,351 1,465 1,533
$41,249 $32,605 $25,763
Approximate future minimum payments, including rent escalation clauses and stores that are not yet open,on all lease obligations at December 31, 2010, are as follows (in thousands). These operating lease commitmentsare not reflected on the Consolidated Balance Sheet.
2011 . . . . . . . . . . . . . . . . . . . . . . . . . . . . . . . . . . . . . . . . . . . . . . . . . . . . . . . . . . . . . $ 34,1152012 . . . . . . . . . . . . . . . . . . . . . . . . . . . . . . . . . . . . . . . . . . . . . . . . . . . . . . . . . . . . . 31,2442013 . . . . . . . . . . . . . . . . . . . . . . . . . . . . . . . . . . . . . . . . . . . . . . . . . . . . . . . . . . . . . 29,0312014 . . . . . . . . . . . . . . . . . . . . . . . . . . . . . . . . . . . . . . . . . . . . . . . . . . . . . . . . . . . . . 25,3322015 . . . . . . . . . . . . . . . . . . . . . . . . . . . . . . . . . . . . . . . . . . . . . . . . . . . . . . . . . . . . . 23,649Thereafter . . . . . . . . . . . . . . . . . . . . . . . . . . . . . . . . . . . . . . . . . . . . . . . . . . . . . . . . . 110,415
$253,786
Operating lease obligations listed above do not include percentage rent, real estate taxes, insurance, CAM,and other costs for which the Company is obligated. Total expenses for real estate taxes, insurance, CAM, andother costs related to retail space operating leases for the year ended December 31, 2010 was $10.3 million and isincluded in SG&A expense in the Consolidated Statement of Operations.
Inventory Purchase Obligations
Inventory purchase obligations consist of open production purchase orders for sourced apparel, footwear,accessories and equipment, and raw material commitments not included in open production purchase orders. At
60
COLUMBIA SPORTSWEAR COMPANY
NOTES TO CONSOLIDATED FINANCIAL STATEMENTS—(Continued)
December 31, 2010 and 2009, inventory purchase obligations were $323,327,000 and $258,069,000,respectively. To support certain inventory purchase obligations, the Company maintains unsecured anduncommitted lines of credit available for issuing import letters of credit. At December 31, 2010 and 2009, theCompany had letters of credit of $439,000 and $7,771,000, respectively, outstanding for inventory purchaseobligations.
Litigation
The Company is a party to various legal claims, actions and complaints from time to time. Although theultimate resolution of legal proceedings cannot be predicted with certainty, management believes that dispositionof these matters will not have a material adverse effect on the Company’s consolidated financial statements.
Indemnities and Guarantees
During its normal course of business, the Company has made certain indemnities, commitments andguarantees under which it may be required to make payments in relation to certain transactions. These include(i) intellectual property indemnities to the Company’s customers and licensees in connection with the use, saleand/or license of Company products, (ii) indemnities to various lessors in connection with facility leases forcertain claims arising from such facility or lease, (iii) indemnities to customers, vendors and service providerspertaining to claims based on the negligence or willful misconduct of the Company, (iv) executive severancearrangements and (v) indemnities involving the accuracy of representations and warranties in certain contracts.The duration of these indemnities, commitments and guarantees varies, and in certain cases, may be indefinite.The majority of these indemnities, commitments and guarantees do not provide for any limitation of themaximum potential for future payments the Company could be obligated to make. The Company has notrecorded any liability for these indemnities, commitments and guarantees in the accompanying ConsolidatedBalance Sheets.
NOTE 14—SHAREHOLDERS’ EQUITY
Since the inception of the Company’s stock repurchase plan in 2004 through December 31, 2010, theCompany’s Board of Directors has authorized the repurchase of $500,000,000 of the Company’s common stock.As of December 31, 2010, the Company had repurchased 9,190,890 shares under this program at an aggregatepurchase price of approximately $421,237,000. During the year ended December 31, 2010, the Companyrepurchased an aggregate of $13,838,000 of common stock under the stock repurchase plan, of which $4,339,000was recorded as a reduction to retained earnings; otherwise, the aggregate purchase price would have resulted ina negative common stock carrying amount. Shares of the Company’s common stock may be purchased in theopen market or through privately negotiated transactions, subject to market conditions. The repurchase programdoes not obligate the Company to acquire any specific number of shares or to acquire shares over any specifiedperiod of time.
NOTE 15—STOCK-BASED COMPENSATION
1997 Stock Incentive Plan
The Company’s 1997 Stock Incentive Plan (the “Plan”) provides for issuance of up to 8,900,000 shares ofthe Company’s Common Stock, of which 1,711,768 shares were available for future grants under the Plan atDecember 31, 2010. The Plan allows for grants of incentive stock options, non-statutory stock options, restrictedstock awards, restricted stock units and other stock-based awards. The Company uses original issuance shares tosatisfy share-based payments.
61
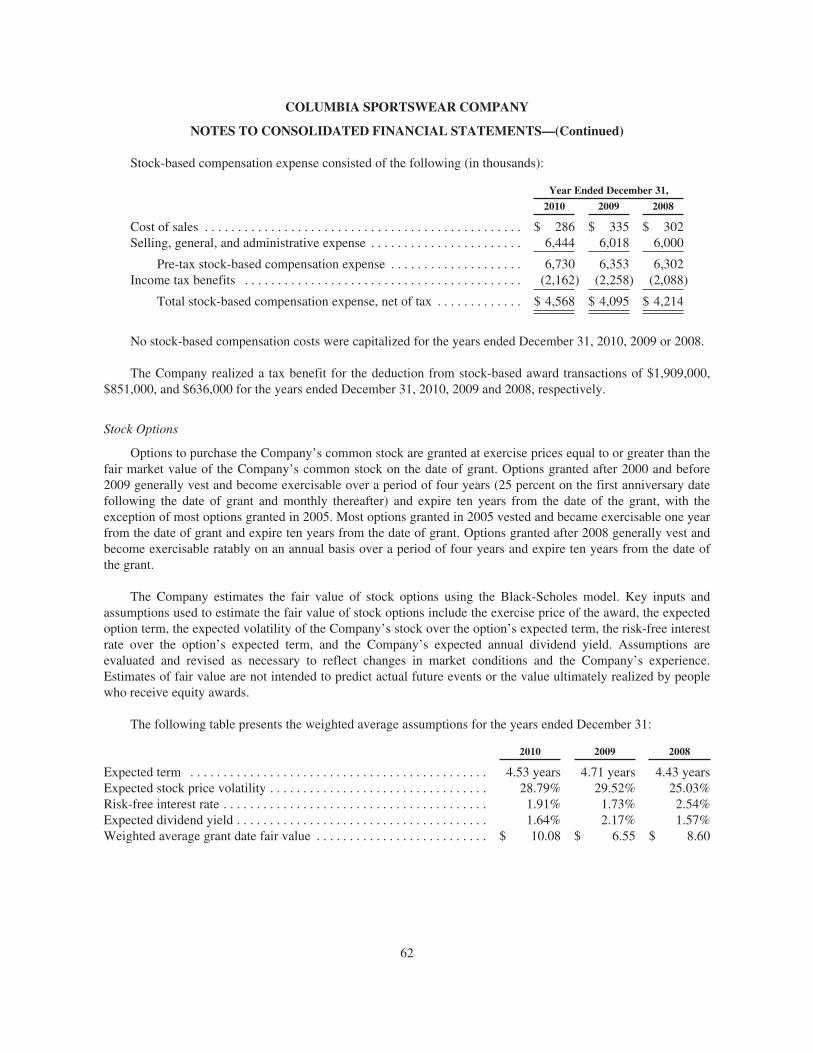
COLUMBIA SPORTSWEAR COMPANY
NOTES TO CONSOLIDATED FINANCIAL STATEMENTS—(Continued)
Stock-based compensation expense consisted of the following (in thousands):
Year Ended December 31,
2010 2009 2008
Cost of sales . . . . . . . . . . . . . . . . . . . . . . . . . . . . . . . . . . . . . . . . . . . . . . . . $ 286 $ 335 $ 302Selling, general, and administrative expense . . . . . . . . . . . . . . . . . . . . . . . 6,444 6,018 6,000
Pre-tax stock-based compensation expense . . . . . . . . . . . . . . . . . . . . 6,730 6,353 6,302Income tax benefits . . . . . . . . . . . . . . . . . . . . . . . . . . . . . . . . . . . . . . . . . . (2,162) (2,258) (2,088)
Total stock-based compensation expense, net of tax . . . . . . . . . . . . . $ 4,568 $ 4,095 $ 4,214
No stock-based compensation costs were capitalized for the years ended December 31, 2010, 2009 or 2008.
The Company realized a tax benefit for the deduction from stock-based award transactions of $1,909,000,$851,000, and $636,000 for the years ended December 31, 2010, 2009 and 2008, respectively.
Stock Options
Options to purchase the Company’s common stock are granted at exercise prices equal to or greater than thefair market value of the Company’s common stock on the date of grant. Options granted after 2000 and before2009 generally vest and become exercisable over a period of four years (25 percent on the first anniversary datefollowing the date of grant and monthly thereafter) and expire ten years from the date of the grant, with theexception of most options granted in 2005. Most options granted in 2005 vested and became exercisable one yearfrom the date of grant and expire ten years from the date of grant. Options granted after 2008 generally vest andbecome exercisable ratably on an annual basis over a period of four years and expire ten years from the date ofthe grant.
The Company estimates the fair value of stock options using the Black-Scholes model. Key inputs andassumptions used to estimate the fair value of stock options include the exercise price of the award, the expectedoption term, the expected volatility of the Company’s stock over the option’s expected term, the risk-free interestrate over the option’s expected term, and the Company’s expected annual dividend yield. Assumptions areevaluated and revised as necessary to reflect changes in market conditions and the Company’s experience.Estimates of fair value are not intended to predict actual future events or the value ultimately realized by peoplewho receive equity awards.
The following table presents the weighted average assumptions for the years ended December 31:
2010 2009 2008
Expected term . . . . . . . . . . . . . . . . . . . . . . . . . . . . . . . . . . . . . . . . . . . . . 4.53 years 4.71 years 4.43 yearsExpected stock price volatility . . . . . . . . . . . . . . . . . . . . . . . . . . . . . . . . . 28.79% 29.52% 25.03%Risk-free interest rate . . . . . . . . . . . . . . . . . . . . . . . . . . . . . . . . . . . . . . . . 1.91% 1.73% 2.54%Expected dividend yield . . . . . . . . . . . . . . . . . . . . . . . . . . . . . . . . . . . . . . 1.64% 2.17% 1.57%Weighted average grant date fair value . . . . . . . . . . . . . . . . . . . . . . . . . . $ 10.08 $ 6.55 $ 8.60
62
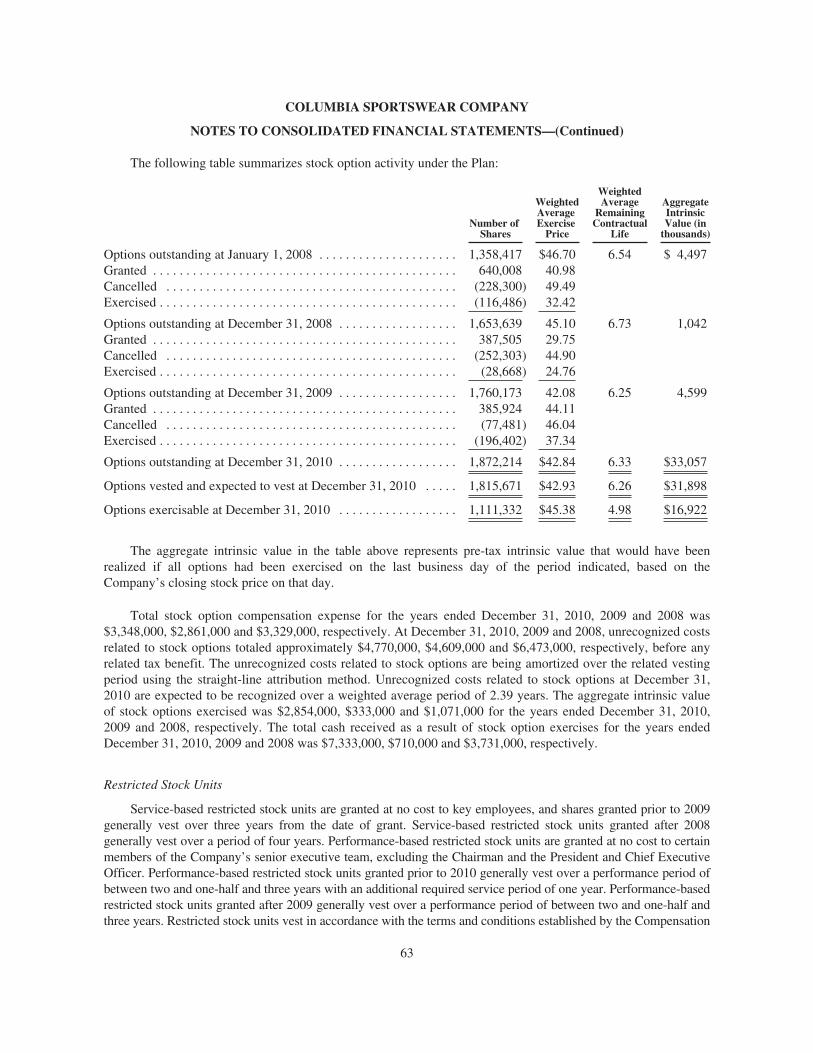
COLUMBIA SPORTSWEAR COMPANY
NOTES TO CONSOLIDATED FINANCIAL STATEMENTS—(Continued)
The following table summarizes stock option activity under the Plan:
Number ofShares
WeightedAverageExercise
Price
WeightedAverage
RemainingContractual
Life
AggregateIntrinsicValue (in
thousands)
Options outstanding at January 1, 2008 . . . . . . . . . . . . . . . . . . . . . 1,358,417 $46.70 6.54 $ 4,497Granted . . . . . . . . . . . . . . . . . . . . . . . . . . . . . . . . . . . . . . . . . . . . . . 640,008 40.98Cancelled . . . . . . . . . . . . . . . . . . . . . . . . . . . . . . . . . . . . . . . . . . . . (228,300) 49.49Exercised . . . . . . . . . . . . . . . . . . . . . . . . . . . . . . . . . . . . . . . . . . . . . (116,486) 32.42
Options outstanding at December 31, 2008 . . . . . . . . . . . . . . . . . . 1,653,639 45.10 6.73 1,042Granted . . . . . . . . . . . . . . . . . . . . . . . . . . . . . . . . . . . . . . . . . . . . . . 387,505 29.75Cancelled . . . . . . . . . . . . . . . . . . . . . . . . . . . . . . . . . . . . . . . . . . . . (252,303) 44.90Exercised . . . . . . . . . . . . . . . . . . . . . . . . . . . . . . . . . . . . . . . . . . . . . (28,668) 24.76
Options outstanding at December 31, 2009 . . . . . . . . . . . . . . . . . . 1,760,173 42.08 6.25 4,599Granted . . . . . . . . . . . . . . . . . . . . . . . . . . . . . . . . . . . . . . . . . . . . . . 385,924 44.11Cancelled . . . . . . . . . . . . . . . . . . . . . . . . . . . . . . . . . . . . . . . . . . . . (77,481) 46.04Exercised . . . . . . . . . . . . . . . . . . . . . . . . . . . . . . . . . . . . . . . . . . . . . (196,402) 37.34
Options outstanding at December 31, 2010 . . . . . . . . . . . . . . . . . . 1,872,214 $42.84 6.33 $33,057
Options vested and expected to vest at December 31, 2010 . . . . . 1,815,671 $42.93 6.26 $31,898
Options exercisable at December 31, 2010 . . . . . . . . . . . . . . . . . . 1,111,332 $45.38 4.98 $16,922
The aggregate intrinsic value in the table above represents pre-tax intrinsic value that would have beenrealized if all options had been exercised on the last business day of the period indicated, based on theCompany’s closing stock price on that day.
Total stock option compensation expense for the years ended December 31, 2010, 2009 and 2008 was$3,348,000, $2,861,000 and $3,329,000, respectively. At December 31, 2010, 2009 and 2008, unrecognized costsrelated to stock options totaled approximately $4,770,000, $4,609,000 and $6,473,000, respectively, before anyrelated tax benefit. The unrecognized costs related to stock options are being amortized over the related vestingperiod using the straight-line attribution method. Unrecognized costs related to stock options at December 31,2010 are expected to be recognized over a weighted average period of 2.39 years. The aggregate intrinsic valueof stock options exercised was $2,854,000, $333,000 and $1,071,000 for the years ended December 31, 2010,2009 and 2008, respectively. The total cash received as a result of stock option exercises for the years endedDecember 31, 2010, 2009 and 2008 was $7,333,000, $710,000 and $3,731,000, respectively.
Restricted Stock Units
Service-based restricted stock units are granted at no cost to key employees, and shares granted prior to 2009generally vest over three years from the date of grant. Service-based restricted stock units granted after 2008generally vest over a period of four years. Performance-based restricted stock units are granted at no cost to certainmembers of the Company’s senior executive team, excluding the Chairman and the President and Chief ExecutiveOfficer. Performance-based restricted stock units granted prior to 2010 generally vest over a performance period ofbetween two and one-half and three years with an additional required service period of one year. Performance-basedrestricted stock units granted after 2009 generally vest over a performance period of between two and one-half andthree years. Restricted stock units vest in accordance with the terms and conditions established by the Compensation
63
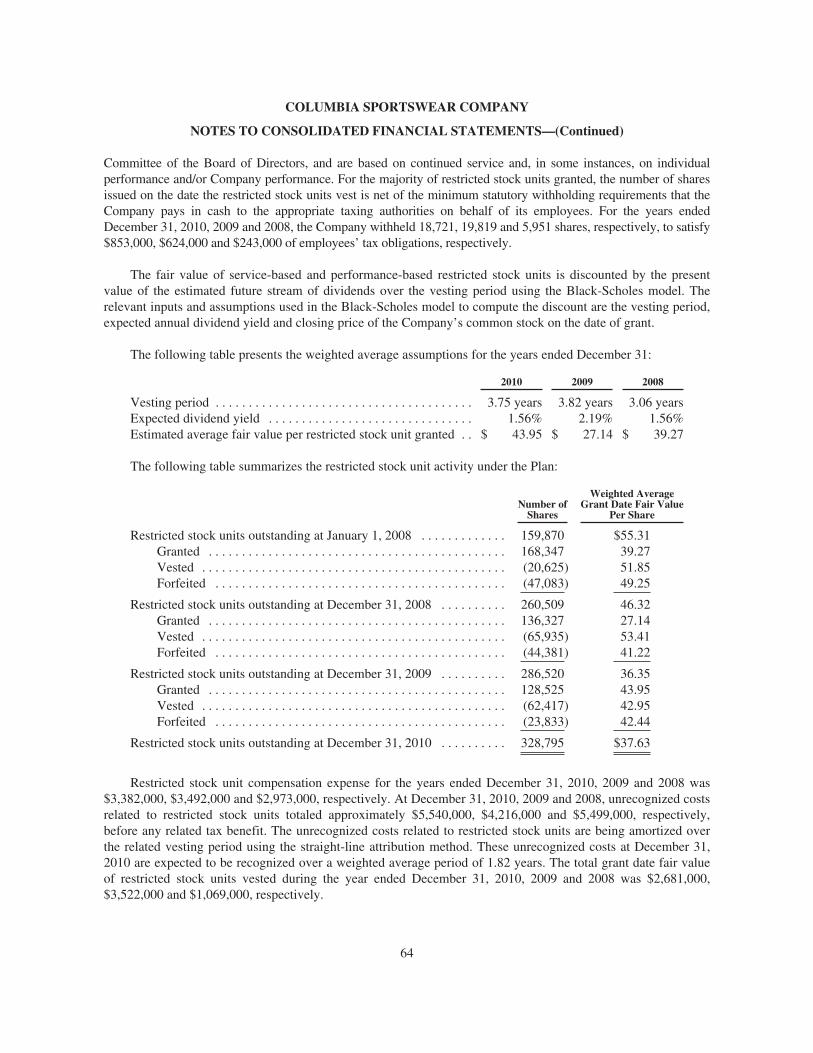
COLUMBIA SPORTSWEAR COMPANY
NOTES TO CONSOLIDATED FINANCIAL STATEMENTS—(Continued)
Committee of the Board of Directors, and are based on continued service and, in some instances, on individualperformance and/or Company performance. For the majority of restricted stock units granted, the number of sharesissued on the date the restricted stock units vest is net of the minimum statutory withholding requirements that theCompany pays in cash to the appropriate taxing authorities on behalf of its employees. For the years endedDecember 31, 2010, 2009 and 2008, the Company withheld 18,721, 19,819 and 5,951 shares, respectively, to satisfy$853,000, $624,000 and $243,000 of employees’ tax obligations, respectively.
The fair value of service-based and performance-based restricted stock units is discounted by the presentvalue of the estimated future stream of dividends over the vesting period using the Black-Scholes model. Therelevant inputs and assumptions used in the Black-Scholes model to compute the discount are the vesting period,expected annual dividend yield and closing price of the Company’s common stock on the date of grant.
The following table presents the weighted average assumptions for the years ended December 31:
2010 2009 2008
Vesting period . . . . . . . . . . . . . . . . . . . . . . . . . . . . . . . . . . . . . . . 3.75 years 3.82 years 3.06 yearsExpected dividend yield . . . . . . . . . . . . . . . . . . . . . . . . . . . . . . . 1.56% 2.19% 1.56%Estimated average fair value per restricted stock unit granted . . $ 43.95 $ 27.14 $ 39.27
The following table summarizes the restricted stock unit activity under the Plan:
Number ofShares
Weighted AverageGrant Date Fair Value
Per Share
Restricted stock units outstanding at January 1, 2008 . . . . . . . . . . . . . 159,870 $55.31Granted . . . . . . . . . . . . . . . . . . . . . . . . . . . . . . . . . . . . . . . . . . . . . 168,347 39.27Vested . . . . . . . . . . . . . . . . . . . . . . . . . . . . . . . . . . . . . . . . . . . . . . (20,625) 51.85Forfeited . . . . . . . . . . . . . . . . . . . . . . . . . . . . . . . . . . . . . . . . . . . . (47,083) 49.25
Restricted stock units outstanding at December 31, 2008 . . . . . . . . . . 260,509 46.32Granted . . . . . . . . . . . . . . . . . . . . . . . . . . . . . . . . . . . . . . . . . . . . . 136,327 27.14Vested . . . . . . . . . . . . . . . . . . . . . . . . . . . . . . . . . . . . . . . . . . . . . . (65,935) 53.41Forfeited . . . . . . . . . . . . . . . . . . . . . . . . . . . . . . . . . . . . . . . . . . . . (44,381) 41.22
Restricted stock units outstanding at December 31, 2009 . . . . . . . . . . 286,520 36.35Granted . . . . . . . . . . . . . . . . . . . . . . . . . . . . . . . . . . . . . . . . . . . . . 128,525 43.95Vested . . . . . . . . . . . . . . . . . . . . . . . . . . . . . . . . . . . . . . . . . . . . . . (62,417) 42.95Forfeited . . . . . . . . . . . . . . . . . . . . . . . . . . . . . . . . . . . . . . . . . . . . (23,833) 42.44
Restricted stock units outstanding at December 31, 2010 . . . . . . . . . . 328,795 $37.63
Restricted stock unit compensation expense for the years ended December 31, 2010, 2009 and 2008 was$3,382,000, $3,492,000 and $2,973,000, respectively. At December 31, 2010, 2009 and 2008, unrecognized costsrelated to restricted stock units totaled approximately $5,540,000, $4,216,000 and $5,499,000, respectively,before any related tax benefit. The unrecognized costs related to restricted stock units are being amortized overthe related vesting period using the straight-line attribution method. These unrecognized costs at December 31,2010 are expected to be recognized over a weighted average period of 1.82 years. The total grant date fair valueof restricted stock units vested during the year ended December 31, 2010, 2009 and 2008 was $2,681,000,$3,522,000 and $1,069,000, respectively.
64

COLUMBIA SPORTSWEAR COMPANY
NOTES TO CONSOLIDATED FINANCIAL STATEMENTS—(Continued)
NOTE 16—EARNINGS PER SHARE
Earnings per Share (“EPS”), is presented on both a basic and diluted basis. Basic EPS is based on theweighted average number of common shares outstanding. Diluted EPS reflects the potential dilution that couldoccur if outstanding securities or other contracts to issue common stock were exercised or converted intocommon stock. For the calculation of diluted EPS, the basic weighted average number of shares is increased bythe dilutive effect of stock options and restricted stock units determined using the treasury stock method.
A reconciliation of the common shares used in the denominator for computing basic and diluted EPS is asfollows (in thousands, except per share amounts):
Year Ended December 31,
2010 2009 2008
Weighted average common shares outstanding, used in computing basic earningsper share . . . . . . . . . . . . . . . . . . . . . . . . . . . . . . . . . . . . . . . . . . . . . . . . . . . . . . . . 33,725 33,846 34,610
Effect of dilutive stock options and restricted stock units . . . . . . . . . . . . . . . . . . . . 367 135 101
Weighted-average common shares outstanding, used in computing dilutedearnings per share . . . . . . . . . . . . . . . . . . . . . . . . . . . . . . . . . . . . . . . . . . . . . . . . . 34,092 33,981 34,711
Earnings per share of common stock:Basic . . . . . . . . . . . . . . . . . . . . . . . . . . . . . . . . . . . . . . . . . . . . . . . . . . . . . . . . . $ 2.28 $ 1.98 $ 2.75Diluted . . . . . . . . . . . . . . . . . . . . . . . . . . . . . . . . . . . . . . . . . . . . . . . . . . . . . . . 2.26 1.97 2.74
Stock options and service-based restricted stock units representing 480,707, 1,562,064 and 1,410,849 sharesof common stock for the years ended December 31, 2010, 2009 and 2008, respectively, were outstanding butwere excluded in the computation of diluted EPS because their effect would be anti-dilutive as a result ofapplying the treasury stock method. In addition, performance-based restricted stock units representing 43,323,44,043 and 41,799 shares for the years ended December 31, 2010, 2009 and 2008, respectively, were outstandingbut were excluded from the computation of diluted EPS because these shares were subject to performanceconditions that had not been met.
65
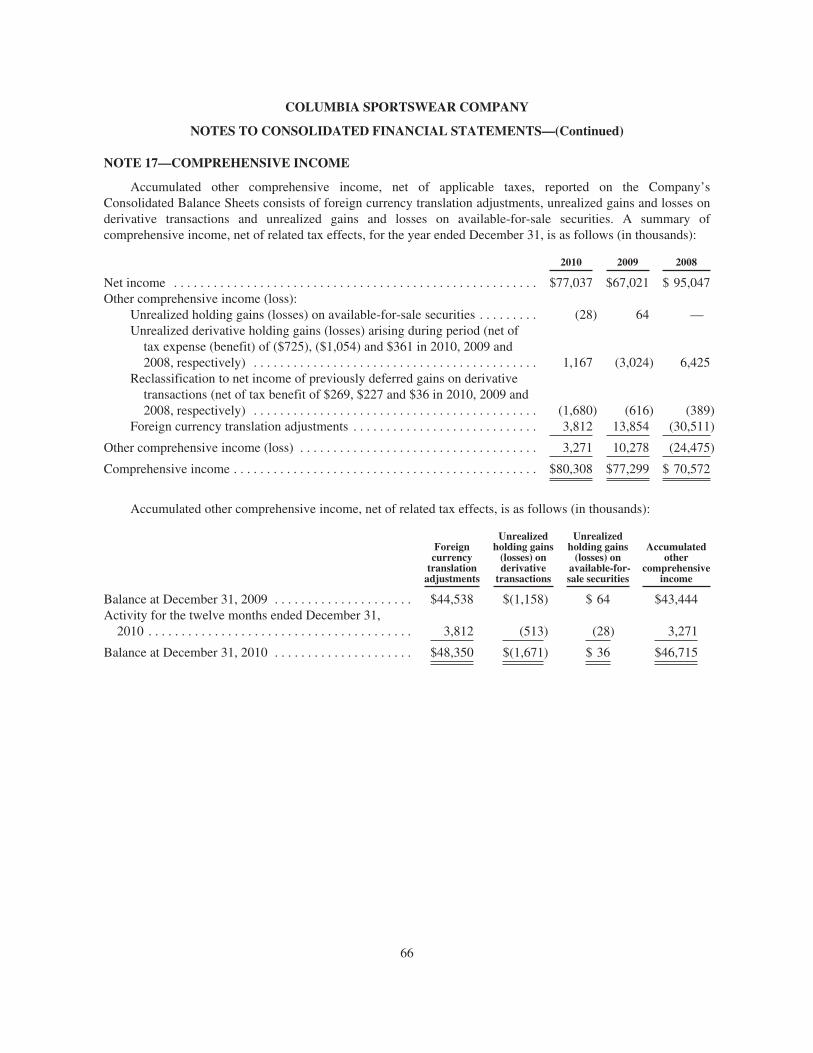
COLUMBIA SPORTSWEAR COMPANY
NOTES TO CONSOLIDATED FINANCIAL STATEMENTS—(Continued)
NOTE 17—COMPREHENSIVE INCOME
Accumulated other comprehensive income, net of applicable taxes, reported on the Company’sConsolidated Balance Sheets consists of foreign currency translation adjustments, unrealized gains and losses onderivative transactions and unrealized gains and losses on available-for-sale securities. A summary ofcomprehensive income, net of related tax effects, for the year ended December 31, is as follows (in thousands):
2010 2009 2008
Net income . . . . . . . . . . . . . . . . . . . . . . . . . . . . . . . . . . . . . . . . . . . . . . . . . . . . . . . $77,037 $67,021 $ 95,047Other comprehensive income (loss):
Unrealized holding gains (losses) on available-for-sale securities . . . . . . . . . (28) 64 —Unrealized derivative holding gains (losses) arising during period (net of
tax expense (benefit) of ($725), ($1,054) and $361 in 2010, 2009 and2008, respectively) . . . . . . . . . . . . . . . . . . . . . . . . . . . . . . . . . . . . . . . . . . . 1,167 (3,024) 6,425
Reclassification to net income of previously deferred gains on derivativetransactions (net of tax benefit of $269, $227 and $36 in 2010, 2009 and2008, respectively) . . . . . . . . . . . . . . . . . . . . . . . . . . . . . . . . . . . . . . . . . . . (1,680) (616) (389)
Foreign currency translation adjustments . . . . . . . . . . . . . . . . . . . . . . . . . . . . 3,812 13,854 (30,511)
Other comprehensive income (loss) . . . . . . . . . . . . . . . . . . . . . . . . . . . . . . . . . . . . 3,271 10,278 (24,475)
Comprehensive income . . . . . . . . . . . . . . . . . . . . . . . . . . . . . . . . . . . . . . . . . . . . . . $80,308 $77,299 $ 70,572
Accumulated other comprehensive income, net of related tax effects, is as follows (in thousands):
Foreigncurrency
translationadjustments
Unrealizedholding gains
(losses) onderivative
transactions
Unrealizedholding gains
(losses) onavailable-for-sale securities
Accumulatedother
comprehensiveincome
Balance at December 31, 2009 . . . . . . . . . . . . . . . . . . . . . $44,538 $(1,158) $ 64 $43,444Activity for the twelve months ended December 31,
2010 . . . . . . . . . . . . . . . . . . . . . . . . . . . . . . . . . . . . . . . . 3,812 (513) (28) 3,271
Balance at December 31, 2010 . . . . . . . . . . . . . . . . . . . . . $48,350 $(1,671) $ 36 $46,715
66

COLUMBIA SPORTSWEAR COMPANY
NOTES TO CONSOLIDATED FINANCIAL STATEMENTS—(Continued)
NOTE 18—SEGMENT INFORMATION
The Company operates in four geographic segments: (1) United States, (2) Latin America and Asia Pacific(“LAAP”), (3) Europe, Middle East and Africa (“EMEA”), and (4) Canada, which are reflective of theCompany’s internal organization, management, and oversight structure. Each geographic segment operatespredominantly in one industry: the design, development, marketing and distribution of active outdoor apparel,including outerwear, sportswear, footwear and accessories and equipment.
The geographic distribution of the Company’s net sales, income before income taxes, interest income(expense), income tax (expense) benefit, and depreciation and amortization expense are summarized in thefollowing tables (in thousands) for the years ended December 31, 2010, 2009 and 2008 and for identifiable assetsat December 31, 2010 and 2009. Inter-geographic net sales, which are recorded at a negotiated mark-up andeliminated in consolidation, are not material.
2010 2009 2008
Net sales to unrelated entities:United States . . . . . . . . . . . . . . . . . . . . . . . . . . . . . . . . . . . . . . . . . . . $ 880,990 $ 736,942 $ 727,706LAAP . . . . . . . . . . . . . . . . . . . . . . . . . . . . . . . . . . . . . . . . . . . . . . . . 263,429 203,230 198,236EMEA . . . . . . . . . . . . . . . . . . . . . . . . . . . . . . . . . . . . . . . . . . . . . . . . 222,451 197,357 267,152Canada . . . . . . . . . . . . . . . . . . . . . . . . . . . . . . . . . . . . . . . . . . . . . . . . 116,654 106,494 124,741
$1,483,524 $1,244,023 $1,317,835
Income before income taxes:United States . . . . . . . . . . . . . . . . . . . . . . . . . . . . . . . . . . . . . . . . . . . $ 53,752 $ 49,660 $ 38,674LAAP . . . . . . . . . . . . . . . . . . . . . . . . . . . . . . . . . . . . . . . . . . . . . . . . 35,635 27,138 32,857EMEA . . . . . . . . . . . . . . . . . . . . . . . . . . . . . . . . . . . . . . . . . . . . . . . . 5,817 1,410 26,167Canada . . . . . . . . . . . . . . . . . . . . . . . . . . . . . . . . . . . . . . . . . . . . . . . . 8,123 9,554 21,008Interest . . . . . . . . . . . . . . . . . . . . . . . . . . . . . . . . . . . . . . . . . . . . . . . . 1,564 2,088 7,537
$ 104,891 $ 89,850 $ 126,243
Interest income (expense), net:United States . . . . . . . . . . . . . . . . . . . . . . . . . . . . . . . . . . . . . . . . . . . $ 4,664 $ 4,561 $ 5,804LAAP . . . . . . . . . . . . . . . . . . . . . . . . . . . . . . . . . . . . . . . . . . . . . . . . 500 561 1,023EMEA . . . . . . . . . . . . . . . . . . . . . . . . . . . . . . . . . . . . . . . . . . . . . . . . (717) (910) 45Canada . . . . . . . . . . . . . . . . . . . . . . . . . . . . . . . . . . . . . . . . . . . . . . . . (2,883) (2,124) 665
$ 1,564 $ 2,088 $ 7,537
Income tax (expense) benefit:United States . . . . . . . . . . . . . . . . . . . . . . . . . . . . . . . . . . . . . . . . . . . $ (9,938) $ (13,710) $ (13,363)LAAP . . . . . . . . . . . . . . . . . . . . . . . . . . . . . . . . . . . . . . . . . . . . . . . . (9,325) (6,745) (8,312)EMEA . . . . . . . . . . . . . . . . . . . . . . . . . . . . . . . . . . . . . . . . . . . . . . . . (7,668) (2,744) (2,692)Canada . . . . . . . . . . . . . . . . . . . . . . . . . . . . . . . . . . . . . . . . . . . . . . . . (923) 370 (6,829)
$ (27,854) $ (22,829) $ (31,196)
Depreciation and amortization expense:United States . . . . . . . . . . . . . . . . . . . . . . . . . . . . . . . . . . . . . . . . . . . $ 28,634 $ 26,850 $ 21,866LAAP . . . . . . . . . . . . . . . . . . . . . . . . . . . . . . . . . . . . . . . . . . . . . . . . 2,557 2,120 1,865EMEA . . . . . . . . . . . . . . . . . . . . . . . . . . . . . . . . . . . . . . . . . . . . . . . . 6,410 6,642 6,978Canada . . . . . . . . . . . . . . . . . . . . . . . . . . . . . . . . . . . . . . . . . . . . . . . . 829 641 449
$ 38,430 $ 36,253 $ 31,158
67
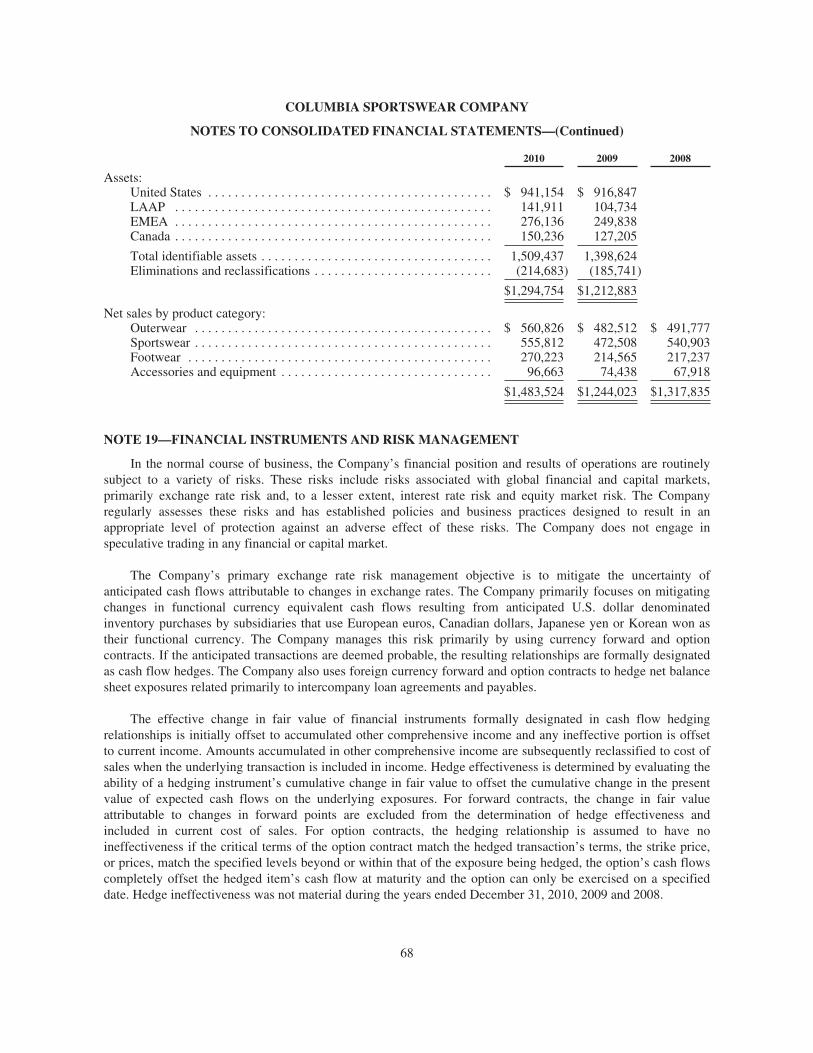
COLUMBIA SPORTSWEAR COMPANY
NOTES TO CONSOLIDATED FINANCIAL STATEMENTS—(Continued)
2010 2009 2008
Assets:United States . . . . . . . . . . . . . . . . . . . . . . . . . . . . . . . . . . . . . . . . . . . $ 941,154 $ 916,847LAAP . . . . . . . . . . . . . . . . . . . . . . . . . . . . . . . . . . . . . . . . . . . . . . . . 141,911 104,734EMEA . . . . . . . . . . . . . . . . . . . . . . . . . . . . . . . . . . . . . . . . . . . . . . . . 276,136 249,838Canada . . . . . . . . . . . . . . . . . . . . . . . . . . . . . . . . . . . . . . . . . . . . . . . . 150,236 127,205
Total identifiable assets . . . . . . . . . . . . . . . . . . . . . . . . . . . . . . . . . . . 1,509,437 1,398,624Eliminations and reclassifications . . . . . . . . . . . . . . . . . . . . . . . . . . . (214,683) (185,741)
$1,294,754 $1,212,883
Net sales by product category:Outerwear . . . . . . . . . . . . . . . . . . . . . . . . . . . . . . . . . . . . . . . . . . . . . $ 560,826 $ 482,512 $ 491,777Sportswear . . . . . . . . . . . . . . . . . . . . . . . . . . . . . . . . . . . . . . . . . . . . . 555,812 472,508 540,903Footwear . . . . . . . . . . . . . . . . . . . . . . . . . . . . . . . . . . . . . . . . . . . . . . 270,223 214,565 217,237Accessories and equipment . . . . . . . . . . . . . . . . . . . . . . . . . . . . . . . . 96,663 74,438 67,918
$1,483,524 $1,244,023 $1,317,835
NOTE 19—FINANCIAL INSTRUMENTS AND RISK MANAGEMENT
In the normal course of business, the Company’s financial position and results of operations are routinelysubject to a variety of risks. These risks include risks associated with global financial and capital markets,primarily exchange rate risk and, to a lesser extent, interest rate risk and equity market risk. The Companyregularly assesses these risks and has established policies and business practices designed to result in anappropriate level of protection against an adverse effect of these risks. The Company does not engage inspeculative trading in any financial or capital market.
The Company’s primary exchange rate risk management objective is to mitigate the uncertainty ofanticipated cash flows attributable to changes in exchange rates. The Company primarily focuses on mitigatingchanges in functional currency equivalent cash flows resulting from anticipated U.S. dollar denominatedinventory purchases by subsidiaries that use European euros, Canadian dollars, Japanese yen or Korean won astheir functional currency. The Company manages this risk primarily by using currency forward and optioncontracts. If the anticipated transactions are deemed probable, the resulting relationships are formally designatedas cash flow hedges. The Company also uses foreign currency forward and option contracts to hedge net balancesheet exposures related primarily to intercompany loan agreements and payables.
The effective change in fair value of financial instruments formally designated in cash flow hedgingrelationships is initially offset to accumulated other comprehensive income and any ineffective portion is offsetto current income. Amounts accumulated in other comprehensive income are subsequently reclassified to cost ofsales when the underlying transaction is included in income. Hedge effectiveness is determined by evaluating theability of a hedging instrument’s cumulative change in fair value to offset the cumulative change in the presentvalue of expected cash flows on the underlying exposures. For forward contracts, the change in fair valueattributable to changes in forward points are excluded from the determination of hedge effectiveness andincluded in current cost of sales. For option contracts, the hedging relationship is assumed to have noineffectiveness if the critical terms of the option contract match the hedged transaction’s terms, the strike price,or prices, match the specified levels beyond or within that of the exposure being hedged, the option’s cash flowscompletely offset the hedged item’s cash flow at maturity and the option can only be exercised on a specifieddate. Hedge ineffectiveness was not material during the years ended December 31, 2010, 2009 and 2008.
68

COLUMBIA SPORTSWEAR COMPANY
NOTES TO CONSOLIDATED FINANCIAL STATEMENTS—(Continued)
The classification of effective hedge results in the Consolidated Statements of Operations is the same as thatof the underlying exposure. Results of hedges of product costs are recorded in cost of sales when the underlyinghedged transaction affects income. Unrealized derivative gains and losses, which are recorded in current assetsand liabilities, respectively, are non-cash items and therefore are taken into account in the preparation of theCondensed Consolidated Statements of Cash Flows based on their respective balance sheet classifications.
The Company uses derivative instruments not formally designated as hedges to manage the exchange raterisk associated with both the remeasurement of monetary assets and liabilities and anticipated transactions that donot qualify as the hedged items in cash flow hedging relationships. The change in fair value of these instrumentsis recognized immediately in cost of sales or SG&A expense, depending on the underlying exposure.
The following table presents the gross notional amount of outstanding derivative instruments (in thousands):
December 31,
2010 2009
Derivative instruments designated as cash flow hedges:Currency forward contracts . . . . . . . . . . . . . . . . . . . . . . . . . . . . . . . . . . . . . . . $ 86,260 $82,730Currency option contracts . . . . . . . . . . . . . . . . . . . . . . . . . . . . . . . . . . . . . . . . 4,500 —
Derivative instruments not designated as cash flow hedges:Currency forward contracts . . . . . . . . . . . . . . . . . . . . . . . . . . . . . . . . . . . . . . . 179,382 61,017
At December 31, 2010, approximately $1,349,000 of deferred net losses on both outstanding and maturedderivatives accumulated in other comprehensive income are expected to be reclassified to net income during thenext twelve months as a result of underlying hedged transactions also being recorded in net income. Actualamounts ultimately reclassified to net income are dependent on U.S. dollar exchange rates in effect against theEuropean euro, Canadian dollar, Japanese yen and Korean won when outstanding derivative contracts mature.
At December 31, 2010, the Company’s derivative contracts had a remaining maturity of approximately twoyears or less. All the counterparties to these transactions had investment grade short-term credit ratings. Themaximum net exposure to any single counterparty, which is generally limited to the aggregate unrealized gain ofall contracts with that counterparty, was less than $1,000,000 at December 31, 2010. The majority of theCompany’s derivative counterparties have strong credit ratings and, as a result, the Company does not requirecollateral to facilitate transactions. The Company does not hold derivatives featuring credit-related contingentterms. In addition, the Company is not a party to any derivative master agreement featuring credit-relatedcontingent terms. Finally, the Company has not pledged assets or posted collateral as a requirement for enteringinto or maintaining derivative positions.
69
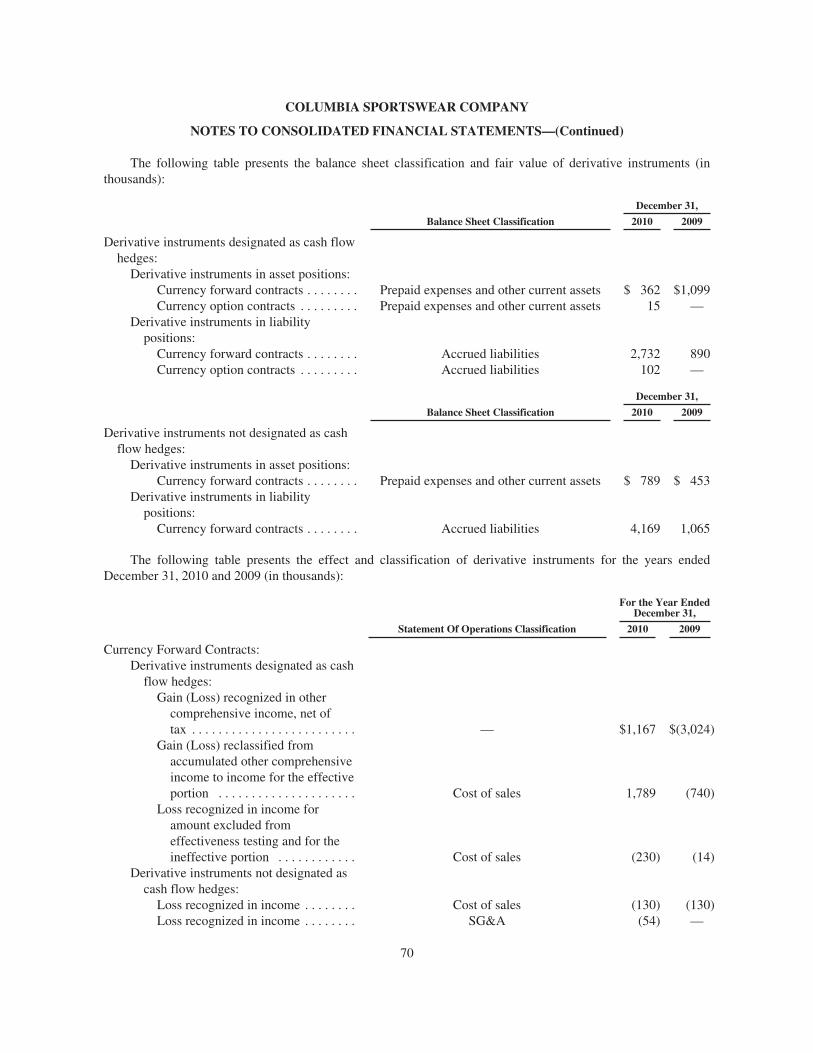
COLUMBIA SPORTSWEAR COMPANY
NOTES TO CONSOLIDATED FINANCIAL STATEMENTS—(Continued)
The following table presents the balance sheet classification and fair value of derivative instruments (inthousands):
Balance Sheet Classification
December 31,
2010 2009
Derivative instruments designated as cash flowhedges:
Derivative instruments in asset positions:Currency forward contracts . . . . . . . . Prepaid expenses and other current assets $ 362 $1,099Currency option contracts . . . . . . . . . Prepaid expenses and other current assets 15 —
Derivative instruments in liabilitypositions:
Currency forward contracts . . . . . . . . Accrued liabilities 2,732 890Currency option contracts . . . . . . . . . Accrued liabilities 102 —
Balance Sheet Classification
December 31,
2010 2009
Derivative instruments not designated as cashflow hedges:
Derivative instruments in asset positions:Currency forward contracts . . . . . . . . Prepaid expenses and other current assets $ 789 $ 453
Derivative instruments in liabilitypositions:
Currency forward contracts . . . . . . . . Accrued liabilities 4,169 1,065
The following table presents the effect and classification of derivative instruments for the years endedDecember 31, 2010 and 2009 (in thousands):
Statement Of Operations Classification
For the Year EndedDecember 31,
2010 2009
Currency Forward Contracts:Derivative instruments designated as cash
flow hedges:Gain (Loss) recognized in other
comprehensive income, net oftax . . . . . . . . . . . . . . . . . . . . . . . . . — $1,167 $(3,024)
Gain (Loss) reclassified fromaccumulated other comprehensiveincome to income for the effectiveportion . . . . . . . . . . . . . . . . . . . . . Cost of sales 1,789 (740)
Loss recognized in income foramount excluded fromeffectiveness testing and for theineffective portion . . . . . . . . . . . . Cost of sales (230) (14)
Derivative instruments not designated ascash flow hedges:
Loss recognized in income . . . . . . . . Cost of sales (130) (130)Loss recognized in income . . . . . . . . SG&A (54) —
70

COLUMBIA SPORTSWEAR COMPANY
NOTES TO CONSOLIDATED FINANCIAL STATEMENTS—(Continued)
NOTE 20—FAIR VALUE MEASURES
Certain assets and liabilities are reported at fair value on either a recurring or nonrecurring basis. Fair valueis defined as an exit price, representing the amount that would be received to sell an asset or paid to transfer aliability in an orderly transaction between market participants, under a three-tier fair value hierarchy whichprioritizes the inputs used in measuring fair value as follows:
Level 1 – observable inputs such as quoted prices in active liquid markets;Level 2 – inputs, other than the quoted market prices in active markets, which are observable, either
directly or indirectly; or observable market prices in markets with insufficient volume and/or infrequent transactions; and
Level 3 – unobservable inputs for which there is little or no market data available, which require thereporting entity to develop its own assumptions.
Assets and liabilities measured at fair value on a recurring basis as of December 31, 2010 are as follows (inthousands):
Level 1 Level 2 Level 3 Total
Assets:Cash equivalents
Money market funds . . . . . . . . . . . . . . . . . . . . . . . . . . . . . . . . $177,104 $ — $— $177,104Time deposits . . . . . . . . . . . . . . . . . . . . . . . . . . . . . . . . . . . . . 7,510 — — 7,510U.S. Government-backed municipal bonds . . . . . . . . . . . . . . — 5,560 — 5,560
Available-for-sale short-term investmentsShort-term municipal bond fund . . . . . . . . . . . . . . . . . . . . . . 15,624 — — 15,624U.S. Government-backed municipal bonds . . . . . . . . . . . . . . — 53,188 — 53,188
Other current assetsDerivative financial instruments (Note 19) . . . . . . . . . . . . . . — 1,166 — 1,166
Non-current assetsMutual fund shares . . . . . . . . . . . . . . . . . . . . . . . . . . . . . . . . . 1,670 — — 1,670
Total assets measured at fair value . . . . . . . . . . . . . . . . . $201,908 $59,914 $— $261,822
Liabilities:Accrued liabilities
Derivative financial instruments (Note 19) . . . . . . . . . . . . . . $ — $ 7,003 $— $ 7,003
Total liabilities measured at fair value . . . . . . . . . . . . . . $ — $ 7,003 $— $ 7,003
71

COLUMBIA SPORTSWEAR COMPANY
NOTES TO CONSOLIDATED FINANCIAL STATEMENTS—(Continued)
Assets and liabilities measured at fair value on a recurring basis at December 31, 2009 are as follows (inthousands):
Level 1 Level 2 Level 3 Total
Assets:Cash equivalents
Money market funds . . . . . . . . . . . . . . . . . . . . . . . . . . . . . . . . . $332,574 $ — $— $332,574Time deposits . . . . . . . . . . . . . . . . . . . . . . . . . . . . . . . . . . . . . . 16,844 — — 16,844
Available-for-sale short-term investmentsShort-term municipal bond fund . . . . . . . . . . . . . . . . . . . . . . . 20,247 — — 20,247Time deposits . . . . . . . . . . . . . . . . . . . . . . . . . . . . . . . . . . . . . . 2,512 — — 2,512
Other current assetsDerivative financial instruments (Note 19) . . . . . . . . . . . . . . . — 1,552 — 1,552
Non-current assetsMutual fund shares . . . . . . . . . . . . . . . . . . . . . . . . . . . . . . . . . . 826 — — 826
Total assets measured at fair value . . . . . . . . . . . . . . . . . . $373,003 $1,552 $— $374,555
Liabilities:Accrued liabilities
Derivative financial instruments (Note 19) . . . . . . . . . . . . . . . $ — $1,955 $— $ 1,955
Total liabilities measured at fair value . . . . . . . . . . . . . . . $ — $1,955 $— $ 1,955
Level 1 instrument valuations are obtained from real-time quotes for transactions in active exchangemarkets involving identical assets. Level 2 instrument valuations are obtained from inputs, other than quotedmarket prices in active markets, that are directly or indirectly observable in the marketplace and quoted prices inmarkets with limited volume or infrequent transactions.
There were no assets and liabilities measured at fair value on a nonrecurring basis at December 31, 2010 or2009.
72

SUPPLEMENTARY DATA—QUARTERLY FINANCIAL DATA (Unaudited)
The following table summarizes the Company’s quarterly financial data for the past two years endedDecember 31, 2010 (in thousands, except per share amounts):
2010First
QuarterSecondQuarter
ThirdQuarter
FourthQuarter
Net sales . . . . . . . . . . . . . . . . . . . . . . . . . . . . . . . . . . . . . . . . . . . . . $300,406 $221,831 $504,028 $457,259Gross profit . . . . . . . . . . . . . . . . . . . . . . . . . . . . . . . . . . . . . . . . . . . 127,304 96,922 214,281 190,897Net income (loss) . . . . . . . . . . . . . . . . . . . . . . . . . . . . . . . . . . . . . . 9,228 (10,604) 52,205 26,208Earnings (loss) per share
Basic . . . . . . . . . . . . . . . . . . . . . . . . . . . . . . . . . . . . . . . . . . . . $ 0.27 $ (0.31) $ 1.55 $ 0.78Diluted . . . . . . . . . . . . . . . . . . . . . . . . . . . . . . . . . . . . . . . . . . . 0.27 (0.31) 1.53 0.77
2009First
QuarterSecondQuarter
ThirdQuarter
FourthQuarter
Net sales . . . . . . . . . . . . . . . . . . . . . . . . . . . . . . . . . . . . . . . . . . . . . $271,966 $179,268 $434,473 $358,316Gross profit . . . . . . . . . . . . . . . . . . . . . . . . . . . . . . . . . . . . . . . . . . . 110,495 74,307 188,599 150,677Net income (loss) . . . . . . . . . . . . . . . . . . . . . . . . . . . . . . . . . . . . . . 6,898 (9,878) 46,915 23,086Earnings (loss) per share
Basic . . . . . . . . . . . . . . . . . . . . . . . . . . . . . . . . . . . . . . . . . . . . $ 0.20 $ (0.29) $ 1.39 $ 0.68Diluted . . . . . . . . . . . . . . . . . . . . . . . . . . . . . . . . . . . . . . . . . . . 0.20 (0.29) 1.38 0.68
Item 9. CHANGES IN AND DISAGREEMENTS WITH ACCOUNTANTS ON ACCOUNTING ANDFINANCIAL DISCLOSURE
None.
Item 9A. CONTROLS AND PROCEDURES
Evaluation of Disclosure Controls and Procedures
Our management has evaluated, under the supervision and with the participation of our chief executiveofficer and chief financial officer, the effectiveness of our disclosure controls and procedures as of the end of theperiod covered by this report pursuant to Rule 13a-15(b) under the Securities Exchange Act of 1934 (the“Exchange Act”). Based on that evaluation, our chief executive officer and chief financial officer have concludedthat, as of the end of the period covered by this report, our disclosure controls and procedures were effective inensuring that information required to be disclosed in our Exchange Act reports is (1) recorded, processed,summarized and reported in a timely manner, and (2) accumulated and communicated to our management,including our chief executive officer and chief financial officer, as appropriate to allow timely decisionsregarding required disclosure.
Design and Evaluation of Internal Control Over Financial Reporting
Report of Management
Our management is responsible for establishing and maintaining adequate internal control over financialreporting. All internal control systems, no matter how well designed, have inherent limitations. Therefore, eventhose systems determined to be effective can provide only reasonable assurance with respect to financialstatement preparation and presentation.
Under the supervision and with the participation of our management, we assessed the effectiveness of ourinternal control over financial reporting as of December 31, 2010. In making this assessment, we used the criteriaset forth by the Committee of Sponsoring Organizations of the Treadway Commission in Internal Control –
73
Integrated Framework. Based on our assessment we believe that, as of December 31, 2010, the Company’sinternal control over financial reporting is effective based on those criteria.
There has been no change in our internal control over financial reporting that occurred during our fiscalquarter ended December 31, 2010 that has materially affected, or is reasonably likely to materially affect, ourinternal control over financial reporting.
Our independent auditors have issued an audit report on the effectiveness of our internal control overfinancial reporting as of December 31, 2010, which is included herein.
74

Report of Independent Registered Public Accounting Firm
To the Board of Directors and ShareholdersColumbia Sportswear CompanyPortland, Oregon
We have audited the internal control over financial reporting of Columbia Sportswear Company andsubsidiaries (the “Company”) as of December 31, 2010, based on criteria established in Internal Control—Integrated Framework issued by the Committee of Sponsoring Organizations of the Treadway Commission. TheCompany’s management is responsible for maintaining effective internal control over financial reporting and forits assessment of the effectiveness of internal control over financial reporting, included in the accompanying“Report of Management”. Our responsibility is to express an opinion on the Company’s internal control overfinancial reporting based on our audit.
We conducted our audit in accordance with the standards of the Public Company Accounting OversightBoard (United States). Those standards require that we plan and perform the audit to obtain reasonable assuranceabout whether effective internal control over financial reporting was maintained in all material respects. Ouraudit included obtaining an understanding of internal control over financial reporting, assessing the risk that amaterial weakness exists, testing and evaluating the design and operating effectiveness of internal control basedon the assessed risk, and performing such other procedures as we considered necessary in the circumstances. Webelieve that our audit provides a reasonable basis for our opinion.
A company’s internal control over financial reporting is a process designed by, or under the supervision of,the company’s principal executive and principal financial officers, or persons performing similar functions, andeffected by the company’s board of directors, management, and other personnel to provide reasonable assuranceregarding the reliability of financial reporting and the preparation of financial statements for external purposes inaccordance with generally accepted accounting principles. A company’s internal control over financial reportingincludes those policies and procedures that (1) pertain to the maintenance of records that, in reasonable detail,accurately and fairly reflect the transactions and dispositions of the assets of the company; (2) provide reasonableassurance that transactions are recorded as necessary to permit preparation of financial statements in accordancewith generally accepted accounting principles, and that receipts and expenditures of the company are being madeonly in accordance with authorizations of management and directors of the company; and (3) provide reasonableassurance regarding prevention or timely detection of unauthorized acquisition, use, or disposition of thecompany’s assets that could have a material effect on the financial statements.
Because of the inherent limitations of internal control over financial reporting, including the possibility ofcollusion or improper management override of controls, material misstatements due to error or fraud may not beprevented or detected on a timely basis. Also, projections of any evaluation of the effectiveness of the internalcontrol over financial reporting to future periods are subject to the risk that the controls may become inadequatebecause of changes in conditions, or that the degree of compliance with the policies or procedures maydeteriorate.
In our opinion, the Company maintained, in all material respects, effective internal control over financialreporting as of December 31, 2010, based on the criteria established in Internal Control—Integrated Frameworkissued by the Committee of Sponsoring Organizations of the Treadway Commission.
We have also audited, in accordance with the standards of the Public Company Accounting Oversight Board(United States), the consolidated financial statements as of and for the year ended December 31, 2010 of theCompany, and our report dated March 11, 2011, expressed an unqualified opinion on those financial statements.
DELOITTE & TOUCHE LLPPortland, OregonMarch 11, 2011
Item 9B. OTHER INFORMATION
None.
75

PART III
Item 10. DIRECTORS, EXECUTIVE OFFICERS AND CORPORATE GOVERNANCE
The sections of our 2011 Proxy Statement entitled “Election of Directors,” “Corporate Governance—Codeof Business Conduct and Ethics,” “Corporate Governance—Board Committees,” “Corporate Governance—Director Nomination Policy,” and “Section 16(a) Beneficial Ownership Reporting Compliance” are incorporatedherein by reference.
See Item 4A of this Annual Report on Form 10-K for information regarding our executive officers.
Item 11. EXECUTIVE COMPENSATION
The sections of our 2011 Proxy Statement entitled “Executive Compensation,” “Director Compensation,”“Corporate Governance—Compensation Committee Interlocks and Insider Participation” and “CompensationCommittee Report” are incorporated herein by reference.
Item 12. SECURITY OWNERSHIP OF CERTAIN BENEFICIAL OWNERS AND MANAGEMENT ANDRELATED STOCKHOLDER MATTERS
The section of our 2011 Proxy Statement entitled “Security Ownership of Certain Beneficial Owners andManagement” is incorporated herein by reference.
The following table provides information about compensation plans (including individual compensationarrangements) under which our equity securities are authorized for issuance to employees or non-employees(such as directors and consultants), at December 31, 2010:
Equity Compensation Plan Information
Plan Category
Number ofsecurities to be
issued uponexercise of
outstanding options,warrants and rights (1)
Weighted-averageexercise price of
outstandingoptions, warrants
and rights (2)
Number of securitiesremaining available forfuture issuance underequity compensation
plans (excludingsecurities reflected in
column a)
(a) (b) (c)
Equity compensation plans approved by securityholders:
1997 Stock Incentive Plan . . . . . . . . . . . . . . . 2,201,009 $42.84 1,711,7681999 Employee Stock Purchase Plan (3) . . . . — — 474,444
Equity compensation plans not approved bysecurity holders . . . . . . . . . . . . . . . . . . . . . . . . . . — — —
Total . . . . . . . . . . . . . . . . . . . . . . . . . . . . . . . . . . . . 2,201,009 $42.84 2,186,212
(1) The number of outstanding shares to be issued under the 1997 Stock Incentive Plan includes stock optionsand restricted stock units.
(2) The weighted-average exercise price excludes 328,795 shares issuable upon the vesting of outstandingrestricted stock units, which have no exercise price.
(3) The 1999 Employee Stock Purchase Plan was suspended indefinitely effective July 1, 2005.
76
Item 13. CERTAIN RELATIONSHIPS, RELATED TRANSACTIONS, AND DIRECTORINDEPENDENCE
The sections of our 2011 Proxy Statement entitled “Corporate Governance—Certain Relationships andRelated Transactions,” “Corporate Governance—Related Transactions Approval Process,” and “CorporateGovernance—Independence” are incorporated herein by reference.
Item 14. PRINCIPAL ACCOUNTANT FEES AND SERVICES
The sections of our 2011 Proxy Statement entitled “Ratification of Selection of Independent RegisteredPublic Accounting Firm—Principal Accountant Fees and Services” and “Pre-approval Policy” are incorporatedherein by reference.
77
PART IV
Item 15. EXHIBITS AND FINANCIAL STATEMENT SCHEDULE
(a)(1) and (a)(2) Financial Statements. The Financial Statements of Columbia and Supplementary Data filedas part of this Annual Report on Form 10-K are on pages 36 to 59 of this Annual Report.
(b) See Exhibit Index beginning on page 64 for a description of the documents that are filed as Exhibits tothis Annual Report on Form 10-K or incorporated herein by reference.
Schedule II, Valuation and Qualifying Accounts, is omitted because the information is included in the Notesto the Consolidated Financial Statements.
78
SIGNATURES
Pursuant to the requirements of Section 13 or 15(d) of the Securities Exchange Act of 1934, the registranthas duly caused this report to be signed on its behalf by the undersigned, thereunto duly authorized.
COLUMBIA SPORTSWEAR COMPANY
By: /s/ THOMAS B. CUSICK
Thomas B. CusickSenior Vice President, Chief Financial Officer and
Treasurer
Date: March 11, 2011
Pursuant to the requirements of the Securities Exchange Act of 1934, this report has been signed below bythe following persons on behalf of the registrant and in the capacities and on the date indicated.
Signatures Title
/s/ TIMOTHY P. BOYLE
Timothy P. Boyle
President and Chief Executive Officer and Director(Principal Executive Officer)
/s/ THOMAS B. CUSICK
Thomas B. Cusick
Senior Vice President, Chief Financial Officer andTreasurer (Principal Financial and AccountingOfficer)
/s/ GERTRUDE BOYLE
Gertrude Boyle
Chairman of the Board of Directors
/s/ SARAH A. BANY
Sarah A. Bany
Director
/s/ EDWARD S. GEORGE
Edward S. George
Director
/s/ MURREY R. ALBERS
Murrey R. Albers
Director
/s/ JOHN W. STANTON
John W. Stanton
Director
/s/ WALTER T. KLENZ
Walter T. Klenz
Director
/s/ STEPHEN E. BABSON
Stephen E. Babson
Director
/s/ ANDY D. BRYANT
Andy D. Bryant
Director
Date: March 11, 2011
79

EXHIBIT INDEX
In reviewing the agreements included as exhibits to this Annual Report on Form 10-K, please rememberthey are included to provide you with information regarding their terms and are not intended to provide any otherfactual or disclosure information about Columbia or the other parties to the agreements. The agreements maycontain representations and warranties by each of the parties to the applicable agreement. These representationsand warranties have been made solely for the benefit of the other party or parties to the applicable agreementand:
• should not in all instances be treated as categorical statements of fact, but rather as a means ofallocating the risk to one of the parties if those statements prove to be inaccurate;
• may have been qualified by disclosures that were made to the other party or parties in connection withthe negotiation of the applicable agreement, which disclosures are not necessarily reflected in theagreement;
• may apply standards of materiality in a manner that is different from what may be viewed as materialto you or other investors; and
• were made only as of the date of the applicable agreement or other date or dates that may be specifiedin the agreement and are subject to more recent developments.
Accordingly, these representations and warranties may not describe the actual state of affairs as of the datethey were made or at any other time. Additional information about Columbia may be found elsewhere in thisAnnual Report on Form 10-K and Columbia’s other public filings, which are available without charge throughthe SEC’s website at http://www.sec.gov.
Exhibit No. Exhibit Name
3.1 Third Restated Articles of Incorporation (incorporated by reference to exhibit 3.1 to theCompany’s Quarterly Report on Form 10-Q for the quarterly period ended March 31, 2000) (FileNo. 000-23939)
3.2 Amendment to Third Restated Articles of Incorporation (incorporated by reference to exhibit 3.1to the Company’s Quarterly Report on Form 10-Q for the quarterly period ended June 30, 2002)(File No. 0-23939)
3.3 2000 Restated Bylaws (incorporated by reference to exhibit 3.2 to the Company’s QuarterlyReport on Form 10-Q for the quarterly period ended March 31, 2000) (File No. 000-23939)
4.1 See Article II of Exhibit 3.1, as amended by Exhibit 3.2, and Article I of Exhibit 3.3
+*10.1 Columbia Sportswear Company 1997 Stock Incentive Plan, as amended (incorporated byreference to exhibit 10.1 to the Company’s Quarterly Report on Form 10-Q for the quarterlyperiod ended June 30, 2009) (File No. 000-23939)
+*10.2 Form of Nonstatutory Stock Option Agreement for stock options granted prior to July 20, 2006
+10.2(a) Form of Executive Stock Option Agreement (incorporated by reference to exhibit 10.3 (a) to theCompany’s Annual Report on Form 10-K for the year ended December 31, 2000) (File No.000-23939)
+10.2(b) Form of Nonstatutory Stock Option Agreement for stock options granted on or after July 20, 2006and before January 23, 2009 (incorporated by reference to exhibit 99.1 to the Company’s Form8-K filed on July 26, 2006)
+10.2(c) Form of Performance-based Restricted Stock Unit Award Agreement for performance-basedrestricted stock units granted on or after March 29, 2010 (incorporated by reference to exhibit 10.1to the Company’s Quarterly Report on Form 10-Q for the quarterly period ended March 31, 2010)(File No. 000-23939)
80

Exhibit No. Exhibit Name
+10.2(d) Form of Restricted Stock Unit Award Agreement for awards granted prior to January 23, 2009(incorporated by reference to exhibit 99.2 to the Company’s Form 8-K filed on July 26, 2006)
+10.2(e) Form of Performance-Based Restricted Stock Unit Award Agreement (incorporated by referenceto exhibit 99.3 to the Company’s Form 8-K filed on July 26, 2006)
+10.2(f) Form of Performance-based Restricted Stock Unit Award Agreement for performance-basedrestricted stock units granted on or after February 24, 2009 (incorporated by reference to exhibit10.1 to the Company’s Quarterly Report on Form 10-Q for the quarterly period ended March 31,2009) (File No. 000-23939)
+10.2(g) Form of Nonstatutory Stock Option Agreement for stock options granted on or after January 23,2009 (incorporated by reference to exhibit 10.2 (e) to the Company’s Annual Report on Form10-K for the year ended December 31, 2008) (File No. 000-23939)
+10.2(h) Form of Restricted Stock Unit Award Agreement for awards granted on or after January 23, 2009(incorporated by reference to exhibit 10.2 (f) to the Company’s Annual Report on Form 10-K forthe year ended December 31, 2008) (File No. 000-23939)
+10.2(i) Columbia Sportswear Company 401(k) Excess Plan (incorporated by reference to exhibit 10.2 tothe Company’s Quarterly Report on Form 10-Q for the quarterly period ended March 31, 2009)(File No. 000-23939)
+10.4 Columbia Sportswear Company Change in Control Severance Plan (incorporated by reference tothe Company’s Form 8-K filed on January 29, 2009) (File No. 000-23939)
10.5 Credit Agreement between the Company and Wells Fargo Bank National Association dated June15, 2010 (incorporated by reference to the Company’s Form 8-K filed on June 18, 2010) (File No.0-23939).
10.5(a) First Amendment to Credit Agreement between the Company and Wells Fargo Bank NationalAssociation dated December 16, 2010 (incorporated by reference to the Company’s Form 8-Kfiled on December 17, 2010) (File No. 0-23939).
*10.9 Form of Indemnity Agreement for Directors
+10.10 1999 Employee Stock Purchase Plan, as amended (incorporated by reference to exhibit 10.21 tothe Company’s Annual Report on Form 10-K for the year ended December 31, 2001) (File No.000-23939)
+10.11 Executive Incentive Compensation Plan, as amended (incorporated by reference to exhibit 10.1 tothe Company’s Quarterly Report on Form 10-Q for the quarterly period ended March 31, 2000)(File No. 000-23939)
+10.12 Form of Indemnity Agreement for Directors and Executive Officers (incorporated by reference toexhibit 10.23 to the Company’s Annual Report on Form 10-K for the year ended December 31,2004)
21.1 Subsidiaries of the Company
23.1 Consent of Deloitte & Touche LLP
31.1 Rule 13a-14(a) Certification of Timothy P. Boyle, President and Chief Executive Officer
31.2 Rule 13a-14(a) Certification of Thomas B. Cusick, Senior Vice President, Chief Financial Officerand Treasurer
32.1 Section 1350 Certification of Timothy P. Boyle, President and Chief Executive Officer
32.2 Section 1350 Certification of Thomas B. Cusick, Senior Vice President, Chief Financial Officerand Treasurer
+ Management Contract or Compensatory Plan* Incorporated by reference to the Company’s Registration Statement on Form S-1 (Reg. No. 333-43199).
81