TABLE OF CONTENTS - MarketResearch · Adidas Group Company Overview. 3 Business Strategies...
25
1
Transcript of TABLE OF CONTENTS - MarketResearch · Adidas Group Company Overview. 3 Business Strategies...
1
2
TABLE OF CONTENTS
1. The US Apparel and Footwear Market Introduction
2. The US Apparel and Footwear Market Size by Personal Consumption Expenditure, 2005-2010
3. The US Apparel and Footwear Per Capita Consumption and Contribution to GDP, 2005-2010
4. The US Apparel and Footwear Market Trends and Developments
5. The US Apparel Market
5.1. The US Apparel Market Size by Personal Consumption Expenditure, 2005-2010
5.2. The US Apparel Per Capita Consumption and Contribution to GDP, 2005-2010
5.3. The US Apparel Market Segmentation, 2005-2010
5.3.1. By Men’s Wear, Women’s Wear and Children’s Wear Market Size by Personal Consumption Expenditure, 2005-2010
5.3.2. By Men’s, Women’s, Children’s and Family Clothing Retail Stores
5.3.3. By Athletic and Non Athletic Wear, 2005-2010
5.4. The US Athletic Apparels Market
5.4.1. Market Size by Personal Consumption Expenditure, 2005-2010
5.4.2. The US Athletic Apparel Market Major Players’ Market Share, 2010
5.4.3. The US Athletic Apparel Future Outlook and Future Projections, 2011-2015
5.4.4. Major Athletic Apparel Company Profiles
5.4.4.1. NIKE
Company Overview
Business Strategies
Financial Performance
5.4.4.2. Adidas Group
Company Overview
3
Business Strategies
Financial Performance
5.5. The US Fashion Apparel Market
5.5.1. Market Size by Sales, 2008-2010
5.5.2. The US Fashion Wear Market Segmentation by Women’s, Men’s, Children’s Fashion Apparel, 2008-2010
5.6. SWOT Analysis of the US Apparel Market
Strengths
Weaknesses
Opportunities
Threats
5.7. The US Apparel Market Major Players’ Market Share, 2010
5.8. The US Apparel Market Future Outlook and Projections, 2011-2015
5.8.1. Cause and Effect Relationship between Dependent and Independent Factors Prevailing in the US Apparel Market
5.8.2. The US Apparel Market Future Projections, 2011-2015
5.8.3. Women’s, Men’s and Children’s Apparel Future Projections, 2011-2015
5.9. Company Profile of Major Players Operating in the US Apparel Market, 2008-2010
5.9.1. GAP Inc.
Company Overview
Business Strategies
Financial and Operational Performance
5.9.1.1. TJX Companies Inc.
Company Overview
Business Strategies
Financial and Operational Performance

4
5.9.1.2. VF Corp.
Company Overview
Business Strategies
Financial Performance
5.9.1.3. Limited Brands
Company Overview
Business Strategies
Financial and Operational Performance
5.9.1.4. Ross Stores
Company Overview
Business Strategies
Financial and Operational Performance
6. The US Footwear Market
6.1. The US Footwear Market Size by Personal Consumption Expenditure, 2005-2010
6.2. The US Footwear Per Capita Consumption and Contribution to GDP, 2005-2010
6.3. The US Footwear Market Segmentation, 2005-2010
6.3.1. By Non-Athletic and Athletic Footwear, 2005-2010
6.4. The US Athletic Footwear Market
6.4.1. Market Size by Personal Consumption Expenditure, 2005-2010
6.4.2. The US Athletic Footwear Market Segmentation, 2005-2010
6.4.2.1. By Gender, 2005-2010
6.4.2.2. By Product Category, 2005-2010
6.4.2.3. By Channel of Distribution
6.4.3. The US Athletic Footwear Market Major Players’ Market Share, 2010
6.4.4. The US Athletic Footwear Future Outlook and Projections, 2011-2015
6.4.5. Major Athletic Footwear Company Profiles
5
6.4.5.1. NIKE
Company Overview
Business Strategies
Financial Performance
6.4.5.2. Foot Locker
Company Overview
Business Strategies
Financial and Operational Performance
6.4.5.3. Skechers USA, Inc.
Company Overview
Financial Performance
6.4.5.4. Adidas Group
Company Overview
Business Strategies
Financial Performance
6.5. The US Fashion Footwear Market
6.5.1. Market Size by Sales, 2008-2010
6.5.2. The US Fashion Footwear Market Segmentation, 2008-2010
6.5.2.1. By Women’s, Men’s and Children’s Footwear, 2008-2010
6.6. SWOT Analysis of the US Footwear Market
Strengths
Weaknesses
Opportunities
Threats
6.7. The US Footwear Market Major Players’ Market Share, 2010
6.8. The US Footwear Market Future Outlook and Projections, 2011-2015
6
6.8.1. Cause and Effect Relationship between Dependent and Independent Factors Prevailing in the US Footwear Market
6.8.2. The US Footwear Future Projections, 2011-2015
6.9. Company Profile of Major Players Operating in the US Footwear Market, 2008-2010
6.9.1. Collective Brands
Company Overview
Business Strategies
Financial Performance
6.9.2. Brown Shoes
Company Overview
Business Strategies
Financial and Operational Performance
7. Macro Economic and Industry Factors: Current and Projections
7.1. Population, 2005-2015
7.2. Demographic Distribution of Population on the basis of Age, 2009-2015
7.3. GDP, 2005-2015
7.4. Personal Disposable Income, 2005-2015
7.5. The US Apparel and Footwear Exports, 2005-2015
7.6. The US Apparel and Footwear Imports, 2005-2015
7.7. Consumer Price Index, 2005-2015
8. Appendix
8.1. Market Definition
8.2. Abbreviations
8.3. Research Methodology
Data Collection Methods
Approach

7
Variables (Dependent and Independent)
Multi Factor Based Sensitivity Model
Final Conclusion
8.4. Disclaimer
8
LIST OF FIGURES
Figure 1: The US Apparel and Footwear Market Size by Personal Consumption Expenditure in USD Million, 2005-2010
Figure 2: The US Apparel and Footwear Per Capita Consumption in USD and Contribution to GDP in Percentage, 2005-2010
Figure 3: The US E-Commerce Retail Sales of Apparel and Footwear in USD Million, 2005-2010
Figure 4: The US Apparel Market Size by Personal Consumption Expenditure in USD Million, 2005-2010
Figure 5: The US Apparel Per Capita Consumption in USD and Contribution to GDP in Percentage, 2005-2010
Figure 6: The US Apparel Market Segmentation by Women’s Wear, Men’s Wear and Children’s Wear on the Basis of Personal Consumption Expenditure in Percentage, 2005-2010
Figure 7: The US Apparel Market Segmentation by Non-Athletic and Athletic Apparels on the Basis of Personal Consumption Expenditure in Percentage (%), 2005-2010
Figure 8: The US Athletic Apparel Market Size by Personal Consumption Expenditure in USD Million, 2005-2010
Figure 9: The Projected US Athletic Apparel Market Size by Personal Consumption Expenditure in USD Million, 2011-2015
Figure 10: Total Domestic Athletic Apparel Revenue of NIKE in USD Million, 2008-2010
Figure 11: Total Domestic Athletic Apparel Revenue of Adidas Group in USD Million, 2008-2010
Figure 12: The US Fashion Apparel Market Size by Sales in USD Million, 2008-2010
Figure 13: The US Fashion Apparel Market Segmentation by Women’s, Men’s and Children’s Apparel on the Basis of Sales in Percentage, 2008-2010
Figure 14: The US Fashion Apparel Market Segmentation by Women’s, Men’s and Children’s Apparel on the Basis of Sales in USD Million, 2008-2010
Figure 15: The Projected US Apparel Market Size by Personal Consumption Expenditure in USD Million, 2011-2015

9
Figure 16: The Projected US Apparel Market Size by Women’s, Men’s and Children’s Apparel on the Basis of Personal Consumption Expenditure in Percentage, 2011-2015
Figure 17: Total Domestic Apparel Revenue of GAP Inc. in USD Million, 2008-2010
Figure 18: Total Domestic Apparel Revenue of TJX Companies Inc. in USD Million, 2008-2010
Figure 19: Total Domestic Apparel Revenue of VF Corp. in USD Million, 2008-2010
Figure 20: Total Domestic Apparel Revenue of Limited Brands in USD Million, 2008-2010
Figure 21: Total Domestic Apparel Revenue of Ross Stores in USD Million, 2008-2010
Figure 22: The US Footwear Market Size by Personal Consumption Expenditure in USD Million, 2005-2010
Figure 23: The US Footwear Per Capita Consumption in USD and Contribution to GDP in Percentage, 2005-2010
Figure 24: The US Footwear Market Segmentation by Non-Athletic and Athletic Footwear by Personal Consumption Expenditure in Percentage (%), 2005-2010
Figure 25: The US Athletic Footwear Market Size by Personal Consumption Expenditure in USD Million, 2005-2010
Figure 26: The US Athletic Footwear Market Segmentation by Female and Male on the Basis of Personal Consumption Expenditure in Percentage, 2005-2010
Figure 27: The US Athletic Footwear Segmentation by Channel of Distribution on the Basis of Sales in Percentage, 2010
Figure 28: The Projected US Athletic Footwear Market Size by Personal Consumption Expenditure in USD Million, 2011-2015
Figure 29: Total Domestic Footwear Revenue of Nike in USD Million, 2008-2010
Figure 30: Total Domestic Footwear Revenue of Foot Locker in USD Million, 2008-2010
Figure 31: Total Domestic Footwear Revenue of Skechers USA, Inc. in USD Million, 2008-2010
Figure 32: Total Domestic Footwear Revenue of Adidas Group in USD Million, 2008-2010
Figure 33: The US Fashion Footwear Market Size by Sales in USD Million, 2008-2010
Figure 34: The US Fashion Footwear Market Segmentation by Women’s, Men’s and Children’s Footwear on the Basis of Sales in Percentage, 2008-2010
10
Figure 35: The Projected US Footwear Market Size by Personal Consumption Expenditure in USD Million, 2011-2015
Figure 36: Total Domestic Footwear Revenue of Collective Brands in USD Million, 2008-2010
Figure 37: Total Domestic Footwear Revenue of Brown Shoes in USD Million, 2008-2010
Figure 38: The US Population in Millions, 2005-2015
Figure 39: The US GDP in USD Million, 2005-2015
Figure 40: The US Personal Disposable Income in USD Millions, 2005-2015
Figure 41: The US Apparel and Footwear Exports in USD Millions, 2005-2015
Figure 42: The US Apparel and Footwear Imports in USD Millions, 2005-2015
Figure 43: The US Consumer Index, 2005-2015

11
LIST OF TABLES
Table 1: Average Price of Athletic Shoes by Purpose in USD, 2008-2010
Table 2: The US Apparel Market Segmentation by Women’s Wear, Men’s Wear and Children’s Wear on the Basis of Personal Consumption Expenditure in USD Million, 2005-2010
Table 3: The US Apparel Market Segmentation on the Basis of Sales by Men’s, Women’s, Children’s and Family Clothing Stores in USD Million, 2005-2010
Table 4: The US Apparel Market Segmentation by Non-Athletic and Athletic Apparels on the Basis of Personal Consumption Expenditure in USD Million, 2005-2010
Table 5: The US Athletic Apparel Market’s Major Players’ Revenue in USD Million and Market Share in Percentage in 2010
Table 6: Total Number of NIKE Stores in US and Other Territories in Units in 2010
Table 7: Total Number of Retail Stores of Adidas Group in US and other Territories in Units in 2010
Table 8: The US Apparel Market Major Players’ Revenue in USD Million and Market Share in Percentage in 2010
Table 9: Cause and Effect Relationship Analysis between Industry Factors and Expected Industry Prospects of the US Apparel Market
Table 10: The Projected US Apparel Market Size by Women’s, Men’s and Children’s on the Basis of Personal Consumption Expenditure in USD Million, 20011-2015
Table 11: Total Number of Stores of GAP Inc. in North America, Europe and Asia in Units in 2010
Table 12: GAP Inc. Retail Store Operational Information on the Basis of Square Footage in million, 2008-2010
Table 13: Total Number of Stores of TJX Companies Inc. in the US, Canada and Europe in Units in FY’2011
Table 14: TJX Companies Inc. Retail Store Operational Information on the Basis of Selling Square Footage in Thousands, 2008-2010
Table 15: VF’s Manufacturing, Distribution and Administrative Owned and Leased Facilities, in Square Feet, in 2010
Table 16: Total Number of Stores of Limited Brands in the US and Canada in Units in 2010
12
Table 17: Limited Brands Retail Store Operational Information on the Basis of Selling Square Footage in Thousands, 2008-2010
Table 18: Total Number of Stores of Ross Stores in the US in Units in 2008-2010
Table 19: Ross Stores Retail Store Operational Information on the Basis of Selling Square Footage in Thousands, 2008-2010
Table 20: The US Athletic Footwear Market Segmentation by Male and Female on the Basis of Personal Consumption Expenditure in USD Million, 2005-2010
Table 21: The US Athletic Footwear Market Segmentation by Product Category on the Basis of Personal Consumption Expenditure in Percentage (%), 2005-2010
Table 22: The US Athletic Footwear Market Segmentation on the Basis of Personal Consumption Expenditure by Product Category in USD Million, 2005-2010
Table 23: The US Athletic Footwear Market’s Major Players’ Revenue in USD Million and Market Share in Percentage in 2010
Table 24: Total Number of NIKE Stores in the US and Abroad in Units in 2010
Table 25: Total Number of Foot Locker Stores in the US, Canada, Europe and Australia in 2010
Table 26: Foot Locker Retail Store Operational Information on the Basis of Selling Square Footage in million, 2008-2010
Table 27: Total Number of Retail Stores of Skechers USA, Inc. in the US and Other Countries in Units in 2010
Table 28: Total Number of Retail Stores of Adidas Group in US and other Territories in Units in 2010
Table 29: The US Fashion Footwear Market Segmentation by Women’s, Men’s and Children’s Footwear on the Basis of Sales in USD Million, 2008-2010
Table 30: The US Footwear Market’s Major Players’ Revenue in USD Million and Market Share in Percentage in 2010
Table 31: Cause and Effect Relationship Analysis between Industry Factors and Expected Industry Prospects of the US Footwear Market
Table 32: Total Number of Retail stores of Collective Brands in US, Canada, Central America and South America and Other territories in Units in 2010
13
Table 33: Total Number of Retail Stores of Brown Shoes in US, Canada, Guam and China in Units in 2010
Table 34: Brown Shoe Company Retail Store Operational Information on the Basis of Selling Square Footage in Thousand, 2008-2010
Table 35: Demographic Distribution of Population in the US on the basis of Age, in Million, 2009-2015
Table 36: Correlation Matrix of the US Apparel Market
Table 37: Regression Coefficients Output of the US Apparel Market
14
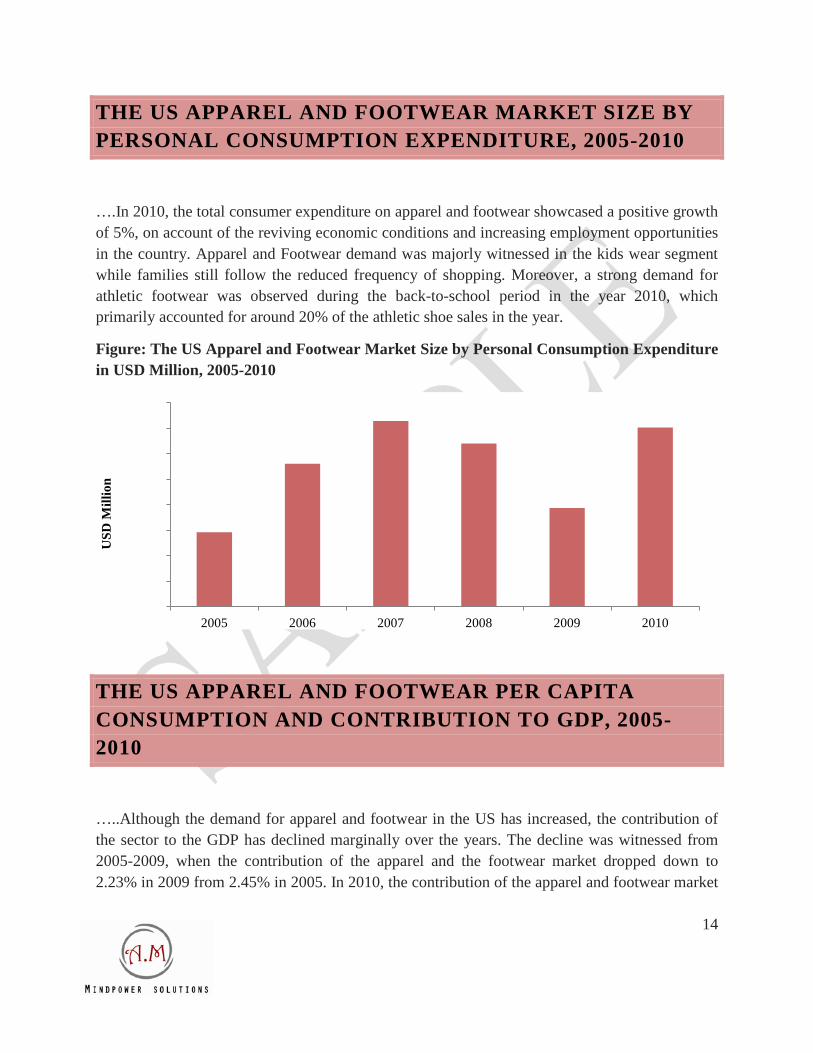
THE US APPAREL AND FOOTWEAR MARKET SIZE BY PERSONAL CONSUMPTION EXPENDITURE, 2005-2010
….In 2010, the total consumer expenditure on apparel and footwear showcased a positive growth of 5%, on account of the reviving economic conditions and increasing employment opportunities in the country. Apparel and Footwear demand was majorly witnessed in the kids wear segment while families still follow the reduced frequency of shopping. Moreover, a strong demand for athletic footwear was observed during the back-to-school period in the year 2010, which primarily accounted for around 20% of the athletic shoe sales in the year.
Figure: The US Apparel and Footwear Market Size by Personal Consumption Expenditure in USD Million, 2005-2010
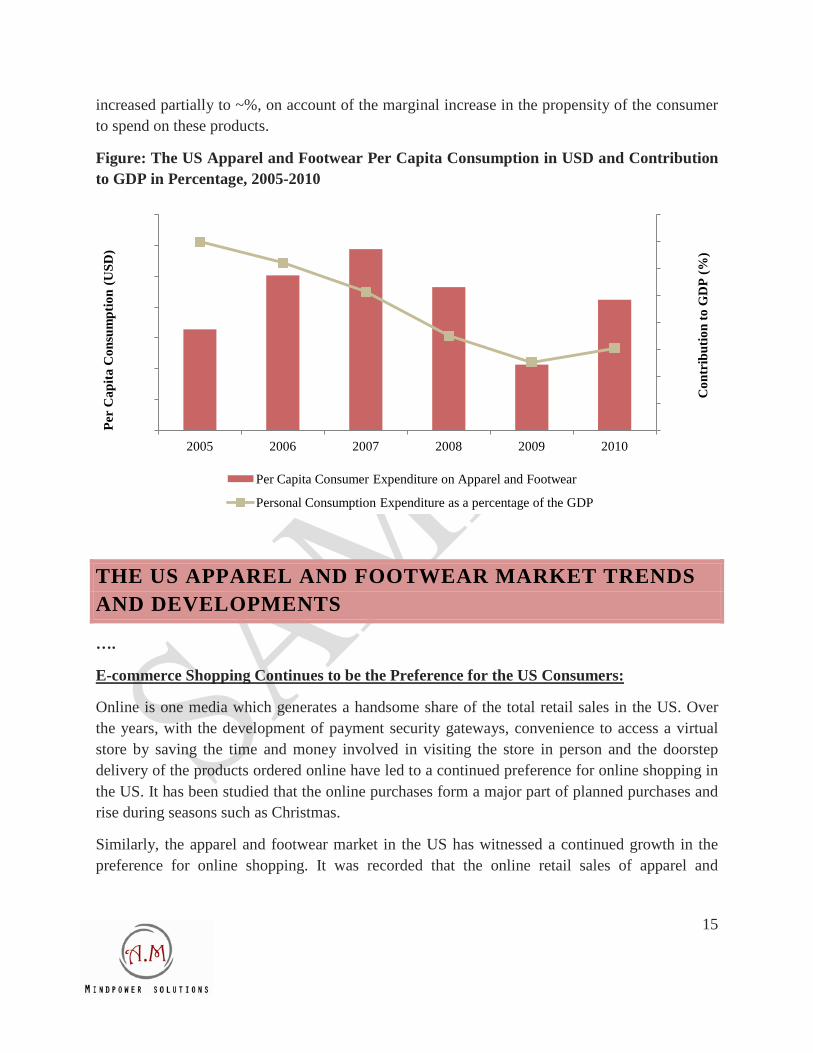
THE US APPAREL AND FOOTWEAR PER CAPITA CONSUMPTION AND CONTRIBUTION TO GDP, 2005-2010
…..Although the demand for apparel and footwear in the US has increased, the contribution of the sector to the GDP has declined marginally over the years. The decline was witnessed from 2005-2009, when the contribution of the apparel and the footwear market dropped down to 2.23% in 2009 from 2.45% in 2005. In 2010, the contribution of the apparel and footwear market
295,000
300,000
305,000
310,000
315,000
320,000
325,000
330,000
335,000
2005 2006 2007 2008 2009 2010
USD
Mill
ion
15
increased partially to ~%, on account of the marginal increase in the propensity of the consumer to spend on these products.
Figure: The US Apparel and Footwear Per Capita Consumption in USD and Contribution to GDP in Percentage, 2005-2010
THE US APPAREL AND FOOTWEAR MARKET TRENDS AND DEVELOPMENTS
….
Online is one media which generates a handsome share of the total retail sales in the US. Over the years, with the development of payment security gateways, convenience to access a virtual store by saving the time and money involved in visiting the store in person and the doorstep delivery of the products ordered online have led to a continued preference for online shopping in the US. It has been studied that the online purchases form a major part of planned purchases and rise during seasons such as Christmas.
E-commerce Shopping Continues to be the Preference for the US Consumers:
Similarly, the apparel and footwear market in the US has witnessed a continued growth in the preference for online shopping. It was recorded that the online retail sales of apparel and
2.10%
2.15%
2.20%
2.25%
2.30%
2.35%
2.40%
2.45%
2.50%
980.00
1,000.00
1,020.00
1,040.00
1,060.00
1,080.00
1,100.00
1,120.00
2005 2006 2007 2008 2009 2010
Con
trib
utio
n to
GD
P (%
)
Per
Cap
ita C
onsu
mpt
ion
(USD
)
Per Capita Consumer Expenditure on Apparel and Footwear
Personal Consumption Expenditure as a percentage of the GDP
16
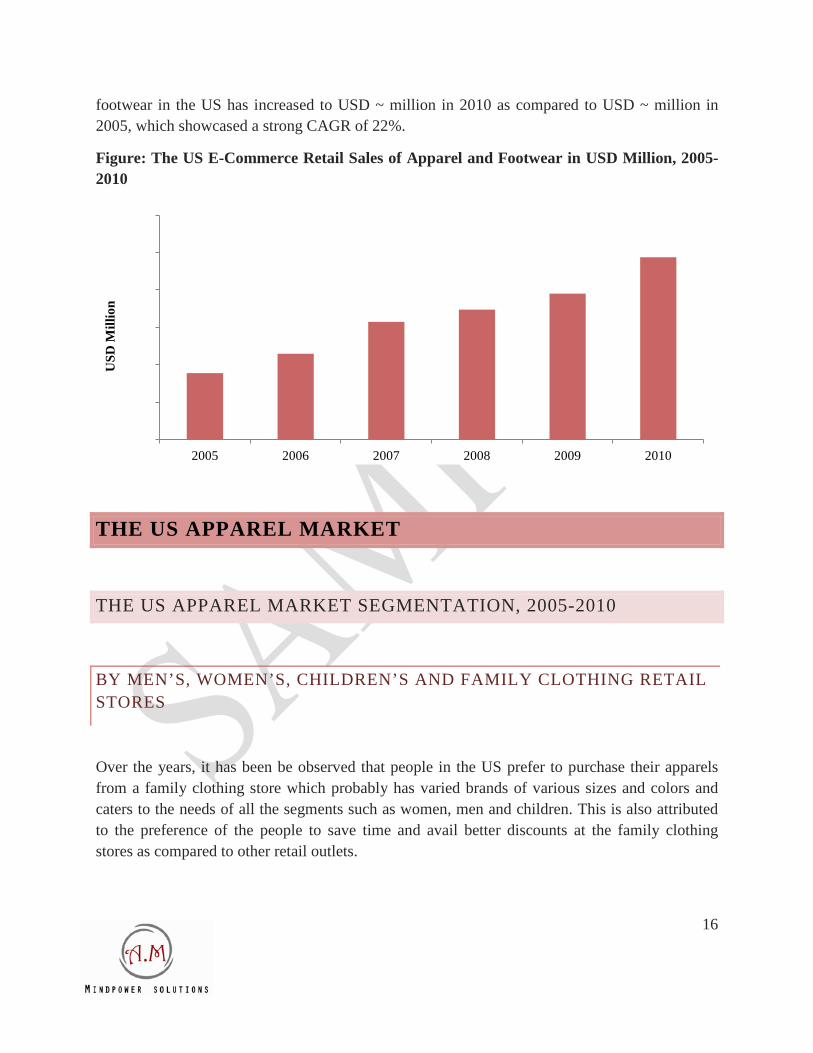
footwear in the US has increased to USD ~ million in 2010 as compared to USD ~ million in 2005, which showcased a strong CAGR of 22%.
Figure: The US E-Commerce Retail Sales of Apparel and Footwear in USD Million, 2005-2010
THE US APPAREL MARKET
THE US APPAREL MARKET SEGMENTATION, 2005-2010
BY MEN’S, WOMEN’S, CHILDREN’S AND FAMILY CLOTHING RETAIL STORES
Over the years, it has been be observed that people in the US prefer to purchase their apparels from a family clothing store which probably has varied brands of various sizes and colors and caters to the needs of all the segments such as women, men and children. This is also attributed to the preference of the people to save time and avail better discounts at the family clothing stores as compared to other retail outlets.
-
5,000
10,000
15,000
20,000
25,000
30,000
2005 2006 2007 2008 2009 2010
USD
Mill
ion
17
Table: The US Apparel Market Segmentation on the Basis of Sales by Men’s, Women’s, Children’s and Family Clothing Stores in USD Million, 2005-2010
Type of Retail Stores 2005 2006 2007 2008 2009 2010
Men's Clothing Stores
Women's Clothing Stores
Family Clothing Stores
Children Clothing Stores
Other Clothing Stores
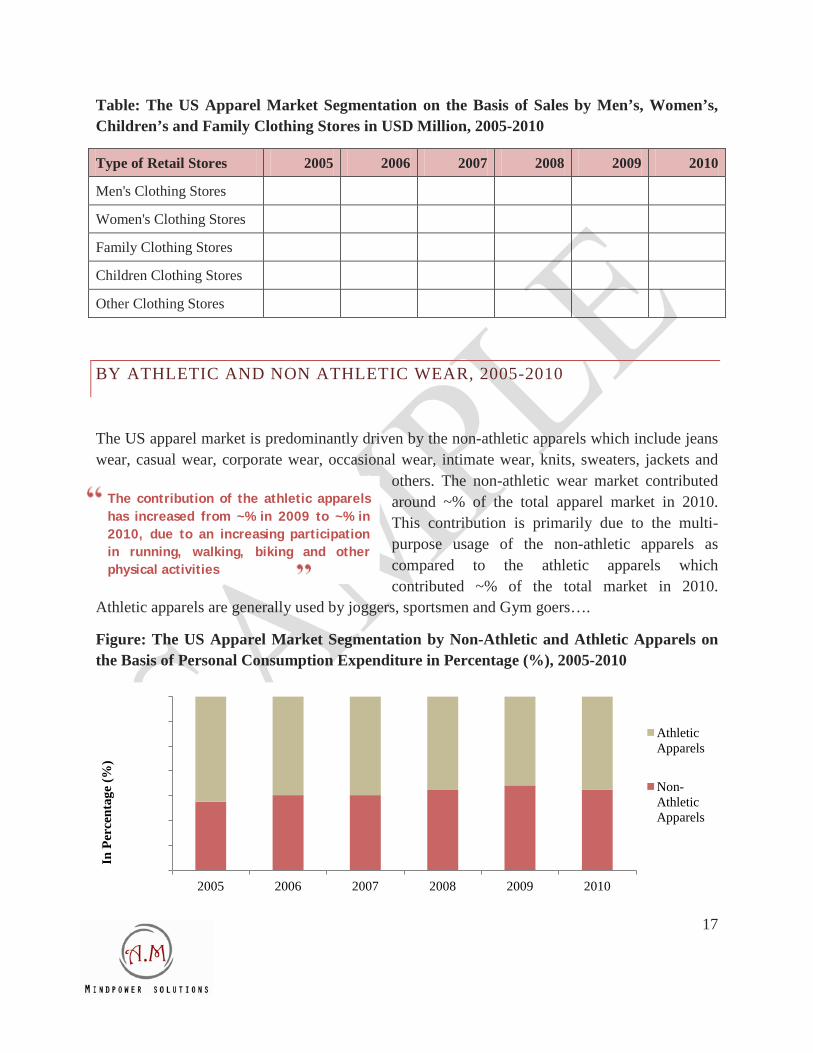
BY ATHLETIC AND NON ATHLETIC WEAR, 2005-2010
The US apparel market is predominantly driven by the non-athletic apparels which include jeans wear, casual wear, corporate wear, occasional wear, intimate wear, knits, sweaters, jackets and
others. The non-athletic wear market contributed around ~% of the total apparel market in 2010. This contribution is primarily due to the multi-purpose usage of the non-athletic apparels as compared to the athletic apparels which contributed ~% of the total market in 2010.
Athletic apparels are generally used by joggers, sportsmen and Gym goers….
Figure: The US Apparel Market Segmentation by Non-Athletic and Athletic Apparels on the Basis of Personal Consumption Expenditure in Percentage (%), 2005-2010
93.0%
94.0%
95.0%
96.0%
97.0%
98.0%
99.0%
100.0%
2005 2006 2007 2008 2009 2010
In P
erce
ntag
e (%
)
Athletic Apparels
Non-Athletic Apparels
The contribution of the athletic apparels has increased from ~% in 2009 to ~% in 2010, due to an increasing participation in running, walking, biking and other physical activities

18
THE US ATHLETIC APPARELS MARKET
THE US ATHLETIC APPAREL MARKET MAJOR PLAYERS’ MARKET SHARE, 2010
…NIKE, the leading brand in the US athletic apparel market has gained a competitive edge over the years with its innovative marketing techniques and preference for performance athletic
apparels. Moreover, a total number ~ store across the US has helped the company to penetrate the US market. Adidas Group is the second largest company in the athletic apparel market in the US. The company’s discrete product line in the athletic apparel segment which ranges from performance athletic apparels to
premium fashion athletic apparels has certainly aided the company in sustaining its position as one of the market leader in the US athletic apparel segment….
Table: The US Athletic Apparel Market’s Major Players’ Revenue in USD Million and Market Share in Percentage in 2010
Companies Revenue1, 2010 Market Share1, 2010
NIKE
Adidas Group
Under Armour, Inc.
VF Corp.
Ascis
Puma
Other
The athletic apparel segment of the market is characterized by intense competition where top 6 players contributed around ~% of the total athletic apparel market revenue in the US in 2010
19
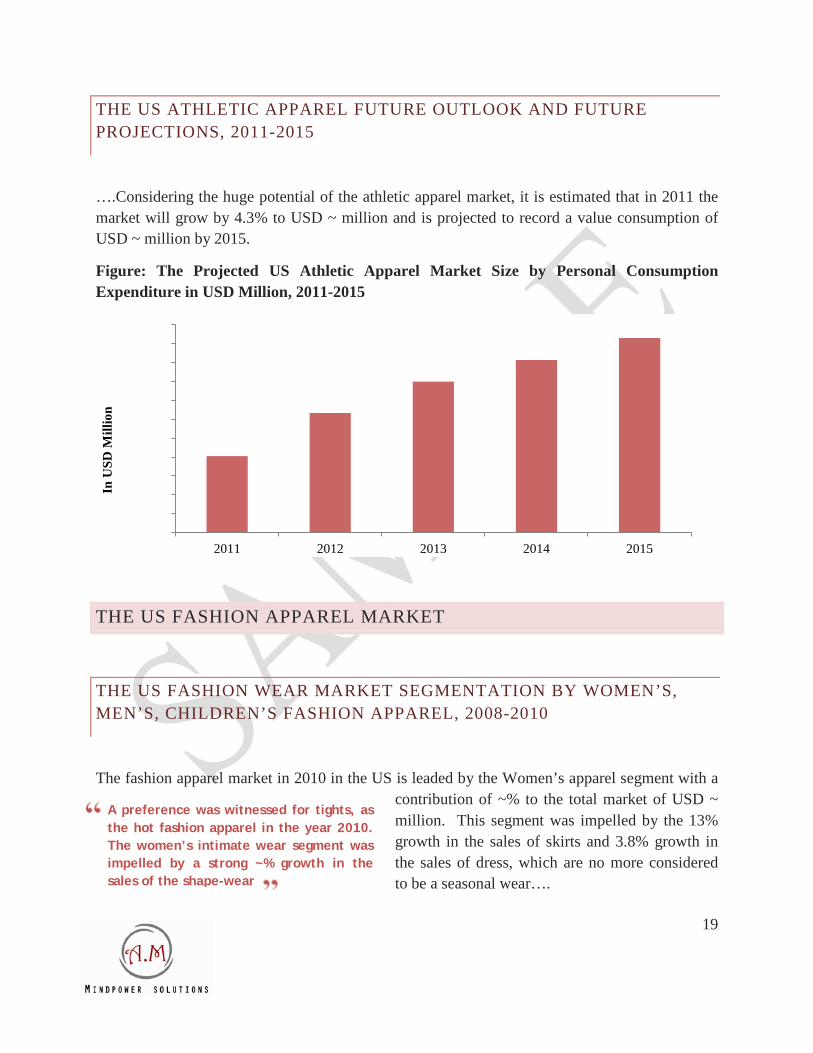
THE US ATHLETIC APPAREL FUTURE OUTLOOK AND FUTURE PROJECTIONS, 2011-2015
….Considering the huge potential of the athletic apparel market, it is estimated that in 2011 the market will grow by 4.3% to USD ~ million and is projected to record a value consumption of USD ~ million by 2015.
Figure: The Projected US Athletic Apparel Market Size by Personal Consumption Expenditure in USD Million, 2011-2015
THE US FASHION APPAREL MARKET
THE US FASHION WEAR MARKET SEGMENTATION BY WOMEN’S, MEN’S, CHILDREN’S FASHION APPAREL, 2008-2010
The fashion apparel market in 2010 in the US is leaded by the Women’s apparel segment with a contribution of ~% to the total market of USD ~ million. This segment was impelled by the 13% growth in the sales of skirts and 3.8% growth in the sales of dress, which are no more considered to be a seasonal wear….
9,800 10,000 10,200 10,400 10,600 10,800 11,000 11,200 11,400 11,600 11,800 12,000
2011 2012 2013 2014 2015
In U
SD M
illio
n
A preference was witnessed for tights, as the hot fashion apparel in the year 2010. The women’s intimate wear segment was impelled by a strong ~% growth in the sales of the shape-wear

20
The men’s fashion apparel segment in 2010 contributed around ~% which is marginally higher than ~% contribution in 2009. This segment was driven primarily by the casual fashion wear and inner wear especially the long leg briefs…
Figure: The US Fashion Apparel Market Segmentation by Women’s, Men’s and Children’s Apparel on the Basis of Sales in Percentage, 2008-2010
Figure: The US Fashion Apparel Market Segmentation by Women’s, Men’s and Children’s Apparel on the Basis of Sales in USD Million, 2008-2010
Particulars 2008 2009 2010
Women’s Apparel
Men’s Apparel
Children’s Apparel
Source: AM Mindpower Solutions
0.0
0.1
0.2
0.3
0.4
0.5
0.6
0.7
0.8
0.9
1.0
2008 2009 2010
In P
erce
ntag
e (%
)
Children's Apparel
Men's Apparel
Women's Apparel

21
THE US APPAREL MARKET MAJOR PLAYERS’ MARKET SHARE, 2010
The US apparel market is fragmented with the presence of several large scale and small scale manufacturers, retailers and wholesalers, of which the top 14 companies contribute around ~% of the total apparel market revenue in 2010. As the market is much fragmented, there is high level of competition amongst the market players which leads them to compete against each other either on the basis of innovative designs, colors and sizes or on the basis of innovative marketing and brand promotion or expansion strategies such as in-store promotions, discount coupons and attractive deals…. The market in 2010 was leaded by the GAP Inc with ~% contribution to the total apparel market revenue. The company has a diversified product portfolio of which the brand Athleta and Piperlime are still at the nascent stage in the US which in turn showcases the future growth potential of these two brands in the US…
Table: The US Apparel Market Major Players’ Revenue in USD Million and Market Share in Percentage in 2010
Companies Revenue1, 2010 Market Share, 2010
GAP Inc
TJX Companies
VF Corp.
Limited Brands
Ross Stores
Nordstrom
Burlington Coat Factory
Hanes brands Inc.
Polo Ralph Lauren
Phillips-Van Heusen
American Eagle Outfitters
Abercrombie & Fitch Co.
Levi Straus
Nike
Others

22
WOMEN’S, MEN’S AND CHILDREN’S APPAREL FUTURE PROJECTIONS, 2011-2015
The apparel industry over the years has been dominated by the activities in the women’s wear segment. It has been estimated that as the economy will recover in the next 5 years, the percentage contribution of the women segment to the overall apparel market revenue will increase to ~% in 2015….
Table: The Projected US Apparel Market Size by Women’s, Men’s and Children’s on the Basis of Personal Consumption Expenditure in USD Million, 20011-2015
Particulars 2011 2012 2013 2014 2015
Women’s Apparel
Men’s Apparel
Children’s Apparel
Others
Total
THE US FOOTWEAR MARKET
THE US ATHLETIC FOOTWEAR MARKET
MARKET SIZE BY PERSONAL CONSUMPTION EXPENDITURE, 2005-2010
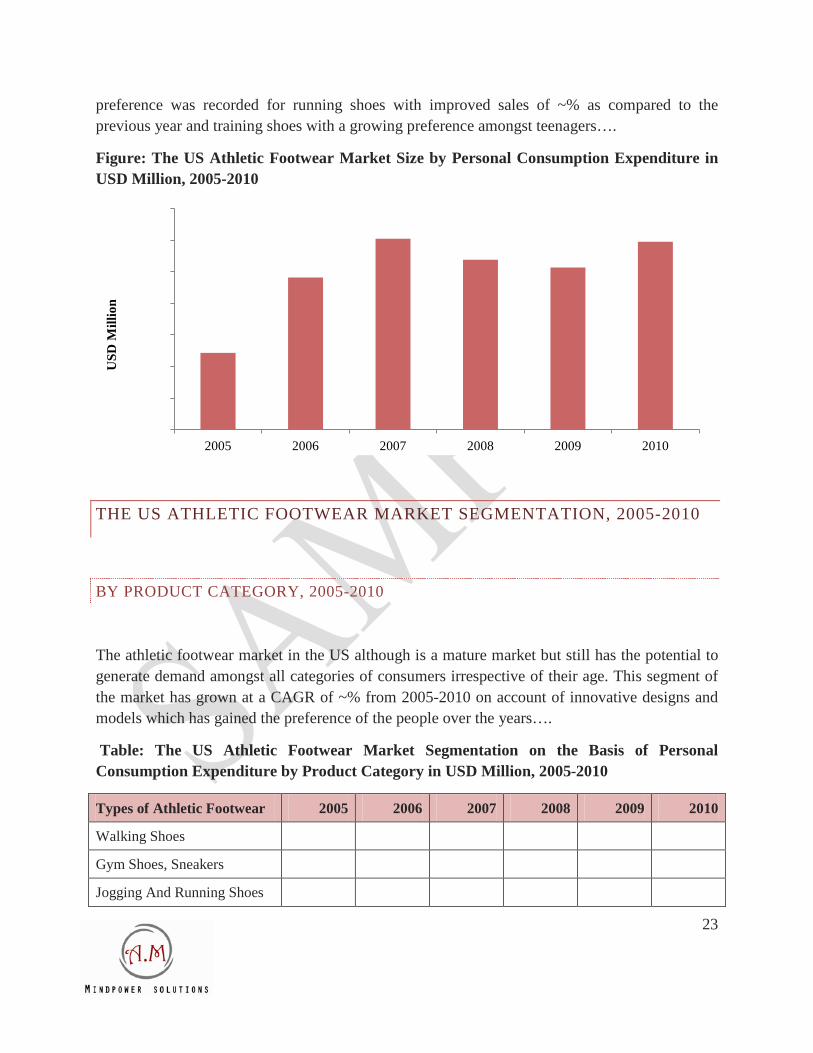
The Athletic footwear in the US grew by ~% to US ~ million in 2010 after a decline in period from 2008-2009. The market in 2010 registered a strong demand for walking, running, basketball, training and toning shoes. It was witnessed that the “back to school” period from July to September contributed around ~% of the athletic footwear sales in the US in 2010. Strong
The Athletic footwear in the US grew by ~% to US ~ million in 2010 after a decline in period from 2008-2009. The market in 2010 registered a strong demand for walking, running, basketball, training and toning shoes
23
preference was recorded for running shoes with improved sales of ~% as compared to the previous year and training shoes with a growing preference amongst teenagers….
Figure: The US Athletic Footwear Market Size by Personal Consumption Expenditure in USD Million, 2005-2010
THE US ATHLETIC FOOTWEAR MARKET SEGMENTATION, 2005-2010
BY PRODUCT CATEGORY, 2005-2010
The athletic footwear market in the US although is a mature market but still has the potential to generate demand amongst all categories of consumers irrespective of their age. This segment of the market has grown at a CAGR of ~% from 2005-2010 on account of innovative designs and models which has gained the preference of the people over the years….
Table: The US Athletic Footwear Market Segmentation on the Basis of Personal Consumption Expenditure by Product Category in USD Million, 2005-2010
Types of Athletic Footwear 2005 2006 2007 2008 2009 2010
Walking Shoes
Gym Shoes, Sneakers
Jogging And Running Shoes
14,500
15,000
15,500
16,000
16,500
17,000
17,500
18,000
2005 2006 2007 2008 2009 2010
USD
Mill
ion

24
Cross Training Shoes
Basketball Shoes
Tennis Shoes
Aerobic shoes
Others
BY CHANNEL OF DISTRIBUTION
The athletic footwear in the US is supplied to the end consumers through several distribution channels, of which the sporting goods stores and the discount stores gained popularity as the preferred medium for the purchase of athletic footwear.
Figure: The US Athletic Footwear Segmentation by Channel of Distribution on the Basis of Sales in Percentage, 2010
Sporting Goods Stores
Discount Store
Specialty Athletic Footwear Stores
On-Line/Internet
Department Store
Family Footwear Store
Factory Outlet Store
Specialty Sport Shop
Mail Order
Other Outlet
Pro Shop
The people in the US have showcased their preference for online purchases of footwear which has impelled the contribution of the online and internet to ~% in 2010 from ~% in 2008
25
THE US FASHION FOOTWEAR MARKET
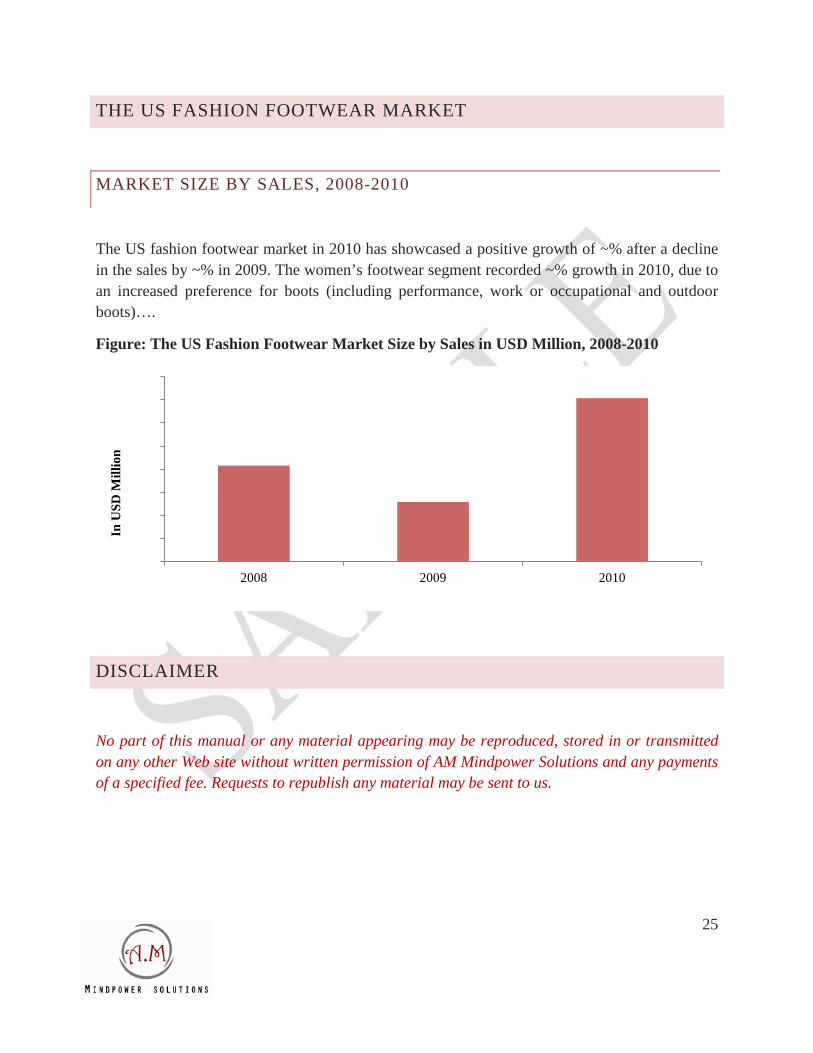
MARKET SIZE BY SALES, 2008-2010
The US fashion footwear market in 2010 has showcased a positive growth of ~% after a decline in the sales by ~% in 2009. The women’s footwear segment recorded ~% growth in 2010, due to an increased preference for boots (including performance, work or occupational and outdoor boots)….
Figure: The US Fashion Footwear Market Size by Sales in USD Million, 2008-2010
DISCLAIMER
No part of this manual or any material appearing may be reproduced, stored in or transmitted on any other Web site without written permission of AM Mindpower Solutions and any payments of a specified fee. Requests to republish any material may be sent to us.
31,000.0
31,500.0
32,000.0
32,500.0
33,000.0
33,500.0
34,000.0
34,500.0
35,000.0
2008 2009 2010
In U
SD M
illio
n