downloads.scia.net · Table of contents 3 Table of contents Table of contents

LMPO 2040 Metropolitan Transportation Plan
1
Table of Contents Chapter 1: Introduction ................................................................................................................................ 3
Changes ..................................................................................................................................................... 3
Study Area Boundaries ......................................................................................................................... 3
Metropolitan Planning Organization ..................................................................................................... 3
MAP-21................................................................................................................................................. 3
Plan Preparation ........................................................................................................................................ 5
Study Area ................................................................................................................................................ 6
Map 1: Study Area Boundary .............................................................................................................. 7
Transportation Committees ....................................................................................................................... 8
Lawton Metropolitan Planning Organization Transportation Policy Board ......................................... 8
Transportation Technical Committee .................................................................................................... 8
City Transit Trust .................................................................................................................................. 9
Lawton Metropolitan Area Airport Authority....................................................................................... 9
Approval Process ...................................................................................................................................... 9
Chapter 2: Goals and Objectives .......................................................................................................... 10
Chapter 3: Public Involvement .................................................................................................................. 13
Chapter 4: Socioeconomic Data ................................................................................................................. 14
Population ............................................................................................................................................... 14
Table 1: Population Summary ............................................................................................................. 14
Employment ............................................................................................................................................ 15
Table 2: Comparison of Employment Data ........................................................................................ 15
Vehicles .................................................................................................................................................. 15
Housing ................................................................................................................................................... 15
Table 3: Households in Study Area ................................................................................................... 15
Development Patterns Within the Study Area ........................................................................................ 16
Map 2: Traffic Analysis Zones .......................................................................................................... 17
Map 3: 2010 Population by TAZ ....................................................................................................... 18
Map 4: 2040 Population by TAZ ....................................................................................................... 19
Map 5: 2010 Employment by TAZ .................................................................................................... 20
Map 6: 2040 Employment by TAZ .................................................................................................... 21
Map 7: 2010 Occupied Dwelling Units by TAZ ................................................................................ 22
Map 8: 2040 Occupied Dwelling Units by TAZ ................................................................................ 23
Map 9: Commercial Land Use ........................................................................................................... 24
Chapter 5: Street Network ......................................................................................................................... 25
LMPO 2040 Metropolitan Transportation Plan
2
Current Network ..................................................................................................................................... 25
Table 4: Functional Classification of Streets by Mileage .................................................................. 25
Table 5: Existing Transportation System ............................................................................................ 25
Federal-Aid Highways ........................................................................................................................ 26
State Highways ................................................................................................................................... 26
Local Streets ........................................................................................................................................ 27
Map 10: Network by Functional Classification .................................................................................. 27
2040 Transportation System Network .................................................................................................... 28
Environmental Justice ............................................................................................................................. 28
Design Standards .................................................................................................................................... 29
Table 6: Proposed Projects for 2040 MTP .......................................................................................... 30
Map 11. Location of Proposed Projects ............................................................................................. 35
No-Build Projects.................................................................................................................................... 36
Chapter 6: Environment ............................................................................................................................. 37
Air Quality .............................................................................................................................................. 37
Table 7: 2013 Highest 8 Hour Averages ............................................................................................. 39
Water Quality .......................................................................................................................................... 40
Chapter 8: Alternate Modes of Transportation .......................................................................................... 41
Transit ..................................................................................................................................................... 41
Map 12: LATS Route Map ................................................................................................................ 42
Bicycle and Pedestrian ............................................................................................................................ 43
Map 13. Bicycle and Pedestrian Plan Routes...................................................................................... 44
Map 14: Existing Bike Routes and Routes Awarded for Construction in 2014.................................. 45
Air ........................................................................................................................................................... 45
Rail .......................................................................................................................................................... 46
Chapter 9: Freight ...................................................................................................................................... 47
Roads ...................................................................................................................................................... 47
Airport ..................................................................................................................................................... 48
Railroad ................................................................................................................................................... 48
Chapter 10: Funding .................................................................................................................................. 49
Funding Sources...................................................................................................................................... 49
Revenues ................................................................................................................................................. 49
Costs ........................................................................................................................................................ 50
Chapter 11: Conclusion .............................................................................................................................. 51

LMPO 2040 Metropolitan Transportation Plan
3
Chapter 1: Introduction The Metropolitan Transportation Plan (MTP) is a long-range vision for the Lawton Metropolitan Area Transportation Study (LMATS) area focusing on anticipated transportation needs based on demographic and economic assumptions and forecasts. The Federal planning regulations require the long range transportation plan provide for a planning horizon of at least 20 years and be updated every five years. The 2035 Long Range Transportation Plan for the LMATS area (an extension of the 2030 LRTP) was adopted in January 2013. The 2035 LRTP reaffirmed the 2030 LRTP by readopting the vision, goals, and objectives and extending the planning horizon year to 2035. The 2030 LRTP included projections of the effects of the Base Realignment and Closure Act on Fort Sill and the City of Lawton. The actual effect on the LMATS area was not as great as projected. The 2040 MTP will ensure that a 25-year planning horizon is intact and that transportation planning and project implementation will continue without interruption. The 2040 MTP is an update of the LRTP which reevaluates the population and employment forecasts, accounting for transportation investments and policy changes since 2008, and recommending fiscally feasible improvements through 2040.
Changes Since the last plan update, the study area and the composition of the metropolitan planning organization have changed in addition to the adoption of the new transportation bill, Moving Ahead for Progress in the 21st Century (MAP-21). This plan addresses these changes and new requirements.
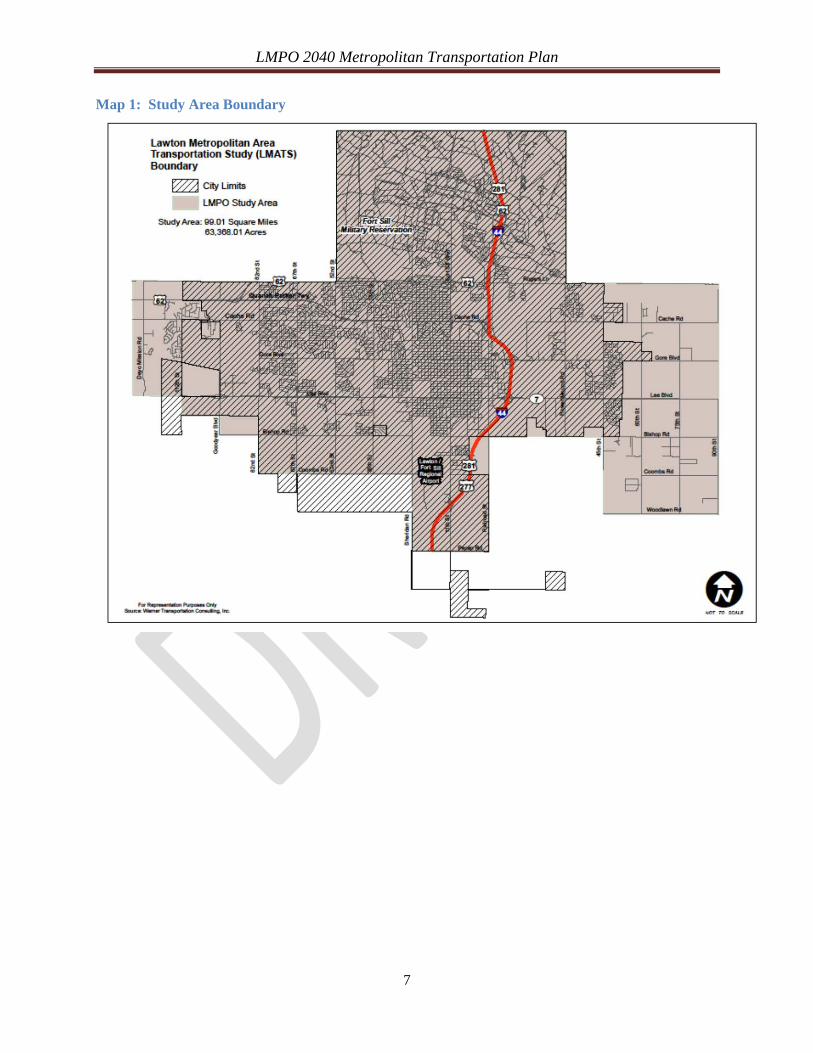
Study Area Boundaries The study area has changed to extend further to the east and west and include Fort Sill while omitting portions south of the Lawton city limits. Previously the study area included 64.45 square miles, and the new study area includes 99 square miles. The study area is illustrated in Map 1.
Metropolitan Planning Organization The Lawton Metropolitan Planning Organization (LMPO) was redesignated by the Governor of the State of Oklahoma through the Oklahoma Department of Transportation. The new LMPO is composed of elected officials and representatives of transportation modes and meets the composition for MPOs as set out in the Federal regulations.
MAP-21 A new transportation bill, “Moving Ahead for Progress in the 21st Century Act” (MAP-21), was signed into law on July 6, 2012, and became effective October 1, 2012. In MAP-21, the metropolitan planning process is continued and enhanced to incorporate performance goals, measures, and targets into the process of identifying needed transportation improvements and project selection. The following eight planning factors were included in the previous
LMPO 2040 Metropolitan Transportation Plan
4
transportation bill, Safe, Accountable, Flexible, Efficient Transportation Equity Act – A Legacy for Users (SAFETEA-LU) and are still required to be addressed in metropolitan transportation plans: 1. Support the economic vitality of the United States, the States, non-metropolitan areas, and
metropolitan areas, especially by enabling global competitiveness, productivity, and efficiency.
2. Increase the safety of the transportation system for motorized and non-motorized users. 3. Increase the security of the transportation system for motorized and non-motorized users. 4. Increase accessibility and mobility options available of people and freight. 5. Protect and enhance the environment, promote energy conservation, and improve quality of
life, and promote consistency between transportation improvements and State and local planned growth and economic development patterns.
6. Enhance integration and connectivity of the transportation system, across and between modes throughout the state for people and freight.
7. Promote efficient system management and operation. 8. Emphasize the preservation of the existing transportation system. MAP-21 also outlines seven performance goals for metropolitan transportation planning which include a focus on the following:
• safety; • infrastructure conditions; • congestion reduction; • system reliability; • freight movement and economic vitality; • environmental sustainability; and • reduced project delivery delays.
MAP-21 focuses on a performance driven planning process that includes established, consistent, and relevant performance targets that can be assessed to track progress toward the identified goals and measures. Operational and system management studies are a key element in this focus on performance and should examine the wide range of strategies to address congestion, improve mobility, and develop a sustainable multimodal transportation system. The metropolitan transportation planning process is required to document the performance measures and targets established by the MPO that support the seven national performance goals and are coordinated to the extent possible with the Oklahoma Department of Transportation and with public transportation providers. In general, the performance standards are established at the national level and then at the state level, and then at the MPO level. Oklahoma is in the process of developing its performance measures and targets which will then be considered by the MPO for incorporation into its own process for measuring and evaluating performance. The performance measures will be incorporated into the next plan.
LMPO 2040 Metropolitan Transportation Plan
5
Plan Preparation Federal regulations require the transportation plan provide for a planning horizon of at least 20 years and be updated not less than once every five years. The MTP anticipates transportation needs based on demographic and economic projections for the LMATS area. The plan identifies transportation facilities such as major roadways, transit, airport, and bicycle and pedestrian routes. The MTP includes goals, objectives, and analyses of area trends and planned improvement projects throughout the study area as well as a study of roadway, bicycle, pedestrian, and transit improvements to be incorporated within the study area. Projects identified in the MTP must be financially feasible; therefore, the MTP includes implementation costs and resources. For federal funding eligibility, a transportation project must be included in the MTP. The MTP is based upon the assumptions listed below. Assumption one: Population growth is forecasted to occur in the southwest, northeast and southeast quadrants of the study area. Assumption two: Alternative modes of transportation will be developed and existing alternative modes will be expanded. Assumption three: Most of the study area population and land area are within the city limits of Lawton. The assumption is made that the number of persons per occupied dwelling unit for the year 2040 will be 2.7, the same as the city of Lawton. Assumption four: The study area will be developed as a bikeable/walkable community. Assumption five: The MTP is based on a performance standard of a volume/capacity ratio of 0.90 or Level of Service (LOS) D. Assumption six: The revenue projections used for developing the MTP’s financial plan are based on historic trends and assumptions that future funding will increase. The development of the 2040 MTP began with the review of the existing conditions and changes since the adoption of the 2030 LRTP. A travel demand model was used to evaluate existing conditions and projected conditions. An analysis of this data identified areas where LOS exceeds or will exceed LOS D by 2040. A cost benefit ratio was done on the projects. Comments received from various committees, city staff, and the public led to the development of nonconstruction projects to reduce congestion. An analysis of historical and existing financial conditions was completed, and a list of capital needs was developed. The development of this plan was a collaborative effort between the following organizations: LMPO, City of Lawton, Fort Sill, Lawton-Fort Sill Chamber of Commerce and Industry, Lawton-Fort Sill Regional Airport, Lawton Area Transit System, Association of South Central Oklahoma Governments, Local Native American Tribes, ODOT, FHWA, and FTA.

LMPO 2040 Metropolitan Transportation Plan
6
Study Area The LMATS area includes most of the city of Lawton and portions of Comanche County, totaling 99 square miles. Fort Sill is within the study area and was included in the modeling of the network; however, the 2040 MTP does not address transportation issues on Fort Sill Military Reservation. Map 1 illustrates the LMATS boundary.
LMPO 2040 Metropolitan Transportation Plan
7
Map 1: Study Area Boundary
LMPO 2040 Metropolitan Transportation Plan
8
Transportation Committees Under MAP-21 any urbanized area (as defined by the Census Bureau) exceeding a population of 50,000 people must have an established Metropolitan Planning Organization. In 2013, the Transportation Policy Board was designated as the Lawton Metropolitan Planning Organization by the Oklahoma Department of Transportation on behalf of the Governor of Oklahoma. In addition to the Transportation Policy Board, there is a Transportation Technical Committee which serves as an advisory committee to the Policy Board.
Lawton Metropolitan Planning Organization Transportation Policy Board As the LMPO, the Transportation Policy Board (TPB) is tasked with the primary role and responsibility of ensuring that the transportation planning process is being carried out according to Federal and State regulations. The planning and program management functions are administered and carried out by the City of Lawton’s Planning Division, which provides staff, technical and clerical support. The City of Lawton Director of Planning is designated as the LMPO Director. The Transportation Policy Board is the final approval authority for transportation planning documents. Membership includes representatives of the following entities: the Lawton City Council, the Lawton City Transit Trust, the Lawton-Fort Sill Regional Airport, the Comanche County Board of Commissioners, Oklahoma Department of Transportation, Federal Highway Administration, Federal Transit Administration, Fort Sill, Lawton City Planning Commission and state legislators. The functions of the TPB include the following:
• Develop and maintain a comprehensive transportation planning program in conformance with Section 134 and 49 U.S.C.;
• Develop and approve all policy procedures for transportation planning for the transportation study area;
• Review and approve the Metropolitan Transportation Plan (MTP) and the Transportation Improvement Program (TIP);
• Ensure that established Public Involvement Procedures are carried out appropriately for all major transportation activities;
• Establish and revise the metropolitan area boundary as required by law; • Prepare certifications; and • Review and approve the UPWP.
Transportation Technical Committee The Transportation Technical Committee (TTC) is an advisory committee to the LMPO Transportation Policy Board. Membership includes representatives from the City of Lawton, Lawton-Fort Sill Regional Airport, Fort Sill, Lawton Area Transit System, Lawton-Fort Sill Chamber of Commerce and Industry, Association of South Central Oklahoma Governments, local tribes, Oklahoma Department of Transportation, Federal Highways Administration, and Federal Transit Administration. The TTC provides technical expertise related to review of transportation issues and development of proposed plans and studies, the transportation improvement program, and the unified planning work program.
LMPO 2040 Metropolitan Transportation Plan
9
City Transit Trust The Lawton City Council serves as the City Transit Trust and operates the public transit system. The Transit Trust contracts the management of the system to McDonald Transit Associates. The Transit Trust is a member of the LMPO Policy Board.
Lawton Metropolitan Area Airport Authority The Lawton Metropolitan Area Airport Authority oversees the operations of the Lawton-Fort Sill Regional Airport. The Chairman of the Airport Authority is a member of the LMPO Policy Board.
Approval Process After a series of meetings a draft plan was prepared. The draft plan was posted on the LMPO website and made available for review at various places of business per the LMPO’s Public Participation Plan. Staff held three public meetings throughout the city seeking input from citizens on the draft plan. The Technical Committee made a recommendation for approval on __________, 2015. On __________. 2015, the LMPO Policy Board held a public hearing and adopted the plan.
LMPO 2040 Metropolitan Transportation Plan
10
Chapter 2: Goals and Objectives The goals of this transportation plan are mobility, multimodalism, livability, safety and security, system management, coordination, land use planning, and environmental impacts.
Goal One: Access and Mobility Develop and maintain a multi-modal transportation system that provides for the effective movement of people and goods. Objectives: A. Establish standards for the connection of streets, pedestrian and bicycle facilities within
individual subdivisions of land, between adjacent land areas, in relation to existing and planned facilities, that allows for efficient movement of vehicles, pedestrians and goods and services.
B. Create context-based options for street designs that support multiple users and multiple modes of transportation within the rights-of-way, and through which the design of streets may transition along their length to better support anticipated and adjacent land uses.
C. Identify freight routes that provide direct connections to the interstate system. D. Designate hazardous material transport routes. E. Design intersections on freight routes to accommodate large vehicles. F. Develop a multi-modal transportation system that includes appropriate public transit, bicycle,
and pedestrian facilities. G. Require connectivity (automobile, pedestrian and bicycle) among new and existing
developments to promote reduction in trip length. H. Design transportation facilities that consider the needs of individuals with disabilities or
restricted mobility. I. Develop and maintain a continuous network of attractive public facilities, including multi-use
trails, bicycle routes, bicycle lanes, and walkways. J. Encourage adequate bicycle parking facilities for employees, customers, and visitors at
businesses, libraries, schools, transit stops, and other public destinations.
Goal Two: Livability Develop and maintain a transportation system that promotes safe, healthy, and attractive neighborhoods.
Objectives: A. When modifying or rebuilding the road network: beautify streetscapes, restore roadways to a human scale, and improve the character and livability of the area through which they pass. B. Set up traffic-calming measures, where appropriate, with special attention to safety needs to
control vehicle movements and speeds on neighborhood streets when supported by local residents.
C. Employ road design guidelines that encourage compliance with posted speed limits and support a walkable community design.
LMPO 2040 Metropolitan Transportation Plan
11
D. Develop visual and sound barriers between roads classified as arterials and homes. E. Enable bicycle and pedestrian circulation within and between neighborhoods. F. Develop design guidelines for streetscapes, including landscaping, street trees, pedestrian-
scale lighting, transit stops, curbing, and other elements of the streetscape.
Goal Three: Safety and Security Develop and maintain a safe and secure transportation system. Objectives: A. Rank safety and security in the achievement of every goal for both motorized and non-
motorized modes of transportation. B. Increase the number of interconnections within the transportation network to provide
multiple possible routes for emergencies. For example, a home on a road that intersects two other roads offers two exits, while a dead-end offers only one.
C. Regularly monitor motor vehicle accidents to analyze high accident locations and develop mitigation measures. Consider existing safety-related problems—such as speeding, following too close, failure to yield, stop sign noncompliance, etc.
D. Identify appropriate mitigation techniques to reduce the number and severity of accidents. E. Promote safe frontage access by limiting curb cuts onto collectors and arterials. F. Where possible, physically separate bicycle and pedestrian paths from roads carrying large
volumes of traffic. G. Evaluate alternatives to reduce traffic delays associated with signalized intersections and
stop-controlled intersections. H. Identify priority corridors where access management techniques can be carried out to
improve traffic flow and have positive safety benefits. I. Encourage the Lawton Area Transit System (LATS) to incorporate safety and security
measures into the operating system. J. Develop street crossings to be safe, attractive and easy to navigate. K. Improve traffic safety through engineering, education and enforcement.
Goal Four: Transportation System Management. Preserve and maintain the transportation system.
Objectives: A. Regularly evaluate the condition of the transportation network to allocate the City’s and
County’s resources efficiently. B. Preserve current and planned right-of-way for the transportation system. C. Provide sufficient roadway capacity to maintain a Level of Service of D on streets and at
intersections. D. Identify and preserve right-of-way, including abandoned rail lines, for future bicycle and
multi use trails.
LMPO 2040 Metropolitan Transportation Plan
12
Goal Five: Growth and Development Ensure that future development minimizes adverse impacts on the current and future transportation system by promoting development patterns that reduce the need of automobiles and encourages the use of alternate modes of transportation.
Objectives: A. Consider and mitigate the impact of development on the transportation network. B. Ensure transportation decisions are consistent with and support the goals of the Land Use
Plan. C. Plan and design future transportation facilities to be physically and aesthetically compatible
with the character of the study area. D. Relate the scale and concentration of development to what can be supported by the
transportation system. E. Promote connectivity by developing an interconnected network of low-speed and low-
volume streets. F. Direct development toward areas already served by multiple modes of transportation or
where such facilities can be provided.
Goal Six: Environment Protect the environment and the significant natural, agricultural, scenic, and historic resources.
Objectives: A. Reduce transportation impacts on water quality, wetlands, and wildlife habitats. B. Reduce dependency on single-occupancy vehicles by supporting transit and car
pool/vanpool/rideshare initiatives and working to make bicycle and pedestrian travel an attractive alternative to motor vehicles.
C. Reduce adverse noise impacts related to the transportation system. D. Evaluate potential impacts of transportation on environmentally sensitive areas, parks and
recreational facilities, and historical and archaeological sites. E. Discourage disruption to cohesive neighborhoods. F. Preserve adequate right-of-way for future transportation infrastructure to reduce the negative
impacts, including potential displacement to area residents and businesses. G. Protect neighborhoods from excessive through traffic and travel speeds. H. Maintain an open transportation planning process that encourages involvement and
participation from all communities, businesses, individuals and stakeholders. I. Incorporate Federal Environmental Justice principles into planning activities to ensure
maximum representation for traditionally under-represented and minority populations. J. Provide a cost-effective transportation system where the public and development industry
pay respective share of the system’s costs proportional to their demands on the system.
LMPO 2040 Metropolitan Transportation Plan
13
Chapter 3: Public Involvement This chapter describes the methods of providing opportunities for public input in the update of this document. Public participation was available through the following formats: public review and comment, open forums, public hearings, TTC, and LMPO Policy Board meetings. In the development and adoption of this plan the adopted Public Involvement Plan 2009 was followed. The public involvement process for the 2040 Metropolitan Transportation Plan included the following major activities:
• The Technical Committee and Policy Board held meetings to discuss the population, employment, and housing data; current street network; travel demand model; and proposed street projects and transportation programs/policies that will enhance the network and improve the projected level of service of streets.
• A public review and comment period was opened from January 26, 2015 to March 2, 2015.
• Copies of the proposed plan were distributed per the adopted Public Participation Process of the LMPO.
• The draft plan was posted on the LMPO’s website (www.lawtonmpo.org). • Public forums were held on February ___, ___, and ___, 2015, seeking public input on
the draft plan. • The TTC recommended adoption of the Plan on _____________, 2015. • The TPB held a public hearing and adopted the Plan on _______________, 2015.
Invitations to the public forums were mailed to community leaders; large industries/businesses; community service organizations; federal, state and local entities. A notice was published in The Lawton Constitution advising of the date, time, and location of the three public forums. Public Service Announcements were also aired on Channel KSWO 7 and local radio stations. Comments received during the open forums relating to the transportation needs of the community were reviewed by the TTC and TPB and included in the plan, as appropriate. Appendix C of this plan includes all of the comments received.
LMPO 2040 Metropolitan Transportation Plan
14
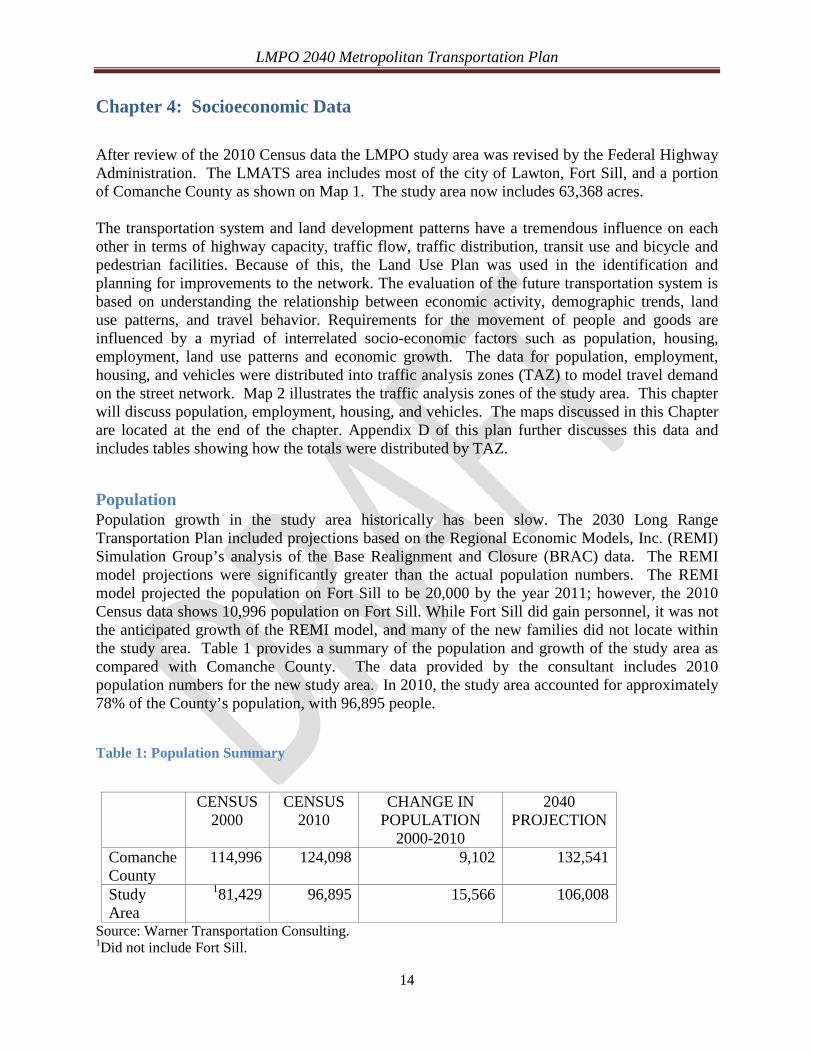
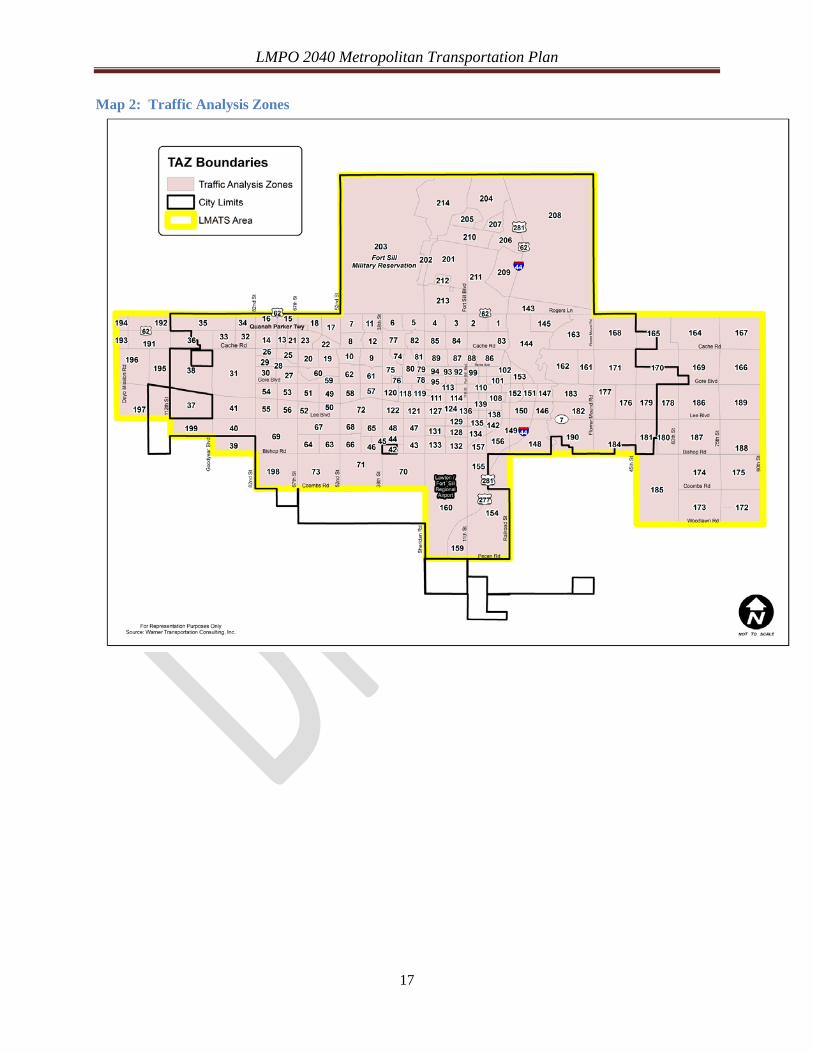
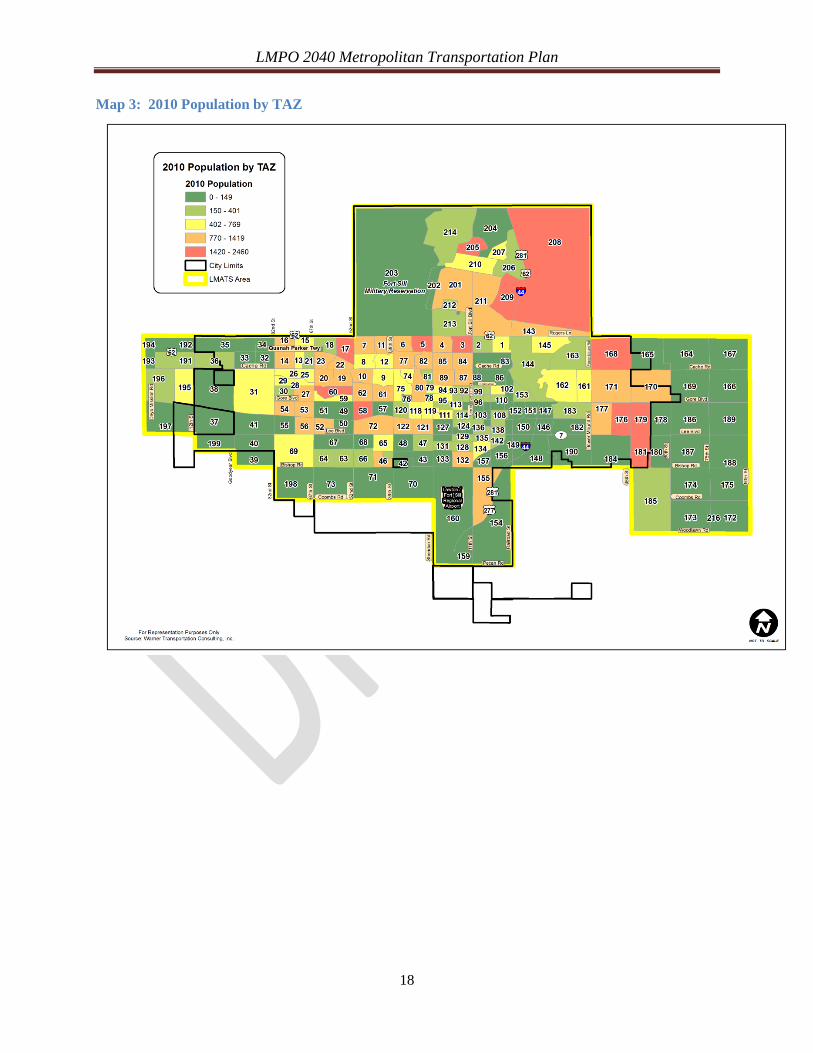
Chapter 4: Socioeconomic Data After review of the 2010 Census data the LMPO study area was revised by the Federal Highway Administration. The LMATS area includes most of the city of Lawton, Fort Sill, and a portion of Comanche County as shown on Map 1. The study area now includes 63,368 acres. The transportation system and land development patterns have a tremendous influence on each other in terms of highway capacity, traffic flow, traffic distribution, transit use and bicycle and pedestrian facilities. Because of this, the Land Use Plan was used in the identification and planning for improvements to the network. The evaluation of the future transportation system is based on understanding the relationship between economic activity, demographic trends, land use patterns, and travel behavior. Requirements for the movement of people and goods are influenced by a myriad of interrelated socio-economic factors such as population, housing, employment, land use patterns and economic growth. The data for population, employment, housing, and vehicles were distributed into traffic analysis zones (TAZ) to model travel demand on the street network. Map 2 illustrates the traffic analysis zones of the study area. This chapter will discuss population, employment, housing, and vehicles. The maps discussed in this Chapter are located at the end of the chapter. Appendix D of this plan further discusses this data and includes tables showing how the totals were distributed by TAZ.
Population Population growth in the study area historically has been slow. The 2030 Long Range Transportation Plan included projections based on the Regional Economic Models, Inc. (REMI) Simulation Group’s analysis of the Base Realignment and Closure (BRAC) data. The REMI model projections were significantly greater than the actual population numbers. The REMI model projected the population on Fort Sill to be 20,000 by the year 2011; however, the 2010 Census data shows 10,996 population on Fort Sill. While Fort Sill did gain personnel, it was not the anticipated growth of the REMI model, and many of the new families did not locate within the study area. Table 1 provides a summary of the population and growth of the study area as compared with Comanche County. The data provided by the consultant includes 2010 population numbers for the new study area. In 2010, the study area accounted for approximately 78% of the County’s population, with 96,895 people.
Table 1: Population Summary
CENSUS
2000 CENSUS
2010 CHANGE IN
POPULATION 2000-2010
2040 PROJECTION
Comanche County
114,996 124,098 9,102 132,541
Study Area
181,429 96,895 15,566 106,008
Source: Warner Transportation Consulting. 1Did not include Fort Sill.
LMPO 2040 Metropolitan Transportation Plan
15
Map 3 illustrates the 2010 population distribution by Traffic Analysis Zones (TAZ), and Map 4 illustrates the projected 2040 population distribution by TAZ.
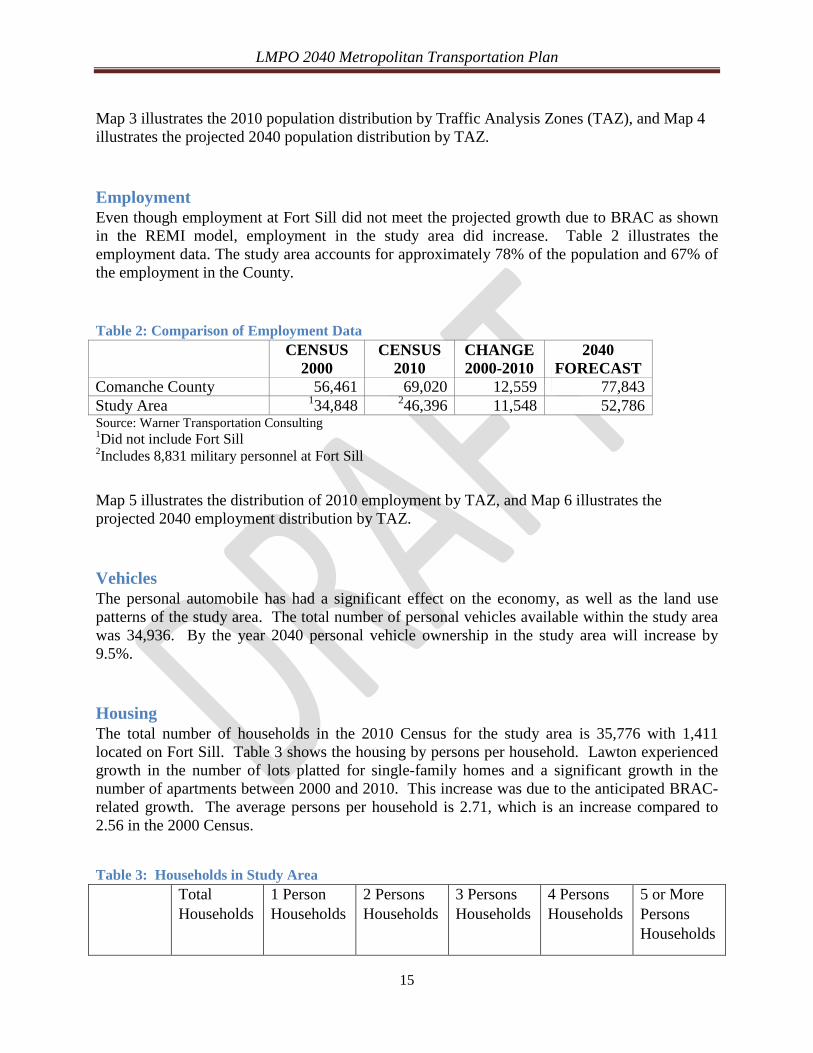
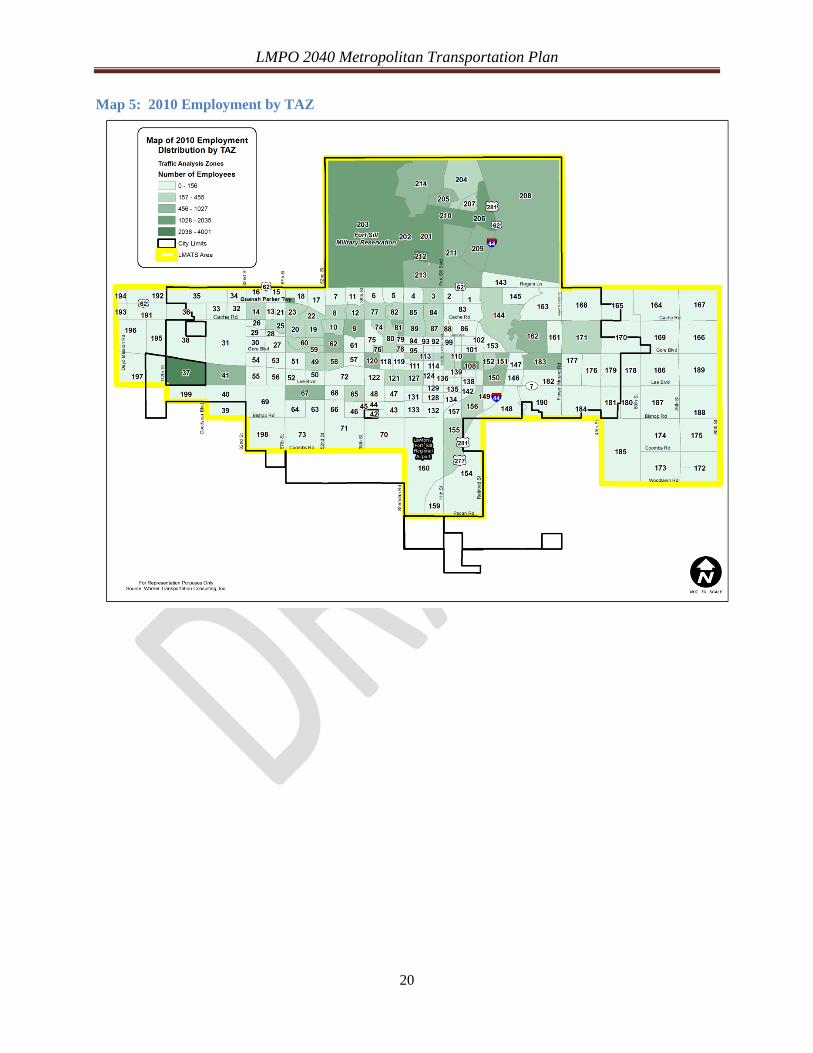
Employment Even though employment at Fort Sill did not meet the projected growth due to BRAC as shown in the REMI model, employment in the study area did increase. Table 2 illustrates the employment data. The study area accounts for approximately 78% of the population and 67% of the employment in the County.
Table 2: Comparison of Employment Data CENSUS
2000 CENSUS
2010 CHANGE 2000-2010
2040 FORECAST
Comanche County 56,461 69,020 12,559 77,843 Study Area 134,848 246,396 11,548 52,786 Source: Warner Transportation Consulting 1Did not include Fort Sill 2Includes 8,831 military personnel at Fort Sill Map 5 illustrates the distribution of 2010 employment by TAZ, and Map 6 illustrates the projected 2040 employment distribution by TAZ.
Vehicles The personal automobile has had a significant effect on the economy, as well as the land use patterns of the study area. The total number of personal vehicles available within the study area was 34,936. By the year 2040 personal vehicle ownership in the study area will increase by 9.5%.
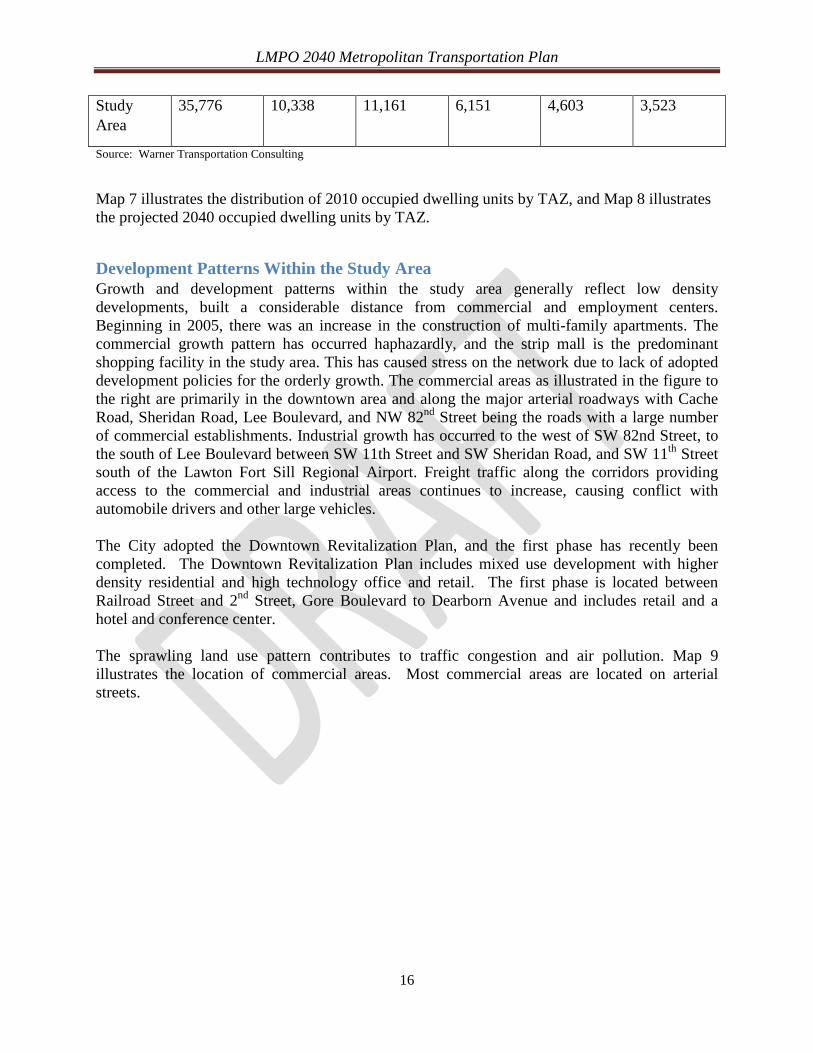
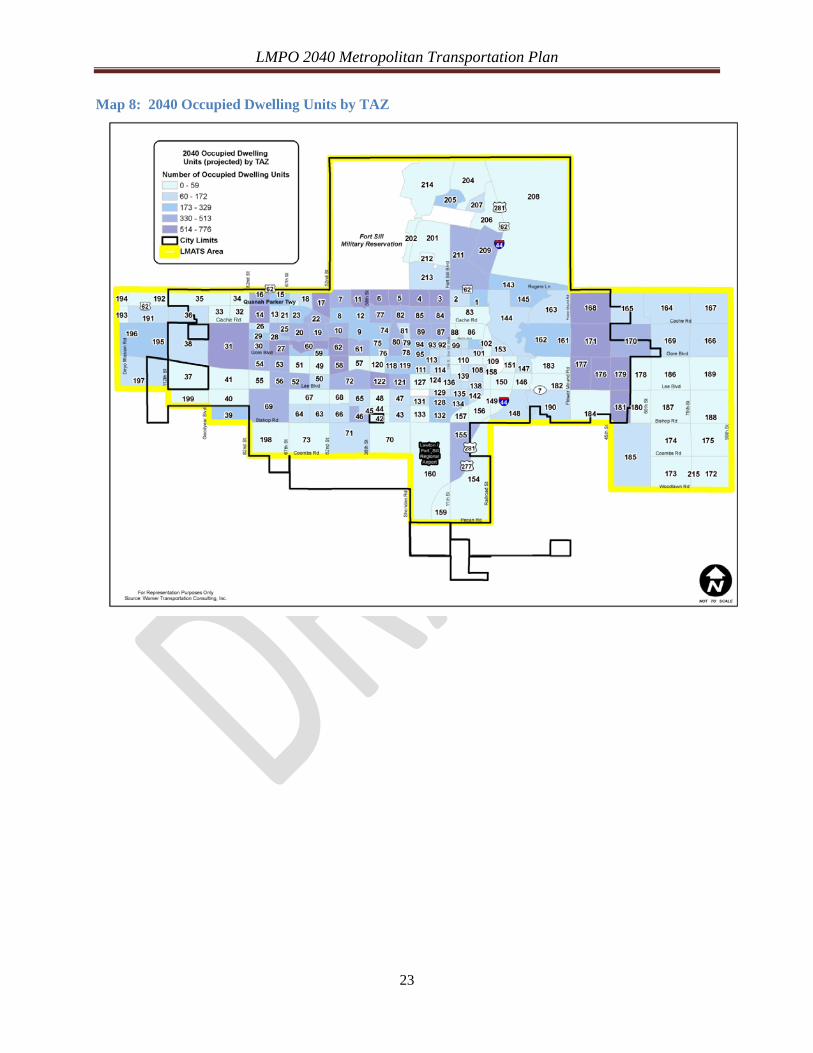
Housing The total number of households in the 2010 Census for the study area is 35,776 with 1,411 located on Fort Sill. Table 3 shows the housing by persons per household. Lawton experienced growth in the number of lots platted for single-family homes and a significant growth in the number of apartments between 2000 and 2010. This increase was due to the anticipated BRAC-related growth. The average persons per household is 2.71, which is an increase compared to 2.56 in the 2000 Census.
Table 3: Households in Study Area Total
Households 1 Person Households
2 Persons Households
3 Persons Households
4 Persons Households
5 or More Persons Households
LMPO 2040 Metropolitan Transportation Plan
16
Study Area
35,776 10,338 11,161 6,151 4,603 3,523
Source: Warner Transportation Consulting
Map 7 illustrates the distribution of 2010 occupied dwelling units by TAZ, and Map 8 illustrates the projected 2040 occupied dwelling units by TAZ.
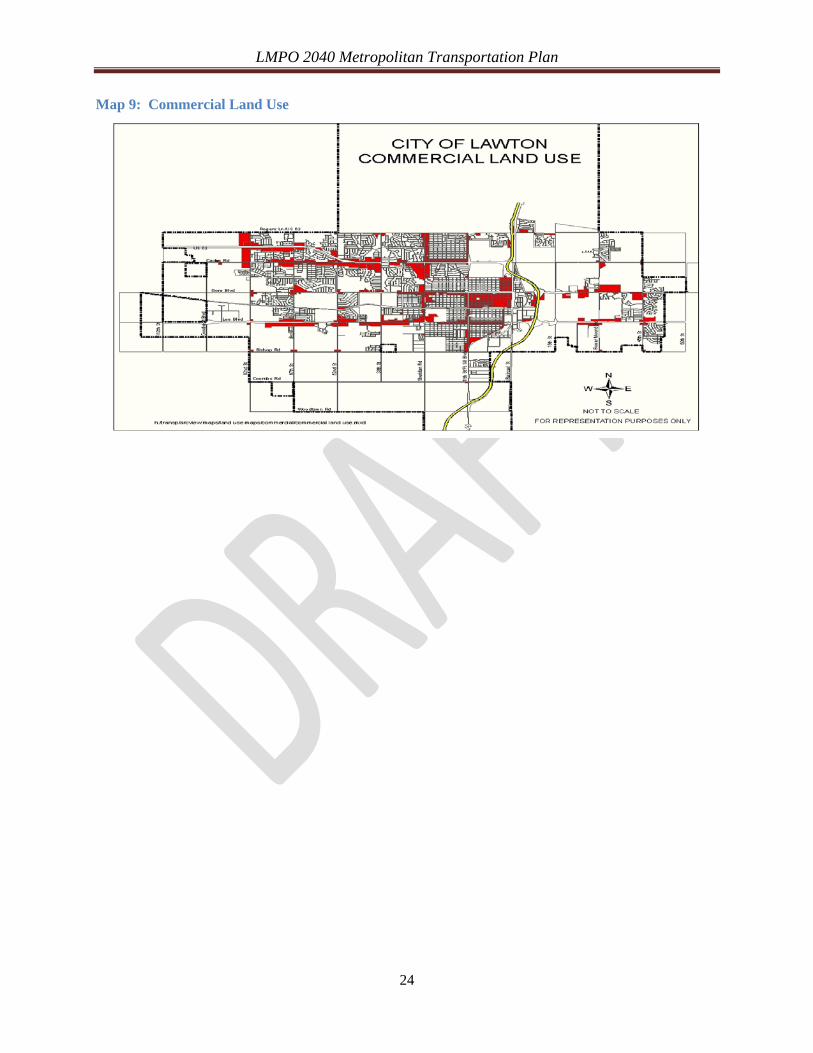
Development Patterns Within the Study Area Growth and development patterns within the study area generally reflect low density developments, built a considerable distance from commercial and employment centers. Beginning in 2005, there was an increase in the construction of multi-family apartments. The commercial growth pattern has occurred haphazardly, and the strip mall is the predominant shopping facility in the study area. This has caused stress on the network due to lack of adopted development policies for the orderly growth. The commercial areas as illustrated in the figure to the right are primarily in the downtown area and along the major arterial roadways with Cache Road, Sheridan Road, Lee Boulevard, and NW 82nd Street being the roads with a large number of commercial establishments. Industrial growth has occurred to the west of SW 82nd Street, to the south of Lee Boulevard between SW 11th Street and SW Sheridan Road, and SW 11th Street south of the Lawton Fort Sill Regional Airport. Freight traffic along the corridors providing access to the commercial and industrial areas continues to increase, causing conflict with automobile drivers and other large vehicles. The City adopted the Downtown Revitalization Plan, and the first phase has recently been completed. The Downtown Revitalization Plan includes mixed use development with higher density residential and high technology office and retail. The first phase is located between Railroad Street and 2nd Street, Gore Boulevard to Dearborn Avenue and includes retail and a hotel and conference center. The sprawling land use pattern contributes to traffic congestion and air pollution. Map 9 illustrates the location of commercial areas. Most commercial areas are located on arterial streets.
LMPO 2040 Metropolitan Transportation Plan
17
Map 2: Traffic Analysis Zones
LMPO 2040 Metropolitan Transportation Plan
18
Map 3: 2010 Population by TAZ

LMPO 2040 Metropolitan Transportation Plan
19
Map 4: 2040 Population by TAZ
LMPO 2040 Metropolitan Transportation Plan
20
Map 5: 2010 Employment by TAZ

LMPO 2040 Metropolitan Transportation Plan
21
Map 6: 2040 Employment by TAZ

LMPO 2040 Metropolitan Transportation Plan
22
Map 7: 2010 Occupied Dwelling Units by TAZ
LMPO 2040 Metropolitan Transportation Plan
23
Map 8: 2040 Occupied Dwelling Units by TAZ
LMPO 2040 Metropolitan Transportation Plan
24
Map 9: Commercial Land Use
LMPO 2040 Metropolitan Transportation Plan
25
Chapter 5: Street Network
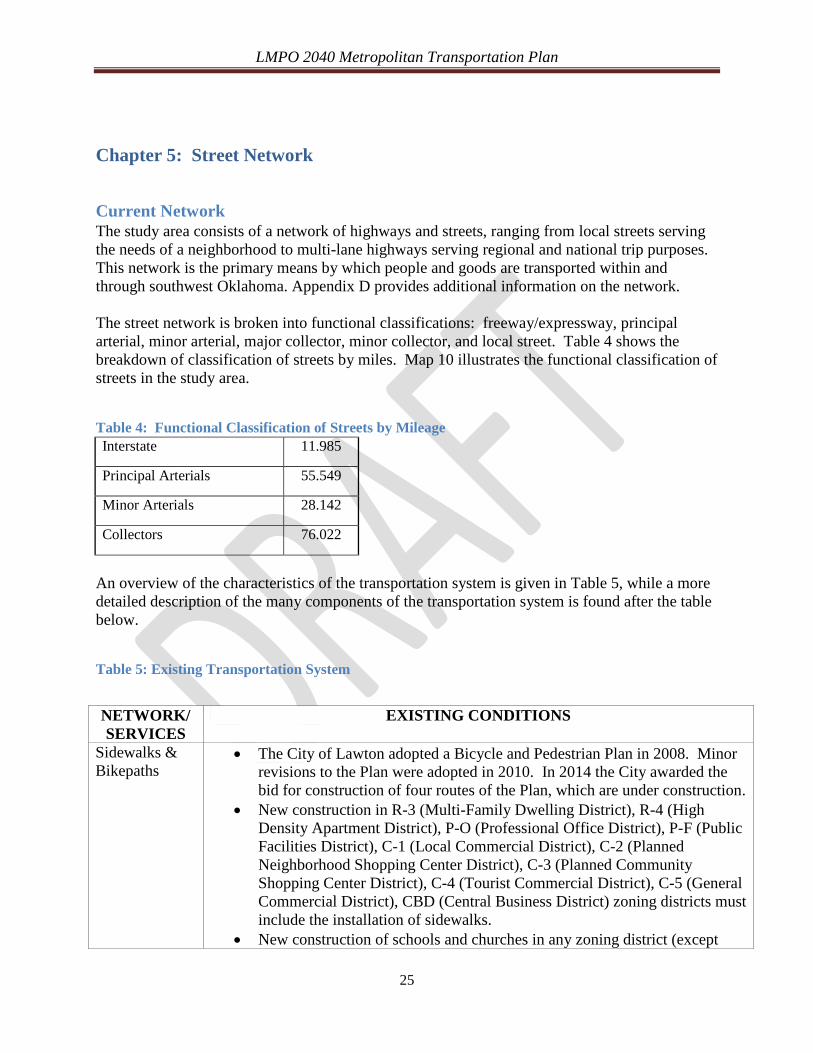
Current Network The study area consists of a network of highways and streets, ranging from local streets serving the needs of a neighborhood to multi-lane highways serving regional and national trip purposes. This network is the primary means by which people and goods are transported within and through southwest Oklahoma. Appendix D provides additional information on the network. The street network is broken into functional classifications: freeway/expressway, principal arterial, minor arterial, major collector, minor collector, and local street. Table 4 shows the breakdown of classification of streets by miles. Map 10 illustrates the functional classification of streets in the study area.
Table 4: Functional Classification of Streets by Mileage Interstate 11.985
Principal Arterials 55.549
Minor Arterials 28.142
Collectors 76.022
An overview of the characteristics of the transportation system is given in Table 5, while a more detailed description of the many components of the transportation system is found after the table below.
Table 5: Existing Transportation System NETWORK/ SERVICES
EXISTING CONDITIONS
Sidewalks & Bikepaths
• The City of Lawton adopted a Bicycle and Pedestrian Plan in 2008. Minor revisions to the Plan were adopted in 2010. In 2014 the City awarded the bid for construction of four routes of the Plan, which are under construction.
• New construction in R-3 (Multi-Family Dwelling District), R-4 (High Density Apartment District), P-O (Professional Office District), P-F (Public Facilities District), C-1 (Local Commercial District), C-2 (Planned Neighborhood Shopping Center District), C-3 (Planned Community Shopping Center District), C-4 (Tourist Commercial District), C-5 (General Commercial District), CBD (Central Business District) zoning districts must include the installation of sidewalks.
• New construction of schools and churches in any zoning district (except
LMPO 2040 Metropolitan Transportation Plan
26
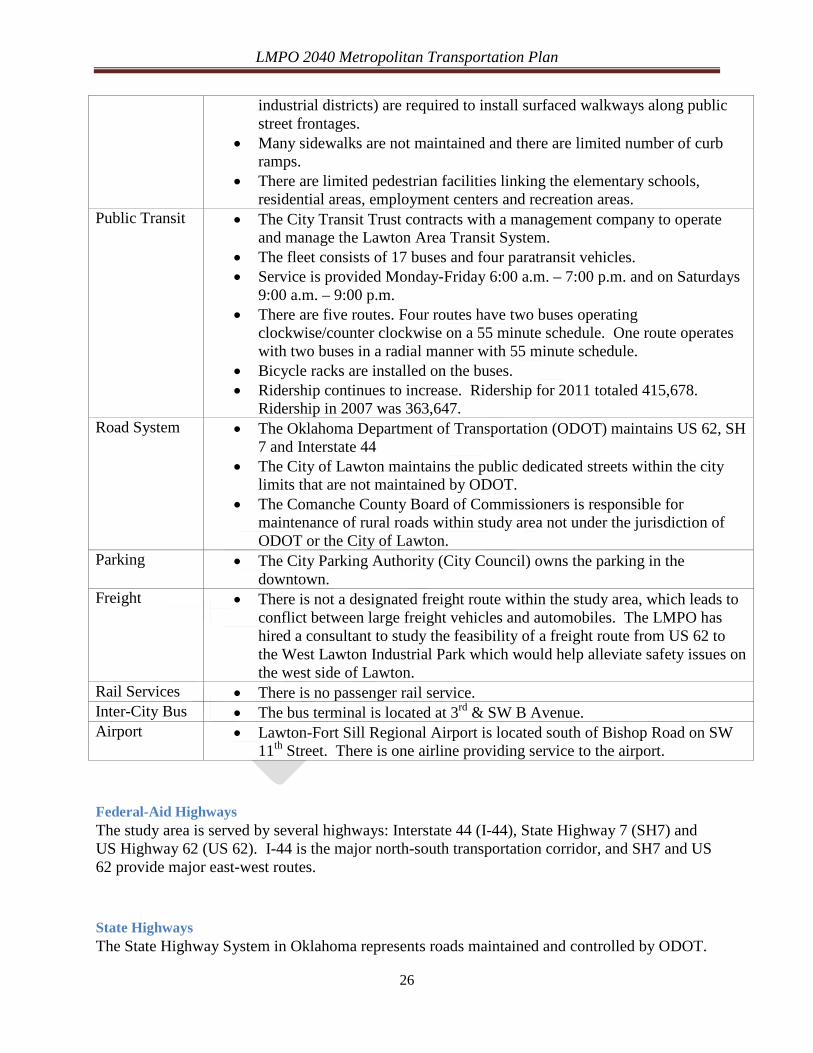
industrial districts) are required to install surfaced walkways along public street frontages.
• Many sidewalks are not maintained and there are limited number of curb ramps.
• There are limited pedestrian facilities linking the elementary schools, residential areas, employment centers and recreation areas.
Public Transit • The City Transit Trust contracts with a management company to operate and manage the Lawton Area Transit System.
• The fleet consists of 17 buses and four paratransit vehicles. • Service is provided Monday-Friday 6:00 a.m. – 7:00 p.m. and on Saturdays
9:00 a.m. – 9:00 p.m. • There are five routes. Four routes have two buses operating
clockwise/counter clockwise on a 55 minute schedule. One route operates with two buses in a radial manner with 55 minute schedule.
• Bicycle racks are installed on the buses. • Ridership continues to increase. Ridership for 2011 totaled 415,678.
Ridership in 2007 was 363,647. Road System • The Oklahoma Department of Transportation (ODOT) maintains US 62, SH
7 and Interstate 44 • The City of Lawton maintains the public dedicated streets within the city
limits that are not maintained by ODOT. • The Comanche County Board of Commissioners is responsible for
maintenance of rural roads within study area not under the jurisdiction of ODOT or the City of Lawton.
Parking • The City Parking Authority (City Council) owns the parking in the downtown.
Freight • There is not a designated freight route within the study area, which leads to conflict between large freight vehicles and automobiles. The LMPO has hired a consultant to study the feasibility of a freight route from US 62 to the West Lawton Industrial Park which would help alleviate safety issues on the west side of Lawton.
Rail Services • There is no passenger rail service. Inter-City Bus • The bus terminal is located at 3rd & SW B Avenue. Airport • Lawton-Fort Sill Regional Airport is located south of Bishop Road on SW
11th Street. There is one airline providing service to the airport.
Federal-Aid Highways The study area is served by several highways: Interstate 44 (I-44), State Highway 7 (SH7) and US Highway 62 (US 62). I-44 is the major north-south transportation corridor, and SH7 and US 62 provide major east-west routes.
State Highways The State Highway System in Oklahoma represents roads maintained and controlled by ODOT.

LMPO 2040 Metropolitan Transportation Plan
27
Existing state highways in the study area include the following: • State Highway 7 – SH 7 extends from its interchange with I-44 east. This facility is
access controlled by ODOT. • U. S. Highway 62 - US 62 extends from its interchange with I-44 west on Rogers Lane
and is a limited access freeway. This facility separates the City from the Fort Sill Military Installation.
Local Streets The local network consists of more than 646 miles of roads. This number does not include streets located on Fort Sill. The City maintains the roads within the corporate limits excluding the Interstate system, U.S. or State highways, which are maintained by ODOT. The County maintains the roads outside the City’s corporate limits.
Map 10: Network by Functional Classification

LMPO 2040 Metropolitan Transportation Plan
28
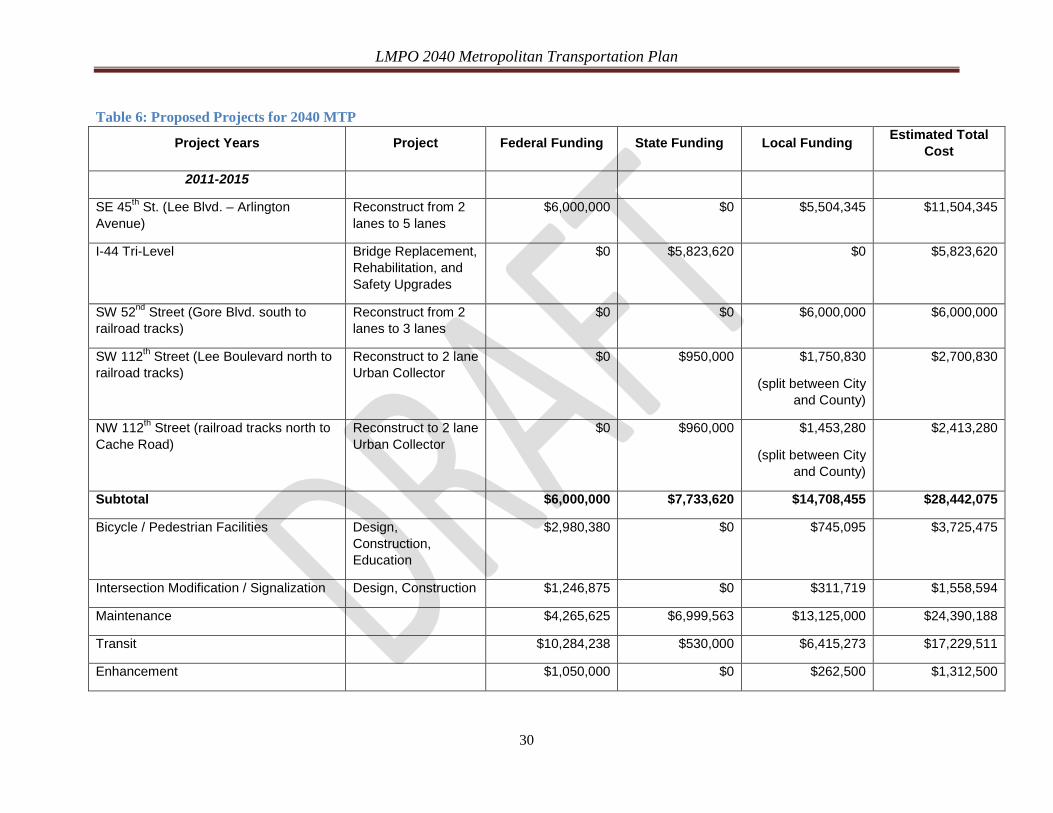
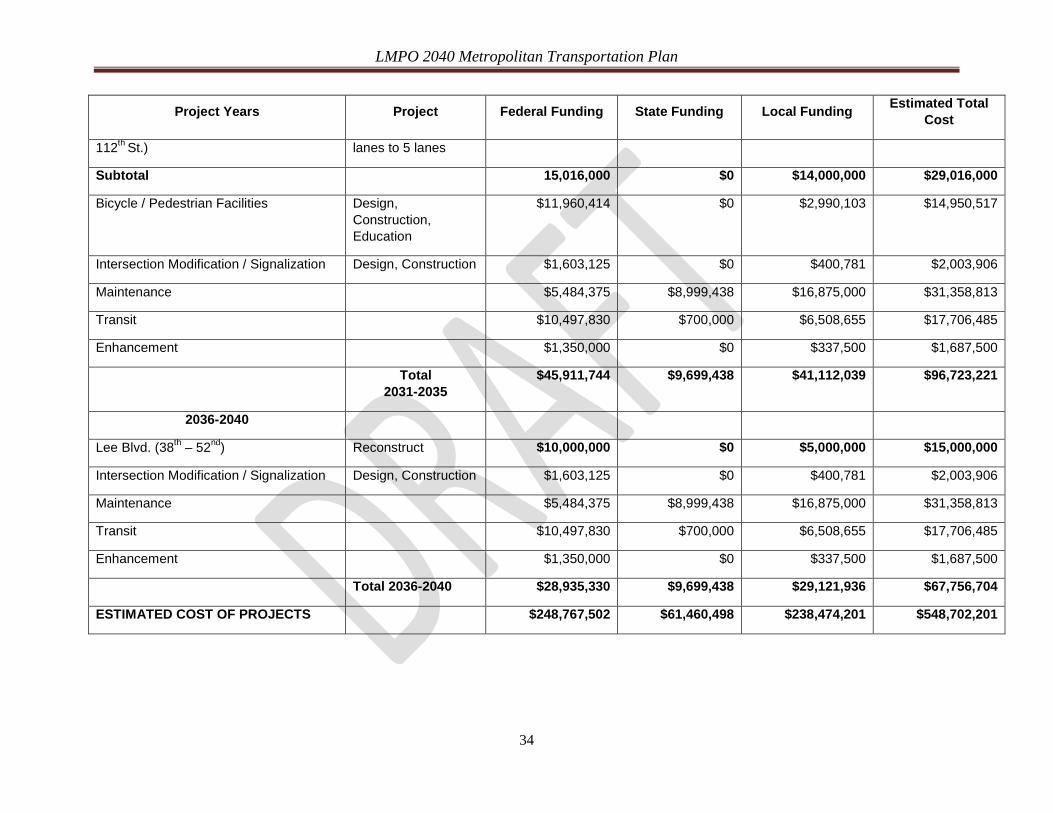
2040 Transportation System Network The local transportation system consists predominantly of streets, limited pedestrian facilities and public transportation. Motorists, transit vehicles, truck drivers, pedestrians, and cyclists all compete for a place on the road network. Enhancing the network by providing bicycle facilities and increasing the number of pedestrian facilities will provide an alternative to the car without expanding the road network. Traffic volumes identify existing travel patterns and assist in determining the transportation system's ability to serve area travel demands. The identification of existing travel patterns and travel demands is based upon available daily traffic volume counts provided by ODOT. Historic traffic volume data is shown in Appendix D. It should again be mentioned that for this update of the MTP, it was assumed that the transportation network for planning purposes was modeled at Level of Service (LOS) D or a volume/capacity ratio of 0.90. The LMPO used a computerized travel demand program for the update of its MTP. Appendix D provides additional information on the development and evaluation of the analyzed street and highway network. The LMPO has reviewed changes to the transportation network. The changes include both major construction improvements and non-construction improvements for congestion mitigation. Table 6 lists the projects with an inflation factor of 1.5% per year and Map 11 illustrates the project locations. The inflation rate of 1.5% per year agrees with the Consumer Price Index from 2010 – 2014. The project costs for 2011-2015 are actual costs and inflation rate is not included in the total cost.
Environmental Justice The LMPO reviewed and analyzed the proposed road construction projects for the 2040 MTP in relation to their effect upon and benefit to marginalized populations in deference to Environmental Justice. The United States Environmental Protection Agency defines Environmental Justice as, “the fair treatment and meaningful involvement of all people regardless of race, color, national origin, or income with respect to the development, implementation, and enforcement of environmental laws, regulations, and policies (http://www.epa.gov/environmentaljustice).” For purposes of the 2040 MTP, Environmental Justice includes verifying that proposed projects do not ignore or disproportionately fail to address the transportation needs in the areas most significantly populated by minority racial and ethnic groups, people aged 65 and older, people whose household income places them below the poverty limit, and people with disabilities. The LMPO analyzed accessibility for those marginalized groups to selected target facilities such as: institutions of higher education, hospitals, major employment centers, and heavily trafficked shopping areas. The purpose of this analysis was to evaluate whether or not the Lawton Metropolitan Transportation Plan was inclusive to the groups traditionally, historically harmed and/or ignored through such processes. Through this evaluation, it is concluded that the projects identified in the 2040 Metropolitan Transportation Plan:

LMPO 2040 Metropolitan Transportation Plan
29
• will not result in an adverse impact to areas with the highest percentages of marginalized populations,
• will not minimize or block access to the transportation system in areas with the highest percentages of marginalized populations; and,
• will not neglect the transportation system in areas with the highest percentages of marginalized populations.
Appendix E contains further details on Environmental Justice in the LMATS area to include tables and maps showing minority, disabled, poverty, persons older than 65 years of age, and persons without vehicles in relation to proposed projects and target facilities by Census Block Group.
Design Standards Historically, the arterials constructed in the study area have been five lane facilities with a center turn lane. The ITE Proposed Recommended Practice, Context Sensitive Solutions (CSS) in Designing Major Urban Thoroughfares for Walkable Communities, provides guidance on applying the principles of CSS in transportation planning and in the design of roadway improvement projects in places where community objectives support walkable communities. Appendix J provides illustrations for recommended street design standards for CSS.
LMPO 2040 Metropolitan Transportation Plan
30
Table 6: Proposed Projects for 2040 MTP
Project Years Project Federal Funding State Funding Local Funding Estimated Total Cost
2011-2015
SE 45th St. (Lee Blvd. – Arlington Avenue)
Reconstruct from 2 lanes to 5 lanes
$6,000,000 $0 $5,504,345 $11,504,345
I-44 Tri-Level Bridge Replacement, Rehabilitation, and Safety Upgrades
$0 $5,823,620 $0 $5,823,620
SW 52nd Street (Gore Blvd. south to railroad tracks)
Reconstruct from 2 lanes to 3 lanes
$0 $0 $6,000,000 $6,000,000
SW 112th Street (Lee Boulevard north to railroad tracks)
Reconstruct to 2 lane Urban Collector
$0 $950,000 $1,750,830
(split between City and County)
$2,700,830
NW 112th Street (railroad tracks north to Cache Road)
Reconstruct to 2 lane Urban Collector
$0 $960,000 $1,453,280
(split between City and County)
$2,413,280
Subtotal $6,000,000 $7,733,620 $14,708,455 $28,442,075
Bicycle / Pedestrian Facilities Design, Construction, Education
$2,980,380 $0 $745,095 $3,725,475
Intersection Modification / Signalization Design, Construction $1,246,875 $0 $311,719 $1,558,594
Maintenance $4,265,625 $6,999,563 $13,125,000 $24,390,188
Transit $10,284,238 $530,000 $6,415,273 $17,229,511
Enhancement $1,050,000 $0 $262,500 $1,312,500
LMPO 2040 Metropolitan Transportation Plan
31
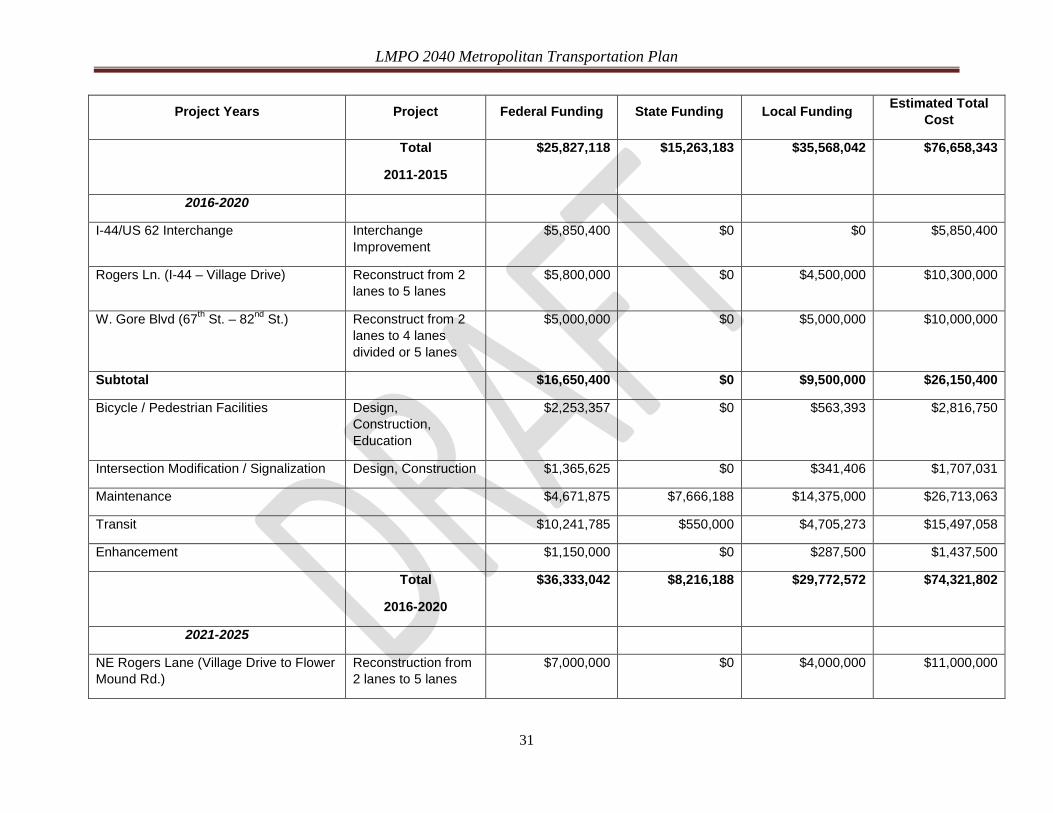
Project Years Project Federal Funding State Funding Local Funding Estimated Total Cost
Total
2011-2015
$25,827,118 $15,263,183 $35,568,042 $76,658,343
2016-2020
I-44/US 62 Interchange Interchange Improvement
$5,850,400 $0 $0 $5,850,400
Rogers Ln. (I-44 – Village Drive) Reconstruct from 2 lanes to 5 lanes
$5,800,000 $0 $4,500,000 $10,300,000
W. Gore Blvd (67th St. – 82nd St.) Reconstruct from 2 lanes to 4 lanes divided or 5 lanes
$5,000,000 $0 $5,000,000 $10,000,000
Subtotal $16,650,400 $0 $9,500,000 $26,150,400
Bicycle / Pedestrian Facilities Design, Construction, Education
$2,253,357 $0 $563,393 $2,816,750
Intersection Modification / Signalization Design, Construction $1,365,625 $0 $341,406 $1,707,031
Maintenance $4,671,875 $7,666,188 $14,375,000 $26,713,063
Transit $10,241,785 $550,000 $4,705,273 $15,497,058
Enhancement $1,150,000 $0 $287,500 $1,437,500
Total
2016-2020
$36,333,042 $8,216,188 $29,772,572 $74,321,802
2021-2025
NE Rogers Lane (Village Drive to Flower Mound Rd.)
Reconstruction from 2 lanes to 5 lanes
$7,000,000 $0 $4,000,000 $11,000,000

LMPO 2040 Metropolitan Transportation Plan
32
Project Years Project Federal Funding State Funding Local Funding Estimated Total Cost
SW 52nd St. (Lee Blvd. north to railroad tracks)
Reconstruct from 2 lanes to 3 lanes
$0 $0 $6,000,000 $6,000,000
Bishop Rd. (38th – 67th) Reconstruct 2 lanes $4,000,000 $0 $4,000,000 $8,000,000
Cache Rd. (67th – 82nd ) Reconstruct from 4 lanes to 5 lanes
$3,150,000 $0 $5,000,000 $8,150,000
Goodyear Blvd. (Cache Rd. – US 62) Construct 2 lanes $4,000,000 $0 $4,000,000 $8,000,000
SW 38th St. (Bishop Rd. – Lee Blvd.) Reconstruct from 2 lanes to 5 lanes
$5,175,000 $0 $5,000,000 $10,175,000
Subtotal $23,325,000 $0 $28,000,000 $51,325,000
Bicycle / Pedestrian Facilities Design, Construction, Education
$2,600,277 $0 $650,069 $3,250,346
Intersection Modification / Signalization Design, Construction $1,484,374 $0 $371,094 $1,855,468
Maintenance $5,078,125 $8,332,813 $15,626,000 $29,036,938
Transit $10,241,785 $600,000 $4,908,539 $15,750,324
Enhancement $1,250,000 $0 $312,500 $1,562,500
Total
2021-2025
$43,979,561 $8,932,813 $49,868,202 $102,780,576
2026-2030
Cache Rd. (82nd – 97th ) Reconstruct from 2 lanes to 5 lanes
$4,725,000 $0 $5,000,000 $9,725,000
SW 52nd St. (Bishop Rd. – Lee Blvd.) Reconstruct from 2 lanes to 3 lanes
$4,725,000 $0 $5,000,000 $9,725,000

LMPO 2040 Metropolitan Transportation Plan
33
Project Years Project Federal Funding State Funding Local Funding Estimated Total Cost
E. Gore Blvd. (NE 45th St. – NE 60th St.) Reconstruct from 2 lanes to 5 lanes
$5,175,000 $0 $5,000,000 $10,175,000
SW 67th St.(Bishop Rd. – Lee Blvd.) Reconstruct from 2 lanes to 3 lanes
$5,625,000 $0 $4,000,000 $9,625,000
Sheridan Rd. (Lee Blvd. – Bishop Rd.) Reconstruct from 2 lanes to 3 lanes
$6,000,000 $0 $6,000,000 $12,000,000
SW 82nd (Lee Blvd. – Coombs Rd.) Reconstruct from 2 lanes to 4 lanes
$12,150,000 $0 $3,037,500 $15,187,500
Subtotal $38,400,000 $0 $28,037,500 $66,437,500
Bicycle / Pedestrian Facilities Design, Construction, Education
$10,701,422 $0 $2,675,356 $13,376,778
Intersection Modification / Signalization Design, Construction $1,603,125 $0 $400,781 $2,003,906
Maintenance $5,484,375 $8,999,438 $16,875,000 $31,358,813
Transit $10,241,785 $650,000 $4,705,273 $15,597,058
Enhancement $1,350,000 $0 $337,500 $1,687,500
Total
2026-2030
$67,780,707 $9,649,438 $53,031,410 $130,461,555
2031-2035
NE Cache Road (Flower Mound Road to NE 45th Street)
Reconstruct from 2 lanes to 5 lanes
$5,760,000 $0 $5,000,000 $10,760,000
NE 45th Street (NE Cache Road to Arlington)
Reconstruct from 2 lanes to 5 lanes
$4,256,000 $0 $4,000,000 $8,256,000
NW Cache Road (Goodyear Blvd. – Reconstruct from 2 $5,000,000 $0 $5,000,000 $10,000,000
LMPO 2040 Metropolitan Transportation Plan
34
Project Years Project Federal Funding State Funding Local Funding Estimated Total Cost
112th St.) lanes to 5 lanes
Subtotal 15,016,000 $0 $14,000,000 $29,016,000
Bicycle / Pedestrian Facilities Design, Construction, Education
$11,960,414 $0 $2,990,103 $14,950,517
Intersection Modification / Signalization Design, Construction $1,603,125 $0 $400,781 $2,003,906
Maintenance $5,484,375 $8,999,438 $16,875,000 $31,358,813
Transit $10,497,830 $700,000 $6,508,655 $17,706,485
Enhancement $1,350,000 $0 $337,500 $1,687,500
Total 2031-2035
$45,911,744 $9,699,438 $41,112,039 $96,723,221
2036-2040
Lee Blvd. (38th – 52nd) Reconstruct $10,000,000 $0 $5,000,000 $15,000,000
Intersection Modification / Signalization Design, Construction $1,603,125 $0 $400,781 $2,003,906
Maintenance $5,484,375 $8,999,438 $16,875,000 $31,358,813
Transit $10,497,830 $700,000 $6,508,655 $17,706,485
Enhancement $1,350,000 $0 $337,500 $1,687,500
Total 2036-2040 $28,935,330 $9,699,438 $29,121,936 $67,756,704
ESTIMATED COST OF PROJECTS $248,767,502 $61,460,498 $238,474,201 $548,702,201

LMPO 2040 Metropolitan Transportation Plan
35
Map 11. Location of Proposed Projects

LMPO 2040 Metropolitan Transportation Plan
36
No-Build Projects The 2040 MTP includes the same no-build projects identified in the 2035 LRTP. I. Intelligent Transportation Systems (ITS) - ITS makes the existing transportation system more
efficient by increasing existing capacity with A. Signalization: Traffic signal retiming is one of the most cost effective ways and is one of the most
basic strategies to help mitigate congestion. B. Signboards: Motorists can be notified in real time of changes in traffic conditions. C. GPS Navigation Systems. D. Internet Information. E. Accident Clearance. F. Provide real time updates of the traffic condition on the street system. G. Transportation Demand Management. II. Transit A. Increase bus service and/or frequencies. B. Implement Park-and-Ride Lots. C. Develop Bicycle Facilities at Trip Origins/Destinations. D. Develop design guidelines for transit cutouts on arterials. III. Bicycle/Pedestrian Plan A. Construct facilities in accordance with the Bicycle & Pedestrian Plan. IV. Land use A. Require raised medians. B. Implement left turn restrictions at intersections operating above Level of Service E or
have an Accident Severity Index of 0.40 or greater for two consecutive years. C. Develop regulations to mitigate traffic impacts from new development based upon trip generation. D. Develop requirements for curb openings to minimize the number of curb openings and establish a
minimum distance between curb openings and between curb openings and street intersections. E. Develop regulations to support infill development, develop regulations to support mixed use
development. F. Develop design guidelines for pedestrian-oriented development and guidelines for mixed use
development. G. Develop and implement an Access Management Plan. H. Develop and implement a Congestion Management Plan.

LMPO 2040 Metropolitan Transportation Plan
37
Chapter 6: Environment The study area has many of the same environmental concerns as other similarly-sized metropolitan areas. The City’s land development and transportation policies that impact environmental issues will be addressed prior to any future development. Section 109(c) (2) of Title 23, USC includes consideration of identified documents and materials that define the core principles of context sensitive solutions (CSS). The basic concept is that a proposed transportation project must be planned not only for its physical aspects as a facility serving specific transportation objectives, but also for its effects on the aesthetic, social, economic and environmental values, needs, constraints and opportunities in a larger community setting. FHWA defines CSS as a collaborative, interdisciplinary, approach that involves all stakeholders in developing a transportation facility that complements its physical setting and preserves scenic, aesthetic, and historic and environmental resources while maintaining safety and mobility.
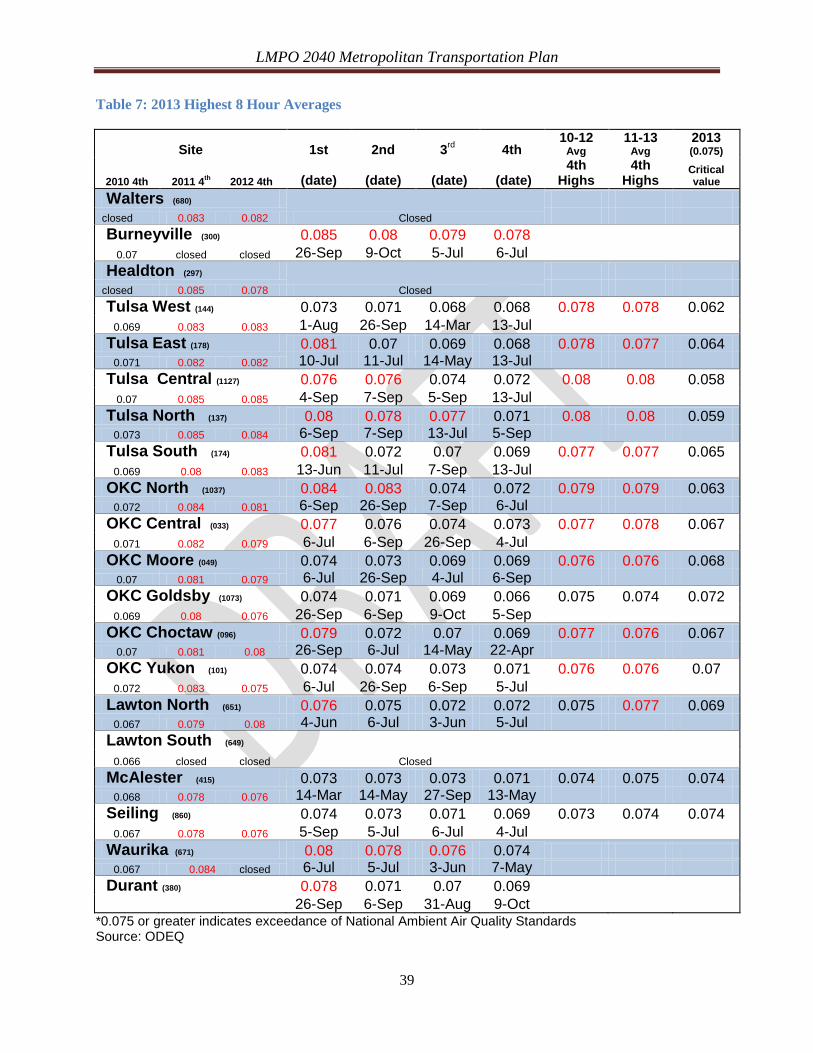
Air Quality The LMPO, working with the Oklahoma Department of Environmental Quality (ODEQ), ensures that the metropolitan transportation system contributes to improving air quality. In 2008 EPA changed the ozone threshold to 0.075 ppm to be designated as an “attainment area.” Currently Comanche County is designated as an “attainment area”; however, the latest numbers show Comanche County is at risk of being designated as nonattainment. Also EPA is considering lowering the standard which will definitely impact Lawton. If the EPA designates Comanche County as nonattainment, the impact will be felt by all towns and cities within the County. The impact to the transportation planning process would result in the LMPO having to show that the MTP and the Transportation Improvement Program (TIP) “conform” to the air pollution reduction goals. To conform, the nonattainment area cannot have an increase in on-road mobile sources generated Volatile Organic Compounds (VOC) or Nitrogen Oxide (NOx) emissions over air pollutant loads shown in previous emission inventories, even if the area experiences significant increase in vehicle miles traveled. The area must also show that transportation emissions continue to decline throughout the metropolitan transportation planning period, and that the area is meeting the State Improvement Plan commitments it has made. The ODEQ did operate two air quality-monitoring stations in Lawton; however, in 2010 the station located on SW 11th Street at Baseline Road was closed. The remaining station is located in the north-central part of Lawton. This station continuously samples the air for Comanche County for ground level ozone. Data gathered at this station is used by the EPA and ODEQ to report on air quality in the LMA. Table 6 shows the 2013 8-hour average for ground-level ozone readings taken at sites throughout Oklahoma. Lawton’s average fourth highest reading from 2011-2013 is 0.077 which is above the threshold set by EPA. The ODEQ monitors weather conditions and informs the City of Lawton Planning Division of air action days. It should be noted that air action days were not forecasted on any of the days in which the ozone level exceeded 0.075 in 2013. The trend of ground-level ozone transport from Dallas-Fort Worth through Oklahoma is expected to continue, considering that prevailing winds during the ground-level ozone season are predominantly from the south. The transport of pollution by prevailing wind patterns is one
LMPO 2040 Metropolitan Transportation Plan
38
factor that is out of the control of the LMA. The LMPO must focus on the parts of the problem within our control. On air action days, the community is urged to do their part to reduce emissions for the day. The Clean Air Lawton program encourages citizens to take personal responsibility for reducing air pollution and help our area avoid expensive penalties and economic development consequences for violating federal air quality standards. The City of Lawton and Comanche County address air quality issues by encouraging behavior that reduces transportation-related air pollution and using best management practices to provide system improvements that reduce congestion. The City and County can also address air quality issues by:
• establishing land use patterns that potentially reduce the number and length of trips and that promote the use of alternative, less polluting, transportation modes,
• promoting the planting of vegetation to absorb air pollutants, • purchasing fuel efficient vehicles, and • upgrading old equipment.
LMPO 2040 Metropolitan Transportation Plan
39
Table 7: 2013 Highest 8 Hour Averages
Site 1st 2nd 3rd 4th 10-12
Avg 11-13
Avg 2013 (0.075)
2010 4th 2011 4th 2012 4th (date) (date) (date) (date) 4th
Highs 4th
Highs Critical value
Walters (680) Closed
closed 0.083 0.082 Burneyville (300) 0.085 0.08 0.079 0.078
0.07 closed closed 26-Sep 9-Oct 5-Jul 6-Jul Healdton (297)
Closed
closed 0.085 0.078 Tulsa West (144) 0.073 0.071 0.068 0.068 0.078 0.078 0.062
0.069 0.083 0.083 1-Aug 26-Sep 14-Mar 13-Jul Tulsa East (178) 0.081 0.07 0.069 0.068 0.078 0.077 0.064
0.071 0.082 0.082 10-Jul 11-Jul 14-May 13-Jul Tulsa Central (1127) 0.076 0.076 0.074 0.072 0.08 0.08 0.058
0.07 0.085 0.085 4-Sep 7-Sep 5-Sep 13-Jul Tulsa North (137) 0.08 0.078 0.077 0.071 0.08 0.08 0.059
0.073 0.085 0.084 6-Sep 7-Sep 13-Jul 5-Sep Tulsa South (174) 0.081 0.072 0.07 0.069 0.077 0.077 0.065
0.069 0.08 0.083 13-Jun 11-Jul 7-Sep 13-Jul OKC North (1037) 0.084 0.083 0.074 0.072 0.079 0.079 0.063
0.072 0.084 0.081 6-Sep 26-Sep 7-Sep 6-Jul OKC Central (033) 0.077 0.076 0.074 0.073 0.077 0.078 0.067
0.071 0.082 0.079 6-Jul 6-Sep 26-Sep 4-Jul OKC Moore (049) 0.074 0.073 0.069 0.069 0.076 0.076 0.068
0.07 0.081 0.079 6-Jul 26-Sep 4-Jul 6-Sep OKC Goldsby (1073) 0.074 0.071 0.069 0.066 0.075 0.074 0.072
0.069 0.08 0.076 26-Sep 6-Sep 9-Oct 5-Sep OKC Choctaw (096) 0.079 0.072 0.07 0.069 0.077 0.076 0.067
0.07 0.081 0.08 26-Sep 6-Jul 14-May 22-Apr OKC Yukon (101) 0.074 0.074 0.073 0.071 0.076 0.076 0.07
0.072 0.083 0.075 6-Jul 26-Sep 6-Sep 5-Jul Lawton North (651) 0.076 0.075 0.072 0.072 0.075 0.077 0.069
0.067 0.079 0.08 4-Jun 6-Jul 3-Jun 5-Jul Lawton South (649)
Closed
0.066 closed closed McAlester (415) 0.073 0.073 0.073 0.071 0.074 0.075 0.074
0.068 0.078 0.076 14-Mar 14-May 27-Sep 13-May Seiling (860) 0.074 0.073 0.071 0.069 0.073 0.074 0.074
0.067 0.078 0.076 5-Sep 5-Jul 6-Jul 4-Jul Waurika (671) 0.08 0.078 0.076 0.074
0.067 0.084 closed 6-Jul 5-Jul 3-Jun 7-May Durant (380) 0.078 0.071 0.07 0.069
26-Sep 6-Sep 31-Aug 9-Oct *0.075 or greater indicates exceedance of National Ambient Air Quality Standards Source: ODEQ
LMPO 2040 Metropolitan Transportation Plan
40
Water Quality Transportation also has a significant impact on water quality. Development of transportation facilities must include an erosion and sediment control plan. Runoff from roads, bridges, parking lots and other impervious surfaces can lead to changes in water chemistry that degrade habitat quality and ultimately pollute drinking water. The City of Lawton has adopted a stormwater ordinance. Appendix I Environment provides additional information.
LMPO 2040 Metropolitan Transportation Plan
41
Chapter 8: Alternate Modes of Transportation
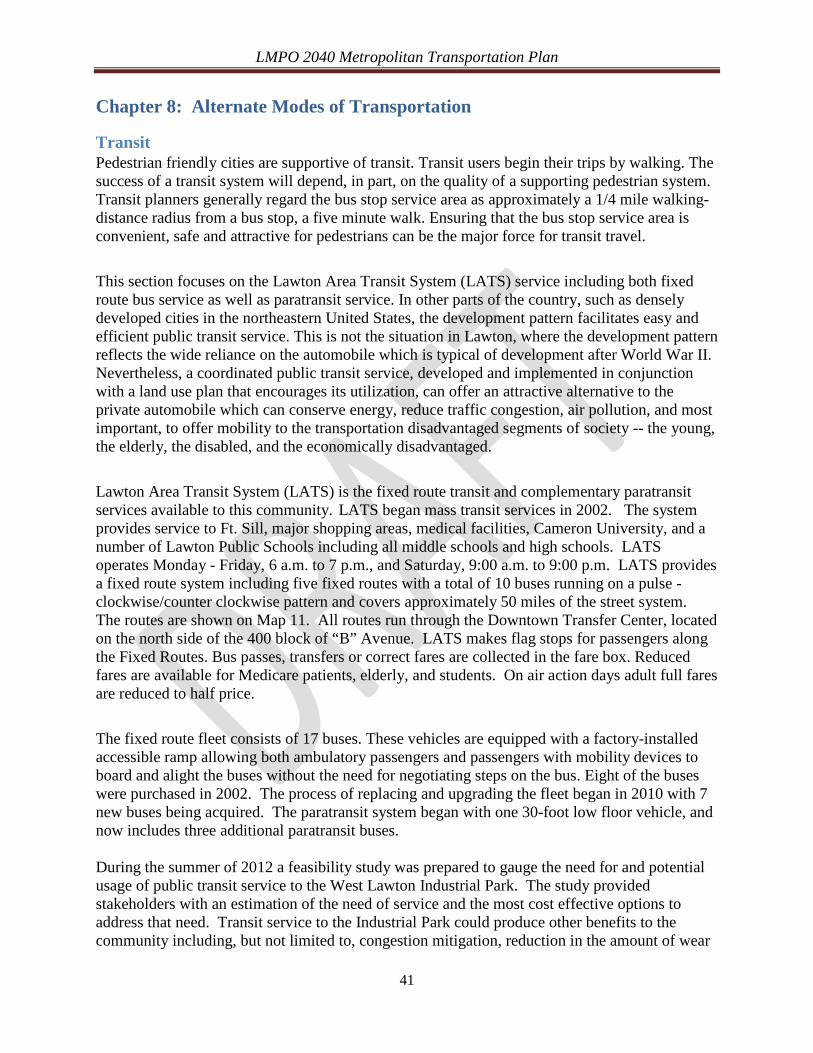
Transit Pedestrian friendly cities are supportive of transit. Transit users begin their trips by walking. The success of a transit system will depend, in part, on the quality of a supporting pedestrian system. Transit planners generally regard the bus stop service area as approximately a 1/4 mile walking-distance radius from a bus stop, a five minute walk. Ensuring that the bus stop service area is convenient, safe and attractive for pedestrians can be the major force for transit travel. This section focuses on the Lawton Area Transit System (LATS) service including both fixed route bus service as well as paratransit service. In other parts of the country, such as densely developed cities in the northeastern United States, the development pattern facilitates easy and efficient public transit service. This is not the situation in Lawton, where the development pattern reflects the wide reliance on the automobile which is typical of development after World War II. Nevertheless, a coordinated public transit service, developed and implemented in conjunction with a land use plan that encourages its utilization, can offer an attractive alternative to the private automobile which can conserve energy, reduce traffic congestion, air pollution, and most important, to offer mobility to the transportation disadvantaged segments of society -- the young, the elderly, the disabled, and the economically disadvantaged. Lawton Area Transit System (LATS) is the fixed route transit and complementary paratransit services available to this community. LATS began mass transit services in 2002. The system provides service to Ft. Sill, major shopping areas, medical facilities, Cameron University, and a number of Lawton Public Schools including all middle schools and high schools. LATS operates Monday - Friday, 6 a.m. to 7 p.m., and Saturday, 9:00 a.m. to 9:00 p.m. LATS provides a fixed route system including five fixed routes with a total of 10 buses running on a pulse - clockwise/counter clockwise pattern and covers approximately 50 miles of the street system. The routes are shown on Map 11. All routes run through the Downtown Transfer Center, located on the north side of the 400 block of “B” Avenue. LATS makes flag stops for passengers along the Fixed Routes. Bus passes, transfers or correct fares are collected in the fare box. Reduced fares are available for Medicare patients, elderly, and students. On air action days adult full fares are reduced to half price. The fixed route fleet consists of 17 buses. These vehicles are equipped with a factory-installed accessible ramp allowing both ambulatory passengers and passengers with mobility devices to board and alight the buses without the need for negotiating steps on the bus. Eight of the buses were purchased in 2002. The process of replacing and upgrading the fleet began in 2010 with 7 new buses being acquired. The paratransit system began with one 30-foot low floor vehicle, and now includes three additional paratransit buses. During the summer of 2012 a feasibility study was prepared to gauge the need for and potential usage of public transit service to the West Lawton Industrial Park. The study provided stakeholders with an estimation of the need of service and the most cost effective options to address that need. Transit service to the Industrial Park could produce other benefits to the community including, but not limited to, congestion mitigation, reduction in the amount of wear
LMPO 2040 Metropolitan Transportation Plan
42
on roadways, and reduction in automotive emissions. The LMPO recommended the City approve a Flexible Fixed Route which would operate along most of the major arterials Monday through Saturday with arrival and departure times corresponding to shift changes for the largest number of employees. It was also recommended that a Carpool/Vanpool program be approved to provide another option at a low cost. At this time funding has yet to be identified for this service. The transit transfer center is located outside Wayne Gilley City Hall, and until 2013 bus drivers and passengers had access to restrooms and vending machines in that building. The City moved offices to the new City Hall and closed the building. In 2013 the LMPO hired a consultant to prepare a design concept and location report for a new multi-modal transportation center. The consultant researched two sites which are owned by the City and prepared designs for each location. The next step would be to conduct an environmental assessment of the site. The City has not decided on a location. To serve the increasing number of people who use the transit system, a transfer center is necessary. The transfer center could also serve the regional bus system.
Map 12: LATS Route Map

LMPO 2040 Metropolitan Transportation Plan
43
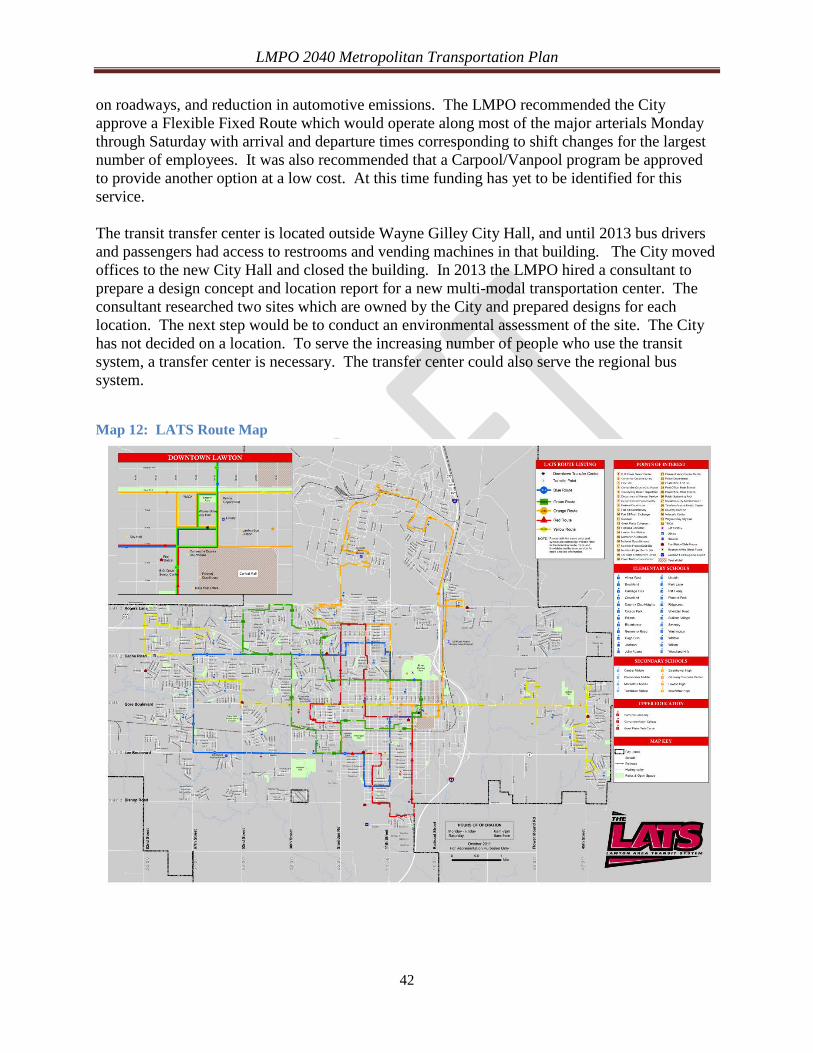
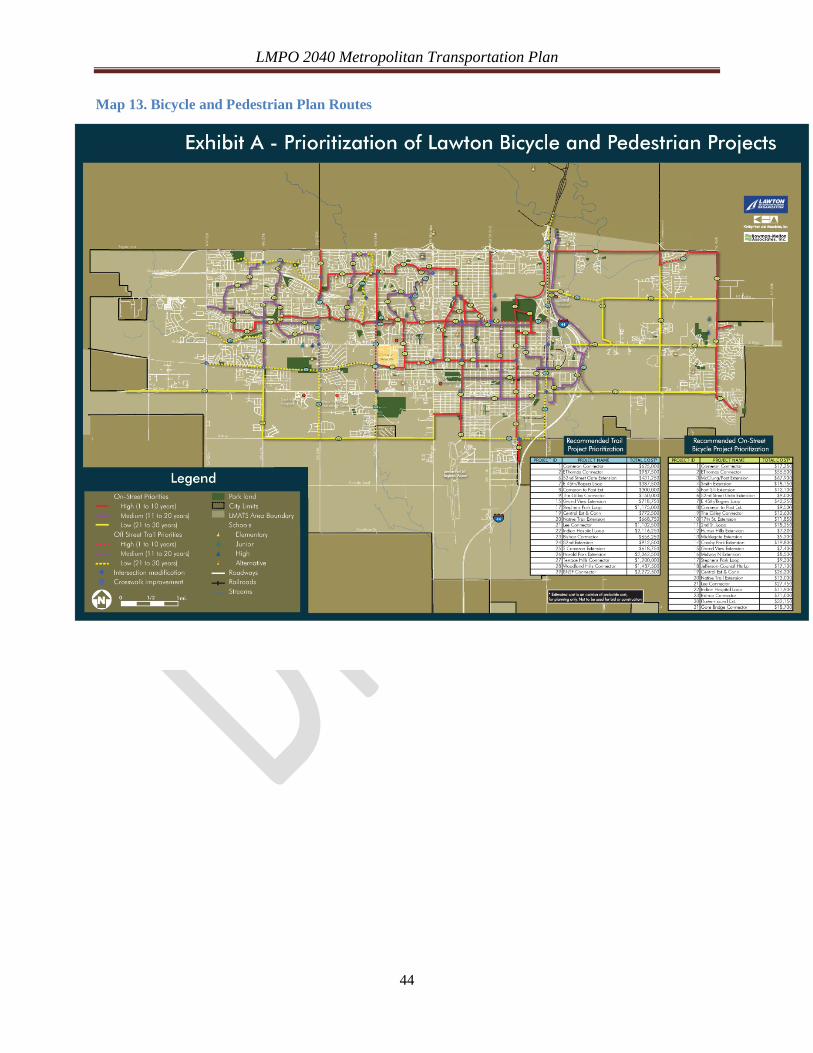
Bicycle and Pedestrian Historically, City and County streets throughout the study area were designed and built with little regard for modes of transportation other than the automobile. It was not until the adoption of ISTEA in 1990 that pedestrian/bicycle facilities were required to be constructed on streets using federal highway funds. In June 2008 the City adopted the Lawton Metropolitan Bicycle and Pedestrian Plan. An amendment to the plan was approved in 2010 for the location of the Elmer Thomas Park Connector. Map 12 illustrates the routes approved in the Bicycle and Pedestrian Plan. The design of the first nine routes has been completed, and the bid has been awarded for the construction of the first four routes: Cameron Connector, Elmer Thomas Park Connector, McClung/Post Extension and Fort Sill Extension. These four routes are shown on Map 13 along with the existing loop in Elmer Thomas Park and the Rock Island Connector. Funding has been provided through Congestion Mitigation and Air Quality funds, ODOT Transportation Enhancement grants, the Comanche Nation, and the City of Lawton. See Appendix G for additional bicycle and pedestrian information. It should be assumed that people will walk, and pedestrians should be accommodated. Where and when people are not walking is often because they are discouraged from doing so due to insufficient facilities. In 1992, the City of Lawton adopted an ordinance which required the installation of sidewalks in new residential subdivisions as an element of the building permit process. In 2006, the City adopted an ordinance requiring all applicants for building permits to construct new buildings in multi-family residential, commercial, and public facilities districts to install sidewalks along public street frontages. The City Code also requires the installation of sidewalks with the construction of churches and schools in any zoning district except industrial districts. Sidewalks in the city are required with the construction of new streets when federal funding is involved. The City Code requires the abutting property owners to maintain the sidewalks. The County development regulations do not require sidewalks; therefore, sidewalks are not required in developments outside the jurisdiction of the City of Lawton.
LMPO 2040 Metropolitan Transportation Plan
44
Map 13. Bicycle and Pedestrian Plan Routes
LMPO 2040 Metropolitan Transportation Plan
45
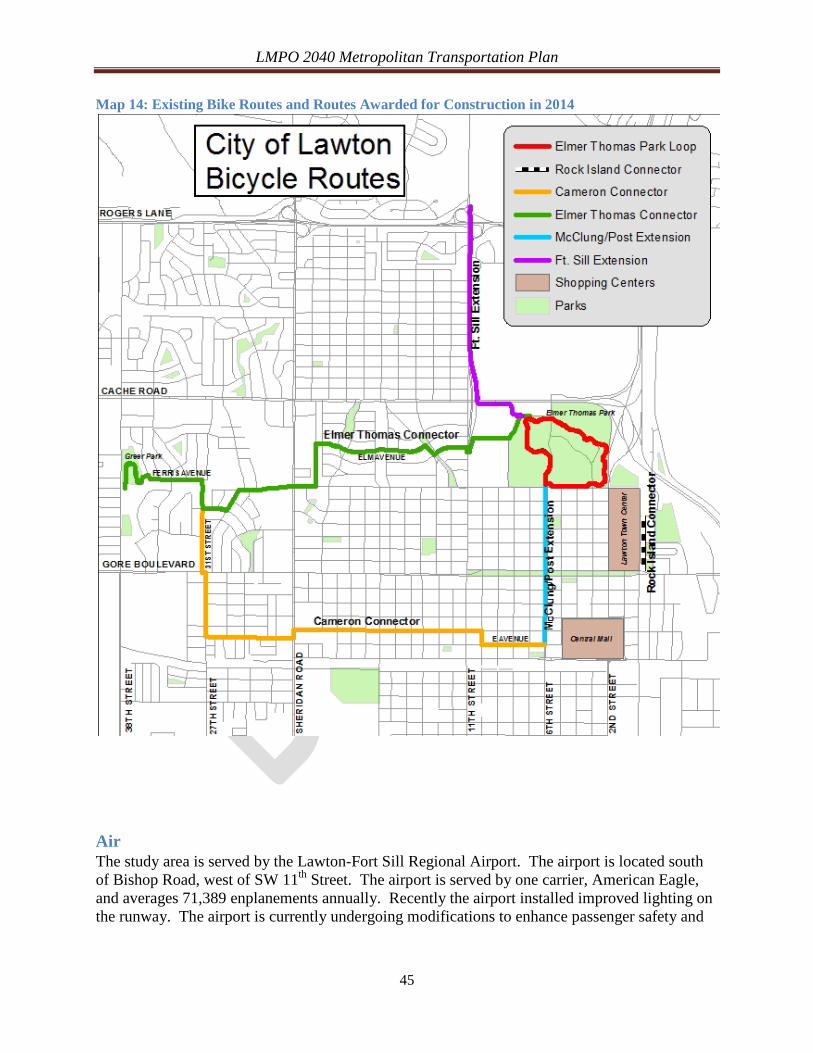
Map 14: Existing Bike Routes and Routes Awarded for Construction in 2014
Air The study area is served by the Lawton-Fort Sill Regional Airport. The airport is located south of Bishop Road, west of SW 11th Street. The airport is served by one carrier, American Eagle, and averages 71,389 enplanements annually. Recently the airport installed improved lighting on the runway. The airport is currently undergoing modifications to enhance passenger safety and

LMPO 2040 Metropolitan Transportation Plan
46
convenience. The Federal Aviation Administration classifies the airport as a Commercial Airport.
Rail There is no passenger rail service in the study area. The railroads in the study area are used primarily by the industries in the West Lawton Industrial Park. There are approximately 19.5 miles of open rail track within the study area.
LMPO 2040 Metropolitan Transportation Plan
47
Chapter 9: Freight Through MAP-21 the Federal Government has increased the visibility of freight movement in metropolitan areas throughout the United States. The guidelines, recommendations, and requirements under MAP-21 are to be used by States and MPOs to guide the development of an overall baseline assessment and a set of recommendations for improving the transportation network and its performance for freight movement. In addition, MAP-21 established a national freight policy with the following objectives:
• Strengthen the contribution of the national freight network to the economic competitiveness of the US;
• Reduce congestion • Increase productivity, particularly for domestic industries and businesses that create high-
value jobs; • Improve safety, security, and resilience of freight transportation; • Improve the state of good repair of the national freight network; • To use advanced technology to improve the safety and efficiency of the national freight
network; • To incorporate concepts of performance, innovation, competition, and accountability into
the operation and maintenance of the national freight network; and • To improve the economic efficiency of the national freight network.
The Oklahoma Department of Transportation is working on a freight plan for the state.
Roads The need for a designated freight route has been discussed for many years. Trucks traveling to the study area use I-44, US 62, and SH 7. Trucks going to the West Lawton Industrial Park, which is the major industrial area, typically use I-44 and US 62. The West Lawton Industrial Park is located on both sides of Goodyear Boulevard between Lee Boulevard and Cache Road. Previous plans discussed constructing Goodyear Boulevard from US 62 south to NW Cache Road, extending the route along Goodyear Boulevard to Lee Boulevard, east on Lee Boulevard to 82nd Street, and then south on 82nd Street to SH 36. This route would provide a loop around Lawton from I-44. Most of that route would be located outside the study area. The ODOT Division VII Engineer has advised that there would be an issue extending Goodyear Boulevard to US 62 due to the close proximity of the interchange of NW Quanah Parker Trailway and Rogers Lane (US 62). Currently westbound trucks are exiting US 62 at NW 82nd Street, traveling south on NW 82nd Street to Cache Road, then west on Cache Road to Goodyear Boulevard, and then south on Goodyear Boulevard to the industrial area. A major shopping center has been constructed at NW 82nd Street and Quanah Parker Trailway, which is making this route a safety concern for the trucks and vehicles traveling to the shopping center. Eastbound trucks are exiting US 62 at Deyo Mission Road, traveling south to Cache Road, then east to Goodyear Boulevard, and then south to the industrial area. The LMPO has hired Guernsey and Associates to study the feasibility of extending Goodyear Boulevard to US 62 or at least designating a route from US 62 to the West Lawton Industrial

LMPO 2040 Metropolitan Transportation Plan
48
Park. It is anticipated the study will be completed in 2015.
Airport The Lawton-Fort Sill Regional Airport is centrally located within the study area and operates as an intermodal (Ground Air) facility for the area’s freight. Facilities and infrastructure exist to serve truck-to-plane transfers of freight and vice versa. According to the Federal Aviation Administration the airport is classified as a Commercial Airport.
Railroad Freight movement by rail in the study area is primarily used by the industries in the West Lawton Industrial Park. There are approximately 19.5 miles of open rail track in the study area. The rail infrastructure is controlled by the Stillwater Central Railroad (17.7 miles) and the Union Pacific (1.8 miles). Appendix F Freight provides additional information.

LMPO 2040 Metropolitan Transportation Plan
49
Chapter 10: Funding
Funding Sources The purpose of this chapter is to provide an overview of anticipated revenue sources and the transportation funds through the year 2040 needed to implement this plan. Effort was made to accurately estimate the revenues and costs closely. This analysis was based on past trends and future revenue estimates. However, fulfilling the investment scenario presented in this Plan is contingent upon continued financial commitments by local, state, and federal authorities.
Transportation system improvements will ultimately be made based on need and the local government’s ability to pay for needed improvements. The City of Lawton funds its transportation infrastructure and services almost entirely from the general operation budget and Capital Improvement Programs (CIP). Federal and State funding is on a project-by-project basis. These funds are highly competitive and availability of funds may not follow the City’s priorities.
Funding for streets and highways within the study area comes from three sources: City of Lawton, Comanche County, and ODOT. Private sources also may be available for a limited amount of funding. As noted above, the City's ability to pay for projects will influence its project priorities and its rate of project implementation. The 2012 CIP identified funding for transportation projects through 2019 as follows:
Arterial Roadway and Bridge Improvements
• SE 45th Street - Lee Boulevard north to Bell Avenue $ 8,500,000 • SW 52nd Street - Gore Boulevard south to the railroad tracks $ 4,700,000 • NW 2nd Street Enhancement – Ferris to Columbia Avenue $ 2,600,000 • Citywide Mill and Overlay Program $10,800,000
Residential Street and Drainage Improvements
• Citywide Overlay and Reconstruction Projects $ 8,000,000 • NW 35th Street and Arlington Avenue $ 4,200,000 • 27th/31st Street Design (Realignment of intersection) $ 500,000
Revenues The estimated revenues for the 2040 LRTP are $483,857,929 (capital roads, transit, maintenance, pedestrian and bicycle facilities). This estimate includes federal, state and local funding sources. Table 7 shows the estimated revenue for implementation.
Table 7: Estimated Revenue for Implementation of Projects
STREETS AND HIGHWAYS ESTIMATED 20-YEAR TOTAL
Federal-Aid Funds: IM, NHS, STP, STP Enhancement and CMAQ, matching funds $ 96,066,897 State Funds: State Highway Maintenance Taxes and Fees $ 60,056,246 Local Funds: General Fund, Developer Contributions, bonds and sales tax $246,713,266 Subtotal $402,836,409 TRANSIT Federal Funds: FTA $ 42,023,741
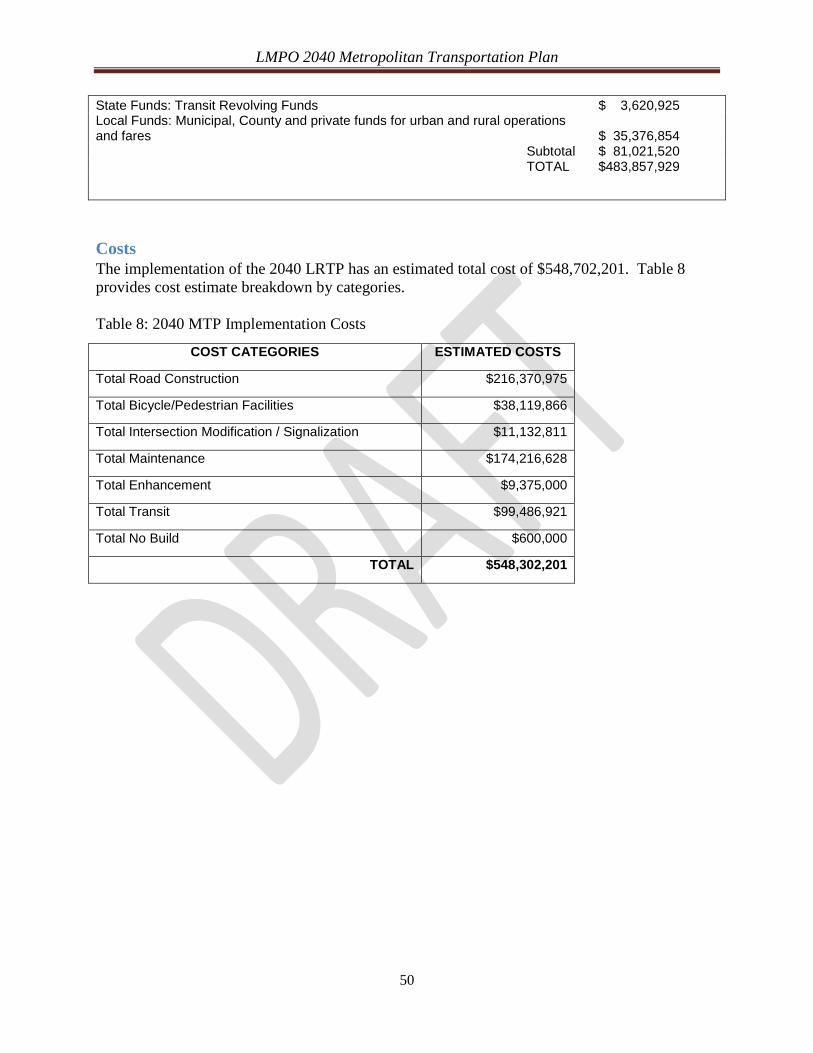
LMPO 2040 Metropolitan Transportation Plan
50
State Funds: Transit Revolving Funds $ 3,620,925 Local Funds: Municipal, County and private funds for urban and rural operations and fares $ 35,376,854 Subtotal $ 81,021,520 TOTAL $483,857,929
Costs The implementation of the 2040 LRTP has an estimated total cost of $548,702,201. Table 8 provides cost estimate breakdown by categories. Table 8: 2040 MTP Implementation Costs
COST CATEGORIES ESTIMATED COSTS
Total Road Construction $216,370,975
Total Bicycle/Pedestrian Facilities $38,119,866
Total Intersection Modification / Signalization $11,132,811
Total Maintenance $174,216,628
Total Enhancement $9,375,000
Total Transit $99,486,921
Total No Build $600,000
TOTAL $548,302,201

LMPO 2040 Metropolitan Transportation Plan
51
Chapter 11: Conclusion
TO BE COMPLETED AFTER PUBLIC FORUMS ARE CONDUCTED