Table of Contents: Introduction - DNA Tribes
13
DNA Tribes ® Digest April 2, 2013 All contents © 2006-2013 DNA Tribes. DNA Tribes®. What’s Your Tribe?®. DNA Tribes proprietary SNP analysis is available exclusively from DNA Tribes. DNA Tribes® Digest April 2, 2013 Page 1 of 13 Web: www.dnatribes.com; Email: [email protected]; Facebook: facebook.com/DNAtribes Mail: DNA Tribes, P.O. Box 735, Arlington, VA 22216 DNA Tribes ® Digest April 2, 2013 Copyright © 2013 DNA Tribes ® . All rights reserved. To request an email subscription to DNA Tribes ® Digest, email [email protected] with the subject heading “Subscribe.” To unsubscribe from DNA Tribes ® Digest, email [email protected] with the subject heading “Unsubscribe.” Previous issues of DNA Tribes ® Digest are available online at http://dnatribes.com/library.html. Table of Contents: Introduction ..................................................................................................................................... 1 Visualizing World Genetic Relationships using Multi-Dimensional Scaling (MDS) (Part One) .. 2 Background ............................................................................................................................. 2 Regional Genetic Relationships in Africa............................................................................... 4 Regional Genetic Relationships in Saharan-Arabian Populations .......................................... 5 Regional Genetic Relationships in Western Asia ................................................................... 7 Regional Genetic Relationships in Europe ............................................................................. 9 DNA Tribes ® SNP Update for February 2013............................................................................... 12 Introduction Hello, and welcome to the April 2013 issue of DNA Tribes ® Digest. This month’s article begins a two-part “big picture” exploration of world genetic relationships using Multi-Dimensional Scaling (MDS). This global view is important, because the larger genetic relationships between regions and continents provide the necessary context to understand the smaller, more localized links between populations. This big picture includes (for instance) the genetic similarity between West Asian and European populations, and the global genetic continuum linking populations of Africa, the Middle East, Europe, Asia, and the Americas. These genetic patterns provide insights about the early migration and trade routes of our peripatetic ancestors and reveal the basic connectedness of populations around the world. The last section of this month’s article will also in particular examine whether present day Basques and Sardinians might provide clues about the spread of early Indo-European languages (ancestral to present day Romance languages, such as Spanish, Portuguese, Sardinian, and Italian) in the Mediterranean. Best regards, Lucas Martin DNA Tribes DNA Tribes ® is on Facebook. Find us at http://facebook.com/DNAtribes
Transcript of Table of Contents: Introduction - DNA Tribes

DNA Tribes® Digest April 2, 2013
All contents © 2006-2013 DNA Tribes. DNA Tribes®. What’s Your Tribe?®. DNA Tribes proprietary SNP analysis
is available exclusively from DNA Tribes.
DNA Tribes® Digest April 2, 2013 Page 1 of 13
Web: www.dnatribes.com; Email: [email protected]; Facebook: facebook.com/DNAtribes Mail: DNA Tribes, P.O. Box 735, Arlington, VA 22216
DNA Tribes® Digest April 2, 2013 Copyright © 2013 DNA Tribes®. All rights reserved. To request an email subscription to DNA Tribes® Digest, email [email protected] with the subject heading “Subscribe.” To unsubscribe from DNA Tribes® Digest, email [email protected] with the subject heading “Unsubscribe.” Previous issues of DNA Tribes® Digest are available online at http://dnatribes.com/library.html.
Table of Contents:
Introduction ..................................................................................................................................... 1 Visualizing World Genetic Relationships using Multi-Dimensional Scaling (MDS) (Part One) .. 2
Background ............................................................................................................................. 2 Regional Genetic Relationships in Africa ............................................................................... 4 Regional Genetic Relationships in Saharan-Arabian Populations .......................................... 5 Regional Genetic Relationships in Western Asia ................................................................... 7 Regional Genetic Relationships in Europe ............................................................................. 9
DNA Tribes® SNP Update for February 2013............................................................................... 12
Introduction
Hello, and welcome to the April 2013 issue of DNA Tribes® Digest. This month’s article begins a two-part “big picture” exploration of world genetic relationships using Multi-Dimensional Scaling (MDS).
This global view is important, because the larger genetic relationships between regions and continents provide the necessary context to understand the smaller, more localized links between populations. This big picture includes (for instance) the genetic similarity between West Asian and European populations, and the global genetic continuum linking populations of Africa, the Middle East, Europe, Asia, and the Americas. These genetic patterns provide insights about the early migration and trade routes of our peripatetic ancestors and reveal the basic connectedness of populations around the world.
The last section of this month’s article will also in particular examine whether present day Basques and Sardinians might provide clues about the spread of early Indo-European languages (ancestral to present day Romance languages, such as Spanish, Portuguese, Sardinian, and Italian) in the Mediterranean.
Best regards,
Lucas Martin DNA Tribes
DNA Tribes® is on Facebook. Find us at http://facebook.com/DNAtribes
DNA Tribes® Digest April 2, 2013
All contents © 2006-2013 DNA Tribes. DNA Tribes®. What’s Your Tribe?®. DNA Tribes proprietary SNP analysis
is available exclusively from DNA Tribes.
DNA Tribes® Digest April 2, 2013 Page 2 of 13
Web: www.dnatribes.com; Email: [email protected]; Facebook: facebook.com/DNAtribes Mail: DNA Tribes, P.O. Box 735, Arlington, VA 22216
Visualizing World Genetic Relationships using Multi-Dimensional Scaling (MDS) (Part One)
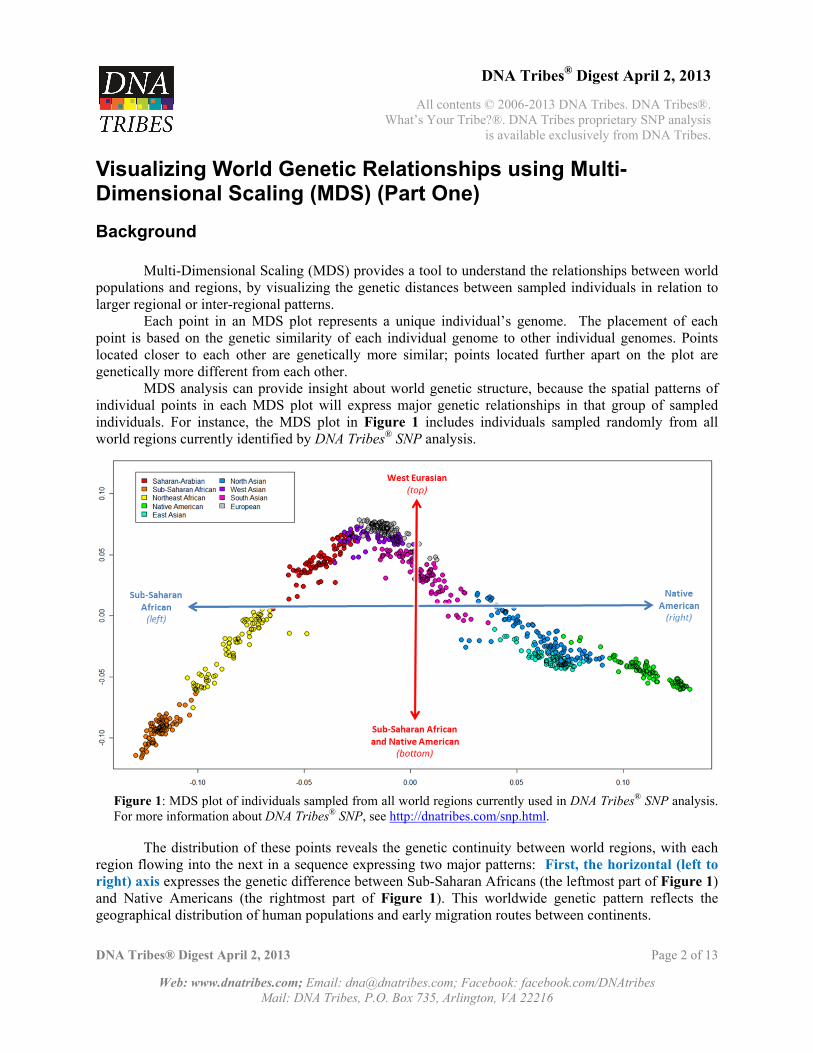
Background Multi-Dimensional Scaling (MDS) provides a tool to understand the relationships between world populations and regions, by visualizing the genetic distances between sampled individuals in relation to larger regional or inter-regional patterns. Each point in an MDS plot represents a unique individual’s genome. The placement of each point is based on the genetic similarity of each individual genome to other individual genomes. Points located closer to each other are genetically more similar; points located further apart on the plot are genetically more different from each other. MDS analysis can provide insight about world genetic structure, because the spatial patterns of individual points in each MDS plot will express major genetic relationships in that group of sampled individuals. For instance, the MDS plot in Figure 1 includes individuals sampled randomly from all world regions currently identified by DNA Tribes® SNP analysis.
Figure 1: MDS plot of individuals sampled from all world regions currently used in DNA Tribes® SNP analysis. For more information about DNA Tribes® SNP, see http://dnatribes.com/snp.html.
The distribution of these points reveals the genetic continuity between world regions, with each region flowing into the next in a sequence expressing two major patterns: First, the horizontal (left to right) axis expresses the genetic difference between Sub-Saharan Africans (the leftmost part of Figure 1) and Native Americans (the rightmost part of Figure 1). This worldwide genetic pattern reflects the geographical distribution of human populations and early migration routes between continents.

DNA Tribes® Digest April 2, 2013
All contents © 2006-2013 DNA Tribes. DNA Tribes®. What’s Your Tribe?®. DNA Tribes proprietary SNP analysis
is available exclusively from DNA Tribes.
DNA Tribes® Digest April 2, 2013 Page 3 of 13
Web: www.dnatribes.com; Email: [email protected]; Facebook: facebook.com/DNAtribes Mail: DNA Tribes, P.O. Box 735, Arlington, VA 22216
For instance, Northeast African and Saharan-Arabian populations form a genetic “bridge” between Sub-Saharan Africa and West Eurasian (West Asian and European) populations; this reflects early migration and trade routes linking Africa and West Eurasia in these areas, such as the Nile Valley, Red Sea, and Sahara Desert. Similarly, North Asian populations form a similar bridge between Asian and Native American populations; this reflects the early migration routes into the Americas via Siberia. Second, the vertical (top to bottom) axis expresses the genetic difference between West Eurasian (West Asian and European) individuals (towards the top of Figure 1) and individuals sampled from other world regions (towards the bottom of Figure 1). This reflects West Eurasia’s geographical position midway along the global migration routes between Africa and the Americas via Eurasia (represented in the horizontal left-right axis), as well as West Eurasia’s role as a local population center (represented by the vertical or top-bottom axis). The regions genetically closest to West Eurasia are the Saharan-Arabian and South Asian regions, reflecting their geographical locals adjacent to West Eurasia. The regions most genetically distant from West Eurasia are the Sub-Saharan African and Native American regions, reflecting isolation by distance due to the relative difficulty in travel to these distant continents from other parts of the world prior to the modern period. However, it is notable that there are no large “breaks” in the MDS plot of individuals sampled from around the world. Instead, the individuals sampled from geographical crossroads or connecting regions form smooth transitions between geographical extremes. This continuity reflects the genetic traces of the human propensity for wandering to the ends of the earth (even crossing formidable seas and deserts) for purposes of trade, exploration, or finding a better home during periods of environmental change. The following sections of this article will explore genetic relationships among regions in more detail, with MDS plots illustrating more local patterns in each part of the world.1
1 For more information about DNA Tribes® SNP analysis, see http://dnatribes.com/snp.html. For tables listing how regional admixture is expressed for populations sampled in our SNP database, see http://dnatribes.com/dnatribes-snp-admixture-2013-02-11.pdf.

DNA Tribes® Digest April 2, 2013
All contents © 2006-2013 DNA Tribes. DNA Tribes®. What’s Your Tribe?®. DNA Tribes proprietary SNP analysis
is available exclusively from DNA Tribes.
DNA Tribes® Digest April 2, 2013 Page 4 of 13
Web: www.dnatribes.com; Email: [email protected]; Facebook: facebook.com/DNAtribes Mail: DNA Tribes, P.O. Box 735, Arlington, VA 22216
Regional Genetic Relationships in Africa
To visualize genetic relationships in Africa, MDS analysis of individuals sampled randomly from
African and neighboring regions identified by DNA Tribes® SNP analysis was performed. Results are illustrated in Figure 2.
Figure 2: MDS plot of individuals randomly sampled from Sub-Saharan African (circled in red), Northeast African (circled in blue) and neighboring regions.
Discussion: Results in Figure 2 express two genetic patterns in sampled African individuals. First, the blue horizontal (left-to-right) axis expresses the genetic difference between Saharan-Arabian individuals (North Africans and Arabians; to the left of the plot) and Sub-Saharan African individuals (West African and Khoisan-Aka; to the right of the plot).
Notably, Northeast Africans (from the Horn of Africa and Nilotic regions) are intermediate along this axis. This reflects the role of Northeast Africans in connecting Sub-Saharan Africa with the Maghreb

DNA Tribes® Digest April 2, 2013
All contents © 2006-2013 DNA Tribes. DNA Tribes®. What’s Your Tribe?®. DNA Tribes proprietary SNP analysis
is available exclusively from DNA Tribes.
DNA Tribes® Digest April 2, 2013 Page 5 of 13
Web: www.dnatribes.com; Email: [email protected]; Facebook: facebook.com/DNAtribes Mail: DNA Tribes, P.O. Box 735, Arlington, VA 22216
and Arabian Peninsula. Along this continuum, Horn of African individuals are closer to Saharan-Arabian, and Nilotic individuals are closer to West Africans. Second, the red vertical (top-to-bottom) axis expresses the genetic distinction between Nilotic and West African individuals (towards to the top) and Khoisan-Aka individuals (towards the bottom of the chart). Notably, Khoisan-Aka individuals are distributed with no major gap or break in this genetic continuum with West Africans; this might reflect historical contacts between Khoisan related cultures and West Africans during the course of the Bantu Expansions.2
Regional Genetic Relationships in Saharan-Arabian Populations
To visualize genetic relationships in the Middle East, MDS analysis of individuals sampled
randomly from Saharan-Arabian and neighboring regions. Results are illustrated in Figure 3.
Figure 3: MDS plot of individuals randomly sampled from Saharan-Arabian (circled) and neighboring regions identified by DNA Tribes® SNP analysis.
2 For more information about the Bantu Expansions, see http://dnatribes.com/dnatribes-digest-2013-03-02.pdf.

DNA Tribes® Digest April 2, 2013
All contents © 2006-2013 DNA Tribes. DNA Tribes®. What’s Your Tribe?®. DNA Tribes proprietary SNP analysis
is available exclusively from DNA Tribes.
DNA Tribes® Digest April 2, 2013 Page 6 of 13
Web: www.dnatribes.com; Email: [email protected]; Facebook: facebook.com/DNAtribes Mail: DNA Tribes, P.O. Box 735, Arlington, VA 22216
Discussion: Results in Figure 3 express two genetic patterns in sampled Saharan-Arabian individuals. First, the blue horizontal (left-to-right) axis expresses the genetic difference between West Eurasian (leftmost) and Sub-Saharan African (rightmost) individuals. Saharan-Arabian individuals (circled in Figure 3) are located towards the left of this continuum. This reflects the genetic relationship between sampled West Asians, Europeans, and Saharan-Arabians, also illustrated in Figure 1 and discussed in the Background section of this article.
Compared to sampled East Mediterranean and European individuals, Saharan-Arabian individuals are somewhat closer to Sub-Saharan Africans. This might reflect a greater history of contacts between Sub-Saharan Africa and both North Africa and the Arabian Peninsula. For instance, these contacts might include population movements via early trade and migration routes along the Nile River and Red Sea, as well as Trans-Saharan trade routes active since early periods.3
Within the Arabian region (green in Figure 3), some Arabians are shifted further to the right (towards Africans) relative to other Arabians. This might reflect differing degrees of contact with Africa. This might partly reflect relatively recent processes (such as the African slave trade in the Islamic period).
However, another factor might be earlier migrations between West Asia and Africa described by the Hebrew patriarchal narratives. African links are also suggested by Hebrew traditions attributing African related origins to ancestral Sidonians, Hittites, Amorites, and other Canaanite peoples, as well as later contacts between the East Mediterranean and Africa.4 Similarly, the Greek historians Herodotus and Strabo recorded traditions that the Phoenicians originated in the Erythraean Sea (the Red Sea and northwest Indian Ocean) before coming to the East Mediterranean.5 Second, the red vertical (top-to-bottom) axis expresses the genetic continuum between Arabian Peninsula (top) and European and Sub-Saharan African (bottom) individuals. Along this axis, some Arabian individuals in particular extend towards the top of the chart. This might reflect the genetic distinctiveness of local Arabian populations, perhaps due to periods of geographical isolation in the Arabian Peninsula. Notably, sampled populations that are most representative of the Arabian genetic component include not only Saudi and Qatari individuals, but also Yemeni Jewish individuals.6 This is notable, since local traditions attest Jewish communities in Southern Arabia (Temanim) dating to the First Temple period and possibly to the early United Monarchy of King Solomon.7
In addition to more Arabian-like individuals towards the top of the chart, other sampled Arabian and North African individuals appear lower on this vertical axis, forming a smooth continuum with sampled East Mediterraneans. This might reflect gene flow between these regions, including migrations between ancient Canaan, Africa, and Arabian Peninsula (attested in early Egyptian and Mesopotamian records, as well as the Hebrew patriarchal narratives).8
3 For more information, see http://dnatribes.com/dnatribes-digest-2012-09-01.pdf (Horn of Africa genetic links with the East Mediterranean); http://dnatribes.com/dnatribes-digest-2012-03-01.pdf (Arabian links in Eastern Africa). 4 During the Iron Age, the king Jeroboam ben Nebat (cf. Nabata; Nabatene) of the house of Ephraim (cf. Afri; also Euphrates; Bharatas) re-introduced Egyptian customs to the East Mediterranean. Similar Egyptian influence is expressed in the Ugaritic and Phoenician iconography, such as Melqart wearing a Hedjet-like crown and Bes (associated with Nubia and Upper Egypt and later depicted on the gold chariot model of the Oxus treasure). 5 It is unknown whether this relates to Bronze Age maritime trade centers, such as Meluhha, Magan, and Dilmun. 6 See also the Arabian admixture component: http://dnatribes.com/dnatribes-snp-admixture-2013-02-11.pdf. 7 Aside from local traditions that are difficult to confirm, scholars recognize evidence of ancient Judaism in Yemen dating to the Himyarite Kingdom (5th century CE). See http://www.hs.ias.edu/files/Bowersock_RiseAndFall.pdf. For information about how the Arabian genetic component is expressed based on available SNP samples, see current admixture tables at http://dnatribes.com/dnatribes-snp-admixture-2013-02-11.pdf. 8 For more information, see http://dnatribes.com/dnatribes-digest-2012-09-01.pdf.

DNA Tribes® Digest April 2, 2013
All contents © 2006-2013 DNA Tribes. DNA Tribes®. What’s Your Tribe?®. DNA Tribes proprietary SNP analysis
is available exclusively from DNA Tribes.
DNA Tribes® Digest April 2, 2013 Page 7 of 13
Web: www.dnatribes.com; Email: [email protected]; Facebook: facebook.com/DNAtribes Mail: DNA Tribes, P.O. Box 735, Arlington, VA 22216
Regional Genetic Relationships in Western Asia
To visualize genetic relationships in the Middle East, MDS analysis of individuals sampled
randomly from West Asian and neighboring regions identified by DNA Tribes® SNP analysis was performed. Results are illustrated in Figure 4.
Figure 4: MDS plot of individuals randomly sampled from West Asian (circled) and neighboring regions identified by DNA Tribes® SNP analysis.
Discussion: Results in Figure 4 express two genetic patterns among randomly sampled West Asian individuals. First, the blue horizontal (left-to-right) axis expresses the genetic differences between West Eurasian (left) and South Asian (right) individuals. West Asians (circled in Figure 4) are located in the middle of this continuum. This reflects the genetically intermediate position of West Asians between Europe, the Arabian Peninsula, and South Asia.
Among sampled West Asians, East Mediterraneans are closest to sampled Europeans and Arabians, and Mesopotamian and Caucasus Mountains populations are closest to South Asian (Indus

DNA Tribes® Digest April 2, 2013
All contents © 2006-2013 DNA Tribes. DNA Tribes®. What’s Your Tribe?®. DNA Tribes proprietary SNP analysis
is available exclusively from DNA Tribes.
DNA Tribes® Digest April 2, 2013 Page 8 of 13
Web: www.dnatribes.com; Email: [email protected]; Facebook: facebook.com/DNAtribes Mail: DNA Tribes, P.O. Box 735, Arlington, VA 22216
Valley) individuals. This might reflect gene flow related to early population centers in West Asia, which included the Mesopotamian and other Fertile Crescent populations where agriculture and later urban civilization first emerged.
It is also worth noting that early urban cultures of Mesopotamia are thought to have emerged from the integration of three cultural streams: (1) local fishing cultures9 (perhaps related to Gulf and Indian Ocean populations); (2) nomadic goat and sheep herders (perhaps related to early populations of the interior Arabian Peninsula); and (3) irrigation agriculture (perhaps related to Caucasus Mountains populations).
Genetic relationships in this part of the world are particularly important due to the possible role of early West Asians in spreading Neolithic technologies to the Europe10 and South Asia.11 Similarly, expansions from West Asia might have played a later role in dispersing new ideas and technologies to Europe12 and Africa13 during the Iron Age. In addition, migratory West Asian related cultures (such as the Maykop culture) might have played a role in establishing early northern trade routes linking Eastern Europe, Central Asia, and Siberia.14 For this reason, present day West Asians might preserve genetic traces of early founding populations that over several millennia spread out to reshape the genetic landscape of Asia, Europe, and Africa.
Second, the red vertical (top-to-bottom) axis expresses the genetic continuum between European (top) and Saharan-Arabian (bottom) individuals. As with the horizontal axis, West Asians (circled) are located along the middle of this genetic continuum (see Figure 4). This might reflect historical gene flow (possibly in both directions) linking West Asians both with European and Arabian related populations in various periods. This again highlights the importance of West Asian populations as both potential sources and also recipients for gene flow between continents since early periods, including (but not limited to) the Neolithic expansions that began in early population centers of the Fertile Crescent.
9 Early traditions from Eridu (cf. Aratta) and other Mesopotamian settlements describe Apkallu (teachers of civilization; cf. Saptarishi) associated with water and maritime travel. Similarly, the South Asian Rigveda describes an important cultural role for the Sapta Sindhu (“seven rivers”). This suggests an important but seldom considered role for early sea and riverine traders in spreading civilization in Asia. 10 See http://dnatribes.com/dnatribes-digest-2013-01-02.pdf. 11 See http://dnatribes.com/dnatribes-digest-2012-11-01.pdf; http://dnatribes.com/dnatribes-digest-2012-04-02.pdf. 12 See http://dnatribes.com/dnatribes-digest-2012-08-01.pdf (discussing possible Proto-Celtic links with West Asia). 13 See http://dnatribes.com/dnatribes-digest-2013-03-02.pdf (discussing the Sao civilization near Lake Chad, where West Asian related R1b Y-DNA lineages are found at high frequencies). 14 See http://dnatribes.com/dnatribes-digest-2012-05-01.pdf; http://dnatribes.com/dnatribes-digest-2012-10-01.pdf.

DNA Tribes® Digest April 2, 2013
All contents © 2006-2013 DNA Tribes. DNA Tribes®. What’s Your Tribe?®. DNA Tribes proprietary SNP analysis
is available exclusively from DNA Tribes.
DNA Tribes® Digest April 2, 2013 Page 9 of 13
Web: www.dnatribes.com; Email: [email protected]; Facebook: facebook.com/DNAtribes Mail: DNA Tribes, P.O. Box 735, Arlington, VA 22216
Regional Genetic Relationships in Europe
To visualize genetic relationships in Europe, MDS analysis of individuals sampled randomly
from European and neighboring regions identified by DNA Tribes® SNP analysis was performed. Results are illustrated in Figure 5.
Figure 5: MDS plot of individuals randomly sampled from European (circled) and neighboring regions identified by DNA Tribes® SNP analysis.
Discussion: Results in Figure 5 express two genetic patterns in randomly sampled European
individuals. First, the blue horizontal (left-to-right) axis expresses the genetic difference between sampled West Asian (Mesopotamian and East Mediterranean; left) and Northern European (Slavic-Baltic and Uralic; right) individuals. Most sampled Europeans are located along the middle part of this horizontal continuum, with Iberian-Italian individuals forming a genetic “bridge” between East Mediterraneans and both Slavic-Baltic and Northwest European individuals.
Second, the red vertical (top-to-bottom) axis in Figure 5 expresses the genetic continuum between West Mediterranean (bottom) individuals and (relatively) more Asian like (top) individuals. This vertical axis represents the European segment of a larger genetic continuum between European and Asian populations: This larger pattern connects West Asians (represented by Mesopotamian individuals in

DNA Tribes® Digest April 2, 2013
All contents © 2006-2013 DNA Tribes. DNA Tribes®. What’s Your Tribe?®. DNA Tribes proprietary SNP analysis
is available exclusively from DNA Tribes.
DNA Tribes® Digest April 2, 2013 Page 10 of 13
Web: www.dnatribes.com; Email: [email protected]; Facebook: facebook.com/DNAtribes Mail: DNA Tribes, P.O. Box 735, Arlington, VA 22216
Figure 5) to the Indus Valley and connects Uralic (Northeast European) individuals to Siberian populations. (For a broader view of this large scale or macro continuum between continents, see the discussions of Figure 1 and Figure 4 earlier in this article.)
Notably, the sampled Europeans that are least Asian like in this MDS plot are Iberian-Italian (Mediterranean) individuals; of these, Basques and Sardinians (labeled in Figure 5) are the Europeans that are most differentiated from Asians along this continuum. This suggests that Basques and Sardinians might have been less affected by Eurasian population expansions that have changed the genetic landscape in other parts of Europe. That is, Sardinians and Basques might each represent (to some degree) aspects of ancient or “indigenous” population structure of the Mediterranean. If so, what population expansions might have affected other present day Mediterraneans?
Compared to other sampled Mediterranean individuals, Basques are most distant from West Asians; however, Sardinians are most distant from Northern Europeans (see Figure 5). Admixture percentages for populations of Mediterranean Europe (see Table 1) express similar relationships: a minimum of East Mediterranean admixture expressed for Basques and a minimum of Northwest European and Slavic-Baltic components expressed for Sardinians.15
Population Horn of Africa
North African
Arabian
Mesopotamian
East
Med
iterranea
n
Iberian
‐Italian
Northwest
Europea
n
Slavic‐Baltic
Uralic
Cau
casus
Mountains
Other
Andalusia Spain 0.3% 4.0% 1.9% 2.5% 5.0% 61.0% 18.5% 4.2% 0.9% 0.2% 1.5%
Basque France 0.0% 0.0% 0.0% 0.0% 0.1% 88.0% 8.7% 1.6% 1.2% 0.0% 0.4%
Basque Spain 0.0% 0.1% 0.0% 0.0% 0.0% 85.5% 11.1% 1.8% 0.6% 0.0% 0.9%
Bergamo Italy 0.0% 0.7% 2.7% 4.2% 9.1% 52.0% 20.0% 5.5% 1.0% 3.6% 1.2%
Galicia Spain 0.2% 6.8% 1.0% 0.9% 3.2% 54.3% 23.8% 6.4% 2.1% 0.2% 1.0%
Greek Mixed 0.0% 4.5% 1.1% 14.7% 10.2% 42.4% 3.5% 10.3% 2.8% 10.5% 0.0%
Italy General 0.3% 0.3% 9.0% 12.2% 10.2% 40.3% 9.7% 7.9% 2.2% 7.4% 0.5%
Portugal 2.2% 6.2% 2.6% 0.1% 2.5% 50.4% 23.0% 9.1% 1.0% 1.9% 1.1%
Sardinia 0.0% 3.9% 1.2% 0.1% 8.9% 85.9% 0.0% 0.0% 0.0% 0.0% 0.0%
Southern Italy and Sicily 0.1% 2.8% 10.4% 15.7% 17.6% 38.7% 4.0% 1.6% 0.1% 8.4% 0.5%
Spain 0.1% 3.8% 1.2% 1.3% 4.3% 61.5% 19.0% 5.5% 1.3% 0.8% 1.2%
Tuscany Italy 0.0% 1.0% 4.8% 9.1% 12.9% 47.2% 13.4% 5.7% 0.8% 4.7% 0.4%
Table 1: Admixture components (average population %) for SNP samples from Mediterranean Europe.
Given the complex history of the Mediterranean, these genetic differences do not necessarily express the effects of only one population expansion. Nevertheless, one possibility is that the East Mediterranean component expressed for Indo-European speaking (Spanish and Portuguese) populations of the Iberian Peninsula but not for Basques might reflect the genetic traces (in part) of Indo-European population movements in the Mediterranean. Notably, Indo-European languages are attested in the East
15 For complete admixture listings, see http://dnatribes.com/dnatribes-snp-admixture-2013-02-11.pdf, page 28.

DNA Tribes® Digest April 2, 2013
All contents © 2006-2013 DNA Tribes. DNA Tribes®. What’s Your Tribe?®. DNA Tribes proprietary SNP analysis
is available exclusively from DNA Tribes.
DNA Tribes® Digest April 2, 2013 Page 11 of 13
Web: www.dnatribes.com; Email: [email protected]; Facebook: facebook.com/DNAtribes Mail: DNA Tribes, P.O. Box 735, Arlington, VA 22216
Mediterranean since the Bronze Age (Linear B; Hittite; and Amarna texts); Indo-European words are attested in Iberia starting in the Iron Age (possible Celtic vocabulary in Tartessian inscriptions).16 In contrast to other sampled Mediterraneans, admixture results for Sardinians express smaller percentages of Northwest European and Slavic-Baltic components (see Table 1). A theoretical pre-Indo-European Paleo-Sardinian language has been proposed by some linguists. However, the historically attested languages in Sardinia are all Indo-European languages (Sardinian and more recently Italian). For this reason, it is unknown whether Indo-European languages were already spoken in Sardinia in early periods, such as the Bell-Beaker influenced Nuragic civilization of the Bronze Age.17
Nevertheless, both MDS (see Figure 5) and admixture analysis (see Table 1) indicate Sardinians are more genetically distant from Northern Europeans as compared to other present day Mediterraneans. If Sardinians already spoke Indo-European languages during the Bronze Age, this difference might reflect the impact of later expansions (also Indo-European speaking) that affected Mediterranean Europe but not Sardinia: For instance, the larger Northwest European and Slavic-Baltic regional components might (in part) reflect Urnfield and/or Haltstatt expansions (possibly related to early Celtic migrations) in Italy and the Iberian Peninsula but not Sardinia.18
Looking towards the right of Figure 5, there is a generally smooth genetic continuum between sampled West Asians and Europeans in the following sequence: Mesopotamian, East Mediterranean, Iberian-Italian, Northwest European, Slavic-Baltic, and Uralic.
At one end of this sequence, sampled individuals from the Uralic region (including sampled Finnish, Chuvash, Mordvins, and Northern Russian individuals) represent a genetic extreme within Europe that is most distant from Sardinians. In contrast, the Northern Europeans that are most similar to Sardinians are sampled Northwest European individuals (speaking Mediterranean related centum languages), followed by sampled Slavic-Baltic individuals (speaking satem languages with closer links to Asian IE languages).
This genetic continuum between Sardinians and Northeast European populations (where Uralic languages are attested) might represent another effect of Indo-European expansions, this time in Northern Europe. If so, the expansions of Indo-European languages in Northern Europe might have involved populations that were (in part) more Mediterranean like mixing with indigenous populations that were more Uralic like (represented by present day Finns and Northern Russians).19
However, more data from both Mediterranean Europe (including populations such as Corsica, Sicily, the Balearic Islands, Malta, and the Aegean Islands) and the Balkan Peninsula (a linguistically diverse part of Europe and possible origin territory for Indo-European languages) are needed to fully explore these relationships.
16 Other components expressed in higher percentages for Spanish than for Basques include: Northwest European, Slavic-Baltic, North African, and Arabian. Some or all of these components might have been involved in each of the various Indo-European population movements in the Mediterranean. See also http://dnatribes.com/dnatribes-digest-2012-11-01.pdf and http://dnatribes.com/dnatribes-digest-2013-01-02.pdf. 17 See also http://dnatribes.com/dnatribes-digest-2012-07-01.pdf. 18 See http://dnatribes.com/dnatribes-digest-2012-08-01.pdf. 19 Ancient DNA extracted from individuals buried in Gotland attests the presence of Neolithic migrants or travelers related to present day Southeast Europeans in the Baltic Sea dating to approximately 3,000 BCE. See http://www.sciencemag.org/content/336/6080/466. These remarkable travelers appear to be early predecessors of the migrants who transmitted Aegean (Minoan-Mycenaean) culture to Northern Europe during the Bronze Age (possibly related to the Homeric Danaoi). See http://dnatribes.com/dnatribes-digest-2011-11-01.pdf.

DNA Tribes® Digest April 2, 2013
All contents © 2006-2013 DNA Tribes. DNA Tribes®. What’s Your Tribe?®. DNA Tribes proprietary SNP analysis
is available exclusively from DNA Tribes.
Page 12 of 13
Web: www.dnatribes.com; Email: [email protected]; Facebook: facebook.com/DNAtribes Mail: DNA Tribes, P.O. Box 735, Arlington, VA 22216
DNA Tribes® SNP Update for February 2013
We are pleased to announce a new update for DNA Tribes® SNP analysis. New Populations: Several new populations have been added to our SNP database: New African populations:
Afar (Ethiopia) Anuak (Ethiopia) Ari Blacksmith (Ethiopia) Ari Cultivator (Ethiopia) Bantu (South Africa) Gui and Gana San (Botswana) Gumuz (Ethiopia) Herero (Namibia) Juoansi San (Tsumkwe, Namibia) Karretjie San (Colesberg, South Africa) Khomani San (Askham, South Africa) Khwe San (Caprivi, Southern Africa) Nama Khoe (Windhoek, Namibia) Somali (Ethiopia) South Sudanese Wolayta (Ethiopia) Xun San (Menongue, Angola)
New European populations:
Argyll and Bute (Scottish Highlands) Ireland Norway Sweden
New Diasporic populations:
Coloured (Colesberg, South Africa) Coloured (Wellington, South Africa) Native American (US and Canada)

DNA Tribes® Digest April 2, 2013
All contents © 2006-2013 DNA Tribes. DNA Tribes®. What’s Your Tribe?®. DNA Tribes proprietary SNP analysis
is available exclusively from DNA Tribes.
Page 13 of 13
Web: www.dnatribes.com; Email: [email protected]; Facebook: facebook.com/DNAtribes Mail: DNA Tribes, P.O. Box 735, Arlington, VA 22216
Enhanced World Region Analysis: Our updated regional admixture and MDS analysis now includes several new and updated regions: World Region Description of World Region Other Related Populations
East Mediterranean Cyprus; European Jewish; Malta. Levant; Anatolia; Italy.
Khoisan‐Aka Khoisan; Aka; Mbuti. South African Bantu.
Mesopotamian Anatolia; Transcaucasus; Kurds; Persians. Southwest Asia.
Nilotic Nilotic speaking populations of East Africa.
Slavic‐Baltic Eastern and Central Europe; Balkan Peninsula. Western Europe.
Uralic Finland; Northern Russia; Ural Mountains. Scandinavia; West Siberia.
West African Western Africa. Bantu speaking populations of East and Southern Africa.
Updated on Website World Admixture Tables: Comprehensive admixture tables listing the continental and regional components of world populations in our database are available at http://www.dnatribes.com/dnatribes-snp-admixture-2013-02-11.pdf. Updated on Website Sample Reports: Updated DNA Tribes® SNP reports for several world populations are available at http://dnatribes.com/snp.html. Update Your Personal SNP Analysis New SNP analysis orders (Sale Price $49.99) and SNP updates (Sale Price $19.99) be ordered at http://dnatribes.com/snp.html.