TABLE OF CONTENTS - GFEI | Global Fuel Economy Initiative · · 2017-11-29TABLE OF CONTENTS 1....
177
Transcript of TABLE OF CONTENTS - GFEI | Global Fuel Economy Initiative · · 2017-11-29TABLE OF CONTENTS 1....


TABLE OF CONTENTS
1. BACKGROUND AND INTRODUCTION .................................................................... 12
1.1 Country Background ................................................................................................ 12
1.2 Project Background .................................................................................................. 13
1.3 Objectives ................................................................................................................ 17
2. NATIONAL REGULATIONS AND INCENTIVES FOR FUEL EFFCIENT AND
ENVIRONMENTAL FRIENDLY VEHICLES ...................................................................... 18
2.1 Policy & Strategy, Legal, Institutional & Regulatory Framework .......................... 18
2.2 Vehicles Import Customs Duties & Applicable Taxes and Incentives .................... 21
2.2.1 Customs Duties & Taxes ..................................................................................... 21
2.2.2 Incentives ............................................................................................................. 24
2.3 Vehicles Registration & Inspection System ............................................................ 27
2.3.1 Vehicles Registration System .............................................................................. 27
2.3.2 Vehicles Inspection System ................................................................................. 29
2.4 Ethiopia’s International Obligation/Participation .................................................... 29
2.5 Formulation of Draft Regulations ............................................................................ 30
2.5.1 Statutory Legislative Process ............................................................................... 30
2.5.2 Non-Statutory Legislative Process ....................................................................... 31
2.6 Conclusion ............................................................................................................... 32
3. BASELINE SETTING FOR VEHICLE EFFICIENCY.................................................. 34
IMPROVEMENT AND EMISSION REDUCTION ............................................................... 34
3.1 Methodology ............................................................................................................ 34
3.1.1 Objective .............................................................................................................. 34
3.1.2 Data Attributes ..................................................................................................... 35
3.1.3 Data Collection .................................................................................................... 35
3.1.4 Data Cleaning....................................................................................................... 36
3.2 Baseline Setting ....................................................................................................... 38

Final Report on Pilot Global Fuel Economy Initiative Study in Ethiopia 2012
2
3.3 Estimating Baseline Fuel Economy ......................................................................... 43
3.3.1 Average Fuel Economy and Annual Emission for New Vehicles ....................... 46
3.3.2 Average Fuel Economy and Annual Emission Considering Age of Vehicle ...... 48
3.4 Conclusion ............................................................................................................... 51
4. VEHICLE STOCK STATISTICS ................................................................................... 52
4.1 Methodology ............................................................................................................ 52
4.1.1 Data Collection .................................................................................................... 52
4.1.2 Classifications ...................................................................................................... 52
4.1.3 Data Cleaning....................................................................................................... 54
4.1.4 Parameters for Data Cleaning .............................................................................. 55
4.2 Vehicle Stock Analysis in Addis Ababa .................................................................. 58
4.2.1 Motorcycles and Tricycles ................................................................................... 58
4.2.2 Gasoline Vehicles ................................................................................................ 59
4.2.3 Diesel Vehicles .................................................................................................... 61
4.3 Vehicle Stock Analysis in Regional Governments .................................................. 65
4.3.1 Motorcycle and Tricycle ...................................................................................... 65
4.3.2 Gasoline Vehicles ................................................................................................ 70
4.3.3 Diesel Vehicles .................................................................................................... 75
4.4 Impact of Vehicle Stock Composition on Fuel Economy ....................................... 84
4.4.1 Motorcycles and Tricycles ................................................................................... 84
4.4.2 Gasoline Vehicles ................................................................................................ 87
4.4.3 Diesel Vehicles .................................................................................................... 88
5. FUEL QUALITY REVIEW AND IMPROVEMENT OF FUEL STANDARD ............ 91
5.1 Fuel Utilization Policy and Consumption ................................................................ 91
5.1.1 Diesel and Gasoline Consumption in Ethiopia from (2006-2012) ...................... 91
5.1.2 The Biofuel Development and Utilization Strategy in Ethiopia .......................... 92
5.2 International and National Fuel Quality Standards .................................................. 94
5.2.1 Parameters Included In the Fuel Quality Studies ................................................. 94
5.2.2 International Fuel Quality Standards ................................................................... 96
5.2.3 Over View of Ethiopian Fuel Specifications ....................................................... 98
5.3 Data Collected on Fuel Quality (historical data) ................................................... 100

Final Report on Pilot Global Fuel Economy Initiative Study in Ethiopia 2012
3
5.3.1 Global and National Sulfur Levels in Fuels ....................................................... 101
5.4 Conclusions and Recommendations ...................................................................... 104
6. ANALYSIS OF IMPACT OF VEHICLE EMISSION ON AIR POLLUTION ....... 106
6.1 Introduction ............................................................................................................ 106
6.2 Methodology .............................................................................................................. 107
6.2.1 Literature Review................................................................................................... 108
6.2.2 Measuring Methods and Instruments ..................................................................... 108
6.3 Measurement Sites ................................................................................................. 110
6.4 Results .................................................................................................................... 111
6.4.1 Carbon Monoxide .................................................................................................. 111
6.4.2 Particulate Matter ................................................................................................... 114
6.4.3 Nitrogen Oxide (NOx) ........................................................................................... 116
6.4.4 Sulfur Dioxide ........................................................................................................ 117
6.5 Trend Projection......................................................................................................... 120
7. TECHNOLOGY OPTIONS AND POLICY MEASURES FOR FUEL EFFICIENT
VEHICLES ............................................................................................................................ 125
7.1 Technology Options for Fuel Efficient and Clean Vehicles .................................. 125
7.1.1 Technology Options for Increasing Fuel economy ............................................ 125
7.1.2 Emission Control Technologies ......................................................................... 129
7.1.3 Alternative Fuels ................................................................................................ 130
7.2 Policy Measures for Promoting Cleaner and Efficient Vehicles ........................... 131
7.2.1 Enhancing Vehicle Efficiency Improvement ..................................................... 131
7.2.2 Use of cleaner fuels ............................................................................................ 133
7.2.3 Emission Control ............................................................................................... 134
8. COST BENFIT ANALYSIS OF POLICY MEASURES .............................................. 139
8.1 Scope of the Life Cycle Cost Analyses ................................................................... 139
8.2 Assumptions and Specifications ............................................................................ 139
8.3 Results of Life Cycle Cost Analyses ..................................................................... 143

Final Report on Pilot Global Fuel Economy Initiative Study in Ethiopia 2012
4
8.3.5 Conclusion ............................................................................................................. 147
9. CONCLUSION AND RECOMMENDATION ............................................................. 150
REFERENCES ...................................................................................................................... 152

Final Report on Pilot Global Fuel Economy Initiative Study in Ethiopia 2012
5
ACRONYM
AACG: Addis Ababa City Government
AU: African Union
BAU Business as Usual
CD Core Diplomatic
CIF Cost, Insurance & Freight
DPF Diesel Particulate Filter
ECRGES Ethiopia’s Climate-Resilient Green Economy Strategy
EFI Electronic Fuel Injection
EPA Environmental Protection Authority
EPE Ethiopian Petroleum Enterprise
ERCA Ethiopian Revenues & Customs Authority
ETH Ethiopia
FDRE Federal Democratic Republic of Ethiopia
FO: Freight on Board
FTA Federal Transport Authority
GFEI Global Fuel Economy Initiative
GHG Green House Gas
GTP: Growth & Transformation Plan
ICCT International Council on Clean Transportation
IEA International Energy Agency
ITF International Transportation Federation
LCC Life cycle costs
No Number
OPEC Organization of Petroleum Exporting Countries
Proc Proclamation
Reg Regulations
SNNPR Southern Nations, Nationalities and People Region
UN United Nations
UNEP Unite Nation Environmental Protection
UNFCCC United Nations Framework Convention on Climate Change
VAT: Value Added Tax

Final Report on Pilot Global Fuel Economy Initiative Study in Ethiopia 2012
6
LIST OF TABLES
Table 2.1 Custom Duty and Tax Rates of Imported vehicles in Ethiopia
Table 3.1 Example of unstructured raw data in ERCA’s database
Table 3.2 Example cleaned and structured data
Table 3.3 Imported light duty vehicle registered per year
Table 3.4 Locally assembled light duty vehicles per year
Table 3.5 Light duty vehicles registration by condition (New and Used)
Table 3.6 Classification of newly registered LDVs by age group for year 2005, 2008, and
2010
Table 3.7 Classification of registered LDVs by engine displacement volume
Table 3.8 Classification of registered LDVs by body type
Table 3.9 Registration of LDVs by fuel type
Table 3.10 Harmonic Average Fuel Economy and Average Annual Emission for all LDVs
Table 3.11 Harmonic average fuel economy and average annual emission for diesel vehicles
Table 3.12 Harmonic average fuel economy and average annual emission for petrol vehicles
Table 3.13 Harmonic Average Fuel Economy and Annual Emission for all LDVs
Table 3.14 Harmonic Average Fuel Economy and Average Annual Emission for Diesel
Vehicles
Table 3.15 Harmonic Average Fuel Economy and Average Annual Emission for Petrol
Vehicles
Table 4.1 Total vehicles inspected in Addis Ababa and Regions (2010/11)
Table 4.2 Summary of vehicle classification and important parameters
Table 4.3 Summary of vehicle classification by body type and engine capacity
Final Report on Pilot Global Fuel Economy Initiative Study in Ethiopia 2012
7
Table 4.4 Distribution of motorcycles and tricycles in Addis Ababa (Total number of
motorcycles and tricycles: 2084)
Table 4.5 Gasoline vehicle distribution by body type in Addis Ababa
Table 4.6 Light duty diesel vehicle distribution by body type in Addis Ababa
Table 4.7 Cargo diesel vehicle distribution by gross weight in Addis Ababa
Table 4.8 Bus distribution in various categories in Addis Ababa
Table 4.9 Summary of motorcycles and tricycles distribution in Amhara region
Table 4.10 Summary of motorcycles and tricycles distribution by year of manufacture in Oromia region
Table 4.11 Summary of motorcycles and tricycles distribution in SNNPR region
Table 4.12 Summary of motorcycles and tricycles distribution in Tigray region
Table 4.13 Summary of ET-code motorcycles and tricycles distribution in Addis Ababa and some regions
Table 14 Gasoline vehicle distribution in Amhara region
Table 4.15 Gasoline vehicle distribution by engine capacity in Oromia region
Table 4.16 Gasoline vehicle distribution by engine capacity in SNNPR
Table 4.17 Gasoline vehicle distribution by body type in Tigray region
Table 4.18 ET-code gasoline vehicle distribution by body type in Addis Ababa and some regions
Table 4.19 Diesel vehicles distribution by engine capacity in Amhara region
Table 4.20 Diesel vehicles distribution by engine capacity in Benshagul Gumuz region
Table 4.21 Diesel vehicles distribution by engine capacity in Oromia region
Table 4.22 Diesel vehicles distribution by engine capacity in SNNPR region
Table 4.23 Light duty diesel vehicles distribution by body type in Tigray region
Table 4.24 Cargo trucks distribution by gross weight in Tigray region
Table 4.25 Distribution of buses in various categories in Tigray region
Table 4.26 ET-code light weight diesel vehicles distribution by body type
Table 4.27 ET-code cargo trucks distribution by gross weight
Table 4.28 ET-code buses distribution in various categories
Table 5.1 Petroleum product sales (consumption) quantity in metric ton
Table 5.2 Total amount of ethanol blending from 2008-2012

Final Report on Pilot Global Fuel Economy Initiative Study in Ethiopia 2012
8
Table 5.3 trend of Total blend of ethanol, Gasoline and Diesel (2008-2012)
Table 5.4: Gasoline and Diesel specifications (applicable in Europe 2009-2012)
Table 5.5 STM Specifications for Gasoline and Diesel (2012)
Table 5.6 Ethiopian Specifications for Gasoline and Diesel 2012
Table 5.7 Summary of Gasoline Fuel Quality in 2011
Table 5.8 Summary of Diesel Fuel Quality in 2011
Table 5.9 Summary of Gasoline Fuel Quality in 2010
Table 5.10 Summary of Diesel Fuel Quality in 2010
Table 5.11 Sulfur content of imported Diesel for the previous 8 years
Table 5.12 Sulfur content of imported gasoline (From 2004-2011)
Table 6.1 EPA Ethiopia and WHO air quality guidelines [EPA, 2003; WHO, 2005]
Table 6.2 Measurement sites and location
Table 6.3 CO concentrations at different sites collected during the dry season
Table 6.4 Wet season CO concentration level at different sites
Table 6.5 PM2.5 concentration data for different sites during the dry season
Table 6.6 PM2.5 concentration levels at the three sites during the wet season
Table 6.7 Climate data for Addis Ababa [Wikipedia]
Table 6.8 Mileage and fuel consumption per vehicle category in Addis Ababa (2010/2011)
Table 6.9 Annual emissions of pollutants per vehicle category in Addis Ababa (2010/2011)
Table 6.10 Euro II Emission standards in the European Union for passenger cars and light duty vehicles
Table 6.11 Euro III emission standards for heavy duty diesel vehicles,
Table 7.1 Fuel Economy Target for 2020
Table 7.2 Fuel Economy Target for 2030
Table 7.3 Fuel economy target for 2050
Table 8.1: Life cycle cost of the vehicles with the existing tax regime for 36,000 km/year
mileage
Table 8.2: Life cycle cost of the vehicles for 24,000 km/y mileage and 10 % fuel inflation and cost of electricity increase 1.3 Birr/kWh
Table 8.3: Life cycle cost of vehicles of different ages under existing fuel price and 5%
annual fuel inflation under consideration assuming annual mileage of 24,000 km

Final Report on Pilot Global Fuel Economy Initiative Study in Ethiopia 2012
9
Table 8.4: Life cycle cost of vehicles of different ages under existing fuel price and 5%
annual fuel inflation under consideration assuming annual mileage of 36,000 km

Final Report on Pilot Global Fuel Economy Initiative Study in Ethiopia 2012
10
LIST OF FIGURES
Figure 1.1 CO2 emissions in ton from the transport sector in Ethiopia as per BAU scenario
Figure 3.1 Total LDVs Registration by Year
Figure 3.2 Light duty vehicle registration by condition (New and Used)
Figure 3.3 Number of registered LDVs in different years by age groups
Figure 3.4 Classification of registered vehicles by make
Figure 3.5 Body types of registered LDVs by year
Figure 3.6 Classification of registered LDVs by fuel type
Figure 3.7 Quantity of LD Vehicles registered by fuel type
Figure 3.8 ECE 15 or Urban Drive Cycle
Figure 3.9 EUDC for high power engine
Figure 3.10 EUDC for low power engine
Figure 3.11 Harmonic average fuel economy and average annual emission for all LDVs
Figure 3.12 Average annual emission trend for all type of LDVs
Figure 3.13 Harmonic average fuel economy for all registered LDVs considering aging
Figure 3.145 Average annual emission trend for all registered LDVs in g/km considering
aging
Figure 4.1 Summary of motorcycles and tricycles distribution in Ethiopia by engine capacity
Figure 4.2 Distribution of motorcycles and tricycles in Ethiopia by year of manufacture
Figure 4.3 Distribution of motorcycles and tricycles by fuel type
Figure 4.4 Distribution of gasoline vehicles by engine capacity
Figure 4.5 Summary of gasoline vehicles distribution by year of manufacture
Figure 4.6 Summary of gasoline vehicles distribution by type of air fuel mixture formation
Figure 4.7 Summary of diesel vehicles distribution by year of manufacture
Figure 4.8 Summary of diesel vehicles distribution by type of fuel system
Figure 5.1 Trend of gasoline and diesel consumption
Figure 5.2 Global maximum gasoline sulfur content (source: www.ifqc.org)
Figure 5.3 Global maximum sulfur content of diesel (source: www.ifqc.org)
Figure 5.4 Trend of sulfur content of diesel
Figure 5.5 Trend of sulfur content of gasoline
Figure 6.1 Relative air pollutants (HC& NO2) exposure by transportation mode
[www.vtpi.org]

Final Report on Pilot Global Fuel Economy Initiative Study in Ethiopia 2012
11
Figure 6.2 Measured CO concentration at Bole Bridge during the dry season
Figure 6.3 Measured CO concentration at Teklehaimanot Square during the dry season
Figure 6.4 PM2.5 concentrations at Bole Bridge
Figure 6.5 PM2.5 concentrations at Teklehaimanot Square
Figure 7.1 Drive system of Hybrid vehicles
Figure 7.2 Battery pack of electric vehicle under the body
Figure 7.3 Three way catalytic converter
Figure 7.4 Availability and enforcement of low sulfur diesel in Middle East
Figure 7.5 Forecasted LD vehicle at present actual growth rate
Figure 7.6 Target average fuel economy of new vehicles of Ethiopia compared to other
countries
Figure 8.1 Toyota Yaris
Figure 8.2 Nissan Leafi
Figure 8.3 Life cycle cost of the vehicles with the existing tax regime in Birr
Figure 8.4 Life cycle cost of vehicles with excise and sur tax exemption
Figure 8.5 Life cycle cost of vehicles different ages under existing fuel price and 5% annual
fuel inflation
Figure 8.6 Projected incremental cost and benefits of low sulfur fuel in China

Final Report on Pilot Global Fuel Economy Initiative Study in Ethiopia 2012
12
1. BACKGROUND AND INTRODUCTION
1.1 Country Background
Ethiopia is a country located in East Africa between 3 and 15 0 N latitude and 33 and 40 o E
longitude. The total land area is about 1.1 million square kilometers. Ethiopia is bounded to
north and north east by Eretria, to east by Djibouti, to east and south east by Somalia, to south
by Kenya, to south west by South Sudan and to west and to north west by Sudan.
Ethiopia’s population has slightly exceeded 80 million at present that makes it the second
most populous country in Africa. The population is growing at around 2 % per annum. While
most part of the country in central, west and north and south Ethiopia are highlands, the
lowland areas are mostly located in east, south east and the rift valley part of the country.
Most of central, south and western parts of the country receive sufficient rainfall.
Since 1995, Ethiopia is a multi-national Federal Democratic Republic and is currently
governed by the Ethiopian People’s Revolutionary Democratic Front (EPRDF. Ethiopia has
achieved 11% economic in the last 10 years and has planned to reach middle-income status
by 2025. Increasing agricultural productivity and the share of the industry to the economy
are the main strategies. To achieve this goal Ethiopia’s Growth and Transformation Plan
(GTP) is an ambitious development plan of the government that is targeted to lay strong
foundation for industrialization up to 2015.
Ambitious industrial development in the country with conventional path of development can
result in negative environmental impact by increasing GHG emission drastically. To mitigate
this, the government has finalized the preparation of Climate Resilient Green Economy
development strategy in 2011 and began its implementation. The strategy will enable
exploitation of the vast hydropower potential, use of improved stoves in rural areas,
efficiency improvements in livestock value chain, preservation of the forest, utilization of
electricity from hydropower plants for freight transportation by building railway network and
light train transit in cities and use of improved and new technology vehicles with higher
efficiency.
Final Report on Pilot Global Fuel Economy Initiative Study in Ethiopia 2012
13
1.2 Project Background
While fuel efficiency of a vehicle is the volume of fuel consumed per unit or specified
distance travelled, fuel economy of a vehicle is considered to be the distance travelled per
unit volume of fuel. The fuel-efficiency of vehicles became a great concern for the first time
when OPEC increased fuel prices in 1970s following the Arab-Israel War in 1973. Within
few years fuel-efficient cars were considered a necessity to mitigate sky-rocketing fuel price.
Starting 1990s, the concern on the global warming made the reduction of fuel consumption of
vehicles very urgent. The global car fleet is predicted to triple by 2050 and over 80% of the
increase will be in developing countries, which will be a burden to the strained global
economy and can accelerate global warming if the current style of industrial development in
the developed countries is followed.
The Global Fuel Initiative (GEFI), which was formed by UNEP. IEA and ITF in 2009 and
joined by ICCT in 2012, sees that there is an opportunity to improve new car fuel efficiency
by 30% by 2020 and 50% by 2030 in a cost effective way [UNEP,2010]. An improvement of
fuel efficiency will result in a proportional reduction on fuel consumption. Hence, it means
that 30 % of fuel will be saved per km traveled by 2020 and 50 % by 2050. The potential for
improvement of vehicle fuel economy can be realized by combination of the following course
of actions:
a) Improvement of fuel efficiency of conventional vehicles by reducing old vehicle
stock. Newer vehicle can have less frictional resistance and higher combustion
efficiency by, lean mixture burning and better electronic control. Improvement of
transmission efficiency by using continuously variable transmission.
b) Use of compact vehicles: vehicles with less body weight and projected area have less
aerodynamic and gravitational resistance and hence consume less fuel.
c) Use of new vehicle technology: Green vehicles are those that are environmentally
friendly compared to conventional gasoline or diesel vehicles. Green vehicles have
higher fuel efficiency or use no fossil fuel and hence, release less emission. This
category of vehicles includes hybrid vehicles, plug-in electric vehicles, fuel cell
vehicles and alternative fuel vehicles. Green vehicles that have completed the
technology development stage and in commercialization phase are: hybrid vehicles,
plug in electric vehicles and alternative fuels.

Final Report on Pilot Global Fuel Economy Initiative Study in Ethiopia 2012
14
d) Road improvement
• Roadway expansion reduces congestion delay which reduces fuel
consumption.
• Road condition improvement by frequent repair and street resurfacing reduces
vehicle braking and wear.
e) Changing driving habits: Driving with minimal acceleration and braking or cruising at
constant speed as much as possible
f) Changing transport modalities:- Availability of mass transit reduces passenger cars
on the streets or mileage that has to be covered and can contribute to vehicle fuel
economy.
Road transport is the biggest mode of transport that has a share over 95%, both in freight and
passenger movement in Ethiopia. It is estimated that the vehicle population has exceeded
325,000 and growing by about 10% annually. Most of the vehicles are older than 15 years
and beyond their useful service life. As a result high fuel consumption, emission of
pollutants, and road accident prevail.
The increase in road passenger-km travelled in Ethiopia was forecasted at an annual growth
rate of 8.3%-9.1%. The total passenger transport in passenger-km in Ethiopia is expected to
increase from 40 billion in 2010 to 220 billion in 2030 driven by a strong urbanization.
According Ethiopia’s Climate-Resilient Green Economy strategy, if business goes as usual (
BAU), emissions from the motor vehicles will increase from 5 -ton CO2 in 2010 to 41ton CO2
in 2030 as shown in Figure 1.1 [ FDRE,2011].
Figure 1.1 CO2 emissions in million ton from the transport sector in Ethiopia as per BAU
scenario

Final Report on Pilot Global Fuel Economy Initiative Study in Ethiopia 2012
15
As a result GHG emissions of passenger cars will increase from 2.5 million ton in 2010 to
13.1 million ton CO2 equivalent in 2030 assuming there will be average fuel efficiency
improvement of passenger vehicle fleet by 10% from 2010 to 2030.
By introducing new technologies in the transport sector, the emission of CO2 is planned to be
reduced down to 13.2 million ton CO2 in 2030 compared to BAU case. The major courses of
actions proposed by ECRGES are:
• Reducing demand of passenger cars in Addis Ababa by building a light-rail transit
system that goes from east to west and north to south and a bus rapid transit system;
• Improving vehicle fuel efficiency by setting fuel efficiency standards,
• Promoting clean fuels by blending ethanol with gasoline and gasoil with biodiesel
• Adopting hybrid and plug-in electric vehicles,
• Shifting freight transport from road to an electric rail network. Shifting freight to
electric rail is the single largest abatement lever in the Transport sector, with a
potential of 8.9 ton CO2 reduction.
With regard to using alternative fuels, the plan is to use 15 % ethanol- 85 % gasoline blend
and 5 % biodiesel blend. As there is no limitation, the biodiesel content can be increased
provided enough jatropha or castor seed are cultivated and the oil is extracted and esterified.
The blending of gasoline with 15 % ethanol will not be a problem as excess ethanol will be
available from 10 sugar factories that will be erected in the near future. The use of bio-fuels
will reduce emission of greenhouse gases as well as contribute to stabilizing fuel price.
Ethiopia has signed the United Nations Framework Convention on Climate Change in Rio de
Janeiro, in 1994. According to the terms of the responsibilities of the convention, Ethiopia
has submitted initial communication in 2001 and it is working to contribute to efforts in
reduction of global Green House Gas (GHG) emissions by promoting green economic
development strategy. It is well known that reduction of GHG emissions requires reduction of
fossil fuel consumptions. Hence, Ethiopia is working with United Nations Environment
Program (UNEP) to increase vehicle fuel efficiency by identifying and implementing relevant
policy package.
Motor vehicles produce more air pollutants than any other single human activity. Nearly 50%
of global carbon monoxide (CO), hydrocarbons (HCs) and nitrogen dioxide (NO2) emissions
from fossil fuel combustion come from petrol and diesel engines. In city centers and

Final Report on Pilot Global Fuel Economy Initiative Study in Ethiopia 2012
16
congested streets, traffic can be responsible for about 80-90% of these pollutants and this
situation is expected to be severe in cities in the developing countries. Vehicle emissions
mainly result from fuel combustion. The most common type of transport fuels are gasoline
(leaded or unleaded form) for light duty vehicles (such as automobiles) and diesel fuel for
heavy duty vehicles (such as buses, and trucks). For heavy duty vehicles, other commercial
fuels such as biodiesel and compressed natural gas (CNG) are available. These fuels,
especially biodiesel, have lower value of emissions per liter. Carbon dioxide (CO2) (a major
greenhouse gas responsible for global warming), is one of the main combustion products
emitted to the atmosphere from vehicle exhaust system. The major pollutants emitted from
gasoline fueled vehicles are CO, HCs, NOx (oxides of nitrogen) and lead (for leaded gasoline
fuel). In addition to these, a vehicle with diesel engine emits sulfur dioxide (SO2) if sulfur is
present in the fuel and particulate matter (PM) emissions. Specially, when the injection pump
or nozzle has trouble in functioning properly, the particulate emission becomes high. In
addition to these, a worn-out engine results in blue smoke exhaust due to combustion of
lubrication oil.
Climate change resulting from the greenhouse effects will present significant challenges
including risks to water supply and other resources. Global warming will also increase the
frequency of extreme events such as heat waves and wildfires posing additional risks to
human health and infrastructure. A changing climate will also make it more difficult to meet
air quality standards. Higher temperatures increase the photochemical formation of ozone, as
well as emissions from the natural sources such as plants. It also increases the demand for air
conditioning resulting in the generation of additional electricity and smog forming emissions.
The likelihood of more frequent wildfires also poses a risk for air quality. On the whole,
global warming will make the control of smog-forming emissions more difficult and hence,
meeting air quality standards.
As per the contract between the Federal Democratic Republic of Ethiopia Transport
Authority and Addis Ababa Institute of Technology on “Pilot Global Fuel Economy Initiative
(GFEI) Program/Project in Ethiopia”, the consulting team has prepared this draft final report.
Final Report on Pilot Global Fuel Economy Initiative Study in Ethiopia 2012
17
1.3 Objectives This study focuses on the following main objectives and draws possible intervention options
to minimize the effects of atmospheric pollution and GHG emissions from cars in Ethiopia.
The study: • Provides baseline data for tracking progress in improvement of vehicle efficiency as
per GFEI guidelines
• Ensures that Ethiopian policymakers have sufficient and updated information in order
to draft appropriate legislations and guidelines for dissemination of more fuel-
efficient vehicles that have fewer emissions of pollutants and GHG.
• Assesses the impact of vehicle emission and fuel quality on the ambient air quality
• Makes the study of GFEI in Ethiopia as a pilot for wide spread application in Africa
• Uses the experience gained for instructing Eastern Africa countries and sharing the
experience on GFEI regional and global conferences.

Final Report on Pilot Global Fuel Economy Initiative Study in Ethiopia 2012
18
2. NATIONAL REGULATIONS AND INCENTIVES FOR FUEL EFFCIENT AND ENVIRONMENTAL FRIENDLY VEHICLES
2.1 Policy & Strategy, Legal, Institutional & Regulatory Framework
Environmental protection has been given an utmost importance in Ethiopia. The FDRE
Constitution (Proc. No. 1/1995) has provided two broad constitutional environmental
objectives: viz., the achievement of clean and healthy environment (see Article 92 (1)), and
the achievement of sustainable development (see Article 43 (1)).
The Ethiopian Environmental Policy and Conservation Strategy of Ethiopia (1997) provide
also detailed & broad directions as to how to realize the two environmental objectives within
the Ethiopian context.
In terms of environmental policy(as related to Atmospheric Pollution & Climate Change), it
has been stated as follows: The policy recognizes that, even at an insignificant level of
contribution of atmospheric green house gases, a firm & visible commitment to the principles
of containing climate change is essential and to take the appropriate control measures to show
concern and then deal with the rest of the world in a struggle to bring about its containment
by those countries which produce large quantities of greenhouse gases.
The recent FDRE’s Government GTP, and the ECRGES also incorporate plans, strategies
and broad programs on to realize the two fundamental environmental objectives within the
Ethiopian context [FDRE, 2011]. The government sees the opportunity to gear the
development of the transport sector to contribute to a sustainable development pathway. The
policy frame work by ECRGES to promote fuel efficient and environmentally friendly
transportation was discussed in chapter 1.
Following the Environmental Policy & Conservation suitable legal and institutional,
including regulatory, framework has also been instituted to achieve the two fundamental
environmental objectives.
Proc. No. 295/2002 provides the institutional & regulatory framework with respect to
environmental protection in Ethiopia. The institutional framework includes the
Environmental Council, the Federal Environmental Protection Authority (EPA), the regional
(including the two City Administrations i.e., Addis Ababa & Dire Dawa) Environmental

Final Report on Pilot Global Fuel Economy Initiative Study in Ethiopia 2012
19
Agencies, and Environmental Units, which are legally expected to be established within each
of the specific development sector institution.
The Environmental Council shall have the power to review proposed environmental policies,
strategies and laws, and issue recommendations to the government (see Article 9 (1), Proc.
No. 295/2002). The draft regulations to be prepared under this project shall then be approved
by the Council of Ministers (see Article 20 Proc. No. 300/2002 (Environmental Pollution
Control Proc.) cum Article 77 (13), Proc. No. 1/1995 of the FDRE Constitution). The basis
for the Council of Ministers legislative action shall be the recommendation submitted to it by
the Environmental Council.
The EPA shall have a number of coordination responsibilities under the law. The EPA thus
shall have the power & duties to coordinate measures to ensure that the environmental
objectives provided under the Constitution and the basic principles set out in the
Environmental Policy of Ethiopia are realized (see Article 6 (1), Proc. No. 295/2002).
Specifically, with respect to environmental pollution & standards, the EPA, in consultation
with the competent agencies, sets environmental standards and ensures compliance with those
standards (see Article 6 (7) Proc. No. 295/20020).
The EPA under the Environmental Pollution Control Law (i.e., Proc. No. 300/2002), has been
provided with the following clear powers & duties with respect to setting environmental
standards. In consultation with competent agencies, the EPA shall formulate practical
environmental standards based on scientific & environmental principles (see Article 6(1)).
Among such possible environmental standards, one of them is air quality standards that
specify the ambient air quality & give the allowable amount of emission for both stationary &
mobile air pollution sources (see Article 6 (1) (b)).
From the project perspective, the competent organizations are meant to be the Ministry of
Transport and Transport Authority. The Ministry of Transport and the Transport Authority
shall also have the legal obligation to cooperate with EPA with respect to setting
environmental standards as related to mobile source of air pollution such as from vehicles. As
per Article 7 (1) (j) of Proc. No. 468/2005, the Transport Authority, in cooperation with the
concerned organs prepares and submits, and upon approval, implements standards related to
the smoke, gas, vapor, and the like emitted from the exhaust pipes of the vehicles and trains
with a view to preventing pollution, taking into account international criteria and the capacity
of the country.

Final Report on Pilot Global Fuel Economy Initiative Study in Ethiopia 2012
20
In terms of legal framework, Proc. No. 300/2002, the Environmental Pollution Control
Proclamation is another very relevant law with respect to controlling environmental pollution
including those from vehicular emission.
In terms of guiding any economic development by the principle of sustainable development,
Proc. No. 299/2002, the Law of Environmental Impact Assessment, shall also be relevant.
As related to international obligation & participation of Ethiopia, in terms of GHG reduction,
the following international instruments constitute the required legal framework:
• Proc. No. 439/2005 • Kyoto Protocol Ratification Proclamation, which protocol has been based on the UN
Framework Convention on Climate Change, and has been ratified by the Ethiopian government.
In terms of the sector (Transport) specific legal regulation, the following proclamations &
regulations are very relevant in determining the legal framework. These are:
• Proc. No. 468/2005 (the Transport Authority establishment law) • Proc. No. 681/2010 (vehicle identification, inspection & registration law) • Proc. No. 691/2010 (Ministry of Transport empowerment law) • Regulations No. 208/2011(road transport traffic control law) • Regulations No. 74/2001 (motor vehicles & trailers identification, inspection &
registration law).
In terms of customs & tax systems, and incentive related issues, the following constitute the
legal framework:
• Proc. No. 285/2002 (VAT) • Proc. No. 286/2002 (Income Tax) • Proc. No. 300/2002 (Environmental Pollution Control Law) • Proc. No. 622/2009 (Customs Proclamation) • Proc. No. 691/2010 (Incentives related, as related to the Ministry of Finance &
Economic Development) • Proc. No. 307/2002 (Excise Tax, Withholding Tax, Income Tax Proclamation) • Regulations No. 133/2007; (Import Sur Tax, except on those exempted motor
vehicles for freights & passengers, and special purpose motor vehicles)

Final Report on Pilot Global Fuel Economy Initiative Study in Ethiopia 2012
21
The regulation of fuel efficiency & vehicular emission is related to multifaceted legal
institutional & regulatory framework.
2.2 Vehicles Import Customs Duties & Applicable Taxes and Incentives 2.2.1 Customs Duties & Taxes
The customs tariff for imported vehicles shall be based on CIF cost of the vehicle unlike
other goods, which is based on FOB price. The custom & other applicable taxes (tariff) in
relation to vehicles are thus calculated based on CIF cost & as provided under the applicable
customs tariff & respective tax laws.
The following are the information collected from the relevant sources at the ERCA & the
applicable laws. Except those exempted, in relation to vehicles, the possible types of charges
(customs & all taxes) applicable to imported vehicles are the following: customs duty, value
added tax, excise tax, sur tax, and withholding tax. These are shown in Table 2.1.
a) Customs Duty
The applicable law shall be Proc. No. 622/2009 (Customs Proclamation), the Customs tariff
(see Article 45 (1)) & applicable customs related regulations. Customs duty is generally
applicable to all types of vehicles. The customs tariff rate may extend from 10% up to 35%
depending on the weight or capacity of the vehicle under consideration. The customs value
for imported goods shall be the actual total costs of the goods up to the first entry point into
customs territory of Ethiopia (see Article 32 (2) cum Article 33 & 39; see also Article 32-
Article 44 as related to calculation of customs value; Article 51-Article 53 as related to
payment of customs duties and taxes and service charges on imported goods including
vehicles; Article 67-Article 68 as related to relief (tax exemption) procedures). The payment
of customs tariff on goods including vehicles is based on Vol. II Customs Tariff, officially
issued by the ERCA. The latest version is January 2008 based on the 2007 version of the
Harmonized System. Vehicles related customs tariff has been provided under Chapter 87 of
the Customs Tariff Book (see pp 569-577).

Final Report on Pilot Global Fuel Economy Initiative Study in Ethiopia 2012
22
b) Value Added Tax
The legal framework for VAT is Proc. No. 285/2002 and the relevant & applicable VAT
regulations. VAT is generally applicable to all imported goods except those exempted
transactions (see Article 8 cum Article 8 (2) (j), for example). The rate could be 0% (see
Article 7 (2) (b)) or fixed rate i.e., 15%. VAT is applicable to imported goods including
vehicles (see Article 2 (7) and here goods mean all kinds of corporal movable items. The
person who imports vehicles is a VAT payer (see Article 3 (1) (b). In the VAT proclamation
a person carrying out taxable import of goods to Ethiopia, shall be a VAT taxpayer. The
value of a taxable import, as per Article 15 (1), is the customs value of goods determined in
accordance with the customs legislation of Ethiopia, plus the sum of duties & taxes payable
upon the import of the goods into Ethiopia, excluding VAT and income tax withholding.
c) Excise Tax
The legal framework for Excise Tax is Proc. No. 307/2002 and related regulations. Excise
Tax may not be applicable to some types of vehicles. The tax rate may also be different from
vehicles to vehicles. The tax rate extends from 30% up to 100% depending on the capacity of
the vehicle under consideration. The person liable to the payment of excise tax shall be an
importer. Importer means any person (natural or juridical) who imports goods, which are
subjected to the payment of excise tax, in to the country (see Article 2 (2)). To this effect, the
Proclamation under its Schedule (Item No. 15), has provided the following:
• Motor passenger cars, Station Wagons, utility cars & Land Rover, Jeeps, pickups,
other similar vehicles (including motorized caravans), whether assembled with their
appropriate initial component or not follows the following tax categorization;
Item no 15.1: up to 1300 cc 30%;
Item no 15.2: from 1301cc up to 1, 800 cc 60%;
Item no 15.3: above 1 800 cc 100%.
• According to Article 5 (2), the base for computation of excise tax, with respect to
goods imported, shall be based on cost, insurance & freight (CIF).
d) Import Sur Tax:
The applicable law with respect to Import Sur Tax shall be Reg. No. 133/2007. Import Sur
Tax shall apply to all goods imported into Ethiopia except those exempted ones (see Article

Final Report on Pilot Global Fuel Economy Initiative Study in Ethiopia 2012
23
2). The exemption has two aspects: schedule based exemption & non-schedule based
exemption. Under the schedule based exemption & in relation to vehicles, motor vehicles for
freight & passengers, and special purpose motor vehicles are exempted (see Article 5 cum the
Schedule). Non-Schedule based exemption refers to goods imported by persons or
organizations exempted from customs duty by law, directives or by (international) agreement
entered into by the (Ethiopian) government. Import Sur Tax of 10% shall be levied &
collected on all goods imported except the exempted ones. According to Article 4, the basis
of computation for the import surtax shall be the aggregate of CIF value; customs duty, VAT
& Excise Tax Payable on the good.
e) Withholding Tax
The applicable law for withholding tax shall be Proc. No. 286/2002 (Income Tax Proc.)
specifically Article 52, Collection of Tax on Imports. This tax is applicable in relation to
import of goods for commercial use. In particular Article 52 (1) states the follows:
A current payment of income tax shall be collected on Schedule C (Income/Business
Income Tax) income at the time of import of goods for commercial use, and the
collected amount treated as tax withheld that is creditable against the tax payer’s
income tax liability for the year. The amount (as withholding tax) to be collected on
imported goods shall be 3% of the sum of CIF value (see Article 52(2)).
The charge/tax rate may generally be categorized in to three as 0 rates, low rate, and higher
(full) rate.
• Zero rate (0%) applies for the following goods/items: ambulances, fire fighting vehicles, defense vehicles; vehicles for handicapped (physically challenged)
• Low rate applies for the following one item, namely, tractors: The applicable customs duty & tax are as follows:
Customs duty 10%; VAT 15%; Withholding tax 3%.
There will be no payment of surtax & excise tax.
• Higher (full) rate shall be paid on vehicles either based on seats or horse power (cc). This is given in Table 2.1.

Final Report on Pilot Global Fuel Economy Initiative Study in Ethiopia 2012
24
The vehicles importation system, as related to payment of customs duties and other
applicable taxes including incentive regime is administered at two levels, policy &
operational level.
At the policy level, the policy related to fiscal matters shall be initiated and administered, if
approved by the Ministry of Finance and Economic Development (see Proc. No. 691/2010:
Article 18 and see also Article 67 of Proc. No. 622/2009).
Table 2.1 Custom Duty and Tax Rates of Imported vehicles in Ethiopia
No Goods /Items Customs Duty %
Excise Tax %
Import Sur Tax %
VAT %
With holding %
1. Public Transport Less than 15 and greater or equal to 10 seats 15 or more seats
35 10
- -
- -
15 15
3 3
Passenger cars Less than 10 seats
2. Cylinder capacity not exceeding 1300 cc 35 30 10 15 3
3. Cylinder exceeding 1300 cc but less than 1800cc
35 60 10 15 3
4. Cylinder exceeding 1800 cc not exceeding 3000 cc
35 100 10 15 3
5. Electric/Battery Vehicles 35 30 10 15 3
Trucks
6. Cargo vehicles (based on weight) up to 1500 kg
35 - - 15 3
7. Cargo vehicles >1500 kg 10 - - 15 3
8. Heavy Duty, 5 - 20 ton 10 - - 15 3
At the operational level the importation of vehicles system, as related to enforcement of
customs duties & other payable taxes on imported vehicles, is administered by the Federal
Revenues & Customs Authority based on the Harmonized System (see Proc. No. 587/2008
(ERCA Establishment Proc.) cum Proc. No. 622/2009: Customs Proc. & other applicable
laws).
2.2.2 Incentives
Each tax related law may provide incentive regime. The incentive regime shall serve as
exemption from the payment of the required tax or customs as provided. Incentives are more
commonly as related to economic objectives than related to environmental objectives.

Final Report on Pilot Global Fuel Economy Initiative Study in Ethiopia 2012
25
a) As related to Customs Duty
According to Article 67, Proc. No. 622/2009, duty free privilege with respect to import of
goods may be granted by law, international agreement to which Ethiopia is a party or by
directives to be issued by the Ministry of Finance & Economic Development. There are thus
three options to secure incentives: law, international agreement or directives.
In relation to vehicles, the following enjoy such privilege: ambulances (of different capacities
in a complete state), fire fighting vehicles, defense vehicles, vehicles for handicapped
(physically challenged).
If further privilege is to be provided for other vehicles, it has to be provided by law or by
directives to be issued by the Ministry of Finance & Economic Development (see Article 18
(5), Proc. No. 691/2010 cum Article 67, Proc. No. 622/2009).
b) As related to VAT
According to Article 8 of Proc. No. 285/2002, some exempted transactions have been stated
in Article 8 (2) as follows:
As per Article 8 (2) (j) the following types of import goods are exempt from payment
of VAT to the extent provided by regulations. These are :
Goods (the legal definition of goods also includes vehicles) imported by the
government organizations, institutions or projects exempted from (customs) duties
and other import taxes to the extent provided by law or agreement.
Article 8(4) also provides a possibility of granting exemptions for other goods & services,
due to directives to be issued by the Minister of Finance & Economic Development.
c) As related to Excise Tax
The Excise Tax law (Proc. No. 307/2002) provides the assessment & payment of excise tax
on certain types of vehicles (as per its Schedule) from 30% up to 100% excise tax. The
Excise Tax provides no incentive regime.

Final Report on Pilot Global Fuel Economy Initiative Study in Ethiopia 2012
26
d) As related to Import Sur Tax
Import Sur Tax is administered as per Import Sur Tax Reg. No. 133/2007. This law provides
the following exemptions to the following vehicles as per its Schedule. These are: motor
vehicles for freight & passengers, and special purpose motor vehicles.
e) As related to Environmental Objectives
Incentives for environmental objectives have been envisaged under Article 10, Proc. No.
300/2002 (the law of environmental pollution control); given as follows:
Incentives for the introduction of methods that enable the prevention or minimization of
pollution to an existing undertaking shall be determined by the regulations issued under the
proclamation. Importation of new equipment that is destined to control pollution shall, upon
verification by the EPA, be exempted from payment of custom duty.
Article 28 of Reg. No. 25/2007 (of the Addis Ababa City Government) also provides the
following: Incentives for the introduction of methods to an existing undertaking that enable to
prevent or minimize pollution shall be determined by the regulations to be issued by the
Federal Government for the implementation of Environmental Pollution Control Proc. No.
300/2002.
The Federal Government has issued Reg. No. 159/2008 in relation to industrial pollution. The
Federal Government environmental regulations (i.e., Prevention of Industrial Pollution
Council of Ministers Regulations No. 159/2008) deal specifically on industrial pollution.
Although these regulations focus mainly on stationary source of pollution from industrial
source, smoke limits and maximum CO concentration in motor vehicle exhaust is given.
However, the given CO limits are very high.
The incentive regime envisaged under the Federal Government environmental pollution
control proclamation & the Addis Ababa City Regulations, however, are only applicable to
factories. If there is a possibility of interpreting it differently, the content & scope of tax
provisions have to be interpreted restrictively. Therefore, it may not be possible to widen, by
interpretation, the scope of Article 10 (under the proclamation) & Article 28 (under the said
City regulations) to cover vehicles as well.
This obviously requires a policy dialogue to be held with the Ministry of Finance &
Economic Development, based on concrete proposals, to initiate the required incentive

Final Report on Pilot Global Fuel Economy Initiative Study in Ethiopia 2012
27
regime by way of legislative amendment. Legally, the federal EPA is the key institution to
initiate such incentives.
The legislative measure required for consideration of incentives as related to vehicles might
depend on the type of the relevant tax or customs regime: viz., customs duty or VAT or
Excise Tax or Import Sur Tax.
The legislative measure may be required at two levels: at statutory level and/or non-statutory
level. The statutory level amendment may come in two aspects: in relation to amending Proc.
No. 300/2002 & in relation to the tax law at statutory level (say customs duty law or VAT).
The non-statutory legislative amendment or measure may come into picture in the following
way: in relation to a given tax regime law (say Import Sur Tax regulations).
Based on such statutory amendment, the incentive regime has to be provided for vehicles by
the new draft regulations (non-statutory) to be prepared under the present project.
By way of conclusion, the envisaged incentive regime under the environmental pollution
control laws may not be applicable for vehicles. There is a clear legal gap pertaining to
incentives for vehicles. Therefore, a legislative measure, in terms of legislative amendment &
new legal instrument, has to be taken to realize the desired incentive regime for vehicles.
2.3 Vehicles Registration & Inspection System 2.3.1 Vehicles Registration System
Vehicles identification, inspection and registration system is governed by Proc. No.
681/2010. As per the proclamation (see Article 2 (1)) vehicles means any type of wheeled
motor vehicle other than special military vehicles, for use on roads classified as carriage,
bicycle, motor vehicle, semi-trailer & trailer (see also Article 2 (13), Proc. No. 468/2005).
Motor vehicle means (see Article 2 (4)) any vehicle moving on a road by mechanical or
electrical power. The definition for motor vehicle has been broadly defined by Proc. No.
468/2005: Motor Vehicle means a vehicle moving by mechanical or electrical power,
classified as truck, motorcycle, private motor car, public service vehicle, truck, tractor and
special mobile equipment. Each of the items under the definition has been defined legally
separately.
Vehicles, except those exempted by such proclamation, are identified through the registration
system. The exempted groups are the following (see Article 5, Proc. No. 681/2010);

Final Report on Pilot Global Fuel Economy Initiative Study in Ethiopia 2012
28
inventory vehicles; vehicles engaged in international traffic; special mobile equipment with a
maximum speed of less than 20 km per hour; and carriages of handicaps.
The registration system is based on ownership & identification number plate. The
identification number plate is divided into two, federal & regional. The ownership
identification system is similar (except for those only to be issued by the federal government
like embassies, international organizations & aid plates, ETH) both at federal and regional
(including the City of Addis Ababa and Dire Dawa) level, which is identified by different
colors and codes. Those colors & codes, except for temporary, transferrable & special mobile
equipment plate, provide the ownership dimension of the vehicle under consideration.
As per the Schedule, attached to the said Proc., the following 11 (eleven) plates are provided:
Taxi plate; Private Plate; Commercial Plate (see also under ETH Plate); Government Plate
(see also under ETH Plate); Religious & Civic Societies Plate; Temporary Plate; Transferable
Plate; Special Mobile Equipment Plate; Police Plate; Embassies, International Organizations
& Aid Plate; ETH Plate (indicates vehicles engaged in cross country commercial road
transport service or owned by the federal government);
The regional (including the city of Addis Ababa & Dire Dawa) plate types have also been
provided under the same Schedule with their respective abbreviations (like AA to indicate
vehicles registered in Addis Ababa).
Ownership of vehicles may thus conveniently be categorized into the following four groups:
private, government, international & non-government which will include:
• Private; taxi, private & commercial • Government; government itself & police
• International; embassies & international organizations (UN, AU & CD); and
• Non-governmental; domestic & international: religious & civic societies (domestic),
and international aid organizations;
The ownership dimension may help design the implementation strategy, from which group of
vehicles to commence implementation of the fuel efficiency and the environmental
requirement of vehicular emission reduction.

Final Report on Pilot Global Fuel Economy Initiative Study in Ethiopia 2012
29
2.3.2 Vehicles Inspection System
The applicable law (i.e., Proc. No. 681/2010) clearly provides a legal requirement for the
annual inspection (see Article 25) of vehicles except for those exempted under such law (see
Article 26). According to Article 29, there are four vehicles inspection criteria.
Among the inspection criteria environmental criteria is one. According to Article 29 (1) (d), it
is stated as follows: An authorized inspector of an inspection station shall inspect each
vehicle presented for the purpose of establishing the vehicles compliance with environmental
pollution protection standards as per the appropriate law. As per this law (Article 29(2)), the
federal Transport Authority has also been authorized to issue directives to provide for
additional inspection criteria and the implementation of the Article.
Reg. No. 208/2011, as per its Article 10 (1) (a) clearly prohibits the following; No person
may drive on a road any vehicle which is not properly maintained, discharges smoke, vapor,
oil or fuel of higher amount than the appropriate level and which is likely to cause annoyance
or damage to other road users or the environment.
There is no legally prescribed environmentally related standard vehicles inspection criteria
yet. As discussed with relevant informants, the Transport Authority has also not yet issued
the required directives as provided under Article 10 (2) of the said Proclamation (No.
681/2010).
Therefore, based on the new vehicular emission level, the said directives have to be prepared
& issued by the Transport Authority.
2.4 Ethiopia’s International Obligation/Participation
Emission of GHG to the atmospheric environment including from vehicular source is of an
international concern due to its contribution to climate change. Ethiopia, as one of the
member of the international community and therewith to the global environmental system, is
an active participant in the protection of the global environment.
This is evident from the number of legislative ratifications already done with respect to
international environmental agreements by the Ethiopian government. Among the
international environmental agreements ratified by the Ethiopian government, pertaining to
atmospheric environment, the UN Framework Convention on Climate Change (ratified in
1994) and the Kyoto Protocol (ratified in 2005) are few. Ethiopia is not as such a country

Final Report on Pilot Global Fuel Economy Initiative Study in Ethiopia 2012
30
classified as contributor to the atmospheric pollution. Her participation at international level
is based on voluntary and thus on moral obligation basis.
2.5 Formulation of Draft Regulations
The need for drafting new draft regulations with a view to promote fuel efficient vehicles &
therewith to regulate vehicular emission is evident. However, there are some issues to be
discussed, namely, the need to have an ambient air quality standard; the need to establish
vehicular emission standard; under which type of tax law the type of incentive to be
provided; at what level the draft regulations to be issued as regulations; and the scope of
application of the said draft regulations.
Ambient air quality standard is a prerequisite to determine the (vehicular) emission level.
There is no legally established ambient air quality standard in Ethiopia. Such quality standard
has to be determined by law. The initiative has to be taken by the Federal Government EPA
to this effect. There is an already developed draft ambient air quality standard.
The vehicular emission standard has been prepared by adoption, under the current project.
Under which type of tax law the incentive to be provided requires serious discussion by all
stakeholders. The recommendation could be to provide an exemption from Excise Tax and/or
from Import Sur Tax.
Should the provision of incentives for vehicles undergo two legislative processes, statutory &
non-statutory, such legislative process looks as follows.
2.5.1 Statutory Legislative Process
To provide the required incentive regime on environmental objectives, the required
legislative amendment has to be made in relation to Proc. No. 300/2002. This is going to be
done by the House of Peoples Representatives based on the draft amendment proclamation to
be prepared both by the Federal Government EPA in consultation with the Transport
Authority, then to be submitted to the Ministry of Finance & Economic Development. The
draft proclamation may go through the respective standing committees, for their respective
legislative review, before the House deliberates on same for its legislative measure. This is to
be so since the incentive regime touches two dimensions: economic dimension (revenue) &
environmental dimension (protection).

Final Report on Pilot Global Fuel Economy Initiative Study in Ethiopia 2012
31
2.5.2 Non-Statutory Legislative Process
The process to be passed by the draft regulations may look as follows: the draft regulations
have to be prepared by the current project (based on the required inputs emission level,
incentive regime, implementation strategy, scope of application, etc.); the draft regulations
have to be presented for comments by stakeholders in a workshop; comments secured from
the workshop have to be incorporated; the draft regulations have to be submitted by the
Ministry of Transport and Transport Authority to the Federal Government EPA; the EPA
then submits same to the Environmental Council for its due deliberation & recommendation;
the Environmental Council then submits the draft regulations to the Council of Ministers for
its executive action to issue the draft regulations as legally binding & effective regulations.
The following subjects determine the level of government to issue the required regulations:
• legal power on energy matters (given to the Ministry of Water & Energy; see Article 26 (1)) (j), Proc. No. 691/2010);
• power to formulate minimum emission standard level (through federal EPA as provided under Article 6, Proc. No. 300/2002);
• power to decide on tax & customs including incentive matters (as per the federal Constitution (by the House of Peoples Representatives see Article 55 cum Article 96 (1) the provisions which provide the power of the Federal Government on taxation, specifically, on customs duty & import related taxes);( by the respective customs duty & tax laws by the Council of Ministers through its respective regulations); (by the Ministry of Finance & Economic Development (see Article, 18(5), Proc. No. 691/2010);
• power to manage customs & import tax matters on imported goods (by the ERCA as per Proc. No. 587/2008);
• power to manage vehicles in terms of their classification, registration & inspection (by the federal Transport Authority as per its establishment law Proc. No. 468/2005 & other transport related laws).
All these issues, unless delegated, are the mandate of the Federal Government. Therefore, the
draft regulations have to be submitted to the Federal Government for its issuance, instead of
submitting same to the AACG.

Final Report on Pilot Global Fuel Economy Initiative Study in Ethiopia 2012
32
2.6 Conclusion
This project attempts to address the achievement of double objectives: economic objectives
(in terms of increasing vehicles fuel efficiency) & environmental objectives (in terms of
reducing vehicular emission). Technological dimension is also an integral part of both
objectives.
This part of the project concludes the following:
a) There is no legally established ambient air quality standard in Ethiopia.
b) There is no legally established vehicular emission standard in Ethiopia.
c) The introduction of the vehicular emission standard in Ethiopia imperatively requires
the prior legal establishment of a local ambient air quality standard.
d) The introduction of the vehicular emission standard imperatively requires subsequent
detail administrative directives to be issued by the Transport Authority.
e) The importation of vehicles (as imported goods) is subjected to the assessment &
payment of customs duties and other import taxes: viz., VAT, Excise Tax; Import Sur
Tax including Withholding Tax (the last one being creditable to the tax payer).
f) The excise tax is made dependent on cylinder volume. Thus, it penalizes vehicles that
consume more fuel per km and emit more exhaust per km. Hence, it is indirectly
related to fuel economy and emission. However, the group of vehicles with cylinder
volume less than 1000 c.c. are not given tax incentives compared to the group 1000
c.c. -1300 c.c..
g) The heavy tax on passenger cars with seat capacity less than 10 persons is responsible
to the aging of the fleet.
h) Incentive for vehicles based on new technologies ( hybrid vehicles, electric vehicle
etc.) that result in radically higher fuel economy and lower emission has not yet been
provided in Ethiopia.
i) The granting of legally recognized & established fiscal incentives for importation of
vehicles requires legislative measure at two levels: at proclamation level (as related to
amendment of the pollution control law) & at regulations level (in terms of new
regulations to be prepared under the Project, which may touch one or more of the
import tax laws, viz., VAT, Excise Tax and/or Import Sur Tax).
j) The legislative measure determines at which level of government such measure is to
be taken; by the House of Peoples Representative (in case of amending the pollution

Final Report on Pilot Global Fuel Economy Initiative Study in Ethiopia 2012
33
control proclamation) or by the Council of Ministers (in terms of issuing the new draft
regulations to be /prepared under this Project) or by the Minister of Finance &
Economic Development by issuing directives.
k) The new draft regulations to be prepared under this project shall be applicable in all
regions of Ethiopia.
l) The registration of vehicles system of vehicles is based on ownership of vehicles
(private, government, international & non-governmental) & based on such ownership,
the respective code has been given to vehicles.
m) Environmental objectives & criteria has been recognized under the applicable laws in
terms of annual vehicles inspection, but lack details (directives) for their due
enforcement.
n) The economic & environmental dimensions of the objectives of this project involves
multitude of stakeholders for its implementation; this may include government
institutions (like the Federal Government EPA, FTA, Ministry of Transport, ERCA,
AACG, the Police, relevant ministries (specifically Ministry of Water & Energy,
Ministry of Finance & Economic Development,), the private sector (in terms of
vehicles inspection) & the relevant civic societies (in terms of education).

Final Report on Pilot Global Fuel Economy Initiative Study in Ethiopia 2012
34
3. BASELINE SETTING FOR VEHICLE EFFICIENCY IMPROVEMENT AND EMISSION REDUCTION
One of the major activities of the study on Pilot Global Fuel Economy Initiative Program in
Ethiopia is vehicle registration data collection, vehicle data analysis, and vehicle performance
determination for the baseline years 2005, 2008 and 2010 from which progress in
improvement of vehicle efficiency will be tracked as per GFEI guidelines (GEFI,2011). The
process ensures that Ethiopian policymakers have improved information in order to draft
appropriate legislations and guidelines for dissemination of more fuel-efficient vehicles that
have less emission of pollutants and GHG, and to assess the impact of vehicle emission and
fuel quality on the ambient air quality. The accomplished tasks and the way forward in this
direction are discussed in the following section.
3.1 Methodology
To undergo the study of the baseline setting for vehicle fuel efficiency improvement and
emission reductions, there is a certain methodology set by Global Fuel Economy Initiative.
The methodology consists of the following steps:
• Setting the objectives
• Collecting vehicle registration data
• Cleaning data
• Structuring data
• Estimating baseline fuel economy
• Report findings
This step by step methodology has been adopted for ease of analysis and comparing the result
of the study to other countries which underwent similar study.
3.1.1 Objective
The main objective for this study is setting a baseline and developing a national vehicle
database, which is necessary to track improvement in fuel economy and reduction of
emission of carbon dioxide and other pollutant per unit vehicle.

Final Report on Pilot Global Fuel Economy Initiative Study in Ethiopia 2012
35
3.1.2 Data Attributes
Depending on the availability of the vehicles data and the objective of database to be
developed, different data attributes might be considered by different organizations. For
instance the International Energy Agency (IEA) specifies twenty four key attributes on Auto
fuel economy database. While the ERCA recorded a maximum of fifteen data attributes for
the purpose of capturing details of vehicles import, collecting taxes and controlling illegal
smuggling into the country. Out of the fifteen data attributes some of them are irrelevant for
the purpose of auto fuel economy database such as CIF, total tax, country of consignment,
chassis number etc. Besides, some important data attributes were not registered for numerous
vehicles in the database. As such there was a need to look for other sources to fill the gap,
specifically internet was one of the major sources among others. In many developing
countries like Ethiopia, it is difficult to find detailed and full-fledged national information
regarding vehicle data as mentioned above, where in this context the GFEI specifies the
absolute minimum data attributes that are required for auto fuel economy database. These
data attributes include key parameters, directly or indirectly, used for quantifying vehicle fuel
efficiency and CO2 emission calculation which are listed below:
i. Vehicle make and model,
ii. Model production year
iii. Year of first registration, if different from model year
iv. Fuel type
v. Engine size
vi. Domestically produced or imported
vii. New or second hand import
viii. Rated Fuel Economy per model and test cycle basis.
ix. Number of sales by model
3.1.3 Data Collection
Newly registered vehicles are those imported and assembled in the country at a particular
year. The appropriate locations for this data are the database of imported vehicles at
Ethiopian Revenues and Customs Authority (ERCA) and vehicles assembling enterprises.
ERCA is an autonomous federal agency responsible for collecting revenues from customs

Final Report on Pilot Global Fuel Economy Initiative Study in Ethiopia 2012
36
duties and domestic taxes. From ECRA data for newly registered light duty vehicles (LDVs)
for selected years were collected. The vehicle data incorporates brand new vehicles as well as
used ones with gross weight less than3500 kg and having number of seats less than or equal
to 15. Such types of vehicles are known as light duty vehicles.
The light duty vehicles data in this study includes passenger cars and compact cars, saloon
cart car, small sport utility vehicles (SUV), as well as pick-ups.
The data was collected only for the years 2005, 2008, 2010 and 2011. Except for the latter,
the years were selected based on UNEP guidelines for the ‘‘Pilot Global Fuel Economy
Initiative Project in Ethiopia’’.
The second source was from passenger car assembly plants.
3.1.4 Data Cleaning
With respect to the key data attribute suggested by GFEI, the data acquired from ERCA must
be cleaned and structured. The first approach would have been to clean the vehicle data on
the ERCA’s database by removing unnecessary information, but it was found to be very
difficult due to the severe irregularities and missing data. The second approach would have
been to fill the data with a new format that suits the GFEI scheme. However, this option was
also found to be cumbersome and time taking, at least, to do it manually. The main reason
was that most of the data was unstructured or simply written in single record as shown in
Table 3.1.
Table 3.1 Example of unstructured raw data in ERCA’s database
TOYOTA COROLLA (CH#JT1EOEE9000447281,M/Y1992 MODEL-EE90L-AEMDEW,ENG-2E-2451657)
ENGINE 3L-5475634, MODEL LN166L-PRMDS,M/Y2004 (TOYOTA HILUX DOUBLE CABINE PICKUP
CH.NO. JTFDE626X00128020)
NISSAN X-TRAIL MOD.TVHNLAYT30URAY062Z (CH.NO. JN1TENT30Z0005735 EN.NO. YD22146725)
1*2ND HAND CAR TOYOTA COROLLA,M.Y 1992 (CH#.JT1LOEE9007143710, CC 1295 MOD#.EE90L-
ALMDEW,ENG#.2E-2441128)
TOYOTA CORLLA, CH.NO. JTFDE626X00128021

Final Report on Pilot Global Fuel Economy Initiative Study in Ethiopia 2012
37
An attempt has been made to develop a computer program to sort out data collected to extract
manufacturing year, model, and cylinder volume. However, due to the strong irregularities
associated with the original registered data at ECRA, the computer program was not effective
in all cases. Hence, the results obtained (sorted data through a computer program) needed
manual cleaning and sorting. The process of data cleaning is presented as follows. Table 3.2
shows raw data received from ECRA database
Table 3.2 Example cleaned and structured data
Make Model Condition Body Type Engine Disp. Vol. CC
Net Weight
Fuel Type
Qty Production year
Regist. Year
Fuel economy l/km
GHG Emission gCO2/km
TOYOTA COROLLA USED SALOON 1300 950 PETROL 1 1986 2005 12.2 192.9
TOYOTA COROLLA USED SALOON 1300 1000 PETROL 1 2003 2008 15.3 153.8
FORD FIESTA NEW COMPACT 1250 3441 PETROL 3 2010 2010 13.2 178.3
HYUNDAI GETZ NEW COMPACT 1086 961 PETROL 1 2010 2010 17.7 133.0
NISSAN HARDBODY NEW PICK UP 3153 3836 DIESEL 2 2010 2010 11.3 236.6
TOYOTA HILUX USED PICK UP 2779 3000 DIESEL 1 2002 2008 9.0 296.0
TOYOTA HILUX NEW PICK UP 3000 5535 DIESEL 3 2005 2005 9.6 276.7
TOYOTA LAND CRUISER
NEW S.WAGON 4164 2060 DIESEL 1 2004 2005 7.5 355.2
TOYOTA MINIBUS USED VAN 2779 1540 DIESEL 1 1988 2005 9.0 296.0
TOYOTA MINIBUS USED VAN 2494 1620 DIESEL 1 2007 2010 11.4 233.7
NISSAN PATROL USED SUV 4169 2400 DIESEL 1 2007 2010 7.5 355.2
V.WAGEN POLO USED SALOON 1450 1435 PETROL 1 1997 2005 10.0 235.4
TOYOTA PRADO USED SUV 2694 2500 DIESEL 1 2007 2010 8.6 309.8
TOYOTA RAV 4 USED SUV 2362 1600 DIESEL 1 2007 2010 8.6 309.8
TOYOTA TACOMA USED PICK UP 2326 1600 PETROL 1 2005 2008 8.2 287.1
DAIHATSU TERIOS NEW SUV 1300 2070 PETROL 2 2005 2005 11.5 204.7
TOYOTA TUNDRA NEW PICK UP 5663 2710 DIESEL 1 2010 2010 5.1 522.4
TOYOTA VITZ USED COMPACT 997 1000 PETROL 1 2005 2008 12.9 182.7
NISSAN X-TRAIL NEW SUV 3000 1560 DIESEL 1 2005 2005 8.0 333.0
TOYOTA YARIS NEW SALOON 1299 1000 PETROL 1 2010 2010 15.4 153.1
Table 3.2 shows part of the cleaned data that differentiates vehicles by Make, Model,
Condition, Body type, Engine volume, Net weight, Fuel type, Quantity, Production Year,
Registration year, Fuel economy and CO2 emission. These vehicle data are needed to classify
vehicles and determine average fuel economy. The data was made complete by searching and
filling values for parameters such as fuel economy and specific CO2 emission from

Final Report on Pilot Global Fuel Economy Initiative Study in Ethiopia 2012
38
manufacturers’ websites and new vehicle dealers. Even then, after all these attempts, about
8.7% of the total LDVs for the year 2005, 9.14% and 9.12 % for 2008 and 2010 respectively
are not qualified for the database because of lack of the absolute minimum important
information that are required to calculate harmonic average annual fuel economy and average
annual CO2 emission.
3.2 Baseline Setting
According to the GFEI methodology, 2005 is used as a baseline year for fuel economy and
CO2 emission tracking. In this context, the starting year for the study is 2005. Once this
baseline year is established, GFEI recommends that the same calculations be done for 2008,
2010, 2012 and the following calculations after two years. The total number of newly
registered light duty vehicles for the years: 2005, 2008, and 2010 are given Table 3.3 and
Table 3.4 for imports and locally assembled vehicles, respectively.
Table 3.3 Imported light duty vehicle registered per year
Years 2005 2008 2010
Quantity 5598 10254 14931
Table 3.4 Locally assembled light duty vehicles per year
Years 2005 2008 2010
Quantity - 257 450
These light duty vehicles have weights less than3500 kg and seats number between 15 and
24. These vehicles are mainly used for personal transportation in urban areas, for public
transportation purposes as well as for commercial purpose to transport small goods.
Figure 3.1 shows that there is a continuous increase in the number of newly registered light
duty vehicles. The quantity increased by 83% from 2005 to 2008 and by 45% from 2008 to
2010. As local assembly of vehicles in the country started only recently, their share is
insignificant, although it is growing as shown in Table 3.4.

Final Report on Pilot Global Fuel Economy Initiative Study in Ethiopia 2012
39
Figure 3.1 Total number of LDVs Registration by year
By comparing manufacturing year and registration year of particular vehicles considered for
this study, vehicles are categorized either as used or brand new. The quantity of registered
light duty vehicles has increased for both new and used ones from year to year as shown in
Table 3.3. However, the rate of growth of used vehicles registration is greater than that of
band new ones. Excessive import of used vehicles would by far contribute to CO2 emission,
as used vehicles consume more fuel than brand new.
Table 3.5 Light duty vehicles registration by condition (New and Used)
Import Years 2005 2008 2010
New 2011 3457 4335
Used 3587 6797 10596
Figure 3.2 Light duty vehicle registration by condition (New and Used)
0
2000
4000
6000
8000
10000
12000
New Used
2005
2008
2010
0
5000
10000
15000
20000
2005 2008 2010
Year

Final Report on Pilot Global Fuel Economy Initiative Study in Ethiopia 2012
40
Table 3.6 and Figure 3.3 show classification of newly registered used vehicles by age group.
The age group that consists of the highest number of vehicles is 1-5. Considering the new
vehicles, about 50 % of these vehicles are up to 5 years age.
Table 3.6 Classification of registered LDVs by age group for year 2005, 2008, and 2010
Age
Years Old
Registeration Year
2005 2008 2010
2005-2001 2008-2004 2010-2006
1- 5 1989 3875 5500
2000-1996 2003-1999 2005-2001
6-10 555 2111 3195
1995-1991 1998-1994 2000-1996
11-15 895 813 2510
≤ 1990 ≤ 1993 ≤ 1995
More than 15 1472 2489 1662
Figure 3.3 Number of registered LDVs in different years by age groups
Table 3.7 shows classification by engine displacement volume. While the most frequent
range of engines displacement volume of registered light duty vehicles is 1001-1300 cc for
petrol engines, it is engine group 2500-3000cc for that of diesel engines. These medium size
diesel engines belong to SUV vehicles, pick up and vans. It can be observed that diesel fueled
engines become more in number compared to petrol engines as the engine displacement
becomes greater than 2000 c.c. Usually petrol fuel engines are more compact than diesel fuel
engines.
0
1000
2000
3000
4000
5000
6000
1 to 5 6 to 10 11 to 15 > 15
2005
2008
2010

Final Report on Pilot Global Fuel Economy Initiative Study in Ethiopia 2012
41
Table 3.7 Classification of registered LDVs by engine displacement volume
Volume 2005 2008 2010
(cc) Petrol Diesel Petrol Diesel Petrol Diesel
≤ 1000 204 - 142 - 1190 -
1001-1300 1834 8 3378 5 3361 333
1301-1800 309 8 417 29 390 54
1801-2000 260 2 122 21 123 16
2001-2500 72 146 68 1181 186 2763
2500-3000 115 1953 192 3841 1590 4250
Figure 3.4 shows quantities of vehicles that were imported in the years 2005, 2008 and 2010.
It is obvious that by far the most commonly used vehicle in Ethiopia is Toyota brand
followed by Nissan, Suzuki and Mitsubishi. Amazingly the share of Toyota brand is as large
as 72%, 78% and 80% respectively for the years 2005, 2008 and 2010, out of the total import
of LDVs in Ethiopia. The main reasons for Toyota’s brand in wide use in Ethiopia is
assumed to be the abundant availability of spare parts, ample maintenance firms or garages,
and the well known dealer. The people’s perception towards Toyota brand durability is also
very strong.
Figure 3.4 Classification of registered vehicles in no by make
0
2000
4000
6000
8000
10000
12000
2005
2008
2010

Final Report on Pilot Global Fuel Economy Initiative Study in Ethiopia 2012
42
It doesn’t mean that only the brands shown in Figure3.8 are available in Ethiopia. There are
many more brands as well, and just to mention some of them: GMC, Cadillac, Geely, Lexus,
Range Rover, Opel, Fiat ,Hummer, Tata, Land rover, Sangyong, BMW, BYD ,Honda,
Cherry, Isuzu, Holland car etc
Table 3.8 Classification of registered LDVs by body type
Import Year 2005 2008 2010
Compact 118 140 1257
Saloon 1994 3316 3366
SUV 488 796 934
Mini-SUV 399 812 1315
Van 938 2662 3704
Pick up 974 1562 2280
From Table 3.8 and Figure 3.5 show the classification of registered vehicles by body type.
Saloon car took the lead up to 2008 followed by vans that surpassed it in 2010. Although
compact vehicles were insignificant 2005-8, considerable increase of this type of vehicles
occurred in 2010.
Figure 3.5 Body types of registered LDVs by year in number
As it can be seen from Table 3.9 or Figure 3.6 and Figure3.7, the number of annually
registered diesel engine vehicles surpassed that of petrol engine vehicles in 2008. This
indicates that the imported vehicles are mainly for public transport and commercial transport.
0
500
1000
1500
2000
2500
3000
3500
4000
Compact Saloon SUV Mini-SUV Van Pick up
2005
2008
2010
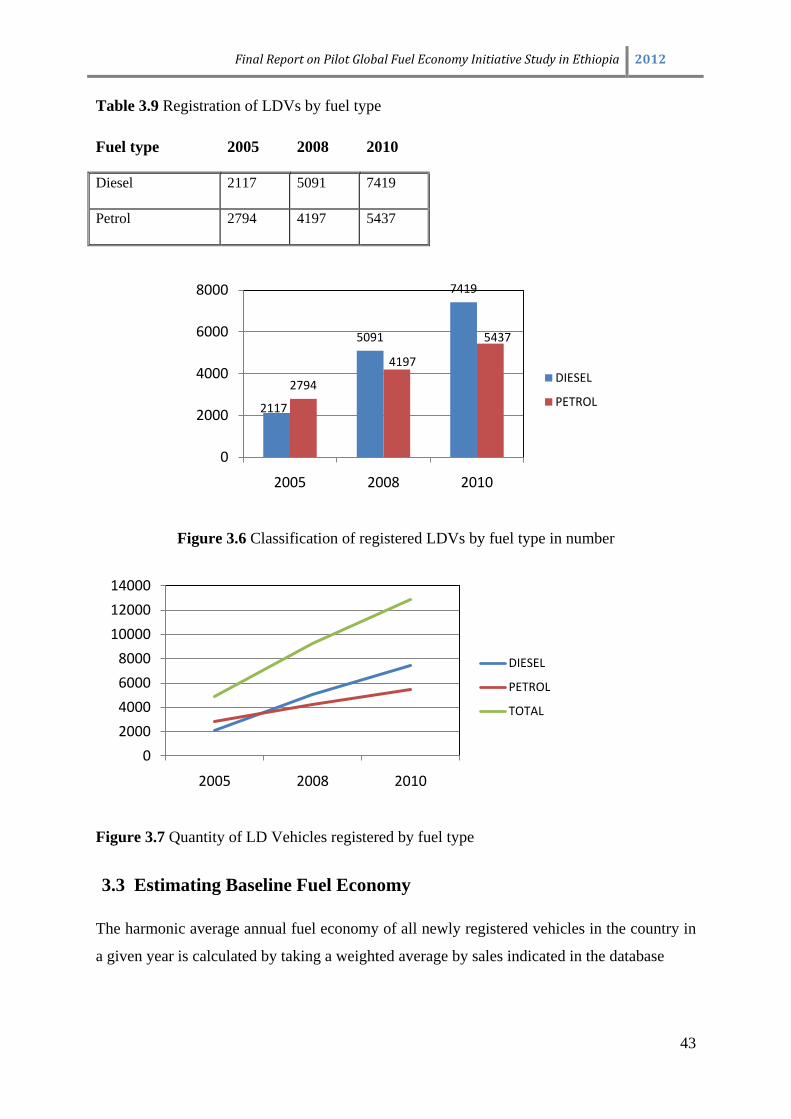
Final Report on Pilot Global Fuel Economy Initiative Study in Ethiopia 2012
43
Table 3.9 Registration of LDVs by fuel type
Figure 3.6 Classification of registered LDVs by fuel type in number
Figure 3.7 Quantity of LD Vehicles registered by fuel type
3.3 Estimating Baseline Fuel Economy
The harmonic average annual fuel economy of all newly registered vehicles in the country in
a given year is calculated by taking a weighted average by sales indicated in the database
2117
5091
7419
2794
4197
5437
0
2000
4000
6000
8000
2005 2008 2010
DIESEL
PETROL
02000400060008000
100001200014000
2005 2008 2010
DIESEL
PETROL
TOTAL
Fuel type 2005 2008 2010
Diesel 2117 5091 7419
Petrol 2794 4197 5437

Final Report on Pilot Global Fuel Economy Initiative Study in Ethiopia 2012
44
𝑯𝑯𝑯𝑯𝑯𝑯𝑯𝑯𝑯𝑯𝑯𝑯𝑯𝑯𝑯𝑯 𝑯𝑯𝒂𝒂𝒂𝒂𝑯𝑯𝑯𝑯𝒂𝒂𝒂𝒂 𝑯𝑯𝑯𝑯𝑯𝑯𝒂𝒂𝑯𝑯𝒂𝒂 𝒇𝒇𝒂𝒂𝒂𝒂𝒂𝒂 𝒂𝒂𝑯𝑯𝑯𝑯𝑯𝑯𝑯𝑯𝑯𝑯𝒆𝒆 =𝑻𝑻𝑯𝑯𝑻𝑻𝑯𝑯𝒂𝒂 𝒔𝒔𝑯𝑯𝒂𝒂𝒂𝒂𝒔𝒔 𝑯𝑯𝑯𝑯 𝑻𝑻𝒕𝒕𝒂𝒂 𝒆𝒆𝒂𝒂𝑯𝑯𝑯𝑯
∑ 𝒔𝒔𝑯𝑯𝒂𝒂𝒂𝒂𝒔𝒔 𝑯𝑯𝑯𝑯𝒎𝒎𝒂𝒂𝒂𝒂 𝑯𝑯𝒇𝒇𝒂𝒂𝒂𝒂𝒂𝒂 𝒂𝒂𝑯𝑯𝑯𝑯𝑯𝑯𝑯𝑯𝑯𝑯𝒆𝒆 𝑯𝑯𝑯𝑯𝒎𝒎𝒂𝒂𝒂𝒂 𝑯𝑯
𝑯𝑯𝑯𝑯
Similarly the average annual carbon dioxide emission can be calculated through the weighted
average with sales of each model.
𝑨𝑨𝒂𝒂𝒂𝒂𝑯𝑯𝑯𝑯𝒂𝒂𝒂𝒂 𝑯𝑯𝑯𝑯𝑯𝑯𝒂𝒂𝑯𝑯𝒂𝒂 𝒂𝒂𝑯𝑯𝑯𝑯𝒔𝒔𝒔𝒔𝑯𝑯𝑯𝑯𝑯𝑯 =∑ 𝒔𝒔𝑯𝑯𝒂𝒂𝒂𝒂𝒔𝒔 𝑯𝑯𝑯𝑯𝒎𝒎𝒂𝒂𝒂𝒂 𝑯𝑯 ∗ 𝒂𝒂𝑯𝑯𝑯𝑯𝒔𝒔𝒔𝒔𝑯𝑯𝑯𝑯𝑯𝑯 𝑯𝑯𝑯𝑯𝒎𝒎𝒂𝒂𝒂𝒂 𝑯𝑯𝑯𝑯𝑯𝑯
𝑻𝑻𝑯𝑯𝑻𝑻𝑯𝑯𝒂𝒂 𝒔𝒔𝑯𝑯𝒂𝒂𝒂𝒂𝒔𝒔 𝑯𝑯𝑯𝑯 𝑻𝑻𝒕𝒕𝒂𝒂 𝒆𝒆𝒂𝒂𝑯𝑯𝑯𝑯
Note that all the auto fuel economy data that have been included in the database are in
compliance with the New European Driving Cycle (NEDC). As such conversion factor has
not been applied to convert from EPA to NEDC.
European Drving Cycles
The ECE(UDC) +EUDC or combined cycle is performed on a chassis dynamometer. The
entire cycle includes four ECE segments, Figure 1, repeated without interruption, followed by
one EUDC segment, Figure 2. Before the test, the vehicle is allowed to soak for at least 6
hours at a test temperature of 20-30°C. It is then started and allowed to idle for 40s.
Effective year 2000, that idling period has been eliminated, i.e., engine starts at 0 s and the
emission sampling begins at the same time. This modified cold-start procedure is also
referred to as the New European Driving Cycle or NEDC.
ECE 15
The ECE cycle is an urban driving cycle, also known as UDC. It was devised to represent
city driving conditions

Final Report on Pilot Global Fuel Economy Initiative Study in Ethiopia 2012
45
Figure 3.8 ECE 15 or Urban Drive Cycle
Extra Urban Driving Cycle (EUDC)
Figure 3.9 EUDC for high power Engine

Final Report on Pilot Global Fuel Economy Initiative Study in Ethiopia 2012
46
Figure 3.10 EUDC for Low power Engine
The calculation of harmonic average fuel economy and average annual emission has been
done with two scenarios. Calculation for the first scenario is done by using the value of fuel
economy that are available on manufacturers’ websites and from other sources specified for
the brand new vehicles, while the second scenario assumes the deterioration of fuel economy
with age of the vehicles. As considerable portion of the LDVs imported to Ethiopia shown in
Table 3.6 are more than six years old, the fuel economy is assumed to decrease by a certain
factor with in an interval of five years from the value mentioned for the brand new vehicles.
For instance, for vehicles more than 15 years old it is assumed that the fuel economy
decreased by 2km/l from the value specified in the test cycle for brand new vehicles. Such
value was specified by interviewing owners of old vehicles.
3.3.1 Average Fuel Economy and Annual Emission for New Vehicles
As mentioned above, the calculation is done assuming that all vehicles perform as brand-new
in urban and combined (urban and extra urban) cycles. Table 3.10 and Figure 3.11 show that
the fuel economy increased from11.5 km/l in 2005 and 2008 to 12 in 2010. The annual
average fuel economy for diesel and petrol engine light duty vehicles are shown in Tables
3.11 and 3.12, where better improvement in fuel economy is obtained for vehicles with petrol
engines.

Final Report on Pilot Global Fuel Economy Initiative Study in Ethiopia 2012
47
Table 3.10 Harmonic Average Fuel Economy and Average Annual Emission for all LDVs
Registration Year 2005 2008 2010
Harmonic Average Fuel Economy
(liter/(100 km)
8.7 8.7 8.3
Harmonic Average Fuel Economy (km/liter) 11.5 11.5 12
Average Annual Emission (g/km) 217 221 212
Figure 3.11 Harmonic average fuel economy trends for all LDVs in km/liter
Figure 3.12 Average annual emission trend in g/km for all type of LDVs
7.5
7.7
7.9
8.1
8.3
8.5
8.7
8.9
2005 2008 2010
L/(1
00 K
m)
Registeration Year
200
205
210
215
220
225
2005 2008 2010
gCO
2/km
Registeration Year

Final Report on Pilot Global Fuel Economy Initiative Study in Ethiopia 2012
48
Table 3.11 Harmonic average fuel economy and average annual emission for diesel vehicles
Registration Year 2005 2008 2010
Harmonic Average Fuel Economy
liter/(100 km)
9.43 9.52 9.17
Harmonic Average Fuel Economy (km/liter) 10.6 10.5 10.9
Average Annual Emission (g/km) 251 255 245
Table 3.12 Harmonic average fuel economy and average annual emission for petrol vehicles
Registration Year 2005 2008 2010
Harmonic Average Fuel Economy
liter/(100 km)
8.13 7.63 7.35
Harmonic Average Fuel Economy (km/liter) 12.3 13.1 13.6
Average Annual Emission (g/km) 191 180 173
3.3.2 Average Fuel Economy and Annual Emission Considering Age of Vehicle
As the engine deteriorates with age, it is definite that the specific fuel consumption will
increase. Hence, a decrease in fuel economy of 1 km/l, 1.5 km/l and 2 km/l, for vehicles in
the age range of 5-10, 10-15 and more than 15 year, respectively, is assumed.
Table 3.13 and Figure 3.13 show that the fuel economy increased from10 in 2005 and 2008 to
11.3 in 2010. The annual average fuel economy for diesel and petrol engine light duty
vehicles are shown in Tables 3.14 and 3.15. Better improvement in fuel economy is obtained
for vehicles with petrol engines.

Final Report on Pilot Global Fuel Economy Initiative Study in Ethiopia 2012
49
Table 3.13 Harmonic Average Fuel Economy and Annual Emission for all LDVs
Registration Year 2005 2008 2010
Harmonic Average Fuel Economy
liter/(100 km)
10 10 8.85
Harmonic Average Fuel Economy (liter/km) 10 10 11.3
Average Annual Emission 254 256 220
Figure 3.13 Harmonic average fuel economy for all registered LDVs in km/liter considering aging
7.5
8
8.5
9
9.5
10
10.5
2005 2008 2010
L/(1
00 k
m)
Registeration Year

Final Report on Pilot Global Fuel Economy Initiative Study in Ethiopia 2012
50
Figure 3.14 Average annual emission trend for all registered LDVs in g/km considering aging
Table 3.14 Harmonic Average Fuel Economy and Average Annual Emission for Diesel Vehicles Registration Year 2005 2008 2010
Harmonic Average Fuel Economy
liter/(100 km)
11.63 11.36 10
Harmonic Average Fuel Economy (km/liter) 8.6 8.8 10
Average Annual Emission (g/km) 310 303 267
Table 3.15 Harmonic Average Fuel Economy and Average Annual Emission for Petrol Vehicles Registration Year 2005 2008 2010
Harmonic Average Fuel Economy
liter/(100 km)
9.01 8.20 8.13
Harmonic Average Fuel Economy (km/liter) 11.1 12.2 12.3
Average Annual Emission (g/km) 211 198 191
200
210
220
230
240
250
260
2005 2008 2010
gCO
2/Km
Registeration Year

Final Report on Pilot Global Fuel Economy Initiative Study in Ethiopia 2012
51
3.4 Conclusion
Study from Ethiopian baseline setting of LDVs indicate that the average fuel economy for
vehicles in Ethiopia in 2005 and 2008 were 8.7 L/(100 km or 11.5 km/l with corresponding
CO2 emission of 217 and 221 gCO2/km while in 2010 the fuel economy slightly increased to
8.3 L/(100 km) or 12 km/l with a corresponding CO2 emission of 212 gCO2/km. Diesel
fueled vehicles were found to travel less kilometer per liter of fuel as compared to petrol
engine vehicles and emit more CO2 than petrol fueled vehicles. This results are in lower
regime when compared to that of reported in the literature [ICT,2012], which is caused by
importation of old second hand vehicles.

Final Report on Pilot Global Fuel Economy Initiative Study in Ethiopia 2012
52
4. VEHICLE STOCK STATISTICS
4.1 Methodology
The methodology employed to deal with the vehicle stock statistics in Ethiopia (Addis Ababa
and selected Regional Governments) includes literature review of standard parameters to
describe vehicle classification, vehicle technology and vehicle manufacturers’ specifications,
data collection, and data cleaning and analysis.,
4.1.1 Data Collection
To make complete the statistics of vehicle stock in Ethiopia and estimate environmental
impact of vehicle emission, the annual vehicle inspection data available at Federal Transport
Authority (FTA), computer database for the year 2011/2012 was utilized. The data available
for Addis Ababa have been summarized from sub-city road and transport bureaus using
similar template to include parameters. Even though there have been problems in the data
entry and incomplete information such as engine cc, manufacture year, emission control
technologies etc, the data available in Addis Ababa have been analyzed separately.
In addition, total fleet was collected from selected regional governments (Oromia, Tigray,
Amhara, SNNPR and Benshangul Gumuz) to project the impact of vehicle fleet on fuel
efficiency and emission across the country. The main challenge to get clean data from Road
and Transport bureaus in the regions is that they are not using standard and similar format to
record the vehicles history. Furthermore, in some cases, the data entry problem has left
important parameters (engine cc, year of manufacturing, vehicle category, etc) incomplete
and ambiguous. The total number of vehicles available in Addis Ababa and some regions in
2011/2012 is given in Table 1. The total vehicles number in Ethiopia is estimated to be
344.108 assuming the vehicle population in Afar and Gambella regions is similar
Benshanguel Gumez region nand that was of Harari region is similar to Diredawa and 5 % of
the the totl fleet were not registered due to several reasons.
4.1.2 Classifications
The total fleet in Addis Ababa and regional governments is broadly classified in to three
groups as Motorcycles & Tricycles, Gasoline and Diesel vehicles in order to investigate the
effect on fuel efficiency, fuel economy and emission.

Final Report on Pilot Global Fuel Economy Initiative Study in Ethiopia 2012
53
Table 4.1 Total vehicles inspected in Addis Ababa and Regions (2010/11)
No Location Total number of vehicles
from raw data(not cleaned)
Number of vehicles known engine cc
and year of manufacture (cleaned data) Motorcycles
and tricycles
Gasoline
vehicles
Diesel
vehicles
Motorcycles
and tricycles
Gasoline
vehicles
Diesel vehicles
light heavy Bus
1 Addis Ababa 5015 123645 68322 2084 87736 27690 23490 2290
2 Amhara 6023 3834 10268 2121 1755 3585
3 Benshangul
Gumuz
299 469 334 56
4 Oromia 4855 11140 17077 3141 5804 11627
5 SNNPR-Debub 15225 2888 5663 6840 488 3857
6 Tigray 4774 1763 5515 3339 1181 2881 620 624
7 ET 3305 5631 42867 1641 4323 11095 24381 1809
8 Diredawa 3111 2386 1513
9 Soimali 1201 1153 2143
Total 43808 152909 153702
Total accounting
for missing data 49,893 344,108
a) Motorcycles and Tricycles
Many motorcycles and tricycles today use gasoline 2-stroke engines due to their smaller size
and lower investment cost. However, 4-stroke engines in motorcycles are available and have
several advantages. A 4-stroke engine is much cleaner and emits substantially less volatile
organic compounds (VOCs) compared to a 2-stroke engines. A 4-stroke engine will probably
cost a little more (10-15%) but uses less fuel, needs no separate lubricating oil, and require
less maintenance. Modern 2-stroke engines with catalyst and direct injection systems have
begun to enter the market. However, so far the endurance of the catalyst is a problem and the
cost of a direct injected 2-stroke engine is similar to a 4-stroke engine.
b) Diesel Vs Gasoline Vehicles
Diesel vehicles (generally comprised of heavy-duty trucks and currently half of all new
passenger cars) are more fuel-efficient compared to petrol vehicles, and emit less CO2.

Final Report on Pilot Global Fuel Economy Initiative Study in Ethiopia 2012
54
However, these engines have relatively higher emission of particulate matter (PM) and
Nitrogen oxides (NOx). Gasoline vehicles (generally, passenger cars and some light duty
trucks) are not as efficient as diesel but emissions of particulate matter and NOx are less. CO
emissions are higher for petrol-powered vehicles; however, CO emissions are easily reduced
with a catalyst and are not deemed as harmful to human health as particulate matter and NOx
emissions.
4.1.3 Data Cleaning
Records of vehicle registration obtained from Federal Transport Authority (FTA) are
considered as the main source of vehicle data for this study. The arrangement was made by
Department of Mechanical Engineering and Ethiopian Transport Authority to facilitate access
to vehicle records in transport authority, and other potential data sources.
It is well known that FTA collects and maintains vehicle databases to suit their own needs,
basically for administrative purpose. Such data may or may not be compatible with the type
of data sought for study on fuel efficiency and emission reduction. Hence, data cleaning and
gap filling are needed. Information on attributes such as , manufacturing year, model number,
engine number, engine capacity, cylinder number, fuel type, engine power, front axle
number, rear axle number, front tire number, rear tire number, vehicle gross weight, vehicle
cargo capacity, vehicle seat number, and registration date of the vehicle was obtained from
the transport authority. Vehicle registration data and other parameters obtained from transport
authority were fragmented and incomplete. In addition, there was a total absence of important
attributes for this study such as type of air fuel mixture formation and emission controlling
technology in the database.
The data cleaning process included sorting out the raw data obtained from the authority to fit
the objectives of the study and filling missing information on key vehicle attributes. To fill
missing data and include important vehicle attributes indicated above the following
methodologies were used:
a. Preparation of standard format to sort the data obtained from Transport Authority.
The summary of vehicle classification and important parameters is given in Table 4.2.
b. Unit conversion to make consistent and uniform (e.g. engine capacity was given in cc
and liter)

Final Report on Pilot Global Fuel Economy Initiative Study in Ethiopia 2012
55
c. Missing performance data, body type, etc. are searched from the manufacturers’
website via internet and vehicle sales agents.
Table 4.2 Summary of vehicle classification and important parameters
Classification
Type of vehicle Motorcycles and tricycle
Gasoline Vehicles
Diesel Vehicles
Brand √ √ √ Model √ √ √ Number of strokes 2 or 4 stroke 4 stroke 4 stroke Engine CC √ √ √ Motor Power √ √ √ Number of Cylinder
√ √ √
Type of fuel used Gasoline or Diesel
Gasoline Diesel
Type of air fuel mixture formation
X
Carburetor and Gasoline EFI
X
Type of fuel injection system
X X Diesel mechanical or electronic injection
Year of manufacture
√ √ √
Number of wheels 2 or 3 4 and above 4 and above Emission controlling technology (ECT)
X
2 way or 3 way catalyst
Diesel Oxidation Catalyst (DOC) or Diesel Particulate Filter (DPF)
Type of body Or
X
Saloon Van SUV (Sport utility vehicle) Pick up
Light weight diesel
Saloon Van SUV (Sport utility vehicle) Pick up
Cargo diesel
Light duty truck Medium duty truck Heavy duty truck
Bus Weight (Gross vehicle weight rating)
X X Class 1-8
Registration date √ √ √
4.1.4 Parameters for Data Cleaning
The consultant team has identified key parameters to clean the raw data collected that are
relevant to fuel efficiency and emission issues from Federal Transport Authority and regional

Final Report on Pilot Global Fuel Economy Initiative Study in Ethiopia 2012
56
governments transport bureaus. These parameters have effect on fuel economy and emission
reduction directly or indirectly. It is obvious that some parameters (air fuel mixture
formation, emission control technologies and fuel injection systems) are specific for
motorcycles, gasoline vehicles and diesel vehicles that require special attention for each
vehicle classifications. On the other hand, age, body type, manufacture year, engine capacity,
etc. are common features considered for all vehicle categories.
a) Type of air fuel mixture formation: - Generally, gasoline vehicles have higher fuel
consumption as compared to diesel vehicles due to the air fuel mixture technology. The air
fuel mixture technology in gasoline vehicles is either carburetor system or electronic fuel
injection system. The study has considered that all gasoline vehicles manufactured before
1986 use carburetor systems and those vehicles manufactured since late 1980s use electronic
fuel injection.
The fuel system for diesel vehicles is either diesel mechanical injection or diesel electronic
injection. The diesel electronic injection system is the new technology introduced in late
1990s. Thus, all diesel vehicles manufactured after 2000 are considered to have diesel
electronic fuel injection system which is efficient in fuel delivery based on the load and speed
conditions.
b) Emission Controlling Technology:-The emission controlling technologies have a direct
impact on emission reduction if they are properly used in motorcycles, gasoline and diesel
vehicles. The type of fuel (gasoline or diesel) is the key factor to select the appropriate
emission control technology. When strict vehicle emission standards were first set, all
vehicles did not possesses the technology to significantly lower vehicle emission before
1970. Then, two way catalytic convertors were installed on gasoline vehicles in the mid
1970s and replaced by three way catalytic convertors in early 1980s.
Diesel vehicles were using diesel oxidation catalysts (DOC) as an emission technology to
oxidize hydrocarbons (HC), carbon monoxide (CO) and the soluble organic fraction of
particulate matter (PM) since mid 1990s. A DOC can work at sulfur level higher than 500
ppm, but there is a risk that sulfur contained in the fuel will also oxidize and form sulphate
and thus actually increase the total emission particulate matter. The lower the fuel sulfur
level, the more efficiently the DOC functions. Furthermore, the Diesel particulate filters
(DPFs) are new technologies introduced in mid 2000 that function by capturing particulate

Final Report on Pilot Global Fuel Economy Initiative Study in Ethiopia 2012
57
matter in a filter and oxidizing the particles. Generally, some of the emission control
technologies not only applied to new vehicles but can be installed or “retrofitted” in older in-
use vehicles. However, many vehicles in Ethiopia are not equipped with emission control
technologies because they are removed intentionally due to the lack of knowledge and
maintenance facilities.
c) Engine Capacity:- The raw data collected from Federal Transport Authority and regional
government transport bureaus include engine capacity having mixed measuring units (cc and
liter), incomplete information and errors in the data entry. The engine capacity of gasoline
vehicles (light duty cars) is considered in the range from 700 to 2200 cc. On the other hand,
light weight diesel vehicles (Saloon, SUV, Minibus and Pickup) have engine capacity from
1200-6000 and heavy weight diesel vehicles (Cargo and Bus) engine capacity is from 1200-
13000 cc.
d) Year of Manufacture:-It is an important parameter to know the technology of the total
vehicle fleet in order to determine the fuel economy and emission reduction. New vehicles
and modern technologies contribute significantly to fuel consumption and emission
reduction. If the raw data do not contain the correct year of manufacture, the vehicles are
ignored in the data cleaning process. The year of manufacture of all motorcycles, tricycles,
gasoline and diesel vehicles is included up to 2011/12 G.C.
e) Gross Weight:- Gross vehicle weight rating is considered as a parameter to classify heavy
weight diesel vehicles (trucks) and buses. The heavy weight diesel vehicles are classified as
light duty (1000-6350 Kg), medium duty (6351-11793 Kg) and heavy duty trucks (11794-
40000 Kg).
f) Body Type:-The shape and size of the vehicle body has a direct impact on the fuel
consumption due to light weight and aerodynamic effect. The raw data has included some
vehicle descriptions in line with the body type such as automobile, double cabin, pickup, bus,
cargo and field vehicles. However, such important parameters were missing for many
vehicles in the raw data, mainly from regional government offices. Therefore, additional
criteria were set to clearly define the body type of gasoline and diesel vehicles. The summary
of vehicle classification by engine and body type is given in Table 4.3.

Final Report on Pilot Global Fuel Economy Initiative Study in Ethiopia 2012
58
4.2 Vehicle Stock Analysis in Addis Ababa
4.2.1 Motorcycles and Tricycles
The total number of motorcycles and tricycles in Addis Ababa classified in year of
manufacture, engine capacity, number of stroke and fuel type are given in Table 4.4. The
number of vehicles in each classification such as engine capacity, number of stroke and type
of fuel are given in percentage adjacent to each group. Then, the distribution of vehicles in
year of manufacture is given in each row. For example, the number of vehicles having
engine capacity less than 100 cc is equivalent to 7.1% of the total population. Among those
vehicles having engine capacity less than 100 cc, the number of motorcycles and tricycles
manufactured before 1989 and 2005-2009 are 24.3 % and 39.9 %, respectively.
Table 4.3 Summary of vehicle classification by body type and engine capacity
Vehicle Classification by
engine type
Vehicle classification by
body type
Vehicle description in
row data
Engine capacity( cc)
No. seat or weight (Kg)
Gasoline
Saloon Automobile Minibus Minibus
Bus
Pickup Double cabin Pickup
SUV/ Sport Utility Vehicle/
Automobile >1800 4-9 Field vehicles >1850 4-9
Light weight diesel vehicles
Saloon All type < 1800 4-9 Minibus Bus ≤15
Automobile ≥ 10 Double cabin/Pickup Double cabin SUV /Sport Utility Vehicle)
Not double cabin & field vehicles
≥ 1850 4-9
All field vehicles Heavy weight diesel vehicles
Bus Bus Light duty truck Cargo < 4000 1000-6350 Medium duty truck 4000-5500 6351-11793 Heavy duty truck >5500 11794-40000

Final Report on Pilot Global Fuel Economy Initiative Study in Ethiopia 2012
59
The motorcycles and tricycles can use either a two stroke or four stroke cycle engines.
Generally, four stroke cycle engines are better in fuel economy and reduced emissions.
However, almost all motorcycles and tricycles (98.9%) use two stroke cycle engines and 98.0
% of the total population, use gasoline fuel, as shown in Table 4.4.
In this study, generally the engine capacity is classified as low, medium and high capacity
motorcycles and tricycles. Table 4.4 shows that the medium capacity vehicles (151-200 cc)
are 61.8 % in comparison with low and high capacity vehicles. Also, the total number of high
capacity vehicles in Addis Ababa is 5.9 %.
Table 4.4 Distribution of motorcycles and tricycles in Addis Ababa (Total number of
motorcycles and tricycles: 5015)
Motorcycle and Tricycle
Classification
Year of manufacture (%)
≤1989 1990-1994 1995-1999 2000-2004 2005-2009 2010-2011
Engine
capacity
(cc)
≤100 (7.1%) 24.3 0.7 1.4 5.4 39.9 28.4
101-150 (25.1%) 4.8 2.3 4.2 6.3 46.2 36.3
151-200 (61.8%) 8.5 2.3 2.6 14.0 59.3 13.3
201-400 (1.2%) 38.5 7.7 7.7 19.2 26.9 0
≥ 400 (4.7%) 16.3 9.2 8.2 13.3 44.9 8.21
No.
stroke
2 (98.9%) 9.4 2.5 3.1 11.5 54.2 19.3
4 (1.1%) 21.7 17.4 13.0 17.4 26.1 4.3
Fuel
type
Gasoline (98.0%) 9.7 2.7 3.2 11.5 53.6 19.4
Diesel (2.0%) 2.3 2.3 0 18.2 70.5 6.8
4.2.2 Gasoline Vehicles
The summary of total fleet in Addis Ababa which was obtained from the raw data is given in
Table 4.5. Table 4.5 includes various parameters designed to evaluate the influence of all
gasoline vehicles on fuel economy and emission reduction such as body type, engine
capacity, year of manufacture, type of air fuel mixture formation and emission control
technology.
The number of gasoline vehicles in each classification such as engine capacity, year of
manufacture, type of air fuel mixture formation and emission controlling technology are
given in percentage adjacent to each group. Then, the distribution of vehicles in body type is

Final Report on Pilot Global Fuel Economy Initiative Study in Ethiopia 2012
60
Table 4.5 Gasoline vehicle distribution by body type in Addis Ababa (Total number of
gasoline vehicles: 123,645)
Category Classification Body Type (%)
Saloon
85.76 %
Minibus
10.41 %
SUV
4.19 %
Pickup
13.6% Engine capacity
(cc)
≤ 1000 (8.7%) 87.7 11.8 0.2 0.2
1001- 1300 (55.3%) 99.9 0.7 0.3 0
1301 – 1500 (4.5%) 96.8 1.9 0.9 0.4
1501 – 1800 (16.4%) 75.6 6.3 17.7 0.4
1801 – 2000 (14.8%) 39.9 53.0 7.0 0.2 ≥ 2001 (0.3%) 76.2 12.6 9.5 1.7
Year of
manufacture (G.C)
≤ 1982 (17.5%) 92.0 7.0 0.8 0.2
1982- 1989 (35.3%) 81.2 17.9 0.9 0.1
1990 – 1994 (19.0%) 81.9 7.3 10.6 0.1
1995 – 2000 (9.5%) 84.2 7.3 8.1 0.4
2000- 2004 (7.8%) 85.9 7.4 6.7 0.4 2005 -2009 (9.1%) 93.4 2.1 4.3 0.2 2010-2011 (1.9%) 98.6 0.5 0.7 0.2
Type of air fuel
mixture formation
Carburetor (42.2%) 85.5 13.7 0.7 0.1
Gasoline EFI (57.8%) 85.2 8.0 6.7 0.2
Emission
controlling
technology (ECT)
No ECT (4.6%) 97.4 1.8 0.5 0.3
Two way catalyst (9.5%) 92.1 6.9 0.9 0.1 Three way catalyst (85.9%)
83.9 11.2 4.7 0.2
given in each row. For example, the number of gasoline vehicles having engine capacity less
than 1000 and 101-1300 cc is equivalent to 8.7% and 55.3 % of the total population,
respectively. In all engine capacity classification, the majority of vehicles are Saloon except
in engine capacity range from1801-2000cc. In this particular case, 53.0 % are Minibuses.
This indicates that in high engine capacity range (1801-2000 cc), the number of Minibuses
increases considerably. This is evident that most gasoline vehicles with high engine capacity
used for transportation in Addis Ababa are Minibuses that consume more fuel every day.
However, Minibuses are advantageous as they carry 12-14 people at a time for transportation
(passenger to km travel). Furthermore, it is recommended that the use of busses and light
railway systems for mass transportation can improve the fuel economy as far as passenger to
km travel is concerned. Besides the normal fuel consumption of Minibuses, there are other

Final Report on Pilot Global Fuel Economy Initiative Study in Ethiopia 2012
61
factors such as engine performance, road condition, traffic jam, eco-driving etc that
contribute greatly to higher fuel mileage and emission.
The year of manufacture of all vehicles clearly shows the performance of the vehicles and the
technology incorporated for fuel consumption and emission reduction. The gasoline vehicle
distribution in year of manufacture is also given in Table 4.5. The total number of gasoline
vehicles available in Addis Ababa that were manufactured before 2000 are 81.3 %. This
shows that most of the gasoline vehicles are relatively old that could consume more fuel in
normal condition.
The type of air fuel mixture formation systems in gasoline vehicles (conventional carburetor
or Electronic Fuel Injection (EFI)) is determined based on the year of manufacture. The
numbers of vehicles using conventional carburetor and EFI system are 42.2% and 57.8%,
respectively. This indicates that there is an advantage to use vehicles equipped with EFI
system for fuel economy.
There have been two types of emission controlling technologies introduced in gasoline
vehicles, namely, two way and three way catalytic converters. Table 4.5 also includes the
total vehicle distribution in line with emission control technologies. As most vehicles in
Addis Ababa were manufactured in 1980s, most of them are expected to be equipped with
three-way catalytic converters. However, evidences show that emission controlling
technologies are dismantled from many vehicles available in Ethiopia because there are no
rules and regulations that enforce to use them and the fuel quality (leaded gasoline) is a
factor that could damage catalytic converters too.
4.2.3 Diesel Vehicles
Generally, diesel vehicles are categorized into three different groups as light duty vehicles,
cargo trucks and bus. The summary of vehicle distribution for each group is given in Tables
4.6-4.8.
Tables 4.6-4.8 include various parameters designed to evaluate the influence of all diesel
vehicles on fuel economy and emission reduction such as body type, engine capacity, year of
manufacture, type of fuel system and emission control technology. The numbers of gasoline
vehicles in each classification are given in percentage adjacent to each group. Then, the
distribution of vehicles in body type is given in each row. In addition, the body type for light

Final Report on Pilot Global Fuel Economy Initiative Study in Ethiopia 2012
62
duty vehicles diesel vehicles is the same as gasoline vehicles that include Saloon, Minibus,
SUV and Pickup (single and double cabins).
In the low engine capacity range (≤1800 cc), the Saloon vehicles cover 79.8% compared to
other body type vehicles. In the medium engine capacity range, there is no Saloon vehicles
but the number of Minibus, SUV and Pickup vehicles increases considerably. Furthermore,
the SUV vehicles are 85.2% in the high engine capacity range.
The year of manufacture of all vehicles clearly shows the performance of the vehicle and the
technology incorporated for fuel consumption and emission reduction. The light weight
vehicle distribution in year of manufacture is also given in Table 4.6. The share of light
weight diesel vehicles available in Addis Ababa that were manufactured before 2000 is 49.3
%. This shows that almost half of the light weight diesel vehicles are relatively old that could
consume more fuel in normal condition.
The type of air fuel mixture formation systems in diesel vehicles (Mechanical Injection or
Electronic Injection is determined based on the year of manufacture. The numbers of vehicles
using conventional mechanical injection and electronic injection system are 49.2% and
50.8%, respectively.
There have been two types of emission controlling technologies introduced in diesel vehicles
called, Diesel Oxidation Catalyst (DOC) and Diesel Particulate Filter (DPF). Table 4.6 also
includes the total vehicle distribution in line with emission control technologies. The majority
of vehicles (91.2%) use either DOC or DPF. However, evidences show that emission
controlling technologies are dismantled from many vehicles available in Ethiopia because
there are no rules and regulations that enforce to use them and the fuel quality (high sulfur
diesel) is a factor that could damage the emission controlling technology too.
Table 4.7 shows cargo trucks distribution in gross weight. In low and medium engine
capacity ranges, the number of light duty trucks is considerably high. On the other hand, in
the high engine capacity range (≥5501 cc), there are high number of medium duty trucks. As
it is shown in the Table 4.7, the number of heavy duty trucks manufactured after 2000 is 73.6
% of the total population. This indicates that most trucks available in Addis Ababa are new
types that include improved technology for fuel system and emission control.

Final Report on Pilot Global Fuel Economy Initiative Study in Ethiopia 2012
63
Table 4.6 Light duty diesel vehicle distribution by body type in Addis Ababa (Total number
of vehicles: 35381)
Category Classification Body Type (%)
Saloon
(1.3)
Minibus
(30.5)
SUV
(36.8)
Pickup
(31.6)
Engine capacity
(cc)
≤ 1800 (1.6%) 79.8 3.1 8.8 8.4
1801- 2500 (35.3%) 0.0 29.4 23.6 47.0
2501 – 4000 (46.0%) 0.0 37.9 30.1 32.0
≥ 4001 (17.0%) 0.0 13.9 85.2 1.0
Year of
manufacture
(G.C)
≤ 1982 (1.8%) 8.3 20.9 57.7 13.2
1982- 1989 (14.4%) 3.2 43.8 40.4 12.6
1990 – 1994 (13.3%) 1.9 30.7 54.4 13.0
1995 – 2000 (19.8%) 0.5 37.7 33.9 27.9
2000- 2004 (21.3%) 0.5 35.0 31.0 33.6
2005 -2009 (23.2%) 1.1 15.1 34.5 49.3
2010-2011 (6.3%) 0.1 17.0 23.4 59.5
Type of fuel
system
Mechanical injection (49.2%) 1.9 37.0 42.2 18.9
Electronic injection (50.8%) 0.7 23.7 31.6 44.0
Emission
controlling
technology (ETC)
No ECT (8.8%) 5.2 42.6 40.9 11.4
Diesel Oxidation Catalyst (40.4%) 1.2 35.8 42.5 20.5
Diesel Particulate Filter (50.8%) 0.7 23.7 31.6 44.0
Table 4.8 shows the distribution of diesel buses in various categories such as engine capacity,
year of manufacture, type of fuel system and emission controlling technology. Many buses
have high engine capacity (≥ 4000 cc). The number of buses manufactured after 2000 is 75%
of the total population. This shows that the use of new buses for transportation contributes for
better fuel efficiency. Since many buses are of the new types, their fuel systems and emission
controlling technology include the modern system.

Final Report on Pilot Global Fuel Economy Initiative Study in Ethiopia 2012
64
Table 4.7 Cargo diesel vehicle distribution by gross weight in Addis Ababa (Total number of vehicles: 30015)
Vehicle Category Vehicle Classification Vehicle distribution by gross weight (%)
Light duty truck (79.287 %)
Medium duty truck (19.87 %)
Heavy duty truck
(0.44 %) Engine capacity (cc) ≤ 4000 (29.3%) 88.9 10.5 0.2
4001- 5500 (68.4%) 77.6 22.3 0.1 ≥ 5501 (2.2%) 7.3 77.3 15.4
Year of manufacture (G.C)
≤ 1982 (2.8%) 36.2 60.1 3.7 1982- 1989 (5.4%) 78.4 18.9 2.7 1990 – 1994 (7.1%) 94.7 4.0 1.3 1995 – 2000 (11.2%) 93.5 6.1 0.4 2000- 2004 (24.2%) 88.9 11.0 0.1 2005 -2009 (39.8%) 84.2 15.8 0.1 2010-2011 (9.6%) 21.4 78.1 0.5
Type of fuel system Mechanical injection (26.4%) 84.8 13.8 1.5 Electronic injection (73.6%) 77.5 22.3 0.1
Emission controlling technology(ECT)
No ECT 54.0 42.3 3.6 DOC (21.0%) 92.7 6.4 0.9 DPF (73.6) 77.5 22.3 0.1
Table 4.8 Bus distribution in various categories in Addis Ababa ( Total no of buses: 2926)
Vehicle Category Vehicle Classification Bus (%)
Engine capacity (cc) 2501-4000 37.3 >=4001 62.7
Year of manufacture (G.C) <= 1982 6.6 1982- 1989 2.8 1990 - 1994 6.1 1995 - 2000 9.3 2000- 2004 26.6 2005 -2009 45.9 2010-2011 2.8
Type of fuel system Mechanical injection 24.8 Electronic injection 75.2
Emission controlling technology (ECT)
No emission controlling technology 8.3 Diesel Oxidation Catalyst 16.5 Diesel Particulate Filter 75.2

Final Report on Pilot Global Fuel Economy Initiative Study in Ethiopia 2012
65
4.3 Vehicle Stock Analysis in Regional Governments
This section explains the vehicle stock analysis of some regional governments that include
Amhara, Benshangul Gumuz, Oromia, SNNPR and Tigray regions. Generally, the row data
collected from each region does not contain complete information for the vehicles registered
in their respective areas. Furthermore, there is no uniform and standard format to record basic
information of all vehicles. Therefore, it is observed that many vehicles are not included in
the analysis because of the lack of important parameters such as vehicle description, engine
capacity, year of manufacture, number of seat and gross weight.
4.3.1 Motorcycle and Tricycle
a) Amhara
The row data obtained from Amhara region does not include complete information on year of
manufacture and number of stroke of motorcycle and tricycle. Thus, the number of stroke
ignored and year of manufacture is partially considered in the analysis.
The total number of motorcycles and tricycles in Amhara region classified in year of
manufacture, engine capacity and fuel type are given in Table 4.9. The number of vehicles in
each classification, such as engine capacity and type of fuel are given in percentages adjacent
to each group. Then, the distribution of vehicles in year of manufacture is given in each row.
For example, the number of vehicles having engine capacity less than 100 cc is equivalent to
13.8% of the total population. Among those vehicles having engine capacity less than 100 cc,
the share of motorcycles and tricycles manufactured from 2005-2009 is 77.8 %.
The motorcycles and tricycles can use either gasoline or diesel fuel. Most motorcycles and
tricycles (95.9%) use gasoline fuel, as shown in Table 4.9.

Final Report on Pilot Global Fuel Economy Initiative Study in Ethiopia 2012
66
Table 4.9 Summary of motorcycles and tricycles distribution in Amhara region (Total
number of motorcycles and tricycles: 6023)
Motorcycle and Tricycle
Classification
Year of Manufacture (%)
≤ 2004 2005-2009 2010-2012
Engine
capacity
(cc)
≤ 100 (13.8%) 0.3 77.8 21.8
101-150 (7.1%) 0.7 70.7 28.7
151-200 (74.2%) 1.8 63.6 34.6
201-400 (1.3%) 0 74.1 25.9
≥400 (3.7%) 0 64.1 35.9
Fuel type Gasoline (4.1%) 0 69.8 30.2
Diesel (95.9%) 1.5 66.0 32.4
b) Benshangul Gumuz
The row data obtained from Benshangul Gumuz region does not include engine capacity of
almost all vehicles. Therefore, the consultant team couldn’t find additional information to
analyze the vehicle fleet in the region.
c) Oromia
Like Amhara region, the row data obtained from Oromia region does not include complete
information on number of stroke of motorcycle and tricycle. Thus, the number of stroke is
ignored in the analysis.
The total number of motorcycles and tricycles in Oromia region classified in year of
manufacture, engine capacity and fuel type is given in Table 4.10. The number of vehicles in
each classification, such as engine capacity and type of fuel are given in percentage adjacent
to each group. Then, the distribution of vehicles in year of manufacture is given in each row.
For example, the number of vehicles having engine capacity less than 100 cc is equivalent to
38.6% of the total population. Among those vehicles having engine capacity less than 100 cc,
the share of motorcycles and tricycles manufactured from 2005-2009 is 66.6 %. Most
motorcycles and tricycles in Oromia region have medium engine capacity (151-200 cc) and
only 6.0 % of the total population has high engine capacity (≥ 400 cc). In addition, most
motorcycles and tricycles (98.1%), use gasoline fuel, as shown in Table 4.10.

Final Report on Pilot Global Fuel Economy Initiative Study in Ethiopia 2012
67
d) SNNPR
The row data obtained from SNNPR does not include complete information on number of
stroke of motorcycle and tricycle. Thus, the number of stroke is ignored in the analysis.
The total number of motorcycles and tricycles in SNNPR classified in year of manufacture,
engine capacity and fuel type is given in Table 4.11. The number of vehicles in each
classification, such as engine capacity and type of fuel are given in percentage adjacent to
each group. Then, the distribution of vehicles in year of manufacture is given in each row.
For example, the number of vehicles having engine capacity less than 100 cc is equivalent to
39.7% of the total population. Among those vehicles having engine capacity less than 100 cc,
the share of motorcycles and tricycles manufactured from 2005-2009 is 81.4 %. Most
motorcycles
Table 4.10 Summary of motorcycles and tricycles distribution by year of manufacture in
Oromia region (Total number of motorcycles and tricycles: 4855)
Motorcycle and Tricycle
Classification
Year of Manufacture (%)
≤ 1990 1990-1994 1995-1999 2000-2004 2005-2009 2010-2011
Engine
capacity
(cc)
≤ 100 (38.6%) 0.2 0 0 0.7 66.6 32.5
101-150 (5.3%) 0 1.2 0.6 5.4 73.5 19.3
151-200 (50.2%) 0.1 0.1 0.6 1.8 72.8 24.6
201-400 (5.1%) 0 0 0 1.9 97.5 0.6
≥ 400 (0.9%) 0 0 0 0 96.3 3.7
Fuel
type
Gasoline (98.1%) 0.1 0.1 0.4 1.6 71.8 26.1
Diesel (1.9%) 1.7 0 0 1.7 78.3 18.3
and tricycles in SNNPR have low engine capacity (up to 150 cc) and only 0.9 % of the total
population have high engine capacity (≥ 400 cc). In addition, most motorcycles and tricycles
(99.4%), use gasoline fuel, as shown in Table 4.11.

Final Report on Pilot Global Fuel Economy Initiative Study in Ethiopia 2012
68
Table 4.11 Summary of motorcycles and tricycles distribution in SNNPR region (Total
number of motorcycles and tricycles: 15225)
Motorcycle and Tricycle
Classification
Year of Manufacture (%)
≤ 1990
1990-1994
1995-1999
2000-2004
2005-2009
2010-2011
Engine
capacity
(cc)
≤ 100 (39.7%) 0 0 0 0.9 81.4 17.7
101-150 (40.4%) 0 0 0 0.5 74.7 24.7
151-200 (18.7%) 0.4 0.2 1.3 15.3 69.9 12.9
201-400 (0.3%) 0 5.3 5.3 10.5 78.9 0
≥ 400 (0.9%) 0 0 0 0 100 0
Fuel
type
Gasoline (99.4%) 0.1 0.1 0.4 1.6 71.8 26.1
Diesel (0.6%) 1.7 0 0 1.7 78.3 18.3
e) Tigray
The row data obtained from Tigray region also does not include complete information on the
number of stroke of motorcycle and tricycle. Thus, the number of stroke is ignored in the
analysis.
The total number of motorcycles and tricycles in Tigray region is classified in year of
manufacture, engine capacity and fuel type as it is given in Table 4.12. The number of
vehicles in each classification, such as engine capacity and type of fuel are given in
percentage adjacent to each group. Then, the distribution of vehicles in year of manufacture is
given in each row. For example, the number of vehicles having engine capacity less than
151-200 cc is equivalent to 42.4 % of the total population. Among those vehicles having
engine capacity less than 151-200 cc, the share of motorcycles and tricycles manufactured
from 2005-2009 is 52.8 %. Most motorcycles and tricycles in Tigray region have medium
engine capacity (151-200 cc) and only 0.3 % of the total population have high engine
capacity (≥ 400 cc). This is considerably low. In addition, most motorcycles and tricycles
(91.1%), use gasoline fuel, as shown in Table 4.12.
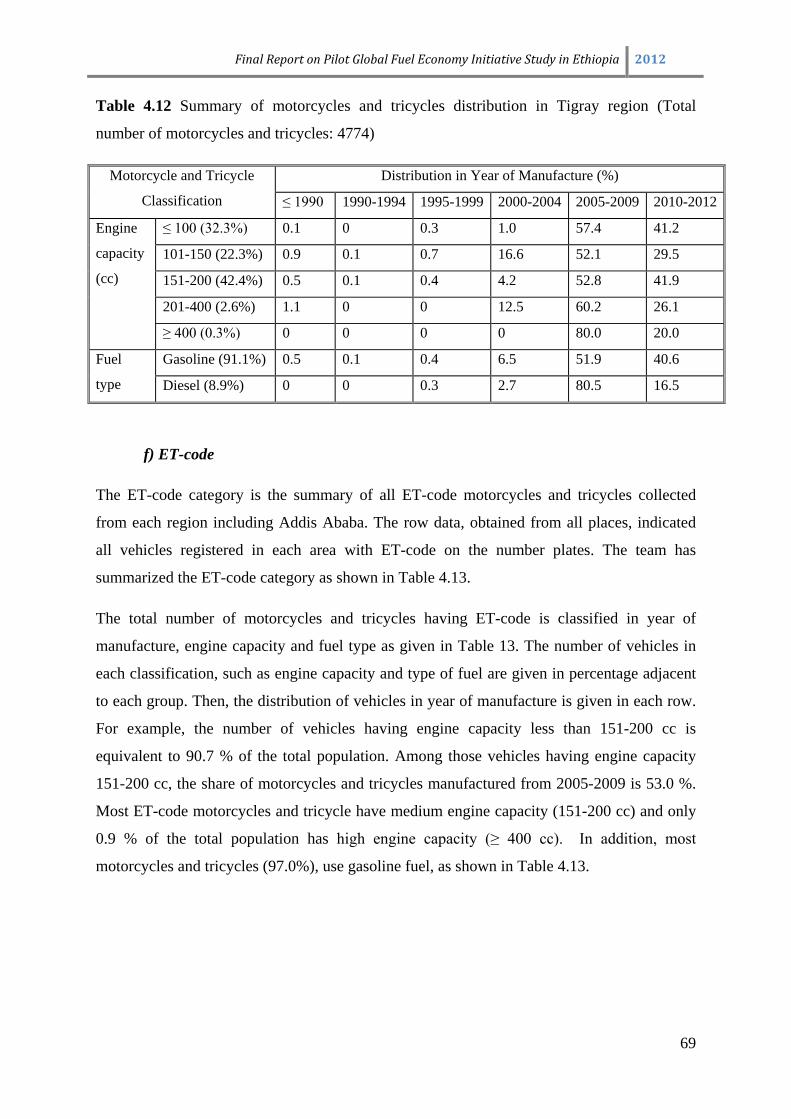
Final Report on Pilot Global Fuel Economy Initiative Study in Ethiopia 2012
69
Table 4.12 Summary of motorcycles and tricycles distribution in Tigray region (Total
number of motorcycles and tricycles: 4774)
Motorcycle and Tricycle
Classification
Distribution in Year of Manufacture (%)
≤ 1990 1990-1994 1995-1999 2000-2004 2005-2009 2010-2012
Engine
capacity
(cc)
≤ 100 (32.3%) 0.1 0 0.3 1.0 57.4 41.2
101-150 (22.3%) 0.9 0.1 0.7 16.6 52.1 29.5
151-200 (42.4%) 0.5 0.1 0.4 4.2 52.8 41.9
201-400 (2.6%) 1.1 0 0 12.5 60.2 26.1
≥ 400 (0.3%) 0 0 0 0 80.0 20.0
Fuel
type
Gasoline (91.1%) 0.5 0.1 0.4 6.5 51.9 40.6
Diesel (8.9%) 0 0 0.3 2.7 80.5 16.5
f) ET-code
The ET-code category is the summary of all ET-code motorcycles and tricycles collected
from each region including Addis Ababa. The row data, obtained from all places, indicated
all vehicles registered in each area with ET-code on the number plates. The team has
summarized the ET-code category as shown in Table 4.13.
The total number of motorcycles and tricycles having ET-code is classified in year of
manufacture, engine capacity and fuel type as given in Table 13. The number of vehicles in
each classification, such as engine capacity and type of fuel are given in percentage adjacent
to each group. Then, the distribution of vehicles in year of manufacture is given in each row.
For example, the number of vehicles having engine capacity less than 151-200 cc is
equivalent to 90.7 % of the total population. Among those vehicles having engine capacity
151-200 cc, the share of motorcycles and tricycles manufactured from 2005-2009 is 53.0 %.
Most ET-code motorcycles and tricycle have medium engine capacity (151-200 cc) and only
0.9 % of the total population has high engine capacity (≥ 400 cc). In addition, most
motorcycles and tricycles (97.0%), use gasoline fuel, as shown in Table 4.13.

Final Report on Pilot Global Fuel Economy Initiative Study in Ethiopia 2012
70
Table 4.13 Summary of ET-code motorcycles and tricycles distribution in Addis Ababa and some regions (Total number of motorcycles and tricycles: 3305)
Motorcycle and Tricycle
Classification
Year of Manufacture (%)
<=1990 1990-1994 1995-1999 2000-2004 2005-2009 2010-2011
Engine
capacity
(cc)
<=100 (0.5%) 12.5 0 0 37.5 50.0 0
101-150 (7.8%) 3.1 1.6 2.3 26.6 59.4 7.0
151-200 (90.7%) 0.7 0.5 1.9 23.1 53.0 20.8
201-400 (0.1%) 0 0 0 0 100 0
>=400 (0.9%) 0 0 28.6 14.3 57.1 0
Fuel
type
Gasoline (97.0%) 0.9 0.6 2.1 22.3 54.0 20.0
Diesel (3.0%) 2.0 0 2.0 57.1 38.8 0
4.3.2 Gasoline Vehicles
The summary of total fleet in some regions is given from Table 4.14-4.18.
a) Amhara Region
The summary of gasoline vehicles in Amhara region which was obtained from the raw data is
given in Table 4.14. The number of gasoline vehicles with medium engine capacity (1001-
1300 cc) is 37.5% of the total population. In addition, most vehicles are Saloon in comparison
with other body types in low and medium engine capacity range. The gasoline vehicle
distribution in year of manufacture is also given in Table 4.14. The total number of gasoline
vehicles available in Amhara region that were manufactured after 2005 indicates 76.3 %.
This shows that most of the gasoline vehicles in Amhara region are relatively new.
Table 14 Gasoline vehicle distribution in Amhara region (Total number of vehicles: 3834)
Category Classification Body type (%) Saloon (53.0)
Minibus (31.2)
SUV (2.5)
Pickup (13.2)
Engine capacity
(cc)
≤ 1000 (3.8%) 61.5 16.9 9.2 12.3
1001- 1300 (37.5%) 88.5 5.9 2.6 3.0
1301 – 1800 (26.0%) 56.4 19.0 3.8 20.9
1801 – 2000 (32.3%) 7.8 71.4 0.9 19.9 ≥ 2001 (0.3%) 0.0 50.0 0 50.0
Year of
manufacture (G.C)
≤ 2004 (23.6%) 42.0 39.1 1.9 16.9 2005 -2009 (39.3%) 56.2 27.3 4.0 12.5 2010-2011 (37.2%) 57.4 30.2 1.2 11.2
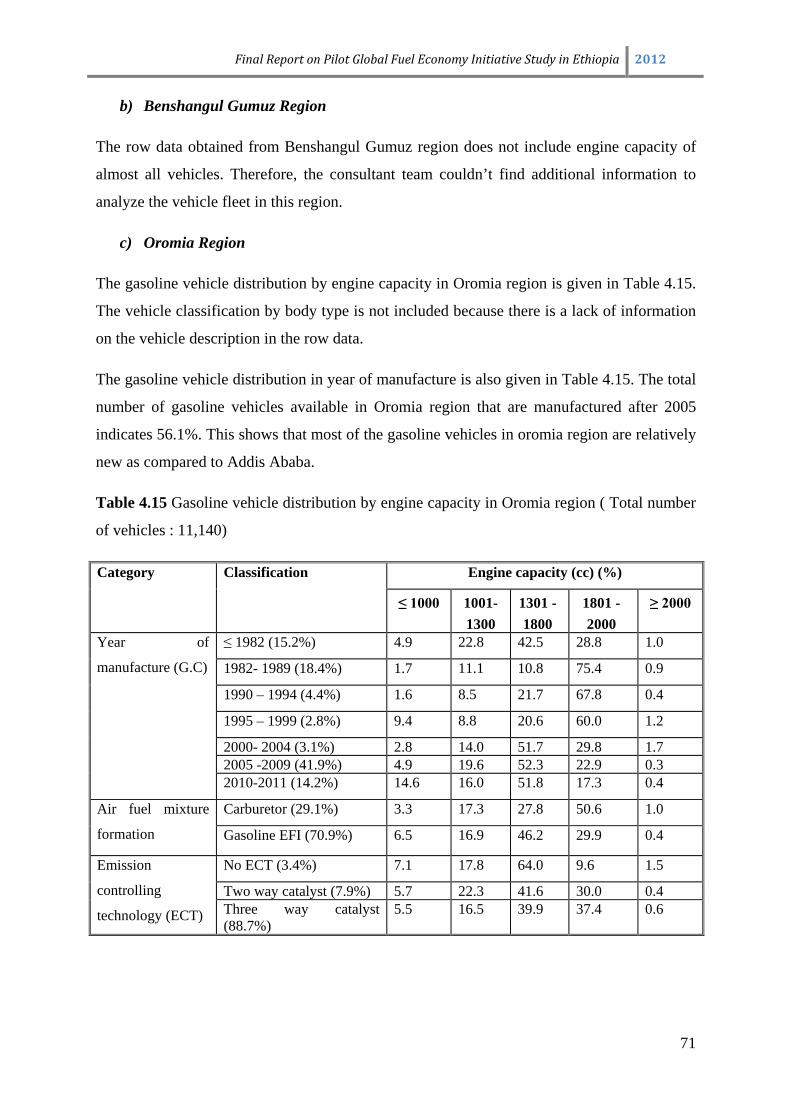
Final Report on Pilot Global Fuel Economy Initiative Study in Ethiopia 2012
71
b) Benshangul Gumuz Region
The row data obtained from Benshangul Gumuz region does not include engine capacity of
almost all vehicles. Therefore, the consultant team couldn’t find additional information to
analyze the vehicle fleet in this region.
c) Oromia Region
The gasoline vehicle distribution by engine capacity in Oromia region is given in Table 4.15.
The vehicle classification by body type is not included because there is a lack of information
on the vehicle description in the row data.
The gasoline vehicle distribution in year of manufacture is also given in Table 4.15. The total
number of gasoline vehicles available in Oromia region that are manufactured after 2005
indicates 56.1%. This shows that most of the gasoline vehicles in oromia region are relatively
new as compared to Addis Ababa.
Table 4.15 Gasoline vehicle distribution by engine capacity in Oromia region ( Total number
of vehicles : 11,140)
Category Classification Engine capacity (cc) (%)
≤ 1000 1001- 1300
1301 - 1800
1801 - 2000
≥ 2000
Year of
manufacture (G.C)
≤ 1982 (15.2%) 4.9 22.8 42.5 28.8 1.0
1982- 1989 (18.4%) 1.7 11.1 10.8 75.4 0.9
1990 – 1994 (4.4%) 1.6 8.5 21.7 67.8 0.4
1995 – 1999 (2.8%) 9.4 8.8 20.6 60.0 1.2
2000- 2004 (3.1%) 2.8 14.0 51.7 29.8 1.7 2005 -2009 (41.9%) 4.9 19.6 52.3 22.9 0.3 2010-2011 (14.2%) 14.6 16.0 51.8 17.3 0.4
Air fuel mixture
formation
Carburetor (29.1%) 3.3 17.3 27.8 50.6 1.0
Gasoline EFI (70.9%) 6.5 16.9 46.2 29.9 0.4
Emission
controlling
technology (ECT)
No ECT (3.4%) 7.1 17.8 64.0 9.6 1.5
Two way catalyst (7.9%) 5.7 22.3 41.6 30.0 0.4 Three way catalyst (88.7%)
5.5 16.5 39.9 37.4 0.6

Final Report on Pilot Global Fuel Economy Initiative Study in Ethiopia 2012
72
d) SNNPR
The gasoline vehicle distribution by engine capacity in SNNPR is given in Table 4.16. The
vehicle classification by body type is not included because there is a lack of information on
the vehicle description in the row data.
The gasoline vehicle distribution in year of manufacture is also given in Table 4.16. The total
number of gasoline vehicles available in SNNPR that were manufactured after 2005 indicates
24.5%. This shows that most of the gasoline vehicles in SNNPR are relatively old as
compared to Amhara and Oromia regions.
Table 4.16 Gasoline vehicle distribution by engine capacity in SNNPR (Total number of vehicles in each category: 2888)
Vehicle Category Vehicle Classification Engine capacity (cc) (%)
≤ 1000 1001- 1300
1301 - 1800
1801 - 2000
≥ 2000
Year of manufacture
(G.C)
≤ 1982 (19.7%) 5.2 39.6 28.1 27.1 0
1982- 1989 (36.5%) 0.6 26.4 14.0 59.0 0
1990 – 1994 (9.8%) 2.1 2.1 25.0 70.8 0
1995 – 1999 (6.6%) 3.1 15.6 3.1 78.1 0
2000- 2004 (2.9%) 21.4 35.7 7.1 35.7 0 2005 -2009 (18.4%) 6.7 40.0 24.4 25.6 3.3 2010-2011 (6.1%) 3.3 40.0 40.0 16.7 0
Air fuel mixture
formation
Carburetor (44.1) 0 50.0 37.5 12.5 0
Gasoline EFI (55.9) 9.3 29.6 31.5 29.6 0
Emission controlling
technology (ECT)
No ECT (1.6%) 3.1 29.1 18.8 48.4 0.7
Two way catalyst (11.1%) 2.8 29.8 20.9 46.5 0 Three way catalyst (87.3%) 4.4 29.3 20.1 45.1 1.1
e) Tigray Region
The summary of gasoline vehicles in Tigray region is given in Table 4.17. The number of
gasoline vehicles with high engine capacity (1801-200 cc) is 43.8% of the total population.
Most vehicles are Saloon in low and medium engine capacity range in comparison with other
body types. As the engine capacity range increases, the number of Minibuses increases
considerably.

Final Report on Pilot Global Fuel Economy Initiative Study in Ethiopia 2012
73
The gasoline vehicle distribution in year of manufacture is also given in Table 4.17. The total
number of gasoline vehicles available in Tigray region that are manufactured after 2005
indicates 13.4 %. This shows that most of the gasoline vehicles in Tigray region are relatively
old as compared to Amhara and Oromia regions.
The type of air fuel mixture formation systems in gasoline vehicles (conventional carburetor
or Electronic Fuel Injection (EFI)) is determined based on the year of manufacture. The
numbers of vehicles using conventional carburetor and EFI system are 54.1% and 45.9%,
respectively. This indicates that the number of vehicles with EFI is relatively smaller than the
conventional carburetor system.
Table 4.17 Gasoline vehicle distribution by body type in Tigray region (Total number of
vehicles: 1763)
Category Classification Body type (%)
Saloon (44.2)
Minibus (39.2)
SUV (2.6)
Pickup (14.0)
Engine capacity (cc) ≤ 1000 (4.0%) 63.8 17.0 6.4 12.8
1001- 1300 (35.8%) 88.9 7.6 1.4 2.1
1301 – 1800 (16.0%) 48.1 18.5 9.5 23.8
1801 – 2000 (43.8%) 4.6 74.5 0.8 20.1
≥2001 (0.4%) 20.0 60.0 0 20.0
Year of manufacture
(G.C)
≤ 1982 (19.3%) 61.8 22.4 2.2 13.6
1982- 1989 (49.4%) 31.2 51.5 1.0 16.3
1990 – 1994 (9.7%) 36.0 45.6 4.4 14.0
1995 – 1999 (4.3%) 37.3 37.3 2.0 23.5
2000- 2004 (3.8%) 62.2 20.0 6.7 11.1 2005 -2009 (5.8%) 56.5 27.5 10.1 5.8 2010-2011 (7.6%) 80.0 7.6 4.4 2.2
Type of air fuel
mixture formation
Carburetor (54.1%) 43.5 39.3 1.6 15.6
Gasoline EFI (45.9%) 45.0 39.1 3.9 12.0
Emission controlling
technology (ECT)
No ECT (4.6%) 83.3 7.4 1.9 7.4
Two way catalyst (8.6%) 63.4 23.8 3.0 9.9 Three way catalyst (86.9%) 40.3 42.4 2.6 14.7
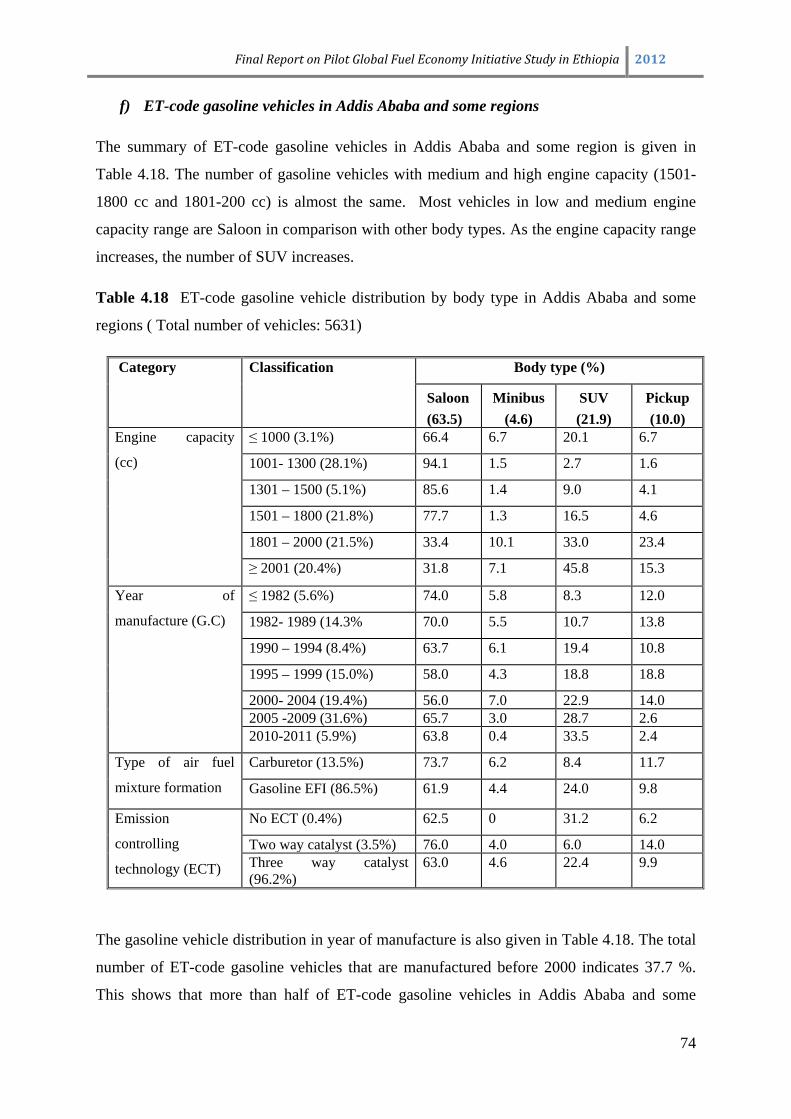
Final Report on Pilot Global Fuel Economy Initiative Study in Ethiopia 2012
74
f) ET-code gasoline vehicles in Addis Ababa and some regions
The summary of ET-code gasoline vehicles in Addis Ababa and some region is given in
Table 4.18. The number of gasoline vehicles with medium and high engine capacity (1501-
1800 cc and 1801-200 cc) is almost the same. Most vehicles in low and medium engine
capacity range are Saloon in comparison with other body types. As the engine capacity range
increases, the number of SUV increases.
Table 4.18 ET-code gasoline vehicle distribution by body type in Addis Ababa and some
regions ( Total number of vehicles: 5631)
Category Classification Body type (%)
Saloon (63.5)
Minibus (4.6)
SUV (21.9)
Pickup (10.0)
Engine capacity
(cc)
≤ 1000 (3.1%) 66.4 6.7 20.1 6.7
1001- 1300 (28.1%) 94.1 1.5 2.7 1.6
1301 – 1500 (5.1%) 85.6 1.4 9.0 4.1
1501 – 1800 (21.8%) 77.7 1.3 16.5 4.6
1801 – 2000 (21.5%) 33.4 10.1 33.0 23.4
≥ 2001 (20.4%) 31.8 7.1 45.8 15.3
Year of
manufacture (G.C)
≤ 1982 (5.6%) 74.0 5.8 8.3 12.0
1982- 1989 (14.3% 70.0 5.5 10.7 13.8
1990 – 1994 (8.4%) 63.7 6.1 19.4 10.8
1995 – 1999 (15.0%) 58.0 4.3 18.8 18.8
2000- 2004 (19.4%) 56.0 7.0 22.9 14.0 2005 -2009 (31.6%) 65.7 3.0 28.7 2.6 2010-2011 (5.9%) 63.8 0.4 33.5 2.4
Type of air fuel
mixture formation
Carburetor (13.5%) 73.7 6.2 8.4 11.7
Gasoline EFI (86.5%) 61.9 4.4 24.0 9.8
Emission
controlling
technology (ECT)
No ECT (0.4%) 62.5 0 31.2 6.2
Two way catalyst (3.5%) 76.0 4.0 6.0 14.0 Three way catalyst (96.2%)
63.0 4.6 22.4 9.9
The gasoline vehicle distribution in year of manufacture is also given in Table 4.18. The total
number of ET-code gasoline vehicles that are manufactured before 2000 indicates 37.7 %.
This shows that more than half of ET-code gasoline vehicles in Addis Ababa and some

Final Report on Pilot Global Fuel Economy Initiative Study in Ethiopia 2012
75
regions are relatively new. Furthermore, since most vehicles are of the new type designs, the
number of vehicles with EFI is relatively higher than the conventional carburetor system. If
ET-code vehicles are periodically maintained and conditioned, they will be fuel efficient.
4.3.3 Diesel Vehicles
This section explains the diesel vehicle stock analysis of some regional governments that
includes Amahra, Benshangul Gumuz, Oromia, SNNPR and Tigray regions. In this study,
diesel vehicles are categorized into three groups as light weight vehicles, heavy weight
vehicles (cargo) and busses. Due to incomplete information (vehicle description and gross
weight) in the raw data, all diesel vehicles (light weight, heavy weight and buses) are treated
together in some regions such as Amhara, Benshagul Gumuz, Oromia and SNNPR.
a) Amhara Region
The summary of diesel vehicle distribution in Amhara region is given in Table 4.19. All
diesel vehicles in Amhara region are grouped by engine capacity and year of manufacture.
The engine capacity and year of manufacture are classified into four and three groups,
respectively. The diesel vehicles manufactured before 2004 are in one group because the raw
data from Amhara region does not show the respective year of manufacture of the vehicles.
The number of diesel vehicles available in Amhara region that are manufactured after 2005 is
70.8%. In addition, most vehicles manufactured in various periods have engine capacity of
2500-4000 cc as shown in Table 4.19.
Table 4.19 Diesel vehicles distribution by engine capacity in Amhara region (Total number
of vehicles: 10268)
Vehicle
Category
Vehicle
Classification
Engine capacity (cc) (%)
≤ 1800 1801- 2500 2500 - 4000 ≥ 4000 Year of
manufacture
(G.C)
≤ 2004 (29.2%) 2.8 17.2 44.1 35.9
2005- 2009 (44.0%) 3.8 7.3 49.3 39.5
2010 – 2012 (26.8%) 0.8 9.3 40.4 49.5
b) Benshangul Gumuz Region
The raw data of diesel vehicles obtained from Benshangul Gumuz region have relatively
more information in comparison with gasoline vehicles. However, many diesel vehicles are

Final Report on Pilot Global Fuel Economy Initiative Study in Ethiopia 2012
76
ignored in the data cleaning process due to unknown engine capacity and year of
manufacture.
The summary of diesel vehicle distribution in Benshangul Gumuz region is given in Table
4.20. The number of diesel vehicles available in Benshangul Gumuz region that are
manufactured after 2000 indicates 64.3%. These groups of vehicles are of the new type. This
clearly shows that the type of fuel system and the emission controlling technologies are
modern type that helps to minimize fuel consumption and emission. In addition, most
vehicles manufactured in different periods have engine capacity range of 2500-4000 cc which
is similar to diesel vehicles available in Amhara region.
Table 4.20 Diesel vehicles distribution by engine capacity in Benshagul Gumuz region (Total
number of vehicles: 334)
Category Classification Engine capacity (cc) (%)
≤ 1800 1801- 2500 2500 - 4000 ≥ 4000
Year of manufacture
(G.C)
≤ 1982 (1.8%) 0 0 0 100
1982- 1989 (10.7%) 16.7 16.7 66.7 0
1990 – 1994(1.8%) 0 0 100 0
1995 – 1999 (21.4%) 0 16.7 33.3 50.0
2000- 2004 (26.8%) 0 13.3 26.7 60.0 2005 -2009 (37.5%) 4.8 0 47.6 47.6
Type of fuel system Mechanical Injection(35.7%) 5.0 15.0 45.0 35.0
Electronic Injection(64.3%) 2.8 5.6 38.9 52.8
Emission controlling
technology (ECT)
No ECT (10.7%) 16.7 16.7 50.0 16.7
DOC (25.0%) 0 14.3 42.9 42.9 DPF (64.3%) 2.8 5.6 38.9 52.8
c) Oromia Region
The summary of diesel vehicle distribution in Oromia region is given in Table 4.21. The
number of diesel vehicles available in Oromia region that were manufactured after 2000 is
54.1% of the total population. This shows that almost half of the diesel vehicles are of the
new type designs. In addition, most vehicles manufactured from 1990-2004 have engine
capacity of 2500-4000 cc. On the other hand, many vehicles manufactured after 2004 have
higher engine capacity (≥ 4000 cc).

Final Report on Pilot Global Fuel Economy Initiative Study in Ethiopia 2012
77
Table 4.21 Diesel vehicles distribution by engine capacity in Oromia region (Total number of
vehicles: 17,077)
Category Classification Engine capacity (cc) (%)
≤ 1800 1801- 2500 2500 - 4000 ≥ 4000 Year of manufacture
(G.C)
≤ 1982 (7.0%) 3.9 9.4 10.6 76.0
1982- 1989 (7.7%) 2.2 37.7 30.4 29.6
1990 – 1994 (8.8%) 1.0 21.0 64.8 13.2
1995 – 1999 (22.4%) 1.2 10.5 74.4 13.8
2000- 2004 (33.4%) 1.0 10.5 53.8 34.2 2005 -2009 (18.1%) 2.9 18.6 11.9 66.5 2010-2011 (2.6%) 3.3 30.0 19.3 47.3
Type of fuel system Mechanical Injection (45.9%) 1.8 16.9 55.4 25.9
Electronic Injection (54.1%) 1.7 14.2 38.1 46.0
Emission controlling
technology (ECT)
No ECT (11.1%) 3.6 21.4 14.3 60.7
DOC (34.8%) 1.2 15.5 68.6 14.3 DPF (54.1%) 1.7 14.2 38.1 46.0
d) SNNPR
The summary of diesel vehicle distribution in SNNPR is given in Table 4.22. The diesel
vehicle distribution in SNNPR have similar pattern with Oromia region as far as engine
capacity and year of manufacture are concerned. The number of diesel vehicles available in
SNNPR that are manufactured after 2000 indicates 69.2%. These groups of vehicles are of
the new type designs. In addition, most vehicles manufactured from 1982-1999 have engine
capacity of 2500-4000 cc. On the other hand, many vehicles manufactured after 2004 have
higher engine capacity (≥ 4000 cc).

Final Report on Pilot Global Fuel Economy Initiative Study in Ethiopia 2012
78
Table 4.22 Diesel vehicles distribution by engine capacity in SNNPR region (Total number
of vehicles: 5663)
Category .Classification Engine capacity (cc) (%)
≤ 1800 1801- 2500 2500 - 4000 ≥ 4000 Year of manufacture
(G.C)
≤ 1982 (2.1%) 2.5 8.8 26.2 62.5
1982- 1989 (4.6%) 2.2 30.2 46.9 20.7
1990 – 1994 (7.6%) 2.7 16.4 59.6 21.2
1995 – 1999 (26.4%) 0.5 6.4 66.4 26.7
2000- 2004 (33.4%) 0.3 3.6 40.2 55.9 2005 -2009 (22.1%) 0.7 8.3 28.8 62.1 2010-2011 (3.7%) 3.5 14.6 36.8 45.1
Type of fuel system Mechanical Injection (40.2%) 1.2 11.1 60.9 26.8
Electronic Injection (59.3%) 0.7 6.1 35.7 57.5
Emission controlling
technology (ECT)
No ECT (4.2%) 2.5 19.8 32.7 45.1
DOC (36.5%) 1.1 10.1 64.1 24.7 DPF (59.3%) 0.7 6.1 35.7 57.5
e) Tigray Region
The summary of diesel vehicle distribution in Tigray region for each group is given in Table
4.23-4.25. Table 4.23 shows that the Saloon vehicles cover 59.4% in comparison with other
body type vehicles in the low engine capacity range (≤1800 cc). In the medium engine
capacity range, there is no Saloon vehicles but the number of Minibus, SUV and Pickup
vehicles increases considerably. Furthermore, the SUV vehicles are 94.9% in the high engine
capacity range.
The total number of light duty diesel vehicles available in Tigray that are manufactured
before 2000 are 49.4 %. This shows that almost half of the light weight diesel vehicles are
relatively old that could consume more fuel during normal operation.
The type of air fuel mixture formation systems in diesel vehicles (Mechanical Injection or
Electronic Injection) is determined based on the year of manufacture. The numbers of
vehicles using conventional mechanical injection and electronic injection system are 49.4%
and 50.6%, respectively.

Final Report on Pilot Global Fuel Economy Initiative Study in Ethiopia 2012
79
There have been two types of emission controlling technologies introduced in diesel vehicles
called Diesel Oxidation Catalyst (DOC) and Diesel Particulate Filter (DPF). Table 4.23 also
includes the total vehicle distribution in line with emission control technologies. Many
vehicles (93.6%) use either DOC or DPF. However, evidences show that emission controlling
technologies are dismantled from many vehicles available in Ethiopia because there are no
rules and regulations that enforce to use them and the fuel quality (high sulfur diesel) is a
factor that could damage the emission controlling technology too.
Table 4.23 Light duty diesel vehicles distribution by body type in Tigray region ( Total
number of vehicles:3852)
Category Classification Body type (%)
Saloon (0.7)
Minibus (47.8)
SUV (18.3)
Pickup (33.2)
Engine capacity (cc) ≤ 1800 (1.1%) 59.4 6.2 9.4 25.0
1801- 2500 (18.1%) 0 41.4 12.5 46.2
2501 – 4000 (67.9%) 0 58.5 5.6 35.9
≥ 4001 (12.8%) 0 3.8 94.9 1.4
Year of manufacture
(G.C)
≤ 1982 (1.5%) 4.8 33.3 52..4 9.5
1982- 1989 (8.3%) 3.3 54.0 32.6 10.0
1990 – 1994 (10.1%) 0.7 44.3 29.2 25.8
1995 – 2000 (29.5%) 0.1 61.7 15.4 22.8
2000- 2004 (33.6%) 0.1 51.6 14.5 33.8 2005 -2009 (11.5%) 0.6 20.3 14.5 64.5 2010-2011 (5.6%) 1.9 8.7 14.9 74.5
Type of fuel system Mechanical injection (49.4%) 0.9 56.0 22.2 20.9
Electronic injection (50.6%) 0.4 39.8 14.5 45.3
Emission controlling
technology (ECT)
No ETC (6.4%) 3.8 55.7 32.4 8.1
DOC (43.0%) 0.5 56.1 20.7 22.8 DPF (50.6%) 0.4 39.8 14.5 45.3
Table 4.24 shows the cargo trucks distribution in gross weight. In low and medium engine
capacity ranges, the number of light duty trucks is considerably high. On the other hand, in
the high engine capacity range (≥5501 cc), there is a high number of medium duty trucks. As
it is shown in the Table 4.24, the number of cargo trucks manufactured after 2000 is 49.8 %

Final Report on Pilot Global Fuel Economy Initiative Study in Ethiopia 2012
80
of the total population. This indicates that half of the trucks available in Tigray are new types
that include improved technology for fuel system and emission control.
Table 4.24 Cargo trucks distribution by gross weight in Tigray region (Total number of
vehicles 829)
Category Classification Vehicle distribution by gross weight (%)
Light duty truck
(0.65 %)
Medium duty truck
(47.7 %)
Heavy duty truck \
(33.19%) Engine capacity (cc) ≤ 4000 (39.0%) 44.6 4.1 51.2
4001- 5500 (59.5%) 46.1 8.4 45.5
≥ 5501 (1.5%) 11.1 88.9 0
Year of manufacture
(G.C)
<= 1982 (5.0%) 12.9 32.3 54.8
1982- 1989 (7.6%) 27.7 8.5 63.8
1990 – 1994 (15.6%) 52.6 1.0 46.4
1995 – 2000 (21.9%) 30.9 4.4 64.7
2000- 2004 (29.0%) 55.0 9.4 35.6 2005 -2009 (18.9%) 52.1 9.4 38.5 2010-2011 (1.9%) 75.0 0 25
Type of fuel system Mechanical injection (50.2%) 35.4 6.8 57.9
Electronic injection (49.8%) 54.7 9.1 36.2
Emission controlling
technology (ECT)
No ETC (9.0%) 17.9 25.0 57.1
DOC (41.1%) 39.2 2.7 58.0 DPF (49.8%) 54.7 9.1 36.2
Table 4.25 shows the distribution of diesel buses in various categories such as engine
capacity, year of manufacture, type of fuel system and emission controlling technology.
Many buses have high engine capacity (≥ 4000 cc). The number of buses manufactured after
2000 is 76.1% of the total population. This shows that the use of new buses for transportation
contributes towards better fuel efficiency. Since many buses are of the new type designs, their
fuel systems and emission controlling technology include the modern system.

Final Report on Pilot Global Fuel Economy Initiative Study in Ethiopia 2012
81
Table 4.25 Distribution of buses in various categories in Tigray region ( Total number of buses: 834)
Vehicle Category Vehicle Classification Bus (%)
Engine capacity (cc) 2501-4000 20.5
≥ 4001 79.5
Year of manufacture (G.C) ≤ 1982 2.1
1982- 1989 2.4
1990 - 1994 7.4
1995 - 2000 12.0
2000- 2004 44.6 2005 -2009 27.7 2010-2011 3.8
Type of fuel system Mechanical injection 23.9
Electronic injection 76.1
Emission controlling
technology (ECT)
No ECT 3.8
Diesel Oxidation Catalyst (DOC) 20.0 Diesel Particulate Filter (DPF) 76.1
f) ET-code in Addis Ababa and some Regions
The summary of diesel vehicle distribution in Tigray region for each group is given in Tables
4.26-4.28. Table 4.26 shows that in the low engine capacity range (≤1800 cc), the Saloon
vehicles cover 70.7% compared to other body type vehicles. In the medium engine capacity
range, there is no Saloon vehicle but the number of Minibus, SUV and Pickup vehicles
increases considerably. Furthermore, the SUV vehicles are 94.8 % in the high engine capacity
range.
The total number of light duty diesel vehicles available in Addis Ababa that were
manufactured after 2000 indicates 34.1 %. The type of air fuel mixture formation systems in
diesel vehicles (Mechanical Injection or Electronic Injection) is determined based on the year
of manufacture. The numbers of vehicles using conventional mechanical injection and
electronic injection system are 34.1% and 65.9%, respectively.
There have been two types of emission controlling technologies introduced in diesel vehicles
called Diesel Oxidation Catalyst (DOC) and Diesel Particulate Filter (DPF). Table 4.23 also
includes the total vehicle distribution in line with emission control technologies. Many

Final Report on Pilot Global Fuel Economy Initiative Study in Ethiopia 2012
82
vehicles (95.5%) use either DOC or DPF. However, evidences show that emission controlling
technologies are dismantled from many vehicles available in Ethiopia because there are no
rules and regulations that enforce to use them and the fuel quality (high sulfur diesel) is a
factor that could damage the emission controlling technology too.
Table 4.26 ET-code light weight diesel vehicles distribution by body type ( Total number of
vehicles: 12756)
Category Classification Body type (%)
Saloon (2.3)
Minibus (3.9)
SUV
(53.5)
Pickup (40.3)
Engine capacity (cc) ≤ 1800 (3.2%) 70.7 2.8 10.1 16.5
1801- 2500 (19.8%) 0 8.8 26.5 64.7
2501 – 4000 (39.4%) 0 1.8 31.4 66.8
≥ 4001 (37.5%) 0 3.5 94.8 1.7
Year of manufacture
(G.C)
≤ 1982 (1.5%) 21.7 12.0 41.0 25.3
1982- 1989 (9.0%) 7.5 6.4 50.6 35.5
1990 – 1994 (7.6%) 5.3 6.3 66.2 22.2
1995 – 2000 (16.1%) 2.0 2.6 61.2 34.2
2000- 2004 (22.9%) 1.9 2.4 50.8 44.9 2005 -2009 (32.0%) 0.4 3.3 50.5 45.8 2010-2011 (11.0%) 0 5.5 52.4 42.1
Type of fuel system Mechanical injection (34.1%) 5.0 4.9 58.6 31.5
Electronic injection (65.9) 0.9 3.4 50.9 44.9
Emission controlling
technology (ECT)
No ECT (4.5%) 17.3 11.6 42.0 29.1
DOC (29.6%) 3.2 3.8 61.1 31.9 DPF (65.9%) 0.9 3.4 50.9 44.9
Table 4.27 shows cargo trucks distribution in gross weight. In low and medium engine
capacity ranges, the number of light duty trucks is considerably high. On the other hand, in
the high engine capacity range (≥5501 cc), there are high number of medium duty trucks. As
it is shown in the Table 4.27, the number of heavy duty trucks manufactured after 2000 is
51.4 % of the total population. This indicates that most trucks available in Addis Ababa are
new types that include improved technology for fuel system and emission control.

Final Report on Pilot Global Fuel Economy Initiative Study in Ethiopia 2012
83
Table 27 ET-code cargo trucks distribution by gross weight (Total number of vehicles:
24381)
Category Classification Vehicle classification by gross weight (%)
Light duty truck (1000-6350 Kg)
Medium duty truck (6351-11793 Kg)
Heavy duty truck (11784-40000 Kg)
Engine capacity (cc) ≤ 4000 (6.7%) 50.0 7.9 42.1
4001- 5500 (4.0%) 64.4 4.9 30.7
≥ 5501 (89.3%) 44.5 0.9 54.6
Year of manufacture
(G.C)
≤ 1982 (13.9%) 78.8 1.5 19.9
1982- 1989 (15.1%) 67.3 2.1 30.6
1990 – 1994 (9.4%) 51.2 1.1 47.8
1995 – 2000 (10.3%) 57.0 0.8 42.1
2000- 2004 (7.1%) 40.8 4.2 55.0 2005 -2009 (34.2%) 28.3 1.2 70.4 2010-2011 (10.1%) 13.2 1.0 85.8
Type of fuel system Mechanical injection (48.6%) 65.5 1.6 32.9
Electronic injection (51.4%) 27.2 1.7 71.7
Emission controlling
technology (ECT)
No ETC (21.3%) 77.1 1.9 21.0
DOC (27.3%) 56.5 1.4 42.1 DPF (51.4%) 27.2 1.7 71.1
Table 4.28 shows the distribution of diesel buses in various categories such as engine
capacity, year of manufacture, type of fuel system and emission controlling technology. ET-
code buses are used for mass transportation. Many buses have high engine capacity (≥ 4000
cc). The number of buses manufactured after 2000 are 28.0% of the total population. This
shows that many ET-code buses are old types that could consume more fuel in normal
condition.

Final Report on Pilot Global Fuel Economy Initiative Study in Ethiopia 2012
84
Table 4.28 ET-code buses distribution in various categories (Total number of buses: 2080)
Vehicle Category Vehicle Classification Bus (%)
Engine capacity (cc) 2501-4000 8.2
≥ 4001 91.8
Year of manufacture (G.C) ≤ 1982 14.4
1982- 1989 20.0
1990 - 1994 7.7
1995 - 2000 30.2
2000- 2004 8.1 2005 -2009 13.3 2010-2011 6.6
Type of fuel system Mechanical injection 72.0
Electronic injection 28.0
Emission controlling
technology (ECT)
No ECT 26.7
Diesel Oxidation Catalyst (DOC) 45.3 Diesel Particulate Filter (DPF) 28.0
4.4 Impact of Vehicle Stock Composition on Fuel Economy
4.4.1 Motorcycles and Tricycles
a) Engine capacity vs fuel economy
Figure 4.1 shows the distribution of motorcycles and tricycles by engine capacity in number
in Ethiopia. Most motorcycles and tricycles have medium engine capacity (151-200 cc).
These groups of motorcycles and tricycles contribute towards better fuel consumption
compared to high engine capacity.
Besides the engine capacity, the number of stroke is an important factor that should be
considered for fuel consumption. The data collected from some regions does not show the
type of stroke that the motorcycles and tricycles have. On the other hand, most motorcycles
and tricycles in Addis Ababa use 2-stroke cycle gasoline engines that contribute towards high
fuel consumption.

Final Report on Pilot Global Fuel Economy Initiative Study in Ethiopia 2012
85
Fig 4.1 Summary of motorcycles and tricycles distribution in Ethiopia by engine capacity
b) Year of manufacture vs fuel economy
Figure 4.2 shows the distribution of motorcycles and tricycles by year of manufacture in
number in Ethiopia. Many motorcycles and tricycles available in Ethiopia were manufactured
in the years 2005-2009. This is due to the introduction of new tricycles across the country to
use them for transportation. Generally, the use of new vehicles with appropriate technology
contributes towards better fuel economy. On the other hand, few motorcycles and tricycles
were manufactured before 1989. These groups are very old and consume more fuel if they are
not maintained periodically.
0100020003000400050006000700080009000
10000
<= 100 101 - 150 151 - 200 201 - 400 >=401
Engine Capacity

Final Report on Pilot Global Fuel Economy Initiative Study in Ethiopia 2012
86
Fig 4.2 Distribution of motorcycles and tricycles in Ethiopia by year of manufacture
c) Fuel type vs fuel economy
Figure 4.3 shows the distribution of motorcycles and tricycles by fuel type in number in
Ethiopia. Almost all motorcycles and tricycles across the country use gasoline fuel. Since
diesel vehicles are fuel efficient, the use of 2-stroke cycle gasoline engines results in more
fuel consumption. It is recommended to introduce more 4-stroke cycle gasoline engines,
although they are relatively expensive.
Fig 4.3 Distribution of motorcycles and tricycles by fuel type
02000400060008000
100001200014000
<= 1989 1990 - 1994 1995 - 1999 2000 - 2004 2005-2009 2010 & 2011
Year of Manufacturing
0
5000
10000
15000
20000
Diesel Gasoline
Fuel Type

Final Report on Pilot Global Fuel Economy Initiative Study in Ethiopia 2012
87
4.4.2 Gasoline Vehicles
a) Engine capacity vs fuel economy
Figure 4.4 shows the distribution of gasoline vehicles by engine capacity in number in
Ethiopia. Most gasoline vehicles in Addis Ababa and some regions have medium engine
capacity (1001-1300 cc). Since gasoline vehicles are not fuel efficient as compared to diesel
vehicles, high population of medium engine capacity gasoline vehicles contributes to low fuel
consumption and better fuel economy.
Fig 4.4 Distribution of gasoline vehicles by engine capacity
b) Year of manufacture vs fuel economy
Figure4.5 shows the distribution of gasoline vehicles in Ethiopia by year of manufacture in
number. Many gasoline vehicles available in Ethiopia are manufactured during the period
1982-1989 which is more than 23 years ago. Unless these vehicles are properly maintained
and their engines are overhauled, they are not fuel efficient. Moreover, the fuel efficiency
mainly depends on the type of air fuel mixture formation.
0
10000
20000
30000
40000
50000
60000
<= 1000 1001- 1300 1301 - 1800 1801 - 2000 >=2001
Engine Capacity
Number of Gasoline Vehicles by Engine Capacity

Final Report on Pilot Global Fuel Economy Initiative Study in Ethiopia 2012
88
Figure 4. 5 Summary of gasoline vehicles distribution by year of manufacture
c) Type of air-fuel mixture formation vs fuel economy
Figure4.6 shows the distribution of gasoline vehicles in Ethiopia by type of air fuel mixture
formation in number. The number of gasoline vehicles with Electronic Fuel Injection system
(EFI) is greater than that of the conventional carburetor systems. This is recommended for
better fuel efficiency.
4.4.3 Diesel Vehicles
Diesel vehicles (generally comprised of light duty vehicles, heavy trucks (cargo) and buses)
are more fuel-efficient compared to petrol vehicles, and that emit less CO2. There are other
factors that contribute to high fuel consumption such as body type, engine capacity, year of
manufacture and type of fuel injection systems. As it is discussed in the previous sections, the
raw data collected from regional governments does not have complete information to analyze
the influence of various factors on fuel economy. Therefore, this section only addresses the
effect of year of manufacture and fuel system on fuel economy.
0
5000
10000
15000
20000
25000
30000
35000
40000
<= 1982 1982 - 1989 1990-1994 1995-1999 2000-2004 2005-2009 2010 &2011
Year of manufacturing

Final Report on Pilot Global Fuel Economy Initiative Study in Ethiopia 2012
89
Figure 4.6 Summary of gasoline vehicles distribution by type of air fuel mixture
formation
a) Year of manufacture vs fuel economy
Figure 4.7 shows the distribution of diesel vehicles in Ethiopia by year of manufacture. The
number of new diesel vehicles imported to Ethiopia increases gradually from time to time.
Most diesel vehicles available in Ethiopia were manufactured in the range of 2005-2009. This
indicates that the old heavy duty trucks and busses are being replaced by the new ones. This
trend will encourage the use of new diesel vehicles for better fuel economy.
Figure4. 7 Summary of diesel vehicles distribution by year of manufacture
010000200003000040000500006000070000
Carburator Gasoline EFI
Type of air fuel mixture formation
0
5000
10000
15000
20000
25000
30000
35000
40000
<= 1982 1982 -1989
1990-1994 1995-1999 2000-2004 2005-2009 2010 &2011
Year of Manufacturing

Final Report on Pilot Global Fuel Economy Initiative Study in Ethiopia 2012
90
b) Type of air-fuel mixture formation vs fuel economy
Figure 4.8 shows the distribution of diesel vehicles in Ethiopia by type of fuel system. The
number of diesel vehicles with Electronic Injection system (EI) is twice greater than that of
the conventional Mechanical Injection systems. Since most diesel vehicles were
manufactured after 2005, they are equipped with electronic injection system. Therefore, the
use of more diesel vehicles with Electronic Injection system improves fuel economy.
Figure 4. 8 Summary of diesel vehicles distribution by type of fuel system
4800050000520005400056000580006000062000
Diesel Electronic Diesel Mechanical Injection
Type of fuel system

Final Report on Pilot Global Fuel Economy Initiative Study in Ethiopia 2012
91
5. FUEL QUALITY REVIEW AND IMPROVEMENT OF FUEL STANDARD
5.1 Fuel Utilization Policy and Consumption
The economic development of a country along with infrastructure expansion and shifts to
industrialization is exacerbating the demand for fuel. For instance, Ethiopia imports fuel on
average that costs about 768 million USD per annum and this covers 77% of the total export
earnings (MM and E, 2007). The demand is expected to increase with the economic and
population growth of the country. The economic changes are associated with changes in
economic sectors such as transport sector which uses only commercial energy such as
gasoline and diesel as opposed to noncommercial forms of energy. Therefore, the share of
commercial energy in the development process will increase because of rapid growth of
inherently modern fuel using sectors such as transport sector of the economy (Mosse, 2002).
The transport energy policy of Ethiopia emphasizes ensuring efficient utilization of energy
and partially substituting by local products, to save scarce foreign exchange to achieve
sustained and continued economic and social development of the country (MW and E, 2010).
The policy emphasis is that the energy must be friendly to the environment through adopting
different technology intervention to reduce petroleum fuel consumption products in the
transport sector and substituting wherever possible to new non petroleum fuels.
5.1.1 Diesel and Gasoline Consumption in Ethiopia from (2006-2012)
Petroleum is one of the valuable commodities in the world. It is used to generate power to
drive the science-invented tools of Transport, Industry, Agriculture and Communication that
touches every aspect of our daily life (World Bank, 1999). The level of petroleum
consumption is directly related to economic development and the number of population
(Mosse, 2002). The data of the Ethiopian Petroleum Enterprise shows that Ethiopia consumes
petroleum products, gasoline and diesel, which has were increased during the year 2006 -
2012 (Table 5.1). During these years diesel had the largest share compared to gasoline. This
shows that diesel consuming transport activities has constituted the largest share and increase.

Final Report on Pilot Global Fuel Economy Initiative Study in Ethiopia 2012
92
In these years, gasoline consumption increased by 27.9%, whereas that of diesel was 35.61%.
During all those years, diesel oil has been the dominant fuel demand of the total consumption
(Table 5.1 and Figure 5.1). As the economic growth of the country is expected to continue
even at higher rate, the demand for gasoline and diesel is expected to continue rising rapidly.
Table 5.1 Petroleum product sales (consumption) quantity in metric ton
Product
type
2006 2007 2008 2009 2010 2011 2012
Diesel 851,381 927,939 1,107,193 1,199,673 1,250,641 1,154,560 1,232,894
Gasoline 147,514 144,637 143,024 149,966 162,070 151,634 154,238
Source: Ethiopian Petroleum Supply Enterprise
Figure 5.1 Trend of gasoline and diesel consumption
5.1.2 The Biofuel Development and Utilization Strategy in Ethiopia
In order to ensure the countries continued development program and the national fuel
security, it is important to increase fuel utilization and substitution by locally produced fuels
0
200000
400000
600000
800000
1000000
1200000
1400000
2005 2006 2007 2008 2009 2010 2011 2012 2013
cons
umpt
ion
of g
asol
inea
nd d
iese
l in
Mt
Year
diesel
gasoline

Final Report on Pilot Global Fuel Economy Initiative Study in Ethiopia 2012
93
such as biofuel. The “Ethiopian Biofuel Development and Utilization Strategy’’ is targeted
for supply of fuels from locally produced biofuel with the objective of the strategy being to
ensure the production of biofuel without affecting food self sufficiency, enable import
substitution and improve balance of payment (MM and E, 2007).
Fuel demand is getting higher while the supply is getting less. The oil price increase, which is
the result of the mismatch between the demand and supply, is becoming a barrier for stable
and sustainable economic development for many countries, particularly for developing
countries like Ethiopia. In order to address these fossil fuel constraint shortage realities, the
Ethiopian government has formulated a bio-fuel strategy for the energy sector. The strategy is
expected to satisfy the demand for fuel by undertaking projects that accelerate bio-fuel
development activities in the country. This will enable the country to withstand the
challenges of unexpected fossil fuel price increase, to save foreign earnings, and even earn
produce foreign currency (MM and E, 2007).
The biofuel development strategy paper (2007) by ministry of water resources and energy
indicates that the production of ethanol in the medium and long term development can grow
to 1 billion liters (1 million m3) through agro-processing industry integrated development, in
particular sugar industry, by cultivating 700,000 ha suitable land for sugar cane plantation.
The sugar corporation agency of Ethiopia planned to produce 128,165,000 liters (128,165m3)
of ethanol from four sugar industries namely Fincha, Metehara, Wonji and Tendaho at the
end of 2012 though Tendaho sugar factory has not yet started production (Guta, 2012).
Local production and utilization of ethanol has already been started as a blending to gasoline
(B5) which has been upgraded to (B10). Data obtained from Ministry of Water Resources
and Energy indicates that a total of 5,880,294.00 liter has been blended in 2012 which shows
an increment of 4,231,961 liter compared to 2008. The blend of ethanol with gasoline shows
an increment from year to year but the share of the blend compared to gasoline and diesel
consumption is insignificant (Table 5.2 and 5.3).
Although the production of bio-diesel is not yet started, the country possesses ample potential
for production of this fuel. The country has promoted production mainly of three feedstock,
Castor crop, Jatropha curcas, and palm tree. In light of this, at national level, the country has
allocated 23.3million ha to feedstock production (Guta, 2012).

Final Report on Pilot Global Fuel Economy Initiative Study in Ethiopia 2012
94
By considering diverse potential energy sources and commitment of the government in
creating enabling policies and legal grounds to facilitate the utilization of these resources as
opportunity, it is possible to produce much more bio-fuel.
Table 5.2 Total amount of ethanol blending from 2008-2012
S/N Year Total Blending(Lt) Remark
1 2008 1648333
2 2009 5146642
3 2010 6110936
4 2011 2827372 Incomplete data
5 2012 5880294
Source: Ministry of Water and Energy Bio Fuel Development Coordination July, 2012
Table 5.3 trend of Total blend of ethanol, Gasoline and Diesel (2008-2012)
Year Total blend(m3) Gasoline( m3) Diesel(m3)
2008 1648.333 194004.503 1244037.078
2009 5146.642 203420.959 1347947.191
2010 6110.936 219839.396 1405214.606
2011 2827.372 205683.513 1297258.427
2012 5880.294 209215.702 1387521.347
5.2 International and National Fuel Quality Standards
5.2.1 Parameters Included In the Fuel Quality Studies
The fuel quality parameters which are included in the discussion of fuel quality studies are
discussed below. Some of the parameters have an impact on air pollution and/or motor
vehicle emissions while others are related to motor vehicle performance (ORBITAL &
CSIRO, 2008).

Final Report on Pilot Global Fuel Economy Initiative Study in Ethiopia 2012
95
a) Gasoline Fuel Quality Parameter
(i) Octane is a measure of petrol’s ability to resist auto-ignition, which can cause engine
knock. There are two laboratory test methods to measure petrol octane numbers: one
determines the Research Octane Number (RON) and the other is the Motor Octane Number
(MON). RON correlates best with low speed, mild-knocking conditions and MON correlates
with high-temperature knocking conditions and with part-throttle operation. Vehicles are
designed and calibrated for a certain octane value. When a customer uses petrol with an
octane level lower than that required, knocking may result, which could lead to severe engine
damage. Engines equipped with knock sensors can handle lower octane levels by retarding
the spark timing. However, fuel consumption and power suffer at very low octane levels and
knock may still occur. Using petrol with an octane rating higher than that required will not
improve the vehicle’s performance. Most Euro-compliant engines are designed for 95 RON.
In Europe, the min RON is 95, while in USA and Ethiopia is 91.
(ii) Sulfur: Sulfur naturally occurs in crude oil. If the sulfur is not removed during the
refining process it will contaminate the vehicle fuel. Sulfur has a significant impact on
vehicle emissions by reducing the efficiency of catalysts. Sulfur also adversely affects heated
exhaust gas oxygen sensors. Reductions in sulfur will provide immediate reductions of
emissions from all catalyst-equipped vehicles on the road.
(iii) Lead: Unleaded petrol is necessary to support vehicle emission control technologies
such as catalytic converters and oxygen sensors. As vehicle catalyst efficiencies are
increased, tolerance to lead contamination decreases. Even slight lead contamination can
destroy a modern catalysts. The phase out of lead is supported but consideration must be
given to the existing vehicle fleet as some older vehicles may require lead (or lead
replacement additives) for engine protection.
(iv)Volatility: Sufficient volatility of petrol is critical to the operation of spark ignition
engines with respect to both performance and emissions. Volatility is characterized by two
measurements, vapor pressure and distillation. The vapor pressure of petrol should be
controlled seasonally to allow for the differing volatility needs of vehicles at different
temperatures. Lower vapor pressure is required at higher temperatures to reduce the
possibility of hot fuel handling problems and to reduce evaporative emissions.

Final Report on Pilot Global Fuel Economy Initiative Study in Ethiopia 2012
96
b) Diesel Fuel Quality Parameters
(i) Cetane Number/Cetane index: Cetane index is the ‘natural’ Cetane of the fuel, which is
calculated based on measured fuel properties. The Cetane number is measured on a test
engine and reflects the effects of Cetane improver additives. To avoid excessive additive
dosage, a minimum difference between Cetane index and Cetane number must be maintained.
Increasing the Cetane number improves fuel combustion, reduces white smoke on startup,
and tends to reduce NOx and PM emissions. NOx seems to be reduced in all engines, while
PM reductions are engine-dependent. These Cetane number effects also tend to be non-linear
in the sense that increasing the Cetane number produces the greatest benefit when starting
with a relatively low Cetane number fuel.
(ii) Density and Viscosity: Variations in fuel density (and viscosity) result in variations in
engine power and, consequently, in engine emissions and fuel consumption. Changes in fuel
density affect the energy content of the fuel brought into the engine at a given injector setting.
Reducing fuel density tends to decrease NOx emissions in older technology engines that
cannot compensate for this change.
(iii) Sulfur in Diesel: Diesel fuel sulfur contributes significantly to fine particulate matter
(PM) emissions, through the formation of sulfates both in the exhaust stream and, later in the
atmosphere. Sulfur can lead to corrosion and wear of engine systems. Furthermore the
efficiency of some exhaust after-treatment systems is reduced as fuel sulfur content increases,
while others are rendered permanently ineffective through sulfur poisoning.
5.2.2 International Fuel Quality Standards
In 2007, the European Commission undertook a review of these fuel quality requirements.
The review addressed fuel specifications meeting stricter EU air quality targets and future
auto emissions requirements, and also greenhouse gas (GHG) emissions from transportation
fuels (International Fuel Quality Center, 2012). The review outcome was incorporated in a
new directive as shown in the Table 5.4

Final Report on Pilot Global Fuel Economy Initiative Study in Ethiopia 2012
97
Table 5.4: Gasoline and Diesel specifications (applicable in Europe 2009-2012)
Parameter Limits
Gasoline
RON Min 95
MON Min 85
Sulfur Max 10 ppm
Aromatics Max 35 vol%
Oxygen Max 2.7wt%
Diesel
Cetane number Min51
Cetane index Min 46
Sulfur Max 10 ppm
Flashpoint Min 55oC
Density at 15oC 820 kg/m3-845kg/m3
Source: International Fuel Quality Center compiled from Directive 98/70/EC as amended and EN 228:2008 and EN, 590:2009
In USA, the EPA imposed a drastic reduction in the permitted lead level in petrol, from 0.13
g/L in 1985 and then to 0.026 g/L from January 1986. This was considered to be the lowest
lead level that would allow continued operation of older engines. Finally ``sales of leaded
petrol were banned from January 1995. The current American gasoline fuel specification is
shown in the Table 5.5(ORBITAL & CSIRO, 2008).
Gasoline Sulfur Content: the maximum allowable sulfur limits in national standards, sulfur
limits in local/regional standards (such as specifications for cities/states) of United States is
11-99ppm as shown in table 5.5 and Fig 5.3 ( International Fuel Quality Center, 2012).

Final Report on Pilot Global Fuel Economy Initiative Study in Ethiopia 2012
98
Figure 5.2 Global maximum gasoline sulfur content (source: www.ifqc.org)
Table 5.5 ASTM Specifications for Gasoline and Diesel (2012)
Parameter Limits Test methods
Gasoline
RON Min. 91 ASTM D 2699
Total Sulfur µg/g Max.11-99
Density @ 15 OC.(g/ml) 0.705-0.74 ASTM D 1298
Lead Content, g/L Max. 0.013 IP 352
Diesel
Cetane number Min 40 D 643
Cetane index Min 40 D976-80
Sulfur, ppm(µg/g),max
% mass, max
% mass, max
15
0.05
0.50
D5453
D2622
D129
Flashpoint Min 55oC
5.2.3 Over View of Ethiopian Fuel Specifications
Fuel quality in Ethiopia is maintained through a regulation of Ethiopian petroleum supply
enterprise and specifications made by Ethiopian quality and standards authority. Ethiopian

Final Report on Pilot Global Fuel Economy Initiative Study in Ethiopia 2012
99
quality and standards authority has established national fuel quality specifications based on
Ethiopian standard which in most cases is in agreement with American Society of Testing
and Materials (ASTM) Standard (Table 5.6).
Figure 5.3 Global maximum sulfur content of diesel (source: www.ifqc.org)
Table 5.6 Ethiopian Specifications for Gasoline and Diesel 2012
Parameter Limits Test methods
Gasoline
RON Min. 91 ASTM D 2699
MON -
Total Sulfur( µg/g) Max (1000 ppm) ASTM D 4294
Density @ 15 OC.(g/ml) 0.705-0.74 ASTM D 1298
Lead Content, g/L Max. 0.013 IP 352
Diesel
Cetane number - -
Cetane index Min 48 ASTM D 976
Total Sulfur % Weight Max 0.50(5000ppm) ASTM D 1552
ASTM D 4294
Flashpoint Min 52oC ASTM D 93 Source: Ethiopian Petroleum Supply Enterprise June, 2012

Final Report on Pilot Global Fuel Economy Initiative Study in Ethiopia 2012
100
Gasoline lead content: as it can be noticed from national fuel specification (Table 5.6) and
historical data from Ethiopian petroleum supply the maximum allowable lead content is
0.013g/L which is unleaded.
Gasoline sulfur content: Ethiopian standards authority set the maximum allowable sulfur
content gasoline to be 1000ppm (Table 5.6 and Fig 5.3) which is by far greater than current
standards of USA and Europe.
Diesel sulfur content: Standard diesel sulfur content is specified at max 5000 ppm which will
be a bottle neck to apply emission control technologies (Table 5.6 and Fig 5.4).
5.3 Data Collected on Fuel Quality (historical data)
The data for selected parameters were collected from the data base of Ethiopian Petroleum
Enterprise and compiled into excel file for analysis purpose. The data were compiled for the
last 8 years. The average, minimum, and maximum values of these data were evaluated for
Table 5.7 Summary of Gasoline Fuel Quality in 2011
Test/parameter Specification Test method Average Min Max
Research Octane Number
(RON)
Min. 91 ASTM D 2699 90.52 90 91.8
Density @ 15 OC.(g/ml) 0.705-0.74 ASTM D 1298 0.721 0.711 0.739
Total Sulfur % Weight Max. 0.10 ASTM D 4294 0.0244 0.004 0.1
Lead Content, g/L Max. 0.013 IP 352 0.007 0.007 0.007
Table 5.8 Summary of Diesel Fuel Quality in 2011 Test/parameter Specification Test method Average Min Max
Density @15oC(g/ml) Report ASTM D4052 0.861 0.844 0.865
Total Sulfur % weight Max 0.5 ASTM D 1552
ASTM D 4294
0.469 0.402 0.5
Flash point Pensky-Martens
Closed cup, OC
Min 52 ASTM 93 77.94 63 89
Kinematic Viscosity
Centistokes @37.8 OC
Min 1.9
Max 4.1
ASTM D445 3.686 2.9 4
Cetane index Min 48 ASTM D97 49.18 48 56
Carbon residue Rams bottom10% (% weight)
Max 0.35 ASTM D524 0.123 0.03 0.2

Final Report on Pilot Global Fuel Economy Initiative Study in Ethiopia 2012
101
each year to compare with the standards as shown in Tables (5.7 to 5.10 for three consecutive
years) while summary of the date for the year 2004 to 2010 are shown in the annex. The
review indicates the imported gasoline is unleaded gasoline but has very high sulfur content.
Table 5.9 Summary of Gasoline Fuel Quality in 2010
Test/parameter Specification Test method Average Min Max
Research Octane Number (RON) Min. 91 ASTM D 2699 90.18 90 91.3
Density @ 15 Deg. C.(g/ml) 0.705-0.74 ASTM D 1298 0.724 0.722 0.738
Total Sulfur % Weight Max. 0.10 ASTM D 4294 0.012 0.004 0.06
Lead Content, g/L Max. 0.013 IP 352 0.007 0.007 0.007
Table 5.10 Summary of Diesel Fuel Quality in 2010
Test/parameter Specification Test method Average Min Max
Density @15oC(g/ml) Report ASTM D4052 0.856 0.834 0.866
Total Sulfur % weight Max 0.5 ASTM D 1552
ASTM D 4294
0.458 0.340 0.50
Flash point Pensky-Martens
Closed cup, Deg.C
Min 52 ASTM 93 76.71 57 89
Kinematic Viscosity Centistokes
@37.8 Deg.C
Min 1.9
Max 4.1
ASTM D445 3.53 2.4 4
Cetane index Min 48 ASTM D97 (calc) 49.71 41 55
Carbon residue Rams bottom10%
Distillation Residue % weight
Max 0.35 ASTM D524 0.121 0.09 0.17
5.3.1 Global and National Sulfur Levels in Fuels
Global levels of sulfur in fuels differ greatly, by country and region. Depending on the crude
oil used and the refinery configurations, sulfur levels in petrol range from a value less than 10
ppm to as high as 1000 ppm or more (Figure 5.2). In diesel fuel, levels range from a value
less than 10 ppm to more than 10,000 ppm (Figure 5.3). Europe, the US, and Japan have
put in place measures to reduce sulfur to lower levels (below 10-15 ppm), often along with

Final Report on Pilot Global Fuel Economy Initiative Study in Ethiopia 2012
102
emission standards that require advanced emission control technologies that cannot be used
with higher sulfur fuels (UNEP, 2006).
Around the world, many countries are lowering the limit of allowable sulfur in fuels and
adopting tailpipe emission standards to reduce vehicle pollution (UNEP, 2006). However, the
global picture is mixed. As shown in Figures 5.2 and 5.3, the sulfur levels in both gasoline
and diesel in the majority of developing countries of Africa, including Ethiopia, is very high.
The data acquired from Ethiopian Petroleum Supply Enterprise showed that the max
allowable sulfur level in gasoline is 1000 ppm whereas the maximum allowable sulfur level
in diesel is 5000ppm. The Ethiopian Petroleum Supply Enterprise is very stringent in
maintaining the set standards especially from 2006 onwards (Table 5.11, Figure 5.4 and 5.5).
Different researches conducted on vehicle emission and engine operability indicate that fuel
quality intimately affects vehicle emissions as the vehicle and its fuel (and oil) form an
integrated system (Blumberg et al., 2003). The vehicle-fuel system determines the quality
and amount of emissions and the extent to which emission control technologies will be able
to reduce the emissions. Reducing sulfur levels in fuels is especially important in reducing
the smallest particles and can reduce vehicle emissions in general (UNEP, 2006). This
demonstrates that there are substantial emission reductions to be achieved when sulfur in
diesel is reduced from very high levels that are common in many developing countries like
Ethiopia, which have more than 5,000 ppm in diesel fuels, to very low levels (50 ppm and
less). This, not only reduces PM emissions further but also enables the introduction of
emission control technologies that provide even greater emission reductions.
Table 5.11 Sulfur content of imported Diesel for the previous 8 years
Year Average Minimum Maximum
2004 0.913 0.70 0.99
2005 0.610 0.31 0.97
2006 0.499 0.14 3.9
2007 0.448 0.28 0.48
2008 0.481 0.40 0.93
2009 0.477 0.38 0.48
2010 0.458 0.34 0.50
2011 0.469 0.40 0.50
2012 0.475 0.47 0.48
NB: specification (total sulfur % by weight 0.5 or 5000ppm)

Final Report on Pilot Global Fuel Economy Initiative Study in Ethiopia 2012
103
Table 5.12 Sulfur content of imported gasoline (From 2004-2011)
Year Average Minimum Maximum
2004 0.061 0.004 0.09
2005 0.015 0.004 0.09
2006 0.056 0.02 0.09
2007 0.075 0.07 0.08
2008 0.0391 0.004 0.09
2009 0.038 0.004 0.09
2010 0.012 0.004 0.06
2011 0.0244 0.004 0.1
NB: specification (total sulfur % by weight 0.1 or 1000ppm)
Figure 5.4 Trend of sulfur content of diesel
0
0.1
0.2
0.3
0.4
0.5
0.6
0.7
0.8
0.9
1
2002 2004 2006 2008 2010 2012 2014
tota
l sul
phur
%by
wei
ght
Year
average
standarerd

Final Report on Pilot Global Fuel Economy Initiative Study in Ethiopia 2012
104
Figure 5.5 Trend of sulfur content of gasoline
5.4 Conclusions and Recommendations
Ethiopia imports its entire petroleum fuel requirement, and the demand for petroleum fuel is
rising rapidly due to a growing economy and expanding infrastructure. By 2012 Ethiopia has
imported 1,232,894.00 Mton of diesel and 154,238.00Mton diesel while the total blend of
ethanol with gasoline was 5,880,294.00 Lt. Report from Ministry of Water Resources and
Energy indicates that Ethiopia imports fuel on average at the expense of 768 million USD per
annum and this covers 77% of the total export earnings. Given the current and expected oil
price trends and volatility, the gradual substitution of imported petroleum fuels by biofuel and
a diversification of energy sources will rapidly gain macroeconomic importance. In order to
ensure the continued development program and the national fuel security, the government of
Ethiopia has set a clean energy plan to increase fuel efficiency and substituting fossil fuel
demand by locally produced fuels such as biofuel.
The historical data obtained from petroleum supply of Ethiopia demonstrates the fuel
parameters of the imported gasoline and diesel comply with the set standards but as stated in
section 5.3, the sulfur content of gasoline and diesel are 1000ppm and 5000ppm, respectively.
0
0.02
0.04
0.06
0.08
0.1
0.12
2002 2004 2006 2008 2010 2012 2014
tota
l sul
phur
%by
wei
ght
Year
average
standarerd
Final Report on Pilot Global Fuel Economy Initiative Study in Ethiopia 2012
105
This is categorized under high sulfur content of fuel. The high sulfur content of fuel reduces
the vehicle efficiency and affects the environment and human health. With high sulfur fuel, it
will also make the application of vehicle emission control technologies difficult.
As can be noted, in Ethiopia, vehicle numbers are increasing rapidly from time to time.
Hence, the high-sulfur fuels continue to be the norm and to inhibit the introduction of new
vehicle technologies. Therefore in order to allay the mounting human health impacts of
increasing vehicle numbers and reduce the burden associated with cleaning up existing
vehicles, Ethiopia needs to institute policies earlier to lower sulfur levels to 50ppm which
allows for the further benefit of advanced control technologies for diesel vehicles. Studies
show the benefits of sulfur reduction far outweigh the costs. The U.S. EPA found human
health and environmental benefits due to sulfur reduction was ten times higher than the costs.
Furthermore the considerable potential for greenhouse gas emission reductions adds further
to the health, environmental, and social benefits of sulfur reduction (Blumberg et al., 2003).

Final Report on Pilot Global Fuel Economy Initiative Study in Ethiopia 2012
106
6. ANALYSIS OF IMPACT OF VEHICLE EMISSION ON AIR POLLUTION
6.1 Introduction
Air pollution is the presence of pollutants in the ambient air in such concentration as to harm
human, plant, or animal life, cause damage to materials and structures, cause climate or
weather change. Urban air pollution usually occurs when a high level of emission (from
vehicles or other combustion sources), combines with poor dispersion conditions.
Meteorological and topographic conditions affect dispersion and transport of these pollutants.
Motor vehicles are sources of a number of air pollutants, such as carbon monoxide, nitrogen
oxides, un-burnt hydrocarbons, suspended particulate matter, sulfur dioxide and volatile
organic compounds. Nearly 50% of global carbon monoxide (CO), hydrocarbons (HCs) and
nitrogen dioxide (NO2) emissions from fossil fuel combustion come from petrol and diesel
engines. In city centers and congested streets, traffic can be responsible for about 80-90% of
these pollutants and this situation is expected to be severe in cities in developing countries
where vehicle emission monitoring is not in place. Vehicle emissions mainly result from fuel
combustion or evaporation. The major pollutants emitted from gasoline fueled vehicles are
CO, HCs, and NOx (oxides of nitrogen), whereas the presence of sulfur compounds in diesel
fuel results in sulfur dioxide (SO2) and particulate matter (PM) emissions.
Diesel exhaust emission usually contains particles in the size range between 50nm and
100nm. Particulates from gasoline vehicle exhaust emission are well below 40nm in
diameter, with large proportion of this being in the order of 10 nm. Particles with diameter
below 0.1µm are ultrafine particles. Particles between 0.1 and about 1µm in diameter are
typically formed from ultrafine particles by coagulation and adsorption of gaseous material in
the atmosphere onto preexisting particles. These particles can remain suspended in the air for
long period of time (several weeks). These particles and the ultrafine particles are also known
as fine particles (PM2.5), i.e. particles with an aerodynamic diameter of less than 2.5µm
[Bacha, 2007; Tiagarajam, 2004; Farnlund, 2001].
According to the WHO assessment, diseases associated to air quality deterioration have been
responsible for millions of premature deaths, majority of which is in the developing
countries.

Final Report on Pilot Global Fuel Economy Initiative Study in Ethiopia 2012
107
Local pollutants such as carbon monoxide, air toxins and particulates, tend to concentrate
adjacent to busy roadways, especially where geographic and climatic conditions trap
pollution and produce ozone [www.vtpi.org].
Air pollution is a serious environmental concern in large cities. Often, a significant portion of
city residents are exposed to poor air quality. Childhood cancers are frequent in households
living adjacent to high traffic roads [www.vtpi.org]. In addition, as shown in Figure 6.1
people who travel by car are exposed to more air pollution than people traveling by other
modes. According to a study, road pollution emissions in Austria, France and Switzerland
cause significant increases in bronchitis, asthma, hospital admissions and premature deaths.
Figure 6.1 Relative air pollutants (HC& NO2) exposure by transportation mode
[www.vtpi.org]
Air quality limit values are designed, and set to serve as guidance in reducing human health
impacts of air pollution. In order to reduce the impact of air quality deterioration, it is
necessary to know the state of the ambient air quality. Accordingly, this part of the study
deals with the measurement and assessment of common air pollutants related to motor
vehicle emissions in the Addis Ababa City.
6.2 Methodology
This section deals with the methodological aspects of air quality measurement. The
methodology followed in this part of the study includes literature review, measuring method
and instruments, measuring site selection and evaluation of the results. Collected primary and
secondary data were analyzed by comparing against WHO guidelines and EPA Ethiopia
guidelines given in Table 6.1.

Final Report on Pilot Global Fuel Economy Initiative Study in Ethiopia 2012
108
Table 6.1 EPA Ethiopia and WHO air quality guidelines [EPA, 2003; WHO, 2005] Pollutant EPA Ethiopia guideline WHO guideline
Guideline
value (µg/m3)
Average time Guideline value
(µg/m3)
Average time
Sulfur dioxide 500 10 minutes 500 10 minutes
125 24 hours 20 24 hours
50 1year 50 1 year
Nitrogen dioxide 200 1 hour 200 1 hour
40 1 year 40 1 year
Carbon monoxide 100,000 15 minutes 100,000 15 minutes
60,000 30 minutes 60,000 30 minutes
30,000 1 hour 30,000 1 hour
10,000 8 hours 10,000 8 hours
Particulate matter
PM2.5 65 24 hours 25 24 hours
15 1 year 10 1year
6.2.1 Literature Review
There is very little information available concerning urban air pollution in Addis Ababa city.
A study was conducted on the magnitude and variation of CO pollution due to vehicle
emissions in Addis Ababa city by Abera Kume at 40 different sites (Kume, 2010). According
to this study none of the sampling sites showed CO concentrations above WHO guideline
limit. The result indicated that the mean value for 15 minutes CO concentration was found to
be 2.1 ppm and 2.8 ppm for wet and dry seasons, respectively.
6.2.2 Measuring Methods and Instruments
In this study, only the measurements of common vehicle emissions/pollutants viz. carbon
monoxide, (CO), particulate matter (PM2.5), nitrogen dioxide (NO2), and sulfur dioxide (SO2)
were carried out mainly due to time limitation and shortage of available resources including
measuring instruments and associated technical problems.
CO and PM2.5 measurement were carried out employing continuous measuring instruments
comprising of uninterrupted recording of concentrations throughout the measurement period.

Final Report on Pilot Global Fuel Economy Initiative Study in Ethiopia 2012
109
The measurements of NO2 and SO2 were carried out using non-continuous measuring
instruments.
Two sampling periods, dry and wet seasons, were selected. All measurements were taken
during working days from 8:30 am to 5:30 pm local time. The measuring instruments were
fixed at the edges of the roads at a height of 1 meter above ground.
a) Carbon Monoxide Measurement
HOBO model CO data logger was used to measure the level of CO in the ambient air at all
selected sites. The instrument was calibrated as per the specification of the manufacturer
before commencing the intended measurements. Measurements were conducted by placing
the instrument 1 meter above the ground at the edge of the selected road. The instrument was
set at a sampling interval of 1 minute during the whole period of the study lasting from 8:30
AM to 5.30 PM. Measured data were evaluated and presented.
b) Particulate Matter Measurement
Particles between 0.1 and about 1µm in diameter are typically formed from ultrafine particles
by coagulation and adsorption of gaseous material in the atmosphere onto preexisting
particles. These particles can remain suspended in the air for long period (several weeks).
These particles and the ultrafine particles are also known as fine particles (PM2.5), i.e.,
particles with an aerodynamic diameter of less than 2.5µm.
In this work, the measurement of PM2.5 was carried out mainly because of the fact that most
particulate matter associated with vehicular emissions are fine particles of less than 2.5µm in
diameter.
Concentration of fine particulate matter was measured using the University of California
Berkeley Particle Monitor (UCB PM Monitor). The UCB Particle Monitor can detect
particles with aerodynamic diameter of 2.5 microns (PM2.5) and less. Measurements were
conducted by placing the instrument 1 meter above the ground at the edge of a road. The
instrument was continuously recording the concentration of fine particles in the ambient air
from 8:0 am to 5.30 pm.

Final Report on Pilot Global Fuel Economy Initiative Study in Ethiopia 2012
110
c) Nitrogen Dioxide Measurement
The measurements of nitrogen oxides concentration in the ambient air were carried out using
Oldham Multi-gas detector. Measurements were performed at different time intervals on
discrete basis.
d) Sulfur Dioxide (SO2) Measurement
SO2 concentration in the ambient air was measured using Crown Gasman detector. On-road
measurements were performed at different time intervals on discrete basis.
Table 6.2 Measurement sites and location
Site GPS location
Code Name
S1 Aduwa Square (Megenagna) N 09o 00.145’; E 038o 47.560’
S2 Arada (Arada building) N 09o 01.977’; E 038o 45.187’
S3 Betel N 09o 00.225’; E 038o 41.515’
S4 Bob Marley Square (Imperial Hotel ) N 09o 00.156’; E 038o 48.005’
S5 Bole Bridge N 08o 59.351’; E038o 47.550’
S6 Bus Station (Addis Ketema) N 090 02.038’; E038o 43.947’
S7 Entoto (St. Mary Church) N 090 05.182’; E 038o 45.735’
S8 Kaliti Road Intersection (Traffic light) N08o55.967’; E038o 46.002’
S9 La gare Traffic Light N 09o 00.701’; E 038o 45.192’
S10 Mexico Square N 09o 00.638’; E 038o 44.699’
S11 Teklehaimanot Square N 09o01.728’; E038o 44.583’
S12 Urael Traffic Light N 09o 00.659’; E 038o 46.503’
6.3 Measurement Sites
Given the limitation in time and resource, only 12 sampling sites were selected. In line with
the objective of the project, which aimed at assessing the severity of air pollution due to
vehicle emission, on-road measurements were carried out at selected sites (road junctions,
roundabouts and squares). The criteria used for site selection were:
• congested traffic area suspected of high fleet pollutant emissions
• high population density relative to receptor-dose levels, both short- and long-term
(permanent/residence)

Final Report on Pilot Global Fuel Economy Initiative Study in Ethiopia 2012
111
• atmospheric considerations such as spatial and temporal variability of pollutants and
their transport
• height and density of buildings
• building use
• traffic frequency and composition
• background pollution
The selected measurement sites in Addis Ababa city are shown Table 6.2.
6.4 Results
6.4.1 Carbon Monoxide
Figure 6.2 and Figure 6.3 show the variation of CO concentration with time as recorded by
the instrument in the interval of time shown for two representative sites (Bole bridge and
Teklehaimanot Square). The site at Bole Bridge hosts high traffic intensity of light vehicles
since the circulation of vehicles above 3t is restricted in this area while the site at
Teklehaimanot Square is a commercial area that hosts heavy traffic of different vehicle
categories. According to Figure 6.2 higher levels of CO are observed in the morning up to
lunch time in Bole bridge and this level decreases very gradually in the afternoon.
The tendency at Teklehaimanot looks different. The CO level was seen to increase in the
morning until around 12:00am when the highest peak was observed. Lowest values were seen
between 12:00am and 13:30pm (lunchtime). The level of CO afterwards showed more or less
a regular pattern oscillating around a mean value. The maximum recorded value of CO at this
site for the dry season is 16.4ppm.
Nevertheless, as can be seen from Table 6.3, none of the averages are greater than the values
indicated in the WHO guideline. Only two sites (S6 and S11) show values greater than 50%
of the WHO guideline for 8-hour average. Particular to these two sites is the relatively higher
circulation level of diesel vehicles.

Final Report on Pilot Global Fuel Economy Initiative Study in Ethiopia 2012
112
Figure 6.2 Measured CO concentration at Bole Bridge during the dry season
Figure 6.3 Measured CO concentration at Teklehaimanot Square during the dry season
0
5
10
15
20
25
8:30 9:30 10:30 11:30 12:30 13:30 14:30 15:30 16:30 17:30
CO, p
pm
Time, hour
0
5
10
15
20
25
8:30 9:30 10:30 11:30 12:30 13:30 14:30 15:30 16:30 17:30
CO
, ppm
Time, hour

Final Report on Pilot Global Fuel Economy Initiative Study in Ethiopia 2012
113
Table 6.3 CO concentrations at different sites collected during the dry season
Site CO Concentration, ppm Code Name Max 15-
minute average
Max 30-minute average
Max 1-hour
average
8-hour average
Maximum
S1 Aduwa Square (Megenagna) 7.1 7.1 6.0 3.8 15.9
S2 Arada (Arada building) 3.8 3.0 2.8 2.2 12.5
S3 Betel 4.4 4.3 3.7 2.5 12.5
S4 Bob Marley Square (Imperial Hotel ) 6.9 6.3 4.9 3.7 13.4
S5 Bole Bridge 15.0 10.7 6.1 4.4 16.4
S6 Bus Station (Addis Ketema) 15.0 7.8 7.1 5.9 20.8
S7 Entoto (St. Mary Church) 0.2 0.2 0.2 0.2 0.2
S8 Kaliti Road Intersection 15.0 5.1 4.8 3.9 11.0
S9 La gare Traffic Light 6.3 5.8 4.8 3.6 14.4
S10 Mexico Square 9.9 7.6 7.3 3.7 17.7
S11 Teklehaimanot Square 16 9.0 7.5 5.2 23.2
S12 Urael Traffic Light 5.3 5.1 4.8 3.2 12.9
Average 8.7 6.0 5.0 3.5 14.2
WHO guideline for CO: 15minute = 90ppm; 30 minute = 50ppm; 1hr =25ppm; 8hr = 10ppm
EPA guideline for CO: 15minute = 90ppm; 30 minute = 50ppm; 1hr = 25pp; 8hr = 10ppm
Measurement of CO concentrations during the wet season was conducted only for three
representative sites due to time constraints. The result of measurements is given in Table 6.4.
Table 6.4 Wet season CO concentration level at different sites
Site CO concentration, ppm Max 15-minute average
Max 30-minute average
Max 1-hour
average
8-hour average
Maximum
Bus station
(Addis Ketema)
37.4 23.4 17.2 2.8 44.2
Mexico Square 14.5 13.1 8.1 4.9 22.7
Teklehaimanot Square 17.2 13 8.0 1.5 24.2
As can be seen from Table 6.4 the results obtained for the wet season at the same sites are
slightly higher than those of the dry season.

Final Report on Pilot Global Fuel Economy Initiative Study in Ethiopia 2012
114
6.4.2 Particulate Matter
Figure 6.4 shows that the PM2.5 concentration builds up in the morning attaining a maximum
around 9:30 am after which the concentration gradually drops and remains at relatively low
level until it starts to increase after lunch time reaching a maximum around 15:00 pm. It can
be said that this observed pattern is related to the traffic intensity during the rush hours.
Figure 6.4 PM2.5 concentrations at Bole Bridge
Figure 6.5 PM2.5 concentrations at Teklehaimanot Square
In the case of Figure 6.5, one can observe that the concentration builds up until 15:00 pm, in
line with the traffic intensity associated with the commercial activities of the area.
0200400600800
100012001400160018002000
8:30 9:30 10:30 11:30 12:30 13:30 14:30 15:30 16:30 17:30
PM2.
5Co
ncen
trat
ion,
µg/
m3
Sampling time, hr
0
500
1000
1500
2000
2500
3000
8:30 9:30 10:30 11:30 12:30 13:30 14:30 15:30 16:30 17:30
PM, µ
g/m
3
Sampling time, hour

Final Report on Pilot Global Fuel Economy Initiative Study in Ethiopia 2012
115
Table 6.5 gives 24-hour averages and maximum levels of PM2.5 for the dry season. As can be
seen in the table, the measured values at all sites are higher than the WHO guideline limit. On
the other hand, except sites S1, S2, S4 and S7, all other sites show values greater than the
Ethiopian EPA guideline limit. If one considers the maximum for the different sites, both
limit values are highly exceeded in all 12 sites.
Consequently, people residing and working along roads and those frequently using passenger
vehicles are expected to encounter severe health effects due to such high level of PM2.5 in the
ambient air.
Table 6.5 PM2.5 concentration data for different sites during the dry season.
Site PM2.5 Concentration, µg/m3
Code Name 24-hour average Maximum
S1 Aduwa Square (Megenagna) 54.8 4471.9
S2 Arada (Arada building) 30.7 624.0
S3 Betel 135.6 6576.4
S4 Bob Marley Square (Imperial Hotel ) 43.6 511.1
S5 Bole Bridge 97.3 1982.6
S6 Bus Station (Addis Ketema) 70.4 1827.5
S7 Entoto (St. Mary Church) 27.2 808.5
S8 Kaliti Road Intersection (Traffic light) 271.4 9082.6
S9 La gare traffic light 83.5 3268.8
S10 Mexico Square 228.6 17169.3
S11 Taklehaimanot Square 342.1 2933.7
S12 Urael Traffic Light 165 1837.5
WHO guideline for MP2.5: 24 hr average = 25µg/m3
EPA Ethiopia guideline for PM2.5: 24 hr average = 65µg/m3
The measurement of fine particulate matter (PM2.5) concentration levels in the ambient air
during the wet season was conducted at selected three sites. The results of measurement are
presented in Table 6.6.

Final Report on Pilot Global Fuel Economy Initiative Study in Ethiopia 2012
116
Table 6.6 PM2.5 concentration levels at the three sites during the wet season
Site PM2.5 concentration, µg/m3
24-hour average Maximum
Bus station (Addis Ketema) 34.6 4824.6
Mexico Square 59.3 1529.6
Teklehaimanot Square 60.9 3531.6
WHO guidelines for PM2.5: 24 hr average = 25 µg/m3 ; EPA (Ethiopia) Guideline for PM2.5: 65µg/m3
It can be seen from the data in Tables 6.5 and 6.6 that the results obtained for PM2.5 during
the wet season is lower than those obtained during the dry season for the same sites. This
difference arises as a result of agglomeration and wet precipitation of fine particles. In
addition, horizontal wind enhances dispersion of fine particles decreasing their concentration
in the ambient air.
6.4.3 Nitrogen Oxide (NOx)
The level of nitrogen dioxide concentrations in the ambient air was not detected by the
instrument during the field survey at all selected sites. This indicates that the concentration of
NO2 in the ambient air is relatively low in the Addis Ababa city. The instrument used for NO2
concentration level measurement can detect values less 0.1ppm, which is lower than the
WHO and EPA Ethiopia guideline limit value of 0.11ppm (200µg/m3). The low level of NO2
may be attributed to variety of factors including combustion flame temperature, residence
time of the nitrogen gas in the peak temperature zone of combustion flame, and the amount of
oxygen present in the peak temperature zone of the flame. Oxides of nitrogen are invariably
produced in any combustion process involving air containing high proportion of nitrogen.
The rate of formation of oxides of nitrogen is dependent on the pressure and temperature,
with high temperatures being conducive to higher formation rates provided that the residence
time and oxygen available are sufficient. However, the rate of formation of nitrogen oxides
can be suppressed by the presence of hydrocarbons (HCs) and carbon monoxide. This would
result in low NOx emissions.
In addition, the atmospheric life time of NO2 is relatively short. Nitrogen dioxide transforms
in the air to gaseous nitric acid and toxic organic nitrates. It plays a major role in the
atmospheric reaction of ozone formation, a major component of smog. Nitrogen dioxide is
also a precursor of nitrates, which contributes to increased respiratory fine particulate matters

Final Report on Pilot Global Fuel Economy Initiative Study in Ethiopia 2012
117
in the atmosphere. This transformation and dispersion of NO2 in the atmosphere would
account for the low concentration level of this pollutant in the ambient air.
6.4.4 Sulfur Dioxide
The concentration of SO2 in the ambient air was not detected by the instrument (Crown
Gasman detector) at all measurement sites during the study period. This indicates that SO2
concentration in the ambient air is low. Sulfur oxides formed during fuel combustion are
further oxidized to solid sulfates, to a certain extent within the engine and completely in the
atmosphere. The low level of SO2 concentration would arise from the transformation and
dispersion factors as it is released from the exhaust tailpipe. Its lifetime in the atmosphere
depends strongly on meteorological conditions and is usually short. It is highly soluble in
water, forming weak sulfurous acid. In the presence of excess oxygen, SO2 is oxidized to
sulfur trioxide (SO3) in the atmosphere. The SO3 rapidly combines with water forming
sulfuric acid. Generally, SO2 is further oxidized to sulfuric acid and sulfates, in the
atmosphere, forming an aerosol often associated with other pollutants in droplets or solid
particles extending over wide range sizes. Sulfur dioxide and its oxidation products are
removed from the atmosphere by wet and dry deposition. Sulfur dioxide can also be removed
from the atmosphere through condensation and precipitation. Under favorable meteorological
conditions SO2 released from the vehicle exhaust system to the atmosphere can be diluted by
dispersion and transportation thereby maintaining low level concentration in the ambient air.
The volume and composition of vehicle emission is affected by many factors such as the size
of the engine, the age of the vehicle, the air-to-fuel ratio, etc.
The higher the size (capacity) of the engine that powers a vehicle, the higher will be the fuel
per km consumption and hence the greater the volume of the emissions. The age of a vehicle
closely correlates to the type of emissions control equipment installed in the vehicle. Older
vehicles tend to have traveled a greater number of kilometers, which causes both engines and
emission control equipment to wear.
In general, a petrol engine operating with a fuel-air ratio greater than the stoichiometric will
produce more products of incomplete combustion, such as carbon monoxide (CO),
hydrocarbons (HC) from unburned fuel and particulate emissions. If the mixtures is slightly
lean, the formation of NOx (mainly NO and a smaller proportion of NO2) is favored. The
formation of NOx increases strongly with peak flame temperatures if sustained long enough

Final Report on Pilot Global Fuel Economy Initiative Study in Ethiopia 2012
118
in the presence of oxygen. Thus, particulates can be reduced through higher temperature and
faster combustion, whereas reductions in NOx emissions require reduced combustion
temperature.
In Addis Ababa, most of the circulating vehicles are old vehicles. This means vehicles with
old engines and poor emission controls are in circulation. In addition, there is lack of proper
instrumentation and expertise to tune engines of vehicles for optimum conditions (acceptable
emission levels and power output).
Altitude is also an important factor. Fuel combustion efficiency of motor vehicles declines
with altitude resulting in increased pollutant emission, particularly CO. Addis Ababa is
located between 2200 and 2800 meter above sea level. For vehicles circulating in the city,
unless properly tuned the air-fuel mix becomes rich (more fuel than the stoichiometric), due
to the less amount of oxygen available, thus favoring less complete combustion, i.e., more
CO, more HC and more particulate and less NOx.
Therefore, based on the foregoing discussion, it is reasonable to expect high amount of CO,
HC and particulate matter in Addis Ababa.
However, the level of pollutant concentration in ambient air is also highly affected by
dispersion factors like the meteorological and physiographical conditions of a city (wind
speed and direction, precipitation). According to a study [Faiz, 1996], most air pollution
disasters have occurred in areas where natural air ventilation is restricted by terrain.
Addis Ababa borders to the north with Entoto Mountain which is about 3000 (meters above
sea level) masl and slopes down to the south, south-east and south-west.
In addition the city, which is stretched horizontally, is characterized by very low vertical
density. It occupies an estimated area of 54 thousand hectares. Low rising buildings occupy a
significant proportion of the city while the high rising buildings are mostly located parallel to
main roads.
The city is often regarded as one having three major seasons: the dry season from October to
January, the small rainy season from February to May and the heavy rainy season from June
to September. As can be seen in Table 6.7, the city gets rain for more than half of the year
(132 days).

Final Report on Pilot Global Fuel Economy Initiative Study in Ethiopia 2012
119
Table 6.7 Climate data for Addis Ababa (Source: Ethiopian National Meteorological
Agency) Month Jan Feb Mar Apr May Jun Jul Aug Sep Oct Nov Dec Year
Average max
temperature, 0C
23.2 24.7 26.6 25.2 25.2 25.6 21.2 21.3 22.9 23.0 23.9 22.2
2009 Average min.
temperature, 0C
9.0 10.0 11.9 12.0 12.0 12.3 11.5 11.5 12.0 10.5 6.0 8.5
Rainfall, mm 19.5 2.7 28.4 80.6 80.6 82.0 349.9 387.6 112.7 45.8 4.4 65.0
Average max
temperature, 0C
23.8 23.6 23.5 24.1 24.1 22.8 20.4 20.9 21.3 23.5 22.5 22.8
2010 Average min.
temperature, 0C
9.6 12.2 12.3 13.3 13.5 11.9 11.6 12.2 11.7 11.2 9.5 8.9
Rainfall, mm 2.6 79.2 55.5 97.6 24.0 231.1 313.9 205.3 237.8 1.8 25.7 14.5
Average max
temperature, 0C
24.0 25.0 24.6 25.9 26.0 24.0 22.0 21.2 21.8 23.0 23.0 27.0
2011 Average min.
temperature, 0C
10.0 10.0 11.5 13.4 13.0 12.0 12.0 11.8 11.7 10.0 11.0 7.0
Rainfall, mm 14.1 13.1 44.5 17.0 50.0 180.0 56.0 195.9 184.5 0.0 32.4 0.0
Average max
temperature, 0C
25.0 26.0 26.6 25.0 27.0 25.0 21.0 21.3 21.3 23.0 24.5 23.0
2012 Average min.
temperature, 0C
8.0 8.0 10.8 12.0 13.0 13.0 12.0 11.8 11.3 10.0 9.6 10.0
Rainfall, mm 0.0 0.0 16.0 41.0 57.0 49.0 324.0 293.0 202.9 2.0 0.8 10.0
Thus, the variation of elevation within the city by favoring natural ventilation, the low height
of most buildings in city by offering little or no obstacle to flow of air, and the light and
heavy rainy seasons by washing air pollutants contribute to the dispersion deposition of
pollutants from vehicle emissions in the city.
The observed low level of CO during this study, in spite of all the factors indicating the
opposite, can only be explained by the meteorological and physiographical conditions of the
city which contribute towards the dispersion of CO.
Moreover, the removal and dispersion seems to be less efficient in case of PM2.5. This is also
reasonable, since PM2.5 has the tendency to remain suspended in the air for longer times due
to their smaller size. Fine particulate matters have low removal tendency by precipitation and

Final Report on Pilot Global Fuel Economy Initiative Study in Ethiopia 2012
120
deposition owing to their size, and hence have long residence time in the air. This is one of
the main reasons for observed elevated concentration of PM2.5 in the ambient air during the
study period.
According to the 2007 population census, the city has a population of 3,384,569. There is an
increased economic activity in the city now. More and more people move from one part of
the city to the other during working days for work, study, etc. The shortage of transportation
is evident. Many people can be seen queuing at bus and taxi stops at peak hours. This implies
more and more people are exposed to air pollutants (especially to PM2.5), the exposure time
depending on the time spent in queue and travel.
6.5 Trend Projection
The estimated mileage and corresponding annual fuel consumption in Addis Ababa for the
Ethiopian year 2003 (2010/11) are given in Table 6.8.
Table 6.8 Mileage and fuel consumption per vehicle category in Addis Ababa (2010/2011)
Vehicle category
No of
Vehicles
Annual
Mileage[km/yr]
passenger
cars
Petrol without catalyst 85,786 2,058,864,000
Petrol with 3-way catalyst 40,677 976,248,000
Diesel- OLD-without PM filter 3,401 81,624,000
Diesel- with PM filter 38,376 921,024,000
Light Duty
Trucks and
Buses
Light Duty-pre Euro 3,928 196,400,000
Light Duty-Euro I+II 24,130 1,206,500,000
Light Duty-Euro III+IV 8,466 423,300,000
Heavy
Duty
Trucks and
Buses
Heavy Duty-pre Euro 682 34,100,000
Heavy Duty-Euro I+II 5,160 258,000,000
Heavy Duty-Euro III+IV 1,669 83,450,000
Bus pre-Euro 524 26,200,000
Bus Euro I+II 2,503 125,150,000
Bus Euro III+IV 961 48,050,000

Final Report on Pilot Global Fuel Economy Initiative Study in Ethiopia 2012
121
This estimation was made assuming that annual mileage of passenger cars, trucks and buses
are 24,000, 50,000 and 50,000kms, respectively. In addition, 50% of the vehicles with ET
plates were assumed to circulate in Addis Ababa.
Following, the estimated amount of the different pollutants per vehicle category were
calculated using the emission factors of Nairobi [UNEP] and shown in Table 6.9.
Furthermore, it was attempted to estimate the GHG emission as expressed in Million ton of
CO2e using the indicated conversion factors. Since these conversion factors were derived
based on transport conditions in developed countries, the actual emission values of these
pollutants are expected to be higher.
Table 6.9 Annual emissions of pollutants per vehicle category in Addis Ababa (2010/2011)
Vehicle category
Annual Emission [kg/yr]
CO VOC NOX SOx PM10
Passenger
cars
Petrol without catalyst 109,120 18,217 5,188 103 21
Petrol with 3-way catalyst 17,572 761 1,142 49 10
Diesel- OLD-without PM filter 295 153 136 18 18
Diesel- with PM filter 3,325 17 820 147 74
Light Duty
Trucks and
Buses
Light Duty-pre Euro 709 369 328 57 53
Light Duty-Euro I+II 4,343 229 1,979 314 157
Light Duty-Euro III+IV 1,524 80 694 106 55
Heavy
Duty
Trucks and
Buses
Heavy Duty-pre Euro 293 56 523 24 23
Heavy Duty-Euro I+II 2,216 426 3,873 178 173
Heavy Duty-Euro III+IV 446 96 768 58 24
Bus pre-Euro 348 66 624 26 56
Bus Euro I+II 1,477 317 2,553 121 168
Bus Euro III+IV 278 76 481 47 31
Total 141,947 20,864 19,108 1,200 862 8
According to the Climate Resilient Green Economy Strategy of Ethiopia [FDRE, 2011], the
total GHG emission of the country from the transport sector in 2010 was estimated at 5
Million ton CO2e. With business-as-usual-scenario, the GHG emission from this sector is
expected to reach 40 Mt CO2e in 2030 which is an 800% increase. Similarly, the GHG

Final Report on Pilot Global Fuel Economy Initiative Study in Ethiopia 2012
122
emission in Addis Ababa can be expected to increase by the same percentage if not more.
Hence, the air quality in the city will deteriorate unless proper mitigation measures are
introduced in time.
6.6 Mitigation Measures and Conclusion
6.6.1 Recommendation on Mitigation Measures
Mitigation measures refer to programs or strategies designed to reduce vehicular emissions
for a particular region or area and are necessary to maintain or improve air quality. There is a
global interest towards developing mitigation measures, which can reduce vehicle emissions
either directly (e.g., by tightening emission standards, retrofitting, and introducing fuel
reformulations) or indirectly (e.g., by relieving traffic congestion, encouraging ride share, and
shifting private vehicle use to non-auto travel or public transport modes). In order to reduce
the impact of air pollution caused due to vehicular fleet, appropriate mitigation measures
need to be considered and applied. Regulatory guidelines are important to effectively control
and reduce vehicular emissions. Moreover emissions are generally regulated based on the
available standards that establish limit values for each type of pollutants released to the
ambient air.
a) Vehicle Emission Standards
Emission standards set limits on the amount of specific pollutants that vehicles can release
into the environment. The pollutants usually regulated include NOx, CO, HC and particulate
matter (PM). Unfortunately there are no universally accepted standards.
Most countries are adopting European Union Emission Standards as their national vehicle
emission standard. European Union vehicle emission standard started in early 1990s with
Euro I and reached Euro III at 2000. Then, it developed to Euro IV in 2005. While the current
standard is Euro V, it will be updated to Euro VI starting 2014. In order to control vehicular
emissions and reduce air pollutions in Ethiopia, it is necessary to draft and implement
emission standards as soon as possible. Since new vehicles imported from China and locally
assembled ones meet Euro III standards it is recommended to adopt and enforce Euro III on
newly registered vehicles emission in the country. European regulations introduce different
emission limits for diesel and petrol/gasoline vehicles. Emission standards for passenger cars

Final Report on Pilot Global Fuel Economy Initiative Study in Ethiopia 2012
123
are defined by vehicle driving distance, g/km. But for heavy duty vehicles (eg., trucks and
buses) standards are defined by engine energy output, g/kWh. Table 6.10 shows Euro III
vehicle emissions standard.
Emission standards for trucks and buses are defined by engine energy output, g/kWh. Table
6.12 shows Euro III standard for trucks and buses.
Table 6.10 Euro II Emission standards in the European Union for passenger cars and light
duty vehicles, g/km ) [Saint Gobain, 2011]
Vehicle Category Engine type Pollutants
CO THC NOx HC+NOx PM
Passenger cars Diesel 0.64 - 0.5 0.56 0.05
Petrol 2.3 0.2 0.15 - -
Light-commercial
vehicles ≤ 1305 kg
Diesel 0.64 - 0.50 0.56 0.05
Petrol 2.3 0.20 0.15 - -
Light-commercial
vehicles 1305-1760 kg
Diesel 0.8 - 0.65 0.72 0.07
Petrol 4.17 0.25 0.18 - -
Light-commercial
vehicles
>1760max3500
Diesel 0.95 - 0.78 0.86 0.10
Petrol 5.22 0.29 0.21 - -
Table 6.11 Euro III emission standard for heavy duty diesel vehicles, g/kWh
[Wikipedia 2007],
Vehicle category CO HC NOx PM
Trucks and buses 2.1 0.66 5.0 0.1
Heavy duty cargo vehicles
(2000kg and above)
2.1 0.66 5.0 0.1
The emission limit values specified in standards should not be exceeded in order to avoid air
pollution. Regulatory guidelines require that new vehicles should be fitted with catalytic
converters in order comply with the emission limit values defined by the standards.

Final Report on Pilot Global Fuel Economy Initiative Study in Ethiopia 2012
124
Moreover, fuel quality also plays a major role in controlling emissions and performance of
the converter. High sulfur content fuel can cause catalyst poisoning thereby reducing its
effectiveness. Catalytic converters are considered to be effective and viable measures to
achieve emissions reduction and improve ambient air quality. High sulfur has also a potential
to produce high emission of sulfur oxides. It is therefore necessary that refined low sulfur fuel
be used to control vehicle emissions.
b) Catalytic Converter
Catalytic converter is a vehicle emissions control device which converts toxic byproducts of
combustion to less toxic substances by catalyzed chemical reactions before they leave
vehicles exhaust system [Wikepdea, 2012]. This device reduces vehicular emissions by
chemical reactions performed on the surface of catalyst fitted in a housing through which
exhaust gas is passed.
The rising air pollution in Addis Ababa requires that vehicles should have calataytic
converter corresponding to the standard.

Final Report on Pilot Global Fuel Economy Initiative Study in Ethiopia 2012
125
7. TECHNOLOGY OPTIONS AND POLICY MEASURES FOR FUEL EFFICIENT VEHICLES 7.1 Technology Options for Fuel Efficient and Clean Vehicles 7.1.1 Technology Options for Increasing Fuel economy
The gasoline engine, which was invented by Nicolas Augusto Otto, was operating with only
incremental improvement since 1876. To make these engines fuel efficient, new technologies
such as electronic ignition and electronic injection were introduced in 1970s and made the
carburetor and conventional ignition systems obsolete to cope with escalating fuel prices
caused by Arab-Israel war. All passenger cars with gasoline engines manufactured after
1990s have electronic injection system and ignition system. As a result, incremental change
in vehicle fuel economy was obtained. A shift from mechanical individual fuel injection
system to common rail electronic injection system was also observed in diesel engines.
Although some success was obtained in increasing fuel economy of the reciprocating internal
combustion engine, with the incorporation of more improvements the limit will be
approached. A better result in fuel economy was obtained by using new concepts such as
hybrid, electric and fuel cell engines.
The technological options and their limitations for increasing fuel economy to improve fuel
economy are discussed in this section and reported in literature [ Lipman, 2003],(IEA,2008].
a) Hybrid electric vehicle (HEV)
This is a vehicle that is powered by an on-board internal combustion engine which is
complemented by an electric motor that is driven by a battery, charged by electricity
recovered via regenerative braking. The braking energy that could otherwise be lost as heat is
recovered by driving an electric motor as a generator and stored by charging batteries. Any
excess power and braking power while a hybrid vehicle travels downhill, will be used for
driving a generator. The engine and the electric motor of hybrid vehicles can be in a series or
parallel configured as sown in Figure 7.1. In series configuration, the engine drives an
electric motor that delivers power to the wheels and in parallel configuration, both can
provide power directly to the wheels. Hybrid vehicles use an electric motor to start and drive
at low speed range. Hence, the engine can be stopped when the car is idling at traffic light.
The vehicle will restart by electric motors and then the gasoline engine will be engaged after
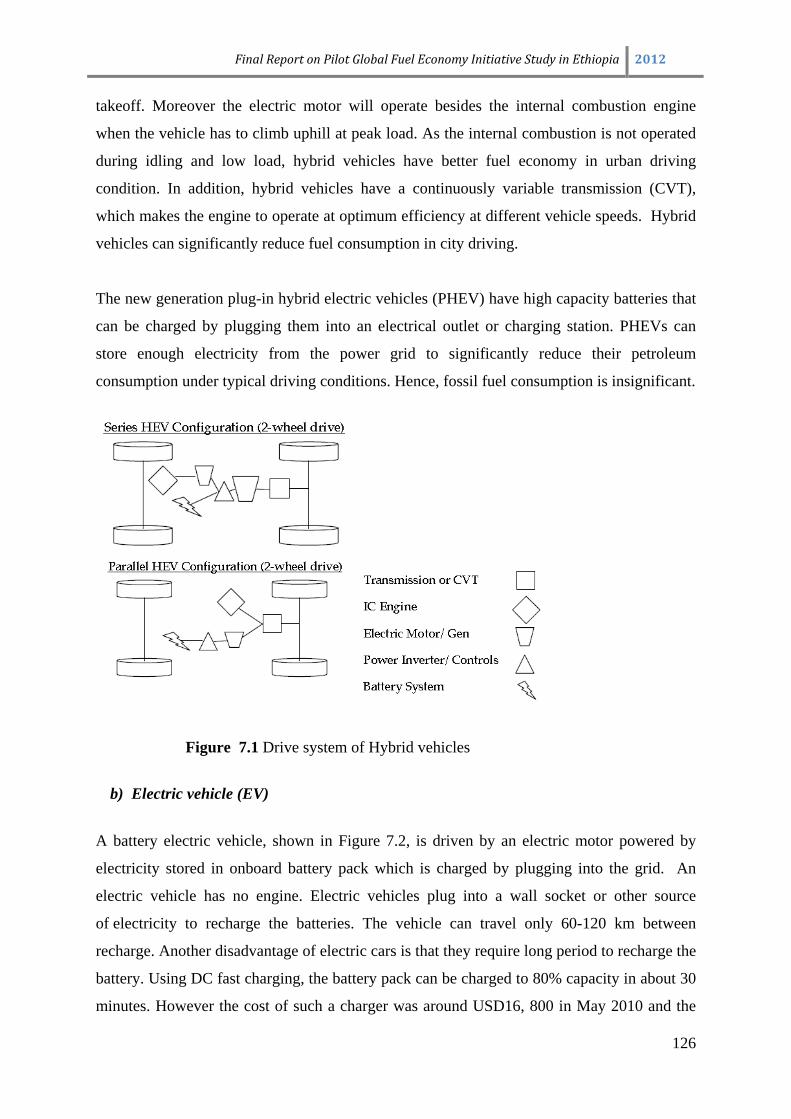
Final Report on Pilot Global Fuel Economy Initiative Study in Ethiopia 2012
126
takeoff. Moreover the electric motor will operate besides the internal combustion engine
when the vehicle has to climb uphill at peak load. As the internal combustion is not operated
during idling and low load, hybrid vehicles have better fuel economy in urban driving
condition. In addition, hybrid vehicles have a continuously variable transmission (CVT),
which makes the engine to operate at optimum efficiency at different vehicle speeds. Hybrid
vehicles can significantly reduce fuel consumption in city driving.
The new generation plug-in hybrid electric vehicles (PHEV) have high capacity batteries that
can be charged by plugging them into an electrical outlet or charging station. PHEVs can
store enough electricity from the power grid to significantly reduce their petroleum
consumption under typical driving conditions. Hence, fossil fuel consumption is insignificant.
Figure 7.1 Drive system of Hybrid vehicles
b) Electric vehicle (EV) A battery electric vehicle, shown in Figure 7.2, is driven by an electric motor powered by
electricity stored in onboard battery pack which is charged by plugging into the grid. An
electric vehicle has no engine. Electric vehicles plug into a wall socket or other source
of electricity to recharge the batteries. The vehicle can travel only 60-120 km between
recharge. Another disadvantage of electric cars is that they require long period to recharge the
battery. Using DC fast charging, the battery pack can be charged to 80% capacity in about 30
minutes. However the cost of such a charger was around USD16, 800 in May 2010 and the

Final Report on Pilot Global Fuel Economy Initiative Study in Ethiopia 2012
127
fast charger will also gradually degrade the battery capacity. 10-20 % loss is expected in a
10-year period. By increasing considerably the electrical energy that can be stored in the
battery and cutting the battery cost, the technology can be made reliable to compete with
conventional vehicles.
Figure 7.2 Battery pack of electric vehicle under the body
Electric vehicles and plug-in hybrid vehicles have high potential to significantly reduce fuel
consumption which can benefit to achieve fuel sustainability and reducing emissions of
pollutants and CO2. In Ethiopia where electricity is generated without direct CO2 emission or
with small life cycle GHG emission, electric vehicles can contribute 100 % in direct fuel
savings and about 85 % life cycle CO2 emission reduction per vehicle
Electric and plug-in hybrid electric vehicles are developed by large number of vehicle
manufacturers in different countries. They are viewed as a breakthrough in reducing GHG
emission in the transport sector and strong dependence on fossil fuels.
There are several barriers that shall be addressed before mass-market penetration can be
achieved. These barriers include:
• Limited vehicle travel distance between recharge

Final Report on Pilot Global Fuel Economy Initiative Study in Ethiopia 2012
128
• High initial cost due to high costs of batteries
• Limited availability of recharging infrastructure.
It is hoped that some of the major barriers will be overcome up to 2020 and the electric
vehicle and plug-in hybrid vehicles will penetrate the market in significant number beyond
2020.
c) Fuel efficiency improvement of conventional passenger cars
It is believed that the efficiency of conventional vehicles will increase with the incremental
approach by making combustion more efficient, reducing engine and valve gear friction,
making the body compact and reducing the engine size. Improvements to gasoline engines
injection system using injection engine is estimated to attain 18% reduced fuel consumption.
Cylinder shutoff during low load conditions and improved valve timing and lift controls are
some of the measures to improve fuel efficiency of passenger cars. (SAE International,
2003a)
d) Proper maintenance of old vehicles and gradual replacement
The study on vehicle fleet classification in Ethiopia indicated that the majority of saloon and
compact passenger cars are older than 15 years and their fuel efficiencies are low. The fuel
economy of these vehicles is less than 8 km/liter for city driving. New vehicles with
equivalent power have fuel economy off 12-15 km/liter. Hence, enhancing the replacement of
the old vehicles, higher fuel economy can be achieved. In countries like Ethiopia, where the
vehicle engines are not tuned optimally, proper maintenance of vehicles by availing spare-
parts and tools is expected to improve fuel economy by about 10-20 % per vehicle older than
15 years. Some studies indicate that proper vehicle engine tuning can yield 10% decrease in
fuel consumption (IPCC, 1996). Replacement of bias (cross-ply) tires with radial tires can
reduce fuel consumption by about 10%. In Ethiopia, considerable portion of cars use bias
tires. Hence, regular tire inspection and maintenance as well as replacement of bias tires can
increase fuel economy.
e) Reducing traffic congestion by road improvement and use of mass transit
Traffic congestion will cause a car to idle and consume fuel while not travelling or travelling
at low speed. Even though the number of vehicles in Addis Ababa is about quarter a million,
traffic congestions happen in some part of the city. Construction of over and underpasses at

Final Report on Pilot Global Fuel Economy Initiative Study in Ethiopia 2012
129
some road junctions and implementation of the planned light rail and bus rapid transit can
contribute to improvement of fuel economy
f) Popularization of EC0-driving habit
Eco driving or driving habit with high acceleration and braking will result in higher fuel
economy. Hence, Eco driving has to be popularized by distributing flyer and launching
demonstrating video on TV.
Some of the rules of ECO driving are:
• Start slowly, avoiding rapid acceleration.
• Use the highest gear possible, and lower the engine speed.
• Maintain a constant speed during travelling
• Anticipate traffic conditions, and accelerate and decelerate smoothly – it is safer, uses
less fuel, and reduces brake wear.
• Drive at road posted speed limits.
• Avoid idling for any stop of longer period reduces fuel consumption and carbon
dioxide emissions.
• Check the tire pressure monthly with cold tires.
• Replace air filters regularly - saving up to 10% fuel consumption.
7.1.2 Emission Control Technologies
a) Catalytic Converters of Gasoline Engines
Two-way catalytic converter: It oxidizes carbon monoxide to carbon dioxide and
hydrocarbons unburned or partially burned during combustion, present in the exhaust gas, to
carbon dioxide and water over a platinum or palladium catalyst. The catalyst aids the
reaction of carbon monoxide and hydrocarbons with the remaining oxygen in the exhaust gas.
Three-way catalytic converter: The reduction catalyst is the first stage of this catalytic
converter (Figure 7.3). It uses rhodium catalyst coating to reduce the NOx to nitrogen. In the
second stage carbon monoxide and hydrocarbons are oxidized to carbon dioxide and water in
the same way as in two way catalytic converter.

Final Report on Pilot Global Fuel Economy Initiative Study in Ethiopia 2012
130
Figure 7.3 Three way catalytic converter
Two way catalyst converters became obsolete since they do not reduce NOx emission. At
present all vehicles with petrol engines have three way catalytic converters. The price of such
type of catalytic converters starts with USD 200.
b) Catalytic Converters for Diesel Engines
Diesel Oxidation Catalyst:- It is the most commonly used catalytic converter is the
compression ignition engine. This catalyst converter oxidizes carbon monoxide and
hydrocarbons in the exhaust by excess oxygen in the exhaust.
Diesel particulate filter:- Catalytic converters cannot clean up soot or elemental carbon.
Hence particulates are cleaned up by diesel particulate filter. Particulate filter efficiency is
adversely affected by sulfur dioxide in the flue gas, which by oxidation in the catalytic
converter and combining with water, converts to sulfuric acid. Low sulfur fuel is a
prerequisite for efficient and sustainable performance of diesel particulate filters.
Hence there is a need to shift to gasoil with 50 ppm maximum sulfur. The price difference
between the Standard Diesel grade (500 ppm) and the low sulfur diesel grade (50 ppm) is said
to be about 1%.
7.1.3 Alternative Fuels
Bio-fuels have the potential to replace a significant part of gasoline and gasoil used in the
transport sector. According to Climate Resilient Development Plan of Ethiopia, biofuels
share of transport fuels shall increase to about 15% for gasoline engines and 5 % for diesel
engines by 2030. With expansion of sugar industries, Ethiopia will not only have sufficient
ethanol to blend with gasoline in 15-85 % proportion, but also can produce bioplastics such

Final Report on Pilot Global Fuel Economy Initiative Study in Ethiopia 2012
131
as polyethylene and pet from ethanol. Hence, the plan in CRDGA for ethanol-gasoline
blending can be easily achieved. With regard to biodiesel, numerous foreign companies with
local partners have acquired investment licenses. For example, Global Energy Ethiopia
(GEE) is planting a castor and jatropha to process 40,000 tons per annum. GEE leased
30,000 hectares of land in Wolaita Soddo in the Southern Nations Nationalities and Peoples
Regional State for this purpose. Therefore, it will be reasonable to assume the share of
biodiesel in reduction of gasoil will reach 10 % by 2050. Averaging the share of ethanol in
reducing gasoline and that of biodiesel in reducing gasoil and noting that the heating value of
ethanol is two third of that of gasoline, the replacement of fossil fuels with bio-fuels will
reach 10 % by 2050.
7.2 Policy Measures for Promoting Cleaner and Efficient Vehicles
Some of the policy measures in this section are discussed in the literatures {GEFI,2010]
7.2.1 Enhancing Vehicle Efficiency Improvement
a) Mandatory requirement of fuel efficiency and emission certificate for vehicles to be
imported or assembled in the country.
In addition to this all vehicles for sale shall post fuel economy value on display.
b) Banning of import of old second hand vehicles
Although the initial price of old second hand vehicles is low, the operating costs are high due
to excessive fuel consumption caused by the deterioration of the engine due to aging and hih
frequency of maintenance. New vehicles and relatively newer second hand vehicles require
only servicing that is replacement of air filter, fuel filter, engine oil and oil filter often every
5000 km. Second hand vehicles might require the following types of maintenance as soon as
bought.
• Front brakes have to be replaced every 40,000 km and rear every 70,000 km
• Require replacement shock absorbers, batteries and tires
• Vehicles that travelled 200,000 km require engine overhaul and other accessories.
• If the body is corroded, the corroded part has to be removed and welded and the it
must be repainted.

Final Report on Pilot Global Fuel Economy Initiative Study in Ethiopia 2012
132
Hence, old second hand vehicles have high operating costs. In addition when a vehicle has to
be maintained, the user needs to rent another car or use taxi (especially for business purpose).
This cost is called downtime costs which increase as the vehicle becomes older.
Experience from other African that legislated policy on second hand-vehicles indicate that
the maximum age limited to maximum of ten years as follows.
Algeria - -3 years.
South Africa – new only
Sudan - new (except migrants)
Kenya - 8 years
Lesotho - 8 years
Gabon - 5 years
Mozambique cars – 5 Vans -9
Niger - 5 years
From the economic analysis conducted in this study in next chapter and lessons learnt from
bench marked countries, it is recommended to limit the age of second hand vehicles to be
imported to Ethiopia 8-10 years.
Banning import of vehicles older than 8-10 years, will contribute to increase fuel economy
due to newer vehicles with improved technology and higher efficiency.
c) Introduction of hybrid and electric vehicle
Duty free import for pilot introduction of electric and hybrid electric vehicles is essential as a
transfer program. The pilot technology transfer program can be carried as follows;
• 200 hybrid vehicles (duty free) in public enterprise or as hotel taxi fleet • 50 electric vehicles such as service vehicles in premises of Ethiopian airlines
In addition, legislation for total exemption of excise tax of hybrid vehicles and plug-in
electric vehicles is necessary to enhance dissemination of these fuel efficient vehicles. It is
hoped that after 2020, these vehicles will penetrate the market and become considerable after
2030.

Final Report on Pilot Global Fuel Economy Initiative Study in Ethiopia 2012
133
d) Improvement of maintenance infrastructure of vehicles and increasing awareness
In order to improve condition of vehicles, it is necessary to avail more spare parts and tools
by reducing import duty tax. It also necessary to control vehicle condition during annual
inspection, initiate certification of vehicle maintenance workshops and increase awareness on
fuel economy. Drivers shall also be aware of not to accelerate and brake frequently too, select
less congested route and time.
7.2.2 Use of cleaner fuels
Although, the sulfur content of the imported diesel fuel in Ethiopia has recently decreased
appreciably to 500 ppm and below, the high sulfur content of the fuel is still an obstacle for
effectiveness of particulate matter removal from diesel engine exhausts.
With regard to sustainable use of biofuel, major achievement was scored in using gasoline
ethanol blend. However, commercial production of biodiesel has not commenced as
expected. The investors did not go beyond pilot plantation.
Hence, the following courses of actions are recommended to promote cleaner fuels
• Amending the Ethiopian standard for limiting sulfur to 50 ppm maximum in diesel
fuel by 2015 so that modern vehicles with diesel engines with lower particulate
emissions can effectively use particulate filter for cleaning exhaust.
• Preparation of incentive package to promote biodiesel production such as VAT
exemption
• In addition, improvement of EPE and Ethiopian Standard laboratory infrastructure are recommended.
Although some vehicles in Ethiopia are fitted with catalytic converters, most of the
catalytic converters are ineffective due to use of unleaded gasoline in earlier years (old
vehicles), high sulfur content in the fuel and no replacement of damaged units.

Final Report on Pilot Global Fuel Economy Initiative Study in Ethiopia 2012
134
Figure 7.4 Availability and enforcement of low sulfur diesel in Middle East
7.2.3 Emission Control
The high level of CO and PM emission in traffic congestion areas of Addis Ababa, although
the vehicle stock is very low even compared to African cities such as Nairobi, indicates that
the necessity of functional and effective catalytic converters for every vehicle.
As the sulfur content of the fuel is 500 ppm at present, diesel particulate filter will not
become fully effective unless stringent vehicle emission standards such as Euro IV and above
are implemented. However, implementation of Euro III with maximum 150 ppm sulfur
content in the fuel will considerably reduce particulate matter emission. The transition to
Euro IV emission standard has to be delayed as some of the vehicles imported from china
will be able to conform to it only in 2013 and until the maximum sulfur content in the fuel is
limited to 50 ppm. It is recommended that Ethiopia shall adopt Euro III emission standard in
2015 and move to Euro IV in 2017. The availability of low sulfur diesel is not a problem as
most of the Gulf States are going for low sulfur diesel as shown in Figure 7.4
The emission standard shall incorporate the following
• All vehicles to be imported or assembled in the country after January, 2015 except three wheel vehicles shall have catalytic converters that confirm at least to Euro III emission standard and after January 2017 to Euro IV emission standard.

Final Report on Pilot Global Fuel Economy Initiative Study in Ethiopia 2012
135
• All three wheels vehicle to be imported after January 1st, 2015 shall have four stroke engines and a catalytic converter.
• All vehicles imported after 2015, without functional catalytic converters shall be penalized upon annual inspection after 2015.
The above policy measures which have to be formulated in legislation are given as draft
legislation given in Appendix 1.
7.3 Targets for Fuel Economy Improvement and Average Fuel Economy In order to determine the targets for fuel economy improvement, the light duty vehicles
population in Ethiopia was projected with the assumption that the present growth rate will
prevail and the high taxes on light duty vehicles, high fuel prices and improvement in public
transport with introduction of light transit train in Addis Abba will continue to encourage use
of public transportation and discourage owning of personal cars. The projection of light duty
vehicles is shown in Figure 7.5. If the vehicle population increases at faster rate, it means
vehicles with newer technology with lower fuel consumption will be more in proportion and
higher improvement in fuel economy can be achieved. The fuel economy for the baseline
year or 2005 is 11.5 km/liter for new vehicles and 9 km/liter for the fleet as a whole.
Figure 7.5 Forecasted LD vehicle at present actual growth rate.
0
200,000
400,000
600,000
800,000
1,000,000
1,200,000
1,400,000
2010 2015 2020 2025 2030 2035 2040 2045 2050
LD V
ehic
le Q
TY
Year

Final Report on Pilot Global Fuel Economy Initiative Study in Ethiopia 2012
136
7.3.1 Target for 2020
It is assumed that 60 % of the vehicles in 2020, which will be registered between 2010 and
2020, will have an average fuel economy of 13 km/liter in city driving due to improved
polices and technology. The old vehicles, which were registered before 2010, are assumed to
have 9 km/liter fuel economy and account to 40 % of the fleet. The target fuel economy for
new vehicles and the vehicle stock is given in Figure 7.1.
Table 7.1 Fuel Economy Target for 2020
Improvement measure Fossil Fuel Economy Improvement
1 Preventive maintenance of vehicle and awareness 5 % 2 Vehicles fleet efficiency improvement 17.5 % 3 Bio-fuels 2.5% Total 25%
Average fuel economy target of new vehicles 6.25 L/100 km (16 km/L)
Average fuel economy target of the fleet 9.05 L/100 km
(11.05 km/L)
7.3.2 Target for 2030
Table 7.2 Fuel Economy Target for 2030
Improvement Measure Fossil Fuel Economy
Improvement 1 Preventive maintenance of vehicle and awareness 5 %
2 Vehicles fleet efficiency improvement 25 %
3 Hybrid vehicles 2.5%
4 Bio-fuels 7.5%
Total 40%
Average fuel Economy target of new vehicles 5 L/100 km (20 km/L)
Average fuel economy target of the fleet 7.6 L/100 km (13.05 km/L)

Final Report on Pilot Global Fuel Economy Initiative Study in Ethiopia 2012
137
In this case, it is assumed that 50 % of the vehicles in 2030, which will be registered between
2020 and 2030, will have average fuel economy of 17 km/liter in city driving due to
improved polices and technology. Vehicles registered between 2010 and 2020 will account
30 % of the fleet and will have fuel economy of 12 km/liter. The old vehicles, which were
registered before 2010, are assumed to have 9 km/liter fuel economy and account to 20 % of
the fleet. The targets to be met are shown in table 7.2.
7.3.2 Target for 2050
Here it is assumed that 45 % of the vehicles registered before 2030 will have fuel economy
of 12.5 km/liter and 45 % of vehicles are registered after 2030 with average fuel economy 20
km/liter. In addition 12 % vehicles ( 9% hybrid vehicles and 3 % electric vehicles) will be
electric and plug-in hybrid vehicles saving 7 % of fuel consumed. Table 7.3 shows the
obtained targets
Table 7.3 Fuel economy target for 2050
Efficiency Improvement Fossil Fuel
Economy Improvement 1 Vehicles fleet efficiency improvement 30 % 2 Hybrid and electric vehicles 7% 3 Bio-fuels 7.5% Total 44.5 %
Average fuel economy target of the fleet 6.05 L/ 100 km (16.6 km/L)
The comparison of projected fuel economy of new vehicles of Ethiopia with the European
Union and China shows that Ethiopia will still lag behind the world average by 2030 as
shown in Figure 7.5. However compared to the benchmark year 2005, it comes near to
achieving targets set by GFEI by partially substituting petroleum by bio-fuel in addition fuel
economy improvement obtained due to incremental technology improvement of conventional
vehicles and introduction of new technologies such as hybrid and electric vehicles starting
2020.

Final Report on Pilot Global Fuel Economy Initiative Study in Ethiopia 2012
138
Figure 7.5 Target average fuel economy of new vehicles of Ethiopia compared to
other countries

Final Report on Pilot Global Fuel Economy Initiative Study in Ethiopia 2012
139
8. COST BENFIT ANALYSIS OF POLICY MEASURES
8.1 Scope of the Life Cycle Cost Analyses
The objective of the analyses is to compare available vehicle technologies with respect to
possibility of private end users making economically rational decision toward cleaner technology
when purchasing a new car. Therefore, the life cycle cost methodology has been chosen to
determine and quantify the cost of each vehicle technology. The first goal is to develop a life
cycle cost model and to calculate the private end users costs associated with owning and
operating conventional and cleaner vehicles.
The life cycle cost model is based on forecasts of various vehicle operating costs. The values of
these operating costs are estimated based on the most probable forecasts, which cover a long
period of time. The values of these variables for the most probable outcome scenario may be
influenced by many factors and the actual values may differ considerably from the forecast
values depending on future events. It is therefore necessary to consider the sensitivity of the life
cycle cost model to potential changes in key variables. Accordingly, life cycle cost analyses
under different scenarios is also carried out.
Finally, the tax structure of vehicles in Ethiopia is analyzed and the impact of a new
fiscal system based on the environmental performance of vehicles on making cleaner
technologies economically competitive with conventional vehicles is analyzed.
8.2 Assumptions and Specifications
Within the life cycle cost analysis, several parameters have to be defined. In this section, the
main assumptions are briefly explained.
8.2.1 Definition of Functional Unit
A functional unit is a quantified description of the performance of product systems, for use as a
reference unit. It allows comparing two or several product systems on the basis of a
common provided service. Within this study, the functional unit will be defined in such a way
that all the life cycle phases of vehicles will be taken into account in the analysis.
Accordingly it has been assumed that the vehicle lifetime is 10 years, with an annual driving
range of 25.000 km or 250,000 km lifetime travel.

Final Report on Pilot Global Fuel Economy Initiative Study in Ethiopia 2012
140
8.2.2 Financial Parameters
The financial parameters that will be taken into account can be divided into the vehicle initial
financial costs and the operating costs related to the use of the car. Vehicle initial costs
comprise the initial investment cost, freight and taxes. Operating costs are the future expenses
related to the use of the car. Operating costs can be divided into fuel operating costs and the
non fuel operating costs ( lubricant, tyre , battery, repair and maintenance, vehicle registration
and insurance).
In order to accurately combine the initial expenses with the future costs, the present value of all
expenses must be determined. Vehicle initial costs occur at the same time, so there is no need to
calculate their present value. Their present value is equal to their actual cost. The operating costs
are in contrast time dependent costs and their present value has to be calculated. In other words
annual operating costs during the life of the vehicle will be adjusted to reflect the time value of
money. Discounting is a technique or a process by which one can reduce future costs to their
present worth or present value.
Operating costs are discounted by a factor that reflects the rate at which today’s value of a
monetary unit decreases with the passage of every time unit. The factor used to discount
operating costs is called the discount rate and is expressed as a percentage.
For the purpose of this study a discount rate of 10% is used and to determine the present value of
future operating costs, the following formula is used
Where:
PV = Present Value A0 = Amount of recurring cost I = Real Discount Rate T = Time (expressed as number of years)
8.2.3 Technical Specification of Vehicles
The following vehicle technologies were included in the life cycle cost analysis.
a) Toyota Yaris conventional specification
Prime mover Petrol engine
Engine power 74 kW
Engine Disp. volume 1500 c.c.

Final Report on Pilot Global Fuel Economy Initiative Study in Ethiopia 2012
141
No of cylinders 4
Transmission 4 speed automatic or 5 manual
Average fuel consumption 13.5 km/l
CO2 emissions 79 g/km
Figure 8.1 Toyota Yaris
b) Toyota Yaris Hybrid specifications.
Prime mover petrol engine and battery powering the electrical motor
Engine power 55 kW
Engine Disp. volume 1500 c.c.
No of cylinders 4
Transmission 4 speed automatic
Engine power 55 kW
Total maximum power 74 kW
Average fuel consumption 28.5 l/ km
CO2 emissions of only 79 g/km,
c) Nissan Leaf Electric Vehicle
Prime mover Electric motor
Power 80 kW
Torque 280 N·m
Drive: Front-mounted synchronous electric motor driving the wheels,
Battery: 24 kilowatt-hours (86 MJ) lithium ion battery pack

Final Report on Pilot Global Fuel Economy Initiative Study in Ethiopia 2012
142
Battery weight 300 kilograms
Cost of battery: US$18,000
Energy consumption: 765 kJ/km (34 kWh/100 miles)
Life span of battery: 10 years or minimum160,000 km
Interval between charges: 117 km
Cost USD 27,000
Figure 8.2 Nissan Leafi
8.2.4 Current Tax Regime for Importing Vehicles
In Ethiopia imported vehicles are liable to five different taxes. These taxes are assigned
priority levels and are calculated in a sequential order. These taxes, in their sequential order,
are Customs Duty, Excise Tax, VAT, Surtax and Withholding Tax. The rates applied
especially for Excise Tax differ from vehicle to vehicle based on the horse power of the
vehicle. For the type of vehicles under consideration the rates are as followed;
• Duty (35% of CIF)
• Excise (50 % of CIF + Duty)
• Sur Tax (10% of CIF + excise +duty)
• VAT (15% of CIF + excise + duty + sur tax)
• With hold (3% of CIF)

Final Report on Pilot Global Fuel Economy Initiative Study in Ethiopia 2012
143
8.3 Results of Life Cycle Cost Analyses
8.3.1 Base Case
Under the base case scenario the current tax regime is considered. The current price of fuel is
assumed to increase by 5% annually. The cost of electrical energy is assumed to be Birr 0.65
per kwh. Total mileage traveled per vehicle per year is considered to be 24,000 km. The
battery for electric vehicles is assumed to be replaced every 166,000 km.
Based on the above assumptions under the base case scenario the life cycle cost of
conventional, hybrid and electric vehicles is Birr 745,539, Birr 826,643 and Birr 1,243,680,
respectively (see Figure 8.3 and for details see Appendix.)
Figure 8.3 Life cycle cost of the vehicles with the existing tax regime in Birr
However, when the mileage traveled per vehicle per year is considered to be 36,000 km/year
a different picture immerges where new conventional vehicles followed by five year old
conventional second hand vehicles and hybrid vehicles will become the least expensive (see
Table 8.1). As compared to a mileage of 24,000 km/year when a 36,000 km/year mileage is
considered the life cycle cost for conventional second hand 10 year and 5 year old vehicles
has increased by 26% and 20% respectively while for hybrid and electric vehicles the
increase is only by 8% and 1% respectively.
0
200,000
400,000
600,000
800,000
1,000,000
1,200,000
1,400,000
Conventional Hybrid Electric

Final Report on Pilot Global Fuel Economy Initiative Study in Ethiopia 2012
144
Table 8.1: Life cycle cost of the vehicles for the existing tax regime
Assuming 36,000 km/year
mileage
Type of vehicles LCC in Birr
Conventional (new) 851,209
Hybrid 891,528
Electric 1,255,014
Moreover, assuming that the cost of fuel will increase by 10% annually and the cost of
energy will increase to 1.30 per kwh the total life cycle cost (assuming 24,000 km mileage)
will become Birr 792,144 Birr 855,444 and Birr 1,266,347 for conventional, hybrid and
electric vehicles respectively ( see Table 8.2.)
Table 8.2: Life cycle cost of the vehicles for 24,000 km/y mileage and 10 % fuel inflation
and cost of electricity increase 1.3 Birr/kWh
Type of vehicles ( in Birr) Conventional (new) 792,444 Hybrid 855,444 Electric 1,266,347
8.3.2 With Tax incentive for cleaner vehicles
In this scenario it is assumed that for hybrid and electric vehicles excise and surtax will be
exempted. Accordingly, other assumptions being similar to base case scenario the life cycle
cost of conventional, hybrid and electric vehicles is Birr 745,539, Birr 586,887 and Birr
884,028 (see Figure 8.4.)

Final Report on Pilot Global Fuel Economy Initiative Study in Ethiopia 2012
145
Figure 8.4 Life cycle cost of vehicles with excise and sur tax exemption
8.3.3 Second Hand Vehicles
To compare the live cycle cost of new conventional with imported second hand vehicles,
Toyota corolla 1992, Toyota corolla 2007 model and Toyota Corolla 2002 models have been
considered. The prices of the second hand vehicles were collected from second hand car
dealers and for the new model it was calculated from CIF prices using the cost build up due
to transportation and various taxes. The fuel consumption per 100 km is taken 6, 7, 8.5 and
10 for new, 5 years old, 10 years old and 11 years old vehicles respectively, considering
improvements in technology and efficiency reduction due to depreciation. It was assumed
that each vehicle will change oil every 5000 km. In addition fixed time replacement of
batteries and tires were considered and the cost was apportioned to mileage. For annual
maintenance cost, Birr 3000 was estimated for new vehicle and to increase by 10 % with
age. The 20 year old vehicle certainly will require engine over hauls and replacement of
engine and vehicle accessories. Hence, the average annual maintenance cost was relatively
high.
The analysis with existing fuel price and annual mileage of 24,000 is given in table 8.3 and
Figure 8.5. The results show that the 10 year old vehicle is more economical for the user. In
strict sense, 8 years old would have the least life cycle cost. If the annual mileage increases
to 36,000 km, then a vehicle upto five year old will be economical to the user.
0
100,000
200,000
300,000
400,000
500,000
600,000
700,000
800,000
900,000
1,000,000
Conventional Hybrid Electric

Final Report on Pilot Global Fuel Economy Initiative Study in Ethiopia 2012
146
Table 8.3: Life cycle cost of vehicles of different ages under existing fuel price and 5%
annual fuel inflation under consideration assuming annual mileage of 24,000 km
Age of Vehicle LCC in Birr
20 743,362
10 707,132
5 722,589
New 743,362
Figure 8.5 Comparison of Life cycle cost of different ages under existing fuel price and 5%
annual fuel inflation.
Table 8.4: Life cycle cost of vehicles of different ages under existing fuel price and 5%
annual fuel inflation under consideration assuming annual mileage of 36,000 km
Age of Vehicle LCC in Birr
20 1,083,697 10 907,536 5 892,464
New 890,5849
0
200,000
400,000
600,000
800,000
1,000,000
20 10 5 New
LCC
in B
irr
Vehicle Age
Final Report on Pilot Global Fuel Economy Initiative Study in Ethiopia 2012
147
The above analysis does not include down time cost of an old vehicle during maintenance
which hast to replaced by rented vehicles temporarily. Hence, it is conclude 8- 10 year old
vehicles are economical for personal cars with less annual mileage and 0-5 year old vehicles
are economical for business application with increased annual mileage.
8.3.4 Impact off Tax Incentives for Cleaner Vehicles inn Government Revenue
Assuming that in 2030 the total light duty vehicle population of the country will become
600,000 and the share of hybrid and electric vehicles from the total will be 3% or 18,000
vehicles and considering the average excise and sur tax the government collects from the
hybrid and electric vehicles under consideration (Birr 390,918) the total amount of tax
income loss for the government for introducing tax exemption for cleaner vehicles by 2030 is
estimated at Birr 7.021 billion or Birr 413.9 million annually.
8.3.5 Conclusion
Under the current tax system, the life cycle costs is significantly lower for conventional
vehicles compared to other vehicle technologies. The main reason for this advantage is the
high initial price for both hybrid and electric vehicles and the ensuing high tax and for
electric vehicles also the high battery replacement costs. However, with excise and sur tax
exemption for hybrid electric vehicles their life cycle cost will be lower than the
conventional vehicles. Hence, private end users cannot make rational decision, based on
economical aspect, toward cleaner technology when purchasing a new vehicle under the
current tax regime for vehicles. Although the life cycle cost of electric vehicles is high,
breakthrough through in battery technology will bring drastic decrease in initial cost in the
near future. Hence, the technology transfer activity has to begin for both vehicles.
8.4 Benefits and costs associated with sulfur reduction in fuel
Experience of countries like USA, China, Mexico, Europe and studies conducted on African
refineries showed that the average consumer cost of reducing sulfur levels to 15 ppm is from
3.66 to 7 USD cents per liter (Sandy Thind, 2000, Abidjan, 2009). Hence, reduction of sulfur
content of a fuel from 5000 to 150 ppm in Ethiopia, for instance, will not add more than 5
USD cents per liter. Accordingly, if the petroleum enterprise of Ethiopia reduces the sulfur

Final Report on Pilot Global Fuel Economy Initiative Study in Ethiopia 2012
148
content of the Diesel from 5000 to 150 ppm and even down to 50 ppm, the incremental cost
is expected to be around 5 USD cents per litter cost on the current market price of the fuel.
Ethiopia has imported 1,232,894 ton (1,450,463,529.42 liter) of diesel fuel in 2012 (Ethiopian
PE, 2012). The cost of importing of diesel fuel would have increased form around USD
1,289,300,915.037 to USD 1,360, 535,728.588, if low sulfur fuel were imported in the same
year to Ethiopia. Definitely, as most countries will go for low sulfur diesel option in the
future, the incremental cost will lower due to economy of scale.
Lowering the sulfur content of diesel fuel has a lot of economic benefits though the price
seems to be high at first. Benefits will overtake costs in years as it has been witnessed by
tangible researches conducted in US, Europe, China and Mexico as shown in Figure 8.6. In
summarizing the complex costs and benefits of low sulfur diesel, it was estimated that the
annual monetized net benefits would be $66.2 billion due to the thousands of avoided
hospital admissions, asthma emergencies, lost work days, chronic pulmonary ailments, other
health impacts, reduced agricultural crop and commercial forest damage (U.S. EPA, 2007).
The same patterns were seen in Mexico, Europe and other countries (ICCT, 2009).
Source: Costs and Benefits of Reduced Sulfur Fuels in China,( ICCT, 2006).
Figure 8.6 Projected incremental cost and benefits of low sulfur fuel in China

Final Report on Pilot Global Fuel Economy Initiative Study in Ethiopia 2012
149
Using low-sulfur diesel offers economic benefits beyond the obvious public health and
environmental improvements. Low-sulfur diesel can reduce maintenance costs over the life of
a vehicle because it reduces engine corrosion and makes engine lubricating oil less prone to
acidification and this leads to longer maintenance intervals and lower maintenance costs.

Final Report on Pilot Global Fuel Economy Initiative Study in Ethiopia 2012
150
9. CONCLUSION AND RECOMMENDATION
The study compiled and used data of registered vehicles and annual inspected vehicles in
Ethiopia, scanned parameters of imported gasoline and gasoil, reviewed legislation and
regulation of relevant to vehicle import registration, inspection and vehicle emission,
conducted measurement of ambient air quality at 12 selected sites in Addis Ababa, reviewed
new vehicle technologies and conduct cost benefit analysis of measures that require
introduction of new technologies. Finally policy recommendations to promote efficient and
cleaner vehicles and draft legislation on vehicle emission standard and related were prepared.
Major finding of the study can be concluded as follow.
• Gasoline engine vehicles in Ethiopia are aging consuming more fuel and with
increased emissions
• The relatively low average fuel economy indicates importation of old second hand
vehicles has to be stopped and minimum fuel economy standard for different class of
vehicles has to beset
• The high-level of particulate matter emission indicates that vehicle emission standard
implementation is crucial.
• Implementation of vehicle emission standard will require radical reduction of sulfur
content of the fuel. Hence, Ethiopian fuel standard has to be revised.
• New vehicle technologies that promote fuel efficiency and emissions reduction has to
be introduced into the country at first and disseminated. Toward this, incentives
packages have to be prepared and maintenance support has to be arranged.
In addition to this, the following recommendations are made to facilitate the implementation
of the study:
• As the particulate matter emission is alarming, detailed ambient air quality study has
to be conducted at least for a year for more sites in Addis Ababa and other cities with
high traffic.
• Task forces shall be formed from the stakeholder including from Ministry of
Transportation to implement the different aspects of the study.

Final Report on Pilot Global Fuel Economy Initiative Study in Ethiopia 2012
151
• ECRA shall revise its newly registered vehicle database so that it can facilitate
tracking of vehicle fuel efficiency similar to the cleaned vehicle database in this study
• Computerized vehicle inspection data recording has to be improved to facilitate
classification of vehicle stock and implemented in regions where it is absent.
• The laboratory infrastructure of EPE has to be strengthened.

Final Report on Pilot Global Fuel Economy Initiative Study in Ethiopia 2012
152
REFERENCES
Abidjan (2009), Costs and Benefits of lower sulfur Fuels, Implication for West and Central Africa on Better Air quality
Blumberg, K. O., M. P. Walsh and C. Pera (2003),. Low-Sulfur Gasoline & Diesel: The Key to Lower Vehicle Emissions, http://www.unep.org/transport/pcfv/PDF/PubLowSulfurPaper.pdf, retrieved on August 27, 2012.
Bacha, John et al. (2007), ’Diesel Fuels Technical Review’, Cheveron Corporation, USA.
Blend Petrol, Department of the Environment, Water, Heritage and the Arts, Australia, http://www.environment.gov.au/atmosphere/fuelquality/publications/pubs/ethanol-health-impacts.pdf, retrieved August 27, 2012.
Chevron Corporation, (2007), Diesel Fuel Technical Review USA, www.chevronwithtechron.com/Diesel_Fuel_Tech_Review.pdf, retrieved on August 27, 2012.
EPA (2003), Guideline Ambient Environment Standards for Ethiopia.
Farnlund, Sairam and Holman, Claire (2001), Emissions of Ultrafine Particles from Different Types of Light DutyVehicles, Swedish National Road Administration Publication..
Faiz, A. et al (1996) Air Pollution from Motor Vehicles: Standard and Technologies for Controlling Emissions, World Bank 1996.
FDRE (2011), The Federal Democratic Republic of Ethiopia, Environmental Protection Authority, “Ethiopia’s Climate Resilient Green Economy Strategy.
Forum for Environment (2008), Agro fuel Development in Ethiopia: Rhetoric, Reality and Recommendations.
GFEI (2010), 50BY50 Making Cars 50% More Fuel Efficient by 2050 Worldwide
Guta, D. D. (2012), Assessment of Biomass Fuel Resource Potential and Utilization in Ethiopia: Sourcing Strategies for Renewable Energies, International Journal Of Renewable Energy Research ,Vol. 2, No.1, 2012
Hart Energy’s International Fuel quality Center (2012), www.ifqc.org, visited on August 29,2012.
http://glendalepower.co.uk/Environment/assets/Carbon%20Trust%20Conversion%20Factors.pdf
International council on clean Transportation (icct, 2009). Cost benefits of lower sulfur fuels in Mexico
International council on clean Transportation (icct, 2006). Costs and Benefits of Reduced sulfur fuels in China
ICCT (2012),Global Comparison of Light-Duty Vehicle Fuel Economy/GHG Emissions Standards
IEA (2008), Review of international policies for vehicle fuel efficiency, International Energy Agency, Paris.
IEA (2008), Review of international policies for vehicle fuel efficiency, International Energy Agency, Paris.

Final Report on Pilot Global Fuel Economy Initiative Study in Ethiopia 2012
153
Kosub, Jeffry (2010), Transitioning to a Greener Fleet: A Cost-Benefit Analysis of a Vehicle Fleet Program at the Texas, General Land Office in Austin, Texas.
Kume, Abera, et al. (2010), Magnitude and Variation of Traffic Air Pollution as Measured by CO in the City of Addis Ababa, Ethiopia, Ethiop. J. Health Dev., 24(3).
Lipman, Timothy E.( 2003), Hybrid-Electric Vehicle Design Retail and Lifecycle Cost Analysis
Ministry of Mines and Energy (2010). Energy policy of Ethiopia, country paper by Japan International Cooperation Agency (JICA)
Mosse, A (2002). Determinants of Gasoline and Diesel Demand in Ethiopia, Addis Ababa University, School of Graduate Studies, Addis Ababa, Ethiopia.
ORBITAL & CSIRO (2008), Evaluating the Health Impacts of Ethanol
Review of Fuel Quality Requirements for Australian Transport, Chapter 3 - International Fuel Quality Studies and Regulations, www.environment.gov.au/atmospher/fuel quality, retrieved on August 2, 2012.
Saint Gobin (2011), European Emission standard.
Sandy Thind, (2002), the transition to ultra low sulfur, Air and Waste management Association Saudi Arabian section
The Federal Democratic Republic of Ethiopia Ministry of Mines and Energy (2007). The Biofuel Development and Utilization Strategy, Addis Ababa, Ethiopia.
Thomas, Charles, et al. (2002),The GHG Indicator: UNEP Guidelines for Calculating Greenhouse Gas Emissions for Businesses and Non- Commercial Organizations, 2000.
Tiagarajam, Sairam et al, (2004), Nigel Clark, and W. Scott Wayne; Effect of Driving Cycles on the particulate mass and Number Emissions from In-use Heavy-Duty Diesel Vehicles, M Sc Paper, Morington, West Virginia, 2004
Transportation Cost and Benefit Analysis II – Air Pollution Costs Victoria Transport Policy Institute (www.vtpi.org)
US EPA (2007), Economic impacts of Reducing sulfur from Diesel Fuel.
UNEP (2010), 50BY50 Global Fuel Economy initiative.
UNEP, Toolkit, (http://www.unep.org/tnt-unep/toolkit/index.html
United Nations Environmental Programme (2006). Clearing House of the Partnership for clean fuels and Vehicles (PCFV).
WHO (2005), Air Quality Guidelines for Particulate Matter, Ozone, Nitrogen Dioxide and Sulfur Dioxide, Global Update 2005
Wikipedia(2007), European Emission Standards.
Wikipedia,(2012), Catalytic Converter.
World Bank (1999), "Energy Market & Reform", Seminar note, No.1.

A1-1
APPENDIX 1: DRAFT REGULATION
Federal Negarit Gazeta Of the Federal Democratic Republic of Ethiopia
______________________________________________________________________________
Council of Ministers (draft) Regulations No. /2012
Council of Ministers Regulations to Provide Vehicular Emission Standard & Incentive for Fuel
Efficient & Environmental Friendly Vehicles
These Regulations are issued by the Council of Ministers pursuant to Article 5 of Proclamation
No. 691/2010 of the Definition of Powers & Duties of the Executive Organs of the Federal
Democratic Republic of Ethiopia, and Article 20 of the Environmental Pollution Control
Proclamation No. 300/2002, and Article ? of the Environmental Pollution Control (Amendment)
Proclamation No. / .
Article 1: Short Title
These Regulations may be cited as “Regulations to Provide Vehicular Emission Standard &
Incentive for Fuel Efficient & Environmental Friendly Vehicles Council of Ministers
Regulations No. /2012”
Article 2: Definitions
Unless the context requires otherwise, in these Regulations:
(1) “Incentive” means the exemption from any applicable import related tax (es) on imported
or assembled vehicles, wholly or partly.
(2) “Person” means any natural person or juridical entity which has been bestowed with legal
existence, rights & obligations by law.
(3) “Pollution” shall have the meaning as provided under Article 2(12) of the Environmental
Pollution Control Proclamation No. 300/2002.
(4) “Tax Payer” means a person who imports taxable vehicles to Ethiopia or purchases
assembled vehicles in Ethiopia.
(5) “Vehicle” means any type of wheeled motor vehicle except defense & three wheel
vehicles, for use on roads classified as carriage.
(6) “Vehicular Emission” means pollutants emitted from vehicles exhaust.
Article 3: Scope of Application
These Regulations shall:

A1-2
(1) apply within the territory of Federal Democratic Republic of EthiopiaCity of Addis
Ababa;
(2) apply on new or second hand vehicles imported to Ethiopia on or after the effective date
of these Regulations;
(3) apply on new vehicles assembled in Ethiopia on or after the effective date of these
Regulations;
(4) apply on any tax payer or person by virtue of being a purchaser of assembled vehicle in
Ethiopia or importer of vehicle to Ethiopia;
(5) not apply on defense vehicles & three wheel vehicles including on those vehicles
exempted under Article 5 & Article 26 of Proclamation No. 681/2010.
Article 4: Vehicular Emission Standard
(1) The Vehicular Emission Standard is hereby provided in the Schedule which forms an
integral part of these Regulations.
(2) All vehicles, with four or more wheels, to be imported to Ethiopia or assembled in
Ethiopia on or after effective date of these Regulations shall have catalytic converter that
conform to the Vehicular Emission Standard provided hereof.
(3) All vehicles to be imported to Ethiopia or assembled in Ethiopia after January 1 2015
shall have catalytic converter that confirm to Euro III emission standard.
(4) Euro IV vehicular emission standard shall be updated with Euro IV standard as of
September 2017.
(5) Conformance to the Vehicular Emission Standard may not be mandatory to all three
wheel vehicles. However, they shall have four stroke petrol engines with catalytic
converters.
Article 5: Importation of New Vehicles
(1) No tax payer or person is allowed to import new or second hand vehicles in to Ethiopia
which shall not comply with the Vehicular Emission Standard as provided in these
Regulations.
(2) No tax payer or person shall be allowed to import in to Ethiopia second hand vehicle
older than 5 years of its make.
(3) No person is allowed to assemble vehicles in Ethiopia which shall not conform to the
Vehicular Emission Standard provided hereof.
Article 6: Incentives
(1) A tax payer or person who imports new or second hand vehicle to Ethiopia & such
vehicle which conforms to the Vehicular Emission Standard, shall be granted import tax
related incentive(s) as provided in the Incentive Schedule which forms an integral part of
these Regulations.
(2) A tax payer or person, who purchases assembled vehicle in Ethiopia & such vehicle
which conform to the Vehicular Emission Standard, shall be granted import tax related
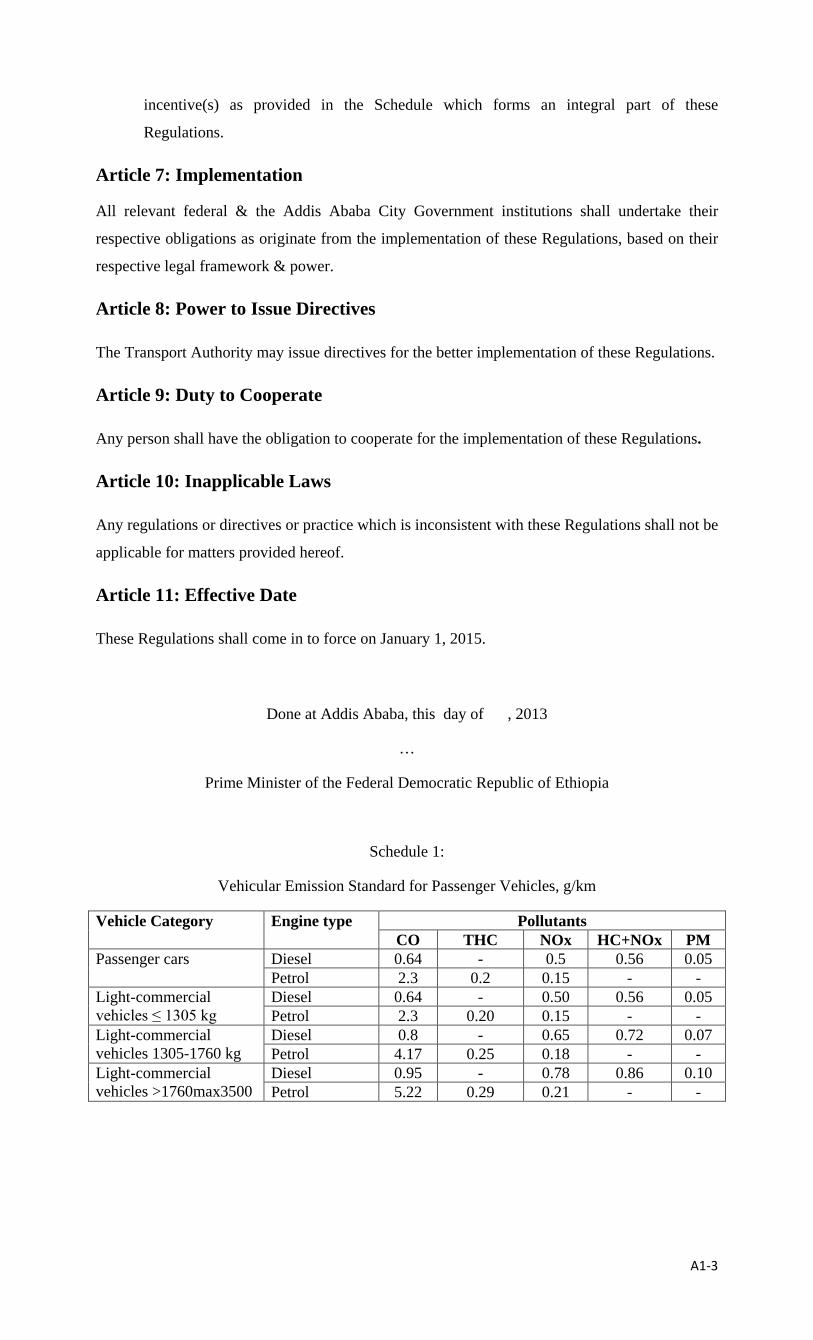
A1-3
incentive(s) as provided in the Schedule which forms an integral part of these
Regulations.
Article 7: Implementation
All relevant federal & the Addis Ababa City Government institutions shall undertake their
respective obligations as originate from the implementation of these Regulations, based on their
respective legal framework & power.
Article 8: Power to Issue Directives
The Transport Authority may issue directives for the better implementation of these Regulations.
Article 9: Duty to Cooperate
Any person shall have the obligation to cooperate for the implementation of these Regulations.
Article 10: Inapplicable Laws
Any regulations or directives or practice which is inconsistent with these Regulations shall not be
applicable for matters provided hereof.
Article 11: Effective Date
These Regulations shall come in to force on January 1, 2015.
Done at Addis Ababa, this day of , 2013
…
Prime Minister of the Federal Democratic Republic of Ethiopia
Schedule 1:
Vehicular Emission Standard for Passenger Vehicles, g/km
Vehicle Category Engine type Pollutants CO THC NOx HC+NOx PM
Passenger cars Diesel 0.64 - 0.5 0.56 0.05 Petrol 2.3 0.2 0.15 - -
Light-commercial vehicles ≤ 1305 kg
Diesel 0.64 - 0.50 0.56 0.05 Petrol 2.3 0.20 0.15 - -
Light-commercial vehicles 1305-1760 kg
Diesel 0.8 - 0.65 0.72 0.07 Petrol 4.17 0.25 0.18 - -
Light-commercial vehicles >1760max3500
Diesel 0.95 - 0.78 0.86 0.10 Petrol 5.22 0.29 0.21 - -

A1-4
Schedule 2:
Vehicles Emission Standard for Heavy Duty Diesel Vehicles, g/kWh
Vehicle category CO HC NOx PM Trucks and buses 2.1 0.66 5.0 0.1 Large good vehicles (2000kg and above) 2.1 0.66 5.0 0.1
Schedule 3:
Incentives for Fuel Efficient Vehicles to be imported to or assembled in Ethiopia
The following exemptions have been granted if not already provided by other applicable import
related tax laws.
No Category of Vehicles VAT Excise Tax Import Sur Tax
I. Hybrid vehicles 15 % Exempted Exempted
II. Electric vehicles 15 % Exempted Exempted

A2‐1
APPENDIX 2: LIFE CYCLE COST ANALYSES (BASE CASE)
CONVENTIONAL VEHICLE
a) Capital Cost
1 Purchase price Cost 1.1 in USD 12,007 1.2 in Birr 216,126 2 Cost of freight, insurance and port handling
2.1 in USD 2,500 2.2 in Birr 45,000
Total CIF cost in USD 14,507 in Birr 261,126
3 Tax ( in Birr) 3.1 Duty (35% of CIF) 91,394 3.2 Excise (50% of CIF + Duty) 176,260 3.3 Sur Tax (10% of CIF + excise +duty) 52,878 3.4 VAT (15% of CIF + excise + duty + sur tax) 87,249
Total tax in Birr 407,781 Total capital cost ( Birr) 668,907
4 Salvage value (Birr) 222,969 Grand total capital cost (Birr) 445,938

A2‐2
b) Operating cost
Sr. No Description Year/ cost in Birr 1 Fuel 1 2 3 4 5 6 7 8 9 10
1.1 Mileage travelled per year 24,000 24,000 24,000 24,000 24,000 24,000 24,000 24,000 24,000 24,000 1.2 Fuel consumption ( per 100 km) 5.7 5.7 5.7 5.7 5.7 5.7 5.7 5.7 5.7 5.7
1.3 Amount of fuel required (lit/annum) 1,368 1,368 1,368 1,368 1,368 1,368 1,368 1,368 1,368 1,368
1.4 Unit Cost of fuel ( per lit) 18.88 19.82 20.82 21.86 22.95 24.10 25.30 26.57 27.89 29.29 Annual Cost of fuel (in Birr) 25,828 27,119 28,475 29,899 31,394 32,964 34,612 36,342 38,159 40,067 2 Lubricant
2.1 Mileage travelled per year 24,000 24,000 24,000 24,000 24,000 24,000 24,000 24,000 24,000 24,000
2.2 Number of Lubricant change ( every 5000 km) 5 5 5 5 5 5 5 5 5 5
2.3 Average Amount of lubricant required (kg) 29 29 29 29 29 29 29 29 29 29
2.4 Average Unit cost of lubricant ( per kg) 100 105 110 116 122 128 134 141 148 155
Annual Cost of Lubricant (in Birr) 2,880 3,024 3,175 3,334 3,501 3,676 3,859 4,052 4,255 4,468
3 Tyre and battery (every 24,000 km) 1,800 1,800 1,800 1,800 1,800 1,800 1,800 1,800 1,800 1,800
4 Maintenance and Repair Costs 3,000 3,600 4,320 5,184 6,221 7,465 8,958 10,750 12,899 15,479
5 Vehicle registration and insurance cost 1,000 1,000 1,000 1,000 1,000 1,000 1,000 1,000 1,000 1,000
Total operating cost 34,508 36,543 38,770 41,217 43,915 46,904 50,229 53,944 58,114 62,815

A2‐3
c) Life Cycle Cost
Year Actual cost
(in Birr) Discounting
Factor (10%)
Discounted cost
(in Birr) Capital cost 445,938 1 445,938
1 34,508 1 34,508 2 36,543 0.909 33,218 3 38,770 0.826 32,024 4 41,217 0.751 30,954 5 43,915 0.683 29,994 6 46,904 0.621 29,128 7 50,229 0.564 28,329 8 53,944 0.513 27,673 9 58,114 0.467 27,139 10 62,815 0.424 26,633
Total Life Cycle Cost ( in Birr) 745,539

A2‐4
HYBRID VEHICLE
a) Capital Cost
1.1 Purchase price Cost 1.1.1 in USD 17,299 1.1.2 in Birr 311,382
2 Cost of freight, insurance and port handling
2.1 in USD 2,500 2.1 in Birr 45,000 3 Total CIF cost
3.1 in USD 19,799 3.2 in Birr 356,382 4 Tax ( in Birr)
4.1 Duty (35% of CIF) 124,734 4.2 Excise (50% of CIF + Duty) 240,558 4.3 Sur Tax (10% of CIF + excise +duty) 72,167
4.4 VAT (15% of CIF + excise + duty + sur tax) 119,076 Total tax 556,535 5 Total capital cost ( Birr) 912,917 6 Salvage value (Birr) 304,306
Grand total capital cost (Birr) 608,611

A2‐5
b) Operating cost
Sr. No Description Year/ cost in Birr 1 Fuel 1 2 3 4 5 6 7 8 9 10
1.1 Mileage travelled per year 24,000 24,000 24,000 24,000 24,000 24,000 24,000 24,000 24,000 24,000
1.2 Fuel consumption ( per 100 km) 3.5 3.5 3.5 3.5 3.5 3.5 3.5 3.5 3.5 3.5
1.3 Amount of fuel required (lit/annum) 840 840 840 840 840 840 840 840 840 840
1.4 Unit Cost of fuel ( per lit) 18.88 19.82 20.82 21.86 22.95 24.10 25.30 26.57 27.89 29.29 Annual Cost of fuel (in Birr) 15,859 16,652 17,485 18,359 19,277 20,241 21,253 22,315 23,431 24,603 2 Lubricant
2.1 Mileage travelled per year 24,000 24,000 24,000 24,000 24,000 24,000 24,000 24,000 24,000 24,000
2.2 Number of Lubricant change ( every 5000 km) 5 5 5 5 5 5 5 5 5 5
2.3 Average Amount of lubricant required (kg) 29 29 29 29 29 29 29 29 29 29
2.4 Average Unit cost of lubricant ( per kg) 100 105 110 116 122 128 134 141 148 155
Annual Cost of Lubricant (in Birr) 2,880 3,024 3,175 3,334 3,501 3,676 3,859 4,052 4,255 4,468
3 Tyre and battery (every 24,000 km) 1,800 1,800 1,800 1,800 1,800 1,800 1,800 1,800 1,800 1,800
4 Maintenance and Repair Costs 3,000 3,600 4,320 5,184 6,221 7,465 8,958 10,750 12,899 15,479
5 Vehicle registration and insurance cost 1,000 1,000 1,000 1,000 1,000 1,000 1,000 1,000 1,000 1,000
Total operating cost 24,539 26,076 27,780 29,677 31,798 34,181 36,870 39,917 43,386 47,350

A2‐6
c) Life Cycle Cost
Year Actual
cost
DiscountingFactor (10%)
Discounted cost
Capital cost 608,611 1 608,611 1 24,539 1 24,539 2 26,076 0.909 23,703 3 27,780 0.826 22,946 4 29,677 0.751 22,287 5 31,798 0.683 21,718 6 34,181 0.621 21,227 7 36,870 0.564 20,795 8 39,917 0.513 20,478 9 43,386 0.467 20,261 10 47,350 0.424 20,076
Total Life Cycle Cost 826,643

A2‐7
ELECTRIC VEHICLE
a) Capital Cost
1 Capital Cost Cost 1.1 Purchase price 1.1.1 in USD 27,200 1.1.2 in Birr 489,600 2 Cost of freight, insurance and port handling 2.1 in USD 2,500 2.2 in Birr 45,000 2.3 Total CIF cost 2.3.1 in USD 29,700 2.3.2 in Birr 534,600 3 Tax ( in Birr) 3.1 Duty (35% of CIF) 187,110 3.2 Excise (50% of CIF + Duty) 360,855 3.3 Sur Tax (10% of CIF + excise +duty) 108,257
3.4 VAT (15% of CIF + excise +duty+ sur tax) 178,623 Total tax 834,845 4 Total capital cost ( Birr) 1,369,445 5 Salvage value (Birr) 456,482 6 Grand total capital cost (Birr) 912,963

A2‐8
b) Operating cost
Sr. No Description
Year 1 2 3 4 5 6 7 8 9 10
1 Energy 1.1 Mileage travelled per year 24,000 24,000 24,000 24,000 24,000 24,000 24,000 24,000 24,000 24,000
1.2 Energy consumption ( kwh/km ) 0.215 0.215 0.215 0.215 0.215 0.215 0.215 0.215 0.215 0.215
1.3 Amount of energy required (kwh/annum) 5,160 5,160 5,160 5,160 5,160 5,160 5,160 5,160 5,160 5,160
1.4 Unit Cost of energy ( Birr/ per kwh) 0.65 0.65 0.65 0.65 0.65 0.65 0.65 0.65 0.65 0.65 Annual Cost of energy (in Birr) 3,354 3,354 3,354 3,354 3,354 3,354 3,354 3,354 3,354 3,354 2 Lubricant
2.1 Mileage travelled per year 24,000 24,000 24,000 24,000 24,000 24,000 24,000 24,000 24,000 24,000
2.2 Number of Lubricant change ( every 5000 km) 4.80 4.80 4.80 4.80 4.80 4.80 4.80 4.80 4.80 4.80
2.3 Average Amount of lubricant required (kg) 14.40 14.40 14.40 14.40 14.40 14.40 14.40 14.40 14.40 14.40
2.4 Average Unit cost of lubricant ( per kg) 100 105 110 116 122 128 134 141 148 155
Annual Cost of Lubricant (in Birr) 1,440 1,512 1,588 1,667 1,750 1,838 1,930 2,026 2,128 2,234
3 Tyre (every 24,000 km) 900 900 900 900 900 900 900 900 900 900 4 Battery ( every 160,000 km) 461,953
5 Maintenance and Repair Costs 1,500 1,800 2,160 2,592 3,110 3,732 4,479 5,375 6,450 7,740
6 Vehicle registration and insurance cost 1,000 1,000 1,000 1,000 1,000 1,000 1,000 1,000 1,000 1,000
Total operating cost 8,194 8,566 9,002 9,513 10,115 10,824 473,616 12,655 13,831 15,228

A2‐9
c) Life Cycle Cost
Year Actual cost
DiscountingFactor (10%)
Discounted cost
Capital cost 912,963 1 912,963 1 8,194 1 8,194 2 8,566 0.909 7,786 3 9,002 0.826 7,435 4 9,513 0.751 7,144 5 10,115 0.683 6,908 6 10,824 0.621 6,722 7 473,616 0.564 267,119 8 12,655 0.513 6,492 9 13,831 0.467 6,459 10 15,228 0.424 6,456
Total Life Cycle Cost 1,243,680

1
APPENDIX 3: NEW AND SECOND VEHICLES LIFE COST ANALYSIS A2.1 New Vehicle
1 Capital Cost Birr
1.1 Purchase price 600,000
1.2 Total capital cost ( Birr) 600,000
1.3 Salvage value (Birr) 200,000
1.4 Grand total capital cost (Birr) 400,000

1
1
2
3
4
5
6
7
8
9
10 Total
2 Operating cost 2.1 Fuel
2.1.1 Mileage travelled per year 24,000
24,000
24,000
24,000
24,000
24,000
24,000
24,000
24,000
24,000
2.1.2 Fuel consumption ( per 100 km) 6.00
6.00
6.00
6.00
6.00
6.00
6.00
6.00
6.00
6.00
2.1.3 Amount of fuel required (lit/annum)
1,440
1,440
1,440
1,440
1,440
1,440
1,440
1,440
1,440
1,440
2.14 Unit Cost of fuel ( per lit) 18.88
20.77
22.84
25.13
27.64
30.41
33.45
36.79
40.47
44.52
Annual Cost of fuel (in Birr) 27,187
29,906
32,897
36,186
39,805
43,785
48,164
52,980
58,278
64,106
433,294
2.2 Lubricant
2.2.1 Mileage travelled per year 24,000
24,000
24,000
24,000
24,000
24,000
24,000
24,000
24,000
24,000
2.2.2 Number of Lubricant change ( every 4000 km)
5
5
5
5
5
5
5
5
5
5
2.2.3 Average Amount of lubricant required (kg)
19
29
29
29
29
29
29
29
29
29
2.2.4 Averege Unit cost of lubricant ( per kg)
100
105
110
116
122
128
134
141
148
155
Annual Cost of Lubricant (in Birr)
1,920
3,024
3,175
3,334
3,501
3,676
3,859
4,052
4,255
4,468
35,264
2.3 Tyre and battery (every 24,000 km)
1,800
1,800
1,800
1,800
1,800
1,800
1,800
1,800
1,800
1,800
18,000
2.4 Maintenance and Repair Costs 3,000
3,300
3,630
3,993
4,392
4,832
5,315
5,846
6,431
7,074
47,812
2.5 Vehicle registration and insurance cost
1,000
1,000
1,000
1,000
1,000
1,000
1,000
1,000
1,000
1,000
10,000
Total operating cost 34,907
39,030
42,502
46,313
50,498
55,092
60,138
65,679
71,764
78,448
544,371
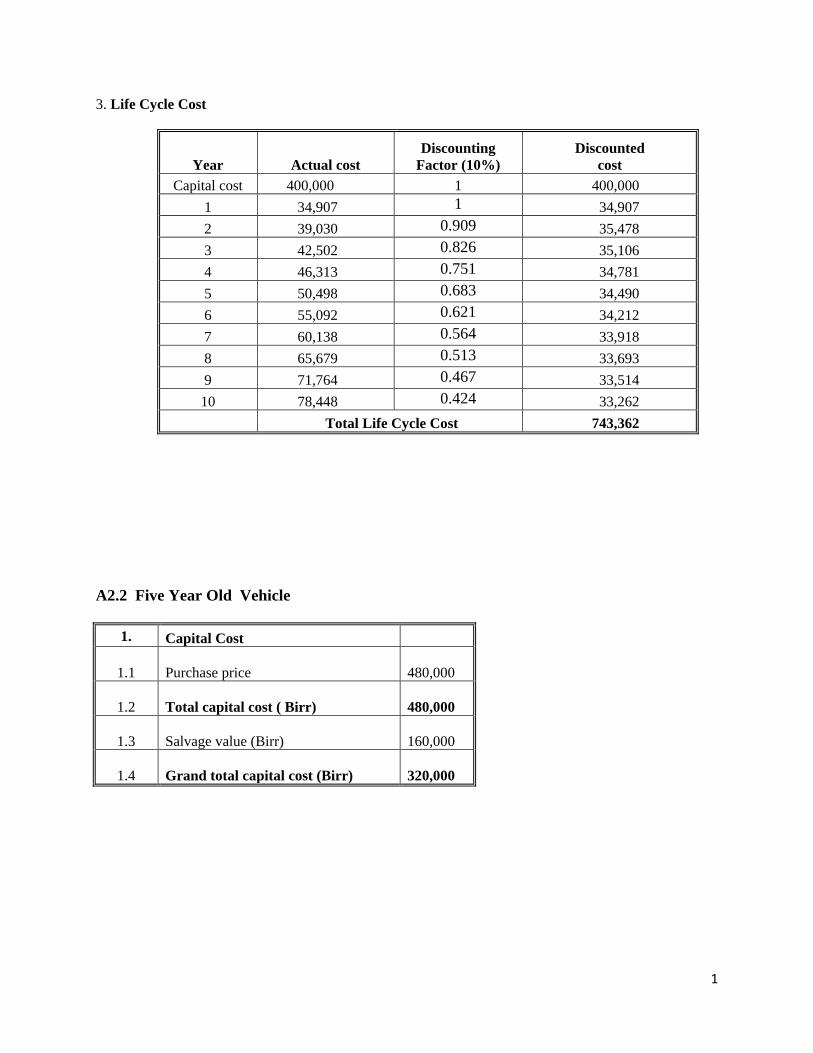
1
3. Life Cycle Cost
Year Actual cost
Discounting Factor (10%)
Discounted cost
Capital cost 400,000 1 400,000
1 34,907 1 34,907
2 39,030 0.909 35,478
3 42,502 0.826 35,106
4 46,313 0.751 34,781
5 50,498 0.683 34,490
6 55,092 0.621 34,212
7 60,138 0.564 33,918
8 65,679 0.513 33,693
9 71,764 0.467 33,514
10 78,448 0.424 33,262
Total Life Cycle Cost 743,362
A2.2 Five Year Old Vehicle
1. Capital Cost
1.1 Purchase price 480,000
1.2 Total capital cost ( Birr) 480,000
1.3 Salvage value (Birr) 160,000
1.4 Grand total capital cost (Birr) 320,000
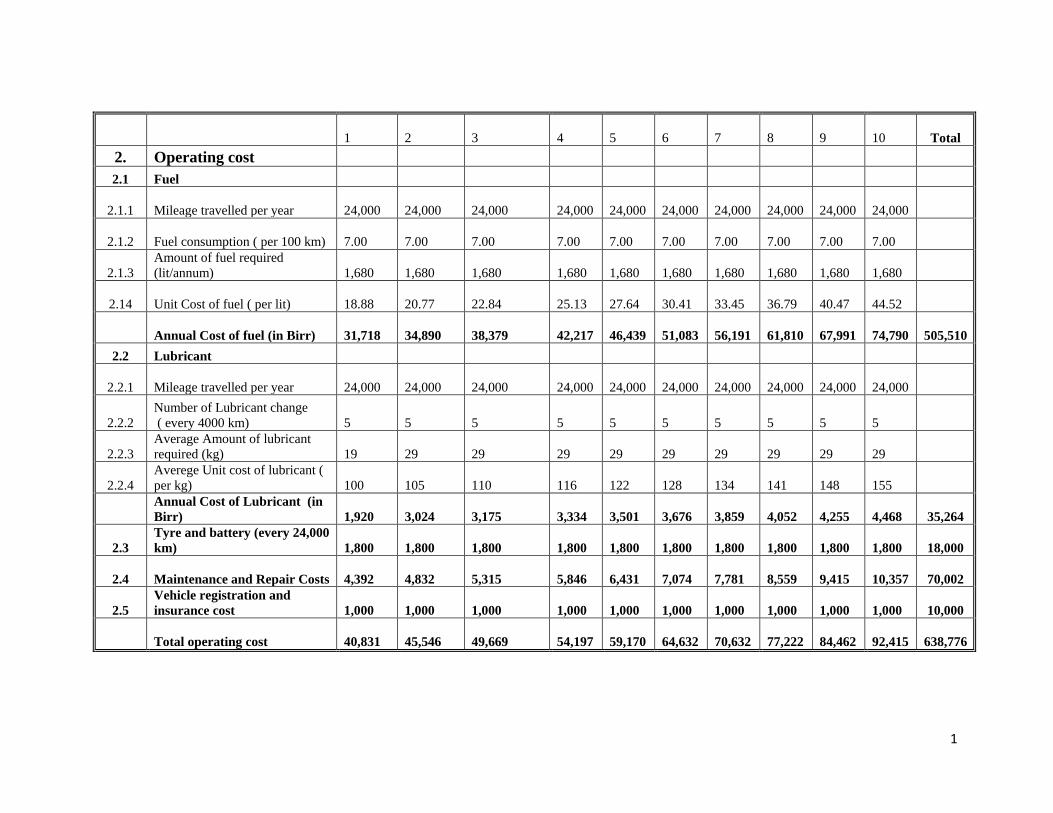
1
1
2
3
4
5
6
7
8
9
10 Total
2. Operating cost 2.1 Fuel
2.1.1 Mileage travelled per year 24,000
24,000
24,000
24,000
24,000
24,000
24,000
24,000
24,000
24,000
2.1.2 Fuel consumption ( per 100 km)
7.00
7.00
7.00
7.00
7.00
7.00
7.00
7.00
7.00
7.00
2.1.3
Amount of fuel required (lit/annum)
1,680
1,680
1,680
1,680
1,680
1,680
1,680
1,680
1,680
1,680
2.14 Unit Cost of fuel ( per lit)
18.88
20.77
22.84
25.13
27.64
30.41
33.45
36.79
40.47
44.52
Annual Cost of fuel (in Birr)
31,718
34,890
38,379
42,217
46,439
51,083
56,191
61,810
67,991
74,790
505,510
2.2 Lubricant
2.2.1 Mileage travelled per year 24,000
24,000
24,000
24,000
24,000
24,000
24,000
24,000
24,000
24,000
2.2.2
Number of Lubricant change ( every 4000 km)
5
5
5
5
5
5
5
5
5
5
2.2.3
Average Amount of lubricant required (kg)
19
29
29
29
29
29
29
29
29
29
2.2.4
Averege Unit cost of lubricant ( per kg)
100
105
110
116
122
128
134
141
148
155
Annual Cost of Lubricant (in Birr)
1,920
3,024
3,175
3,334
3,501
3,676
3,859
4,052
4,255
4,468
35,264
2.3 Tyre and battery (every 24,000 km)
1,800
1,800
1,800
1,800
1,800
1,800
1,800
1,800
1,800
1,800
18,000
2.4 Maintenance and Repair Costs 4,392
4,832
5,315
5,846
6,431
7,074
7,781
8,559
9,415
10,357
70,002
2.5 Vehicle registration and insurance cost
1,000
1,000
1,000
1,000
1,000
1,000
1,000
1,000
1,000
1,000
10,000
Total operating cost
40,831
45,546
49,669
54,197
59,170
64,632
70,632
77,222
84,462
92,415
638,776

1
3. Life Cycle Cost
Year Actual cost
Discounting Factor (10%)
Discounted cost
Capital cost 320,000 1 320,000
1 40,831 1 40,831
2 45,546 0.909 41,401
3 49,669 0.826 41,027
4 54,197 0.751 40,702
5 59,170 0.683 40,413
6 64,632 0.621 40,137
7 70,632 0.564 39,836
8 77,222 0.513 39,615
9 84,462 0.467 39,444
10 92,415 0.424 39,184
Total Life Cycle Cost 722,589
A3.3 Ten Year Old Vehicle
1 Capital Cost 1.1 Purchase price
1.2 Total capital cost ( Birr) 325,000
1.3 Salvage value (Birr) 108,333
1.4 Grand total capital cost (Birr) 216,667

1
1
2
3
4
5
6
7
8
9
10 Total
2. Operating cost 2.1 Fuel
2.1.1 Mileage travelled per year 24,000
24,000
24,000
24,000
24,000
24,000
24,000
24,000
24,000
24,000
2.1.2
Fuel consumption ( per 100 km)
8.50
8.50
8.50
8.50
8.50
8.50
8.50
8.50
8.50
8.50
2.1.3
Amount of fuel required (lit/annum)
2,040
2,040
2,040
2,040
2,040
2,040
2,040
2,040
2,040
2,040
2.14 Unit Cost of fuel ( per lit)
18.88
20.77
22.84
25.13
27.64
30.41
33.45
36.79
40.47
44.52
Annual Cost of fuel (in Birr)
38,515
42,367
46,603
51,264
56,390
62,029
68,232
75,055
82,561
90,817
613,833
2.2 Lubricant
2.2.1 Mileage travelled per year 24,000
24,000
24,000
24,000
24,000
24,000
24,000
24,000
24,000
24,000
2.2.2
Number of Lubricant change ( every 3,333 km)
5
5
5
5
5
5
5
5
5
5
2.2.3
Average Amount of lubricant required (kg)
19
19
19
19
19
19
19
19
19
19
2.2.4
Averege Unit cost of lubricant ( per kg)
100
105
110
116
122
128
134
141
148
155
Annual Cost of Lubricant (in Birr)
1,920
2,016
2,117
2,223
2,334
2,450
2,573
2,702
2,837
2,979
24,150
2.3 Tyre and battery (every 24,000 km)
1,800
1,800
1,800
1,800
1,800
1,800
1,800
1,800
1,800
1,800
18,000
2.4 Maintenance and Repair Costs
7,074
7,781
8,559
9,415
10,357
11,392
12,532
13,785
15,163
16,680
112,739
2.5 Vehicle registration and insurance cost
1,000
1,000
1,000
1,000
1,000
1,000
1,000
1,000
1,000
1,000
10,000
Total operating cost
50,309
54,964
60,080
65,702
71,881
78,672
86,137
94,342
103,361
113,275
778,721

1
3.
Life Cycle Cost
Year Actual cost
Discounting Factor (10%)
Discounted cost
Capital cost 216,667 1 216,667
1 50,309 1 50,309
2 54,964 0.909 49,962
3 60,080 0.826 49,626
4 65,702 0.751 49,342
5 71,881 0.683 49,095
6 78,672 0.621 48,855
7 86,137 0.564 48,581
8 94,342 0.513 48,397
9 103,361 0.467 48,270
10 113,275 0.424 48,029
Total Life Cycle Cost 707,132
A2.4 Twenty Year Old Vehicle
1. Capital Cost
1.1 Purchase price 280,000
1.2 Total capital cost ( Birr) 280,000
1.3 Salvage value (Birr) 70,000
1.4 Grand total capital cost (Birr) 210,000

1
1
2
3
4
5
6
7
8
9
10 Total
2. Operating cost 2.1 Fuel
2.1.1 Mileage travelled per year 24,000
24,000
24,000
24,000
24,000
24,000
24,000
24,000
24,000
24,000
2.1.2
Fuel consumption ( per 100 km)
10.00
10.00
10.00
10.00
10.00
10.00
10.00
10.00
10.00
10.00
2.1.3
Amount of fuel required (lit/annum)
2,400
2,400
2,400
2,400
2,400
2,400
2,400
2,400
2,400
2,400
2.14 Unit Cost of fuel ( per lit)
18.88
20.77
22.84
25.13
27.64
30.41
33.45
36.79
40.47
44.52
Annual Cost of fuel (in Birr)
45,312
49,843
54,828
60,310
66,341
72,975
80,273
88,300
97,130
106,843
722,157
2.2 Lubricant
2.2.1 Mileage travelled per year 24,000
24,000
24,000
24,000
24,000
24,000
24,000
24,000
24,000
24,000
2.2.2
Number of Lubricant change ( every 3,333 km)
5
5
5
5
5
5
5
5
5
5
2.2.3
Average Amount of lubricant required (kg)
19
19
19
19
19
19
19
19
19
19
2.2.4
Averege Unit cost of lubricant ( per kg)
100
105
110
116
122
128
134
141
148
155
Annual Cost of Lubricant (in Birr)
1,920
2,016
2,117
2,223
2,334
2,450
2,573
2,702
2,837
2,979
24,150
2.3 Tyre and battery (every 24,000 km)
1,800
1,800
1,800
1,800
1,800
1,800
1,800
1,800
1,800
1,800
18,000
2.4 Maintenance and Repair Costs
15,163
16,680
18,348
20,182
22,201
24,421
26,863
29,549
32,504
35,755
241,666
2.5 Vehicle registration and insurance cost
1,000
1,000
1,000
1,000
1,000
1,000
1,000
1,000
1,000
1,000
10,000
Total operating cost
65,195
71,339
78,092
85,515
93,676
102,647
112,509
123,351
135,271
148,376
1,015,972

1
3
Life Cycle Cost
Year Actual cost
Discounting Factor (10%)
Discounted cost
Capital cost 210,000 1 210,000
1 65,195 1 65,195
2 71,339 0.909 64,847
3 78,092 0.826 64,504
4 85,515 0.751 64,222
5 93,676 0.683 63,981
6 102,647 0.621 63,744
7 112,509 0.564 63,455
8 123,351 0.513 63,279
9 135,271 0.467 63,172
10 148,376 0.424 62,912
Total Life Cycle Cost
849,310

![DURABILITY OF FUEL PUMPS AND FUEL LEVEL ... … 664 [AVFL-15a]/AVFL... · DURABILITY OF FUEL PUMPS AND FUEL LEVEL ... Fuel pump soak data ... fuel pumps and fuel level senders were](https://static.fdocuments.us/doc/165x107/5b5fc9d67f8b9a51328e7dbf/durability-of-fuel-pumps-and-fuel-level-664-avfl-15aavfl-durability.jpg)