
Table of Contents - Finanšu ministrija Documents/EM_Tirgu… · Web viewSustainable Development...
468
ACCESS TO FINANCE ex ante assessment LATVIA The Ministry of Economics of the Republic of Latvia March 31, 2015
Transcript of Table of Contents - Finanšu ministrija Documents/EM_Tirgu… · Web viewSustainable Development...

ACCESS TO FINANCEex ante assessment
LATVIA
The Ministry of Economicsof the Republic of Latvia
March 31, 2015

Ex ante assessments
The list of the prepared SME access to finance ex ante assessments in Latvia, in reverse chronology:
March 2015 The current ex ante assessment for the planned financial instruments within the European Union Investment Funds programming period 2014-2020, under the Thematic Objective no. 3 to enhance the competitiveness of SMEs, compiled by the Ministry of Economics of the Republic of Latvia, and to be submitted to the Monitoring Committee in April, 2015
Compared to the previous version, the current document includes the market analysis and findings prepared by Deloitte Latvia and the revised investment strategy
June 2014 The previous draft of the ex ante assessment for the planned financial instruments within the European Union Investment Funds programming period 2014-2020, prepared by the Ministry of Economics of the Republic of Latvia and submitted to the Monitoring Committee on June 2, 2014
May 2013 The first draft of the ex ante assessment for the planned financial instruments within the European Union Investment Funds programming period 2014-2020, prepared by the Ministry of Economics of the Republic of Latvia and submitted to the Monitoring Board of financial instruments on May 2, 2013
July 2007 The SME Financing Gap Assessment, prepared by the European Investment Fund within the JEREMIE (joint European resources for micro to medium enterprises) initiative for the programming period 2007-2013
2

Table of Contents
Table of Contents............................................................................................................................3
List of Acronyms..............................................................................................................................5
Executive Summary.........................................................................................................................7
1. Introduction..............................................................................................................................141.1. Objectives and Scope of the Assessment..................................................................................161.2. Regulatory Framework..............................................................................................................161.4. Priorities and Policies for SME Financing...................................................................................171.4. Structure of the Assessment.....................................................................................................201.5. Provisions to Review and Update the Assessment....................................................................21
2. Market Environment.................................................................................................................232.1. Characteristics of the Economy and Demographics..................................................................232.2. SME Characteristics and Environment.......................................................................................302.3. Existing Financial Instruments...................................................................................................332.4. National Specialised Development Financing Institution...........................................................52
3. Market Analysis and Findings....................................................................................................543.1. Methodological Framework......................................................................................................543.2. General Observations................................................................................................................593.3. Financing Eco-System................................................................................................................713.4. Microfinance.............................................................................................................................743.5. Bank Lending.............................................................................................................................833.6. Leasing and Factoring................................................................................................................903.7. Loan Guarantees.......................................................................................................................993.8. Export Credit Guarantees........................................................................................................1073.9. Venture Capital and Growth Capital........................................................................................1133.10. Technology Transfer Financing..............................................................................................1343.11. Business Angel Financing.......................................................................................................1403.12. Mezzanine Financing.............................................................................................................1453.13. Rescue and Restructuring Financing......................................................................................1493.14. Summary...............................................................................................................................151
4. Investment Strategy................................................................................................................1544.1. Microloans...............................................................................................................................1574.2. Start-up Loans.........................................................................................................................1774.3. Growth Loans..........................................................................................................................1894.4. Co-lending...............................................................................................................................1994.5. Loan Guarantees.....................................................................................................................2114.6. Export Credit Guarantees........................................................................................................2244.7. Accelerators.............................................................................................................................2334.8. Business Angel Co-Investment Fund........................................................................................242
3

4.9. Venture Capital Funds.............................................................................................................2554.10. Growth Capital Funds............................................................................................................2674.11. Rescue and Restructuring Facility..........................................................................................2784.12. Other Support Activities........................................................................................................2854.13. Summary...............................................................................................................................287
Annexes......................................................................................................................................291I. Assessment Completeness Checklist...........................................................................................291II. Note on Survey Analysis.............................................................................................................296III. Questionnaire for Survey...........................................................................................................302IV. List of Interviews.......................................................................................................................313V. Questionnaire for Interviews.....................................................................................................314VI. Stakeholders..............................................................................................................................317VII. Bibliography.............................................................................................................................323
4

List of Acronyms
AFI Development finance institution, merging ALTUM, LAF and LGA
AIFMD Alternative Investment Fund Managers Directive
ALTUM Development finance institution Altum
APGE Acton programme “Growth and Employment”
BA Business angel
BIF Baltic Innovation fund
CAGR Compound annual growth rate
CEE Central and Eastern Europe
CF Cohesion Fund
CB Cooperation Body
COCOF Coordination Committee of the Funds
CP Cohesion Policy
CPI Consumer Price Index
CPR Common Provisions Regulation
CSF Common Strategic Framework
EAFRD European Agricultural Fund for Rural Development
EBRD European Bank for Reconstruction and Development
EC European Commission
ECB European Central Bank
EIB European Investment Bank
EIF European Investment Fund
EMFF European Maritime and Fisheries Fund
ERDF European Regional Development Fund
ESIF European Structural and Investment Funds 2014-2020
EU European Union
EVCA European Venture Capital Association
FCMC Financial and Capital Market Commission
FDI Foreign direct investment
FEI Financial Engineering Instrument
5

FI Financial Instrument
GAFMA Guidelines for SME Access to Finance Market Assessments by EIF
GDP Gross Domestic Product
IPO Initial public offering
JEREMIE Joint European resources for micro to medium enterprises
LAF Rural Development Fund
LATBAN Latvian Business Angel Network
LE Large enterprise
LGA Latvian Guarantee agency
LIAA Investment and Development Agency of Latvia
LVCA Latvian Venture Capital Association
M&A Merger and acquisition
MA Managing Authority
NDP National Development Plan of Latvia for 2014-2020
NIP Guidelines on the National Industrial Policy for 2014–2020
NRP National Reform Programme of Latvia for the Implementation of the “EU 2020” strategy
OECD Organization for Economic Co-operation and Development
OPIC Operational programme “Innovation and Competitiveness”
PA Partnership Agreement for the EU Investment Funds Programming Period 2014-2020
PE Private Equity
PGA Peer group analyses
PGS Pubic guarantee scheme
RA Responsible Authority
R&D Research and Development
ROE Return on equity
SBF Separate block of finance
SDS Sustainable Development Strategy of Latvia until 2030
SF EU Structural Fund (ERDF and ESF)
SME Small and medium-sized enterprise
TO Thematic Objective
TT Technology transfer
VAT Value added tax
VC Venture capital
6

7

Executive Summary
The present SME Access to Finance ex ante Assessment for Latvia, prepared by the Ministry of Economics of The Republic of Latvia, provides the justification for the implementation of the planned financial instruments supported by European Structural and Investment Funds and other national public funding within the 2014-2020 programming period.
Research, development of technologies and innovations are one of the most important aspects for the competitiveness and sustainable entrepreneurship. The assessment evaluates and provides financial instruments also for innovative and knowledge-intensive projects. As a result, financial instruments are complementary to the thematic objective no. 1 to strengthen research, technological development and innovation, and no financial instruments are envisaged under the thematic objective no. 1.
As in accordance to Article 37 of the Common Provisions Regulation, support of financial instruments shall be “based on an ex ante assessment which has established evidence of market failures or suboptimal investment situations, and the estimated level and scope of public investment needs, including types of financial instruments to be supported.”
The assessment aims to provide an unbiased market analysis, independently performed by a specially contracted consultant Deloitte Latvia, applying both qualitative and quantitative research methods, identify and, where possible, quantify the current market gap, suboptimal investment situations, investment needs for SMEs in Latvia, and an assessment of lessons learnt from similar instruments and ex ante assessments carried out in the past. The assessment is drafted, as far as possible, following the European Commission’s methodological guidelines for preparing ex ante assessments for financial instruments in the 2014-2020 programming period, as well as the guidelines for preparing SME access to finance market assessments by the European Investment Fund.
After having identified the presence of market failures and suboptimal investment situations that justify public intervention and quantified the market gap, the assessment presents the investment strategy with the envisaged financial instruments, in line with the priorities and policies set in the operational programme “Innovation and Competitiveness”, the action programme “Growth and Employment” of the 2014-2020 programming period and other relevant policy documents with the objective of improving SME access to financing. The assessment also provides a short review of macroeconomic environment in Latvia, characteristics of economy and demography, as well as SME challenges. In summary, the main growth bottlenecks are rebalancing of the economy towards the tradable sectors and raising productivity levels; ensuring a well-functioning and stable financial sector in the light of the on-going deleveraging of the private sector; addressing the weaknesses in the business environment, ensuring adequate access to finance for companies favouring productive investment; and avoiding high structural unemployment and ensuring better matching with the labour market.
8

To conduct the market analysis, Deloitte Latvia applied the methodological guidelines recommended by the European Commission and the European Investment Fund, namely, exercising analytical triangulation of (1) literature review and data gathering, (2) stakeholder interviews, and (3) an online SME survey, in order to estimate a market viable gap, market weaknesses or failures, suboptimal investment situations, and investment needs.
The conducted online survey results reveal that SME mostly fund their growth with short and medium term loans and leasing. When considering loan financing, in general SMEs name lack of own capital, insufficient collateral or guarantees, and being overleveraged as main concerns limiting their success in obtaining the required financing. Both micro and small companies use external funding to finance working capital and acquisition of machinery and equipment, while medium companies have more widespread needs in addition requiring financing to launch a new product and enter new markets. Debt financing instruments are seen as the primary preferred source of future funding for any segment of SMEs, followed by owner funding, and support from state authorities. However, commercial banks and leasing companies are viewed as a preferred source of funding increasingly more as the company matures.
In accordance with the applied methodology, to identify a market viable gap, Deloitte Latvia employed the following calculation steps: (1) estimation of the number of SMEs by segment in need for external financing to fund future growth; (2) estimation of the external financing requirement by SMEs segments as part of total demand for financing in Latvian economy; (3) estimation of the implied market viable gap for SMEs per segment for external financing in total; and (4) estimation of the market viable gap based on the conducted SME survey and allocation of the results to separate financial instruments.
The market analysis conducted by Deloitte Latvia reveal the following findings on market failures, suboptimal investment situations, investment needs, and market viable gaps separately for each financing segment:
In terms of the overall financing eco-system, the assessment reveals that SMEs are insufficiently informed about the availability of various financing instruments, particularly for micro companies and early stage businesses. Also the lack of good corporate governance principles and general awareness of the role of each stakeholder by the new entrepreneurs is a major detrimental factor for potential equity investors. Additional major drawback is that start-up entrepreneurs and micro company entrepreneurs often lack general financing education that makes it difficult for financing providers to evaluate the target business.
In the microfinance segment, the assessment identifies the following market failures: (1) high handling (or operational) costs for credit institutions; (2) lack of sufficient collateral from the micro-enterprises; and (3) high risk: microcredit is considered a risky business by finance providers; and (4) micro companies are not sufficiently aware of the viability of micro financing opportunities. Lack of microfinance providers determines inadequate supply and competition. The calculated total market viable gap for the microfinance segment is estimated at approximately EUR 163-184 million.
9

In the bank lending segment, the assessment reveals that there are certain aspects of market failure in the magnitude of rejections to provide funding due to credit risk and profitability of companies looking for financing and purpose of the loan applications, that appears to affect small and start-up companies in particular. The assessment also names inefficient legal framework that hinders trust in new clients, lack of credit history, high administrative costs that prohibit lending low amounts, insufficient equity for loan co-financing, SMEs cautious to increase indebtedness and shadow economy are the main detrimental factors limiting the growth of bank lending. The calculated total market viable gap for the bank lending segment is estimated at approximately EUR 381-698 million.
In the leasing and factoring segment, the assessment reveals that there are certain aspects of market failure in the magnitude of rejections to provide funding due to credit risk and profitability of companies looking for financing and purpose of the loan applications, as well as the same detrimental factors limiting the growth of leasing and factoring similar to bank lending. The calculated total market viable gap for the leasing segment is estimated at approximately EUR 55-101 million and the factoring segment – EUR 107-196 million.
In the loan guarantee segment, the calculated total market viable gap is estimated at approximately EUR 100-184 million.
In the export credit guarantee segment, the assessment reveals that there is no supply of medium and long-term focused guarantees in the market. Regarding short term export guarantees private credit insurers are selective about eligible geographies and sensitive to adverse volatile changes in the market. The calculated total market viable gap for the export credit guarantee segment is estimated at approximately EUR 14-26 million.
In the venture capital and growth capital segment, the assessment reveals that in general the venture capital market is underdeveloped and unattractive for investors, lack of incentives for institutional investors to invest in local venture capital funds, legislation provides excessive barriers to set up and run venture capital funds, and trend of venture capital funds shifting focus to later stage investments. Also simultaneous public financing for SMEs directly and indirectly through intermediaries hinders development of indirectly supported intermediaries, lack of businesses exhibiting strong potential, small scale limits providing smart money, the stock market is underdeveloped to serve as an exit option, investment selection is exposed to rush to spend risk, and lack of alternative financing instruments for early stage. The calculated total market viable gap for the venture capital and growth capital segment is estimated at approximately EUR 294-538 million.
In the technology transfer financing segment, the assessment identifies the following market failures: low funding for academic research affects supply of technology intensive enterprises, low interconnectedness between scientists and entrepreneurs, lack of supply to finance pre-seed and seed stage technology intensive ventures, lack of smart money, insufficient size of economy to gather substantial pipeline of technology intensive enterprises, and inability to access debt financing. The calculated total market viable gap for the technology transfer financing segment is estimated at approximately EUR 10 million.
10

In the business angel financing segment, the assessment reveals that there is a limited access to business angels due lack of networks uniting business angels, reluctance to invest due to lack of investing experience, regional incubators seldom produce start-ups attractive for business angels, the quality of pitches to BAs are often below par, and limited options to exit investments. The calculated total market viable gap for the business angel financing segment is estimated at approximately EUR 20 million.
In the mezzanine financing segment, the assessment identifies that SMEs are insufficiently informed about mezzanine financing opportunities. The assessment was not able to reliably estimate the market viable gap for the mezzanine financing segment. However, the interviewed stakeholders, have voiced that there is a profound need in the market for mezzanine financing and it can address some of the bank lending market failures, such as insufficient co-financing, collateral or fully utilized capacity of senior debt borrowing.
In the rescue and restructuring financing segment, the assessment reveals that private sector is sensitive to adverse changes in the market and company financials, thus there is lack of adequate financing for rescue and restructuring of SMEs in financial difficulties.
After having identified the presence of market failures and suboptimal investment situations that justify public intervention and quantified the market viable gap, the investment strategy provides the following envisaged financial instruments to facilitate SME access to finance:
The microloans instrument is aimed to support small enterprises, implemented by both the national specialised development finance institution (AFI) and private micro financing providers. It is expected to support in total indicatively up to 900 small enterprises, providing state aid in accordance with the de minimis aid rules.
The start-up loans instrument is aimed to support small and medium enterprises in their start-up development stage, implemented by the national specialised development finance institution (AFI) with the total budget of EUR 20 million, including EUR 10 million by the ESI funds. The planned start-up loan amount to a single enterprise will be up to EUR 150 thousand with maturity up to 8 years. It is expected to support in total indicatively up to 300 enterprises, providing state aid in accordance with the de minimis aid rules.
The growth loans instrument is aimed to support small and medium enterprises in their growth development stage, implemented by the national specialised development finance institution (AFI) with the total budget of EUR 40 million. The planned growth loan amount to a single enterprise will be up to EUR 500 thousand (EUR 250 thousand for working capital) with maturity up to 10 years. It is expected to support in total indicatively up to 107 enterprises, providing state aid in accordance with the de minimis aid rules.
The co-lending instrument is aimed to support small and medium enterprises in their start-up and growth development stage, implemented by the national specialised development finance institution (AFI) with the total budget of EUR 15 million, including EUR 5 million by the ESI funds. The planned mezzanine loan amount to a single enterprise will be up to EUR 2 million (EUR 250 thousand for working capital) with maturity up to 10 years. It is expected to support
11
in total indicatively up to 30 enterprises, providing state aid in accordance with the de minimis aid rules or general block exemption rules for investment aid to SMEs.
The loan guarantees instrument is aimed to support small and medium enterprises in their start-up and growth development stage, implemented by the national specialised development finance institution (AFI) with the total budget of EUR 20 million financed by the ESI funds. The planned loan guarantee amount to a single enterprise will be up to EUR 1.5 million (EUR 750 thousand for working capital) with maturity up to 10 years. It is expected to support in total indicatively at least 128 enterprises, providing state aid in accordance with the de minimis aid rules.
The export credit guarantees instrument is aimed to support small and medium exporting enterprises in all development stages, implemented by the national specialised development finance institution (AFI) with the total budget of EUR 20 million. However, to ensure the effective implementation of credit insurance instruments it is considered to create a credit insurance agency, which will operate as a separate subsidiary of the national specialised development finance institution (AFI). The planned trade credit insurance amount to a single enterprise will be up to EUR 1 million for short-term transactions (with payment period of up to 2 years) and 5 million EUR for medium and long-term transactions (with payment period between 2 and 10 years). It is expected to support in total indicatively at least 85 enterprises.
Accelerators will support new and innovative small enterprises in technologically intensive sectors in their pre-seed development stage. Private financial intermediaries will be selected by the national specialised development finance institution (AFI), with the total budget of EUR 10 million (financed by the ESI Funds). Accelerators (financial intermediaries) will implement accelerator programs. The duration of each of the program will be up to 24 months. Acceleration services for fee and early stage investments up to EUR 25 thousand, will be provided by accelerators. Follow-on investments might be made in perspective businesses from private investors own resources. It is expected to support in total 90 enterprises, providing state aid in accordance with the general block exemption rules on aid for start-ups.
The business angel co-investment fund instrument is aimed to support new and innovative small enterprises in their seed and start-up development stages, implemented by a private financial intermediary selected by the national specialised development finance institution (AFI), with the total budget of EUR 10 million. The co-investment fund is planned to provide to a single enterprise investments not exceeding 15% of the fund’s capital. It is expected to support in total indicatively up to 33 enterprises, providing state aid in accordance with the general block exemption rules on risk finance aid.
The venture capital funds instrument is aimed to support new and innovative small and medium enterprises in their start-up development stages, implemented by private financial intermediaries selected by the national specialised development finance institution (AFI), with the total budget of EUR 30 million financed by the ESI Funds and additional private financing of EUR 10 million. The two venture capital funds are planned to provide to a single enterprise investments not exceeding 15% of the fund’s capital. It is expected to support up to 40
12

enterprises, providing state aid in accordance with the general block exemption rules on risk finance aid.
The growth capital fund instrument is aimed to support innovative small and medium enterprises in their growth development stages, implemented by a private financial intermediary selected by the national specialised development finance institution (AFI), with the total budget of EUR 35 million financed by the ESI Funds and additional private financing of EUR 23 million. The growth capital fund is planned to provide to a single enterprise investments not exceeding 15% of the fund’s capital. It is expected to support in total indicatively up to 31 enterprises, providing state aid in accordance with the general block exemption rules on risk finance aid.
The rescue and restructuring guarantees and loans instrument is aimed to support small and medium enterprises in difficulties that can return to long term economic viability, implemented by the national specialised development finance institution (AFI) with the total budget of EUR 10 million. It is expected to support in total indicatively up to 20 enterprises, providing state aid in accordance with the rules notified and approved by the European Commission.
Financial allocation to financial instruments in the programming period 2014 – 2020 is based on market gap assessment findings and taking into account market failures identified in the assessment and considering actual demand and payments made for financial instruments in the 2007-2013 programming period. Such an approach allows allocating precisely financial resources when implementation of financial instruments is envisaged on similar conditions as in the previous programming period. The assessment findings might deviate from actual payments made for financial instruments in the 2007-2013 programming period because the analysis is based on various data (incomplete information and scarcity of reliable and readily available data to perform the analysis) and triangulated in order to establish the evidence of the market failure and market viable gap sources.
Apart from the envisaged financial instruments, the investment strategy proposes several additional support activities, namely, a grant scheme to co-finance pre-seed workshops and networking events, a grant scheme to cover part of SME expenses accrued in relation to initial public offering or possibly an investment guarantee scheme to cover credit risk of corporate bonds, and to develop a combined and co-ordinated information, publicity and possibly even SME training strategy of public initiatives to improve SME awareness of available financing instruments and SME ability to attract financing.
The assessment, including the market analysis and the investment strategy, is expected to be periodically reviewed and updated to reflect any deviations from the expected results or miscalculation of risks related to the financial instruments, a gradual change in the market conditions that could require adjustments in the financial instruments, or a drastic change in the market conditions that could require a re-assessment of the already implemented financial instruments and possibly introduce new financial instruments. Therefore, once a year but not later than in the end 2016 necessary adjustments of the assessment will be evaluated and, if necessary, the assessment will be updated. Additional allocation of EU funding for financial instruments will be revised at the end of 2018 if changes in the demand will occur.
13

1. INTRODUCTION

15

1. Introduction
The pivotal role of small and medium-sized enterprises (SMEs) in the economy has been repeatedly acknowledged both at European and national level. Since its adoption in 2008, the Small Business Act for Europe reflects ongoing political will of the European Commission (EC) to recognise the central part of SMEs in the European Union (EU) economy and puts into place a comprehensive SME policy framework for the EU and its Member States.1 In the footsteps of this act, the successive policy recommendations have continuously strived towards establishing and adopting a coherent approach to improve SMEs’ access to finance.
In the 2004-2006 programming period, the structural funds support to SMEs was mainly provided via grant funding, use of financial instruments (FIs) was limited. In comparison, the 2007-2013 programming period brought a much wider application of FIs along and in combination with grants2.
Due to the added value of the use of FI comprising facilitating and attracting additional private financing, attraction of additional expertise and know-how by the private market, which helps to increase the efficiency and effectiveness of public resource allocation, re-use of capital resources for further investments, conditionality to the existence of the market failure, non-distortion to the competition the Ministry of Economics of the Republic of Latvia foresees increased use of FIs for SMEs in the 2014-2020 programming period.
Nevertheless, further transition away from grant funding schemes towards FIs for SMEs will be gradual. Considering a wide use of grants to finance innovation projects in the 2007 – 2013 programming period, a grant scheme supporting implementation of new products into production will be continued in the 2014 – 2020 programming period in order to provide access to funding for purchase of innovative equipment for those enterprises, which face several obstacles in the availability of funding (the lack of own capital, insufficient collateral or guarantees and being overleveraged) and to stimulate acquisition of the most innovative and advanced production machinery. The need of grants is justified by requirements of commercial banks for own co-financing for the project, since commercial banks in their scoring system count grants as co-financing for the project. A grant scheme will complement the range of FIs for the implementation of innovative and knowledge-intensive projects.
Grants facilitate further specialization of innovative and knowledge intensive companies and ensure conformity to RIS3. The availability of grants will accelerate creation of innovative companies, technologically advanced production facilities, demand for R&D services and VC instruments. Given that the analysis is limited to financial instruments only, there is no detailed investment strategy of grant schemes improving SMEs access to finance provided in the assessment.
1 A Small Business Act for Europe (COM (2008) 394, 23.6.2008).2 European Commission, Summary of data on the progress made in financing and implementing financial engineering instruments
reported by the MAs in accordance with Article 67(2)(j) of Council Regulation (EC) No 1083/2006. Programming period 2007-2013 (situation as at 31 December 2012).
16

FIs represents a resource-efficient way of deploying public resources in pursue of the SME financing objectives. Targeting only feasible projects with economic viability, FIs provide support for investments in the form of loans, guarantees, equity, quasi-equity, and other risk-bearing mechanisms, possibly combined with technical support, interest rate or guarantee fee subsidies.
The present SME Access to Finance Market Gap Assessment for Latvia (the assessment) prepared by the Ministry of Economics of The Republic of Latvia provides the justification for the implementation of FIs supported by European Structural and Investment Funds (ESIF) and as envisaged by the priorities and policies under the TO no.3 to enhance the competitiveness of SMEs within the 2014-2020 programming period. However, research, development of technologies and innovations are one of the most important aspects for the competitiveness and sustainable entrepreneurship. The assessment evaluates and provides financial instruments also for innovative and knowledge-intensive projects. As a result, financial instruments are complementary to the thematic objective no. 1 to strengthen research, technological development and innovation, and no financial instruments are envisaged under the thematic objective no. 1. For example, private equity investments stimulate innovations and in particular cause a significant increase in the patent filings 3. The availability of venture capital has a significant positive effect on the likely emergence of new entrepreneurial projects with high growth and innovation potential4. Therefore, the provision of access to finance in the form of equity (accelerators, venture capital funds, growth capital funds, business angel co-investment fund) is beneficial to achieve an increase in investments in research and innovations.
Concentration of all financial instruments under the thematic objective no. 3 approach avoids unnecessary fragmentation of financial instruments and allows implementing financial instruments on the best market practice. According to Article 37 of the EU Common Provisions Regulation (CPR), support of financial instruments shall be “based on an ex ante assessment which has established evidence of market failures or suboptimal investment situations, and the estimated level and scope of public investment needs, including types of financial instruments to be supported.”5
Accordingly, this assessment studies the existing supply and demand of SME financing instruments in Latvia, analyses if and to what extent financing gaps exist in particular segments, and proposes an investment strategy with specific FIs how to address the market failures, identified suboptimal investment situations and SME financing needs. Characteristics of innovative and knowledge-driven projects and their weaknesses and limitations are considered in the assessment, when assessing supply and demand side of venture and growth capital, technology transfer and business angel financing and when choosing an appropriate investments strategies.
3 Popov and Roosenboom, ECB Working Paper, 20094 VICO Project, 20115 European Union (2013). Regulation (EU) No 1303/2013 of the European Parliament and of the Council of 17 December 2013 laying down
common provisions on the European Regional Development Fund, the European Social Fund, the Cohesion Fund, the European Agricultural Fund for Rural Development and the European Maritime and Fisheries Fund and laying down general provisions on the European Regional Development Fund, the European Social Fund, the Cohesion Fund and the European Maritime and Fisheries Fund and repealing Council Regulation (EC) No 1083/2006. Official Journal of the European Union. 20.12.2013. L 347/320 – L 347/469.
17

1.1. Objectives and Scope of the Assessment
In line with Article 37 of CPR, the assessment aims to provide an unbiased market analysis, applying both qualitative and quantitative research methods, identify and, if possible, quantify the current market failures, suboptimal investment situations, and investment needs for SMEs in Latvia, and present the investment strategy. Investment needs of innovative and knowledge-driven projects are also considered.
In order to achieve neutrality, part of the assessment exercise was independently performed by a specially contracted consultant – Deloitte Latvia. The consultant’s task was to deliver content specifically required under Article 37 (2) sub-parts (a) and (d) of CPR, namely, an analysis of market failures, suboptimal investment situations, and investment needs; and an assessment of lessons learnt from similar instruments and ex ante assessments carried out in the past. To determine an appropriate amount of funding for each of the FIs, the allocation of funding in the Section 4 of the assessment is determined considering identified market failures and demand for FIs in the 2007-2013 programming period. Such an approach is the most optimal to allocate limited funding to specific financial instruments.
This assessment provides the justification for the implementation of FIs financed not only by ESIF within the 2014-2020 programming period, but also by resources returned from the FIs operations of the 2007-2013 programming period and other funding. According to the Coordination Committee of the Funds (COCOF) Guidance Note on Financial Engineering Instruments”,6 any and all returned resources shall be allocated to similar type of activities for the benefit of SMEs and used beyond the end of the their respective programming period until exhaustion. Therefore, the investment strategy of the assessment duly anticipates the re-use of these returned resources, if applicable, with specific provisions for the relevant FIs. The assessment envisages reviewing EU funding for FIs in 2018, if additional demand for FIs will occur.
1.2. Regulatory Framework
CPR lays down provisions for the use of ESIF, including FIs under one or more programmes to be implemented during the 2014-2020 programming period. FIs are positioned as a necessary tool for the successful implementation of Common Strategic Framework (CSF) policies as well as for achieving the Europe 2020 Strategy objectives for smart, sustainable and inclusive growth. FIs are promoted as a valuable complement to traditional grant schemes and that leverages existing experience with the use of FIs acquired during the 2007-2013 programming period.
Managing authorities (MAs) are allowed to use FIs for all 11 TOs covered by CSF programmes as part of the future Cohesion Policy (CP) for 2014-2020. As a result, the structure of CSF programmes will have to be aligned with the TOs, including the TO no.3 which states that “each CSF Fund shall support the following thematic objectives in accordance with its mission in order to contribute to the Union strategy for smart, sustainable and inclusive growth: […] enhancing the competitiveness of small and
6 European Commission – Directorate-General Regional Policy (2012). Revised Guidance Note on Financial Engineering Instruments under Article 44 of Council Regulation (EC) No 1083/2006. COCOF_10-0014-05-EN.
18

medium-sized enterprises [(for the ERDF)], the agricultural sector (for the EAFRD) and fisheries and aquaculture sector (for the EMFF)”.
The assessment is prepared according to all provisions given under Article 37 of CPR in regards to the required content of a market gap ex ante assessment. Obviously the assessment, where necessary and if justified, goes beyond and explores other aspects and considerations related to the subject of the study. For verification purposes a special assessment completeness checklist is included in Annex I.
In addition to the CPR provisions, the assessment is drafted, as far as possible, following the EC methodological guidelines for preparing ex ante assessments for FIs in the 2014-2020 programming period, both general methodology covering all the TOs (Volume I) and specific methodology for the TO no.3 (Volume III),7 as well as the guidelines for preparing SME access to finance market assessments (GAFMA) by European Investment Fund (EIF).8
1.4. Priorities and Policies for SME Financing
In June 2010, the Parliament of the Republic of Latvia, the Saeima, approved the Sustainable Development Strategy (SDS) of Latvia until 2030.9 It defines the national priorities, development directions and objectives, action directions, and solutions for sustainable development, balancing public welfare and environmental and economic development. The SDS prioritizes creation of “Innovative and Eco-efficient Economy” with the objective for Latvia to become one of the leaders of the EU in the terms of distribution of innovative and exportable enterprises. Furthermore, the SDS identifies several possible solutions to the challenge of globalization of economy and promotion of creative activity, such as, co-operation of scientists and enterprises in the research field, cluster development programme, research and development tax credit, innovation bonds of pension funds, and innovation guarantees.
In December 2012, the Parliament of the Republic of Latvia, the Saeima, approved the National Development Plan (NDP) of Latvia for 2014-2020.10 It defines the main national priorities, objectives, and goals, as well as the most important challenges for the economic development. The NDP prioritizes “Growth of the National Economy” in order to facilitate Latvia’s “economic breakthrough”. The aim of this priority is to balance the structure of Latvia’s national economy, expand the operations of the sectors focused on external markets, and provide targeted support to businesses in the manufacturing sector and with internationally competitive services.
The NDP recognizes that to achieve growth through improved competitiveness of Latvian products and services it is required to increase productivity; encourage the private sector investments in research and innovation, in close cooperation with the scientific sector; provide an outstanding business environment (predictable, reasonable, and supportive to every entrepreneur); develop a
7 European Commission, Ex-ante assessment methodology for financial instruments in the 2014-2020 programming period.8 European Investment Fund (2014). Guidelines for SME Access to Finance Market Assessments. Working paper 2014/22.9 Sustainable Development Strategy of Latvia until 2030,
http://www.varam.gov.lv/in_site/tools/download.php?file=files/text/dokumenti/pol_doc//LIAS_2030_en.pdf10 National Development Plan of Latvia for 2014-2020, http://nap.lv/images/NAP2020%20dokumenti/NDP2020_English_Final.pdf
19

sustainable transportation infrastructure that ensures domestic mobility and international accessibility; and promote an efficient and smart use of energy resources and energy production.
The NDP sets the following strategic objectives in order to achieve the priority “Growth of the National Economy”:
Highly productive manufacturing and internationally competitive services with export potential;
Outstanding business environment, that includes a coherent regulatory framework, the operation of a stable state support and monitoring system, public services oriented towards the needs of businesses, clear and competitive environment for the start-ups and development of general business activity;
Advanced research and innovation and higher education, by promoting well-developed research and successfully commercialised innovations that enable to manufacture products that can be exported and provide internationally competitive services; and
Energy efficiency and energy production, in ensuring the competitiveness and independence of the national economy.
In April 2011, the Ministry of Economics of the Republic of Latvia submitted to the EC the National Reform Programme (NRP) of Latvia for the Implementation of the “EU 2020” strategy11 and, in April 2013, the progress report on its implementation.12 These policy documents describe the medium-term macroeconomic scenarios in Latvia, assess the progress on the implementation of policy directions and the achievement of the quantitative targets of Latvia within the “Europe 2020” strategy, and indicate the planned use of the EU funds in the 2014-2020 programming period.
The NRP sets a priority for “Promoting Competitiveness” through the following main objectives:
Business environment and modernization of public administration by, among other initiatives, reducing administrative barriers and labour taxes, simplifying administrative procedures for entrepreneurs, improving regulatory basis for employment legal regulations, and combating “grey economy”;
Promoting productive investments and exports, with the key policy measures to support access to finance, attract foreign investments, support access to foreign markets, and strengthening capacity of municipalities in attraction of companies and investments; and
Innovations, research and development, including the policy initiatives to develop a long-term cooperation platform for enterprises and scientists, support development of innovative enterprises.
11 National Reform Programme of Latvia for the Implementation of the “EU2020” strategy, http://ec.europa.eu/europe2020/pdf/nrp/nrp_latvia_en.pdf
12 Progress Report on the Implementation of the National Reform Programme of Latvia within the “EU2020” strategy, http://ec.europa.eu/europe2020/pdf/nd/nrp2013_latvia_en.pdf
20

In April 2012, the Ministry of Economics of the Republic of Latvia prepared the Guidelines on the National Industrial Policy (NIP) for 2014–2020.13 It defines the national industrial policy aim to stimulate the structural economic changes in benefit of production of products and services with higher added value, including the increase of manufacturing sector, the modernization of manufacturing and services, and the growth of exports. In order to achieve this aim, the NIP proposes tasks to address the market failures and improve the competitiveness, develop the specific potential of separate sectors, utilize the regional advantages, identify the export-capable sectors and develop appropriate state support instruments.
In July 2014, the Cabinet of Ministers of the Republic of Latvia approved the Partnership Agreement (PA) for the European Union Investment Funds Programming Period 2014-2020.14 In alignment with the EU strategy of smart, sustainable and inclusive growth, the PA provides with the analysis of the national development needs and growth potential, and proposes the thematic objectives and investment priorities to be financed by the ESIF in the 2014-2020 programming period.
The PA identifies the following main challenges for the priory aim “Growth of the National Economy” and intricately in relation to SME financing:
Cooperation of private sector with research institutions is weak; Technology transfer is underdeveloped; Low level of commercialization; Small share of processing industries in the economy; Low productivity; Weak innovation performance; Current business model is weakly oriented to innovation; Limited access to financing, especially in the start-up phase; Low quality of public and business infrastructure and shortage of industrial areas and
infrastructure suitable for development of manufacturing; Shortage of export skills in SMEs; and Insufficient inter-sectorial cooperation at local and international level that aims to
commercialize creativity and innovation by developing new goods and services and increasing value added.
In order to address these challenges, the PA describes the planned objectives under the TO no.3 “Enhancing the competitiveness of SMEs, the agricultural sector (for the EAFRD) and the fisheries and aquaculture sector (for the EMFF).” It specifically states: “it is necessary to enhance the creation and development of new, innovative and viable SME’s int.al. providing them with consulting services required during the start-up stage, facilitating the access to finance, by implementing financial instruments activities.”
13 Guidelines on the National Industrial Policy for 2014-2020, http://www.em.gov.lv/images/modules/items/Industrialas%20politikas%20politisko%20vadliniju%20dokuments%20FINAL.pdf
14 Partnership Agreement for the European Union Investment Funds Programming Period 2014-2020, http://www.esfondi.lv/upload/Planosana/FMPlans_230714_PA_updated.pdf
21

In October 2014, the Cabinet of Ministers of the Republic of Latvia approved the action programme “Growth and Employment” (APGE). The APGE has been submitted and approved by the EC on November 2014. This planning document allows to start implementing individual activities, the financing of which will be ensured later by the means available in the programming period 2014-2020 of the EU structural funds.
The APGE assumes the following investment priorities to increase SME competitiveness:
Promote entrepreneurship, in particular by facilitating the utilization of new ideas in the economy and supporting creation of new companies, including with the help of business incubators;
Support SME ability to achieve growth in the regional, national and international markets, and participate in innovation processes; and
Support the creation and improvement of SME ability to develop products and services.
The current draft of the PA clearly demonstrates the government’s desire and intent to use FIs to support creation and development of SMEs and facilitate their access to finance in the 2014-2020 programming period.
The policies and priorities described in this chapter are taken into consideration in preparation of this assessment, including the analysis of market failures and the proposed investment strategy.
1.4. Structure of the Assessment
The assessment begins with the review of market environment (Section 2). It includes a description of an overview of the macroeconomic situation, socioeconomic and political trends; and an insight in the SME characteristics and environment identifying the SME demographic profile, the institutional and legal framework, the general trends, development, and challenges. The section also presents the existing SME financing instruments available in the Latvian market providing an overview of public support schemes and the historical use of structural funds.
In Section 3, the SME financing market analysis are performed and findings presented separately for each category of financing product: microfinance, bank lending, guarantees, venture capital and growth capital, technology transfer financing, business angel financing, mezzanine loans. The section begins with the presentation of the methodology that details the approach taken in collecting and analysing relevant data. Each market segment is analysed by looking both at its supply and demand, and includes a summary of the market research findings and the identified, if any, market failure and the calculated market gap.
In Section 4, the assessment presents the investment strategy, describing the proposed financial instruments, implementing bodies of FIs and how these financial instruments tackle the specific market failures identified in the market analysis. The descriptions expand on the provisions of value added, the state aid implications, the planned leverage effect, the expected counterparty remuneration, and the envisaged combination with grants, where applicable, among other aspects
22

and considerations relevant to justify the implementation of the financial instruments. The analysis is limited to financial instruments only, therefore there is no detailed investment strategy of grant schemes improving SMEs competitiveness or promotion of R&D.
1.5. Provisions to Review and Update the Assessment
Aligned with Article 37 (2) (g) of CPR, the assessment has to have “provisions allowing for the ex ante assessment to be reviewed and updated as required during the implementation of any financial instrument which has been implemented based upon such assessment, where during the implementation phase, the RA considers that the ex ante assessment may no longer accurately represent the market conditions existing at the time of implementation.”
Therefore, the RA assumes the responsibility to assess on annual basis, whether the assessment represents the market conditions and whether any updates in the assessment are necessary. If the assessment needs to be reviewed, the RA administers the task and, if necessary, contracts an independent consultant to perform the market analysis, and update the assessment report in accordance with the initial methodology.
Given unused and repaid funding of the 2007-2013 programming period, in section 4 of the assessment it is stated that unused repayments, which are made till December, 2014 are used to increase allocation of funding for FIs in the 2014-2020 programming period. After 2015 still repayments will be made, therefore RA envisage to review and to increase the allocation of funding to FIs. Therefore necessary changes in the budget of FIs will be made and information on actions taken would be submitted to the monitoring committee in 2018.
When evaluating the need to update the assessment, the RA considers the following, but not only these triggers:
Data attained from regular reporting/monitoring of the FI show poor accuracy, inadequate volume or miscalculation of risks taken comparing the proposed targets to observed results;
A gradual change in the economic environment may have led to new evidence of market failures or suboptimal investment situations, and minor adjustments in the estimated level and scope of public investment needs, including the already implemented FIs;
A more drastic change in the economic environment such as major financial crisis and other externalities may require a comprehensive re-assessment of the SME financing market, major adjustments in the already implemented FIs, and possibly completely new FIs.
23

2. MARKET ENVIRONMENT

2. Market Environment
2.1. Characteristics of the Economy and Demographics
Situated in north-eastern Europe with a coastline along the Baltic Sea, Latvia is regarded as one of Europe’s most dynamic economies.
Figure 1: map of Latvia
25

Table 1: key figures15
2.1.1. Macroeconomic overview
Latvia experienced a credit-driven boom prior to the 2007-2008 financial crisis. In 2007, Latvia’s current account deficit was 22 per cent of gross domestic product (GDP), while the huge private sector financial deficits were estimated at 23 per cent of GDP. To address the consequences of a decline in capital inflows, asset price collapses, recession and net public debt of 5% (as of 2007), Latvia’s national currency, the lat, was pegged at EUR 1.42 per lat since January 1, 2005 and fiscal austerity measures had been implemented. The latter included trimming public sector wages by an average of 25%, widespread job cuts, reductions in state benefits and hikes to indirect taxes. In “Boom, Bust, Recovery – Forensics of the Latvia Crisis”16 Olivier Blanchard, Mark Griffiths and Bertrand Gruss of the International Monetary Fund (IMF) show that the adjustment involved a very large decrease in output, a very large increase in unemployment, and substantial emigration. Nevertheless, they conclude that the country has undergone a strong return to growth following its internal devaluation and a return to competitiveness.
Table 2: European Economic Forecast Spring 2014
Forecasts for Latvia 2012 2013 2014 201515 EIU, CIA World Factbook, UN, World Economic Forum, Transparency International, Reporters Without Borders, World Bank.16 ‘Boom, Bust, Recovery – Forensics of the Latvia Crisis’ by Olivier Blanchard, Mark Griffiths and Bertrand Gruss
26

GDP growth (%, yoy) 5,2 4,1 3,8 4,1Inflation (%, yoy) 2,3 0,0 1,2 2,5Unemployment (%) 15,0 11,9 10,7 9,6Public budget balance (% of GDP) -1,3 -1,0 -1,0 -1,1Gross public debt (% of GDP) 40,8 38,1 39,5 33,4Current account balance (% of GDP) -2,5 -0,8 -1,3 -2,0
5 May 2014European Commission
European Economy 3|2014
Table 2 lists key features of economic data for Latvia. Although the growth of GDP is expected to slow down to 3.8% in 2014, Latvia is still projected to remain the fastest growing in the EU. The nominal fiscal outlook is broadly stable as the budget deficit is forecast at around 1% of GDP.17
Figure 2: growth performance18
The pace thenceforth is forecasted to pick up to approximately 5% a year in 2015, supported by a rebound in domestic demand. Private consumption is forecast to be the main driver of growth in 2014 and 2015 helped by continuous wage and employment growth. Yet, it should be noted that risks due to the tensions between Russia and Ukraine might have repercussions for regional trade flows and investment sentiment.
On January 1, 2014 Latvia became the 18th country to join the single currency union. Latvia's ascension to the Eurozone is expected to boost foreign direct investment due to price convergence and elimination of currency risk. Further benefits include a reduction in the economic risk from the country's large external financing requirements and high level of foreign exchange debt. Using high-frequency good-level data, Cavallo et al. of MIT (June 2014) show that price dispersion between 17 European Economic Forecast. Spring 2014, European Union, 201418 The Economist Intelligence Unit
27

Latvia and euro zone countries collapsed swiftly following entry to the euro. Whereas 6% of the goods sold in Latvia and Germany in November 2013 had the same price, about 85% did by the end of January 2014 and about 90% did by the end of February 2014.19
2.1.2. Trade
Latvia is a small and open economy as measured by the ratio of exports to GDP. The latter indicator of trade openness was 60% in 2012, with about 30% of exports being re-exports. According to The Economist Intelligence Unit, the current account shifted from a large deficit to a surplus of 8.8% of GDP in 2009, as the economic slump led to a sharp fall in imports and exports and large write-offs in the value of foreign direct investment (FDI). The current-account has since moved back into deficit, but, at 0.8% of GDP in 2013, remains well below pre-crisis levels, although it is expected to widen in 2014-2015. Exports, especially to the EU, are dominated by low-value-added goods. It is imperative to note that in order to avoid unsustainable external imbalances, Latvian products will need to move up the value chain.
The main driving force of the development of national economics is export, thus the promotion of exportable sectors, e.g. manufacturing, is being set as a priority on national politics. During the financial crisis main industries, e.g. manufacturing, trade, construction industries experienced a fall, which were driven by reduced demand in both domestic and foreign markets. Since the crisis has leaded the decrease in labour costs, competitiveness of exportable Latvian manufacturers has increased. The value added in manufacturing has increased from 10.8 % in 2008 to 14.5% in 2012. The share of tradable sectors in economy from 2008 to 2012 has increased by 11%, resulting in changes in the structure of Latvian economy. In 2012 there was the steady growth in manufacturing, resulting in a production increase by 9.3%. The growth of manufacturing production volume contributed about a quarter of all economic growth in the year 2012.
Latvia has consistently reformed its institutions to facilitate macroeconomic adjustment and recovery. As the European Bank for Reconstruction and Development (EBRD) business environment survey shows, the investment climate has improved dramatically and markets have become more flexible. Moreover, in the 2013 “Ease of doing business” survey conducted by the World Bank, Latvia ranked 25th out of 183 countries.
2.1.3. Labour market conditions
The total population of Latvia is approximately 2.04 million. The economically active population (15-74 years old) amounts to 1 030.7 k. Latvia’s population is ageing and there is trend of a negative natural growth rate (in 2011 – 9 715, in 2012 – 9 128 people 20). Moreover, the emigration of workforce has become a serious concern to Latvian economy since the country joined the EU (migration saldo in 2012 was negative – 11 860 people21).
19 Cavallo et al., “The price impact of joining a currency union: evidence from Latvia” , June 2014, (NBER Working paper)20 Central Statistical Bureau of Latvia21 Central Statistical Bureau of Latvia
28

Following a swift economic recovery, the unemployment rate had decreased from 17.3% in 2010 to 9.1% at the end of September 2013, the lowest since the first quarter of 2009. At the end of January 2014 the registered unemployment rate in the Riga region was 6.2%, whereas in Latgale (in eastern Latvia) it was 19.3%. The overall unemployment rate in Latvia on 31 January 2014 was 9.8%. Tightening labour market conditions are reflected in rising wages: real wages increased by about 4.2% in 2013, a significant acceleration from the muted pace of earlier wage growth (1.3% in 2012). This is in line with staff analysis suggesting that the cyclical component of unemployment has largely been eliminated at this juncture; remaining unemployment is mainly structural in nature.22
Despite recent sharp falls in unemployment, that have been partly generated by an exodus of young Latvians to find work abroad, more focus should be devoted to the improvement of labour market conditions. Recently announced measures such as the provision of dual citizenship options for those forced to renounce Latvian citizenship in the past would contribute to sustainable labour market outcomes.
Figure 3: estimated hourly labour costs23
According to Figure 3, in 2013, average hourly labour costs in the whole economy (excluding agriculture and public administration) were estimated to be EUR 23.7 in the EU28 24 and EUR 28.4 in the euro area. However, this average masks significant differences between EU Member States, with the lowest hourly labour costs recorded in Bulgaria (EUR 3.7), Romania (EUR 4.6), Lithuania (EUR 6.2) and Latvia (EUR 6.3), and the highest in Sweden (EUR 40.1), Denmark (EUR 38.4) and Belgium (EUR 38.0).
Productivity in manufacturing in Latvia remains well below the EU average – in 2000 the added value per employee in manufacturing was 15% of the EU average and in 2011 – 35%. According to the forecast for 2020 productivity in manufacturing will still remain challenge – at approximately 50% of the EU average. The gradual adoption of modern information and communications technology will support strong rates of productivity growth.
22 Baltic Cluster Report23 http://epp.eurostat.ec.europa.eu/statistics_explained/index.php/Hourly_labour_costs24 The EU28 includes Belgium (BE), Bulgaria (BG), the Czech Republic (CZ), Denmark (DK), Germany (DE), Estonia (EE), Ireland (IE), Greece
(EL), Spain (ES), France (FR), Croatia (HR), Italy (IT), Cyprus (CY), Latvia (LV), Lithuania (LT), Luxembourg (LU), Hungary (HU), Malta (MT), the Netherlands (NL), Austria (AT), Poland (PL), Portugal (PT), Romania (RO), Slovenia (SI), Slovakia (SK), Finland (FI), Sweden (SE) and the United Kingdom (UK).
29

2.1.4. Inflation
Headline inflation in 2013 was zero, compared with 2.3% the previous year, continuing a sustained decline since the peak of early-2011. The main cause for the decline was a 1.7% fall in energy prices, which has a large weight in the Latvian economy, partly due to the importance of the transportation sector. Excluding energy, food and non-alcoholic beverage components, Consumer Price Index (CPI) inflation was about 0.6% in 2013.25 Inflation has picked up in the early months of 2014, with y-on-y CPI rising to 0.6% in February, and core CPI to 1.2%. Consumer prices (HICP) are set to accelerate substantially to 2.5% in 2015.
Core inflation, in particular services prices, is expected to rise at a higher rate in 2014 due to the solid increase in household incomes. In 2015, headline and core inflation rates are set to converge, reflecting the large impact of electricity prices, which is estimated at about 0.5%.
2.1.5. Fiscal Policy
The general government deficit was 1.0% of GDP in 2013, compared to 1.3% in 2012, with the largest contribution to the deficit coming from local governments. Following several years of decline or very low growth, government's consumption picked up in 2013, growing close to 4% in real terms. Overall expenditure growth, however, remained contained, so the ratio of government total expenditure to GDP declined in 2013.
The general government deficit is expected to stay at 1% of GDP in 2014 and 2015, while the corresponding structural balance is set to deteriorate by about half a percentage point in both years.26 This is a reflection of the impact of measures to lower labour taxes and to continue with the systemic pension reform, which are only partly offset by an increase in indirect taxes. These measures were partly implemented in 2014 and further tax cuts for 2015 and 2016 are fixed in legislation. Government expenditure is expected to continue growing as well in nominal terms, due in part to an increase in minimum wages and pension indexation to inflation and wage growth.
2.1.6. Taxation
Latvia has a flat system of personal income tax, with a rate of 24%. The corporate-profit tax rate is 15%. Employers also pay social security contributions at 24% of salary (the employee pays a further 11%) and a real estate tax of 1.5%.27 Value-added tax (VAT) is levied at 21% (since July 2012), with a lower rate of 12% for medicines and certain utilities.
2.1.7. Business confidence
The World Bank’s Doing Business indicator shows that Latvia has become relatively more business friendly in recent years and fares better than most European Union countries (although it continues to lag behind Estonia and Lithuania). But other indicators (IMD’s World Competitiveness, 2013) 25 IMF Country Report No. 14/11526 European Economic Forecast. Spring 2014, European Union, 201427 The Economist Intelligence Unit
30

suggest that there is considerable room to facilitate trade, including through improvements in infrastructure, and the efficiency of the legal system.
EBRD business environment survey shows, the investment climate has improved dramatically and markets have become more flexible. Moreover, in the 2013 “Ease of doing business” survey conducted by the World Bank, Latvia ranked 25th out of 183 countries.
Economic sentiment in both the industrial and services sectors picked up strongly at the beginning of the year, according to the EC’s monthly surveys, which underscores business support for euro membership. With base interest rates now down to ECB levels, borrowing rates in Latvia are lower than those that would have prevailed outside the single currency area. Eurozone membership will also boost inward investment, by removing transaction costs and residual currency risk. However, private investment expenditure will have to be funded mainly by corporate profits this year, as credit conditions remain tight amid ongoing bank deleveraging. Nevertheless, with business confidence improving and domestic demand strengthening, private sector investment should pick up strongly in 2014-2015, offsetting the effect of ongoing public spending cuts. Total investment is expected to rise by 4.5% in 2014, with growth then settling at around 5% a year in 2015-2018.28
To summarize, the main macro-structural growth and labour bottlenecks for Latvia are the following:
Rebalancing of the economy towards the tradable sectors and raising productivity levels;
Ensuring a well-functioning and stable financial sector in the light of the on-going deleveraging of the private sector;
Addressing the weaknesses in the business environment, ensuring adequate access to finance for companies favouring productive investment;
Avoiding high structural unemployment and ensuring better matching with the labour market.
28 EY Eurozone Forecast March 2014 - Latvia
31

2.2. SME Characteristics and Environment
SMEs are a vital part of Latvian economy and a dynamic, growing SME sector is likely to contribute significantly to future economic growth. SMEs play a critical role in raising productivity growth in Latvian economy by spurring innovation and stimulating stronger competition.
Table 3: basic SME figures – 201329
Number of enterprises Number of employees Value added(EUR b)
Micro 61,787 143,463 1Small 6,899 140,962 2
Medium-sized 1,484 135,579 2TOTAL SMEs 70,172 420,005 5
Figure 4: Latvia’s development areas
Figure 4 illustrates Latvia’s current stance around ten principles ranging from ‘entrepreneurship’ and ‘responsive administration’ to ‘internationalisation’.
29 ‘SME Performance Review’ by European Commission
32

Latvia performs better than the EU average, most notably with regard to ‘Access to finance’, ‘Single market’, ‘State aid & public procurement’, ‘Entrepreneurship’ and ‘Responsive administration’ and lags behind in ‘Skills and innovation’ and ‘Environment’, and performs in line with the average in the remaining ones. However, it improved in almost all areas in the past five years.
2.2.1. Structure of Latvian SMEs
At the end of 2013 there were around 71,000 SMEs accounting for approximately 79% of all private sector employees and about 69% of value added. Both variables exceed EU average by about 12 percentage points. More than 8 out of 10 (85%) economically active enterprises in Latvia are micro enterprises (employing less than 10 persons), while small enterprises account for 12%. The latter figure for medium sized and large enterprises are 2.5% and 0.5% respectively.30 Medium-sized enterprises account for 25% of employment (17% in the EU), and 28% of value added (18% in the EU). In contrast, micro-sized firms are less significant to the economy than in the EU on average.
In Latvia, SMEs account for most employment in almost all sectors, except for the ‘electricity and gas’ sector. They also account for most of value added with exception of the ‘information and communication’ sector where they account for 49%.
Most SME activity (in terms of employment and the number of firms) is in the wholesale and retail trade, just as elsewhere in the EU. The highest proportion of value added coming from SMEs can be found in the manufacturing sector.
The 2008/2009 crisis has hit Latvia’s SMEs hard, resulting in significant slumps in employment, and even more so in value added. However, the value added of SMEs decreased more rapidly between 2008 and 2012 than that of LEs. The former declined by 29% and the latter decreased by 17%. This discrepancy was mainly caused by the poor performance of small enterprises (10 to 49 employees), as their value added decreased by about 34%.
SMEs underperformed because of their vulnerability to the economic crisis. Nonetheless, it is imperative to note the Latvian economy has proved to be very resilient, and both SMEs and larger firms have since recovered. Both SMEs and LEs showed positive growth between 2009 and 2012. The value added created by SMEs increased by about 10% between 2009 and 2012, while value added created by LEs increased by 4%. This shows that SMEs recovered from the crisis quicker than LEs, even though they were more affected.
2.2.2. Current outlook and main challenges for SMEs
Access to finance for SMEs is key to the recovery and long term growth of Latvian economy. The principal providers of external finance are the major Latvian banks. Accordingly, the financial crisis was bound to have an impact on SME finance through the failure and partial nationalisation of banks, higher bank funding costs and the subsequent recession.
30 Ministry of Economics of the Republic of Latvia
33
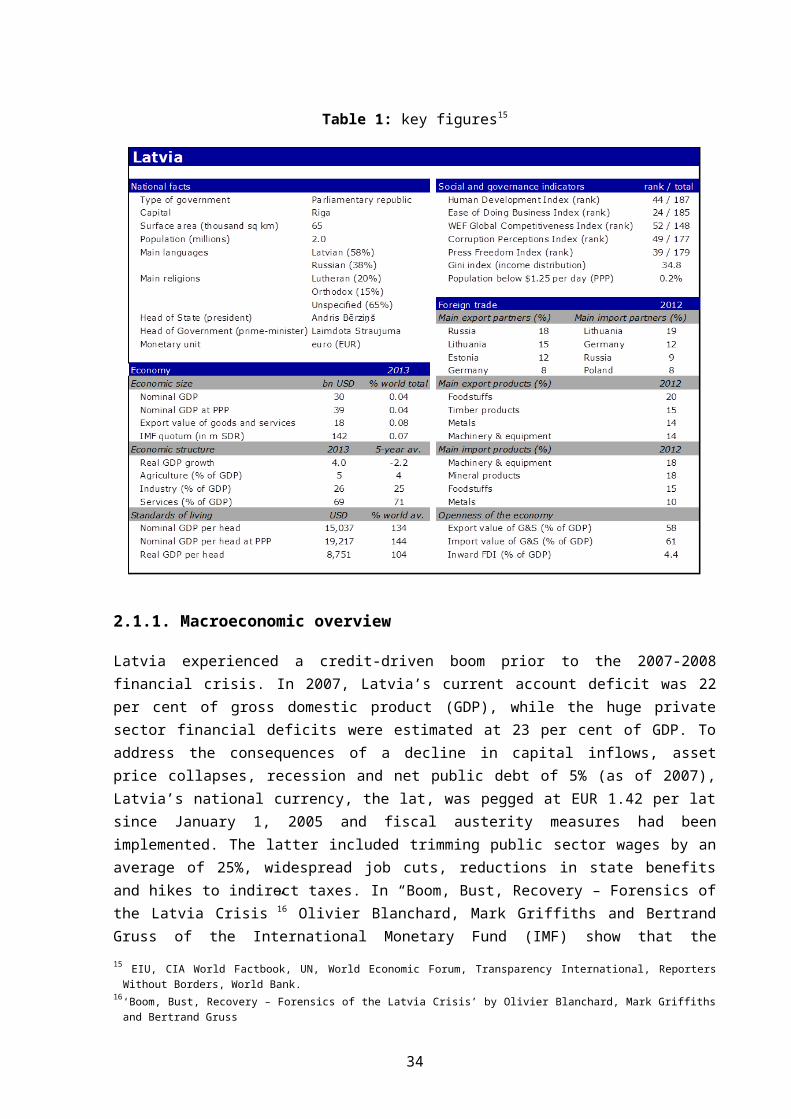
Figure 5: SMAF index31
According to Figure 5, Latvia ranked 6th out of 27 countries in the 2012 SMAF Index, an indication of the changing conditions of SMEs’ access to finance over time for the EU and its Member States. In total, 15 countries have shown improvements in their access to finance environments over the five year period to 2012. In particular significant improvements have been made by Latvia, Lithuania, Netherlands and Croatia.
31 The European Commission (EC) developed the SME Access to Finance (SMAF) index to monitor developments in Small and Medium-sized Enterprises’ (SMEs) access to financial resources, and to analyze differences between Member States.
34

2.3. Existing Financial Instruments
In the 2007-2013 programming period most of the existing FIs for SMEs are co-financed by the public funding within the Operational Programme “Entrepreneurship and Innovation”.
Under the priority “Access to finance” and the priority “Promotion of Employment and Health at Work” FIs are co-financed by the ERDF and the ESF and focuses on improving the business environment by facilitating development of thorough system of support in the form of FIs such as guarantees, loans and venture capital financing. On March 2015 the total funding allocated for FIs under those both priorities is EUR 440 m, including ERDF funding of EUR 147.5 m (the priority “Access to finance”) and ESF funding of EUR 12.8 m EUR (the priority “Promotion of Employment and Heath at Work”).
In comparison to grant schemes FIs can be used time and time again to support economically viable projects. Due to the implementation of FIs in the 2007-2013 programming period additional funding has generated. The total additional funding from capital resources paid back and interest revenue generated and interest payments is EUR 69.4 m on December 31, 2014, thus providing opportunity to support an additional number of final recipients facing difficulties in accessing finance. In line with the market gap assessment about EUR 46 m from additional funding will be used to increase the contribution for FIs of the 2007 – 2013 programming period. EUR 23 m will be used to finance FIs of the 2014 – 2020 programming period. It is important to mention that addition funding will be available in 2015 and later from repayments.
Table 4: additional funding generated by FIs in the 2007-2013 programming period
The number of activity
Additional funding generated till 31.12.2014.M EUR
Total,M EURInterest revenue
generated, M EUR
Resourced paid back and income from interest payments,
M EUR
The priority “Promotion of Employment and Health at Work”1.3.1.2. 1,3 6,0 7,3
The priority “Access to finance”2.2.1.1. 11,0 7,3 18,32.2.1.3. 7,5 1,6 9,1
2.2.1.4.1. 2,8 28,0 30,82.2.1.4.2. 3,3 0,5 3,8
Total 26,0 43,4 69,4
Currently FIs are implemented by the LGA and ALTUM. All below-mentioned instruments are designed, supervised and coordinated by the Ministry of Economics of the Republic of Latvia (RA). All resources available for enterprises in the form of FIs are summarized below in the table no.5.
35

Table 5: allocation of public and private resources for FIs in the 2007-2013 programming period, on March 1, 2015 (according to the contracts signed)
Financial Instrument
Total budget,M EUR
SF funding,M EUR
State budget,M EUR
Private funding,M EUR
Other sources,M EUR
Equity instruments: 77,4 55,9 4,7 13,9 2,9Venture capital 61,5 46 4 11,5 0
Preseed, seed and start-up capital
15,9 9,87 0,72 2,42,9
(interest revenue generated)
Quasi-equity instruments:
29,8 15,15 3,5 0 11,1
Mezzanine loans 29,8 15,15 3,5 0
3,34(interest revenue
generated)
7,76(recycled funding)
Debt instruments: 329,6 89,3 9,6 36,3 213,5
Guarantees 15,4 15,4 0 015,79
(interest revenue generated)
Start-up loans 32,4 16,4 2,6 12,11,3
(interest revenue generated)
Microloans to SMEs 3,7 2,02 0,17 1,47
Loans for competitiveness
195,0 52,1 6,5 19,6
2,7 (interest revenue
generated)
114,0(NIB, Altum)
FRS loans (programme closed in September 2012)
6,7 3,3 0,28 3,15 0
Loans for SME’s growth
79,7 0 0 079,7(EIB)
Total 440,0 160,3 17,8 50,2 227,5
Current state interventions are targeted to cover all possible financing gaps in different development stages of an enterprise, thus providing opportunities for organic growth of SMEs. One of the main reasons for state interventions is to produce critical mass to foster self-development of the market by not distorting market competition and crowding-out private investment.
FIs successfully deal with market failures and demand for FIs in the market is high. Till December 31, 2014 1 925 SMEs are supported under the priority “Access to finance” and the priority “Promotion of Employment and Health at Work” of the total funding EUR 235,4 m, of which ERDF and ESF funding draws up EUR 190,6 m. Among those SMEs 52 new innovative and knowledge-intensive start-ups are created.
36

FIs have an impact on financial market participants. Within FIs implemented under the priority “Access to finance” high leverage is achieved. Till December 31, 2014 under the priority “Access to finance” private funding from investors and commercial banks of total EUR 317 m is attracted. If compared to payments made on the part of the ERDF funding (EUR 188.4 m), the leverage reached 1,69 (169 %).
Figure 6: Access to finance in an enterprise lifecycle
2.3.1. Credit Guarantees
To promote the availability of commercial bank loans the loan guarantee scheme was introduced in 2009 under the priority “Access to finance” and the activity 2.2.1.3. “Guarantees for the development of enterprise competiveness”. Loan guarantee scheme was financed from ERDFfunding. The scheme supported companies to receive loans from commercial banks by sharing credit risks with the bank. Guarantee scheme was closed on December 31, 2013 due to the high multiplier achieved (x 4). Till December 31, 2013 347 guarantees were granted of total amount of EUR 112.38 m. The scheme ensured access to commercial banks loans in total of EUR 250.5 m, thus the leverage 11.8 (1185 %) is reached. When analysing by sectors the greatest risk coverage was provided to public utilities, while least - to construction sector.
37

Table 6: Portfolio of guarantees by sectors and risk coverage, on 31 December, 2013
SectorGuarantees issued,
in M EURNumber of signed
agreementsRisk coverage
Agriculture, forestry and fishing 5.311 9 66%
Mining and quarrying 1.411 6 67%
Manufacturing 67.100 195 50%Electricity, gas, steam and air
conditioning7.902 13 36%
Water supply; sewerage, waste management and remediation
activities0.520 5 80%
Construction 19.936 57 32%Wholesale and retail trade; repair of
cars and motorcycles1.081 7 54%
Transportation and storage 3.272 11 38%
Accommodation and food services 0.100 4 63%
Information and communication services
3.949 26 55%
Professional, scientific and technical services
0.915 3 74%
Administrative and support service activities
0.285 2 66%
Health and social care 0.4312 5 64%
Arts, entertainment and recreation 0.0569 2 73%
Other services 0.0796 2 65%
Total 112.38 347 66%
When analysing beneficiaries by the size of the company, support is being provided mainly to SME’s (325 SMEs or 83 % of total funding portfolio on December 31, 2013). Start-ups hold about 30 % of the total guarantee portfolio. Regarding sectors the main focus was on manufacturing (59.7 % on December 31, 2013).
Table 7: Portfolio by categories of companies, on 31.12.2013
Category Agreements signed Total funding (ERDF), in M EUR
Large 22 19.447SME 325 92.936
The credit guarantee scheme is set up on a national-level without regional priorities. However, most of guarantees were issued to companies operating in Riga (EUR 39,75 M).
38

Figure 7: Regional distribution of credit guarantees granted and loans issued by banks, on December 31, 2013
Short term export credit guarantees, which cover economic and politic risks of export transactions to non-marketable countries with the deferred payment period up to 2 years has successfully addressed market failure, supporting 33 enterprises and ensuring 110 export deals till December 31, 2013. Most of export credit guarantees are granted to projects in manufacturing sector (99 % of the total portfolio) and to companies operating in Riga (EUR 8,65 M on December 31, 2013). 76 agreements were signed with SMEs of total funding 6,60 M EUR and 55 agreements were signed with large enterprises of total funding 5,94 M EUR till December 31, 2013.
Figure 8: Regional distribution of export credit guarantees, in M EUR, on 31 December, 2013
To access the impact of credit and short term export credit guarantees on business performance indicators, net turnover, assets and the number of employees of those 136 companies, which received a guarantee of at least two years ago (till 2012) were analysed. Changes in these indicators were assessed over the period of 2 years. Analysis led to the conclusion that there is a positive
39

impact on net turnover, assets and the number of employees. Over 2 years assets increased by EUR 263.3 m, the number of employees increased by 477 and the net turnover rised by EUR 421 m.
Figure 9: Assets, net turnover, number of employees and 2 years before and 2 years after the date, when the guarantee granted
2.3.2. Equity instruments
To limit failures of the financial market, to foster the development of the venture capital market in Latvia and provide access to early stage and later stage high risk investments for SMEs several venture capital funds are established during 2007-2013 programming period.
Table 8: Public venture capital funds, on March 2015
Fund management company Name of the fund Total fund size Focus
BaltCap Management Latvia, Ltd
BaltCap Latvia Venture Capital Fund EUR 30 M Expansion
Imprimatur Capital Fund Management, Ltd
Imprimatur Capital Seed Fund (including pre-seed fund)
EUR 8,5 M Early stage
Imprimatur Capital Start-up Fund EUR 7,4 M Early stage
Expansion Capital, Ltd Expansion Capital EUR 10,5 M Expansion, early stage
ZGI, Ltd ZGI-3 EUR 10,5 M Expansion. early stage
FlyCap, Ltd FlyCap EUR 10,5 M Expansion, early stage
40

Figure 10: Regional distribution of all venture capital and growth capital investments of the 2007 – 2013 programming period (number of deals), on September 30, 2014
Figure 11: Regional distribution of all venture capital and growth capital investments of the 2007 – 2013 programming period, in M EUR, on September 30, 2014
BaltCap Management Latvia
BaltCap Management Latvia makes venture capital investments (funding amounted to EUR 30 M in total, of which EUR 20 M is public and EUR 10 M is own private co-financing). Investors are local pension funds, institutional investors and other investors. The fund provides financing to SMEs for their expansion, including the diversification of products. The public funding is not subordinated to the private investments and does not act as a downside protection. The fund has sufficient reserves (25 % of fund’s financing) for follow-on investments after 2014.
Until December 31, 2014 BaltCap Management Latvia has made 12 investments of the total funding 14,5 M EUR. The leverage rate achieved by the ERDF contribution is 63 %. The largest part of investments is being made to manufacturing and information and communication services.
41

In 2014 one exit is made by the venture capital fund. BaltCap Management Latvia has successfully sold their shares (47,9 %) of the company Ltd. Primekss Group for EUR 10 m. Compared with the amount of investment (EUR 1,4 m) the return of equity is high – 140 %. Revenue share of public investment is 1.5 m EUR.
Figure 12: Assets, net turnover, number of employees and 2 years before and 2 years after the date of investment
To access the impact of venture capital investments on business performance indicators, net turnover, assets and the number of employees of those 8 companies, which received an investment of at least two years ago (till 2012) were analysed. Changes in these indicators were assessed over the period of 2 years. Analysis led to the conclusion that there is a positive impact on net turnover, assets and the number of employees. Over 2 years assets increased by EUR 16,65 m or 174 %, the number of employees increased by 37 or 111 % and the net turnover rised by EUR 6,28 m or 27 %. If compared to the amount of total investments (EUR 10,367 m) one of new jobs created paid EUR 280 k and the increase of net turnover by EUR 1 m required an investment of EUR 1,65 m.
In the 2007-2013 programming period, the venture capital investments were complemented by the grant scheme offering high value added investments in equipment. Till the end of 2014 16 innovative and knowledge intensive projects has been completed of total funding EUR 122,59 m (ERDF EUR 46,75 m and private co-financing EUR 75,84 m) and their impact can be measured. Projects implementation resulted in an increase of new jobs (697 jobs created or 17% increase) and increase in net turnover by EUR 232,44 m or 48%. If compared to the total costs of projects (EUR 122,59 m) one of new jobs created paid EUR 176 k and the increase of net turnover by EUR 1 m required a grant of EUR 0,5 m.
Comparing results of venture capital investments and grant scheme in terms of turnover and new jobs created, it can be concluded that both contributes to the growth of net turnover and the creation of new jobs. Results are mixed. However due to the revolving nature of FIs public funding will be used several times, therefore the real result of public funding allocated to the venture capital fund on new jobs created and the growth of net turnover will be several times higher. Taking into
42
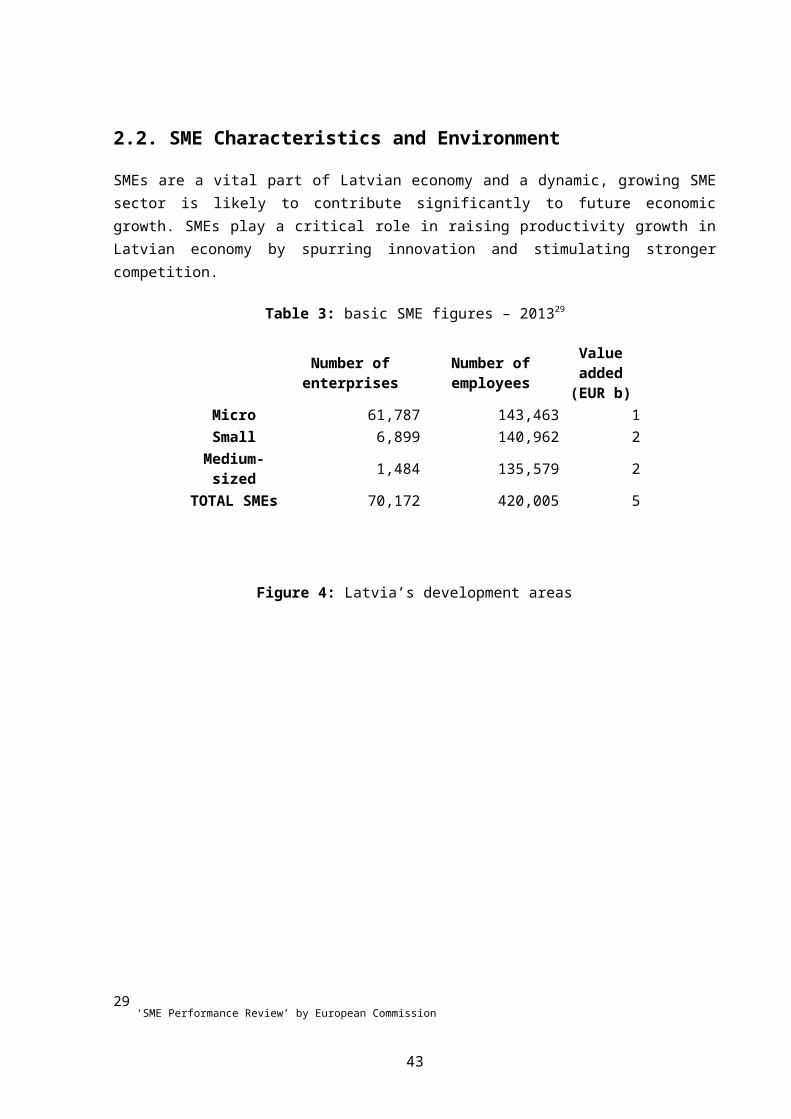
account the administrative costs, which will not be repaid and drawn up about 20 % of the fund size, it is expected that EUR 16 m could be repaid till 2022 and re-used for other investments.
Figure 13: Expected repayments of venture capital fund by years, in m EUR
Imprimatur Capital Seed fund
Imprimatur Capital Seed fund provides early stage investments with total funding of EUR 8,5 M. The fund has been increased, redirecting funding of 3.5 M EUR to pre-seed investments, thus addressing market gap regarding limited pre-seed funding for the creation of initial business concepts. The fund is 100% public financed. Till December 31, 2014 the Imprimatur Capital Seed fund has ensured the creation of 44 new innovative companies (portfolio consists of 15 investments and 29 soft loans). Seed investments are being made in the sectors of nano-technology, B2B e-commerce, enterprise software, digital media, digital security, and data and workflow solutions for health care industry. Seed fund reduces risks to private investors at product development stage. Successful investments have opportunity to attract next round funding from the Imprimatur Capital Start-up Fund. Currently 9 SMEs out of 44 supported in Seed fund have received next round investments.
Imprimatur Capital Start-up Fund
Imprimatur Capital Start-up Fund provides start-up capital with total funding of around EUR 7,4 M, of which EUR 5 M is public and EUR 2,4 M is own private co-financing. A technology focused early-stage fund has invested in 9 companies in the sector of professional, scientific and technical services, and in information and communication service sector, reaching the leverage rate 60 %. A start-up capital fund provides investments up to EUR 600 k. The public funding is not subordinated to the private investments and does not act as a downside protection. Within the fund investments are being provided for the product realization, including for testing a business idea, evaluation of the potential market demand, for the implementation of aggressive marketing strategy etc. In 2011 the first investments of the Start-up Fund were done, according to the intended operational model, where the Seed Fund would test the commercialization potential of the enterprise, and the Start-up Fund would follow up with the next investment tranche, if the transaction was successful. For the first
43

investment case of the Start-up Fund, the fund managers also showed that they can successfully attract other co-investors doubling the investment amount for the company. The follow-on investments are provided to ensure organic growth of companies.
The impact of early stage investments on net turnover, assets and the number of employees were analysed. Were assessed those 11 companies, which received investments from Seed fund and Start-up fund at least two years ago (till 2012). Evaluation showed that investments have had a positive impact on net turnover, assets and the number of employees. Over 2 years assets increased by EUR 1,5 m or 132 %, the number of employees increased by 19 or 86 % and the net turnover rised by EUR 1,25 m or 229 %. Early-stage investment are made in newly created companies, therefore to assess the real impact of investments business performance indicators should be evaluated over a longer period of time. Due to the revolving nature of FIs public funding will be re-used, therefore the real impact of public funding on new jobs created and the growth of net turnover will be higher. Taking into account the administrative costs, which will not be repaid and drawn up 20 % of the fund size, the public funding up to about EUR 11 m could be repaid till 2020 and re-used for other investments. However due to the specifics of early stage investments (higher risks) there is a risk of loss.
Figure 14: Assets, net turnover, number of employees and 2 years before and 2 years after the date of investment or soft loan (within Seed and Start-up funds)
44

Figure 15: Expected repayments of Seed fund and Start-up fund by years, in m EUR
Expansion co-investment funds
Three new expansion co-investment funds Expansion Capital, FlyCap, ZGI-3 with a total public funding of EUR 31.5 M EUR have been established in the August 2013, providing early stage investments and expansion investments up to EUR 1.5 M per company. Funds address market failure regarding insufficient access to early stage and later stage venture capital investments. Expansion capital funds have increased the number of funds operating in the market, thus enhancing the development of the market. Until December 31, 2014 25 investments are made within the funds, including 8 investments in newly created companies. The result of investments on companies’ business performance indicators cannot be evaluated because first investments are made only at the beginning of 2014.
Venture capital funds of the 2004-2006 programming period
In the programming period 2004 to 2006 first three public venture capital funds were introduced into the market (fund managers - ZGI, Second Eko fund, Invento) providing early stage and later stage investments. In 2007 and 2008 28 investments were made for total funding of EUR 16.8 m (public funding EUR 7.9 m). Given that investments were made in the period before the economic crisis, investments had been severely affected by the crisis. Realization value of investments in most cases was negative. Lessons learned:
Follow- on investments should be envisaged; Investment period should be about 5 years; Downside protection should be avoided; Selection criteria should focus on team experience and results achieved.
45

Table 9: Results of public venture capital funds of the programming period 2004-2006 (data on December 2014)
Fund managers Exits (deals)Amount of
investments,M EUR
Value of realization,
M EUR
Losses,M EUR
Profits,M EUR
ZGI 6 4,3 0,8 3,5Second Eko fund 9 5,5 6,2 0,7
Invento 3 0,8 0,17 0, 63
ZGI Fund has realized six investments (out of 9) for the total value EUR 0.8 m. If compared to total amount of investments (EUR 4.3 m), exits constituted a loss of EUR 3.5 m. On December 2014 there are still 3 companies in portfolio and market value for these companies has increased by 2 %, however the value of 2 companies out of those 3 has increased by over 150 %.
Second Eko Fund has realized 9 investments (out of 14) for total value 6.2 m EUR. If compared to total amount of investments (EUR 5.5 m), exits generated revenue of EUR 0.7 m. On December 2014 there are still 5 companies in portfolio and the market value for these companies has increased by 117 %.
Invento ceased its operations in a short time period due to the lack of private funding. Invento invested EUR 0,8 m in 3 companies, which are realized for EUR 0,17 m.
Baltic Innovation Fund
BIF invests public funding to venture capital and mezzanine funds, making investments mainly in companies in Baltic States. BIF provides access to investments from 3 M EUR up to 15 M EUR, however smaller investments can be made in innovative and knowledge based companies. Until January 2015 four financial intermediaries are selected by the EIF (BPM Capital, BaltCap, Livonia Partners, Karma Venture) and one financial intermediary is awaiting approval (Polar Ventures). Livonia Partners and Karma Ventures are working on fundraising, while BaltCap and BPM have already started the investment period. First investment is made by BaltCap in the end of 2014. It is expected that Latvian contribution to the fund will be recycled in full amount.
Table 10: Financial intermediaries of BIF and target size of funds
Fund management company BIF funding Private funding
Total fund size
Investment focus
BPM Capital 15 m 55 m 70 m Small cap PEBaltCap Private Equity Fund II 20 m 80 m 100 m Small cap PELivonia Partners Fund 20 m 60 m 80 m Small cap PEKarma Ventures Fund I 25 m 25 m 50 m Expansion VCPolar Ventures Not yet
approved- - Expansion VC
46
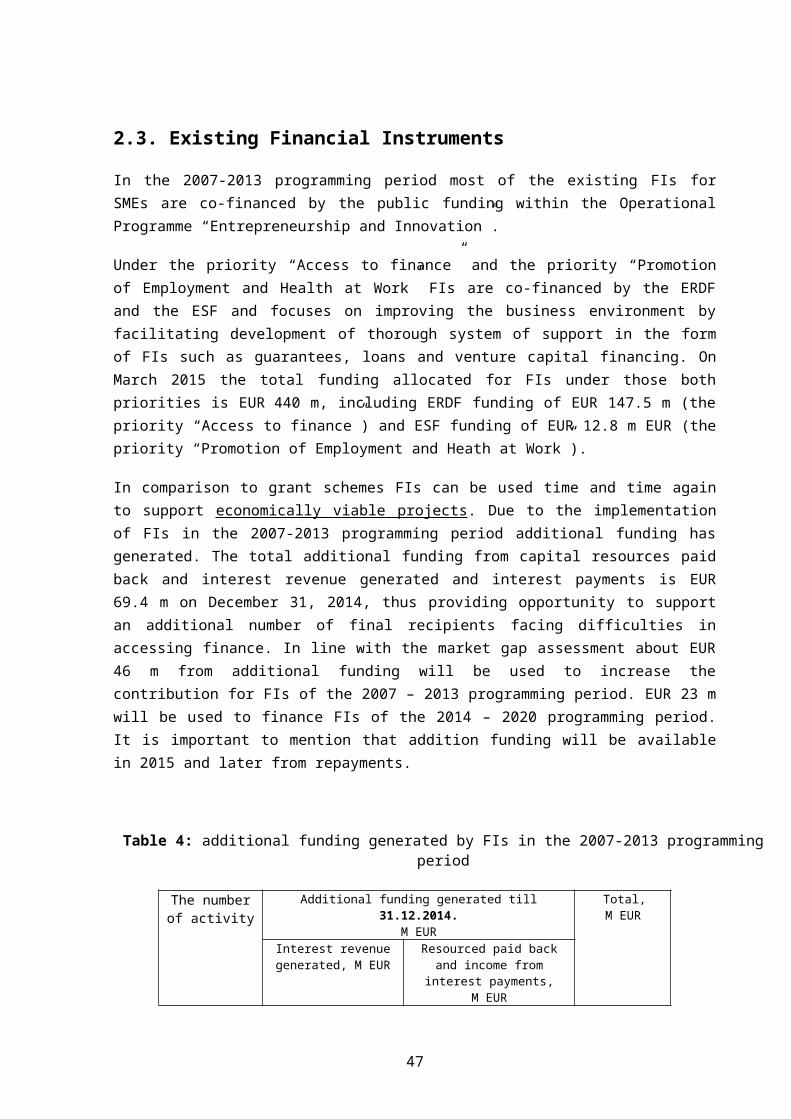
2.3.3. Loans for the Improvement of Business Competitiveness
The loan scheme was introduced in 2009 to improve access to finance for companies facing higher business risks. It is implemented by ALTUM. The loan scheme providing loans for companies expansion is financed with public funding for 66,4 M EUR (interest revenue generated included) and private ALTUM funding for 19,6 M EUR. Until December 31, 2014 110 contracts are signed for total funding of 77,6 M EUR (the leverage rate reached – 66 %). Most of supported projects are in manufacturing sector (69 % on December 31, 2014). Regarding regions the largest volume of portfolio forms companies, which operate in Kurzeme (EUR 23,99 M on December 31, 2014).
Figure 16: Regional distribution of lending scheme, in M EUR, on December 31, 2014
Figure 17: Assets, net turnover, number of employees and 2 years before and 2 years after the date of loan granted
47

Net turnover, assets and the number of employees were analysed to access the impact of the growth loan scheme on business performance indicators of companies. 56 companies were assessed two years after receiving aid. Changes in these indicators were assessed over the period of 2 years. There is a positive impact on net turnover, assets, and the number of employees. Over 2 years assets increased by 63 % (by EUR 86,7 m), the number of employees increased by 8 % (by 191 employees) and the net turnover rised by 20 % (EUR 18,2 m ).
2.3.4. Mezzanine
To improve access to expansion funding for companies facing high debt ratio, mezzanine loan scheme has been introduced in the market in 2011 under the activity 2.2.1.4.2. ”Mezzanine loans and guarantees for the improvement of competiveness”.
The activity 2.2.1.3. “Guarantees for development of enterprise competiveness” providing credit guarantees and short term export credit guarantees is closed on December 2013. To ensure access to commercial bank loans for those companies having higher business risks or insufficient collateral credit guarantee scheme and short term export credit guarantee scheme have been implemented under the activity 2.2.1.4.2.”Mezzanine loans and guarantees for the improvement of competiveness”. Provision of guarantees in 2014 and 2015 led additional funding available from interest revenue generated.
Mezzanine loan is a subordinated loan with low collateral requirements, and is issued together with a bank loan for the same project. Mezzanine loan scheme is 100% public co-financed and funding amounts to EUR 29.8 M. Since the beginning of the program in November 2011 until December 31, 2014 there are 15 contracts signed in total amount of EUR 7,9 M, ensuring the realization of projects of total value EUR 22,5 M EUR (leverage rate reached – 185 %). 12 beneficiaries out of 15 which have received mezzanine loan, are SMEs. There are no specified target sectors within the mezzanine scheme, while still the major part of projects is implemented in manufacturing (59 % of the total portfolio on December 31, 2013). Regarding regions, the largest volume of portfolio forms companies, which operate in Riga (67 % or EUR 12,2 M on December 31, 2014).
During interviews representatives of the commercial banks stressed that mezzanine loan program is crucial for the companies, however slow market penetration could be explained by the fact that it takes two years on average to introduce new product to the market. Recent trends show that the number of mezzanine lending transactions is increasing.
In order to improve access to funding and ensure full utilization of resources widespread marketing activities, which were aimed to improve the awareness of program among the companies, were introduced. Since May 2014 new rules of the program have been passed providing opportunity for companies to receive financial support to cover loan arrangements costs (set by commercial banks). Higher mezzanine limit, which is set in the new regulation, provides access to finance for companies, willing to realize financially more intensive projects.
Net turnover, assets and the number of employees cannot be analysed because there is insufficient number of companies, which have received a loan of at least two years ago (till 2012).
48

Figure 18: Portfolio of mezzanine loans by sectors, in M EUR, on December 31, 2013
Figure 19: Regional distribution of mezzanine loans and loans issued by commercial banks, on December 31, 2014
2.3.5. Start-up Program
Since commercial banks are reluctant to finance start-up companies due to the high risks, information asymmetry, lack of financial records and high administrative costs, the start-up loan scheme was introduced in 2009, supporting increase of economic activity in Latvia. Within the scheme loans are granted to newly established start-ups with no specified target sectors. Additionally also grants for repayment of loan principal have been provided (since middle of 2013 grants are no longer provided). Within the scheme consulting in the preparation of business plan and its implementation, as well as trainings are provided (since July 6, training modules are offered within the programme “Training for operating start-ups and individuals who wish to take up economic activities”). It is estimated to reach the portion of 35 % from those beneficiaries, who after receiving consulting within the scheme have started a self-employment or business. On December 31, 2014 this portion is already achieved by 33 % (1343 persons).
49
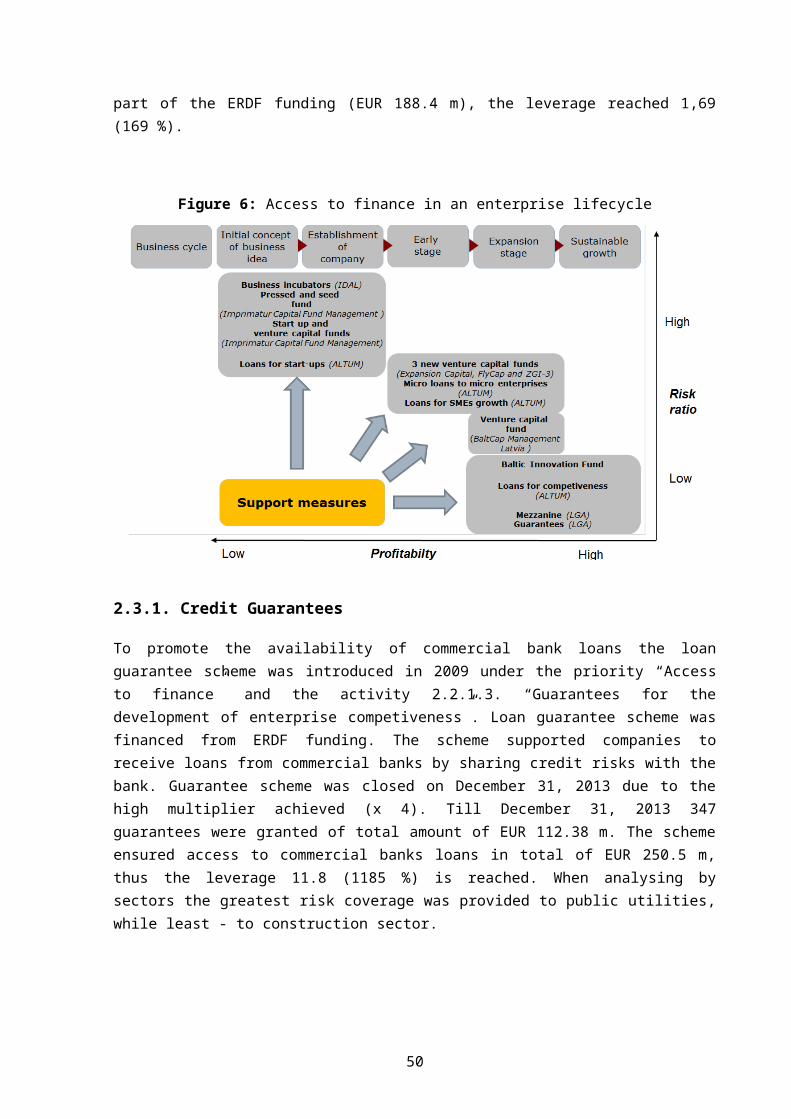
Loan scheme is financed by national budget, EU funding and ALTUM private funding in total of EUR 32,4 M (on December 31, 2014 leverage rate achieved – 98 %). Until December 31, 2014 1367 contracts were signed for a total funding of EUR 24,8 M, out of which EUR 23,39 M are issued for loans and EUR 1,38 M for grants. Regarding the sector, the largest amount of loans is granted to projects in manufacturing (27 % on December 31, 2014) and retail trade (24 %). The main part of portfolio form companies, which operate in Riga (EUR 6,86 M on December 31, 2014).
Figure 20: Regional distribution of loans, in M EUR, on December 31, 2014
The scheme contributes to employment. On December 31, 2014 there are 3 172 job places created and saved.
Figure 21: Net turnover, number of employees 2 years before and 2 years after the date of loan granted
50

To access the impact of loan scheme on business performance indicators, net turnover and the number of employees of those 804 companies, which received a loan of at least two years ago (till 2012) were analysed. There is a positive impact on net turnover and the number of employees - over 2 years turnover increased by EUR 33.8 m and the number of employees increased by 1 173.
2.3.6. Micro Loan Program
To provide access to funding for micro-enterprises, ALTUM is implementing Latvian - Swiss micro lending program32, which allow to receive small loans up to 14 k EUR (additionally grants has been allocated until August 2013). The program is not financed by the EU funds. The total funding for the scheme is 7,11 M EUR, out of which 6.55 M is allocated to loans (80% Swiss government co-financing) and 0.57 M EUR - for grants. Funding for grants is fully absorbed in August 2013, thus since September 2013 there are no new grants longer awarded.
Until 31 December 2014 1050 micro loan contracts are signed for total amount EUR 8.7 m. Additional availability of repaid funding provides opportunity to continue granting of loans.
The largest amount of funding is granted for projects in agriculture and forestry (52 % of total portfolio volume on December 31, 2013). Regarding regions the largest volume of portfolio forms companies, which operate in Latgale (EUR 2,36 M on December 31, 2014).
Figure 22: Regional distribution of micro loans, in M EUR, on December 31, 2014
32 More detail information on Swiss contribution can be found on www.swiss-contribution.lv More detail information on EIB’s operations can be found on www.eib.org
51

2.3.7. SME Growth Program
The program ensures access to investment loans and working capital, as well as to credit lines for micro, small and medium-sized enterprises and farms for their business development. The program33
is not using funding from state or EU structural funds, but is fully financed by EIB sources (ALTUM received long term loan of 100 M EUR). Also EIF guarantees have been attracted to implement the scheme successfully. 1075 agreements are signed for total funding of EUR 66,6 M up to December 31, 2014. The main part of portfolio drowns up loans in agriculture (21% of total funding on December 31, 2013), woodworking (19%) and wholesale, retail trade and car repair (6%). The largest amount of loans is granted to companies, which operate in Vidzeme (EUR 15,4 M on December 31, 2014).
Figure 23: Regional distribution of loans, in M EUR, on December 31, 2014
2.3.8. New Microloan Program to SMEs
Taking into account limited number of financial intermediaries, which specialize in micro-lending, access to finance for loans up to EUR 25 k through new private intermediaries (Capitalia and Grand Credit) is provided since July 2014. Fund amounted to 2.2 M EUR, out of which EUR 1.09 M is public funding. 30 loans are issued for total funding EUR 401 k till December 2014. Since August 2014 Altum also provide microloans with total funding EUR 1,5 m. Altum has issued 33 microloans of total funding EUR 0,545 m till December 2014.
2.3.9. Baltic Innovation fund
A new and innovative investment initiative dedicated to boosting equity investments made into Baltic enterprises has been launched by the EIF and Lithuania, Latvia and Estonia. The BIF will invest EUR 100 M into PE and VC funds focused on the Baltic States over the next four years through a ‘fund of funds’ process to further developing equity investment into SMEs to boost growth. It is expected to attract another EUR 100 M from private investors, thus the total available financing for SMEs
33 More detail information on EIB’s operations can be found on www.eib.org
52

would reach EUR 200 M. However due to successful fundraising the actual amount of private co-funding attracted is significantly higher (EUR 169 M on December 2014).
The BIF management agreement was signed by the EIF and representatives from three Baltic States on September, 2012. The EIF is investing EUR 40 M alongside investments of EUR 20 M from each of the national agencies - INVEGA in Lithuania, LGA in Latvia, and KredEx in Estonia. The level of investment into enterprises in each Baltic country will equal at least the respective government’s capital commitment to BIF. For example, if a government invests EUR 20 M into BIF, the process will be managed to ensure that at least EUR 20 M will be invested in enterprises based in that country.
BIF will take full advantage of EIF’s investment experience and track record as a fund of funds manager and its knowledge of best practice and investment activities in the Baltic region.
Until December 2014 first four fund managers by the EIF has been selected – BMP Capital, BaltCap, Livonia Partners Karma Ventures, and Polar Ventures is waiting for approval. BaltCap and BMP Capital has started investment period. The first investment is already made by BaltCap in 2014.
53

2.4. National Specialised Development Financing Institution
A national specialised development financing institution (AFI) has been created on December 19, 2013 as 100% government owned institution to effectively implement investment strategies of FIs as presented in this document. During 2014 and first quarter of 2015 the process will continue to merge three government agencies – Latvian Guarantee Agency, Altum (former Lavijas Hipotēku un Zemes Banka) and Rural Development Fund (the agencies that were responsible for the implementation of programs in the previous planning period) into AFI. The deadline for the merger is planned to be April 1, 2015.
The main aim of restructuring is to increase efficiency in program implementation, to strengthen coordination among programs and to provide entrepreneurs with a “one-stop-shop” for state support mechanisms. Latvian authorities are aware that aim of the operation of AFI is to operate complementary to the financial market and not creating undue distortions of competition.
The restructuring process is designed to provide continuity of program implementation, transfer of corporate knowledge and infrastructure of three previous institutions (i.e. keeping same regional coverage and representation ensured as currently performed by Altum). This approach though may involve risks, as current period investment strategy as opposed to previous period, is relatively more focused on indirect instruments, support for companies in earlier development stages and expansion of various “soft” measures to strengthen impact of the financial instruments. Therefore, there might be issues of too heavy legacy infrastructure that is not optimized, number of non-core activities that are not terminated and therefore cost base that is over sound management fee limits. Vigorous cost monitoring and capacity monitoring process is needed to ensure that these risks are minimized.
AFI as the national level implementing institution of FIs meets provisions laid down in the Article 7 of the Commission Delegated Regulation (EU) No 480/2014 of 3 March 2014 supplementing Regulation (EU) No 1303/2013 of the European Parliament and of the Council laying down common provisions on the European Regional Development Fund, the European Social Fund, the Cohesion Fund, the European Agricultural Fund for Rural Development and the European Maritime and Fisheries Fund and laying down general provisions on the European Regional Development Fund, the European Social Fund, the Cohesion Fund and the European Maritime and Fisheries Fund (Official Journal of the European Union, 20/12/2013) (hereafter – Regulation No 480/2014). Proceedings related to the selection of AFI envisage auditing for the fulfilment of criteria set out in Article 7 of the Regulation No 480/2014.
54

3. MARKET ANALYSIS AND FINDINGS

3. Market Analysis and Findings
3.1. Methodological Framework
This section describes the methodology adopted for the data gathering and analysis aspects of this study.
The small and medium enterprise (SME) “market viable gap” can be defined as a “mismatch between the demand and the supply [...] in the different types of financial instruments (FI) for SMEs”.34 The overall approach for estimating of the market viable gap and market failures is presented in Figure 6 below.
Figure 23: Assessing the unsatisfied demand and level of market failure
Source: Ex-ante assessment methodology for financial instruments for 2014-2020, Volume 1, European Investment Bank, PriceWaterhouseCoopers, 2014, p.44
A need to allocate market viable gap between different financial instruments is based on the preferences and suitability of each instrument to the particular development stage of the company. Life cycle of the company intersects with preferences in financing instruments due to different business needs from one side and confidence and willingness of investors to provide funding. In general SMEs size categories also depict the life cycle of the company (please see Figure 24 below).
34 European Court of Auditors, 2012b, p. 6
56
Unsatisfied demand(low profitability, too high
risk perceived, too low incentives )
Non efficient firm as final recipient
Lack of sustainability of underlying business model
No market failure
Market failure – justification to
support
Reasons
…
No experience in the regional market or in FI
Restricted risk capacity of the financial intermediaries
Lack of collateral
Lack of credit history
Banking policy (e.g. exclusion of sectors)
Unsatisfied demand(rejection, lack of application,
lack of information, lack of experience in FI, etc.)
Satisfied demandMarket supply
(in form of equity, quasi-equity, loan,
guarantee or grants)

Figure 24: Financing tools and the life cycle of the company in the prism of SMEs size category
Population at the risk of poverty
Companies operating in the market
Unborn companies
Pre-seed Seed Start-up Emerging growth/ Expansion
Microfinance
Venture capital (VC)
Business angels (BA)
Technology Transfer (TT)
Growth capital
Loans/Leasing/Factoring
Micro Small Medium Large
Source: based on various information sources: “Ex-ante assessment methodology for financial instruments in the 2014-2020 programming period”, EU; Guidelines for SME Access to Finance Market Assessments (GAFMA), EIF; Alternative Financing Instruments for SMEs and Entrepreneurs, Organisation for Economic Cooperation and Development (OECD).
Market viable gap analysis was conducted to a large extent based on the recommendations in “Guidelines for SME Access to Finance Market Assessments (GAFMA)” by European Investment Fund (EIF) and “Ex-ante assessment methodology for financial instruments in the 2014-2020 programming period” by European Commission (EC). Given the incomplete information and scarcity of reliable and readily available data to perform the analysis, various data sources are used and triangulated to establish evidence of market failure and market viable gap (please see Figure 25 below):
57

Figure 25: Triangulation of information to establish evidence of market failure and estimate market viable gap
Source: Ex-ante assessment methodology for financial instruments for 2014-2020, Volume 1, European Investment Bank, PriceWaterhouseCoopers, 2014, p.45
1. Literature review was used to determine the key indicators concerning environment of SMEs access to financing in Latvia. Indicators were compared to European Union (EU) level and neighbouring countries, where possible.
2. Interviews with stakeholders representing supply, as well as demand were conducted. List of interviews is provided in Annex IV. Interview structure is provided in Annex V.
3. A survey of Latvian SMEs was conducted totalling 228 respondents. Analysis of respondent distribution was conducted to conclude on how representative the sample is to the population of SMEs in Latvia – see Annex II. The questionnaire used in the survey is presented in Annex III.
The market viable gap was estimated primarily based on the results of the survey by extrapolating the results to the population of SMEs in Latvia adjusted for forward looking expected trends. The implied market viable gap results were analysed in context of the comments made by the interviewed stakeholders. Survey was conducted and questionnaire structured as per recommendations of EIF.35 The questionnaire requires respondents to give their estimates of required funding in upcoming three year period, suggesting a period of 2015-2018 given the time of conducted survey. Therefore, the period is moved by one year and assumed to be applicable for 2016-2019. Assuming that directors of SMEs plan their financing needs in long term and the financial needs outlined for the three years ahead possibly imply the same funding requirement for a four-year period, namely 2016-2020. Similarly, there is a possibility that the funding needs for the fourth
35 European Commission, 2013 SMEs’ Access to Finance survey: Analytical Report. 2013
58
Online survey
Interviews
Estimate of market viable gap, market
weaknesses, suboptimal investment
situations and investment needs
Literature review and data gathering

year is equal to the average annual funding requirement noted in the upcoming three years. Therefore, a range is formed based on the two aforementioned scenarios.
Given the scarcely available data, as well as the relatively small size of the sample limiting analysing subsets of the sample, the analysis was performed for the country as a whole and without further analysis by regions.
3.1.1. Literature review
Literature review aimed to analyse existing information on SMEs financing in Latvia. Through literature trends, insights, potential market failures, and alternative estimations of the market viable gap were identified. Literature review particularly included:
- Identifying and interpreting existing indicators on SME financing in Latvia,
- Reviewing information on the economic environment and economic forecasts of Latvia,
- Reviewing the regulatory environment affecting the SMEs in Latvia and particular FIs,
- Collecting statistical data published by official institutions, associations and stakeholders,
- Reviewing research publications from banks, the central bank, and think tanks.
A list of literature reviewed is presented in Annex VII.
3.1.2. Survey on SMEs
Information from existing surveys carried out at the EU and national level is retrieved to evaluate scale of the problem and trends. Given the scarcity of information about the demand side imperfections, an online survey was performed. The survey was designed based on the structure suggested by “Ex-ante assessment methodology for financial instruments for 2014-2020”, European Investment Bank, PriceWaterhouseCoopers, Appendix E, 2014. The results of the survey were critically assessed taking into account the qualities and completeness of provided answers.
SMEs responded to the survey between 27 August 2014 and 15 September 2014. Respondents were required to answer 42 questions concerning basic information on the company, recently acquired funding and plans of those companies on the financing in the following three years, purpose of acquired funding, reasons for rejection (if any), etc. The questionnaire used for the survey is presented in Annex III. Total number of respondents taking part in the survey was 228 with 46 respondents omitted from the analysis due to significantly incomplete answers. Analysis of the SME survey quality is presented in Annex II.
59

3.1.3. Stakeholder interviews
Pre-arranged interviews were organized with key stakeholders in order to identify as well as validate already identified supply or demand side shortcomings. Interview structure was planned beforehand, and the interview findings were summarised and confirmed with the interviewees. The interviews covered both, demand and supply side representatives as well as policy makers, including non-governmental organizations, investors, ministries and financial institutions. In total 22 interviews were performed. The list of conducted interviews is presented in Annex IV; the interview general structure is presented in Annex V.
60

3.2. General Observations
3.2.1. SME survey
SME’s Access to Finance survey report of 2013 by European Commission indicates that access to finance is an increasingly pressing problem and the second most pressing after “finding customers” (14% of surveyed Latvian SMEs indicated access to finance as an “extremely pressing” issue).36
The following paragraphs comment on the preferences of SMEs in funding sources, main obstacles, and likely reasons for failure to obtain financing based on the answers obtained from the conducted survey.
As illustrated in Figure 9 SMEs across segments mostly fund their growth with short-term, medium term loans and leasing. Micro companies cannot rely on retained earnings as a significant source of funding, and instead rely significantly on loans provided by Altum, investments from shareholders, and family of friends, while private investors (such as BA), and micro-financing is most scarcely used, possibly indicating a lack of knowledge of such financial instruments.
Figure 26: Source of funding used by SMEs between 2012-2014
Loan
s fro
m AL
TUM
prog
ram
Inve
stmen
ts by
the o
wner
s
Shor
t-ter
m lo
ans,
bank
over
draft
s ... Le
asin
g
Fam
ily an
d / or
frien
ds
Med
ium
and l
ong-t
erm
loan
s
Reta
ined
earn
ings
Gove
rnm
net g
rant
s
Our c
ompa
ny di
d not
use a
ny so
ur...
Guar
ante
es
Expo
rt cr
edit
guar
ante
es
Priva
te in
vesto
rs
Priva
te gr
ants
or do
natio
ns
Micr
ofina
ncin
g
0%
5%
10%
15%
20%
25%
30%
Micro Small Medium
Source: conducted survey of SMEs; Q13: Over the last three years (2011, 2012, 2013), which source(s) of funding has your company used?, Base: all respondents, %
36 European Commission, 2013 SMEs’ Access to Finance survey: Analytical Report. 2013, p.20
61

As SMEs grow retained earnings increasingly become a significant source of funding. Interestingly, private investors (e.g., BA, VC, private equity (PE) funds) are rarely used as a source of funding regardless of SME segment.
When considering loan financing, SMEs face several common obstacles regardless of the size of SMEs (please see Figure 10 below), namely lack of own capital, insufficient collateral or guarantees, and being overleveraged. Medium companies face lack of credit history (47%) which is the key obstacle to obtain financing.
Figure 27: Obstacles to loan financing reported by SMEs, 2012-2014
Poor credit
rating
Lack of ow
n capital
Insufficien
t collatera
l or guara
ntee
Insufficien
t or risky
project
Already too
many loans No loa
n history
Poor loan hi
story
No reson pr
ovided
Interest r
ates were t
oo high
Non-interes
t rate cond
itions (e.g.
maturity, co
llateral, le
gal aspec
ts )
0%
5%
10%
15%
20%
25%
SMEs
Source: conducted survey of SMEs; Q21: Over the last three years (2012, 2013, 2014), which were the reasons for being unsuccessful - or partially unsuccessful - in receiving loan financing? Base: all respondents that requested loan financing, all respondents, %
62
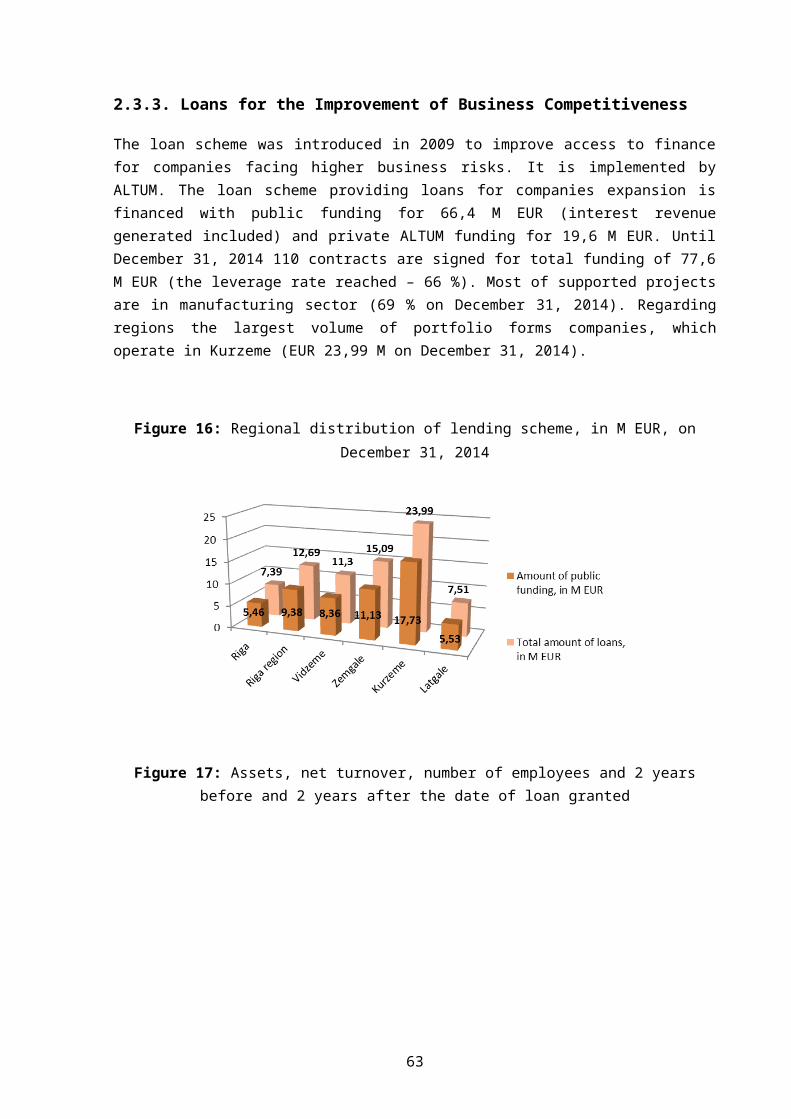
As illustrated in Figure 10 SMEs cannot obtain financing purely using company assets as collateral. Owner is required to pledge his personal assets to obtain the necessary funding, regardless of SME segment, thus suggesting that the entrepreneur is rarely limiting his risks to the extent of the investments in the limited liability company, but mostly is required to risk losing other personal assets in case of ill performance of the business, which is possibly indicating a market failure. Both small and medium companies significantly rely on public support, namely state guarantees, to obtain loan financing, while micro companies do not view guarantees as a notable source of collateral or do not have access to them, instead relying more significantly on family and friends’ assets as collateral (please see Figure 28 below).
Figure 28: Types of collaterals for loan financing of SMEs, 2012-2014
Source: conducted survey of SMEs; Q20: Over the last three years (2012, 2013, 2014), how did you guarantee your loan? Base: all respondents, %
Both micro and small companies use external funding to finance working capital and for acquiring machinery and equipment, while medium companies have more widespread needs where external funding is used: acquire machinery, equipment (26%), financing working capital (18%), launch a new product (17%), enter new markets (13%) (please see Figure 29 below).
63

Figure 29: Use of funding by SMEs, 2012-2014
Finan
cing w
orkin
g cap
ital
Acqu
ire m
achi
nery
/equ
ipm
ent
Laun
ch a
new
prod
uct /
serv
ice
Acqu
ire la
nd/b
uild
ing
Deve
lop i
nter
natio
nal a
ctiviti
es/e
nter
a ne
w m
arke
t (ge
ogra
phic
expa
nsio
n)
Finan
ce ex
port
sales
Finan
ce R&
D an
d inn
ovati
on
Ensu
re de
bt co
nsol
idati
on
Acqu
ire an
othe
r com
pany
0%5%
10%15%20%25%30%35%40%45%
MicroSmallMedium
Source: conducted survey of SMEs; Q16: What were the reasons / needs for the financing means you sought for in previous years (2012, 2013, 2014)? Base: all respondents, %
Debt instruments are seen as the primary preferred source of future funding for any segment of SMEs, followed by owner funding, and support from state authorities (please see Figure 13 below). Commercial banks and leasing companies are viewed increasingly as a preferred source of funding as the company matures. Micro companies seem to expect significant state support, as micro companies have indicated state authorities (e.g. subsidies) as the key preferred source of future funding, followed by owners’ funds and family and friends. Neither micro companies, nor later stage companies see private investors (BA, VC) and mezzanine funding as a significant source of funding.
64

Figure 30: Expected source of funding in future, 2014-2016
Owners, d
irecto
rs
Commercial
banks
State
authoriti
tes (subsid
ies)
Leasi
ng companies
Family
and frien
ds
Other fi
nancia
l insti
tutions
Other n
on-financial e
ntities
Ventu
re capita
l funds
Other
employe
es of th
e compan
y
Business
Angels
Mezzan
ine Financin
g0%
5%
10%
15%
20%
25%
30%
Micro Small Medium
Source: conducted survey of SMEs; Q37: From what different sources do you plan to secure your future funding over the NEXT three years (2014, 2015, 2016)? Base: all respondents, %
3.2.2. Estimating the market viable gap based on survey
When trying to identify a market viable gap, problems of a conceptual nature arise, as the potential/unrealised portion of the demand is not measurable until the supply materialises. Thus, GAFMA proposes to apply a practical approach to assess whether market viable gaps exist in particular markets. This approach consists of (1) a comparison of supply and potential demand (as far as possible) and (2) an analysis of SME finance market weaknesses and the possible application of Peer Group Analyses (PGAs).
In addition to the identification and, where possible, quantification of possible market viable gaps, there is qualitative information on SME finance market weaknesses presenting, primarily based on insights obtained through stakeholders and triangulated with other sources of information.
The PGA of Latvia to a peer group has been considered as an additional basis for the quantification of a possible market viable gap. It is difficult to determine the appropriate granularity of data required to be meaningful. Moreover, it is not enough only to have the data: understanding the drivers behind the data is important to enable change or improvement. These drivers can often cloud the issues, and makes getting value from cross-border PGA a difficult task.37 Given the limitations of comparable data availability for Latvia in combination with the limitations of the PGA approach as such, PGA approach is not conducted in its full form, however there are cross-country comparisons discussed across Baltics where data availability permits.
Below is a description of the main steps in assessing the market viable gap for SMEs in the Latvian economy. The estimation of the gap is based primarily on the results of the conducted SME survey
37 EIF, H., Kraemer-Eis, F.Lang. Guidelines for SME Access to Finance Market Assessments (GAFMA), Working Paper 2014/22, p.21
65

triangulating with conducted interviews, public sources, available statistics and prior researches, where available.
The key steps taken in assessing the forward looking market viable gap for the period 2016-2020 are:
1. Estimating the number of Latvian SMEs by segment in need for external financing to fund future growth;
2. Estimating the average external financing requirement per Latvian SME by SME segment of total demand for financial instruments in Latvian economy;
3. Estimating the average implied market viable gap per Latvian SME by segment for external financing in Latvia;
4. Estimating the market viable gap based on results of the conducted SME survey and allocating the results by financial instruments.
Additionally, sensitivity analysis was performed in order to illustrate the impact of key assumptions. The following key assumptions were tested in the sensitivity analysis:
- Share of viable companies in the Latvian economy,
- Distribution of SMEs segments in the Latvian economy.
Estimation of viable population of SMEs in Latvian economy
The number of companies in Latvia in 2016-2020 was estimated based on compound annual growth rate (CAGR) of number of companies during the period 1995-2014 (corresponding to the period of stabilized growth after regaining independence in 1991 till the latest available date).38 CAGR for the 1994-2014 period was calculated 3.9% and was used to estimate the number of companies in each SME size category in 2016-2020 assuming that the distribution by segment is to remain unchanged, resulting in an estimated average 194’787 companies during the period 2016-2020. Coincidently the implied annual growth in the number of companies is also in line with the forecast growth in GDP in the period 2016-2020.39
The estimated number of companies was further adjusted for the following factors:
1. Exclusion of non-SME companies. The estimated number of companies includes both SMEs and large companies. Therefore, the result was adjusted to exclude large companies.
Distribution of active companies operating in Latvia was based on Latvian Central Statistical Bureau data, according to which majority or registered companies are micro companies – 91% (please see Figure 31).
38 Commercial register, Number of active companies operating in Latvia between 1995 and 2014. Available on: http://www.ur.gov.lv/statistika.html?a=1080. Last visited on 1 September 2014 39 The Economist Intelligence Unit. Country forecast. Latvia, 2014, p.2
66

Figure 31: Distribution of the total population by SMEs categories, %
91%
7%1% 0%
Micro Small Medium Others
Source: Calculations based on CSB statistical data, CSB, SRG041. Ekonomiski aktīvās statistikas vienības sadalījumā pa lieluma grupām un statistiskajiem reģioniem. Available on: http://data.csb.gov.lv/pxweb/lv/uzreg/uzreg__ikgad__01_skaits/SR0041.px/?rxid=cdcb978c-22b0-416a-aacc-aa650d3e2ce0. Last visited on 1 September 2014
As the aim of the study to identify market viable gap for SMEs companies, total population of companies that is analysed should not include large companies, thus the estimated number of SMEs totals 194’273 companies.
2. Exclusion of non-active SMEs
Given that a significant part of micro-enterprises do not perform any economic activity (likumi.lv, 2009),40 it was assumed that only 50% of the total micro-enterprises are active, and thus the total population of micro-companies has been adjusted accordingly for further calculations.
3. Exclusion of non-viable companies
The full potential demand will often not be met by supply because a portion of it is not bankable/eligible/viable. The mere fact that companies have difficulties to find access to finance per se does not immediately mean that there is a market failure or that government intervention is needed.41 Though there is no single indicator that can reliably determine which companies or projects are viable and which are not, the EIF suggests one of the proxies to be the share of SMEs exhibiting positive turnover growth.42
While national statistics do not provide such breakdown of companies by their growth rate, the conducted survey results were used as an indication.
Respondents of survey on SMEs were requested to provide answers to the question below allowing to determine companies’ growth rates. “Please provide us with the financial information regarding your business for the last three years”. Companies were required to submit information on their revenues for the last three years.
40 Likumi.lv, Par Koncepciju par mikrouzņēmumu atbalsta pasākumiem. Available on: http://likumi.lv/doc.php?id=200709. Last visited on 3 September 2014.41 EIF, H. Kraemer-Eis, F. Lang. Guidelines for SME Access to Finance Market Assessments (GAFMA), Working Paper 2014/22, p. 1142 EIF, H.Kraemer-Eis, F.Lang. Guidelines for SME Access to Finance Market Assessments (GAFMA), Working Paper 2014/22, p. 50
67

The respondents not exhibiting positive annual growth for at least two years were excluded from the sample (a range of gap was determined based on varying this assumption: positive growth in the two past consecutive years and any one year of the past three years).
Further, respondents were required to provide information on the reasons for financing driving them over the last three years. Respondents were asked: “What were the reasons / needs for the financing means you sought over the last three years (this year, last year and two years ago)?” If an SME responds that the required funding is not for the purpose of financing growth, then it is not unreasonable to assume that such SMEs are non-viable for the purpose of the market viable gap assessment. Therefore, companies that have indicated that the financing is needed to ensure debt consolidation were rejected from further analysis as unviable.
The share of viable companies resulting after all aforementioned adjustments results in 17 to 31% from the total population depending on the requirement applied for exhibited growth (two subsequent years or in at least one year). Obtained shares of total population were applied to the estimated total average population of SMEs in Latvian economy for period 2016-2020 (please see Table 11).
Table 11: Estimation of viable companies in Latvian economy
Estimated average number of active companies in Latvian economy in 2016-2020
194’787
Micro Small Medium
Share of SMEs size category in total population 91% 7% 1%
Estimated average number of active companies in Latvian economy in 2016-2020 per SMEs size category
178,191 13,409 2,673
Number of non-viable companies excluded from the total population 163,167-150,704 11,148-9,272 2,223-1,849
Number of viable companies in Latvian economy 15,024-27,486 2,261-4,137 451-825
Source: Calculations based on CSB statistical data and conducted survey of SMEs
Estimations of viable companies in Latvian economy resulted in total population of SMEs equal to 17,736-32,448 companies (15,024-27,486 micro companies, 2,261-4,137 small companies, 451-825 medium companies).
Estimation of total market viable gap for financial instruments in Latvian economy
As the next step, average amount of external financing per SMEs segment was estimated. Estimations were based on the results of the conducted SME survey. Respondents were requested to give estimates on their demand for financing in 2012-2014 period by answering the following question: “How much of loan and equity funding did you seek during the last three years in Euro?” In three year period SMEs were seeking EUR 33 m. The SMEs also responded about the expected future financing needs. However, the results were 130% higher than the SMEs had sought in the past years, which contradicts the fact that stable growth is expected to continue in the future. Therefore, the
68

answers about actual financing sought were considered as more reliable and assumed to be the same as for future funding needs.
Table 12: Average demand per SME for financial instruments in 2012-2014 period based on the sample data, EUR
Average demand in 2012-2014 period for each SMEs size
category, EUR t
Micro companies 49
Small companies 604
Medium companies 1,259
Source: Calculations based on conducted survey of SMEs; Q13: How much of loan and equity funding did you seek during the last three years in Euro? Base: all respondents, %
Estimating the average implied market viable gap per Latvian SME by segment for external financing in Latvia required to estimate average supply. Respondents provided information on actual financing provided in the 2012-2014 period by answering the following question: “How much of loan and equity funding did you obtain during the last three years (this year, last year and two years ago) in Euro?” In three year period SMEs obtained EUR 21 m (please see Table 13).
Table 13: Average actual financing provided per SME in 2012-2014 period based on the sample data, EUR
Average supply in 2012-2014 period available for each SMEs size category,
EUR t
Micro companies 34
Small companies 303
Medium companies 1,013
Source: Calculations based on conducted survey of SMEs; Q14: How much of loan and equity funding did you obtain during the last three years (this year, last year and two years ago) in Euro? Base: all respondents, %
The average implied market viable gap per SME is the difference between the average estimated demand and average actual provided funding per SME. Therefore the resulting gap was multiplied by the estimated number of SMEs by segment.
Table 14: Estimated total market viable gap for financial instruments for 2016-2020 period for Latvian economy, EUR
Average market viable gap per company, EUR t
Market viable gap for all financial instruments in 2016-
2020 period, EUR m
Micro 15 224-410
Small 301 681-1,246
Medium 246 111-203
Total 1,017-1,859
69
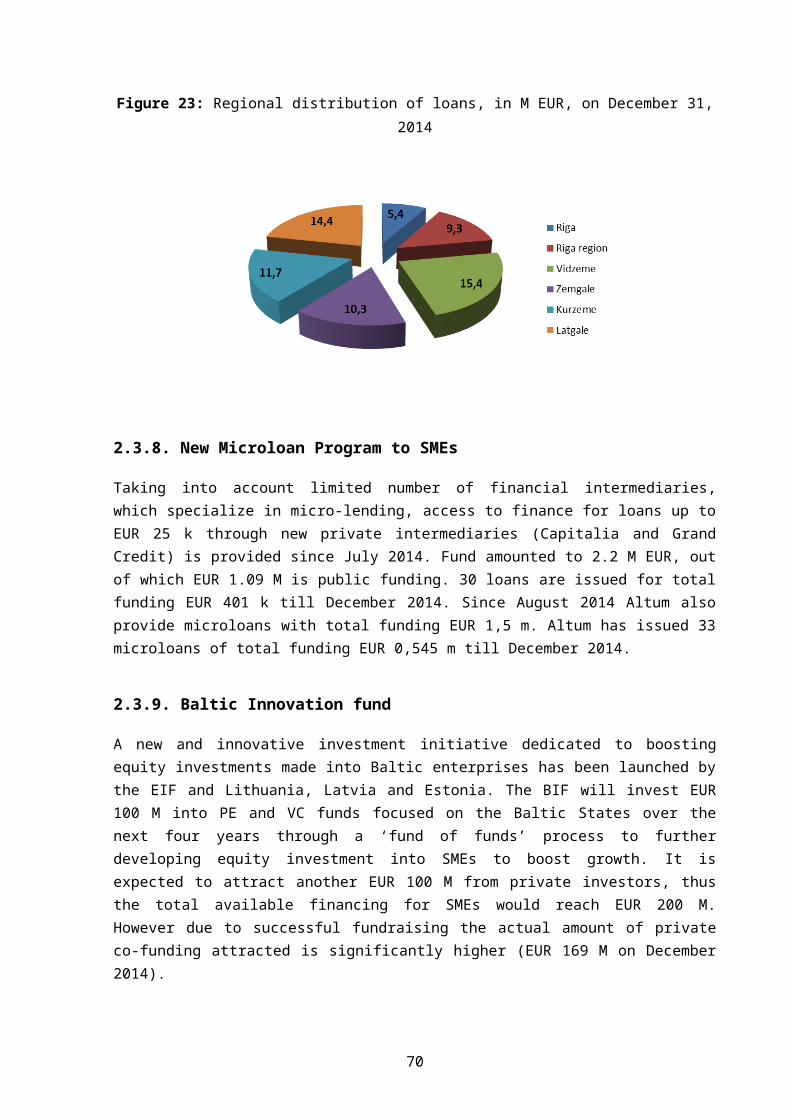
Estimated total market viable gap for financial instruments in the Latvian economy for 2016-2020 totals EUR 1,017-1,859 m.
Allocation of estimated market viable gap between the financial instruments
The estimated total market viable gap was further allocated by financial instruments. The distribution of expressed demand by financial instruments for the following three years based on the survey was used as a proxy for allocating the market viable gap by financial instruments.
Respondents were asked to give their estimates on the volume of financing that they envisage to request during three following years: “What volume of each of the following financing sources do you envisage to ask for during each of the next three years in Euro?” Responses were used a proxy for interest in each financial instrument (please see Table 15 below).
Quality of the sample limited accuracy of the allocation. Insufficiency of responses did not allow to estimate the market viable gap for each individual instrument, therefore certain instruments were analysed as one aggregate group. More detailed allocation of market viable gap for instruments is further analysed separately for each instrument, where other publicly available information and stakeholders’ interviews were taken into account.
Table 15: Distribution of interest in financial instruments
Micro Small Medium
Short-term loans, on demand 6% 18% 12%
Medium and long-term loans 38% 23% 8%
Leasing 10% 4% 6%
Factoring 4% 9% 30%
Credit and export credit guarantees 0% 14% 17%
Advanced payments from the customers 12% 2% 8%
Mezzanine 0% 0% 0%
Micro-financing 1% 0% 0%
Venture capital1 29% 31% 19%
Total 100% 100% 100%
(1)Note: Venture capital includes also Growth capital, Business Angels, Transfer of Technologies, Rescue/turnaround and replacement capitalSource: Calculations based on conducted survey of SMEs; Q35: What volume of each of the following financing sources do you envisage to ask for during each of the next three years (2014, 2015, 2016)? Base: all respondents, %
Allocation of total market viable gap for financial institutions is presented in Table 9 with majority of the market viable gap observed in debt instruments. Results presented in Table 9 considerably deviate from actual absorption of financial instruments in the market.
70

Table 16: Allocation of the estimated viable market viable gap for 2016-2020 period by financial instruments, EUR m
Micro, EUR m Small, EUR m Medium, EUR m Total SMEs, EUR m
Short-term loans, on demand 13-23 122-223 13-24 148-270
Medium and long-term loans 85-156 156-285 9-16 234-427
Leasing 23-42 25-46 7-12 55-101
Factoring 10-18 64-118 33-60 107-196
Credit and export credit guarantees 0.6-1 95-175 19-35 115-211
Advanced payments from the customers 27-49 10-19 9-16 46-84
Micro-financing 1-2 1-2
Venture capital1 65-118 208-381 21-38 294-538
Debt instruments 159-292 473-865 90-165 706-1,292
Equity instruments 65-118 209-381 21-38 294-538
Total 224-410 681-1,246 111-203 1,000-1,830(1)Note: Venture capital includes also Growth capital, Business Angels, Transfer of Technologies, Rescue/turnaround and replacement capitalSource: Calculations based on conducted survey of SMEs
3.2.3. Macroeconomic indicators
According to the Economist Intelligence Unit, the investment and domestic consumption in Latvia in the next several years is going to strengthen with a positive impact on the GDP growth in 2014-2018 period (see Figure 32 below).
Figure 32: GDP growth forecasts 2014-2018, %
2014 2015 2016 2017 20180.0
0.5
1.0
1.5
2.0
2.5
3.0
3.5
4.0
4.5
5.0
World Euro area Latvia
%
Source: The Economist Intelligence Unit. Country forecast. Latvia, 2014, p.2
Latvian GDP growth rate is expected to exceed both Europe and world level of GDP growth in the period forecast by Economist Intelligence Unit – 2014-2018.43 Ministry of Finance forecasts GDP to
43 The Economist Intelligence Unit. Country forecast. Latvia, 2014, p.2
71

grow on average by 4.0% during 2013-2016,44 which is in line with forecasts by the Economist Intelligence Unit.
A gradual increase in lending rates is expected during 2014-2018 (please see Figure 16 below). Daiga Auziņa-Melalksne and Maija Orbidane representing RIGA OMX NASDAQ highlighted that Scandinavian banks operating in Latvian provide credit at affordable and low rates, at times lower than available for businesses in Sweden.45 The view of attractive credit rates in the market is echoed by Karlis Danevics representing Latvian Commercial Bank Association.46
Figure 33: Forecasts of lending rate on Latvian market (2014-2018), %
2014 2015 2016 2017 20180.0
1.0
2.0
3.0
4.0
5.0
6.0
7.0
8.0
9.0
%
Source: The Economist Intelligence Unit. Country forecast. Latvia, 2014, p. 13
Figure 34: Total loans outstanding (% of GDP), as at October 2012
CY LU MT ES PT NL IE DK IT SI AT EL SE BG FR EE DE FI LV BE UK HU LT CZ SK RO PL0%
20%
40%
60%
80%
100%
120%
140%
160%
15
0%
11
7%
83
%
77
%
65
%
63
%
60
%
56
%
56
%
55
%
54
%
53
%
52
%
45
%
43
%
36
%
35
%
35
%
35
%
30
%
28
%
25
%
25
%
22
%
22
%
20
%
17
%
Tota
l lo
an v
olu
me
% o
f GD
P
Source: European Commission, Loans. Available on: http://ec.europa.eu/enterprise/policies/finance/data/enterprise-finance-index/access-to-finance-indicators/loans/index_en.htm. Last visited on September 14, 2014
Outstanding loans to the companies operating in Latvia as a percentage of GDP at 35% is by 10% higher than in Lithuania, however is at the same level with Estonia and Finland (please see Figure 34).
44 Latvijas Republikas Finanšu Ministrija, Finanšu Ministrija palielina IKP izaugmes prognozes. Available on: http://www.fm.gov.lv/lv/aktualitates/jaunumi/makroekonomika/46730-finansu-ministrija-palielina-ikp-izaugsmes-prognozes. Last visited on 19 September 2014.45 Interview with Daiga Auziņa-Melalksne, Maija Orbidāne, RIGA OMX NASDAQ, 10 September 201446 Interview with Karlis Danevics, SEB bank, 24 September 2014
72

3.3. Financing Eco-System
While the other sections of the market viable gap analysis evaluate the existence of market viable gap by particular instruments of financing, the overall socio-economic environment needs to be evaluated, as it impacts the likeliness and efficiency of supply meeting demand.
Development of functioning eco-system requires cooperation and linkage between these institutions and SMEs. Apart from perception of the investors, there is need for existence of a well-developed infrastructure for developing connections between the entrepreneurs and investors (e.g. incubators, business angel networks, accelerators). These stakeholders facilitate innovation and entrepreneurship and may be represented by large businesses or policy-makers and educational institutions.47
Overall, Latvian market offers to SMEs regional and Riga centred incubators, several business angel networks (i.e. LATBAN, CONNECT), and there are plans to establish a new crowd-funding platform backed by the incumbent telecom operator Lattelecom.48
According to the Global Competitiveness Report, Latvia holds the 42nd place in the 2014-2015 index (an improvement from 64th place in the 2011-2012 index). The main weak factors identified are institutions, innovation, business sophistication and market size (please see Figure 35 below). The report also highlights areas that require improvement for doing business in Latvia, namely the top three being inefficient government bureaucracy, tax regulation and access to financing.49
Figure 35: Stage of development of Latvian economy, as at 2014
InstitutionsInfrustructure
Macroeconomic environment
Health and primary education
Higher education and training
Goods market efficiencyLabor market efficiency
Financial market development
Technological readiness
Market size
Business sophistication
Innovation
0
5
10
LatviaAdvanced economies
Source: Klaus Schwab. The Global Competitiveness Report 2014-2015.World Economic Forum, 2014, p.242
47 Karen E. Wilson, Filipe Silva. Policies for Seed and Early Stage Finance, OECD, 2013, p.49-5048 Communication with Karen E. Wilson, 12 September 201449 Klaus Schwab. The Global Competitiveness Report 2014-2015. World Economic Forum, 2014, p.242
73

DoingBusiness review in 2014 has placed Latvia 57th (an improvement from 59th place in 2013)50 in terms of easiness of establishment of business, taking into account such factors as procedures, time required, paid in minimal capital and costs51 (in comparison Estonia holds 61st, Lithuania holds 11th place).
If considering attractiveness as perceived by venture capital and private equity investors, Latvia has shown a significant improvement from 81st place in 2010 to 55th place in 2014 (Lithuania 43rd, Estonia 51st in 2014). Investors to a degree rely on such ratings when making a decision to enter in a new market.52
In terms of ease of resolving insolvency, Latvia leads all three Baltic States by holding the 43rd place out of 189.53 However, when viewing more generally the legal framework in settling disputes is weak and is a prohibiting factor for SMEs to obtain financing.54 According to The Global Competitiveness Report for 2014-2015, Latvia holds the 116th place in the country ranking for efficiency of legal framework in settling disputes (117th in 2013-2014 rating, and behind Russia – 109th). In comparison, Lithuania holds the 84th (significant improvement from 96th place in 2013-2014) and Estonia 39th place (no change compared to 2013-2014).55
Eco-system related market failures
Stakeholders’ interviews have revealed that there are several market failures that are eco-system related:
1. SMEs are insufficiently informed about the availability of various financing instruments, especially for micro companies and early stage.56 Even if they are informed, there is insufficient understanding what financial instruments are suitable in what circumstances.57
2. When having received equity financing, early stage entrepreneurs are rarely serial-entrepreneurs and lack understanding of good governance principles or simply the understanding about the roles of each stakeholder, which investors see as an important prerequisite for building the often weak level of trust.58
3. Start-up entrepreneurs and micro company entrepreneurs often lack general financing education that makes it difficult for financing providers to evaluate the target business, and also to be able to track its progress.59
50 World Bank Group, Ease of Doing Business in Latvia. Available on: http://www.doingbusiness.org/data/exploreeconomies/latvia/. Last visited on October 12, 201451 Doing Business. Doing Business 2014 Economy Profile: Latvia. World Bank Group, 2014, p.1052 IESE Business School, The Venture Capital & Private Equity Country Attractiveness Index. Available on: http://blog.iese.edu/vcpeindex/latvia/. Last visited on October 12, 201453 World Bank Group, Ease of Doing Business in Latvia. Available on: http://www.doingbusiness.org/data/exploreeconomies/latvia/. Last visited on October 12, 201454 Interview with Karlis Danevics, SEB bank, 24 September 201455 Klaus Schwab. The Global Competitiveness Report 2013-2014. World Economic Forum, 2013, p. 18156 Interview with Juris Grišins. Capitalia, 11 September 2014, interview with Edgars Pigoznis, LVCA, 9 September 2014, interview with Janis Butkevics, LTRK, 6 October 201457 Interview with Klavs Vasks, LGA 9 October 2014, interview with Vadims Frolovs, Dace Kalnciema, Aivars Rupeiks and Ilze Kukute, Swedbank 29 September 2014, interview with Juris Birznieks, LatBan, 9 September 201458 Interview with Klavs Vasks, LGA 9 October 2014, interview with Edgars Pigoznis, LVCA, 9 September 2014
74

4. Early stage investors often want to see that the team is passionate about the idea. 60 Besides technical expertise start-up founders perhaps more importantly need to be inspired from success stories in Latvia and also abroad. Co-working spaces and accelerators are an excellent environment to facilitate the sharing of experiences,61 which is much needed to overcome the fear to fail. (According to the GEM survey in 2013 42% of respondents have a fear to fail – a slight increase from 37% in 2012).62, 63
The legal framework in settling disputes is weak and is a prohibiting factor for SMEs to obtain financing.64, 65
59 Interview with Vadims Frolovs, Dace Kalnciema, Aivars Rupeiks and Ilze Kukute, Swedbank 29 September 2014, interview with Juris Birznieks, LatBan, 9 September 201460 Interview with Juris Birznieks, LatBan, 9 September 201461 Interview with Andris K.Bērziņš, Tech Hub Riga, 26 August 201462 J.E.Amoros, N.Bosma. Global Entrepreneurship Monitor 2013 Global Report: Fifteen years of assessing entrepreneurship across the Globe. GEM, 2014, p.2763 S.R.Xavier, D.Kelley et al. Global Entrepreneurship Monitor 2012 Global Report. GEM, 2013, p.2064 World Bank Group, Ease of Doing Business in Latvia. Available on: http://www.doingbusiness.org/data/exploreeconomies/latvia/. Last visited on October 12, 201465 Interview with Karlis Danevics, SEB bank, 24 September 2014
75

3.4. Microfinance
Microfinance is the provision of microcredit up to EUR 25 thousand aimed to stimulate economic growth and encourage financing to those who would not otherwise have such an opportunity. Microfinance is a tool to overcome inaccessibility of financing to entrepreneurs. Following market failures in microlending are identified across the EU: (1) high handling (or operational) costs for credit institutions; (2) lack of sufficient collateral from the micro-enterprises; and (3) high risks: microcredit is considered a risky business by finance providers.66 Entrepreneurs with no track record, collateral or established banking relationships pose a serious risk management challenge to banks. This is even heightened by inability of banks or excessive costs associated to perform due diligence for such applicants.67 Thus it is generally admitted that microcredits affect financing channel for job creation and social inclusion.68
In general terms microfinance may be divided in two main groups – social inclusion lending and lending to micro companies. Where lending to micro companies is fully targeted to businesses (rather than market of social inclusion) lending is divided into private individuals and businesses (please see Figure 36 below).
Figure 36: Classification of microfinance operational models
Source: European Commission. Ex-ante assessment methodology for financial instruments in the 2014-2020 programming period, Volume 3, 2014, p.75
The level of social inclusion lending targeted at businesses can be influenced by various factors, such as level of people at risk of poverty or social exclusion, long-term unemployment rate, feasibility of self-employed, etc.69
As per Eurostat the EU average level of people at risk of poverty or social exclusion in 2012 was 25% (please see Figure 37 below), while 36.2% in Latvia, a level that is higher than neighbouring countries
66 European Commission, Report on Microcredit for small businesses and business creation:bridging a market gap, 2007, p.10-1167 European Commission. Ex-ante assessment methodology for financial instruments in the 2014-2020 programming period, Volume 3, 2014, p.66.68 European Investment Fund, European Small Business Finance Outlook, 2013, p.61. 69 European Commission. Ex-ante assessment methodology for financial instruments in the 2014-2020 programming period, Volume 3, 2014. p.75
76
Business lending Business lendingPersonal lending
Micro-enterprise lendingSocial inclusion lending
Microcredit

or CEE average.70 Higher poverty risk is only in Bulgaria and Romania with 50% and 42% of the population being at risk of poverty, respectively.
Figure 37: People at risk of poverty or social exclusion in 2012, %
Bulgar
ia
Roman
ia
Latv
ia
Greec
e
Lith
uania
Hungary
Croati
a
Irela
ndIta
ly
Spai
n
Cyprus
Poland
Portuga
l
United K
ingd
om
Esto
nia
Mal
ta
Belgi
um
Slova
kia
Germ
any
Slove
nia
Fran
ce
Denm
ark
Austria
Luxe
mbourg
Switz
erla
nd
Finla
nd
Swed
en
Czech
Rep
ublic
Nether
lands
Norway
Icel
and
0
10
20
30
40
50
60
%
Source: Eurostat, People at risk of poverty or social exclusion Available on: http://epp.eurostat.ec.europa.eu/tgm/graph.do?tab=graph&plugin=0&pcode=tsdsc100&language=en&toolbox=data. Last visited on September 9, 2014.
Eurostat estimates that ca 700 thousand people were at risk of poverty in Latvia as of 2012. In EU 28 this number exceeds 120 m in total in the same period.71
Availability of microfinance is one of prerequisites for new job creation.72 Thus willingness of the population to be self-employed is one of the indicators to represent hidden potential of the markets. A survey conducted by Eurobarometer states that 30% of EU population consider that it would be feasible for them to become self-employed,73 while 51% would consider it feasible in Latvia.74 The percentage for Latvia is relatively higher than the EU average and shows growth in comparison to 2009.
70 Eurostat, People at risk of poverty or social exclusion. Available on: http://epp.eurostat.ec.europa.eu/tgm/graph.do?tab=graph&plugin=0&pcode=tsdsc100&language=en&toolbox=data. Last visited on 9 September 2014.71 Eurostat, People at risk of poverty or social exclusion. Available on: http://epp.eurostat.ec.europa.eu/tgm/graph.do?tab=graph&plugin=0&pcode=tsdsc100&language=en&toolbox=data. Last visited on 9 September 2014.72 European microfinance network, Overview of the microcredit sector in the European Union 2010-11, 2012, p.573 European Commission, Entrepreneurship in the EU and beyond. 2012, p.1974 European Commission. Entrepreneurship: Country report for Latvia, Flash Eurobarometer, 2012, p.5.
77

Figure 38: Feasibility of self-employment in Latvian in 2012, %
10%
20%
22%
45%
3%
15%
36%
24%
22%
3%
Very feasibleFairly feasibleNot very feasibleNot feasible at allDon't know
Source: European Commission. Country report for Latvia, 2012, Flash Eurobarometer, p.5.
3.4.1. Supply
Predominantly the most visible microfinance providers focus on private individuals,75 instead of enterprises. Technically, enterprises could obtain loans from microfinance providers targeting private individuals, however the limiting factor is the maximum amount limit (typically up to EUR 400,76 and in some instances up to 1,50077), but more notably the substantial interest rate (on average 330% annualized interest rate in Latvia78), thus limiting demand being satisfied. Please see below the overview of key market participants providing microfinance to SMEs (most are supported by public financing). Credit unions could be potential financial intermediaries for micro lending, as information asymmetry is considerably lower between enterprises and a lender as an entreprise is the member of the credit union. To introduce credit unions into microlending legislation should be amended.79
Table 17: Supply of microfinance for SMEs on Latvian market
Supported by Program Planned amount, EUR m
Availability
ALTUM80 Support for micro companies (up to 10 employees) and entrepreneurs that will register a new company within 2 month
Up to EUR 7 m Program deadline is July 2015.
75 Diena, Ātrie kredīti - jau daudzmiljonu nozare, ko finanšu tirgus radars neuzrauga. Available on: http://www.diena.lv/latvija/zinas/atrie-krediti-jau-daudzmiljonu-nozare-ko-finansu-tirgus-radars-neuzrauga-13962321. Last visited on 26 September 2014.76 smscredit.lv. Available on: https://www.smscredit.lv. Last visited on 26 September 2014.77 vivus.lv. Available on: https://www.vivus.lv. Last visited on 26 September 2014.78 moneyguru24.com, Payday loan interest rates in Europe. Available on: http://www.moneyguru24.com/Content/Themes/Images/blog/EuropeLoansAPR.jpg. Last visited on 26 September 2014.79 Currently Law on credit unions prohibits credit unions to lend to SMEs, with exception to sole traders.80 ALTUM, Mikrokreditēšanas programma. Available on: http://www.hipo.lv/lv/attistibas_programmas/mikrokreditesanas_programma. Last visited on 10 September 2014.
78

Supported by Program Planned amount, EUR m
Availability
after the funds are granted.Amount: up to EUR 14 tInterest: between 5% to 8% per annumMaturity: 5 yearsCollateral: shareholders personal guarantee, assets
ALTUM81 Amount: up to EUR 25 tMaturity: 7 yearsInterest: from 7% per annumCollateral: shareholders personal guarantee, assets
Up to EUR 3,5 m Program deadline is October 2015
Grand Credit82 Provides micro-financing based on hard collateral. Collaborates with Latvian Guarantee agency (LGA) to provide microloans at reduced interest rates (50% reduced interest rate)Amount: up to EUR 25 tMaturity: 3 months to 10 yearsInterest: from 6.5% per annumCollateral: real estate
Up to EUR 3m83 Program deadline is November 2015
CAPITALIA84 Provides micro-financing to SMEs. Collaborates with LGA to provide microloans at reduced interest rates (50% reduced interest rate)Focus on existing companies with at least 6 months of operating historyAmount: up to EUR 25 tMaturity: from 6 to 36 monthsInterest: ca 20% per annum85
Collateral: assets, personal guarantee
SWEDBANK86 Targeting enterprises requiring small investments (e.g. used car), for which processing leasing formalities becomes an excessive burden87
Amount: EUR 1-5 t
n/a (dependent on popularity)
Launched in 2014
81 ALTUM, MVU Mikrokreditēšanas programma. Available on: http://www.hipo.lv/lv/attistibas_programmas/mvu_mikrokreditesanas_programma. Last visited on 10 September 2014.82 Grand Credit, Kredīts Uzņēmumiem. Available on: http://www.grandcredit.lv/?pageid=7&sub=10. Last visited on 10 September 2014.83 Likumi.lv. Ministru kabineta noteikumi Nr.327 “Noteikumi par mikroaizdevumiem saimnieciskās darbības veicēju konkurētspējas uzlabošanai”. Available on: http://likumi.lv/doc.php?id=257784#p1&pd=1. Last visited on 10 September 2014.84 CAPITALIA, Mikrokredīts. Available on: http://www.capitalia.lv/lv/finansejums/mikrokredits. Last visited on 10 September 2014.85 Interview with Juris Grišins. Capitalia, 11 September 201486 Swedbank, Aizdevums auto iegādei. Available on: https://ib.swedbank.lv/business/finance/leasing/car?language=LAT. Last visited on 10 September 2014.87 Interview with Harijs Švarcs, Swedbank, 9 September 2014 and interview with Vadims Frolovs, Dace Kalnciema, Aivars Rupeiks and Ilze Kukute, Swedbank, 29 September 2014
79

Supported by Program Planned amount, EUR m
Availability
Collateral: personal guaranteeInterest rate: 20% per annum
Capitalia, and Grand Credit are two intermediaries that have recently (in 2014) been supported with public funding by LGA to provide more accessible microfinance to SMEs. Simultaneously, the MA in the form of Altum is providing microfinance directly to SMEs, thus competing with the supported intermediaries.
As at September 2014 ALTUM microfinance programs have supported 1382 projects totalling ca EUR 10 m (since 2009) with an average microloan amount EUR 7 t.88 Average microloan funding provided by CAPITALIA in first two quarters of 2014 was ca EUR 10 t,89 with 2 out of 3 microloans provided to SMEs under the LGA support program.90
Altum, a public institution, is managing a micro financing programme. Capitalia and Grand Credit also provide microfinance as publicly supported financial intermediaries, thus suggesting that the private intermediaries supported by the Managing Authority are in direct competition with the micro financing programme provided directly by the Managing Authority. Such situation can adversely affect the private intermediaries to develop and become more self-sustainable if public intermediary has more advantageous terms than private entity.
3.4.2. Demand
Demand from existing companies
Microfinance focus is on micro companies,91 thus this chapter gap analysis focuses solely on micro companies segment. This is echoed also in the conducted SME survey, where solely micro companies have expressed interest in microfinance. The demand for microloans from the survey analysis resulted in an estimated demand by existing companies of EUR 2-5 m in 2016-2020, which is conservative estimate as within micro-lending programme in 2013 loans of total funding of EUR 2,3 m were provided.
Demand for microfinance was estimated based on implied result of the conducted SME survey and allocated by instrument types, among them microfinance.
Average demand per company is assumed to remain stable in the upcoming years (as confirmed is the expectation of CAPITALIA92), and is only adjusted by expected inflation. The number of microfinance companies is assumed to grow at the average pace as in the last several years, which is considered not unreasonable given the anticipated stable GDP growth in the upcoming years.
88 ALTUM, Mikrokredīti. Available on: http://www.atbalstaprogrammas.lv/mikrokrediti.php. Last visited on 13 September 2014. 89 Capitalia, presentation to the Ministry of Economics, 201490 Capitalia, presentation to the Ministry of Economics, 201491 European Commission. Ex-ante assessment methodology for financial instruments in the 2014-2020 programming period, Volume 3, 2014. p.25 92 Interview with Juris Grišins. Capitalia, 11 September 2014
80

The amount of demand allocated to microfinance was estimated based on the answers to survey question “What volumes of each of the financial instruments do you envisage to ask for during the next three years”.
Table 18: Calculation of demand for micro crediting in Latvia (2016-2020), EUR
Steps EUR m
1 Total demand for all financing instruments in Latvia 2,663 – 4,872
2 Share of SMEs interested in micro-financing based on SME survey 0.60%
3 Demand for micro-financing 4 - 8
Source: Calculation based on conducted survey of SMEs; and stakeholder interviews
Demand – social inclusion lending
The survey recipients were existing SMEs, therefore the result does not address the social inclusion lending aspect. Estimation of the social inclusion potential demand was based on the following steps:93
1. Identify the population at risk of poverty out of the economically active population;
2. Estimate the number of potential business creators;
3. Estimate the potential financing need.
93 European Commission. Ex-ante assessment methodology for financial instruments in the 2014-2020 programming period, Volume 3, 2014, p.72
81

Table 19: Calculation of demand of social inclusion lending in Latvia (2016-2020), EUR
Factor Result
Population regarded as at risk of poverty in 25-64 age group
353,805 people94 (36% of total population)95
Share of Latvian population that would prefer to be self-employment
49%96
Share of Latvian population for whom it would be feasible to become self-employed within the next five years
15% (from 49% of Latvian population who would prefer to be self-employed)
Average microfinance loan in Latvia, EUR t In range between 6-797
Potential demand for social inclusion lending focused on businesses, EUR m
162-182
Source: Calculation based on CSB and Eurostat statistical data
Total demand for microfinance in Latvia for 2016-2020 combining demand from existing enterprises, as well as social inclusion related potential demand is estimated in the range between EUR 166-190 m.
The estimated demand should take into account the viability of business factor, which would likely result in a lower viable demand than the aforementioned. However, given the lack of reliable indicator of viability, no additional adjustment has been made to the aforementioned result.
3.4.3. Findings / market failure of microfinance
Microfinance market failures
1. High handling (or operational) costs for credit institutions.
The handling costs for the microcredit provider are high if compared to the small size of loans. The handling costs for the lender depends mainly on four aspects:
- support to the preparation of an enterprise loan application, reflecting the level of “investment readiness” of the borrower;
- internal process to secure the credit deal, including the assessment and approval costs, identification of collateral as well as back office costs;
- internal loan monitoring, including late payment and default procedures;94CSB, Patstāvīgo iedzīvotāju skaits un vecuma struktūra gada sākumā (pa 5 gadu vecuma grupām). Available on: http://data.csb.gov.lv/pxweb/lv/Sociala/Sociala__ikgad__iedz__iedzskaits/IS0022.px/?rxid=cdcb978c-22b0-416a-aacc-aa650d3e2ce0. Last visited on 13 September 2014.95 Eurostat, People at risk of poverty or social exclusion by age group. Available at: http://epp.eurostat.ec.europa.eu/statistics_explained/index.php/File:People_at_risk_of_poverty_or_social_exclusion_by_age_group,_2012.png. Last visited on 13 September 2014.96 European Commission. Entrepreneurship: Country report for Latvia. Flash Eurobarometer, 2012, p. 2. 97 Estimation of average microfinance loan in Latvia is based on two sources: (1) survey analysis where average volume of microloan was established from total demand for the micro financing and number of applicants; and (2) information presented by one of the stakeholders ALTUM that is active in provision of microfinance to SMEs. (ALTUM, Mikrokredītu programma. Available on: http://www.atbalstaprogrammas.lv/mikrokrediti.php. Last visited on 13 September 2014).
82

- non-financial business support and mentoring, which is the largest single operating cost in certain cases.
2. Lack of sufficient collateral.
3. High risk: microcredit is considered a risky business by finance providers hence financing costs of microloans are significantly above those available to larger enterprises;
4. Micro companies unaware of micro financing as a viable option.
While there is notable demand in the market, as suggested by the calculations above, as well as interview with CAPITALIA representative, there is lack of knowledge, awareness about available microfinance options as an alternative to the later stage focussed bank lending,98 thus resulting in unmet demand and suggesting the need to invest in educational activities.
5. Competition between public and private sectors.
Altum, a public institution, is managing a micro financing programme. Capitalia and Grand Credit also provide microfinance in Latvia as publicly supported financial intermediaries. It is important that private intermediaries have identical implementation terms for the micro financing programmes public entity.
3.4.4. Market viable gap
The microfinance demand is estimated at EUR 163-184 m, while the supply seems to be significantly lower (EUR 10 m99), resulting in an implied market viable gap. Having relied on responses to the SME survey, as well as stakeholder interviews, the estimated viable market viable gap for microfinance for 2016-2020 is summarized below in Table 20.
Table 20: Market viable gap for microfinance in Latvia, 2016-2020 by SME segment
Micro, Small Medium
Unborn compa-
nies
Pre-seed Seed Start-up Emerging growth/ Expansion
Companies that did not apply, EUR m 162 – 182
Companies that have applied but did not obtain, EUR m 1-2100
Total, EUR m 163 - 184Source: Calculations based on conducted survey of SMEs and CSB and Eurostat statistical data
98 Interview with Juris Grišins. Capitalia, 11 September 201499 Based on information given by one of stakeholders as intermediate volumes of issued microloans to SMEs. As a matter of fact issued volumes are partially stimulated by state aid (micro financing stimulation programs) what might indicate the total supply is even less. 100 Calculation based on survey analysis and stakeholder interviews
83

There is microfinance supply focusing on private individuals, but the excessive annual interest rate of 330% offered by such providers is a prohibiting factor. As illustrated by Juris Grisins, a third of the accepted applications for micro-financing at 40% annual interest rate (before Capitalia received public support from LGA) refused to take the financing due to the interest rate being too high.
Therefore, lower interest rate can be regarded as a key preferential condition of microfinance for Latvian micro companies that are required for satisfying the demand for financing from micro companies in Latvia. Whether 20% per annum is an optimal level is yet to be verified when the recently launched programs can demonstrate insights based on loan application statistics over a period of time.
Available supply on the market is merely focused on micro companies with existing cash flow history. Potential business creators are left outside of the microfinance and constitute significant part of unsatisfied demand.
3.4.5. Lessons learned
As per Altum, the programs aimed to support SMEs lacking liquidity during the economic crisis period had a significantly positive impact providing financing to more than 1,200 companies.101
Altum, a public institution, is providing microfinance at terms that seem to be significantly more attractive than private institutions can offer (either supported with public financing or not).
Commercial banks have not been active in marketing and issuing microloans to a large extent due to the administrative burden. Karlis Danevics on behalf of SEB and The Association of Commercial Banks of Latvia also acknowledges that loans below EUR 50 thousand are generally not considered as commercially viable to evaluate due to high costs related to the administration and processing the loan.102
Altum as a public institution, and Capitalia and Grand Credit as private institutions are managing a state aid micro financing programme. It is important in future to ensure that private intermediaries have identical implementation terms for the micro financing programmes public entity.
101 Interview with Jēkabs Krieviņš, Altum, 6 October 2014102 Interview with Karlis Danevics, SEB bank, 24 September 2014
84

3.5. Bank Lending
Loans are remunerated transactions in which a lender, on the basis of a written contract, transfers money to a borrower in ownership and which imposes a duty on the borrower to return the money to the lender within a specified time and following a specified procedure.103
REGULATION (EC) No 25/2009 OF THE EUROPEAN CENTRAL BANK (ECB) defines loans issued by monetary financial institutions as: loans diverse maturities, overdrafts, revolving loans, convenience credit card credit and extended credit card credit, claims resulting from financial leasing and reverse repo transactions, margins to be repaid under a contractual agreement, and non-negotiable debt securities issued by non-monetary financial institutions (non-MFIs).104
The loan maturity grouping applied in the following analysis is summarized below.
Table 21: Classification of loans and equal instruments
Short-term and demand loans Medium and long-term loans
Overdrafts, credit lines Short-term loans Medium-term loans Long-term loans
Withdraw of funds to a pre-approved credit limit without giving prior notice to the lender.
Loans with an initial maturity of up to one year (inclusive).
Loans with an initial maturity from one to five years.
Loans with an initial maturity exceeding five years.
Source: Latvijas Banka, Glossary of Statistical Concepts Available on: http://www.bank.lv/en/statistics/glossary-of-statistical-concepts/. Last visited on 14 September 2014
Issuance of loans is administrated by licenced financial institutions, namely banks. Banks are subject both to Latvian national regulations (regulated by provisions of the Credit Institution Law and Regulations on the Issue of Credit Institution and Credit Union Operating Licences) and EU regulations. Operations of Latvian financial institutions are supervised by Financial and Capital Market Commission (FCMC) that is responsible for licencing and overseeing operations.
As of January 2014 the former Capital Requirements Directives (2006/48 and 2006/49) has been replaced by a new legislative package known as CRD IV, which includes:
1. Regulation (EU) No 575/2013 – a regulation on prudential requirements for credit institutions and investment firms (CRR);
2. Directive 2013/36/EU – a directive on access to the activity of credit institutions and the prudential supervision of credit institutions and investment firms (CRD IV).105
Introduced amendments were echo of the financial crisis and were aimed to create a sounder and safer financial system. The most significant change introduced in 2014 is increase of minimal capital
103 Loan Market Association, Legal&Regulatory. Available on: http://www.lma.eu.com/landing_legal_regulatory.aspx. Last visited on 14 September 2014. 104 Official Journal of the European Union. Regulation (EC) No 25/2009 of The European Central Bank, L 15/14, 20.1. 2009105 European Commission, The EU Single Market. Available on: http://ec.europa.eu/internal_market/bank/regcapital/legislation-in-force/index_en.htm. Last visited on 14 September 2014
85

and liquidity requirements. This led to additional pressure on ROE and profitability of financial institutions from one side and simultaneously increased costs of provision of loans.
3.5.1. Supply of loans
According to the European Commission, in general the loan volume data has been relatively stable with very few steep fluctuations already in 2012 and the moderate decreasing trend that was witnessed in previous years has come to an end. Total loan volume has flattened out across the EU.106
In Latvia the loan portfolio of banks has shown a steady decrease, while short-term and medium term loan portfolio showed growth in 2013.
Table 22: Year-on-year change in portfolio of issued loans by Latvian banks, EUR m
2009,EUR m
2010,EUR m
2011,EUR m
2012,EUR m
2013,EUR m
On-Demand 1,642 3,128 3,306 2,857 2,440
Y-on-y,% 90% 6% -14% -15%
Short-term loans 1,547 718 395 379 493
Y-on-y,% -54% -45% -4% 30%
Medium term loans 5,545 4,114 3,336 3,098 3,340
Y-on-y,% -26% -19% -7% 8%
Long-term loans 13,219 12,435 11,703 10,370 9,344
Y-on-y,% -6% -6% -11% -10%
Total 21,954 20,396 18,741 16,705 15,618
Y-on-y,% -7% -8% -11% -7%
Source: Calculations based on FCMC statistical data, FCMC, Semi-annual statistical data. Available on: http://www.fktk.lv/lv/statistika/kreditiestades/ceturksna_parskati. Last visited on 12 September 2014.
Distribution of loan portfolio indicated that short-term loans (including on-demand) on average constituted ca 18% from total loan portfolio, leaving to medium and long-term loans a share of 82%.
Year-on-year change in newly issued loans has been fluctuating significantly for the last couple of years and is expected to show a slight growth by the end of 2014 (please see Table 22).
106 European Commission, Loans. Available on: http://ec.europa.eu/enterprise/policies/finance/data/enterprise-finance-index/access-to-finance-indicators/loans/index_en.htm. Last visited on 14 September 2014
86

Table 23: Year-on-year change in newly issued loans to non-financial corporate entities by SMEs size category, EUR m
2011, EUR m 2012, EUR m 2013, EUR m 2014E, EUR m
Micro companies 272 393 275 327
Y-on-y,% 45% -30% 19%
Small companies 389 461 354 434
Y-on-y,% 19% -23% 23%
Medium companies 159 246 281 211
Y-on-y,% 55% 15% -25%
Large companies 125 193 211 197
Y-on-y,% 55% 9% -7%
Other companies 2 0.228 0.046 0.355
Y-on-y,% -87% -80% 676%
Total 945 1,292 1,121 1,160
Y-on-y,% 37% -13% 3%
Source: Calculations based on FCMC statistical data, FCMC, Semi-annual statistical data. Available on: http://www.fktk.lv/lv/statistika/kreditiestades/ceturksna_parskati. Last visited on 12 September 2014.
Stakeholders
There are 17 financial institutions and ten branches of foreign financial institutions operating in Latvia. Six of the largest banks (primarily Scandinavian) in terms of assets form more than 80% of the market and generate ca 90% of the industry profits.107
Figure 39: Number of banks and branches of foreign banks operating in Latvia, as at September 2014
2004 2005 2006 2007 2008 2009 2010 2011 2012 2013 2014 Q1 -
5
10
15
20
25
30
35
22 22 21 21 21 21 21 22 20 19
17
1 1 3 4 6
8 10 9
9 9
10
Banks Branches of foreign bank
Source: Latvijas Komercbanku Asociācija, Banku sektors skaitļos. Available on: http://www.bankasoc.lv/lv/statistika/. Last visited on 13 September 2014.Description of main market players is presented in Annex VI.107 FCMC, Publiskie ceturkšņa pārskati banku dalījumā (2013. gads). Available on: http://www.fktk.lv/lv/statistika/kreditiestades/publiskie_ceturksna_parskati_i/2013-06-07_publiskie_ceturksna_parskati_banku_dalijuma_par_2013_gada_1_ceturksni/. Last visited on 12 September 2014.
87

Figure 40: Distribution of assets of financial institutions in Latvia, 2013
Swedbank; 20%
SEB banka; 17%
ABLV Bank; 13%Rietumu Banka; 12%
Citadele banka; 9%
DNB banka; 9%
Others; 19%
Source: FCMC. Quarterly statistical data. Available on: http://www.fktk.lv/lv/statistika/kreditiestades/publiskie_ceturksna_parskati_i/2013-06-07_publiskie_ceturksna_parskati_banku_dalijuma_par_2013_gada_1_ceturksni/. Last visited on 17 September 2014.
Estimation of lending supply for 2016-2020
As per Association of Latvian Commercial Banks, banks operating in Latvia have significantly more resources than indicated by the current total loan portfolio balance. 108 The leading banks expect the total loan portfolio balance to remain stable and unchanged over in the upcoming years and during the period 2016-2020.109 Even though Latvia is expected to demonstrate a stable GDP growth in the upcoming years, and the loan portfolio balance should typically be proportionate to GDP, 110 the below mentioned identified market failures, as well as excessively enthusiastic lending by banks in the years preceding the last financial crisis produces a deleveraging effect.
108 Interview with Karlis Danevics, SEB bank, 24 September 2014109 Interview with Karlis Danevics, SEB bank, 24 September 2014, Interview with Harijs Švarcs, Swedbank, 9 September 2014, interview with Vadims Frolovs, Dace Kalnciema, Aivars Rupeiks and Ilze Kukute, Swedbank 29 September 2014 and interview with Karlis Kronbergs, Valters Abele and Agita Nicberga, Citadele, 2 October 2014110 Interview with Karlis Kronbergs, Valters Abele and Agita Nicberga, Citadele, 2 October 2014
88

Table 24: Total expected lending supply for Latvian SMEs for 2016-2020 program period, EUR m
Source: Calculations based on FCMC quarterly reports on operation of financial institutions, Available on: http://www.fktk.lv/lv/statistika/kreditiestades/ceturksna_parskati/. Last visited on 13 September 2014.
Given that the loan portfolio is expected to remain unchanged in the 2016-2020 period, yearly supply for SMEs per year for 2016-2020 is assumed to equal the amount of newly issued loans in 2014, which is EUR 971 m (EUR 167 m for short-term loans, and EUR 804m for medium and long-term loans). Thus, total expected supply for 2016-2020 is estimated at EUR 4.676 m (EUR 668 m for short-term loans, and EUR 3’217 m for medium and long-term loans) (please see above).111
3.5.2. Demand for loans
The demand for lending based on the survey analysis resulted in an estimate between EUR 987 – 1,805 m during 2016-2020.
Table 25: Estimated demand for bank loans by SMEs size category, EUR m
Micro companies
Small companies
Medium companies
Total demand for
loans
Short-term, on demand, EUR m 42-76 244-446 68-125 354-647
Medium and long-term loans, EUR m 278-508 312-571 43-80 633-1,158
Total demand for loans, EUR m 319-584 556-1,017 112-205 987-1,805
Source: Calculations based on conducted survey of SMEs;
111 Calculations based on FCMC quarterly reports on operation of financial institutions, Ceturkšņa pārskati. Available on: http://www.fktk.lv/lv/statistika/kreditiestades/ceturksna_parskati/. Last visited on 13 September 2014
89
Total expected supply for SMEs for 2016-2020
program period, EUR m
Distribution of supply by SMEs size categories,%
Short-term, on-demand
Large 136 17%
Medium 145 18%
Small 298 37%
Micro 225 28%
Total short-term, on-demand 804 100%
Medium and long-term loans
Large 654 17%
Medium 698 18%
Small 1’437 37%
Micro 1’082 28%
Total medium and long-term loans 3’872 100%
668
3217

The amount of demand allocated to each loan category was estimated based on the answers to survey question “What volumes of each of the financial instruments do you envisage to ask for during the next three years”.
Table 26: Calculation of demand for loans by Latvian SMEs, as at September 2014
EUR, m
1 Total demand for all financing instruments in Latvia
Micro companies 730-1,335
Small companies 1’365-2,498
Medium companies 568-1,039
2 Preference of financial instruments by Micro companies
Medium and long-term loans 31%
Short-term and on-demand loans 6%
Other instruments 63%
Total 100%
3 Preference of financial instruments by Small companies
Medium and long-term loans 23%
Short-term and on-demand loans 18%
Other instruments 59%
Total 100%
4 Preference of financial instruments by Medium companies
Medium and long-term loans 8%
Short-term and on-demand loans 12%
Other instruments 80%
Total 100%
Source: Calculations based on conducted survey of SMEs;
Interestingly, micro companies tend to prefer medium and long-term loans over short term loans, based on the conducted survey results, which is the opposite for medium sized companies.
3.5.3. Market viable gap for loans
Banks have more financial resources available for lending than they actually issue in loans, due to the aforementioned market failures.112 A vivid sign of absence of liquidity issues for banks in Latvia is the recently made available cheap financing by ECB to inject liquidity into the banking systems of the member states – only EUR 25 m of the available EUR 560 m (4%) was absorbed by Latvian banks.113
112 Interview with Karlis Danevics, SEB bank, 24 September 2014113 LSM.LV, Bankas nesteidz izmantot lēto ECB aizdevumu. Available on: http://www.lsm.lv/lv/raksts/zinju-analiize/zinas/bankas-nesteidz-izmantot-leto-eiropas-centralas-bankas-aizdevumu.a100714/. Last visited on 21 September 2014.
90

Commercial banks are using scoring systems to optimize loan application evaluation process, which leads to the situation, that some entrepreneurs with sound business plans are rejected due to company financial indicators not matching the necessary scoring ratios of banks.
Nevertheless, interviewed banks and association expressed anonymously the view of existent market viable gap,114 primarily due to the aforementioned identified market failures.
SEB would estimate a currently viable unmet demand by SMEs (that banks would be able to service) at ca 25% above the current total loan portfolio balance.115
From the outset if comparing market portfolio statistics with results from SME survey there is little indication of any market viable gap. Demand implied by the conducted survey of SMEs is significantly lower than the estimated total supply for 2016-2020, thus implying a questionable quality of SME survey results. However, in the absence of alternative statistics or means of estimation, the surveyed SMEs do voice the existence of a market viable gap, as also suggested by the conducted interviews. (Please see Table 20 below). Methodology of calculations of market viable gap is discussed in more detail in Chapter 3.2 and addresses the following main factors:
1. Profitability of companies looking for financing;
2. Purpose of the loan to exclude unsuitable demand;
3. Reasons behind past rejections of the applications by banks.
Total market viable gap for loans based on the conducted survey is estimated at EUR 381-698 m with majority of the gap allocated to small and start-up companies.
Table 27: Estimated market viable gap for loans for 2016-2020 program period, EUR m
Unborn compa-
nies
Pre-seed Seed Start-up
Emerging growth/
Expansion
Short-term loans, overdraft, credit lines, EUR m
13-23 122-223 13-24
Medium and Long-term loans, EUR m 85-156 156-285 9-16
Micro companies Small companies Medium companies
Total, EUR m 98 -179 277-507 22-40
Source: Calculations based on conducted survey of SMEs;
114 Interview with Karlis Danevics, SEB bank, 24 September 2014, Interview with Vadims Frolovs, Dace Kalnciema, Aivars Rupeiks and Ilze Kukute, Swedbank, 29 September 2014, Interview with Karlis Kronbergs, Valters Abele and Agita Nicberga, Citadele, 2 October 2014115 Interview with Karlis Kronbergs, Valters Abele and Agita Nicberga, Citadele, 2 October 2014
91

3.6. Leasing and Factoring
Leasing is an economic concept that allows the lessee to obtain the rights over durable goods in exchange for regular rental payments. ECB classifies leasing as asset based lending and supplements it with factoring and hire-purchase, which are based on receivables rather than assets.116 Asset backed lending allows SMEs to expand their access to short- and medium-term financing.117
Table 28: Classification of asset backed lending instruments
Financial lease Operational lease
- The right to use a durable good is acquired in exchange for rental payments over a predetermined and protracted term.
- Risks and rewards of ownership are transferred to lessee only de facto. The lessee is required to cover all expenses related to the maintenance of the leased object.
- De jure ownership stays to lessor till the lessee utilizes its rights to buy out the leased object.
- The lessor's role is thus purely financial.
- The right to use a durable good is acquired for a certain period of time (not necessary settled in advance and might not cover all lifetime of the goods).
- At the expiry of leasing period the leased object is expected to be returned to the lessor.
- Common practice when the returned object is hired out to another lessee for the second time.
- All expenses related to maintenance of the leased objects stays with the lessor.
Factoring
- Factoring is financial instrument that allows companies to finance their working capital through acquisition of claims to receivers of goods by factoring institution.
- Factoring institution takes over credit risks. Hire-purchase
- A system by which one pays for a thing in regular instalments while having the use of it. Hire-purchase in its nature is close to financial lease.
Sources: Eurostat, Concepts and definitions. Available on: http://ec.europa.eu/eurostat/ramon/nomenclatures/index.cfm?TargetUrl=DSP_GLOSSARY_NOM_DTL_VIEW&StrNom=CODED2&StrLanguageCode=EN&IntKey=16471985&RdoSearch=BEGIN&TxtSearch=leasing&CboTheme=&IsTer=&ter_valid=0&IntCurrentPage=1. Last visited on 13 September 2014; CSB, Leasing and factoring portfolio. Available on: http://www.csb.gov.lv/en/statistikas-temas/metodologija/leasing-and-factoring-portfolio-36313.html. Last visited on 13 September 2014; Oxford Dictionaries, Hire-purchase. Available on: http://www.oxforddictionaries.com/definition/english/hire-purchase. Last visited on 13 September 2014; The National Archives. BIM61025 - Leasing: General: hire purchase and finance leasing: distinction. Available on: http://webarchive.nationalarchives.gov.uk/+/http://www.hmrc.gov.uk/manuals/bimmanual/bim61025.htm. Last visited on 13 September 2014.
EIF does not point out any specific or dominant reasoning for SMEs preferences for leasing instruments, however admits that leasing allows smaller companies to survive and is an alternative mechanism to facilitate access to finance. Young companies usually do not generate sufficient cash, face a lack of credit track record and are unable to provide collateral. Lease is in such circumstances a suitable financing instrument that provides financing aligned to the time period of investment of the leased assets and does not require additional collateral.118 Same applies also to other asset backed
116 European Central Bank. Survey on the Access to Finance of Small and Medium-Sized Enterprises in the Euro Area, 2014, p.25117 European Investment Fund. The importance of leasing for SME finance. Working paper, 2012/2015, p.6 118 European Investment Fund, The importance of leasing for SME finance. Working paper, 2012/2015, pp.8-10
92

lending instruments, where the financing institution maintains significant or total control over the asset.
Meanwhile, asset backed lending also provides more certainty to the leasing companies than secured loans, as the lessor retains ownership of the asset during the whole lease period. In case of bankruptcy it is easier for the lessor to regain control of his asset than for a secured creditor to demand his security interest in the collateral.119
A study performed by Oxford Economics performed in 2011 established a hierarchy of reasons why SMEs prefer leasing. The list included among others such reasons as:
1. A better price than other forms of finance,
2. Tax benefits,
3. Ability to finance up to 100% of the purchase price of an asset, without having to provide any supplementary guarantees or collateral,
4. Enables better cash flow management,
5. Ability to upgrade and renew assets more frequently than purchasing would allow, etc.120
Leasing operations in Latvia are overseen by Consumer Rights Protection Centre (CRPC) that is responsible for granting and supervision of the licences for leasing institutions pursuant to Minister Cabinet Regulation No.245 adopted 29 March 2011 “Regulations Regarding the Procedures by Which a Special Permit (Licence) for the Provision of Consumer Credit Services Shall Be Issued, Re-Registered, Suspended and Cancelled and the State Fee for the Issue and Re-Registration of a Special Permit (Licence) Shall Be Paid, as well as the Requirements for a Capital Company for the Receipt of a Special Permit (Licence)”.
Often a prerequisite for receiving leasing or factoring is at least one year of operational history and positive, predictable cash flows.121
3.6.1. Supply of leasing and factoring
Leasing
Many EU countries in 2009 experienced an unprecedented drop in new leasing business activities regardless of asset type. A moderate growth of 7-15% was observed in 2011 for majority of asset types across the EU. Real estate, however, proceeded to show negative change. Instability in PIGS countries in 2011-2012 impaired the volumes of new leasing markets in the respective countries even further.122 Pre-crisis market volumes have not been reached in 2013, and volumes of real estate lease continue to decrease further.119 E., Kichler, P. Haiss. Market Structure as Determinant: the Case of Leasing in Banking Industry Transformation in Central and South Eastern Europe. EuropaInstitut, 2008, p.6120 Leaseurope. Leasing to European SMEs. 2012, p.15121 Interview with Jevgenijs Belezjeks, Unicredit Leasing and Latvian Commercial Bank Association, 1 October 2014 122 Leaseurope. The Voice of leasing and Automotive Rental in Europe. 2009-2012
93

Latvian leasing market was severally hit at the time of financial crisis (2009) – experiencing a drop of new financing of 70-80% depending on the asset type (please see Figure 41 below).
Figure 41: Issued leasing per asset type in Latvia (2008-2013), EUR m
2008 2009 2010 2011 2012 2013 -
50,000,000
100,000,000
150,000,000
200,000,000
250,000,000
300,000,000
350,000,000
400,000,000
450,000,000
500,000,000
Real EstateCar leasingCommercial vihicles lendingEquipment leasingOthers
Source: LLDA, Statistical data. Available on: http://www.llda.lv/lv/par-asociaciju/statistika.html. Last visited on 9 September 2014
Growth rate for 2013 was a moderate 2% indicating a stabilization of the market, which is expected to remain stable or show a moderate growth.123
The main leasing products in the Latvian market are car leasing, commercial vehicle leasing, equipment leasing. Even though there is no data available on leasing portfolio split by SME segments, one of the market players has the following distribution – J. Belezjaks estimates that 85% of the Unicredit Leasing portfolio is represented by SMEs of which ca 5% are micro companies. 124 However, Swedbank estimates that micro companies form up to 80% of Swedbank leasing operations.125
If considering product types, historically financial leasing portfolio amounted to ca 80% of total leasing portfolio. However, in recent years operational leasing is becoming increasingly popular.
Table 29: Year-on-year change in portfolio and new leasing and factoring businesses in Latvia (2010-2013), EUR m
2010, EUR m 2011, EUR m 2012, EUR m 2013, EUR m
Leasing portfolio
Financial leasing 1,027 961 944 900
Year-on-year change, % -6% -2% -5%
Operational leasing 218 195 200 224
Year-on-year change, % -10% 2% 12%
Factoring portfolio 64 93 96 108
Year-on-year change, % 46% 4% 12%
Total portfolio 1,308 1,249 1,240 1,232
Year-on-year change, % -5% -1% -1%
123 Interview with Vadims Frolovs, Dace Kalnciema, Aivars Rupeiks and Ilze Kukute, Swedbank 29 September 2014124 Interview with Jevgenijs Belezjeks, Unicredit Leasing and Latvian Commercial Bank Association, 1 October 2014125 Interview with Vadims Frolovs, Dace Kalnciema, Aivars Rupeiks and Ilze Kukute, Swedbank 29 September 2014
94

New sales
Financial leasing 240 461 513 511
Year-on-year change, % 93% 11% 0%
Operational leasing 35 61 85 100
Year-on-year change, % 75% 40% 18%
Factoring portfolio 325 434 636 7145
Year-on-year change, % 33% 46% 12%
Total new businesses 599 957 1,234 1,326
Year-on-year change, % 60% 29% 7%
Source: calculations based on LLDA statistical data, LLDA, Statistical data. Available on: http://www.llda.lv/lv/par-asociaciju/statistika.html. Last visited on 9 September 2014
Swedbank has recently (in 2014) launched a new experimental program to provide microfinance to micro enterprises targeting enterprises requiring small investments (e.g. used car), for which processing leasing formalities becomes an excessive burden. The experimental program (untypically for banks targeting microenterprises) is yet to show if it can be a profitable, self-sustainable program at the currently offered terms.126
Factoring
Despite the adverse market conditions caused by economic downturn factoring as a product globally experienced growth in 2012 by 8% followed by 3% growth in 2013.127 Factoring industry remains as a front line working capital finance solution for domestic and international business.128
Latvian factoring market experienced significant drop in 2009. Decrease in volumes continued for a couple of years when market started slowly improve in 2011 (please see Figure 42 below).
Figure 42: Factoring volumes in Latvia (2008-2013), EUR m
2008 2009 2010 2011 2012 2013 -
200,000,000
400,000,000
600,000,000
800,000,000
1,000,000,000
1,200,000,000
1,400,000,000
1,600,000,000
1,800,000,000
2,000,000,000
Factoring portfolio Factoring (turnonver)
Source: LLDA, Statistical data. Available on: http://www.llda.lv/lv/par-asociaciju/statistika.html. Last visited on 9 September 2014
126 Interview with Harijs Švarcs, Swedbank, 9 September 2014 and interview with Vadims Frolovs, Dace Kalnciema, Aivars Rupeiks and Ilze Kukute, Swedbank, 29 September 2014127 IFG GIAR. Global Industry Activity Report. 2013, p.1. 128 IFG GIAR. Global Industry Activity Report. 2012, p.1.
95

Swedbank does not expect the factoring and leasing market size to change in the upcoming years. 129 Jevgenijs Belezjaks, representing Association of Latvian Leasing Providers, on the other hand, sees it probable for the leasing and factoring market portfolio to reach EUR 1 bn in 2015-2016, the main reasons being necessity to renew depreciating assets (vehicle parks and equipment), as well as growth in economy. Once reaching the EUR 1 bn mark, the market size is expected to remain stable and unchanged or experiencing slight growth during 2016-2020.130
As emphasised by Swedbank, financing of working capital is one of the key purpose of providing financing to SMEs, and is primarily related to financing growth by entering new markets, attracting new clients, which are reluctant to finance the purchase with full prepayment. 131 Therefore, it is not unreasonable to conclude that public financing support particularly addressed to finance working capital and addressing related market failures is likely to contribute substantially to the growth and competitiveness of SMEs. However, caution should be exercised when considering particular limitations, requirements, procedures related to such a publicly funded financial instrument, as excessive administrative burden on the lending institution and the recipient enterprise is likely to limit the accessibility of working capital related financing that would be required to fund growth.132
Leasing and factoring stakeholders
There are 19 leasing and factoring institutions operating in the Latvian market as at mid-2014.
Figure 43: Number of leasing institutions on Latvian market, as at September 2014
2009 2010 2011 2012 2013 20140
5
10
15
20
25
30
Source: Latvijas Banka, List of leasing companies. Available on: http://www.bank.lv/statistika/datu-telpa/galvenie-raditaji/lizinga-sabiedribu-saraksts-2009-gada-4-ceturksni. Last visited on 16 September 2014.
Majority of the leasing institutions are an extension of the largest banks operating in Latvia. 133 Therefore, arguably, there is likely similarity in the views and expectations of the financial market in Latvia between banks and leasing institutions. Description of the leading leasing institutions operating in Latvia is presented in Annex VI.
Estimation of supply for 2016-2020
There is no publicly available market data of leasing and factoring portfolio distribution by SME segment. Furthermore, stakeholder interviews indicated that allocation of leasing volumes between
129 Interview with Vadims Frolovs, Dace Kalnciema, Aivars Rupeiks and Ilze Kukute, Swedbank, 29 September 2014130 Interview with Jevgenijs Belezjeks, Unicredit Leasing and Latvian Commercial Bank Association, 1 October 2014 131 Interview with Vadims Frolovs, Dace Kalnciema, Aivars Rupeiks and Ilze Kukute, Swedbank, 29 September 2014132 Interview with Vadims Frolovs, Dace Kalnciema, Aivars Rupeiks and Ilze Kukute, Swedbank, 29 September 2014133 Latvijas Banka, Līzinga sabiedrību saraksts 2014. gada 1. Ceturksnī. Available on: http://www.bank.lv/statistika/datu-telpa/galvenie-raditaji/lizinga-sabiedribu-saraksts-2014-gada-1-ceturksni. Last visited on 16 September 2014.
96

SMEs size categories significantly varies between different leasing institutions. One of the likely reasons might be difference in market strategy. Also the insufficient size of conducted survey sample limits possibility to reliably estimate the preferred distribution of supply by SME segment.
However, Interviews do reveal some commonalities:
1. Micro companies use leasing primarily for car purchase;
2. Small and medium companies use industrial and commercial leasing being able to demonstrate sufficient and predictable cash flow to qualify for the lease.
Annual supply of leasing and factoring instruments for private individuals, SMEs and large enterprises per year is estimated to be EUR 1’326 m (EUR 611 m for leasing and EUR 715 m for factoring) based on 2013 results, suggesting the total supply for 2016-2020 to be EUR 5’304 m (EUR 2’446 m for leasing and EUR 2’858 m for factoring).
Table 30: Estimation of leasing and factoring supply for private individuals, SMEs and large enterprises, 2016-2020, EUR m
Total expected supply in 2016-2020 program period, EUR m
Real Estate 9
Car leasing 970
Commercial vehicles lending 657
Equipment leasing 681
Others 129
Total leasing 2’446
Factoring (turnover) 2’858
Total 5’304
Source: Calculations based on LLDA statistics on leasing and factoring businesses in Latvia, LLDA, Statistical data. Available on: http://www.llda.lv/lv/par-asociaciju/statistika.html. Last visited on 9 September 2014.
The available statistics do not provide any indications about the allocation of leasing and factoring supply by company segment. J. Belezjaks, representing Association of Latvian Leasing Providers has provided an indication that it is not unlikely that SMEs represent 60% from the overall market or EUR 3’182 m, of which ca 15% are likely to be micro companies, and 85% small and medium sized companies.134
Table 31: Allocation of expected supply between SMEs size categories, EUR m
Micro companies
Small companies
Medium companies
Total Leasing and
Factoring
Leasing, EUR m 245 1,223 1,468
Factoring, EUR m 286 1,429 1,715
Total, EUR m 530 2,652 3,182
134 Interview with Jevgenijs Belezjeks, Unicredit Leasing and Latvian Commercial Bank Association, 1 October 2014
97

Source: Calculations based on LLDA statistics on leasing and factoring businesses in Latvia, LLDA, Statistical data. Available on: http://www.llda.lv/lv/par-asociaciju/statistika.html. Last visited on 9 September 2014, and interview with Jevgenijs Belezjaks, Unicredit Leasing and Latvian Commercial Bank Association, October 1, 2014
3.6.2. Demand for leasing and factoring
Arguably the demand for leasing and factoring is at minimum at the level of issued leasing and factoring in the market in the particular given time period, provided that there is no financial or market viable gap. The conducted SME survey suggests that the demand for leasing and factoring is lower than the actual issued leasing and factoring amount, implying that the survey results are to be viewed with caution, and are possibly not fully representable of the market or skewed due an insufficient or insufficiently representative sample size.
3.6.3. Market viable gap for leasing and factoring
Leasing and factoring
Similarly as for loans, from the outset if comparing market portfolio statistics with results from the SME survey there is little indication of any market viable gap for leasing and factoring. However, in the absence of alternative statistics or means of estimation, the surveyed SMEs do voice the existence of a market viable gap for leasing and factoring, as also suggested by the conducted interviews.
Methodology of calculations of market viable gap is discussed in more detail in Chapter 3.2 and addresses the following main factors:
1. Profitability of companies looking for financing;
2. Purpose of the loan to exclude unsuitable demand;
3. Reasons behind past rejections of the applications by leasing and factoring providers.
Total estimated market viable gap for leasing and factoring is estimated at EUR 162-296 m (EUR 55-101 m for leasing and EUR 107-196 m for factoring). Similar to the loan market, the estimated market viable gap serves merely as an approximate indication, given the identified data limitations.
98

Table 32: Estimated market viable gap for factoring and leasing for 2016-2020 program period,EUR m
Unborn compa-
nies
Pre-seed Seed Start-up Emerging growth/
Expansion
Leasing, EUR m 23-42 25-46 7-13
Factoring, EUR m 10-18 64-117 33-60
Micro companies Small companies Medium companies
Total, EUR m 33-60 90 – 164 40-73
Source: Calculations based on conducted survey of SMEs;
3.6.4. Findings / market failure for bank lending and leasing and factoring
1. Inefficient country legal framework hinders trust in new clients
According to The Global Competitiveness Report for 2013-2014, Latvia holds the 117th place in the country ranking for efficiency of legal framework in settling disputes.135 In comparison, Lithuania holds the 96th and Estonia 39th place. Even if a company has a sound business plan, a track record of positive and predictable cash flows, banks are reluctant to lend to companies that are not clients of the particular bank due to perceived excessive risk of low recovery in case of failure to pay. If banks do offer to lend to a new client, often they require hard collateral (instead of commercial pledge, for instance), thus limiting availability of credit to SMEs.136
For particular types of investment leasing as a financial instrument can somewhat address this market failure, as leasing provides a higher security and lower recovery risks than lending with collateral.137
2. Administrative costs prohibits lending low amounts
Karlis Danevics on a behalf of SEB and the Association of Commercial Banks of Latvia acknowledges it is commercially viable to evaluate issuance of loans for an amount exceeding EUR 50 t.138 A Micro company, based on the conducted survey, requires short-term loans with the average amount of EUR 13 t or medium or long-term financing with the average amount of EUR 53 t. Only average medium and long term loans are slightly higher than the loan amounts commercially viable for the banks. This implies that for micro companies to a large extent lending provided by banks is inaccessible.
Commercial banks are using scoring systems to optimize loan application evaluation process, which leads to the situation, that some entrepreneurs with sound business plans are rejected due to company financial indicators not matching the necessary scoring ratios of banks.
135 Klaus Schwab. The Global Competitiveness Report for 2013-2014. World economic forum, 2013-2014, p.263. 136 LSM.LV, Bankas nesteidz izmantot lēto ECB aizdevumu. Available on: http://www.lsm.lv/lv/raksts/zinju-analiize/zinas/Latvijas%20Banka%20vīlusies.a100714/. Last visited on 21 September 2014.137 European Investment Fund. The importance of leasing for SME finance. Working paper, 2012/2015, p.10138 Interview with Karlis Danevics, SEB bank, 24 September 2014
99

3. Insufficient equity for loan co-financing required by banks
Banks typically require a 30% equity co-financing for the project. The recent global financial crisis has had a toll on SMEs, where only the strongest have survived, however without sufficient savings or shareholder capital to co-finance borrowing intended for growth projects.139
4. SMEs cautious to increase indebtedness
Despite statistics not suggesting overleveraging for companies in Latvia (total loans outstanding as a percentage of GDP is 35%), banks see SMEs regardless of segment either being particularly cautious to finance growth with funding from banks, given the recent sour experience in the aftermath of the global financial crisis, or SMEs being fully leveraged.140
5. Increasing shadow economy further limits availability of financing by banks
Reputable banks in Latvia would not lend to SMEs obviously operating in the shadow economy. 141 The share of shadow economy was 24% in 2013 (up from 21% in 2012)142. SMEs operating in the shadow economy have limited access to bank financing. Arguably, if more SMEs were operating outside the shadow economy and reporting actual results, more bank financing would positively affect SME growth.
139 Interview with Vadims Frolovs, Dace Kalnciema, Aivars Rupeiks and Ilze Kukute, Swedbank, 29 September 2014, Interview with Karlis Danevics, SEB bank, 24 September 2014, Interview with Karlis Kronbergs, Valters Abele and Agita Nicberga, Citadele, 2 October 2014140 Interview with Vadims Frolovs, Dace Kalnciema, Aivars Rupeiks and Ilze Kukute, Swedbank, 29 September 2014, Interview with Karlis Danevics, SEB bank, 24 September 2014 141 Interview with Karlis Kronbergs, Valters Abele and Agita Nicberga, Citadele, 2 October 2014142 db.lv, Ēnu ekonomikas īpatsvars Latvijā – 23,8%. Available on: http://www.db.lv/finanses/makroekonomika/enu-ekonomikas-ipatsvars-latvija-23-8-proc-414840. Last visited on 16 September 2014.
100

3.7. Loan Guarantees
A guarantee is a financial commitment to repay up to a certain percentage of the loan to the financial institution in case the SME (to which the guarantee was provided) should not be able to honour its payments. A guarantee is meant to reduce the excessive risks to provide funding as perceived by the lending institution, for example, through provision of a missing collateral.143 A guarantee is invoked only if the creditor is unable to cover its obligations to the financial institutions. It is common for guarantees not to cover the full amount of loan (typically 80%).144
Guarantees are usually used to reduce market failures such as unwillingness of the financial institutions to provide financing to SMEs, by reducing the financial loss suffered by the financial institution in the case of defaults. Presence of guarantee also improves relationships between the creditor and financial institution by reduction of asymmetry of information and serves as a signal of creditworthiness of the firm.145
The key stakeholders affected by guarantees are:
1. SMEs that require loans;
2. Financial institutions that perform an assessment of the borrower’s creditworthiness;
3. Credit guarantee scheme that covers a share of the loan with its guarantee;
4. Government as a regulator of financial markets and directly or indirectly participating in the credit guarantee scheme through direct financial support and participation in their management or indirectly by granting counter-guarantees.146
143 Aecm, What are guarantees? Available on: http://www.aecm.eu/en/what-are-guarantees.html?IDC=65. Last visited on 21 September 2014.144 Aecm, What are guarantees? Available on: http://www.aecm.eu/en/what-are-guarantees.html?IDC=65. Last visited on 21 September 2014.145 OECD. SME and Entrepreneurship Financing: The Role of Credit Guarantee Schemes and Mutual Guarantee Societies in supporting finance for small and medium-sized enterprises. 2012, p.10146 OECD. SME and Entrepreneurship Financing: The Role of Credit Guarantee Schemes and Mutual Guarantee Societies in supporting finance for small and medium-sized enterprises. 2012, p.10
101

Figure 44: The functioning of credit guarantee schemes
Source: OECD, SME and Entrepreneurship Financing: The Role of Credit Guarantee Schemes and Mutual Guarantee Societies in supporting finance for small and medium-sized enterprises. 2013, p.11
Guarantees schemes might be implemented differently depending on the ownership structure and role of the shareholders in management:147
1. Public Guarantee Schemes (PGS) - founded on government initiative as a direct policy tool to alleviate financial distress by SMEs. PGSs are generally managed by government related agencies, such as public guarantee banks, or by an administrative unit of a ministry.
2. Mixed Guarantee Schemes – catalysed by public financial institutions, development banks or SME agencies in which the public entity may keep a majority stake.
3. Private Schemes – characterized by the direct participation of the private sector, SME organizations and banks in the funding and management of the scheme. The role of the government is generally limited to the regulatory and legal framework and to the provision of financial assistance.
Over 2008-2010 in many countries new guarantee programmes were set up and existing loan guarantee programmes ramped up, as part of government anti-crisis packages. 148 Penetration of guarantees is represented by the volume of outstanding guarantees in portfolio as a percentage of GDP (please see Figure 45).
147 OECD. SME and Entrepreneurship Financing: The Role of Credit Guarantee Schemes and Mutual Guarantee Societies in supporting finance for small and medium-sized enterprises. 2012, pp. 11-18. 148 OECD. SME and Entrepreneurship Financing: The Role of Credit Guarantee Schemes and Mutual Guarantee Societies in supporting finance for small and medium-sized enterprises. 2012, p.8.
102
Financial support(Direct Funds/Counter Guarantees)
Bank Loans
Credit Guarantee
Scheme
Public Authorities(Local, regional,
national Government
SME Financial Institution
Legal&Regulatory Framework(tax regime, supervision, etc.)
Fee / MembershipLoan Guarantee

Figure 45: Volume of granted guarantees as a percentage of GDP in 2012, %
Aust
ria
Belg
ium
Bulg
aria
Czech
Republic
Germ
any
Estonia
Spain
France
Hungary
Italy
Lith
uania
Latv
ia
Neth
erlands
Poland
Portugal
Rom
ania
Slove
nia
European U
nion
Euro z
one0.00%
0.20%
0.40%
0.60%
0.80%
1.00%
1.20%
1.40%
Source: European Commission, Guarantees. Available on: http://ec.europa.eu/enterprise/policies/finance/data/enterprise-finance-index/access-to-finance-indicators/guarantees/index_en.htm. Last visited on 23 September 2014.
In 2012 volume of granted guarantees as percentage of GDP in European economies vary between 0.03 and 1.19%, while in Latvia – 0.11%. In terms of volume of outstanding guarantees in portfolio as a share of GDP constituted 0.53% in Latvia, close to EU average of 0.59% in 2012.149
Provisions of guarantees to SMEs in Latvia are governed by the following regulations:
1. Minister Cabinet Regulation No.997 adopted 26 October 2010 “Regulations Regarding Guarantees for Improving the Competitiveness of Merchants”;150
2. Minister Cabinet Regulation No.436 adopted 12 May 2009 “Regulations on Guaranteeing Short-term Export Credit”.
3.7.1. Supply
Risk covering instruments on the Latvian market are managed both by public and private schemes and include three main types of instruments: (1) insurance instruments that mainly cover short term transactions, (2) trade financing (deferred payments) that is provided by financial institutions mainly for short-term transactions, (3) export credit guarantees managed by LGA (please see Figure 29).
149 European Commission, Guarantees. Available on: http://ec.europa.eu/enterprise/policies/finance/data/enterprise-finance-index/access-to-finance-indicators/guarantees/index_en.htm. Last visited on 23 September 2014.150 likumi.lv, Noteikumi par garantijām komersantu un atbilstošu lauksaimniecības pakalpojumu kooperatīvo sabiedrību konkurētspējas uzlabošanai. Available on: http://likumi.lv/doc.php?id=220826. Last visited on 23 September 2014.
103

Figure 46: Risk covering instruments available on Latvian market
Source: Ekonomikas Ministrija, Informatīvais ziņojums „Par priekšlikumiem vidēja un ilgtermiņa eksporta kredīta garantiju ieviešanas modelim”, p.9; LGA, What is provided by a credit guarantee? Available on: http://www.lga.lv/index.php?id=41&L=1. Last visited on 21 September 2014.
Guarantees schemes for Latvian SMEs are supported by LGA that issues credit guarantees for new financial obligations. LGA manages credit guarantee programs.151 A credit guarantee offered by LGA covers up to 80% of the principal of the financial service and does not exceed EUR 1.5 m for one commercial activity (except for road transportation activities – EUR 0.75 m). The maximum length of the guarantee term is 10 years.152 As per OECD, on average guarantees are typically set at 5 years.153
Cumulative guarantee volumes (excluding export credit guarantees) issued by LGA have reached EUR 129 m, with the average guarantee amount per company from EUR 165 t for financial lease guarantees to EUR 450 t for investment guarantees (please see above).154
As per LGA the most active sector in Latvian economy seeking for credit in the last years is the processing industry. While export credit guarantees were not popular among micro companies, credit guarantees were actively used also by micro sector (please see Figure 47).
151 LGA. Financial Instruments for Development. 2013, p.6. 152 LGA, What is provided by credit guarantee. Available on: http://www.lga.lv/index.php?id=41&L=1. Last visited on 21 September 2014.153 OECD, SME and Entrepreneurship Financing: The Role of Credit Guarantee Schemes and Mutual Guarantee Societies in supporting finance for small and medium-sized enterprises. 2013. p.33154 LGA, Who use the services. Available on: http://www.lga.lv/index.php?id=45&L=1. Last visited on 21 September 2014.
104

Figure 47: Distribution of credit guarantees by sector in Latvia, as of 2013, %
60%18%
7%
5%3%3%4%
Credit guarantees
Processing industry Construction Energy Agriculture and forestryIT services Transportation and storage Other sectors
17%
36%29%
18%
Credit guarantees
Large Medium Small Micro
Source: LGA, Annual Report Latvian Guarantee Agency: Financial Instruments for Development. Available on: http://www.lga.lv/fileadmin/dokumenti/LGA_Gada_Parskati/LGA_gada_parskats_2013_ENG_01.pdf, p.6. Last visited on 13 September 2014.
Supply limiting factors
LGA is a specialized development finance institution providing support to Latvian businesses for implementing business ideas. LGA helps entrepreneurs to get new financial investment, by giving credit, export guarantees and mezzanine loans and investing in VC funds.155
The identified market failures such as lack of co-financing resources, insufficient collateral, inefficient legal framework, is to a large extent addressed by an instrument like a guarantee, as expressed by the interviewed lending and leasing institutions and the Chamber of Commerce.
At the same time, there is an administrative burden limitation – private financial institutions regard it economically justified to invest efforts coordinating the application for guarantees for their clients if the guarantee amount exceeds EUR 50-100 t,156 thus limiting the access to guarantees and funding to SMEs requiring a lower amount of financing.
3.7.2. Demand
The demand for guarantees based on the conducted SME survey analysis resulted in an estimated demand of EUR 219-402 m in the period 2016-2020 (please see Table 33 below).
155 LGA, Latvian Guarantee agency. 2014, p.2156 Interview with Jevgenijs Belezjeks, Unicredit Leasing and Latvian Commercial Bank Association, October 1, 2014
105

Table 33: Demand for guarantees in Latvia, as of September 2014, EUR m
Micro companies Small companies Medium companies
Credit guarantees, EUR m 1-2 191-350 27-50
Total demand for guarantees, EUR m 1-2 191-350 27-50
Source: Calculations based on conducted survey of SMEs;
One should evaluate the results estimated based on survey results with caution, given that, as per interviewed stakeholders, SMEs often are not aware of what financial instruments are most suitable in what circumstances, as well as given the limited size of the sample – both of which factors might have an effect on the results of the survey.
3.7.3. Market failures
For market failures please refer to Section 3.8.3.
3.7.4. Market viable gap
The surveyed SMEs do voice the existence of a market viable gap for leasing and factoring, as also suggested by the conducted interviews. Similarly to the loan market, estimated market viable gap serves merely as an approximate indication, given the identified data limitations. This being taken into account market viable gap for guarantees was decided not to divide by types of guarantees.
Methodology of calculations of market viable gap is disclosed in more details in Chapter 3.2 and addresses the following main factors:
1. Profitability of companies looking for financing;
2. Purpose of the loan to exclude unsuitable demand;
3. Reasons behind the rejections of the applications by banks.
Total estimated market viable gap for guarantees is estimated at EUR 115-210 m with majority of the gap allocated to small companies (please see Table 29). Despite the survey results suggesting EUR 0.5 m gap for micro companies, already issued guarantees to micro companies exceed the implied result by a factor, suggesting to view the survey results, especially the distribution by SME segments, with caution.
106

Table 34: Estimated market viable gap for guarantees for 2016-2020 program period, EUR m
Unborn companies
Pre-seed Seed Start-up
Emerging growth/
Expansion
Guarantees, EUR m 1 95-174 5-10
Unborn
companies Micro companies Small companies
Medium companies
Total for guarantees, EUR m 1 95-174 5-10
Source: Calculations based on conducted survey of SMEs
3.7.5. Lessons learned
In the view of stakeholders guarantees are an effective instrument in times of economic crisis to stimulate the overall economic activity.157 Karlis Danevics representing the Commercial Banks Association positively evaluates LGA guarantee program and the guarantee level of 80% from the total financing requested by SMEs, which is also echoed by J. Belezjaks representing Association of Latvian Leasing Providers.158 LGA confirms that the number of guarantees continuously increase, but still is considered as too low opposed to the SMEs population.159
The administrative procedures are considered as optimal and justified, while the principle of issuing guarantees by company provides an administrative barrier. The administrative effort required does not justify financial institutions and companies seeking lending to obtain guarantees in case the loan amount is below a certain threshold (e.g. EUR 50 t).160
Also, the requirement that guarantees are not automatically transferable upon refinancing limits the possibility of companies to obtain additional financing (e.g. when the current lender is reluctant to provide further lending, while other market participants would be able to provide additional financing).161
J. Belezjaks sees that current approach of LGA could be further improved by shifting focus from providing guarantees to particular companies to providing guarantees at portfolio level, while still prescribing the required target limitations. As per J. Belezjaks, such practice is implemented by UNICREDIT in Lithuania and has showed its positive effect. This allows to reduce administrative costs, e.g. evaluation of creditworthiness of the creditor, and allows to increase returns due to portfolio diversification.162
157 Interview with Vadims Frolovs, Dace Kalnciema, Aivars Rupeiks and Ilze Kukute, Swedbank 29 September 2014, Interview with Karlis Danevics, SEB bank, 24 September 2014, Interview with Jevgenijs Belezjeks, Unicredit Leasing and Latvian Commercial Bank Association, 1 October 2014158 Interview with Karlis Danevics, SEB bank, 24 September 2014, Jevgenijs Belezjeks, Unicredit Leasing and Latvian Commercial Bank Association, 1 October 2014159 Interview with Jēkabs Krieviņš, Altum, 6 October 2014160 Interview with Karlis Danevics, SEB bank, 24 September 2014161 Interview with Karlis Kronbergs, Valters Abele and Agita Nicberga, Citadele, 2 October 2014162 Interview with Jevgenijs Belezjeks, Unicredit Leasing and Latvian Commercial Bank Association, 1 October 2014
107

In the past, mechanism for portfolio guarantees has been unsuccessfully attempted to be implemented in Latvia, due to it being perceived as public support of financial institutions instead of SMEs.163
163 Interview with Klavs Vasks, LGA 9 October 2014
108

3.8. Export Credit Guarantees
3.8.1 Supply
Lately demand for a wider range of trade credit insurance instruments has increased. Due to increasing volumes of Latvian export and diversification of export transactions there is a need to provide short-term and long-term economic and political risk coverage to export transactions to European Union, industrialized countries and developing countries.
At the moment Latvia is only among few EU countries, which do not offer MLT (medium and long term) export credit instrument to its exporters.164 Short term commercial risk coverage to export transactions is provided by the private insurers and supply of political risk coverage in the market is insufficient. To add, private insurers are selective about eligible geographies.
In developed countries ECAs (agencies - usually government agencies or government-backed agencies) provide diversified risk coverage to exporters. The need for the implementation of such agencies is justified by unpredictable changes in supply of the private insurers in unstable economic conditions and by low risk appetite for export transactions with deferred payment over 120 days. Among industrialized countries Latvia is one of the few, which has no such agency.
Taking into account the specifics of export credit insurance in the world, there is a common practice to create ECA, which role is to support and to promote exports by covering short term and long term commercial and political risks of exporters. To a limited extent such function is currently performed by LGA. If compared to other Member States of the European Union, it can be concluded that LGA currently offers relatively narrow export business risk coverage range - short-term (up to 2 years) and a limited amount (up to EUR 1 m) political and economic risk coverage.
An export credit guarantee is a commitment of the LGA to reimburse the exporter (or the bank financing the export transactions) losses in the case, where a foreign debtor is insolvent or in the case, where there is long-term non-payment. Such guarantees cover both the buyer’s risk, as well as buyer’s obligation guarantee – the buyer’s bank risk. Export credit guarantee also may be additionally supported by the letter of credit as additional collateral, where there is a doubt about the liquidity of the buyer’s bank, however such instrument is not accessible in the Latvian market.165
Limits on export credit guarantee are fixed at EUR 1m for one or series of transactions with one debtor. Guarantee covers up to 90 per cent of the transaction value and is issued with maturity not exceeding 2 years.166 LGA assumes the risk of an individual buyer, without requiring for the buyer's entire portfolio insurance. The guarantees of LGA cover the commercial and political risks that arise after the product and / or service is delivered to the consumer.
Private credit insurers do not cover the medium and long-term export credit transactions and mainly covers only short-term commercial risks , where the deferred payment period shall not exceed 120
164 Medium and Long-term export credit is offered by similar economies to Latvia in terms of GDP and export volumes, like Estonia (http://www.kredex.ee/credit-insurance/), Slovenia (http://www.sid.si/credit-and-investments-insurance/credit-insurance) etc.165 LGA. What is an Export Credit Guarantee? Available on: http://www.lga.lv/index.php?id=46&L=1. Last visited on 16 October 2014.166 LGA. What are the guarantee limits? Available on: http://www.lga.lv/index.php?id=72&L=1. Last visited on 16 October 2014.
109

days. Although the top three market players for the last three years have covered transactions with longer deferred payments (up to 180 days). The public entities are the dominant players in this segment still, also due to the fact that most private credit insurers do not cover political risks.167
At the same time, since the beginning of the financial crisis, the Latvian commercial banks have become more cautious, financing less the large-scale long-term projects, and following much more conservative risk management and credit policy.168 As evident from the Berne Union statistics, commercial banks tend to be reluctant to finance medium and long term credit risks and political risks, especially to emerging markets (Russia, China, India etc.).169
Where cumulative guarantee volumes issued by LGA have reached EUR 143m, the total amount of short term export credit guarantees issued by December 31, 2013 was EUR 12 m. Average export credit guarantee reached to EUR 125 t for per company (please see Table 35 below).170 The largest amount of guarantees was issued to export transactions with buyers in Russia and Indonesia.171
Table 35: Total supply of guarantees by LGA as at December 2013
Total, EUR mAverage per
company, EUR t
Current assets guarantee 60 364
Export credit guarantee 12 125
Factoring guarantee 1 217
Financial lease guarantee 9 165
Loan guarantee 15 442
Investment guarantee 45 450
Total guarantees 143
Source: LGA, Who use the services. Available on: http://www.lga.lv/index.php?id=45&L=1. Last visited on 21 September 2014.
Figure 48: Distribution of export credit guarantees by sector in Latvia, as of 2013, %
99%
1%
Processing industry Transportation and storage
47%
30%
21%
2%
Large Medium Small Micro
Source: LGA, Annual Report Latvian Guarantee Agency: Financial Instruments for Development. Available on: http://www.lga.lv/fileadmin/dokumenti/LGA_Gada_Parskati/LGA_gada_parskats_2013_ENG_01.pdf, p.6. Last visited on September 13, 2014.
167 Branch, E. Alan. Export practice and Management, 5th edition. London: Thompson Learning, 2006, p.279 168 Bank of Latvia. The Results of July 2012 Survey of Credit Institution Lending to Non-financial Corporations and Households. 2013, p.3 169 Berne Union, Five year trends. Available on: http://www.berneunion.org/bu-total-data.html. Last visited on 12 October 2014.170 LGA, Who use the services. Available on: http://www.lga.lv/index.php?id=45&L=1. Last visited on 21 September 2014.171 LGA, Annual Report Latvian Guarantee Agency: Financial instruments for development. 2014, p.5
110

As per LGA almost the sole sector in Latvian economy seeking for export credit guarantees in the last years was the processing industry. Export credit guarantees were seldom used by micro companies and small and medium companies hold almost a half of the market (please see Figure 48). There is no medium and long term export credit and guarantees available in the Latvian market. However, MLT (medium and long-term) export credit and guarantees is one of the main official activities and support schemes among members of Organization of Economic cooperation and development (OECD) and most of the European Union (EU) member states. This type of official export support in the EU level is regulated by Regulation No 1233/2011 on the application of certain guidelines in the field of officially supported export credits172, which is transferred from the OECD Arrangement on Export Credits173 that provides the framework for the accurate use of officially supported export credits.
Conventional definition of medium-term business is insurance or financing transactions having a credit period of between two and five years and for long-term business, the traditional period is more than five years. These export transactions typically involve capital goods (aircraft, shipbuilding, machinery and similar equipment) and projects (development of telecoms networks, port developments, highways and other infrastructure building projects).
3.8.2 Demand
The demand for export credit guarantees based on the conducted SME survey analysis resulted in an estimated demand of EUR 73-132m in the period 2016-2020 (please see Table 36).
Table 36: Demand for export credit guarantees in Latvia, as of September 2014, EUR m
Micro companies
Small companies Medium companies
Export credit guarantees, EUR m 1 72-131
Total demand for guarantees, EUR m
1 72-131
Source: Calculations based on conducted survey of SMEs;
One should evaluate the results estimated based on survey results with caution, given that, as per interviewed stakeholders, SMEs often are not aware of what financial instruments are most suitable in what circumstances, as well as given the limited size of the sample – both of which factors might have an effect on the results of the survey.
Various Latvian leading industrial sector companies expressed a unified view for the need of existing export credit guarantee programme deployment in the letter by the Mechanical Engineering and Metalworking Industries Association dates dated August 15, 2013. The view underlined the need of inclusion of the medium and long-term transactions with credit period exceeding two years and increased volumes. The key stated reasons for the need for public support are (i) the existing demand
172 The European Parliament and the Council of the European Union. REGULATION (EU) No 1233/2011 OF THE EUROPEAN PARLIAMENT AND OF THE COUNCIL of 16 November 2011 on the application of certain guidelines in the field of officially supported export credits and repealing Council Decisions 2001/76/EC and 2001/77/EC. Official Journal of the European Union, 2011, p.42173 OECD. The Arrangement on Export Credits. Available on: http://www.oecd.org/trade/exportcredits/arrangement.htm. Last visited on 10 October 2014.
111
of foreign markets being primarily in such countries as Russia, Kazakhstan, Georgia, Azerbaijan etc., (ii) requirement of counterparties in provision of state export credit guarantees and (iii) limited ability of Latvian exporters to compete in the foreign markets with the companies that have access to a wider range of risks mitigating financial instruments, including transactions with credit with longer maturity term. Thus, absence of appropriate wide range export credit insurance instruments limits opportunities for export oriented Latvian enterprises to develop.
Moreover, the letter of Latvian Chamber of Commerce to the Prime Minister, Minister of Finance, Economic Affairs and the LGA Chairman of the Board dated as of April 17, 2014 expressed the need for medium and long-term export credit guarantees instruments. Besides, a need for specialized government ECA providing wide range of export insurance tools was identified.
LGA performed questionnaire of the leading exporters, has given an idea on the need for the medium and long-term export credit guarantees. Five companies were interviewed - SIA "L-Ekspresis", AS "VRC Zasulauks" AS "Komforts", AS "SAF Tehnika" and AS "RVR". Interviewed companies produce capital-intensive products and structure their business with the customers through long-term credits.
Table 37: Exporting companies potential transaction profile
Exporter Buyer Buyer's country Transaction Transaction amount
L-Ekspresis Private rail-road operator Russia, Kazakhstan Modernization of wagons ~USD 20 mill.
VRC Zasulauks Azerbaijan railways Azerbaijan Modernization of wagons ~EUR 10 mill.
Komforts Heat supply company Russia, Ukraine, Belarus Manufacture and installation of boilers EUR 1-3 mill.
SAF Tehnika Telecommunication Africa, North America, South America
Wireless data transmission equipment design
~EUR 5 mill. (annual)
RVR Public and private company
CIS, the Caucasus republics, planned the EU and
3.countries
Railway rolling stock modernization and
constructionEUR 6 - 30 mill
Source: Bank of Latvia. The Results of July 2012 Survey of Credit Institution Lending to Non-financial Corporations and Households. 2012, p.3
Table 37 illustrates transactions that could benefit from the introduction of medium and long-term export credit guarantees instruments. As it is seen, transactions’ counterparties are from the third country markets (CIS, Africa, and South America). Exporters reported total transaction amounts range from EUR 1 to 30 million.
3.8.3 Market failure
1. Insufficient supply of long-term focused guarantee schemes
Market stakeholders are mainly focused on short-term transactions (less than 180 days) covering commercial risks. This market segment is also partially covered by factoring services provided by
112

financial institutions.174 Private sector is not active in supporting medium and long-term transactions by issue of guarantees of any kind.
2. Lack of private insurers, offering a wide range of export insurance instruments. Private credit insurers are selective about eligible geographies and sensitive to adverse volatile changes in the market
The private credit insurers providing services in Latvia are part of global insurer groups, which arguably permits these participants to flexibly respond to adverse changes in the market either due to international political risks or other risks by withdrawing from the market or deciding not to service particular sectors. Similarly, credit insurers being driven by the economic factor, provide services in relation to trade with developed countries, while not currently covering credit risks associated with Belarus and Ukraine.175
3. Medium and long-term guarantees not available in the market
Insurance and trading finance services currently available on Latvian market are mostly orientated on transactions with maturity up to 120 days. Even though LGA offers guarantees also for 120-720 days market segment, transactions with longer maturities are leaved out by all market players. As the result banks rarely offer medium and long-term crediting facilities for insufficient insurance covering.176
Even though top three companies have (Euler Hermes, Atradius, Coface) started to cover transactions with deferred payments up to 180 days, the main market players still remains state developed ECAs.177 Besides that majority of private insurance companies do not cover political risks.178
Unlike short-term export credit insurance, which has traditionally been considered private sector insurance business, especially in so called „marketable risk” countries, MLT business still remains „non-marketable”179 and therefore suitable to be addressed by government backed ECAs.180
3.8.3. Market viable gap
Total estimated market viable gap for export credit guarantees is estimated at EUR 14-26m where the whole amount is attributed to medium companies (please see Table 38). Please regard the aforementioned estimated market gap result with caution as the results might be imprecise due to the available information quality that the estimation is based on.
174 Van der Ver, Koen. Private Trade Credit Insurers during the Crisis: The Invisible Banks. World Bank, 2011, p.201-204175 Interview with Māris Lukins, CoFace, 6 October 2014176 Ekonomikas Ministrija. Informatīvais ziņojums „Par priekšlikumiem vidēja un ilgtermiņa eksporta kredīta garantiju ieviešanas modelim”. 2014, p.4177 Van der Ver, Koen. Private Trade Credit Insurers during the Crisis: The Invisible Banks. No: Trade Finance during the Great Trade Collapse. Washington DC, 2011, World Bank, p.201178 Branch, E. Alan. Export practice and Management, 5th edition. London: Thompson Learning, 2006, p.279179 European Commission. Information from European Union Institutions, Bodies, Offices and Agencies. Official Journal of the European Union, 2012.180 International Financial Consulting Ltd. Study on short-term trade finance and credit insurance in the European Union. International Financial Consulting Ltd., 2012, p.53-56
113

Table 38: Estimated market viable gap for export credit guarantees for 2016-2020 program period, EUR m
Unborn companies
Pre-seed
Seed Start-upEmerging growth/
Expansion
Export credit guarantees, EUR m
EUR 0 EUR 0 EUR 14-26 m
Unborn companies
Micro companies Small companies
Medium companies
Total for guarantees, EUR m
EUR 0 EUR 0 EUR 14-26
Source: Calculations based on conducted survey of SMEs;
114

3.9. Venture Capital and Growth Capital
Venture capital firms focus on investing in new born and operating companies characterised by strong technological opportunities and new solutions. Venture capital firms invest in a portfolio of companies, knowing that some will succeed, some will fail and the majority will have average or sub-par performance. On average 65% of a VC investment portfolio generates 3.8% of the returns, while 4% of the portfolio generates more than 60% of the returns (Nanda, 2010).
According to the European private equity and venture capital association (EVCA), venture capital supports companies, which would have had lower growth or would not have been able to survive without it, enabling them to grow and develop. Venture capital investments are those aimed at seed, start-up and later stage venture stages, while growth, buyout investments and rescue/turnaround and replacement capital are categorized as private equity.181
On 17 December 2013 the European Commission adopted a Delegated Regulation (EU) No 694/2014 supplementing Directive 2011/61/EU of the European Parliament and of the Council with regard to regulatory technical standards determining types of alternative investment fund managers. The Regulations differ between open-ended and closed-ended Alternative Investment Fund (AIF).182
Venture capital funds in Latvia are regulated by the law of Financial Instrument Market of the Republic of Latvia, which prescribes the general rules of the financial instrument market, including the venture capital market. Most of the venture capital companies in Latvia are managed under EIF and JEREMIE initiatives.
The Holding Fund administration was initially implemented by the European Investment Fund (EIF), but at the beginning of 2012 it was transferred to the Latvian Guarantee Agency, a limited liability company owned by the State and supervised by the Ministry of Economics of the Republic of Latvia, created to stimulate access to finance through loan schemes, credit guarantees and venture capital financing targeting SMEs.
Venture capital funds making equity investments in SMEs evaluate growth potential of enterprise, the uniqueness of the project, competitors in the field of technologies, solutions, as well as assess the management team and their experience, business plan, revenue model, competitive advantages in the target market segment and likely exit strategy.
As per Latvian Private Equity and Venture Capital Association (LVCA), the tax environment for institutionalized VC funds is prohibiting and creates unfair advantage of informal VC investors as indicated by LVCA (particularly, the effective income tax faced by VC funds being higher than if investment made by an informal venture capitalist; lack of possibility for private investors to write down losses for tax purposes; restricting thin capitalization rules).183 Also, as viewed by the local VC
181 EVCA. Yearbook 2012: Activity Data on Fundraising, Investments and Divestments by Private Equity and Venture Capital Firms in Europe, 2012, p.19182 European Commission, Alternative investments, Available on: http://ec.europa.eu/internal_market/investment/alternative_investments/index_en.htm. Last visited on 10 October 2014183 Letter by LVCA Chairman to Ministry of Finance on „Par nodokļu jomu regulējošo normatīvo aktu saskaņošanu ar alternatīvo ieguldījumu fondu darbību Latvijas uzņēmējdarbībā”, dated 2 July 2014
115

funds,184 the AIFMD EU directive has been adopted with excessive reporting and administrative requirements resulting in an estimated additional cost of ca EUR 50 t per annum.
Taking into account the specifics of venture capital investments, when examining supply, demand and identifying potential market viable gap, needs of innovative and knowledge and technologies-driven companies are considered.
3.9.1. Supply
Performance indicators about the market
As per EVCA venture capital is a three times larger source of funding than growth capital. Buyout investments aimed to acquire control or majority stake form ca 84% of the financial instruments under consideration in the EVCA European market research (please see Figure 49 below).
Figure 49: Distribution of venture capital and private equity in Europe (2007-2013), EUR billion
2007 2008 2009 2010 2011 2012 20130.0
10.0
20.0
30.0
40.0
50.0
60.0
70.0
80.0
90.0
8.3 6.3 3.7 3.2 5.2 3.9 4
58.664.8
10.8 13.4
26.9
16.7
44.9
1.33.6
1.12.6
4.4
0.5
1.2
11.4 5.8
3.3 2.6
5.1
3.4
3.4
Venture Capital Buyout Growth Other (1)
79.680.5
18.9 21.8
41.6
24.6
53.6
Note: (1) Other includes Mezzanine and Generalist funds (fund with either a stated focus of investing in all stages of private equity investment, or with a broad area of investment activity)Source: EVCA. 2013 European Private Equity Activity: Statistics on Fundraising, Investments & Divestments, 2014, p.9.
Rescue/turnaround and replacement capital forms only a small market share 1.0% and 2.1% from the total venture capital and private equity market, respectively.185
184 Interview with Edgars Pigoznis, LVCA, September 9, 2014185 EVCA. 2013 Europe Private Equity Activity: Statistics on Fundraising, Investments & Divestments, 2014, p.30
116

The share of VC investments in Latvia as a % of GDP is lagging behind the European average (0.009% in Latvia compared to a European average of 0.023%), and in 2012 lagging behind Lithuania and Estonia, suggesting that the venture capital market is underdeveloped (European Commission, 2012).
Figure 50: Total VC investment as a percentage of GDP (2007-2012), %
2007 2008 2009 2010 2011 20120.000%
0.010%
0.020%
0.030%
0.040%
0.050%
0.060%
LatviaLithuaniaEstoniaEuropean Union
Source: European Commission, Enterprise and Industry. Available on: http://ec.europa.eu/enterprise/policies/finance/data/enterprise-finance-index/access-to-finance-indicators/venture-capital/index_en.htm. Last visited on 5 September 2014
IESE Business School for the fifth consecutive year is tracking the attractiveness of risk capital around the world. Latvia has jumped 26 places in the Venture Capital & Private Equity Country Attractiveness Index (from 81st place in 2010 to 55th place in 2014).186
Similarly, growth capital investments in Baltic States constitute 0.035% of their GDP (please see Figure 34 below).187 The ratio is comparable to other countries in the CEE region. However, Latvia seems to be lagging behind in terms of volume of growth capital investments (in 2013 in Latvia EUR 2.2 m, while in Lithuania and Estonia EUR 7.2 m and EUR 20.9 m, respectively). 188 Given the confidential nature of the merger and acquisition (M&A) transactions, especially the value of the transactions, the disparity among Baltic countries might be attributable simply to differences in available information about value of transactions that forms the basis of the market size indicator estimated by EVCA.
186 IESE Business School. The Venture Capital & Private Equity Country Attractiveness Index. Available on http://blog.iese.edu/vcpeindex/latvia/. Last visited on October 12, 2014187 EVCA. 2013 Europe Private Equity Activity: Statistics on Fundraising, Investments & Divestments, 2014, p.51188 EVCA. Central and Eastern Europe Statistics 2013, 2014, p.20
117

Figure 51: Growth capital investments in 2013 as a percentage of GDP in Europe, %
United K
ingd
om
Norway
Belgium
Luxe
mbourg
Poland
Portuga
l
Hungary
Baltic c
ountrie
s
Nether
lands
Fran
ce
Swed
en
Euro
pean to
tal
Spain
Finla
nd
Bulgar
ia
Irela
nd
Germ
anyIta
ly
Ukrai
ne
Austria
Swize
rland
Roman
ia
Other
CEE
Czech
Republic
Denm
ark
Greec
e
0.0
59
%
0.0
50
%
0.0
44
%
0.0
42
%
0.0
39
%
0.0
37
%
0.0
37
%
0.0
35
%
0.0
32
%
0.0
28
%
0.0
26
%
0.0
25
%
0.0
23
%
0.0
21
%
0.0
15
%
0.0
14
%
0.0
13
%
0.0
09
%
0.0
09
%
0.0
08
%
0.0
07
%
0.0
07
%
0.0
04
%
0.0
03
%
0.0
02
%
0.0
00
%
% o
f GD
P
Source: EVCA. 2013 European Private equity Activity: Statistics on Fundraising, Investments & Divestments, 2013, p.51
Despite the notable improvement, investors still perceive the lack of strong capital markets, the lack of entrepreneurial opportunities, and economic activity and social environment (see Figure 52 below), which can be attributed to the small size of the economy and the relatively recent and underdeveloped culture of entrepreneurship if compared to Western Europe. Moreover, the value of a typical Baltic M&A deal remains EUR 1-5 m,189 which is considerably below Europe’s average (EUR 281.5 m),190 and which is also related to the small size of Baltic economies in a regional context.
Figure 52: Key drivers of venture capital and private equity attractiveness in Latvia, 2014, (US = 100 points), points
Economic Activity
Capital Market
Taxation
Investor Protection and Corporate Governance
Human and Social Environment
Entrepreneurial Opportunities
0 20 40 60 80 100 120
68.3
32
107.2
77.7
58.7
61.1
69
42
94.8
64.4
67.9
58
Eastern Europe Latvia
Source: IESE Business School. The Venture Capital & Private Equity Country Attractiveness Index. Available on: http://blog.iese.edu/vcpeindex/latvia/. Last visited on 12 October 2014
The neighbouring countries with comparable size and economic development path, namely, Lithuania and Estonia both stand higher in the rankings (43rd and 51st in 2014, respectively).
189 Sorainen, Baltic M&A Deal Points Study 2013. p.19.190 Merger Market. Trend Report, 2014, p. 6.
118

Investors tend to rely on such ratings when making a decision to enter in a new market,191 which partly explains the fact that foreign investors’ capital constitutes merely 5% of the total venture capital funds present in Latvia.192
The average size of a venture capital fund in Latvia was EUR 10.8 m in 2013, which constitutes 35% of that of European venture capital funding (VCF). Prohorovs (2013) research also suggests that among the main reasons for the comparably small size is the country’s low investor appeal related to size of economy, as well as the immaturity of the sector in general.
According to EVCA, in 2013 government agencies represented 38% of total investments into VC funds.193 Approximately 65% of funds invested in venture capital funds were provided by government agencies, while in early 2014 the share of government agencies in Latvian venture capital funds reached 80%.194
High technological risks, lack of professional skills, insufficient own resources, lack of security, unsteady (or negative) cash flow and high business risks are the main obstacles for innovative and technologies-driven enterprises with potential for rapid growth to receive funding. Such companies should be stimulated to invest in most modern equipment to achieve efficiency, productivity and production flexibility. Therefore in the 2007-2013 programming period supply of venture capital funding has been complemented by grants for the implementation of new products into production. The total ERDF funding for the grant scheme amounted to EUR 216 m.
Overview of market participants (venture and growth stage)
Prior to joining the European Union in 2004, there was only one active venture capital fund in Latvia, namely BaltCap. With a goal to stimulate access to venture capital financing and develop the public venture capital framework, the LGA started its work in 2003 and throughout the years implemented nine venture capital funds in three generations. During the 2004-2006 programming period three publicly founded venture capital funds were introduced providing early stage and later stage investments to new born and growing companies (the first generation). During the 2007-2013 programming period additional 6 new publicly founded venture capital funds (fund managers: AIFP Imprimatur Capital Fund Management, BaltCap AIFP, Expansion Capital AIFP, FlyCap AIFP, ZGI Capital) were introduced (the second and third generation).
In their work Vanags, Stasevska and Paalzow (2010) identified 13 venture capital or private equity funds active in the Latvian market, while in 2014 there were 8 active venture capital funds in Latvia.195 Seven of the funds are being co-financed with public funds and only one is solely privately funded, namely, ABLV, which targets later stage venture or private equity stage companies.
The following table lists the funds and investment companies, which are active in Latvia in the investment phase. Additionally, there are two investment companies, namely, Proks capital, and
191 A., Groh, H., Liechtenstein, & K., Lieser., The Global Venture Capital and Private Equity Country Attractiveness Index, 2012.192 A,, Prohorovs. Attraction of Investments into Venture Capital and Private Equity Funds of Latvia, 2013.193 EVCA. 2013 European Private Equity Activity: Statistics on Fundraising, Investments & Divestments, 2014, p.6194 A., Prohorovs, The Volume of Venture Capital Funds of Latvia and Their Financing Sources. China-USA Business Review, ISSN 1537-1514, April 2014, Vol. 13, No. 4, 217-234, p.226 195 A., Vanags, J., Staševska, & A., Paalzow. Venture Capital in Latvia Revisited. Telia Sonera Institute at the Stocholm Schoool of Economics, paper No 9, 7-38, 2010.
119

Dyaltos Capital. It is not uncommon in Latvia for funds or management teams in charge of several funds to be focussing on both later venture capital stage, as well as expansion stage, therefore can be attributable to both VC as well as growth capital.
Table 39: Active VC&PE funds in Latvia as at 2014 [source: LGA and the Ministry of Economics]
Fund management company Name of the fund Fund size Source
of fundsInvestment
focusInvestment
phase end year
Baltcap AIFP, Ltd. Baltcap Latvia Venture Capital Fund
EUR 30 m Private & public
Post-creation / Expansion
End of 2015
Baltcap AIFP, Ltd. Baltcap Private Equity Fund 2
EUR 100 m196
Private & public
Buy-out / Expansion
End of 2020
ZGI Capital, Ltd. ZGI 3 EUR 10.5 m Private & public
Post-creation / Expansion
End of 2015
AIFP Imprimatur Capital Fund Management
Imprimatur Capital Seed Fund
EUR 8.5 m Public Pre-seed / seed
End of 2015
AIFP Imprimatur Capital Fund Management
Imprimatur Capital Technology Venture Fund
EUR 7,4 m Private & public
Seed / Post-creation
End of 2015
Expansion Capital AIFP, Ltd.
Expansion Capital Fund
EUR 10.5 m Private & public
Expansion End of 2015
FlyCap AIFP, Ltd. FlyCap Investment Fund
EUR 10.5 m Private & public
Seed / Post-creation
End of 2015
ABLV Private Equity Management
ABLV Private Equity Fund
EUR 15 m Private Expansion
Livonia Partners KS EuVECA Livonia Partners Fund I
EUR 80 m197 Private & public
Post-creation / Expansion
End of 2020
BPM Capital BPM Mezzanine Fund
EUR 70198 Private & public
Post-creation / Expansion
End of 2020
Karma Ventures Karma Ventures Fund I
EUR 50 m199 Private & public
Seed / Post-creation
End of 2020
Most of the venture capital funds and investment companies, which operate in the venture capital industry in Latvia, are members of the LVCA, which includes 34 members, 19 of which are general partners/fund management companies and 15 representatives of VC&PE supporting industries such as audit and legal service companies. LVCA is an associated member of EVCA.200
196 Pan-Baltic fund supported by the fund of funds Baltic Innovation Fund, therefore assumed that funds will be invested equally among Latvia, Lithuania, Estonia.197 Pan-Baltic fund supported by the fund of funds Baltic Innovation Fund, therefore assumed that funds will be invested equally among Latvia, Lithuania, Estonia.198 Pan-Baltic fund supported by the fund of funds Baltic Innovation Fund, therefore assumed that funds will be invested equally among Latvia, Lithuania, Estonia.199 Nordic fund supported by the fund of funds Baltic Innovation Fund, therefore assumed that 50% of funds will be invested in Baltics, of which equally among Latvia, Lithuania, Estonia.200LVCA, Latvian private equity and venture capital association. Available on: http://www.lvca.lv/en/par-asociaciju/. Last visited on September 16 2014.
120

In addition to the VC/PE funds based in Latvia, some of the more notable regional private equity funds targeting more sizeable deals in the market (deal value EUR 20-30m and above) are the following:201
ENTERPRISE INVESTORS was established in 1990. The fund actively operates in Poland and Central and Eastern Europe (CEE) region with total capital commitment exceeding EUR 2 billion. The fund invests both in venture and private equity capital including buyout.
DARBY PRIVATE EQUITY is an internationally operating private equity fund with local CEE region office in Poland. The fund is investing both in Polish and other CEE economies and currently 11 out of 12 investments are non-Polish. The fund is offering financing in between USD 5 -25 million.
Capital Market (NASDAQ OMX Riga). VC and PE funds realize their profits or cut their losses primarily through sale of their investments. Therefore, sufficient exit options are an essential element for a well-functioning VC and PE market.
NASDAQ OMX Riga is the only regulated secondary securities market in Latvia. The exchange brings together investors, listed companies wishing to gain an access to a host of capital resources and exchange's members, mediating securities transactions of the investors via common electronic trading system. NASDAQ OMX Riga is a self-regulated organisation, issuing and enforcing its own Rules and Regulations consistent with standard exchange operating procedures. NASDAQ OMX Riga is licensed and supervised by the Financial Capital Market Commission.202
The number of initial public offerings (IPO) can serve as one indication of the development of the capital market in the particular country and the attractiveness from VC and PE funds perspective as a viable exit path. In the five-year period 2009-2014 there have been no IPOs in Latvia. 203 In Europe, on the other hand, IPOs as an exit route increased in 2013 more than seven times by amount at cost (EUR 2.2 bn) and almost four times by number of companies (23).204 As confirmed by Daiga Auzina-Melalksne, investment funds, as well as investment banks in Latvia are hesitant to pursue the stock exchange as a divestment route, primarily due to the lack of prior success stories thus creating a vicious circle.205 Though VC funds recognize the difficulties in exiting investments as a result of few exit route options (often non-existent fitting strategic investors locally or regionally, and investment company size too small to interest global strategic investors or regional financial investors), the funds do not seriously consider IPOs in Latvia as a viable exit route before there are success stories to prove the viability.206
Relatively low scores for indicators of stock market development are a direct indication of the potential for financial instruments’ intervention.207
201 Interview with Atra Neimane, Dagnis Dreimanis, Baltcap, 2 September 2014202 Nasdaq, (2014). Nasdaq Riga & Latvian CSD. Available at: http://www.nasdaqomxbaltic.com/en/exchange-information/about-us/nasdaq-omx-riga-3/. Last visited on September 19. 2014.203 NASDAQ, IPO. Available on http://www.nasdaqomxbaltic.com/market/?pg=auctions&ProcedureType=IPO&lang=en¤cy=0&downloadcsv=0&start=13.08.2014&end=13.12.2014. Last visited 20 September 2014204 EVCA. 2013 European Private equity Activity: Statistics on Fundraising, Investments & Divestments, 2014. p.6205 Interview with Daiga Auziņa-Melalksne, Maija Orbidāne, NASDAQ OMX RIGA, September 10, 2014206 Interview with Atra Neimane, Dagnis Dreimanis, Baltcap, September 2, 2014, interview with Normunds Igolnieks, ZGI Capital, August 25, 2014207 European Commission. Ex-ante assessment methodology for financial instruments in the
121

Competition
As observed and suggested in the supply side interviews,208 there is more interest from investors to fund later stage investments instead of early stage (especially pre-seed, seed). Consequently, there is close to no competition in the pre-seed, seed stage segment with Imprimatur Capital being the only formally set up fund. The situation corresponds to the trend throughout, where VC firms have become more risk adverse due to pressures on the industry and have focused on later stage investments.209 If considering the period 2016-2020, the investment period of the currently active major funds is expected to end before the aforementioned 2016-2020 period and stakeholders do not see feasible and do not expect any new funds to be established without public financing support during the period. Thus, it is not unreasonable to expect no formal fund to be active let alone any competition in the pre-seed segment unless public financing is provided, and expected to be close to no funds based in Latvia - the few funds expected to be active in 2016-2020 will have a pan-Baltic focus and with a skewed focus on the later VC stage and expansion stage.
Estimating supply of VC
Venture capital funds
As evident from Table 39, the majority of active funds have the investment period ending at the end of 2014 or 2015, resulting in shortage of funding available for SMEs already in 2015. Even if there are new funds being initiated in 2016, it would take at minimum 12 months to raise the funds until investments can be made.210 The shortage is somewhat compensated by the newly established Baltic Innovation Fund, an investment initiative launched by EIF in cooperation with Lithuania, Latvia and Estonia to boost equity investments into Baltic SMEs with high growth potential, which has already invested in three pan-Baltic equity funds (see Table 30).211 A wave of new funds has appeared on the horizon as a result of Baltic Innovation Fund (BIF – fund of funds) being set up. BIF has also motivated pension funds to co-invest in the funds BIF is investing, as EIF and EBRD being co-investors serves as a type of investment grade indication for the particular fund, which is especially important for the majority of pension funds that don’t have local capacity to evaluate the viability of a particular fund.212
However, the supply needs to be analysed by business development stage. Most of the funds expected to be active during 2016-2020 focus on later venture capital stage (when business has already proven client, revenue traction) and expansion stage, while only one fund is to focus on seed and post-creation stage (pan-Baltic fund by Karma Ventures).Institutional investors
Several of the venture funds have commented about the unwillingness of Latvian pension funds to co-invest in the venture funds. Latvian pension funds have to abide to the threshold of up to 5% of total assets that can be allocated to venture capital type of funds. In comparison, Estonian pension funds can allocate up to 50% of total assets to venture capital type of funds. Therefore, the decision
2014-2020 programming period, Volume 3, 2014, p.26 208 Interview with Atra Neimane, Dagnis Dreimanis, Baltcap, September 2, 2014, interview with Normunds Igolnieks, ZGI Capital, August 25, 2014, interview with Anatolijs Prohorovs, Proks Capital, September 3, 2014209 K.Wilson, F. Silva. Policies for Seed and Early Finance: Findings from the 2012 OECD Financing Questionnaire. OECD, 2013, p.5210 Interview with Atra Neimane, Dagnis Dreimanis, Baltcap, September 2, 2014 211 EIF. EIF in Estonia, 2014, p.1212 Interview with Harijs Švarcs, Swedbank, September 9, 2014
122

of the Latvian Parliament to increase the threshold for investments in VC and PE funds from 5% to 10% (and participation ceiling per fund from 10% to 30%) can be seen as a positive sign. However, the legislation was introduced together with adaptation of the 2011/61/EU AIFMD directive, which has resulted in the increase in ceiling to 10% applicable not just for VC and PE funds but also including other closed funds (such as real estate funds), thus reaching the 10% ceiling is not possible in practice.213
Latvian institutional investors, primarily pension funds, over the time period 2002-2012 have invested merely EUR 51 m in venture capital funds214 in comparison to the pension fund asset value of EUR 1.9 bn as at 2014.215 As seen by the interviewed venture capital funds, until recently the local management of Nordic banks did not take part in making the decision to investing or not in local venture capital funds. That has recently changed, which is also echoed by the interviewed pension funds.216
Leading pension funds (which are managed by largest banks) express growing interest to invest in local venture capital funds, although venture capital funds expect that the increase in supply from institutional investors will be gradual, and not unreasonable to assume at least EUR 10 m per year. 217 The institutional investors will be most likely investing in the funds already expected to be active in Latvia during 2015-2020. One of the leading banks, for instance, has committed above EUR 30m in the funds expected to be moving to investment stage mostly in 2015 (and expected to cover mostly the 2016-2020 period), which is seen as close to the limit of what the bank is able to allocate to VC/PE funds with its current asset base and legislation. The other pension funds active in Latvia are seen as having less appetite to allocate funds to VC/PE, either due to lack of capacity to evaluate locally, or decisions being made abroad (which often means applying unrealistically strict decision making criteria for an underdeveloped VC/PE market as Latvia, where no fund in Latvia would qualify), or perceived excessive risk to invest in local VC/PE funds, or a combination of the above. 218 Interviews with institutional investors and fund managers reveal that institutional investors are uninterested to invest noteworthy amounts in earlier stage funds, are undecided about investing in later stage VC, and prefer to invest in funds focusing on the less risky growth stage.
The main institutional investors are Swedbank, SEB bank, Citadele bank and DNB bank with the following market shares:
Swedbank – 41%; SEB bank – 24%; Citadele bank – 15%; DNB bank – 10.219
213 Interview with Harijs Švarcs, Swedbank, September 9, 2014, interview with Armands Ločmelis, Tarass Buka, DNB Bank, September 16, 2014214 Labklājības ministrija. Informatīvais ziņojums par valsts fondēto pensiju shēmas darbības izvērtējumu, 2012, 9 October 2012215 Manapensija, Actual data. Available on: http://www.manapensija.lv/lv/pensiju-2-limenis/aktualie-dati/. Last visited on 19 September 19 2014216 Interview with Harijs Švarcs, Swedbank, September 9, 2014 and interview with Armands Ločmelis, Tarass Buka, DNB Bank, September 16, 2014217 Interviews with Tobie Moore, Lelde Kļaviņa and Jānis Janēvičs, Imprimatur Capital, August 25, 2014, interview with Atra Neimane, Dagnis Dreimanis, Baltcap, September 2, 2014218 Interview with Harijs Švarcs, Swedbank, September 9, 2014, interview with Armands Ločmelis, Tarass Buka, DNB Bank, September 16, 2014219 Interview with Armands Ločmelis, Tarass Buka, DNB Asset Management, September 16, 2014
123

Private investors
Besides the publicly visible capital funds there are high net worth individuals, who have invested and are likely to invest in early or later stage businesses privately. These resources should be accounted for when quantifying equity supply, however the amounts are difficult to quantify. In light of absence of publicly available statistics, an alternative indication is given by local investment experts, who suggest that there is a supply of funding from individuals for venture capital investments in the range of EUR 30-42 m,220 which coincides with the view of LVCA.221 However, even if the individual investors are willing to invest in early stage businesses, the possibility of demand and supply to meet is hindered by the typical characteristics of private investors. Private investors either don't have the necessary experience or expertise applicable for the business, or they attempt to mitigate the increased risks associated with an early stage business by requiring preconditions (i.e., minimum required return of funds invested, majority shareholding, and evidence of business potential) that reduce the likeliness of the investment commencing. Moreover, private investors often have a capacity to invest in 2-5 businesses in comparison to VC fund teams managing a portfolio of 10-20 investments.222 Private investors typically prefer to see early stage businesses exhaust the available early-stage funding options (grants, soft-loans) that would allow to create a prototype, to produce a market research and protect intellectual property through patents in case of invention.223
Grant scheme for the implementation of new products into production
When considering investments in innovative equipment, enterprises face several obstacles - lack of own capital, insufficient collateral or guarantees and being overleveraged. Venture capital and growth capital investments are substantial source of funding for innovative and technologies-driven new and operating companies, however not all companies are having qualities, which venture capitalists are seeking for, while others are not willing to rise capital by giving away shares of the company. Relating the commercial bank sector (see sub-section 3.5) banks typically require at least 30% co-financing for the project, what new and innovative companies cannot meet. Therefore, to complement supply of venture capital and growth capital investments a grant scheme for the implementation of new products into production will be implemented in the end of 2015 providing funding for production equipment. Commercial banks are using scoring system in the evaluation process of projects and counts grants in the level of co-financing for the project; thereof, availability of grants makes it easier to meet the capital requirements of commercial banks and to access required funding for the implementation of innovative projects. Additionally the availability of grants will accelerate creation of innovative companies, technologically advanced production facilities, demand for R&D services and VC instruments.
220 Balticexport, Riska kapitāla apjoms Latvijā - 20-30 miljoni latu. Available on http://balticexport.com/?lang=lv&article=riska-kapitala-apjoms-latvija-20-30-miljoni-latu. Last visited on 17 September 2014221 Edgars Pigoznis estimates that couple of tens of million euros of non-institutional investors capital available for late VC or growth stage investments in Latvia (Interview with Edgars Pigoznis, LVCA, September 9, 2014)222 Interview with Andris K.Bērziņš, Tech Hub Riga, August 26, 2014 223 Interview with Anatolijs Prohorovs, Proks Capital, September 3, 2014, interview with Edgars Pigoznis, LVCA, September 9, 2014
124

Summary of VC and growth capital supply 2016-2020
Figure 53: Expected supply of equity for SMEs in Latvia by business development stage, 2016-2020, EUR m (excluding management fee)
Source: Calculations based on argumentation in this section
Supply of equity funding (largely venture capital) available for SMEs during 2016-2020 is estimated at EUR 155-167 m, however the funding is skewed towards the later stage VC and expansion stage. In fact, there seems to be no equity supply to be available for pre-seed stage (if assume that private investors primarily consider investing in seed stage and later in development).
3.9.2. Demand
For funding the initial phase of a business equity financing (venture capital, private equity) is the most suitable form of financing and in many cases the only one available to entrepreneurs. Self-financing, another viable option, most likely cannot finance development of a product ready for the market since the amount of funding needed to develop a technology-based product is estimated on average to be ten to twenty times greater than the initial R&D expenditure to launch or further develop their idea or business.224 Debt financing (such as bank loans) usually requires collateral. For start-ups, in particular in technology - based fields, this might be difficult or even impossible to provide. Furthermore, the bank or lender also requires information about the borrower and about the business as such. In the case of new technologies, the bank or other lender might have difficulty in assessing the potential of the technology or business model as such. Stock market flotation requires that the company has already developed to a fairly large scale.225
The initial phase of business, where equity is the most suitable form of financing, also differs considerably by each stage of business development. If expansion stage businesses have established themselves and often seek financing for market expansion or penetration or new product development, then pre-seed, seed and post-development stage businesses face higher risks,
224 Bank of England, Quarterly Bulletin: The financing of technology-based small firms: a review of the literature, 2001, p.66225 K. Avots, R. Strenga and A. Paalzow. Baltic International Centre for Economic Policy Studies jointly with Stockholm School of Economics in Riga. Baltic Journal of Economics. No. 1, vol. 13. 2013, p.4
125

uncertainties and therefore need these risks to be addressed to be able to grow to the next level. The earlier stage of the start-up, the more critical the non-financial investment becomes. As per Sørensen (2007), the ability to bring in managerial advice or other types of non-financial investment (smart money) is becoming increasingly important as it increases the probability of a successful investment.226 Lerner (2002, 2009) suggests that there can be “performance-undermining factors” associated with public venture capital including a weaker screening and evaluation process, and public venture capitalists being less likely to bring in managerial advice or take part in the operations of the start-up.74
However, it is doubtful that there would be any notable VC presence in Latvia was it not for the public support, as released during the interview with the most established VC team in Latvia, namely Baltcap.227 The limited ability of VC funds in Latvia to provide notable non-financial investment (i.e. smart money) is rather attributable to the small Latvian market, which cannot facilitate adequate specialization228 (and thus affects also the screening process229), as well as the limitations imposed by the management fee level in relation to the time to be invested helping each funded start up.230 Therefore, the promising emerging start-ups in absence of the needed non-financial support are either being abandoned by founders or are more likely to fail before reaching the next stage of development, or a few succeed raising funding abroad. The view is supported by one of the founders of the leading start-up ecosystem TechHub Riga. Andris Berzins suggests that the financing sources available become scarcer the earlier a start-up is in its stage of development, but more importantly the VC funds are unable to provide the non-financial support crucially needed, primarily because VC teams in Latvia rarely include experienced serial entrepreneurs or start-up founders. The need for non-financial support plays an especially important role, because there is limited start-up experience to be found in Latvia and only in recent years increasing number of successful start-up cases.231
A positive trend is recent years is the increasing publicity that start-ups receive in local media (please see Figure 54 below), which is the required ingredient to inspire the forming of new start-ups, as confirmed by Andris Berzins, TechHub Riga, and Dagnis Dreimanis, Baltcap.
226 K. Avots, R. Strenga and A. Paalzow. Baltic International Centre for Economic Policy Studies jointly with Stockholm School of Economics in Riga. Baltic Journal of Economics. No. 1, vol. 13. 2013, p.7227 Interview with Atra Neimane, Dagnis Dreimanis, Baltcap, September 2, 2014 228 Interview with Atra Neimane, Dagnis Dreimanis, Baltcap, September 2, 2014 229 Interview with Normunds Igolnieks, ZGI Capital, August 25, 2014230 Interview with Tobie Moore, Lelde Kļaviņa and Jānis Janēvičs, Imprimatur Capital, August 25, 2014231 Interview with Andris K.Bērziņš, Tech Hub Riga, August 26, 2014
126

Figure 54: Frequency of “start-up” mentions in Latvian media, 2008-2014
1st Q
uart
er (J
an-M
arch
)
2nd
(Apr
-Jun
)
3rd
(Jul
-Sep
)
4th
(Oct
-Dec
)
1st Q
uart
er (J
an-M
arch
)
2nd
(Apr
-Jun
)
3rd
(Jul
-Sep
)
4th
(Oct
-Dec
)
1st Q
uart
er (J
an-M
arch
)
2nd
(Apr
-Jun
)
3rd
(Jul
-Sep
)
4th
(Oct
-Dec
)
1st Q
uart
er (J
an-M
arch
)
2nd
(Apr
-Jun
)
3rd
(Jul
-Sep
)
4th
(Oct
-Dec
)
1st Q
uart
er (J
an-M
arch
)
2nd
(Apr
-Jun
)
3rd
(Jul
-Sep
)
4th
(Oct
-Dec
)
1st Q
uart
er (J
an-M
arch
)
2nd
(Apr
-Jun
)
3rd
(Jul
-Sep
)
4th
(Oct
-Dec
)
1st Q
uart
er (J
an-M
arch
)
2nd
(Apr
-Jun
)
3rd
(Jul
-Sep
)
2008 2009 2010 2011 2012 2013 2014
0
5
10
15
20
25
Nr o
f arti
cles
Source: approach: the archives of leading Latvian media (TVnet, Delfi, Diena, Dienas Bizness, Apollo) were searched for keywords “startup” or “jaunuzņēmums” and identified articles were grouped by data of publication
Start-up ecosystems
The trend of increasing publicity received by start-ups coincides with the establishing and growth of the few start-up ecosystems in Latvia, namely, TechHub, Eegloo, Commercialization Reactor and Mill Riga. Figure 55 below illustrates the growing number of resident members in each of the ecosystems. The importance of these establishments is illustrated by the fact that Imprimatur Capital, the only VC fund focussing on the early stage start-ups, has invested in 10% of TechHub residents (7), 20% of Eegloo residents (3), and 50% of Commercialization Reactor graduates (12), while there is lack of start-ups of comparable quality found at the regional business incubators.232 Coincidently, only the latter are publicly funded. These ecosystems to most extent have been established as a result of enthusiasm of few individuals, but their growth into the next stage of development is fragile due to uncertain, unstable or non-existent funding source to support their activities.233
232 Interview with Tobie Moore, Lelde Kļaviņa and Jānis Janēvičs, Imprimatur Capital, August 25, 2014 233 Interview with Andris K.Bērziņš, Tech Hub Riga, August 26, 2014
127

Figure 55: Number of residents in emerging start-up ecosystems in Latvia, 2011-2014
Dec-1
1
Jan-1
2
Feb-1
2
Mar
-12
Apr-12
May
-12
Jun-1
2Ju
l-12
Aug-12
Sep-1
2
Oct-12
Nov-12
Dec-1
2
Feb-1
3
Mar
-13
Apr-13
May
-13
Jun-1
3Ju
l-13
Aug-13
Sep-1
3
Oct-13
Nov-13
Dec-1
3
Jan-1
4
Mar
-14
Apr-14
May
-14
Jun-1
40
10
20
30
40
50
60
70
80
90
100
Techhub The MillEegloo Commercialization reactor
Source: data obtained from TechHub Riga, Mill Riga, Eegloo, Commercialization reactor
Below is an overview of main ecosystems emerged in recent years.
TechHub Riga
TechHub Riga is a community and workspace for tech entrepreneurs, which helps start-ups to develop faster by nurturing an international network of tech entrepreneurs. TechHub Riga has already managed to create several successful new start-ups in Latvia that have collectively raised over EUR 2.5 m in external funding during the last two years.234
Eegloo
An IT oriented incubator that intends to create 5-8 new start-ups with obtained EUR 200 000 in funding. The Eegloo is a young incubator, launched in May 2013 with 6 residents in it: BuzzTale, BranchTrack, ScoreFellas, Wire.as, MyM.io, and Snapkin.235
Commercialization reactor
Commercialization reactor organizes networking events and provides environment facilitating creation of technology intensive start-ups through matching CIS scientists with other necessary competences available in Latvia for commercializing the invented technologies. Commercialization reactor focuses on nano, bio, green, security and other high technologies.236
Mill Riga
Mill Riga was founded in April 2014 primarily by start-ups graduating from TechHub with an aim to facilitate co-working and meeting for newly founded companies with design focus. It was created by
234 Techhub, We help startups get better, faster. Available on: http://www.techhub.com/. Last visited on 4 September 2014235 Eegloo, (2014). Available at: http://blog.eegloo.net/. Last visited on September 4, 2014.236 Commercializationreactor, Points you should know about commercialization reactor. Available on: http://www.commercializationreactor.com/about-us/learn-more. Last visited on 4 September 2014
128

a number of enterprises – “Hungry Lab”, “Berta CMS”, “Froont, “Sellfy”, and investment companies – “Beanstalk Capital”, “Imprimatur Capital” and “Inventure”.237
Draugiem Group
Draugiem is an established local social network business, the management of which is supporting or actively creating various start-ups and form a unique ecosystem closely tied to the Draugiem business. Some of the start-ups: “Startup Vitamins”, “Printful”, “behappy.me“.238
Demand trend 2016-2020
Latvia has had few success stories that can be held up as examples that innovation and entrepreneurship are valued and needed activities in society. The above mentioned ecosystems have greatly contributed to emergence of local start-up success stories, which have in turn sparked increasing interest among youth to develop start-ups,239 providing increasing financing demand pressure particularly in the pre-seed, seed stage. Increasingly start-ups are seeking financing abroad despite the difficulties due to size and lack of traction,240 which is attributable to the fact that there are few funding options to choose from locally.241 Smart money is even more difficult to find,242 although local VC funds try to mitigate the lack of specific competence by insourcing particular competence from abroad (though for later VC and expansion stage).243 Another indication of increasing demand is the increase in ecosystem memberships, increasing start-up stories coverage in local media (as noted above), but also the increasing pipeline of VC funds for pre-seed, seed stage.244
The line between VC funding and growth capital funding is blurred, given the trend of VC funds shifting focus on later VC stage or growth stage. Consequently, it is unfeasible to estimate the supply of growth capital. As per a prior study, it is estimated that only 10% of investments in Latvia by private investors are invested in VC funds. The remaining 90% are invested primarily in more liquid investment instruments and also private equity, though there are no exact statistics available. 245 The fact that growth stage investments are often funded in combination with debt financing provided by banks246 further complicates the estimation of growth capital supply.
237 Mill Riga, (2014). Available at: http://millriga.com/. Last visited on September 4, 2014.238 Draugiem Group. Available on: http://www.draugiemgroup.com/en. Last visited on 4 September 2014239 Interview with Andris K.Bērziņš, Tech Hub Riga, August 26, 2014 240 Interview with Normunds Igolnieks, ZGI Capital, August 25, 2014241 Interview with Normunds Igolnieks, ZGI Capital, August 25, 2014242 K. Avots, R. Strenga and A. Paalzow. Baltic International Centre for Economic Policy Studies jointly with Stockholm School of Economics in Riga. Baltic Journal of Economics. No. 1, vol. 13. 2013, p.11243 Interview with Atra Neimane, Dagnis Dreimanis, Baltcap, September 2, 2014 244 Interviews with Toby Moore, Lelde Kļaviņa and Jānis Janēvičs, Imprimatur Capital, August 25, 2014245 A., Prohorovs. Attraction of Investments into Venture Capital and Private Equity Funds of Latvia, 2013, p.9.246 Interview with Atra Neimane, Dagnis Dreimanis, Baltcap, September 2, 2014
129

3.9.3. Findings / Market failure of VC funding
VC and growth capital market failures
Financial market imperfections arise mostly due to information asymmetries. Venture capital firms partly reduce the information asymmetry problems, which often cause market failures, by intensively scrutinising firms before providing capital and monitoring them afterwards.247
Below is a summary of the identified venture capital market failures.
1. Underdeveloped and unattractive VC market
The share of VC investments in Latvia as a % of GDP is lagging behind the European average and Lithuania and Estonia.248 The underdeveloped VC market results in a vicious circle, whereas emerging business founders are either not aware of VC as a viable and sound source of funding, are not aware of many success stories of VC funded businesses, and thus the potential demand is less likely to meet the small but present supply of VC funding.
There have been significant improvements in the perceived attractiveness of Latvia by VC/PE firms (from 81st place in 2010 to 55th in 2014), however that has not yet translated into a notable influx of VC or PE capital. The most important factors adversely influencing Latvian market attractiveness are primarily capital markets, economic activity and entrepreneurial opportunities, which translates into lack of interest among international VC funds to establish presence in Latvia, having to rely on local investors and public funding support to develop venture capital market.
2. Lack of incentives for institutional investors to invest in local VC funds
Local sources of VC funding (mostly pension funds) constituted merely 4% of total venture funds, indicating a lack of institutional investor funding.249 There is evident unwillingness of Latvian pension funds to co-invest in the venture funds,250 which is partly attributable to the lack of locally present competence and experience of institutional investors to be able to evaluate allocating part of assets by investing in VC/PE funds,251 but partly also to the legislation providing obstacles to invest more in VC funds. Until recently Latvian pension funds had to abide to the threshold of up to 5% of total assets that can be allocated to venture capital type of funds. The Parliament has recently approved lifting the 5% threshold to 10%, however simultaneously introduced adoption AIFMD directive has resulted reaching 10% ceiling not possible in practice252 until the legislation is fixed to prescribe the original intentions. One of the stakeholders is suggesting that political pressure towards some of the leading banks has proved to be effective and should be increased to all pension funds in order to encourage investing the pension fund assets locally.
247 Hall, B. H., & Lerner, J. The financing of R&D and innovation. Handbook of the Economics of Innovation, 2010, p. 27248 European Commission. Enterprise and Industry. Available on: http://ec.europa.eu/enterprise/policies/finance/data/enterprise-finance-index/access-to-finance-indicators/venture-capital/index_en.htm. Last visited on 22 September 2014249 A.Prohorovs, Riska kapitāla piesaistīšana Latvijas ekonomikā.2013, p.24250 Interview with Atra Neimane, Dagnis Dreimanis, Baltcap, September 2, 2014, interviews with Tobie Moore, Lelde Kļaviņa and Jānis Janēvičs, Imprimatur Capital, August 25, 2014251 Interview with Harijs Švarcs, Swedbank, September 9, 2014252 Interview with Harijs Švarcs, Swedbank, September 9, 2014, interview with Armands Ločmelis, Tarass Buka, DNB Bank, September 16, 2014
130

3. Legislation providing excessive barriers to set up and run VC funds
The already relatively unattractive and underdeveloped VC market further development is hindered by unfavourable tax treatment and administrative burden as a result of adopting the AIFMD directive. Tax environment for institutionalized VC funds is prohibiting and creates unfair advantage of informal VC investors as indicated by LVCA (particularly, the effective income tax faced by VC funds being higher than if investment made by an informal venture capitalist; lack of possibility for private investors to write down losses for tax purposes; restricting thin capitalization rules). 253 As viewed by the local VC funds,254 the AIFMD EU directive has been adopted with excessive reporting and administrative requirements resulting in an additional cost of ca EUR 50 t per annum as estimated by LVCA, which is particularly restrictive given the relatively small size of funds (average size of VC funds of Latvia is EUR 10.8 m compared to EUR 43.2 m in Europe), and therefore administrative capacity of Latvian VC funds.255
4. Trend of VC funds shifting focus to later stage investments
Venture capital is commonly assumed to be the main source of seed and early stage financing but, in reality, in Europe the majority of venture capital firms have moved to later stage investments leaving the seed and early stage market to “informal” investors.256 A similar outlook is evident in Latvia, where VC funding during 2016-2020 is expected to be available primarily for later VC stage and expansion stage, but there is a shortage of interest to fund early stage start-ups (please see Table 55 above). The preference for later stage, when companies have demonstrated traction, is indicated also by numerous VC funds257 as a way to mitigate business risk. Also in Europe overall VC firms have become more risk adverse due to pressures on the industry and have focused on later stage investments, leaving an expected market viable gap in pre-seed, seed and post-creation stages for 2016-2020.
5. Simultaneous public financing of SMEs directly and indirectly through intermediaries hinders development of indirectly supported intermediaries
As indicated by VC funds tend to compete with banks and private investors, but increasingly and to a significant extent with direct forms of public financing (grants, subsidized mezzanine financing by state owned LGA, ALTUM programs), resulting in businesses choosing the grants or financing products offered directly by LGA and ALTUM as they are offered on more favourable terms thus becoming less expensive than the partly publicly supported VC funding.258 Grants for SMEs in Latvia (similarly as in Europe) have been widely used in the past and they have surely been successful in generating an increase in production, however the positive impact on productivity should be
253 Letter by LVCA Chairman to Ministry of Finance on „Par nodokļu jomu regulējošo normatīvo aktu saskaņošanu ar alternatīvo ieguldījumu fondu darbību Latvijas uzņēmējdarbībā”, dated 2 July 2014254 Interview with Edgars Pigoznis, LVCA, September 9, 2014 255 A. Prohorovs. The Volume of Venture Capital Funds of Latvia and Their Financing Sources. China-USA Business Review, No. 4, vol. 13., 2014, p.229256 K.Wilson, F. Silva. Policies for Seed and Early Finance: Findings from the 2012 OECD Financing Questionnaire. OECD, 2013. p.9257 Interview with Atra Neimane, Dagnis Dreimanis, Baltcap, September 2, 2014, interview with Normunds Igolnieks, ZGI Capital, August 25, 2014, interview with Edgars Pigoznis, LVCA, September 9, 2014258 Interview with Atra Neimane, Dagnis Dreimanis, Baltcap, September 2, 2014, interview with Normunds Igolnieks, ZGI Capital, August 25, 2014,
131

evaluated259. Supply side stakeholders have suggested that there is a widespread “grant sickness”, whereas availability of grant financing becomes a distraction from focussing on clients and building business, and becomes even as a perceived form of revenue, but also VC funding not being able to compete with the much cheaper financing option of grants.
6. Lack of businesses exhibiting strong potential requiring financing
Although VC funds foresee the pipeline of companies seeking financing to remain stable,260 or gradually growing,261 the management of same VC funds see a lack of attractive companies in their pipeline and in the market in general convincingly exhibiting high growth potential. The main explanations identified: too few success stories for entrepreneurs to be inspired by, lack of entrepreneurial culture, lack of experience entering international markets, lack of exposure to entrepreneurship as a viable career option (which is likely to become a barrier to innovation and economic growth,262 resulting in inexperienced teams lacking entrepreneurial experience, and basic corporate governance understanding in general).263 Given the increasing number of start-ups (please see Figure 38 above) and start-ups becoming an increasingly discussed topic in local media (please see Figure 37 above), possibly, the reason for the lack of quality supply throughout the development stages can be traced back to too many business ventures not surviving the first valley of death at seed, pre-seed and post-creation stage264 implying a need for early stage non-financial support. The result is a vicious circle of inferior demand, and underdeveloped supply especially in relation to the pre-seed, seed, post-creation stages of development.
7. Small scale limits providing smart money
As suggested by Gualandri (2008), the role played by venture capital operators during the initial stages of the firm’s growth cycle is crucial in providing expertise in a series of areas, as well as financial resources, during the stages where the risk of failure is high.265 As per a previous study,266 Latvian venture capital fund managers lack the competence to understand the product or business idea. In general public venture capital funds in Latvia are perceived as bringing in dumb money, i.e. not bringing in any competence to the start-up. Perhaps it is an overstatement. However, there are indications that VC funds are unable to sufficiently provide the needed competence and non-financial investment in businesses seeking funding in Latvia, especially given the absence of international entrepreneurial experience and tradition among Latvian entrepreneurs; such as the small average size of VC funds (EUR 10.8m),267 which limits the team competence that can be accumulated and time
259 the assessment (sub-section 2.3.) provides an evaluation and comparison of results of grants for the implementation of new products into production and venture capital investments on business performance indicators (changes in net turnover, assets, the number of employees are evaluated); results of grants and venture capital investments are mixed.260 Interview with Atra Neimane, Dagnis Dreimanis, Baltcap, September 2, 2014, interview with Normunds Igolnieks, ZGI Capital, August 25, 2014,261 Interviews with Tobie Moore, Lelde Kļaviņa and Jānis Janēvičs, Imprimatur Capital, August 25, 2014 262 K.Wilson, F.Silva, Policies for Seed and Early Finance, OECD, 2013, p.48263 Interview with Edgars Pigoznis, LVCA, September 9, 2014264 Interview with Andris K.Bērziņš, Tech Hub Riga, August 26, 2014 265 E., Gualandru, V., Venturelli. Assessing and Measuring the Equity Gap and the Equity Requirements for Innovative SMEs. CEFIN Working Paper No. 7, p.5266 K.Avots, R.Strenga, A.Paalzow, Public venture capital in Latvia. Baltic Journal of Economics, 2013267 A. Prohorovs. The Volume of Venture Capital Funds of Latvia and Their Financing Sources. David Publishing, 2014, No. 4, vol. 13. Available at: http://www.davidpublishing.com/davidpublishing/Upfile/8/27/2014/2014082766752297.pdf. Last visited on September 18, 2014.
132

that can be allocated per investment,268 or the VC fund management lacking the needed entrepreneurial background and experience to coach business founders they have invested in.269 The lack of experience on both supply and demand side results in reduced level of trust.270 The result is a likely information asymmetry in terms of being able to identify viable businesses with high-growth potential, and inability to provide sufficient non-financial investment in the portfolio companies.
The scarcity of professional fund management limits creation of new funds and institutional investors.271
8. Stock market underdeveloped to serve as an exit option
Among the six factors considered by VC/PE funds in the international IESE Business School VC/PE market attractiveness index, the capital markets as a factor received the lowest mark, suggesting an underdeveloped capital market.272 For instance, in UK Initial Public Offerings (IPO) on a public market (i.e., Alternative Investment Market in UK, or First North in Latvia) is a favoured exit route to VC/PE funds.273 With few exceptions VC/PE funds in Latvia are not considering Riga Stock Exchange NASDAQ as a viable exit route for their investments due to the lack of successful cases of listing, and lack of liquidity.274 Consequently, VC funds are left with seeking other later stage VC funds internationally or strategic investors for exit. However, often the business size or development stage at the time VC funds are contemplating exit is premature for international strategic investors or VC funds to seriously consider acquiring,275 thereby creating challenges for exiting otherwise successful and growing businesses.
9. Investment selection exposed to rush to spend risk
The level of complexity of EU regulations276 or the lack of experience in managing JEREMIE Holding Funds277 led to significant delays in programme implementation, thus facing the risk of investment plan not being fulfilled or risking investments being made in ventures with questionable growth potential (in relation to VC funds required to complete investment stage by end of 2015, but also possibly relating to the programming period 2016-2020 in case the selection process is delayed).
10. Lack of alternative financing instruments for early stages
268 Interviews with Tobie Moore, Lelde Kļaviņa and Jānis Janēvičs, Imprimatur Capital, August 25, 2014269 Interview with Edgars Pigoznis, LVCA, September 9, 2014, interview with Andris K.Bērziņš, Tech Hub Riga, August 26, 2014, interview with Anatolijs Prohorovs, Proks Capital, September 3, 2014270 Interview with Atra Neimane, Dagnis Dreimanis, Baltcap, September 2, 2014, interview with Normunds Igolnieks, ZGI Capital, August 25, 2014, interview with Edgars Pigoznis, LVCA, September 9, 2014271 Interview with Harijs Švarcs, Swedbank, September 9, 2014 interview with Armands Ločmelis, Tarass Buka, DNB Bank, September 16, 2014272 IESE Business School. The Venture Capital & Private Equity Country Attractiveness Index. Available on: http://blog.iese.edu/vcpeindex/latvia/. Last visited on October 12, 2014273 BIS. SME Access to External Finance, 2012, p.35274 Interview with Daiga Auziņa-Melalksne, Maija Orbidāne, NASDAQ OMX RIGA, September 10, 2014, interview with Atra Neimane, Dagnis Dreimanis, Baltcap, September 2, 2014275 Interview with Atra Neimane, Dagnis Dreimanis, Baltcap, September 2, 2014276 Interview with Andris Liepiņš, Ministry of Economics, September 10, 2014 277 European Commission, Expert evaluation network delivering policy analysis on the performance of Cohesion policy 2007-2013 Year 2 – 2012 Task 2: Country Report on Achievements of Cohesion policy: Latvia. 2012
133

Companies in early stages, both for start-up, as well as “family” business segments experience a lack of interest to be financed due to the increased commercial risk, as well as administrative cost as a barrier. Crowdfunding is being considered as a potential solution. One of the reasons crowdfunding is promising is that there are opportunities of bridging these capital gaps once it becomes possible for a larger number of investors to play in the early stage start-up financing market with more flexible models.278
There are few crowdfunding platforms in Latvia (namely, mecenats.lv and idejuarmija.lv, the latter launched in August 2014), which are yet to see the critical mass of projects to be funded and financial backers. The success of crowdfunding for early stage companies is likely to depend on the screening and rating infrastructure that comes together to tackle non-financial heuristics in determining fundability at scale.279
3.9.4. Market viable gap
Given the laid out analysis based on stakeholder interviews as well as suggested by a previous study,280 there is a market viable gap for equity instruments for the different development stages, especially the earlier stages, which cannot be met by private sector.
Having relied on responses to the SME survey, as well as stakeholder interviews, the estimated market viable gap for venture capital and growth capital for 2016-2020 is summarized below and totals EUR 294-538 m.
278 Harvard Business Review. HBR Blog Network. Available on http://blogs.hbr.org/2013/07/can-crowdfunding-solve-the-sta/. Last visited on 25 September 2014279 Harvard Business Review. HBR Blog Network. Available on http://blogs.hbr.org/2013/07/can-crowdfunding-solve-the-sta/. Last visited on 25 September 2014280 European Commission, Expert evaluation network delivering policy analysis on the performance of Cohesion policy 2007-2013 Year 2 – 2012 Task 2: Country Report on Achievements of Cohesion policy: Latvia. 2012
134

Table 40: Market viable gap for VC and growth capital in Latvia, 2016-2020 by SME segment, EUR m
Unborn companies
Pre-seed Seed Start-up
Emerging growth/
Expansion
Venture capital, EUR m 64-118 208-381
Growth capital, EUR m 21-38
Unborn
companies Micro Small Medium
Total, EUR m 64-118 208-381 21-38
Source: Calculations based on conducted survey of SMEs;
3.9.5. Lessons learned
Small size of funds affects the ability to retain a strong and competent management team, but also limits the ability to fundraise funds for investments. A larger size of funds or funds of funds (similar to Baltic Innovation Fund) would result in higher economies of scale and more positive impact on the VC industry.281
Given that there is often more than one shareholder in a target company, and often shareholders’ view on future growth path differs, Baltcap sees a need to allow financing ca 25% of the investments to support buy-out of part of existing shareholders. Also, various sectors are often highly fragmented in Latvia, therefore often the primary growth objective to be able to compete with the more sizeable competition in the region is consolidation. As per Baltcap, permitting financing sector consolidation, where such strategy is likely to provide best growth prospects for the sector, should be considered.282
281 Interview with Atra Neimane, Dagnis Dreimanis, Baltcap, 2 September 2014282 Interview with Atra Neimane, Dagnis Dreimanis, Baltcap, 2 September 2014
135

3.10. Technology Transfer Financing
Technology transfer (TT) can be broadly defined as transformation of scientific findings into marketable products and services.283 EIF identifies three main channels available to convert scientific findings to the marketplace: (1) spin-outs – the creation of new companies that proceed in development of the research; (2) collaboration between universities, research organisations and industry; and (3) licensing of IP that includes also patenting (please see Figure 56 below).284
Figure 56: Main channels of technology transfer
Source: J.Darcy, H.Kraemer-Eis, et al. Financing technology transfer. EIF, 2009, p. 10.
3.10.1. Innovation performance
R&D spending
Finland, Germany, Denmark and Sweden are named as the innovation leaders in Europe by the European Union Innovation Scoreboard 2014. Meanwhile Bulgaria, Latvia and Romania are lagging behind. Latvia’s innovation performance level is less than 50% of the EU average (please see Figure 57 below).285 Spending on R&D activities by countries leading in innovation constituted 2.8-3.5% of GDP (majority of which financed by private sector), while it is only 0.6% of GDP in Latvia (primarily funded with public funds) – please see Figure 41 below. Latvian budgetary provisions on R&D activities measured as a share of Government budget appropriations or outlays for research and development (GBAORD) to GDP was 0.15% in 2011 compared to 0.7% in EU-27.286 In addition, the public financing of R&D has decreased during 2008-2012 at an average rate of 15% per year. 287 283 EIF, Technology Transfer : Converting Research into Products for the Market. Available on: http://www.eif.org/what_we_do/equity/technology_transfer/index.htm. Last visited on September 19, 2014.284 EIF. Financing technology transfer. 2009. p. 20285 European Commission. Innovation Union Scoreboard 2014. 2014, p.11.286 Eurostat, Science, technology and innovation in Europe 2013 edition, European Commission, 2014, p.12287 European Commission. Communication аrom the Commission to the European Parliament, the Council, the European Economic and Social Committee and the Committee of the Regions Research and Innovation as Sources of Renewed Growth, Brussels, COM(2014) 339 final, p.4
136
Collaboration(contract research)
Licensing
Spin-out
‘Prototype IP’
Marketable ProductR&D
‘Technology IP’
Technology transfer
University/Research
organizationIP/ Idea
Market

Despite the past trend there is a more positive outlook – governmental R&D expenditure is expected to increase to 0.78% of GDP by 2020.288
Figure 57: EU Member States innovation performance, as of 2012, points
BG LV RO PL LT HR MT SK HU EL PT ES CZ IT CY EE SI EU FR AT IE UK BE NL LU FI DE DK SE0.000
0.100
0.200
0.300
0.400
0.500
0.600
0.700
0.800
Modest innovators Moderate innovators Innovation followers Innovation leaders
Source: European Commission, Innovation Union Scoreboard 2014. 2014, p.11
Figure 58: Public and private R&D intensity in 2012 in the Member States, EU, and third countries, %
Finland
Denmark
Austria
France
Estonia EU
United Kingdom
LuxemburgSpain
Italy
Poland
Slovakia
Greece
Bulgaria
RomaniaJapan
China0.00
0.50
1.00
1.50
2.00
2.50
3.00
3.50
4.00
4.50
Public expenditure on R&D as % of GDP Business enterprise expenditure on R&D as % of GDPPrivate non-Profit expenditure on R&D as % of GDP R&D intensity target 2020
%
Source: European Commission. Communication from the Commission to the European Parliament, the Council, the European Economic and Social Committee and the Committee of the Regions Research and Innovation as Sources of Renewed Growth, Brussels, COM(2014) 339 final, p.4.
288 I., Kurzemniece, (2013). Esošās situācijas izvērtējums pētniecībā un attīstībā, p.5
137

Patent applications
EIF indicates that one proxy for the growth in the TT market is growth in number of patent applications. Latvian growth rate of patent applications was higher than the one presented by the innovation leaders in 2012 (please see Figure 59 below), however in absolute numbers there is a stark difference if compared with EU countries leading in innovation. (365 patent applications in 2012 – 2-3% of the number of patent applications by EU countries leading in innovation).289
Figure 59: Growth rate of patent applications, 2008-2012, %
Denmark Finland Germany Latvia Sweden
-40%
-30%
-20%
-10%
0%
10%
20%
30%
40%
2009201020112012
Source: WIPO, Patents. Available on: http://ipstats.wipo.int/ipstatv2/ipstableval. Last visited on 25 September 2014
Talent pool
Qualified personnel with scientific, technological and entrepreneurial skills are key prerequisites for innovation.290 Highly qualified, but ageing community of scientists and entrepreneurs with technical education in Latvia is a positive legacy of Soviet Union period, and there is also emerging a highly skilled young generation of scientists. There is evident a generation gap in between the younger and older generation.291 The other ingredient crucial for commercializing R&D is entrepreneurs. Latvian business community can be characterized by absence of technical education, as a result of which technology intensive business ideas are seldom recognized and developed by entrepreneurs.292
3.10.2. Supply
The share of innovative SMEs increases gradually with the size of the SME companies, however the focus of this section is on early stage ventures as they are the most deprived of capital needed to finance the innovation, given that larger firms have access to funding, manufacturing and distribution capacities.293
289 WIPO, Statistical country profile: Latvia. Available on: http://www.wipo.int/ipstats/en/statistics/country_profile/countries/lv.html. Last visited on 14 September 2014290 D.Gagliardi, et al. A recovery on The horizon? Annual report on european SMEs 2012/2013. European Commission, 2013, p.54291 Interview with Nikolajs Adamovičš, Commercialization Reactor, September 11, 2014 292 Interview with Nikolajs Adamovičš, Commercialization Reactor, September 11, 2014293 J.Darcy, H.Kraemer-Eis, et al. Financing technology transfer. EIF, 2009. p.8
138

Estimating supply
Private investors tend to be cautious to invest in pre-seed stage, when there is little evidence of the market potential of the scientific discovery or innovation.294 As suggested by Nikolai Adamovitch representing Commercialization Reactor, the supply of private investor funding can be considered as non-existent for pre-seed and seed stage, or the investors are willing to provide financing at terms mitigating the excessive risks, which often results in founders not agreeing to terms. Though the preference for later stage is observable among institutional investors as well (as discussed in Section 3.8), the main institutionalized early stage technology intensive enterprise (or business idea) funding sources available in Latvia are:
1. Investment and Development Agency of Latvia (LIAA) providing funding in the form of grants. As commented by Nikolai Adamovitch representing Commercialization Reactor, the previously available pre-seed funding (to finance limited research of product market fit) for technology start-ups in the amount of EUR 7 t was a well-intended program, but restrictive in terms of eligibility and application process, hindering an active use of the instrument;
2. Imprimatur Capital providing soft loan financing of EUR 50 t, focussing on both ITC sector, as well as technology intensive start-ups (to finance market research and further develop the prototype).
EIF plans to launch a fund focused on technology and tech-enabled businesses in the Baltic States in 2015 with ca 20% of funds for seed investments. The fund is expected to invest in ca 12-15 companies with average investment amount of EUR 1-5 m and up to 20 companies with investment amount of up to EUR 500 t.295
3.10.3. Demand
Latvia offers several innovation and technology centres as platforms for high-tech SMEs’. Innovative SMEs need funding at the initial stages – pre-seed and seed.
The following list provides a short overview of market participants – platforms available for innovative SMEs.
Commercialization Reactor
Commercialization Reactor is focused on convergence of entrepreneurs and scientists. The aim is to create investment ready technology start-ups. The offered program is specifically designed for earliest stage technology ventures (or idea stage). It is a mixture of mentoring, experience sharing, technology assessment and business model design sessions. In addition to focussing on Latvian science community, Commercialization Reactor attracts foreign scientists, primarily from CIS countries, to attend the events organized by Commercialization Reactor.296 Latvia is an attractive
294 Interview with Juris Birznieks, LatBan, 9 September 2014, interview with Nikolajs Adamovičš, Commercialization Reactor, 11 September 2014, interview with Normunds Igolnieks, ZGI Capital, 25 August 2014; also see Figure 56 in Section 3.8.1295 Communication with Janis Jansons, EIF, September 29, 2014296 Commercializationreactor, Points you should know about commercialization reactor Available on: http://www.commercializationreactor.com/about-us/learn-more. Last visited on 4 September 2014
139

location for scientists from CIS and entrepreneurs to establish a venture, given the access to markets of developed economies being an EU member in combination with lack of cultural and language barriers.297
Estimating demand for 2016-2020
It is not unreasonable to assume that in the upcoming years 50-70 high-tech companies will emerge per year, exhibiting a viable and global business potential.298 At pre-seed stage such a company would require up to EUR 7 t to finance limited and primary product market fit research and assess business potential, which would allow to attract further stage financing.299 The resulting pre-seed stage TT demand for the four years 2016-2020 is estimated at EUR 1.96 t.
The number of technology intensive new ventures requiring seed financing (to finance more detailed market research, contacting market participants, as well as further developing the prototype) is estimated at up to 40 enterprises per year with a financing need of EUR 50 t per each company.300 The resulting seed stage TT demand for the four years 2016-2020 is estimated at EUR 8 m.
3.10.4. Findings / Market failure of TT financing
TT market failures
Please see below a summary of the identified TT market failures.
1. Low interconnectedness between scientist and entrepreneurs
The insufficient knowledge transfer between public research institutions and third parties, including industry, has been identified by the EC as one of the key areas to improve across Europe, 301 and Latvia is not an exception. A university (as opposed to a corporate) laboratory usually does not have the skills and incentives to transform the invention into an innovation.302 There are few technology intensive ventures at an early or later stage that are part of the pipelines of the key investors in the market as suggested in interviews with market participants,303 which is attributable to scientists seldom teaming up with entrepreneurs to form ventures.304
2. Lack of supply to finance pre-seed, seed stage technology intensive ventures
297 Interview with Nikolajs Adamovičš, Commercialization Reactor, September 11, 2014298 Interview with Nikolajs Adamovičš, Commercialization Reactor, September 11, 2014 299 Interview with Nikolajs Adamovičš, Commercialization Reactor, September 11, 2014, interview with Juris Birznieks, LatBan, September 9, 2014300 Interview with Nikolajs Adamovičš, Commercialization Reactor, September 11, 2014, interviews with Tobie Moore, Lelde Kļaviņa and Jānis Janēvičs, Imprimatur Capital, August 25, 2014 301 J.Darcy, H.Kraemer-Eis, et al. Financing technology transfer. EIF, 2009. p. 10302 J.Darcy, H.Kraemer-Eis, et al. Financing technology transfer. EIF, 2009. p. 10303 Interview with Atra Neimane, Dagnis Dreimanis, Baltcap, September 2, 2014, interview with Normunds Igolnieks, ZGI Capital, August 25, 2014, interviews with Tobie Moore, Lelde Kļaviņa and Jānis Janēvičs, Imprimatur Capital, August 25, 2014, interview with Nikolajs Adamovičš, Commercialization Reactor, September 11, 2014304 Interviews with Tobie Moore, Lelde Kļaviņa and Jānis Janēvičs, Imprimatur Capital, August 25, 2014. interview with Nikolajs Adamovičš, Commercialization Reactor, September 11, 2014
140

TT is investment intensive area that has a high risk associated with it, 305 whereas especially academic research is by private sector considered to be 'too new' or 'too high-risk'. Consequently, there are constrains on the transfer of academic research out of the laboratory and attraction of funding from traditional investors.306 Given that private investors are reluctant to finance pre-seed, seed stage especially technology intensive ventures, and the fact that Imprimatur Capital managed EUR 50 t seed stage soft-loan fund investment period is likely to expire by the end of 2015, there are no notable market participants identified that are expected to finance TT in 2016-2020.
3. Lack of smart money
Besides the lack of supply for TT in the market, there is also lack of technical expertise among institutional investors due to the small market size and resulting inability to finance specialized technical competence within the teams. Consequently, the few technology start-ups that do reach market traction stage and require next stage financing (post-production, late VC stage), are often not considered for investment due to costly or impossible verification of the market potential due to lack of specific technical expertise.307
4. Insufficient size of economy to generate substantial pipeline of TT enterprises
The small size of economy affects the academic research financing in absolute amounts, which consequently limits the size of the scientific community, and limits the number of TT enterprises that can emerge from within the market. As an example, Commercialization Reactor has addressed the issue by attracting scientists from CIS and beyond to connect with entrepreneurs locally.308
5. Inability to shift to debt financing
Innovative projects are investment intensive. This limits ability of SMEs to use self-financing option. Moreover, it usually puts constrains on the attraction of debt financing of innovative start-ups. Usual reason is the absence of collateral or track-record to offset the risk associated with the financing.309
3.10.5. Market viable gap
The technology transfer funding gap arises between the point where government and philanthropic funds begin to run out, but the technology’s risk profile still discourages VC and licensing investments.310 Market viable gap analysis is based on stakeholders' interviews, analysis of historical demand and supply of funding and forecasts.
In absence of notable supply identified for pre-seed, seed stage, the implied market viable gap for early stage TT ventures for the period 2016-2020 is EUR 9.96 m (pre-seed stage: EUR 1.96 m; seed stage: EUR 8 m).
305 European Commission. Financing technology transfer & Seed finance Discussion document for the workshops, 2006, p.6.306 EIF, Technology Transfer : Converting Research into Products for the Market, Available at: http://www.eif.org/what_we_do/equity/technology_transfer/index.htm, Last visited on September 14, 2014.307 Interview with Normunds Igolnieks, ZGI Capital, August 25, 2014, interview with Atra Neimane, Dagnis Dreimanis, Baltcap, September 2, 2014308 Interview with Nikolajs Adamovičš, Commercialization Reactor, September 11, 2014 309 European Commission. Financing technology transfer & Seed finance Discussion document for the workshops. 2006, p.7310 J.Darcy, H.Kraemer-Eis, et al. Financing technology transfer. EIF, 2009. p.14
141

3.11. Business Angel Financing
Financing of Research Development Technology and Innovation (RTDI)-driven projects or companies through Business Angels (BAs) is another key contributor in the supply of capital to SMEs. The European Trade Association for Business Angels, Seed Funds and Early Stage Market Players (EBAN) defines BAs as “knowledgeable private individuals, usually with business experience, who directly invest part of their personal assets in new and growing unquoted businesses”. BAs investments are predominantly medium or long-term and focus on seed or start-up companies, thus often providing the supply of capital for a stage of development that is not yet mature enough for VC funds. 311 (Please see Figure 60 below). Besides purely financial contribution, BAs often provide strategic support to entrepreneurs by sharing business management experience provided the possession of such relevant experience.312 BAs investments are focused on pre-seed and seed stages with high uncertainty of potential future growth.
Figure 60: Equity investors at the seed, early and later stage of firm growth
Source: OECD, Financing High-Growth Firms: the Role of Angel Investors, p. 34
BAs offer a number of advantages compared to VC funds, such as: (1) lower transaction costs that allows investing on a lower scale, (2) greater geographical dispersion, and (3) ‘hands-on’ approach to making investments facilitating faster transaction process.313
The majority of BAs invest alone in contrast to the approach of VC funds often co-investing with a number of other funds. Gradually in Europe the popularity of BA networks is growing and BAs start to combine private investments with investments through networks, thus being able to diversify their investment risks.314
3.11.1. Supply
Europe has experienced growth in number of BA networks during the last decade and reached around 468 in 2013,315 while in Latvia the first noteworthy business angel network formed in 2014 as
311 EIF, H., Kraemer-Eis, F.Lang. Guidelines for SME Access to Finance Market Assessments (GAFMA), Working Paper 2014/22, p.25312 EBAN, Business angel. Available on: http://www.eban.org/glossary/business-angel-ba/#.VBmd3ZSSxqU. Last visited on 16 September 2014.313 EIF, H., Kraemer-Eis, F.Lang. Guidelines for SME Access to Finance Market Assessments (GAFMA), Working Paper 2014/22, p.28314 OECD, Financing High-Growth Firms: The Role of Angel Investors, 2011, p. 32315 EIF, H., Kraemer-Eis, F.Lang. Guidelines for SME Access to Finance Market Assessments (GAFMA), Working Paper 2014/22, p.29.
142
Market viable gap

a result of The Latvian Business Angel Network (LATBAN) being established. LATBAN brings together experienced entrepreneurs – BAs - who are willing to invest their savings in new, high-growth potential ventures. The goal of LATBAN is to organize and expand the activity of BAs in Latvia and to help fund promising new ventures by organizing pitch events that bring together BAs and entrepreneurs.
Despite the lack of public statistics or track record of a formalized BA network, Juris Birznieks representing LATBAN estimates that there are expected to be possibly ca 100 BAs in Latvia during the time period 2016-2020.316
EIF is often a key supporter of early stage investments in Europe, varying the approach depending on the level of availability and activity of BA financing. For Latvia, where there are few ‘serial’ BAs, a co-investment fund approach might be applied. Such practice already exists in Lithuania since 2010. Co-investment projects of EIF were recently launched also in Germany, Austria and Spain.317
OECD estimates that volume of investment of BAs is in the range between EUR 15 t to 400t. 318 EBAN statistics indicates that the average amount invested per company decreased over the past three years to EUR 166t in 2013.319 Another study suggests a range of BAs funding per company between EUR 10-100 t in Latvia,320 which is in line with the estimate suggested by Juris Birznieks representing LATBAN of investment per venture of up to EUR 100 t, and every investor ready to make such an investment every two years. Multiplying the estimated 100 BAs by EUR 100 t and two times in the time period 2016-2020, the implied available supply of BAs in the period is up to EUR 20 m. From the one hand there is the theoretical supply, from the other – the supply meeting the demand asks for having an established one-point contact for reaching the supply. As at 2014 LATBAN is a 30 business angel organization, thus limiting easy accessibility of the available supply.
While LATBAN attempts to unite BAs in a network and organizes pitching events, there is similarly one notable organization that primarily focuses on the demand side and educates entrepreneurs and matches to investors. Since 2003 a private initiative called CONNECT Latvia has started its activities providing assistance for entrepreneurs to find financial, technical and business development resources needed to create and develop high-growth companies. By organising activities and offering advice, CONNECT supports and improves the opportunities for entrepreneurs and start-ups.
CONNECT is a network of private and public organisations primarily in the area of knowledge and technology intensive sectors and service providers.
The first CONNECT network was started in 1985 at the University of California, San Diego, on the initiative of the local business community. The network started to expand in the Baltic States in 2001 with the primary objectives of stimulating co-operation and economic development in Baltic States. In the following two years CONNECT Estonia and CONNECT Latvia were found in spring 2002 and February 2003 respectively.
316 Interview with Juris Birznieks, LatBan, September 9, 2014317 Communication with Janis Jansons, EIF, September 29, 2014318 R.Pelly, H.Kramer-Eis. Creating a Better Business Environment for Financing Business, Innovation and Green Growth. 2011, p.3319 EIF, H., Kraemer-Eis, F.Lang. Guidelines for SME Access to Finance Market Assessments (GAFMA), Working Paper 2014/22, p.29.320 K., Avots, R., Strenga, (2013). “Does the Money Meet the Ideas? Evaluation of Public Venture Capital in Latvia”, p.41
143

CONNECT’s main activities are:
1. Springboards – it is a panel of experts that provide entrepreneurs with practical advice for their business activity. Springboards represent the core of CONNECT’s activities;
2. Financial Forum – it is a meeting place for start-ups seeking VC and investors looking for portfolio companies;
3. Partnership Forum – it is a meeting place for start-ups, potential strategic partners within the same or a related fields, and investors;
4. Publications – CONNECT publishes booklets which offer entrepreneurs and start-ups guidance on important matters.
There are possible new funds expected to fundraise in 2015 with focus on early-stage investments in the Baltics. The target size of the investment funds is expected to be up to EUR 50 m, where 60% would address investments in seed stage and 40% – early-stage companies, and an estimated average financing volume of ca EUR 5 m per company for 10 to 40% of ownership.321
3.11.2. Demand
Estimating demand for 2016-2020
As per Juris Birznieks representing LATBAN, the total number of start-ups with sufficiently global ambition and profile fitting BAs is around ca 500 new projects per year (requiring pre-seed and seed stage financing). Out of the ca 500 only ca 100 are deemed to be viable for BAs to seriously consider investing in. The average amount of required investment is estimated on average EUR 100 t. 322 The resulting pre-seed and seed stages financing demand that could be addressed by BA financing for the four years 2016-2020 is estimated at EUR 40 m. The estimated demand for BA financing might be higher taking into account foreign business angels, that various pitch events try to attract for matching with entrepreneurs (e.g. CONNECT). Also, part of BAs prefer to stay anonymous, 323 therefore it is possible that the aforementioned estimate is understated.324
3.11.3. Findings / market failure of BAs financing
BAs market failures
1. Limited access to BAs due to lack of networks uniting BAs
The accessibility of BA financing is hindered by lack of formalized BA networks, which would allow entrepreneurs to more easily approach BAs for financing instead of relying on personal connections. As a result entrepreneurs are deprived of BA as a viable financing option unless a BA is accessible
321 Communication with Janis Jansons, EIF, September 29, 2014322 Interview with Juris Birznieks, LatBan, September 9, 2014 323 H.Kraemer-Eis, F.Lang. Guidelines for SME Access to Finance Market Assessments (GAFMA), Working Paper 2014/22, EIF, 2014. p.28.324 CSES, Evaluation of EU Member States’ Business Angel Markets and Policies Final report. 2012, p.18.
144

through the personal network of the particular entrepreneur. There is positive development, most notably the formation of LATBAN BA network in 2014 with the financial support of LGA. This also is reflected in the fact that there are few ‘serial’ BA with an established track record in Latvia.325
2. Reluctance to invest due to lack of investing experience
Only a fraction of experienced entrepreneurs in Latvia, who would be able to provide the necessary guidance for young entrepreneurs, and who have residual income to be allocated for investing, are active BAs in Latvia due to the lack of investing experience.326 Lack of investing experience makes it more difficult to evaluate an investment opportunity, structure the transaction, and offer attractive investment terms to the entrepreneur. LATBAN is planning to deconstruct these obstacles by providing education to the BAs that are members of LATBAN. Without investors becoming more educated, more investing experience accumulated and shared within the BAs community, the existing supply will hardly satisfy the demand. Another factor limiting appetite to invest is the unpractised diversification of investments through co-investing, which is mostly attributed to the yet underdeveloped network of BAs and lack of successful BA co-investment cases in the local market.327
3. Regional incubators seldom produce start-ups attractive for BAs
Regional incubators, which are funded by public financing and support start-ups by covering costs of outsourced services, introduce an adverse incentive for entrepreneurs. At a stage in venture development when it is most crucial to focus on satisfying client needs and strengthening the team, subsidizing outsourced services disincentives resolving business issues from within by strengthening the team and the availability of cheap outsourced services often serves as a distraction factor away from generating revenue purely from customers.328 As a result, BAs see the mind-set of such entrepreneurs affected to the extent (lack of focus on customer, team, but instead reliance on grants) that the entrepreneurs seem to be unable to reverse the thinking that is required to develop a high growth potential start-up.329
4. The quality of pitches to BAs are often below par
The interest to invest in a start-up is often significantly affected by the first impression BAs obtain from entrepreneurs pitching the business idea. The lack of practiced presentation skills, knowledge of the expectations of investors, and inability to convey an ambitious vision, and a sense that the team is passionate about the vision; all of these factors are often at play at pitching events to BAs in Latvia and adversely affect the positive decision to invest in a team.330 On the other hand the emerging start-up co-working spaces, such as TechHub, serve as a positive environment for start-ups to absorb the best practices of successful start-ups in Latvia, practice presentation skills and strengthen teams by networking with other successful start-ups.
325 Communication with Janis Jansons, EIF, September 29, 2014326 Interview with Juris Birznieks, LatBan, September 9, 2014327 Interview with Juris Birznieks, LatBan, September 9, 2014328 Interview with Andris K.Bērziņš, Tech Hub Riga, August 26, 2014, interview with Juris Birznieks, LatBan, September 9, 2014 329 Interview with Juris Birznieks, LatBan, September 9, 2014330 Interview with Juris Birznieks, LatBan, September 9, 2014
145

5. Limited options to exit investments
BAs mostly evaluate investment opportunities by the expected return on their investment, most often realized through exit in the subsequent rounds of investment at further development stages. Given the underdeveloped VC market and, moreover, the preference of existing investors to focus on late stage venture capital or even private equity stage (discussed in Section 3.8), the limited exit opportunities reduce the attractiveness of an investment opportunity being considered by BAs in Latvia.
3.11.4. Market viable gap
The BA financing demand is estimated at EUR 40 m, while supply estimated at EUR 20 m, resulting in an implied market viable gap for early stage ventures seeking BA funding for the period 2016-2020 of EUR 20 m (in relation to pre-seed and seed stages). However, the available supply sufficiently meeting the available demand is subject to the market failures being addressed (i.e. established network of BAs that entrepreneurs are aware of; sufficient investing experience of BAs; sufficient quality of start-ups and ability to present the idea).
146

3.12. Mezzanine Financing
Mezzanine facility is a ‘hybrid’ instrument as it combines debt and equity characteristics. Mezzanine financing is a debt instrument that has an intermediate priority in the capital structure of a company. Usually mezzanine financing has a lower priority than senior debt, but a higher interest rate and often includes warrants.331
Figure 61: Mezzanine facility
Source: C.Silbernagel, D.Vaitkunas. Mezzanine Finance. Bond Capital, 2012, p. 2.
Common forms of mezzanine finance include subordinated loans, participating loans and equity-related mezzanine instruments such as convertible bonds and bonds with warrants.332
Mezzanine finance is often used as expansion capital and is used to facilitate the financing of buyouts.333 In venture capital a mezzanine round is generally the round of financing that is designed to help a company have enough resources to reach an IPO.334 Thus, most of the mezzanine volumes are used to finance medium and large companies as well as finance organic growth, e.g. working capital. Mezzanine as a financing instrument is often welcomed by entrepreneurs not willing to accept dilution of their private equity investment. However, despite its importance as injector of liquidity into the economy, this type of financing is often viewed as an expensive form of debt. 335 Returns on mezzanine finance are higher than those on senior debt, but lower than those on equity as a risk profile.336 Average rate of return from mezzanine financing is between 11 and 25%. Interest rates for loans are estimated to be in range of 10-15%. Return requested by equity investors, in its turn, above 25%.337 However, in Latvia it is not uncommon to see private investors offering
331 EVCA, 2013 Pan-European Private Equity Performance Benchmarks Study.2014, p.25332 OECD, Alternative Financing Instruments for SMEs and Entrepreneurs: the Case of Mezzanine Finance. 2013. p.6333 EVCA. 2013 Pan-European Private Equity Activiy: Statistics on Fundraising, Investments & Divestments, 2014, p.9334 EVCA, 2013 Pan-European Private Equity Performance Benchmarks Study.2014, p.25335 H.Kraemer-Eis, F.Lang. Guidelines for SME Access to Finance Market Assessments (GAFMA), Working Paper 2014/22, EIF, 2014. p.39. 336 C.Silbernagel, D.Vaitkunas. Mezzanine Finance. Bond Capital, 2012, p.6337 C.Silbernagel, D.Vaitkunas. Mezzanine Finance. Bond Capital, 2012, p.6
147
Mezzanine
Equity
Redeemable preferred stock
Convertible subordinated debt
Senior subordinated debt
Senior debt & asset backed (stretch) lending

mezzanine loans to companies not having access to bank financing in the range of 20-40% per annum.338
3.12.1. Supply for mezzanine finance
Mezzanine funds constituted 22% of total funds raised in Central and Eastern Europe in 2013 with a total amount of EUR 150 m.339
In Latvia mezzanine financing is provided by the following stakeholders:
- LGA (publicly funded),
- BPM Capital (publicly funded),
- Private investors, Capitalia, VC funds at times structuring deals as mezzanine loans.
LGA is operating under Minister Cabinet Regulation No.241 adopted in 13 May 2014 “Regulations Regarding Mezzanine Loans for improving the Commercial Activity Competitiveness of Merchants”. Mezzanine finance offered directly by LGA has the following characteristics:
- Long-term mezzanine loan up to EUR 5 m; or
- Working capital mezzanine loan up to EUR 200 t;
- Loan shall not exceed 40% of the costs of the project;
- Maximum length of the mezzanine loan term is 10 years.340
LGA has started mezzanine financing program in 2011 and has distributed mezzanine financing in the amount of EUR 7,9 m as at end of 2013, primarily to SMEs (80%), and companies operating in processing industries.341
BPM Capital has received EUR 15 m funding from Baltic Innovation Fund (the total fund size – EUR 70 m) to fund high growth small and medium sized companies. Planned investment size per company is EUR 3-15 m. The fund (BPM Mezzanine fund) has closed fundraising on January 2015 and has started the investment period.
CAPITALIA also offers mezzanine financing as a long-term financing instrument targeting to finance investment projects, mergers and acquisitions and restructuring transactions. Mezzanine finance terms include investment volumes between EUR 50-200 t with maturity of one to five years for companies with at least half a year operating history.342
338 Interview with Anatolijs Prohorovs, Proks Capital, 3 September 2014339 EVCA. Central and Eastern Europe Statistics 2013, 2014, p.20340 LGA, Purpose of the Mezzanine Loan. Available on: http://www.lga.lv/index.php?id=55&L=1. Last visited on 25 September 2014341 LGA, Annual Report 2013: Latvian Guarantee Agency Financial instruments for development. 2014, p.5.342 CAPITALIA, Long term capital for companies. Available on: http://www.capitalia.lv/en/financing/mezzanine-loan. Last time visited on 23 September 2014.
148

3.12.2. Demand for mezzanine finance
The survey results do not provide details in adequate depth to be able to reliably estimate demand for mezzanine financing. As noted by the Chamber of Commerce as well as banks, mezzanine finance availability as an instrument is viewed positively, however SMEs seem to be both insufficiently informed about mezzanine financing as an option and the circumstances in which such financing is most suitable.343
3.12.3. Market failure specific to mezzanine finance
1. Low debt coverage ratio
The provision of mezzanine capital in form of long term unsecured, subordinated debt will target those companies having sufficient operating history and low debt coverage ratio. Additionally, the scheme will target those companies, not willing to obtain risk capital investments due to the dilution of shares or financial intermediaries participation in the company’s management structure.
2. SMEs insufficiently informed about mezzanine financing
SMEs seem to be insufficiently informed about mezzanine financing as an option and mezzanine funding sources, possibly attributable to it being relatively recently introduced to the market. Also, as a result SMEs are insufficiently knowledgeable in what circumstances such financing is most suitable.344 Banks have expressed the view that SMEs are often unaware of the differences between various financing instruments, including mezzanine, even if the particular SMEs are aware of such financing instrument as mezzanine.345 Thus, one can conclude that it might be not uncommon that SMEs, which are in need of financing and particularly mezzanine financing as the most suitable or only option, do not apply and request mezzanine financing due to the aforementioned information gap.
3.12.4. Market viable gap of mezzanine finance
The conducted SMEs survey results do not provide details in adequate depth to be able to reliably estimate the market viable gap for mezzanine financing. The interviewed stakeholders, as discussed above, have voiced that there is a profound need in the market for mezzanine financing and it can well address some of the lending market failures, such as insufficient co-financing, collateral or fully utilized capacity of senior debt borrowing. The interviewees have similarly commented that SMEs are not active enough in applying for mezzanine financing, possibly attributable to not being aware of mezzanine financing as an option and its sustainability.
343Interview with Janis Butkevics, LTRK, 6 October 2014, interview with Karlis Danevics, SEB bank, 24 September 2014344Interview with Janis Butkevics, LTRK, 6 October 2014, interview with Karlis Danevics, SEB bank, 24 September 2014345 Interview with Karlis Kronbergs, Valters Abele and Agita Nicberga, Citadele, 2 October 2014
149

3.12.5. Lessons learned
Banks saw mezzanine financing as a much needed instrument targeted at a segment of insufficient collateral or co-financing (segments that banks traditionally are reluctant to finance).346
346 Interview with Karlis Danevics, SEB bank, 24 September 2014, Interview with Vadims Frolovs, Dace Kalnciema, Aivars Rupeiks and Ilze Kukute, Swedbank 29 September 2014
150

3.13. Rescue and Restructuring Financing
Rescue/turnaround and replacement capital forms only a small market share 1.0 % and 2.1 % from the total venture capital and private equity market, respectively.347
Even though EVCA categorise rescue/turnaround and replacement capital are as private equity, 348 there is not a single financial instrument that is suitable in all circumstances for rescue of a distressed company.349 Though some market participants representing supply are at times considering financing a distressed company, there are no market participants solely specializing or focussing on financing distressed enterprises.350
The conducted SME survey reveals that ca 3 % of companies (3 % for micro and 3 for small companies) have indicated that need to refinance existing debts, which might be the indication for inability of a company to serve the loan. However, the survey does not provide insight as to how many of these companies can be considered as non-viable businesses, and how many are temporarily in a distress situation due to adverse and volatile market changes (either due to political risks or other risks beyond the control of the enterprise). Therefore, it is not feasible to quantify the market gap for rescue and restructuring financing.
External political and economic situation, especially recently imposed Russian import restrictions, is having influence on the SMEs, their financial stability and liquidity. It is important to support temporary liquidity problems and for SMEs demonstrating long term economic viability to avoid social hardship or market failure.
According to the European Commission Guidelines on State aid for rescuing and restructuring non-financial undertakings in difficulty there is a concern in relation to SMEs that value may be destroyed when SMEs that have the potential to restructure so as to restore their long-term viability are denied the chance to do so by liquidity problems. The failure of the beneficiary should at the same time involve social hardship or a market failure, in particular that:
(a) the exit of an innovative SME or an SME with high growth potential would have potential negative consequences;
(b)
the exit of an undertaking with extensive links to other local or regional undertakings, particularly other SMEs, would have potential negative consequences;
(c) the failure or adverse incentives of credit markets would push an otherwise viable undertaking into bankruptcy; or
(d)
similar situations of hardship duly substantiated by the beneficiary would arise.
347 EVCA. 2013 Europe Private Equity Activity: Statistics on Fundraising, Investments & Divestments, 2014, p.30348 EVCA. Yearbook 2012: Activity Data on Fundraising, Investments and Divestments by Private Equity and Venture Capital Firms in Europe, 2012, p.19349 Interview with Klavs Vasks, LGA 9 October 2014350 Interview with Atra Neimane, Dagnis Dreimanis, Baltcap, September 2, 2014
151

3.13.1. Market failure specific to rescue and restructuring financing
1. Private sector providing financing is sensitive to adverse changes in the market or company financials
SMEs are reliant on bank lending and other forms of financing to facilitate growth, as they often lack the financial resources to fund their growth and volatilities in business cycle.351 Private sector financing institutions such as banks, leasing providers, credit insurers are sensitive to adverse changes in the market. SMEs suggest that there are cases of some market participants responding to adverse market changes by temporarily not financing entire sectors of economy. 352 For instance, credit insurers provide services in relation to trade with developed countries, while not currently covering credit risks associated with Belarus, Ukraine, and Russia.353 As a result of adverse changes in the market, the company financials are likely to suffer. Given that the credit rating system employed by the leading banks relies primarily on financial indicators indicating financial stability, liquidity and viability354, companies experiencing temporary financial distress are likely not to pass such credit rating test and thus have no access to additional financing required to alleviate the distressed circumstances and be able to restructure operations and recover.
351 The Economist, Don’t bank on the banks. Available on: http://www.economist.com/news/finance-and-economics/21612251-small-businesses-seek-alternatives-banks-leave-them-lurch-dont-bank. Last visited on 23 September 2014.352 Interview with Janis Butkevics, LTRK, 6 October 2014353 Interview with Māris Lukins, CoFace, 6 October 2014354 Interview with Vadims Frolovs, Dace Kalnciema, Aivars Rupeiks and Ilze Kukute, Swedbank 29 September 2014
152
3.14. Summary
Analysis of the conducted SME survey in combination of the stakeholder interviews and available statistical data has resulted in the estimated total market viable gap for financial instruments for SMEs in Latvia. Please see Table 41 for a summary.
Financial allocation to financial instruments in the programming period 2014 – 2020 is based on the assessment findings and taking into account market failures identified in the assessment and considering actual demand and payments made for financial instruments in the 2007-2013 programming period. The allocation of EU funding will be review on 2018 if changes in demand and supply will be detected.
Table 41: Allocation of total market viable gap for financial instruments in Latvian SMEs sector,EUR m
Equity instruments Unborn companies Pre-seed Seed Start-up
Emerging growth/
Expansion
Venture capital, EUR m 64-118 208-381
Growth capital, EUR m 21-38
Business angels, EUR m 20
Technology Transfer, EUR m 2 8
Unborn
companies Micro Small Medium
Total equity instruments, EUR m 94 -148 208-381 21-38
Debt instruments Unborn companies Pre-seed Seed Start-up
Emerging growth/
Expansion
Microfinance for companies that did not apply, EUR m
162 - 182
Microfinance for companies that have applied but did not obtain, EUR m
1-2
Short-term loans, on demand, EUR m 13-23 122-223 13-24
Medium and Long-term loans, EUR m 85-156 156-285 9-16
Leasing, EUR m 23-42 25-46 7-13
Factoring, EUR m 10-18 64-117 33-60
Guarantees, EUR m 1 95-174 5-10
Export credit guarantees, EUR m 0 0 14-26
Mezzanine, EUR m No quantitative estimation of market viable gap is available
Unborn
companies Micro Small Medium
153

Total debt instruments, EUR m 295-424 462-845 81- 149
Total market viable gap, EUR m 389-572 670-1,226 102-187
Source: Calculations based on conducted survey of SMEs; and stakeholders interviews
154

4. INVESTMENT STRATEGY

4. Investment Strategy
After having identified the presence of market failures and suboptimal investment situations that justify public intervention and quantified the market gap, the investment strategy provides the following envisaged financial instruments to facilitate SME access to finance, each described in a separate sub-chapter:
Loan and guarantee instruments: Microloans; Start-up loans; Growth loans; Co-lending; Loan guarantees; Export credit guarantees; Rescue and restructuring guarantees and loans;
Equity instruments: Accelerators; Business angel co-investment fund; Venture capital funds; Growth capital funds;
Other support activities: Facility promoting pre-seed workshops and networking events; Facility promoting access to stock exchange financing; Initiative improving SME awareness of the available financing instruments.
Needs of innovative and knowledge-driven SMEs are considered as appropriate investment strategies were designed.
In accordance with Article 37 (2) (b) of CPR, before selecting a particular financial instrument, the investment strategy includes assessment of the quantitative and qualitative dimensions of the value added of the proposed financial instrument and compares it with other considered alternative initiatives, in conclusion providing a justification for the chosen solution. The main reflected value added dimensions are the potential for the leverage of the ESI Fund contribution, the intensity of the financial instrument’s subsidy, presence of the revolving effect allowing the recycling of funds, ability to address the specific market failures, market readiness for the financial product, availability of infrastructure and appropriate market channels for the implementation of the particular financial instrument, and any other positive internalities and externalities identified.
Then, in accordance with Article 37 (2) (e) of CPR, the investment strategy includes description of the proposed financial instrument, including the envisaged financial products, targeted final beneficiaries, and, where applicable, the planned combination with grant support. The term sheet of
156

the envisaged financial instrument also includes the general implementation model and arrangements, identification of additional public and private resources to be potentially attracted, and provisions of governance structure, where applicable and as far as possible, learning from the past experiences implementing similar financial instruments or addressing similar market failures or suboptimal investment situations.
The investment strategy also reviews state aid implications, namely, the conformity of the proposed financial instrument with the relevant state aid regulations and, if applicable, provisions of any additional assessment and/or notification to EC required to confirm the public initiative’s consistency, proportionality, necessity and value added, minimization of market distortion and other state aid implications.
In accordance to Article 37 (2) (c) of CPR the investment strategy includes an estimate of the achievable leverage effect, namely, the amount of additional public and private resources to be potentially raised by the financial instrument at the levels of the financial instrument and/or the fund of funds, if applicable, the financial intermediary, the financial product, and final beneficiaries. If the envisaged financial instrument is funded by private investors, the description includes also an assessment of the need for, and level of, preferential remuneration to attract these private investors, as well as the mechanisms to establish the extent of this preferential remuneration that would promote competition, not cause market distortions, and based on the practices and standards in the relevant markets.
To accomplish the result orientation of the ESI Funds for the 2014-2020 programming period, in accordance to Article 37 (2) (f) of CPR, the investment strategy has to specify the expected results for each financial instrument and demonstrate how the financial instrument will contribute to the specific objectives and results of the relevant ESI Funds investment priority including indicators for this contribution.
The indicators provided are based on the result and output indicators of the TO “3. SME competitiveness”, the investment priority to 3.1. “Promoting entrepreneurship, in particular by facilitating the economic exploitation of new ideas and fostering the creation of new firms, including through business incubators” and the specific objectives to 3.1.1. “Facilitate formation and development of SME’s in particular in manufacturing and RIS3 priority industries” and 3.1.2. “To increase number of high growth enterprises”. Additional financial instrument performance indicators are set to measure the operational efficiency of the implementation.
Since several financial instruments will be implemented under the same investment priority and with the same specific objectives, the indicator measurements and target amounts are split and adjusted accordingly, where applicable. The investment strategy also provides with the methodology for calculating the planned output and performance indicators. The interaction of all proposed financial instruments towards achieving the strategic objectives is discussed in the Summary of this Section (Chapter 3.13).
In accordance with Article 37 (2) (f) and (g) of CPR, the investment strategy describes the general reporting and monitoring provisions that will be set in place in order to efficiently monitor the proposed financial instruments, facilitate that the relevant reporting requirements are met, and
157

establish a system to promptly react to any deviation from the investment strategy and the funding arrangements agreed on between the RA, CB and/or the fund of funds and the financial intermediary.
The investment strategy establishes a timeline for the implementation of the proposed financial instruments. The timelines prescribes all relevant procedures and tasks necessary for the implementation of financial instruments. Financial instruments are implemented in a timely manner, to address the pressing needs of the market as well as provide continuity for existing financial instruments of the 2007-2013 planning period.
The terms and conditions of the proposed financial instruments, including quantities, maturities and durations, the relevant state aid implications, the expected result, output and performance indicators and their target amounts, the presented implementation timeline, particularly the milestone dates, are indicative and subject to change, for example depending on the completion of the regulatory requirements for the launch of the 2014-2020 programming period and any unforeseeable additional notifications to the Commission required in relation to the proposed financial instruments to verify compliance with the relevant ESI Funds and state aid regulations.
158

4.1. Microloans
After identifying the market failures in the micro financing segment, the investment strategy proposes the following microloan instrument to address the market gap.
4.1.1. Value Added Assessment
The alternative financial public interventions that could potentially address the identified market failures in the micro financing segment and that are considered in the investment strategy within the value added assessment, are provided below:
Public intervention General description Advantages Disadvantages
Portfolio guarantees covering microloans by private financial intermediaries
AFI provides a portfolio guarantee to private financial intermediaries (commercial banks and other private micro financing institutions) to cover a capped portion of the losses from microloans; in accordance to the off the shelf instrument model for capped portfolio guarantees
Potential to achieve a high leverage effect
Involvement of private market participants, usage of their know-how
Ability to achieve high market penetration, exposure to all existing and potential clients of the private intermediaries
Addresses specific risk exposure constraints of the private intermediaries
Actual disbursement is done only in case of default
Revolving effect, ability to recycle remaining funds
Reliance on private initiative to reach the expected output results
To avoid adverse selection, portfolio has to include all transactions that fit the investment strategy, covering microloans that would have been issued without the existence of public intervention
Previous discussions with the private intermediaries operating in the market indicate a general lack of interest or expressed need for additional incentives that entails state aid at the level of the financial intermediary and diverging from the off the shelf implementation
159
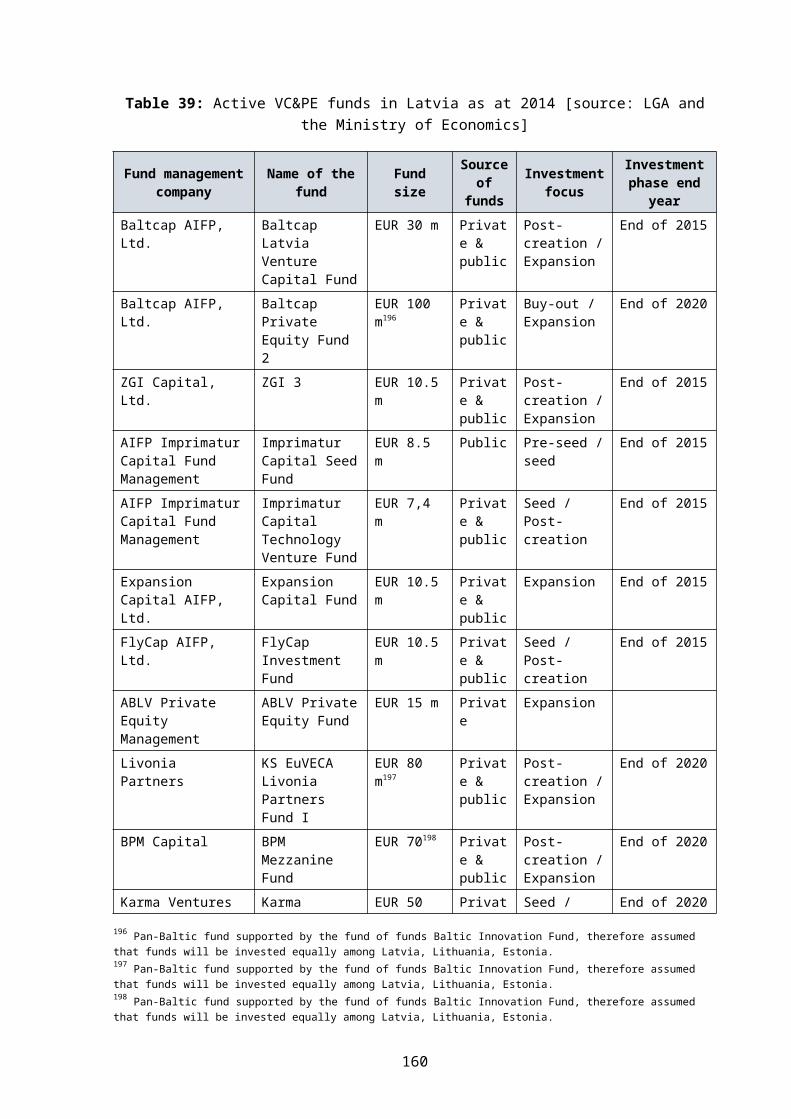
Public intervention General description Advantages Disadvantages
model
Grants for enterprises requiring micro financing
A grant scheme subsidizing a portion of investment costs for micro enterprises
Ability to transfer financing directly to the targeted final recipients, control and monitor the actual utilization of funds
Relatively easier to achieve the desired outcome results
No revolving effect, the funding gets fully exhausted, and limited leverage effect hence also low potential market penetration
The high level of support intensity rise concerns over state aid proportionality
Absent or limited participation of private structures, hence no positive externalities and often insufficient assessment of commercial viability and feasibility of supported enterprises
Portfolio risk sharing loan to private financial intermediaries that provide microloans
AFI provides a portfolio loan to private financial intermediaries (commercial banks and other private micro financing institutions) to cover a portion of the losses from newly issued microloans; in accordance to the off the shelf instrument model for portfolio risk sharing loans
Potential to achieve a higher, but limited leverage effect
Involvement of private market participants, usage of their know-how
Ability to achieve high market penetration, exposure to all existing and potential clients of the private intermediaries
Addresses credit resource constraints
Reliance on private initiative to reach the expected output results
To avoid adverse selection, portfolio has to include all transactions that fit the investment strategy, covering microloans that would have been issued without the existence of public intervention
Does not resolve the credit risk constraints
160

Public intervention General description Advantages Disadvantages
of the private intermediaries
Revolving effect, ability to recycle reimbursed and recovered funds
of the private financial intermediaries
Previous discussions with the private intermediaries operating in the market indicate a general lack of interest or expressed need for additional incentives that entails state aid at the level of the financial intermediary and diverging from the off the shelf implementation model
Microloans provided by AFI
AFI provides microloans to micro enterprises directly and without any intermediation of other (private) institutions
A leverage effect, dependant on the co-financing amount by AFI
High potential market penetration, proximity to the targeted final recipients in all regions
High flexibility to adjust the terms and conditions of the public intervention and the AFI’s credit policy, if required, as a result of any changes in the market conditions
Continuation of the existing microloans
Absent or limited participation of private structures, hence no positive externalities
Possible negative effects of market distortion if public and private intermediaries implement state aid support and public intermediary has more beneficial conditions
161

Public intervention General description Advantages Disadvantages
instrument implemented by AFI and already accepted by the market
Revolving effect, ability to recycle reimbursed and recovered funds
Based on the evaluation of the considered alternative public interventions, in the present market conditions the most feasible solution is that microloans are provided by AFI directly and indirectly (through financial intermediaries) to SME. In order to facilitate a long term development of the financial market and involve private market players, AFI will cooperate with commercial banks and other private micro financing institutions operating in the market and further promote the concepts of portfolio guarantees and risk sharing loans, to cover microloans.
4.1.2. Proposed Direct Instrument
The implementation model of the direct microloans instrument, as intended at the time of drafting the investment strategy, is illustrated below:
Figure 62: The direct implementation model of the microloans instrument
According to the implementation model, the MA will provide funding for the microloans instrument via the capital of AFI. To administer the funding, a separate block of finance (SBF) will be created within the financial intermediary (AFI). AFI will also contribute borrowed resources for the microloans instrument in the amount as indicated under the financial instrument’s term sheet. The resources of the financial instrument will be spent to issue microloans to SMEs and cover AFI’s management costs. All the reimbursements and recoveries from these microloans, as well as all
162
MA
AFI
Fund-of-funds
Microloans SBF
SMEs
funding
microloans reimbursement, recovery

interest, fees and other related earnings within the financial instrument will be accumulated within the separate block of finance, to be re-utilized as prescribed in the ESI Funds regulations and to be decided on by the RA.
The specific terms and conditions (the term sheet) of the proposed direct microlending instrument are provided below:
Scope of financial instrument
The financial instrument is aimed to develop SME by providing microloans.
Implementation model
Within the financial instrument, the national specialised development financing institution (AFI) will provide microloans to SMEs to finance their development.
AFI will create a separate block of finance, recording all the transactions related to the implementation of the financial instrument.
Financial intermediary
The national specialised development financing institution (AFI) meets provisions laid down in the Article 7 of the Regulation No 480/2014, has the required professional experience and capacity; therefore AFI will be directly assigned to implement the financial instrument.
Budget of financial instrument
The ESI funding for the financial instrument is envisaged at 3 million EUR (the amount provided by the fund-of-funds or the MA).
The total budget of the microloans instrument, including other public financing (the AFI’s borrowed resources), is envisaged to reach 10 million EUR.
Investment amounts Within the financial instrument, the microloan amount to a single enterprise can reach up to 25 thousand EUR with maturity up to 10 years.
Investment period The financial intermediary will issue microloans to enterprises for up to 5 years, indicatively till December 31, 2020.
Duration of financial instrument
The expected duration of the instrument is 10 years, which can be extended for further 2 years, if up to that point the financial intermediary (AFI) has not yet received all loan re-payments.
Supported enterprises Eligible undertakings shall be SMEs.
Eligible undertaking cannot be in financial difficulty.
Eligible undertaking cannot be subject to an outstanding recovery order following a previous Commission decision declaring an aid illegal and incompatible with the internal market.
163

Ineligible sectors and activities
According to Article 1 (1) of the de minimis regulation, the financial instrument cannot support undertakings in the following sectors and activities:
(1) aid granted in the fishery and aquaculture sector, as covered by Regulation (EU) No 1379/2013 of the European Parliament and of the Council of 11 December 2013 on the common organisation of the markets in fishery and aquaculture products, amending Council Regulations (EC) No 1184/2006 and (EC) No 1224/2009 and repealing council Regulation (EC) No 104/2000;
(2) aid granted in the primary agricultural production sector;(3) aid granted in the sector of processing and marketing of
agricultural products, in the following cases:(i) where the amount of the aid is fixed on the basis of the price or quantity of such products purchased from primary producers or put on the market by the undertakings concerned; or(ii) where the aid is conditional on being partly or entirely passed on to primary producers;
(4) aid to export-related activities towards third countries or Member States, namely aid directly linked to the quantities exported, to the establishment and operation of a distribution network or to other current expenditure linked to the export activity;
(5) aid contingent upon the use of domestic over imported goods;(6) acquisition of road freight transport vehicles for undertaking
performing road freight transport for hire or reward;
In addition, the financial instrument cannot support undertakings in the following sectors and activities:
(1) operations with real estate;(2) gambling and betting activities; and(3) production and trade of arms, ammunition, tobacco and tobacco
products, alcoholic beverages.
State aid regime The financial intermediary (AFI) provides microloans as de minimis aid, according to Article 4 (3) of the de minimis regulation.
Investment region The financial intermediary (AFI) will provide microloans only to SMEs operating in Latvia.
Funding The indicative funding structure of the microlending instrument:
(1) 30% - the fund-of-funds or the MA; and(2) 70% - the financial intermediary (AFI).
Management costs The management fee of the financial intermediary (AFI) will be set respecting the limits laid out in Article 13 of the Regulation (EU) No 480/2014.
164

Principles of corporate governance
The financial intermediary (AFI) will take investment decisions based on business plans, feasibility assessment, and credit risk.
The financial intermediary (AFI) will implement the financial instrument according to the industry’s best practices, as well as the binding regulations of the European structural funds and state aid.
Reporting The financial intermediary (AFI) will provide regular quarterly reports to RA/CB according to a pre-agreed form.
Monitoring and audit The financial intermediary (AFI) and supported SMEs will have to provide access to all documentation related to the financial instrument and the received support. This access will be provided to representatives of the European Commission, European Court of Auditors, RA, MA, CB.
Publicity The financial intermediary (AFI) will follow the binding publication requirements, performing adequate publicity activities to inform potential eligible undertakings about the financial instrument and its provided opportunities.
The direct microlending instrument will be implemented under the de minimis regulation, in compliance with all the applicable rules and provisions. The financial intermediary (AFI) is a public institution, and there will be no private body involved in the implementation process that could require an additional assessment of possible state aid implications apart from the de minimis aid at the level of final recipients.
The sub-section 4.1.2 describes all criteria that must be met to implement the financial instrument. The sub-section 4.1.2.3 outlines all procedures and tasks necessary for the implementation of the financial instrument. The approval of the assessment by the monitoring committee on April 30, 2015 provides that criteria for the financial instrument (set in the assessment) are approved. Implementation of financial instruments should start after approval of state aid programs by Cabinet of Ministers without additional decisions by the monitoring committee.
165

4.1.2.1 Additional Resources Attracted
Based on the design of the direct microloans instrument, the total estimated funding, including the ESI Funds, additional public and private resources raised, as well as the calculated leverage is provided below:
ESI Funds activity / Fund of funds level:The ESI Funds will directly provide 3 million EUR for the microloans instrument.
Financial intermediary level:The financial intermediary (AFI) will provide further 7 million EUR.
Financial product level:No additional resources are attracted at the level of the microloans product.
Final recipients level:No additional resources are attracted along issuing microloans.
Total funding:Total funding of the ESI Funds, additional public and private resources for the microloans instrument amounts to 10 million EUR.
Leverage:The achieved leverage, calculated as the total estimated additional public and private resources raised divided by the ESI Funds expenditure, is 233 %.
Considering the market gap analysis and findings and the implementation model of the direct microloans instrument presented at the current version of the investment strategy, it is not feasible to attract additional private resources at the level of the financial instrument or the financial product itself.
4.1.2.2. Expected Results
The expected result, output and performance indicators of the envisaged direct microloans instrument, and the methodology for calculation and principles of measurement of these indicators are provided below:
166

Type of indicator
Name of indicator Unit Baseline Target Source
Result indicators
Number of SMEs per 1000 inhabitants
Number36,9
(2013)40
(2023)
SME Performance
Review
SME productivity per 1 employee
EUR12 196(2013)
16 575(2023)
SME Performance
Review
Output indicators
Supported enterprises Number - 400 Monitoring
Private investments matching public support to SMEs
EUR - - Monitoring
Performance indicators
Credit loss; volume of defaulted loans / volume of total loans
Percent - 10 Monitoring
Management costs / volume of total loans outstanding
Percent - 2 Monitoring
Leverage; total additional funding / ESI Funds funding
Percent - 233 Monitoring
Methodology for calculating the output and performance indicators:
(1) The number of supported enterprises is calculated, assuming the total budget of the financial instrument is 10 million EUR, decreased by the total management costs (20%), and divided by the microloan amount of 20 thousand EUR, representing the average amount of microloans according to the historical data on previously implemented similar instruments;
(2) The management fee of the financial intermediary (AFI) will be set respecting the limits laid out in Article 13 of the Regulation (EU) No 480/2014;
(3) The leverage indicator is calculated as the total additional funding raised divided by the ESI Funds public funding at the level of investment in aggregate volumes. The leverage target amount represents the average leverage achieved according to the historical data on previously implemented similar instruments and considering the terms of the financial instrument in regards to the requirements on additional private funding to be attracted.
To allow the MA to evaluate the actual performance of the microloans instrument and to meet the regulatory obligations towards the Commission, the funding agreement establishing the financial instrument between the financial intermediary (AFI) and the CB will set specific provisions on reporting and monitoring. It will ensure data collection and availability in an acceptable format, as well as operational information and financial reports according to a common template, provided by the financial intermediary (AFI) on quarterly basis. These progress reports will include analyses of progress made in comparison to the investment strategy as well as the provisions of the funding agreement. Since the financial instrument is established as a separate block of finance, the financial
167

report will include documentation on the separate financial accounts in regards to the microloans fund’s balance sheet, profit and loss, management costs and other accounting measurement units as defined in the funding agreement.
4.1.2.3. Implementation Timeline
The timeline for implementation of the direct microloans instrument with all procedures and tasks necessary for the implementation of the financial instrument and major milestone dates is provided below:
Activity Tasks Milestone date
Market gap assessment
Examine the supply and demand for microloans Estimate the amount of market gap and other
aspects of market failure The task is completed and conclusions delivered in
the current document of the market gap assessment
(Additional market research may be required to assess specific aspects of the microloans instrument in its design phase) April 2015
Design of financial instrument
The major terms of microloans are presented in the current investment strategy
The directly appointed financial intermediary (AFI) performs a throughout assessment of the current microloans measure implemented in the 2007-2013 programming period, drawing on the lessons learned and the changing market conditions
The financial intermediary (AFI) conducts focus groups with selected already and potentially supported enterprises to test and verify assumptions on their perception of the financial instrument and the required adjustments
If necessary, the financial intermediary (AFI) performs additional feasibility studies
The financial intermediary (AFI) prepares detailed and comprehensive terms and conditions of the microloans instrument in compliance with the relevant ESI Funds and state aid regulations, and sound financial management principles and practices August 2015
168

Activity Tasks Milestone date
Approval of financial instrument
The MA and the financial intermediary (AFI) prepare a project of national regulation governing the implementation of the direct microloans instrument
The regulation draft and the terms and conditions of the financial instrument (AFI) are scrutinised by the relevant authorities
(Additional notification or assistance from the Commission services may be required to ascertain or verify specific interpretations and application of the regulation)
The regulation on the implementation of the direct microloans instrument is approved by the Cabinet of Ministers of the Republic of Latvia December 2015
Approval of financial intermediary
The regulation on the implementation of the activity funded by the ESI Funds is prepared and approved by the Cabinet of Ministers of the Republic of Latvia
The RA invites the financial intermediary (AFI) to submit the project and business plan for the implementation of the activity
The financial intermediary (AFI) submits the required documentation to be appraised by the RA/CB
Upon successful completion of this process, the CB and financial intermediary (AFI) signs the funding agreement January 2016
Preparations for implementation
The financial intermediary (AFI) performs preparatory tasks defined in the funding agreement
Prepare and approve the financial intermediary’s (AFI) internal procedures and policies in relation to the implementation of the microloans instrument
Allocate and assign required human, technical and other resources
Create a separate block of finance February 2016
Launch of financial instrument
The financial intermediary (AFI) starts to deliver microloans to the market
From here onwards, the microloans instrument is implemented according to the funding agreement, and the relevant national and EU regulations March 2016
169
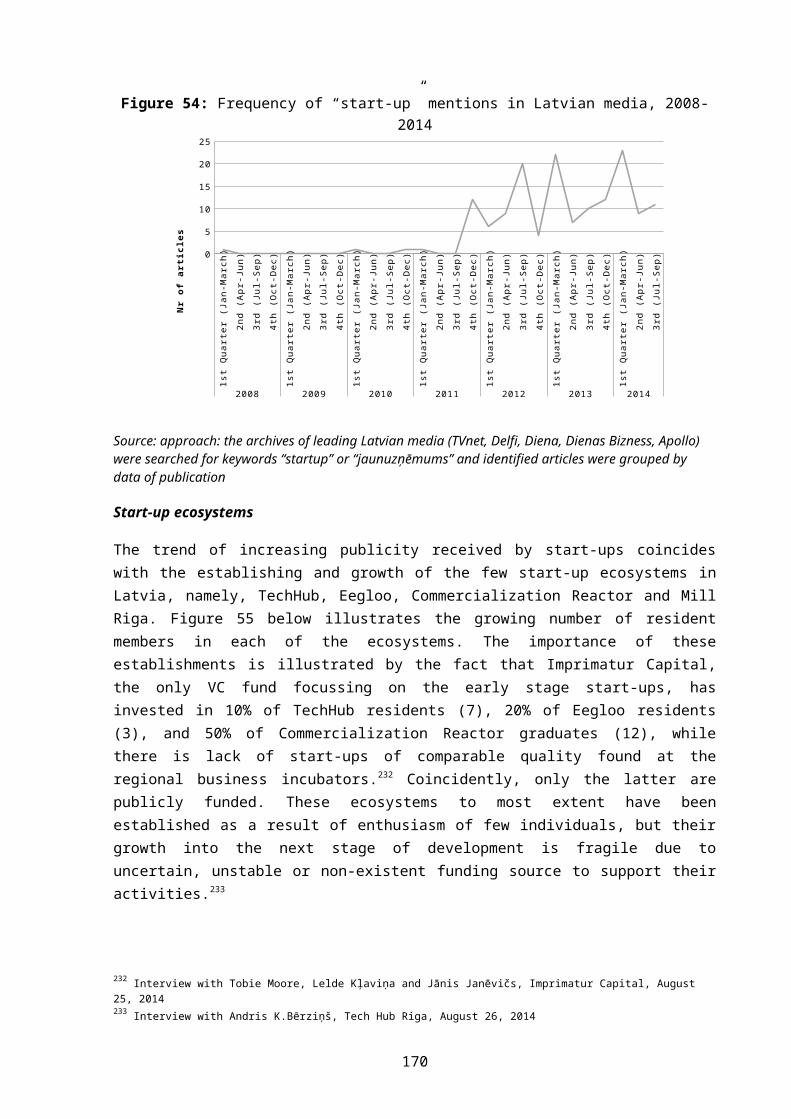
4.1.3. Proposed Indirect Instrument
The implementation model of the indirect microloans instrument:
Figure 63: the implementation model of the indirect microloans instrument
According to the implementation model, the MA will provide funding for the microloans instrument via the capital of AFI. To administer the funding, a separate block of finance (SBF) will be created within the financial intermediary (AFI), through the fund-of-funds. In both cases, the microloans SBF and, if applicable, the fund-of-funds is managed by AFI, the directly appointed financial intermediary. AFI will also contribute borrowed resources for the microloans instrument in the amount as indicated under the financial instrument’s term sheet. The resources of the microloans instrument will be spent to issue portfolio guarantees or portfolio risk sharing loans to micro financing providers that in turn will provide microloans to SMEs, and cover AFI’s and micro financing providers’ related management costs. All the reimbursements and recoveries from these microloans, as well as all interest, fees and other related earnings within the financial instrument will be accumulated within the separate block of finance, to be re-utilized as prescribed in the ESI Funds regulations and to be decided on by the RA.
The specific terms and conditions (the term sheet) of the proposed business microloans instrument are provided below:
Scope of financial instrument
The financial instrument is aimed to develop small enterprises by providing microloans.
170
AFI
MA
Fund-of-funds
Microloans SBF
SMEs
funding
reimbursement, recovery
portfolio guarantee or portfolio risk
sharing loan
Micro financing providers
business microloans

Implementation model
Within the financial instrument, the national specialised development financing institution (AFI) will provide portfolio guarantees and portfolio risk sharing loans to micro financing providers that in turn will provide microloans to SMEs to finance their development.
AFI will create a separate block of finance, recording all the transactions related to the implementation of the financial instrument.
Financial intermediary
The national specialised development financing institution (AFI) meets the provisions laid down in the Article 7 of the Regulation no 480/2014, has the required professional experience and capacity; therefore will be directly assigned to implement the financial instrument.
The microloans will be issued by selected financial intermediaries – commercial banks and other micro financing providers, supported by portfolio guarantees and/or portfolio risk sharing loans. The selection of the financial intermediaries will be conducted according to the Public Procurement Law.
Budget of financial instrument
The ESI funding for the financial instrument is envisaged at 3 million EUR.
The total budget of the microloans instrument, including other public financing (the AFI’s borrowed resources), and private co-financing, in case of the portfolio risk sharing loans, is envisaged to reach 16,65 million EUR.
Investment amounts Within the financial instrument, the microloan amount to a single enterprise can reach up to 50 thousand EUR with maturity up to 5 years.
Investment period The financial intermediaries will issue microloans to enterprises for up to 5 years, indicatively till December 31, 2020.
Duration of financial instrument
The expected duration of the microloans instrument is 10 years, which can be extended for further 2 years, if up to that point the financial intermediaries have not yet received all loan re-payments.
Supported enterprises Eligible undertakings shall be SMEs.
Eligible undertaking cannot be in financial difficulty.
Eligible undertaking cannot be subject to an outstanding recovery order following a previous Commission decision declaring an aid illegal and incompatible with the internal market.
171

Ineligible sectors and activities
According to Article 1 (1) of the de minimis regulation, the financial instrument cannot support undertakings in the following sectors and activities:
(7) aid granted in the fishery and aquaculture sector, as covered by Regulation (EU) No 1379/2013 of the European Parliament and of the Council of 11 December 2013 on the common organisation of the markets in fishery and aquaculture products, amending Council Regulations (EC) No 1184/2006 and (EC) No 1224/2009 and repealing council Regulation (EC) No 104/2000;
(8) aid granted in the primary agricultural production sector;(9) aid granted in the sector of processing and marketing of
agricultural products, in the following cases:(i) where the amount of the aid is fixed on the basis of the price or quantity of such products purchased from primary producers or put on the market by the undertakings concerned; or(ii) where the aid is conditional on being partly or entirely passed on to primary producers;
(10)aid to export-related activities towards third countries or Member States, namely aid directly linked to the quantities exported, to the establishment and operation of a distribution network or to other current expenditure linked to the export activity;
(11)aid contingent upon the use of domestic over imported goods;(12)acquisition of road freight transport vehicles for undertaking
performing road freight transport for hire or reward;
In addition, the financial instrument cannot support undertakings in the following sectors and activities:
(4) operations with real estate;(5) gambling and betting activities; and(6) production and trade of arms, ammunition, tobacco and tobacco
products, alcoholic beverages.
State aid regime The financial intermediaries will provide microloans as de minimis aid, according to Article 4 (3) of the de minimis regulation.
Investment region The financial intermediaries will provide microloans only to enterprises that operate in Latvia.
Funding The indicative funding structure of the business microloans instrument at the level of the financial instrument:
(3) 80% - the fund-of-funds or the MA; and(4) 20% - the private financial intermediary.
Management costs The management fees of AFI and the financial intermediaries will be set respecting the limits laid out in Article 13 of the Regulation (EU) No 480/2014.
172

Principles of corporate governance
The financial intermediaries will take investment decisions based on business plans, feasibility assessment, and credit risk.
The financial intermediaries will manage the operations according to commercial principles.
AFI and the financial intermediaries will manage the operations according to the industry’s best practices, as well as the binding regulations of the European structural funds and state aid.
Reporting AFI and the financial intermediary will provide regular quarterly reports to the RA/CB according to a pre-agreed form.
Monitoring and audit The financial intermediaries and supported enterprises will have to provide access to all documentation related to the financial instrument and the received support. This access will be provided to representatives of the European Commission, European Court of Auditors, MA, RA, CB.
Publicity The financial intermediaries will follow the binding publication requirements, performing adequate publicity activities to inform potential eligible undertakings about the financial instrument and its provided opportunities.
The microloans instrument will be implemented under the de minimis regulation, in compliance with all the applicable rules and provisions.
Regarding the incentives of micro financing providers to issue microloans covered by portfolio guarantees and/or portfolio risk sharing loans.
The sub-section 4.1.3 describes all criteria that must be met to implement the financial instrument. The sub-section 4.1.3.3 outlines all procedures and tasks necessary for the implementation of the financial instrument. Consequently, the approval of the assessment by the monitoring committee on April 30, 2015 provides that criteria for the financial instrument (set in the assessment) are approved. Implementation of financial instruments should start after approval of state aid programs by the Cabinet of Ministers without additional decisions by the monitoring committee.
173

4.1.3.1. Additional Resources Attracted
Based on the design of the indirect microloans instrument, the total estimated funding, including the ESI Funds, additional public and private resources raised, as well as the calculated leverage is provided below:
ESI Funds activity / Fund of funds level:The ESI Funds will directly or through the fund of funds transfer 3 million EUR to the microloans instrument.
Financial intermediary level:The financial intermediary (AFI) will provide further 12 million EUR.
Financial product level:Micro financing providers, benefiting from portfolio risk sharing loans, will provide further 2,65 million EUR as co-financing.
Final recipients level:Micro financing providers, benefiting from portfolio guarantees, will indirectly facilitate microloans for additional 20 million EUR, assuming a loan to guarantee multiplicator of at least 4* and average cover of 80%.
Total funding:Total funding of the ESI Funds, additional public and private resources for the microloans instrument amounts to 16,65 million EUR.
Leverage:The achieved leverage, calculated as the total estimated additional public and private resources raised divided by the ESI Funds expenditure, is 591 %.
* The portfolio guarantee multiplicator of at least 4 is indicative and will be specified in the implementation business plan of the financial instrument, as required by Article 8 (2) of CPR.
Considering the market gap analysis and findings and the implementation model of the microloans instrument presented at the current version of the investment strategy, it is not feasible to attract additional private resources at the level of the financial instrument or the financial product itself. The financial intermediary (AFI) will perform the exercise of analysing the most effective ways and means of attracting these private resources and the need for and extent of preferential remuneration for the private investors, and any state aid implications that may arise as a result.
174

4.1.3.2. Expected Results
The expected result, output and performance indicators of the envisaged business microloans instrument, and the methodology for calculation and principles of measurement of these indicators are provided below:
Type of indicator
Name of indicator Unit Baseline Target Source
Result indicators
Number of SMEs per 1000 inhabitants
Number36,9
(2013)40
(2023)
SME Performance
Review
SME productivity per 1 employee
EUR12 196(2013)
16 575(2023)
SME Performance
Review
Output indicators
Supported enterprises Number - 500 Monitoring
Private investments matching public support to SMEs
EUR - 10 Monitoring
Performance indicators
Credit loss; volume of defaulted loans / volume of total loans
Percent - 10 Monitoring
Management costs / volume of total loans outstanding
Percent - 2 Monitoring
Leverage; total additional funding / ESI Funds funding
Percent - 1400 Monitoring
Methodology for calculating the output and performance indicators:
(1) The number of supported enterprises is calculated, assuming the total budget of the financial instrument is 25 million EUR, decreased by the total management costs (20%), and divided by the business microloan amount of 40 thousand EUR, representing the average amount of business microloans according to the historical data on previously implemented similar instruments;
(2) The management fee of the financial intermediary (AFI) will be set respecting the limits laid out in Article 13 of the Regulation (EU) No 480/2014;
(3) The leverage indicator is calculated as the total additional funding raised divided by the ESI Funds public funding at the level of investment in aggregate volumes. The leverage target amount represents the average leverage achieved according to the historical data on previously implemented similar instruments and considering the terms of the financial instrument in regards to the requirements on additional private funding to be attracted.
To allow the MA to evaluate the actual performance of the microloans instrument and to meet the regulatory obligations towards the Commission, the funding agreement establishing the financial
175

instrument or the fund-of-funds between AFI and the financial intermediaries and the CB will set specific provisions on reporting and monitoring. It will ensure data collection and availability in an acceptable format, as well as operational information and financial reports according to a common template, provided by AFI and the financial intermediaries on quarterly basis. These progress reports will include analyses of progress made in comparison to the investment strategy as well as the provisions of the funding agreement. Since the financial instrument is established as a separate block of finance, the financial report will include documentation on the separate financial accounts in regards to the microloans fund’s balance sheet, profit and loss, management costs and other accounting measurement units as defined in the funding agreement.
4.1.3.3. Implementation Timeline
The timeline for implementation of the microloans instrument with all relevant procedures and tasks necessary for the implementation of the financial instruments and major milestone dates is provided below:
Activity Tasks Milestone date
Market gap assessment
Examine the supply and demand for microloans Estimate the amount of market gap and other
aspects of market failure The task is completed and conclusions delivered in
the current document of the market gap assessment
(Additional market research may be required to assess specific aspects of the microloans instrument in its design phase) April 2015
176

Activity Tasks Milestone date
Design of financial instrument
The major terms of microloans are presented in the current investment strategy
AFI performs a throughout assessment of the microloans measures implemented in the 2007-2013 programming period, drawing on the lessons learned and the changing market conditions
AFI conducts focus groups with selected already and potentially supported enterprises to test and verify assumptions on their perception of the financial instrument and the required adjustments
If necessary, AFI performs additional feasibility studies
AFI performs discussions with potential financial intermediaries (commercial banks and other private micro financing providers) to design portfolio guarantees and portfolio risk sharing loans
AFI prepares detailed and comprehensive terms and conditions of the microloans instrument, including the portfolio guarantees, portfolio risk sharing loans and the financial products itself, in compliance with the relevant ESI Funds and state aid regulations, and sound financial management principles and practices August 2015
Approval of financial instrument
The MA and the financial intermediary (AFI) prepare a project of national regulation governing the implementation of the microloans instrument
The regulation draft and the terms and conditions of the financial instrument (AFI) are scrutinised by the relevant authorities
(Additional notification or assistance from the Commission services may be required to ascertain or verify specific interpretations and application of the regulation)
The regulation on the implementation of the microloans instrument is approved by the Cabinet of Ministers of the Republic of Latvia December 2015
177

Activity Tasks Milestone date
Approval of financial intermediary
The regulation on the implementation of the activity funded by the ESI Funds is prepared and approved by the Cabinet of Ministers of the Republic of Latvia
The RA invites AFI to submit the project and business plan for the implementation of the activity
AFI submits the required documentation to be appraised by the RA/CB
Upon successful completion of this process, the CB and AFI signs the funding agreement January 2016
Preparations for implementation
AFI performs preparatory tasks defined in the funding agreement
Prepare and approve the AFI internal procedures and policies in relation to the implementation of the microloans instrument
Allocate and assign required human, technical and other resources
Create a separate block of finance March 2016
Launch of financial instrument
AFI selects financial intermediaries to participate in the microloans instrument
AFI starts to issue portfolio guarantees and portfolio risk sharing loans to selected financial intermediaries
From here onwards, the microloans instrument is implemented according to the funding agreement, and the relevant national and EU regulations June 2016
178

4.2. Start-up Loans
After identifying the market failures in the bank lending segment, the investment strategy proposes the following start-up loan instrument to address the market gap, and in particular introduce a start-up loan product that targets start-up enterprises in their early development stages that are not able to receive financing from the commercial banks operating in the market due to insufficient collateral, absent or limited credit history, and/or high credit risk.
4.2.1. Value Added Assessment
The alternative financial public interventions that could potentially address the identified market failures in the start-up loans segment and that are considered in the investment strategy within the value added assessment, are provided below:
Public intervention General description Advantages Disadvantages
Portfolio guarantees covering start-up loans by private financial intermediaries
AFI provides a portfolio guarantee to private financial intermediaries (commercial banks) to cover a capped portion of the losses from newly issued start-up loans; in accordance to the off the shelf instrument model for capped portfolio guarantees
Potential to achieve a high leverage effect
Involvement of private market participants, usage of their know-how
Ability to achieve high market penetration, exposure to all existing and potential clients of the private intermediaries
Addresses specific risk exposure constraints of the private intermediaries
Actual disbursement is done only in case of default
Revolving effect, ability to recycle
Reliance on private initiative to reach the expected output results
To avoid adverse selection, portfolio has to include all transactions that fit the investment strategy, covering start-up loans that would have been issued without the existence of public intervention
179

Public intervention General description Advantages Disadvantages
remaining funds
Grants for enterprises requiring start-up financing
A grant scheme subsidizing a portion of investment costs for start-up enterprises
Ability to transfer financing directly to the targeted final recipients, control and monitor the actual utilization of funds
Relatively easier to achieve the desired outcome results
No revolving effect, the funding gets fully exhausted, and limited leverage effect hence also low potential market penetration
The high level of support intensity rise concerns over state aid proportionality
Absent or limited participation of private structures, hence no positive externalities and often insufficient assessment of commercial viability and feasibility of supported enterprises
Portfolio risk sharing loan to private financial intermediaries that provide start-up loans
AFI provides a portfolio loan to private financial intermediaries (commercial banks) to cover a portion of the losses from newly issued start-up loans; in accordance to the off the shelf instrument model for portfolio risk sharing loans
Potential to achieve a higher, but limited leverage effect
Involvement of private market participants, usage of their know-how
Ability to achieve high market penetration, exposure to all existing and potential clients of the private intermediaries
Addresses credit resource constraints
Reliance on private initiative to reach the expected output results
To avoid adverse selection, portfolio has to include all transactions that fit the investment strategy, covering start-up loans that would have been issued without the existence of public intervention
Does not resolve the
180

Public intervention General description Advantages Disadvantages
of the private intermediaries
Revolving effect, ability to recycle reimbursed and recovered funds
credit risk constraints of the private financial intermediaries
Start-up loans provided by AFI
AFI provides start-up loans to start-up enterprises directly and without any intermediation of other (private) institutions
A leverage effect, dependant on the co-financing amount by AFI
High potential market penetration, proximity to the targeted final recipients in all regions
High flexibility to adjust the terms and conditions of the public intervention and the AFI’s credit policy, if required, as a result of any changes in the market conditions
Continuation of the existing start-up loans instrument implemented by the AFI and already accepted by the market
Revolving effect, ability to recycle reimbursed and recovered funds
Absent or limited participation of private structures, hence no positive externalities
181
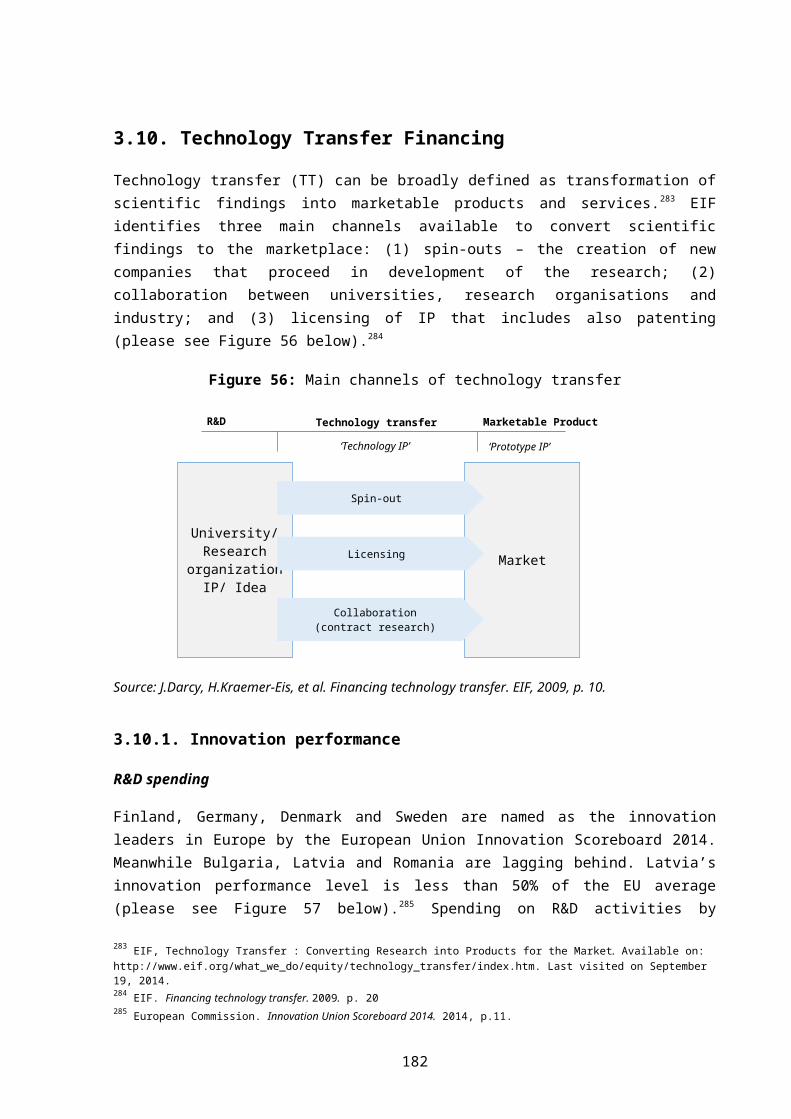
Based on the evaluation of the considered alternative public interventions, in the present market conditions the most feasible solution is that start-up loans are provided by AFI directly to start-up enterprises. However, this solution does not involve participation of private market players and as a result does not provide any positive externalities nor the respective added value benefits identified above. In order to facilitate a long term development of the financial market and involve private market players, AFI will continue ongoing discussions with commercial banks operating in the market and in particular further promote the concept of portfolio guarantees. Depending on the success of these discussions, the investment strategy could be amended and supplemented with an additional financial instrument with a focus to improve SME access to start-up debt financing. Consequently, the currently envisaged start-up loans instrument would likely be also amended or terminated to avoid risk of support duplication and market distortions.
4.2.2. Proposed Instrument
The implementation model of the start-up loans instrument, as intended at the time of drafting the investment strategy, is illustrated below:
Figure 64: the implementation model of the start-up loans instrument
According to the implementation model, the MA will provide funding to the start-up loans instrument via the capital of AFI. To administer the funding, a separate block of finance (SBF) will be created within the financial intermediary (AFI), directly or through the fund-of-funds, if the financial instrument is included in its portfolio. In both cases, the start-up loans instrument and, if applicable, the fund-of-funds is managed by AFI, the directly appointed financial intermediary. AFI will also contribute borrowed resources for the start-up loans instrument in the amount as indicated under the financial instrument’s term sheet. The resources of the start-up loans instrument will be spent to issue start-up loans to SMEs and cover AFI’s management costs. All the reimbursements and recoveries from these start-up loans, as well as all interest, fees and other related earnings within the financial instrument will be accumulated within the separate block of finance, to be re-utilized as prescribed in the ESI Funds regulations and to be decided on by the RA.
182
AFI
MA
Fund-of-funds
Start-up Loans SBF
SMEs
funding
reimbursement, recoverystart-up loans

The specific terms and conditions (the term sheet) of the proposed start-up loans instrument are provided below:
Scope of financial instrument
The financial instrument is aimed to develop small and medium enterprises in their start-up development stage, by providing start-up loans.
Implementation model
Within the financial instrument, the national specialised development financing institution (AFI) will provide start-up loans to small and medium enterprises to finance their establishment and development.
AFI will create a start-up loan fund as a separate block of finance, recording all the transactions related to the implementation of the financial instrument.
Financial intermediary
The national specialised development financing institution (AFI) meets provisions laid down in the Article 7 of the Regulation no 480/2014, has the required professional experience and capacity; therefore will be directly assigned to implement the financial instrument.
Budget of financial instrument
The ESI funding for the financial instrument is envisaged at 10 million EUR (the amount provided by the fund-of-funds or the MA).
The total budget of the start-up loan instrument, including other public financing (the AFI’s borrowed resources), is envisaged to reach 20 million EUR.
Investment amounts Within the financial instrument, the start-up loan amount to a single enterprise can reach up to 150 thousand EUR with maturity up to 10 years.
Investment period The financial intermediary (AFI) will issue start-up loans to enterprises for up to 5 years, indicatively till December 31, 2020.
Duration of financial instrument
The expected duration of the start-up loans instrument is 15 years, which can be extended for further 2 years, if up to that point the financial intermediary (AFI) has not yet received all loan re-payments.
Supported enterprises Eligible undertakings shall be small and medium enterprises.
Eligible undertaking cannot be in financial difficulty.
Eligible undertaking cannot be subject to an outstanding recovery order following a previous Commission decision declaring an aid illegal and incompatible with the internal market.
183

Ineligible sectors and activities
According to Article 1 (1) of the de minimis regulation, the financial instrument cannot support undertakings in the following sectors and activities:
(1) aid granted in the fishery and aquaculture sector, as covered by Regulation (EU) No 1379/2013 of the European Parliament and of the Council of 11 December 2013 on the common organisation of the markets in fishery and aquaculture products, amending Council Regulations (EC) No 1184/2006 and (EC) No 1224/2009 and repealing council Regulation (EC) No 104/2000;
(2) aid granted in the primary agricultural production sector;(3) aid granted in the sector of processing and marketing of
agricultural products, in the following cases:(i) where the amount of the aid is fixed on the basis of the price or quantity of such products purchased from primary producers or put on the market by the undertakings concerned; or(ii) where the aid is conditional on being partly or entirely passed on to primary producers;
(4) aid to export-related activities towards third countries or Member States, namely aid directly linked to the quantities exported, to the establishment and operation of a distribution network or to other current expenditure linked to the export activity;
(5) aid contingent upon the use of domestic over imported goods;(6) acquisition of road freight transport vehicles for undertaking
performing road freight transport for hire or reward;
In addition, the financial instrument cannot support undertakings in the following sectors and activities:
(1) operations with real estate;(2) gambling and betting activities;(3) production and trade of arms, ammunition, tobacco and tobacco
products, alcoholic beverages.
State aid regime The financial intermediary (AFI) provides start-up loans as de minimis aid, according to Article 4 (3) of the de minimis regulation.
Investment region The financial intermediary (AFI) will provide start-up loans only to enterprises that operate in Latvia.
Funding The indicative funding structure of the start-up loan instrument:
(1) 50% - the fund-of-funds or the MA; and(2) 50% - the financial intermediary (AFI).
Management costs The management fee of the financial intermediary (AFI) will be set respecting the limits laid out in Article 13 of the Regulation (EU) No 480/2014.
184

Principles of corporate governance
The financial intermediary (AFI) will take investment decisions based on business plans, feasibility assessment, and credit risk.
The financial intermediary (AFI) will manage the operations according to commercial principles.
The financial intermediary (AFI) will manage the operations according to the industry’s best practices, as well as the binding regulations of the European structural funds and state aid.
Reporting The financial intermediary (AFI) will provide regular quarterly reports to the fund-of-funds or the RA/CB according to a pre-agreed form.
Monitoring and audit The financial intermediary (AFI) and supported enterprises will have to provide access to all documentation related to the financial instrument and the received support. This access will be provided to representatives of the European Commission, European Court of Auditors, the fund-of-funds or the MA, RA, CB.
Publicity The financial intermediary (AFI) will follow the binding publication requirements, performing adequate publicity activities to inform potential eligible undertakings about the financial instrument and its provided opportunities.
The start-up loans instrument will be implemented under the de minimis regulation, in compliance with all the applicable rules and provisions. The financial intermediary (AFI) is a public institution, and there will be no private body involved in the implementation process that could require an additional assessment of possible state aid implications apart from the de minimis aid at the level of final beneficiaries.
The sub-section 4.2.2 describes all criteria that must be met to implement the financial instrument. The sub-section 4.2.5 outlines all procedures and tasks necessary for the implementation of the financial instrument. Consequently, the approval of the assessment by the monitoring committee on April 30, 2015 provides that criteria for the financial instrument (set in the assessment) are approved. Implementation of financial instruments should start after approval of state aid programs by the Cabinet of Ministers without additional decisions by the monitoring committee.
185

4.2.3. Additional Resources Attracted
Based on the design of the start-up loans instrument, the total estimated funding, including the ESI Funds, additional public and private resources raised, as well as the calculated leverage is provided below:
ESI Funds activity / Fund of funds level:The ESI Funds will directly or through the fund of funds transfer 10 million EUR to the start-up loans instrument.
Financial intermediary level:The financial intermediary (AFI) will provide further 10 million EUR.
Financial product level:No additional resources are attracted at the level of the start-up loans product.
Final recipients level:No additional resources are attracted along issuing start-up loans.
Total funding:Total funding of the ESI Funds, additional public and private resources for the start-up loans instrument amounts to 20 million EUR.
Leverage:The achieved leverage, calculated as the total estimated additional public and private resources raised divided by the ESI Funds expenditure, is 100 %.
Considering the market gap analysis and findings and the implementation model of the start-up loans instrument presented at the current version of the investment strategy, it is not feasible to attract additional private resources at the level of the start-up loans fund or the financial product itself. However, if at a later stage of the 2014-2020 programming period a decision is made to increase the capacity of the start-up loans instrument and at that point there are private investors identified that would be ready to participate in the initiative, the investment strategy will be amended accordingly. Moreover, the financial intermediary (AFI) will perform the exercise of analysing the most effective ways and means of attracting these private resources and the need for and extent of preferential remuneration for the private investors, and any state aid implications that may arise as a result.
186

4.2.4. Expected Results
The expected result, output and performance indicators of the envisaged start-up loans instrument, and the methodology for calculation and principles of measurement of these indicators are provided below:
Type of indicator
Name of indicator Unit Baseline Target Source
Result indicators
Number of SMEs per 1000 inhabitants
Number36,9
(2013)40
(2023)
SME Performance
Review
SME productivity per 1 employee
EUR12 196(2013)
16 575(2023)
SME Performance
Review
Output indicators
Supported new enterprises Number - 300 Monitoring
Private investments matching public support to SMEs
EUR - - Monitoring
Performance indicators
Credit loss; volume of defaulted loans / volume of total loans
Percent - 15 Monitoring
Management costs / volume of total loans outstanding
Percent - 1.5 Monitoring
Leverage; total additional funding / ESI Funds funding
Percent - 100 Monitoring
Methodology for calculating the output and performance indicators:(1) The number of supported enterprises is calculated, assuming the total budget of the financial instrument is 15 million EUR, decreased by the total management costs (20%), and divided by the start-up loan amount of 40 thousand EUR, representing the average amount of start-up loans according to the historical data on previously implemented similar instruments;(2) The management fee of the financial intermediary (AFI) will be set respecting the limits laid out in Article 13 of the Regulation (EU) No 480/2014;(3) The leverage indicator is calculated as the total additional funding raised divided by the ESI Funds public funding at the level of investment in aggregate volumes. The leverage target amount represents the average leverage achieved according to the historical data on previously implemented similar instruments and considering the terms of the financial instrument in regards to the requirements on additional private funding to be attracted.
To allow the MA to evaluate the actual performance of the start-up loans instrument and to meet the regulatory obligations towards the Commission, the funding agreement establishing the financial instrument or the fund-of-funds between the financial intermediary (AFI) and the CB will set specific
187

provisions on reporting and monitoring. It will ensure data collection and availability in an acceptable format, as well as operational information and financial reports according to a common template, provided by the financial intermediary (AFI) on quarterly basis. These progress reports will include analyses of progress made in comparison to the investment strategy as well as the provisions of the funding agreement. Since the financial instrument is established as a separate block of finance, the financial report will include documentation on the separate financial accounts in regards to the start-up loans fund’s balance sheet, profit and loss, management costs and other accounting measurement units as defined in the funding agreement.
4.2.5. Implementation Timeline
The timeline for implementation of the start-up loans instrument with all relevant activities and tasks and major milestone dates is provided below:
Activity Tasks Milestone date
Market gap assessment
Examine the supply and demand for start-up loans Estimate the amount of market gap and other
aspects of market failure The task is completed and conclusions delivered in
the current document of the market gap assessment
(Additional market research may be required to assess specific aspects of the start-up loans instrument in its design phase) April 2015
188

Activity Tasks Milestone date
Design of financial instrument
The major terms of start-up loans are presented in the current investment strategy
The financial intermediary (AFI) performs a throughout assessment of the current start-up loans measure implemented in the 2007-2013 programming period, drawing on the lessons learned and the changing market conditions
The financial intermediary (AFI) conducts focus groups with selected already and potentially supported enterprises to test and verify assumptions on their perception of the start-up loans instrument and the required adjustments
If necessary, the financial intermediary (AFI) performs additional feasibility studies
The financial intermediary (AFI) prepares detailed and comprehensive terms and conditions of the start-up loans instrument in compliance with the relevant ESI Funds and state aid regulations, and sound financial management principles and practices August 2015
Approval of financial instrument
The MA and the financial intermediary (AFI) prepare a project of national regulation governing the implementation of start-up loans
The regulation draft and the terms and conditions of the start-up loans instrument are scrutinised by the relevant authorities
(Additional notification or assistance from the Commission services may be required to ascertain or verify specific interpretations and application of the regulation)
The regulation on the implementation of start-up loans is approved by the Cabinet of Ministers of the Republic of Latvia October 2015
189

Activity Tasks Milestone date
Approval of financial intermediary
The regulation on the implementation of the activity funded by the ESI Funds is prepared and approved by the Cabinet of Ministers of the Republic of Latvia
The RA invites the financial intermediary (AFI) to submit the project and business plan for the implementation of the activity
The financial intermediary (AFI) submits the required documentation to be appraised by the RA/CB
Upon successful completion of this process, the CB and the financial intermediary (AFI) signs the funding agreement November 2015
Preparations for implementation
The financial intermediary (AFI) performs preparatory tasks defined in the funding agreement
Prepare and approve the financial intermediary’s (AFI) internal procedures and policies in relation to the implementation of start-up loans
Allocate and assign required human, technical and other resources
Create a separate block of finance December 2015
Launch of financial instrument
The financial intermediary (AFI) starts to deliver start-up loans to the market
From here onwards, the start-up loans instrument is implemented according to the funding agreement, and the relevant national and EU regulations January 2016
190

4.3. Growth Loans
After identifying the market failures in the bank lending segment, the investment strategy proposes the following growth loan instrument to address the market gap, and in particular introduce a growth loan product that targets enterprises in their growth development stages that are not able to receive financing from the commercial banks operating in the market due to insufficient collateral and/or high credit risk.
4.3.1. Value Added Assessment
The alternative financial public interventions that could potentially address the identified market failures in the growth loans segment and that are considered in the investment strategy within the value added assessment, are provided below:
Public intervention General description Advantages Disadvantages
Portfolio guarantees covering growth loans by private financial intermediaries
AFI provides a portfolio guarantee to private financial intermediaries (commercial banks) to cover a capped portion of the losses from newly issued growth loans; in accordance to the off the shelf instrument model for capped portfolio guarantees
Potential to achieve a high leverage effect
Involvement of private market participants, usage of their know-how
Ability to achieve high market penetration, exposure to all existing and potential clients of the private intermediaries
Addresses specific risk exposure constraints of the private intermediaries
Actual disbursement is done only in case of default
Revolving effect, ability to recycle
Reliance on private initiative to reach the expected output results
To avoid adverse selection, portfolio has to include all transactions that fit the investment strategy, covering growth loans that would have been issued without the existence of public intervention
191

Public intervention General description Advantages Disadvantages
remaining funds
Grants for enterprises requiring growth financing
A grant scheme subsidizing a portion of investment costs for supported enterprises
Ability to transfer financing directly to the targeted final recipients, control and monitor the actual utilization of funds
Relatively easier to achieve the desired outcome results
No revolving effect, the funding gets fully exhausted, and limited leverage effect hence also low potential market penetration
The high level of support intensity rise concerns over state aid proportionality
Absent or limited participation of private structures, hence no positive externalities and often insufficient assessment of commercial viability and feasibility of supported enterprises
Portfolio risk sharing loan to private financial intermediaries that provide growth loans
AFI provides a portfolio loan to private financial intermediaries (commercial banks) to cover a portion of the losses from newly issued growth loans; in accordance to the off the shelf instrument model for portfolio risk sharing loans
Potential to achieve a higher, but limited leverage effect
Involvement of private market participants, usage of their know-how
Ability to achieve high market penetration, exposure to all existing and potential clients of the private intermediaries
Addresses credit resource constraints
Reliance on private initiative to reach the expected output results
To avoid adverse selection, portfolio has to include all transactions that fit the investment strategy, covering growth loans that would have been issued without the existence of public intervention
192

Public intervention General description Advantages Disadvantages
of the private intermediaries
Revolving effect, ability to recycle reimbursed and recovered funds
Growth loans provided by AFI
AFI provides growth loans to SMEs directly and without any intermediation of other (private) institutions
High potential market penetration, proximity to the targeted final recipients in all regions
High flexibility to adjust the terms and conditions of the public intervention and the AFI’s credit policy, if required, as a result of any changes in the market conditions
Continuation of the previous growth loans instrument implemented by the AFI and already accepted by the market
Revolving effect, ability to recycle reimbursed and recovered funds
Absent or limited participation of private structures, hence no positive externalities
Based on the evaluation of the considered alternative public interventions, in the present market conditions the most feasible solution is that growth loans are provided by AFI directly to SMEs. However, this solution does not involve participation of private market players and as a result does not provide any positive externalities nor the respective added value benefits identified above. In order to facilitate a long term development of the financial market and involve private market
193

players, AFI will continue ongoing discussions with commercial banks operating in the market and further promote the concept of portfolio guarantees and portfolio risk sharing loans. Depending on the success of these discussions, the investment strategy could be amended and supplemented with an additional financial instrument with a focus to improve SME access to growth debt financing. Consequently, the currently envisaged growth loans instrument would likely be also amended or terminated to avoid risk of support duplication and market distortions.
4.3.2. Proposed Instrument
The implementation model of the growth loans instrument, as intended at the time of drafting the investment strategy, is illustrated below:
Figure 65: the implementation model of the growth loans instrument
According to the implementation model, AFI will create and manage the growth loan instrument as a separate block of finance (SBF) within the financial intermediary (AFI). AFI will also contribute borrowed resources and recycled funds from the financial instruments of the 2007-2013 programming period for the growth loan instrument in the amount as indicated under the financial instrument’s term sheet. The resources of the growth loan instrument will be spent to issue growth loans to SMEs and cover AFI’s management costs. All the reimbursements and recoveries from these growth loans, as well as all interest, fees and other related earnings within the financial instrument will be accumulated within the separate block of finance, to be re-utilized and to be decided on by the RA.
The specific terms and conditions (the term sheet) of the proposed growth loans instrument are provided below:
Scope of financial instrument
The financial instrument is aimed to develop small and medium enterprises in their growth development stage, by providing growth loans.
194
AFI
Growth Loans SBF
reimbursement, recoverygrowth loans
SMEs

Implementation model
Within the financial instrument, the national specialised development financing institution (AFI) will provide growth loans to small and medium enterprises to finance their development.
AFI will create a separate block of finance, recording all the transactions related to the implementation of the financial instrument.
Financial intermediary
The national specialised development financing institution (AFI) meets provisions laid down in the Article 7 of the regulation no 480/2014, has the required professional experience and capacity; therefore will be directly assigned to implement the financial instrument.
Budget of financial instrument
The total budget of the financial instrument is envisaged at 40 million EUR (the amount invested in the growth loan fund from the borrowed resources and recycled funding).
Investment amounts Within the financial instrument, the growth loan amount to a single enterprise can reach up to 500 thousand EUR for investments and 250 thousand EUR for working capital, with maturity up to 10 years.
Investment period The financial intermediary will issue growth loans to enterprises for up to 5 years, indicatively till December 31, 2020.
Duration of financial instrument
The expected duration of the growth loans instrument is 15 years, which can be extended for further 2 years, if up to that point the financial intermediary (AFI) has not yet received all loan re-payments.
Supported enterprises Eligible undertakings shall be small and medium enterprises.
Eligible undertaking cannot be in financial difficulty.
Eligible undertaking cannot be subject to an outstanding recovery order following a previous Commission decision declaring an aid illegal and incompatible with the internal market.
195

Ineligible sectors and activities
According to Article 1 (1) of the de minimis regulation, the financial instrument cannot support undertakings in the following sectors and activities:
(1) aid granted in the fishery and aquaculture sector, as covered by Regulation (EU) No 1379/2013 of the European Parliament and of the Council of 11 December 2013 on the common organisation of the markets in fishery and aquaculture products, amending Council Regulations (EC) No 1184/2006 and (EC) No 1224/2009 and repealing council Regulation (EC) No 104/2000;
(2) aid granted in the primary agricultural production sector;(3) aid granted in the sector of processing and marketing of
agricultural products, in the following cases:(i) where the amount of the aid is fixed on the basis of the price or quantity of such products purchased from primary producers or put on the market by the undertakings concerned; or(ii) where the aid is conditional on being partly or entirely passed on to primary producers;
(4) aid to export-related activities towards third countries or Member States, namely aid directly linked to the quantities exported, to the establishment and operation of a distribution network or to other current expenditure linked to the export activity;
(5) aid contingent upon the use of domestic over imported goods;(6) acquisition of road freight transport vehicles for undertaking
performing road freight transport for hire or reward;
In addition, the financial instrument cannot support undertakings in the following sectors and activities:
(1) operations with real estate;(2) gambling and betting activities;(3) production and trade of arms, ammunition, tobacco and tobacco
products, alcoholic beverages.
State aid regime The financial intermediary (AFI) will provide growth loans as de minimis aid, according to Article 4 (3) of the de minimis regulation.
Investment region The financial intermediary (AFI) will provide growth loans only to enterprises that operate in Latvia.
Funding The indicative funding structure of the growth loan instrument:
100% - the financial intermediary (AFI).
Management costs The management fee of the financial intermediary (AFI) will be set respecting the limits laid out in Article 13 of the Regulation (EU) No 480/2014.
196

Principles of corporate governance
The financial intermediary (AFI) will take investment decisions based on business plans, feasibility assessment, and credit risk.
The financial intermediary (AFI) will manage the operations according to commercial principles.
The financial intermediary (AFI) will manage the operations according to the industry’s best practices, as well as the binding regulations of the European structural funds and state aid.
Reporting The financial intermediary (AFI) will provide regular quarterly reports to the RA/CB according to a pre-agreed form.
Monitoring and audit The financial intermediary (AFI) and supported enterprises will have to provide access to all documentation related to the financial instrument and the received support. This access will be provided to representatives of the European Commission, European Court of Auditors, the fund-of-funds or the MA, RA, CB.
Publicity The financial intermediary (AFI) will follow the binding publication requirements, performing adequate publicity activities to inform potential eligible undertakings about the financial instrument and its provided opportunities.
The growth loans instrument will be implemented under the de minimis regulation, in compliance with all the applicable rules and provisions. The financial intermediary (AFI) is a public institution, and there will be no private body involved in the implementation process that could require an additional assessment of possible state aid implications apart from the de minimis aid at the level of final beneficiaries.
The sub-section 4.3.2 describes all criteria that must be met to implement the financial instrument. The sub-section 4.3.5 outlines all procedures and tasks necessary for the implementation of the financial instrument. Consequently, the approval of the assessment by the monitoring committee on April 30, 2015 provides that criteria for the financial instrument (set in the assessment) are approved. Implementation of financial instruments should start after approval of state aid programs by the Cabinet of Ministers without additional decisions by the monitoring committee.
4.3.3. Additional Resources Attracted
Considering that the ESI Funds will not finance the growth loans instrument, no additional public or private resources are to be raised for the initiative, there is no leverage effect.
4.3.4. Expected Results
Although the financial instrument is not financed by the ESI Funds, but for the monitoring purposes of performance assessment, the expected result, output and performance indicators comparable to
197

other instruments are applied also to the envisaged growth loans instrument, and the methodology for calculation and principles of measurement of these indicators are provided below:
Type of indicator
Name of indicator Unit Baseline Target Source
Result indicators
Number of SMEs per 1000 inhabitants
Number36,9
(2013)40
(2023)
SME Performance
Review
SME productivity per 1 employee
EUR12 196(2013)
16 575(2023)
SME Performance
Review
Output indicators
Supported enterprises Number - 107 Monitoring
Private investments matching public support to SMEs
EUR - - Monitoring
Performance indicators
Credit loss; volume of defaulted loans / volume of total loans
Percent - 7 Monitoring
Management costs / volume of total loans outstanding
Percent - 1.5 Monitoring
Leverage; total additional funding / ESI Funds funding
Percent - - Monitoring
Methodology for calculating the output and performance indicators:
(1) The number of supported enterprises is calculated, assuming the total budget of the financial instrument is 40 million EUR, decreased by the total management costs (20%), and divided by the growth loan amount of 300 thousand EUR, representing the average amount of growth loans according to the historical data on previously implemented similar instruments;
(2) The management fee of the financial intermediary (AFI) will be set respecting the limits laid out in Article 13 of the Regulation (EU) No 480/2014.
To allow the MA to evaluate the actual performance of the growth loans instrument and to meet the regulatory obligations towards the Commission, the agreement establishing the financial instrument between the financial intermediary (AFI) and the CB will set specific provisions on reporting and monitoring. It will ensure data collection and availability in an acceptable format, as well as operational information and financial reports according to a common template, provided by the financial intermediary (AFI) on quarterly basis. These progress reports will include analyses of progress made in comparison to the investment strategy as well as the provisions of the funding agreement. Since the financial instrument is established as a separate block of finance, the financial
198

report will include documentation on the separate financial accounts in regards to the growth loans fund’s balance sheet, profit and loss, management costs and other accounting measurement units as defined in the agreement.
4.3.5. Implementation Timeline
The timeline for implementation of the growth loans instrument with all relevant procedures and tasks necessary for the implementation of the financial instrument and major milestone dates is provided below:
Activity Tasks Milestone date
Market gap assessment
Examine the supply and demand for growth loans Estimate the amount of market gap and other
aspects of market failure The task is completed and conclusions delivered in
the current document of the market gap assessment
(Additional market research may be required to assess specific aspects of the growth loans instrument in its design phase) April 2015
Design of financial instrument
The major terms of growth loans are presented in the current investment strategy
The financial intermediary (AFI) performs a throughout assessment of the current growth loans measure implemented in the 2007-2013 programming period, drawing on the lessons learned and the changing market conditions
The financial intermediary (AFI) conducts focus groups with selected already and potentially supported enterprises to test and verify assumptions on their perception of the growth loans instrument and the required adjustments
If necessary, the financial intermediary (AFI) performs additional feasibility studies
The financial intermediary (AFI) prepares detailed and comprehensive terms and conditions of the growth loans in compliance with the relevant state aid regulations, and sound financial management principles and practices August 2015
199

Activity Tasks Milestone date
Approval of financial instrument
The regulation draft and the terms and conditions of the growth loans instrument are scrutinised by the relevant authorities of the MA in the field of state aid, to verify the compliance and enforcement of standards
(Additional notification or assistance from the Commission services may be required to ascertain or verify specific interpretations and application of the regulation)
The regulation on the implementation of the growth loans instrument is approved by the Cabinet of Ministers of the Republic of Latvia October 2015
Approval of financial intermediary
Since the growth loans instrument is not funded by the ESI Funds, the financial intermediary (AFI) is directly appointed by the regulation on the implementation of the growth loans
Nevertheless, the financial intermediary (AFI) prepares business plan for the implementation of the growth loans instrument November 2015
Preparations for implementation
The financial intermediary (AFI) performs preparatory tasks defined in the regulation on the implementation of the growth loans instrument
Prepare and approve the financial intermediary’s (AFI) internal procedures and policies in relation to the implementation of growth loans
Allocate and assign required human, technical and other resources
Create a separate block of finance December 2015
Launch of financial instrument
The financial intermediary (AFI) starts to deliver growth loans to the market
From here onwards, the growth loans instrument is implemented according to the relevant national and EU regulations January 2016
200

4.4. Co-lending
After identifying the market failures in the bank lending and mezzanine segment, the investment strategy proposes the following co-lending instrument to address the market gap, and in particular introduce a co-lending product that targets enterprises in their growth development stages that are not able to receive all necessary financing amount from the commercial banks operating in the market due to insufficient collateral, low equity relative to the enterprise’s assets, and/or high credit risk.
4.4.1. Value Added Assessment
The alternative financial public interventions that could potentially address the identified market failures in the bank lending and mezzanine segment and that are considered in the investment strategy within the value added assessment, are provided below:
Public intervention General description Advantages Disadvantages
Portfolio guarantees covering loans by private financial intermediaries
AFI provides a portfolio guarantee to private financial intermediaries (commercial banks) to cover a mezzanine portion of the losses from newly issued loans
Potential to achieve a high leverage effect
Involvement of private market participants, usage of their know-how
Ability to achieve high market penetration, exposure to all existing and potential clients of the private intermediaries
Addresses specific risk exposure constraints of the private intermediaries
Actual disbursement is done only in case of default
Reliance on private initiative to reach the expected output results
To avoid adverse selection, portfolio has to include all transactions that fit the investment strategy, covering loans that would have been issued without the existence of public intervention
Since the portfolio guarantee would diverge from the off the shelf implementation model, additional state aid implications would have to be considered, possibly restricting the
201

Public intervention General description Advantages Disadvantages
Revolving effect, ability to recycle remaining funds
appropriateness of this solution
Grants for enterprises requiring mezzanine financing
A grant scheme subsidizing a portion of investment costs for supported enterprises
Ability to transfer financing directly to the targeted final recipients, control and monitor the actual utilization of funds
Relatively easier to achieve the desired outcome results
No revolving effect, the funding gets fully exhausted, and limited leverage effect hence also low potential market penetration
The high level of support intensity rise concerns over state aid proportionality
Absent or limited participation of private structures, hence no positive externalities and often insufficient assessment of commercial viability and feasibility of supported enterprises
Co-lending provided by AFI
AFI provides co-lending, including mezzanine loans, to SMEs directly in combination with loans from commercial banks
High potential market penetration, proximity to the targeted final recipients in all regions
High flexibility to adjust the terms and conditions of the public intervention and the AFI’s credit policy, if required, as a result of any changes in the market conditions
202

Public intervention General description Advantages Disadvantages
Continuation of the previous co-lending instrument implemented by the AFI and already accepted by the market
Revolving effect, ability to recycle reimbursed and recovered funds
Based on the evaluation of the considered alternative public interventions, in the present market conditions the most feasible solution is that co-lending products, including mezzanine loans, are provided by AFI directly to SMEs in combination with loans from commercial banks.
4.4.2. Proposed Instrument
The implementation model of the co-lending instrument, as intended at the time of drafting the investment strategy, is illustrated below:
Figure 65: the implementation model of the co-lending instrument
203
MA
Fund-of-funds
AFI
funding
Co-lending SBF
SMEs
Commercial banks
co-lending, mezzanine loans
loans
reimbursement, recovery

According to the implementation model, the funding to the co-lending instrument will be provided via AFI. To administer the funding, a separate block of finance (SBF) will be created within the financial intermediary (AFI), the directly appointed financial intermediary. AFI will also contribute borrowed resources to the co-lending instrument in the amount as indicated under the financial instrument’s term sheet. The resources of the co-lending instrument will be spent to issue co-lending loans along loans by commercial banks to SMEs and cover AFI’s management costs. All the reimbursements and recoveries from these co-lending loans, as well as all interest, fees and other related earnings within the financial instrument will be accumulated within the separate block of finance, to be re-utilized as prescribed in the ESI Funds regulations and to be decided on by the RA.
The specific terms and conditions (the term sheet) of the proposed co-lending instrument are provided below:
Scope of financial instrument
The financial instrument is aimed to develop small and medium enterprises in their start-up and growth development stages, by providing co-lending, including mezzanine loans, along with loans by commercial banks.
Implementation model
Within the financial instrument, the national specialised development financing institution (AFI) will provide co-lending, including mezzanine loans, to small and medium enterprises to finance their development.
AFI will create a separate block of finance, recording all the transactions related to the implementation of the financial instrument.
Financial intermediary
The national specialised development financing institution (AFI) meets provisions laid down in the Article 7 of the Regulation no 480/2014, has the required professional experience and capacity; therefore will be directly assigned to implement the financial instrument.
Budget of financial instrument
The ESI funding for the financial instrument is envisaged at 5 million EUR (the amount provided by the fund-of-funds or the MA).
The total budget of the co-lending instrument, including other public financing (the AFI’s borrowed resources), is envisaged to reach 15 million EUR.
Investment amounts Within the financial instrument, the co-lending loan amount to a single enterprise can reach up to 2 million EUR for investments and 250 thousand EUR for working capital, with maturity up to 10 years.
The financial intermediary (AFI) will provide with the co-lending loan if it’s matched by another new loan of at least the same amount by a commercial bank. The co-lending loan may be subordinated to the commercial bank’s loan, and thus take higher credit risk.
Investment period The financial intermediary (AFI) will issue co-lending loans to enterprises for up to 5 years, indicatively till December 31, 2020.
204

Duration of financial instrument
The expected duration of the co-lending instrument is 15 years, which can be extended for further 2 years, if up to that point the financial intermediary (AFI) has not yet received all loan re-payments.
Supported enterprises Eligible undertakings shall be small and medium enterprises.
Eligible undertaking cannot be in financial difficulty.
Eligible undertaking cannot be subject to an outstanding recovery order following a previous Commission decision declaring an aid illegal and incompatible with the internal market.
205

Ineligible sectors and activities
If implemented under de minimis aid, the financial instrument cannot support undertakings in the following sectors and activities:
(1) aid granted in the fishery and aquaculture sector, as covered by Regulation (EU) No 1379/2013 of the European Parliament and of the Council of 11 December 2013 on the common organisation of the markets in fishery and aquaculture products, amending Council Regulations (EC) No 1184/2006 and (EC) No 1224/2009 and repealing council Regulation (EC) No 104/2000;
(2) aid granted in the primary agricultural production sector;(3) aid granted in the sector of processing and marketing of
agricultural products, in the following cases:(i) where the amount of the aid is fixed on the basis of the price or quantity of such products purchased from primary producers or put on the market by the undertakings concerned; or(ii) where the aid is conditional on being partly or entirely passed on to primary producers;
(4) aid to export-related activities towards third countries or Member States, namely aid directly linked to the quantities exported, to the establishment and operation of a distribution network or to other current expenditure linked to the export activity;
(5) aid contingent upon the use of domestic over imported goods;(6) acquisition of road freight transport vehicles for undertaking
performing road freight transport for hire or reward;
In addition, the financial instrument cannot support undertakings in the following sectors and activities:
(1) operations with real estate;(2) gambling and betting activities;(3) production and trade of arms, ammunition, tobacco and tobacco
products, alcoholic beverages.
If implemented under the GBER, the financial instrument cannot support undertakings in the following sectors and activities:
(1) for activities and sectors laid down in Article 1 (2) of the GBER;(2) for activities and sectors laid down in Article 1 (3) of the GBER;(3) for activities and sectors excluded in Article 13 (a) of the GBER.
In addition, the financial instrument cannot support undertakings in the following sectors and activities:
(1) operations with real estate;(2) gambling and betting activities;(3) production and trade of arms, ammunition, tobacco and tobacco
products, alcoholic beverages.
206

State aid regime The financial intermediary (AFI) will provide co-lending loans as de minimis aid, according to Article 4 (3) of the de minimis regulation or as investment aid to SMEs, according to the Article 17 of the GBER.
Investment region The financial intermediary (AFI) will provide co-lending loans only to enterprises that operate in Latvia.
Funding The funding structure of the co-lending instrument:
(1) 33.3% - the fund-of-funds or the MA; and(2) 66.7% - the financial intermediary (AFI).
Management costs The management fee of the financial intermediary (AFI) will be set respecting the limits laid out in Article 13 of the Regulation (EU) No 480/2014.
Principles of corporate governance
The financial intermediary (AFI) will take investment decisions based on business plans, feasibility assessment, and credit risk.
The financial intermediary (AFI) will manage the operations according to commercial principles.
The financial intermediary (AFI) will manage the operations according to the industry’s best practices, as well as the binding regulations of the European structural funds and state aid.
Reporting The financial intermediary (AFI) will provide regular quarterly reports to the RA/CB according to a pre-agreed form.
Monitoring and audit The financial intermediary (AFI) and supported enterprises will have to provide access to all documentation related to the financial instrument and the received support. This access will be provided to representatives of the European Commission, European Court of Auditors, MA, RA, CB.
Publicity The financial intermediary (AFI) will follow the binding publication requirements, performing adequate publicity activities to inform potential eligible undertakings about the financial instrument and its provided opportunities.
The co-lending instrument will be implemented under the de minimis regulation or the investment aid to SMEs, according to the GBER in compliance with all the applicable rules and provisions. The financial intermediary (AFI) is a public institution, and there will be no private body involved in the implementation process at the level of financial instrument that could require an additional assessment of possible state aid implications.
The sub-section 4.4.2 describes all criteria that must be met to implement the financial instrument. The sub-section 4.4.5 outlines all procedures and tasks necessary for the implementation of the financial instrument. Consequently, the approval of the assessment by the monitoring committee on April 30, 2015 provides that criteria for the financial instrument (set in the assessment) are approved. Implementation of financial instruments should start after approval of state aid programs by the Cabinet of Ministers without additional decisions by the monitoring committee.
207
4.4.3. Additional Resources Attracted
Based on the design of the co-lending instrument, the total estimated funding, including the ESI Funds, additional public and private resources raised, as well as the calculated leverage is provided below:
ESI Funds activity / Fund of funds level:The ESI Funds will directly or through the fund of funds transfer 5 million EUR for the co-lending instrument.
Financial intermediary level:The financial intermediary (AFI) will provide further 10 million EUR for the co-lending instrument.
Financial product level:No additional resources are attracted at the level of the co-lending product.
Final recipients level:Co-lending loans will be issued along with loans by commercial banks of at least the same amount, 15 million EUR.
Total funding:Total funding of the ESI Funds, additional public and private resources for the co-lending instrument amounts to 30 million EUR.
Leverage:The achieved leverage, calculated as the total estimated additional public and private resources raised divided by the ESI Funds expenditure, is 500 %.
If at a later stage of the 2014-2020 programming period a decision is made to increase the capacity of the co-lending instrument and at that point there are private investors identified that would be ready to participate in the initiative, the investment strategy will be amended accordingly. Moreover, the financial intermediary (AFI) will perform the exercise of analysing the most effective ways and means of attracting these private resources and the need for and extent of preferential remuneration for the private investors, and any state aid implications that may arise as a result.
Regarding the incentives of commercial banks to issue loans along the subordinated mezzanine loans, the lower credit risk and preferential rights for the recoveries in case of default is embedded in the nature of the financial product per se. The mezzanine loans will not provide any non-
208
.
characteristic or market distorting incentive, remuneration or benefit to commercial banks that could possibly raise any state aid implications.
4.4.4. Expected Results
The expected result, output and performance indicators of the envisaged co-lending instrument, and the methodology for calculation and principles of measurement of these indicators are provided below:
Type of indicator
Name of indicator Unit Baseline Target Source
Result indicators
Number of SMEs per 1000 inhabitants
Number36,9
(2013)40
(2023)
SME Performance
Review
SME productivity per 1 employee
EUR12 196(2013)
16 575(2023)
SME Performance
Review
Output indicators
Supported enterprises Number - 30 Monitoring
Private investments matching public support to SMEs
EUR - - Monitoring
Performance indicators
Credit loss; volume of defaulted loans / volume of total loans
Percent - 5 Monitoring
Management costs / volume of total loans outstanding
Percent - 1.5 Monitoring
Leverage; total additional funding / ESI Funds funding
Percent - 500 Monitoring
Methodology for calculating the output and performance indicators:
(1) The number of supported enterprises is calculated, assuming the total budget of the financial instrument is 15 million EUR, decreased by the total management costs (20%), and divided by the co-lending loan amount of 400 thousand EUR, representing the average amount of co-lending loans according to the historical data on previously implemented similar instruments;
(2) The leverage indicator is calculated as the total additional funding raised divided by the ESI Funds public funding at the level of investment in aggregate volumes. The leverage target amount represents the average leverage achieved according to the historical data on previously implemented similar instruments and considering the terms of the financial instrument in regards to the requirements on additional private funding to be attracted;
209

(3) The management fee of the financial intermediary (AFI) will be set respecting the limits laid out in Article 13 of the Regulation (EU) No 480/2014.
To allow the MA to evaluate the actual performance of the co-lending instrument and to meet the regulatory obligations towards the Commission, the funding agreement establishing the financial instrument between the financial intermediary (AFI) and the CB will set specific provisions on reporting and monitoring. It will ensure data collection and availability in an acceptable format, as well as operational information and financial reports according to a common template, provided by the financial intermediary (AFI) on quarterly basis. These progress reports will include analyses of progress made in comparison to the investment strategy as well as the provisions of the funding agreement. Since the financial instrument is established as a separate block of finance, the financial report will include documentation on the separate financial accounts in regards to the mezzanine loans fund’s balance sheet, profit and loss, management costs and other accounting measurement units as defined in the funding agreement.
4.4.5. Implementation Timeline
The timeline for implementation of the co-lending instrument with all relevant procedures and tasks necessary for the implementation of the financial instrument and major milestone dates is provided below:
Activity Tasks Milestone date
Market gap assessment
Examine the supply and demand for co-lending Estimate the amount of market gap and other
aspects of market failure The task is completed and conclusions delivered in
the current document of the market gap assessment
(Additional market research may be required to assess specific aspects of the co-lending instrument in its design phase) April 2015
210

Activity Tasks Milestone date
Design of financial instrument
The major terms of co-lending are presented in the current investment strategy
The financial intermediary (AFI) performs a throughout assessment of the current co-lending and mezzanine loans measures implemented in the 2007-2013 programming period, drawing on the lessons learned and the changing market conditions
The financial intermediary (AFI) conducts focus groups with selected already and potentially supported enterprises to test and verify assumptions on their perception of the co-lending instrument and the required adjustments
If necessary, the financial intermediary (AFI) performs additional feasibility studies
The financial intermediary (AFI) prepares detailed and comprehensive terms and conditions of co-lending in compliance with the relevant ESI Funds and state aid regulations, and sound financial management principles and practices August 2015
Approval of financial instrument
The MA and the financial intermediary (AFI) prepare a project of national regulation governing the implementation of the co-lending instrument
The regulation draft and the terms and conditions of the co-lending instrument are scrutinised by the relevant authorities
(Additional notification or assistance from the Commission services may be required to ascertain or verify specific interpretations and application of the regulation)
The regulation on the implementation of the co-lending instrument is approved by the Cabinet of Ministers of the Republic of Latvia December 2015
211

Activity Tasks Milestone date
Approval of financial intermediary
The regulation on the implementation of the activity funded by the ESI Funds is prepared and approved by the Cabinet of Ministers of the Republic of Latvia
The RA invites the financial intermediary (AFI) to submit the project and business plan for the implementation of the activity
The financial intermediary (AFI) submits the required documentation to be appraised by the RA/CB
Upon successful completion of this process, the CB and the financial intermediary (AFI) signs the funding agreement January 2016
Preparations for implementation
The financial intermediary (AFI) performs preparatory tasks defined in the funding agreement
Prepare and approve the financial intermediary’s (AFI) internal procedures and policies in relation to the implementation of the co-lending instrument
Allocate and assign required human, technical and other resources
Create a separate block of finance March 2015
Launch of financial instrument
The financial intermediary (AFI) starts to deliver co-lending loans to the market
From here onwards, the co-lending instrument is implemented according to the funding agreement, and the relevant national and EU regulations June 2016
212

4.5. Loan Guarantees
After identifying the market failures in the bank lending, including leasing and factoring segment, the investment strategy proposes the following loan guarantees instrument to address the market gap, and in particular introduce a loan guarantee product that targets enterprises in all development stages that are not able to receive all necessary financing amount from the commercial banks operating in the market due to insufficient collateral and/or high credit risk.
4.5.1. Value Added Assessment
The alternative financial public interventions that could potentially address the identified market failures in the loan guarantees segment and that are considered in the investment strategy within the value added assessment, are provided below:
Public intervention General description Advantages Disadvantages
Portfolio guarantees by AFI covering loans by private financial intermediaries
AFI provides portfolio guarantees to private financial intermediaries (commercial banks) to cover a capped portion of the losses from newly issued loans; in accordance to the off the shelf instrument model for capped portfolio guarantees
Potential to achieve a high leverage effect
Involvement of private market participants, usage of their know-how
Ability to achieve high market penetration, exposure to all existing and potential clients of the private intermediaries
Addresses specific risk exposure constraints of the private intermediaries
Actual disbursement is done only in case of default
Revolving effect, ability to recycle
Reliance on private initiative to reach the expected output results
To avoid adverse selection, portfolio has to include all transactions that fit the investment strategy, covering loans that would have been issued without the existence of public intervention
Previous discussions with the private intermediaries indicate expressed need for additional incentives that entail state aid at the level of the financial intermediary, diverging from the off the shelf model
213

Public intervention General description Advantages Disadvantages
remaining funds
Grants for enterprises requiring financing
A grant scheme subsidizing a portion of investment costs for supported enterprises
Ability to transfer financing directly to the targeted final recipients, control and monitor the actual utilization of funds
Relatively easier to achieve the desired outcome results
No revolving effect, the funding gets fully exhausted, and limited leverage effect hence also low potential market penetration
The high level of support intensity rise concerns over state aid proportionality
Absent or limited participation of private structures, hence no positive externalities and often insufficient assessment of commercial viability and feasibility of supported enterprises
Individual guarantees by AFI covering loans by private financial intermediaries
AFI provides individual guarantees to private financial intermediaries (commercial banks and their subsidiaries) to cover a portion of the losses from newly issued loans
Potential to achieve a high leverage effect
Involvement of private market participants, usage of their know-how
Ability to achieve high market penetration, exposure to all existing and potential clients of the private intermediaries
Addresses specific risk exposure constraints of the private
Reliance on private initiative to reach the expected output results
Application and review process requires more time and documentary processing compared to a portfolio guarantee instrument
214

Public intervention General description Advantages Disadvantages
intermediaries
Actual disbursement is done only in case of default
High flexibility to adjust the terms and conditions of the public intervention and the AFI’s guarantee policy, if required, as a result of any changes in the market conditions
Continuation of the existing loan guarantees instrument implemented by AFI and already accepted by the market
Revolving effect, ability to recycle reimbursed and recovered funds
Based on the evaluation of the considered alternative public interventions, in the present market conditions the most feasible solution is that AFI provides individual guarantees in benefit of SME debt financing. However, AFI will continue the ongoing discussions with commercial banks operating in the market and further promote the concept of portfolio guarantees, particularly in the segment of microloans. Depending on the success of these discussions, the investment strategy could be amended and supplemented with an additional financial instrument. Consequently, the currently envisaged loan guarantee instrument would likely be also amended to avoid risk of support duplication and market distortions by narrowing down the scope and focus of the financial product, possibly excluding microloans that would in that case be covered by portfolio guarantees.
215

4.5.2. Proposed Instrument
The implementation model of the loan guarantees instrument, as intended at the time of drafting the investment strategy, is illustrated below:
Figure 66: the implementation model of the loan guarantees instrument
According to the implementation model, the MA will provide funding for the loan guarantees instrument via the capital of AFI. To administer the funding, a separate block of finance (SBF) will be created within the financial intermediary (AFI), the directly appointed financial intermediary. The ESI funding of the loan guarantees instrument will be spent to issue loan guarantees securing loans by commercial banks to SMEs and cover AFI’s management costs. All the remaining uncalled funds and recoveries from the called loan guarantees, as well as all interest, fees and other related earnings within the financial instrument will remain in/return to/will be accumulated within the separate block of finance, to be re-utilized as prescribed in the ESI Funds regulations and to be decided on by the RA.
The specific terms and conditions (the term sheet) of the proposed loan guarantees instrument are provided below:
Scope of financial instrument
The financial instrument is aimed to develop small and medium enterprises in their start-up and growth development stages, by providing with loan guarantees in order to receive loans from commercial banks.
216
MA
Fund-of-funds
AFI
funding
Loan Guarantees SBF
SMEs
Commercial banks
loans
loan guarantees, compensation recovery
reimbursement, recovery

Implementation model
Within the financial instrument, the national specialised development financing institution (AFI) will provide loan guarantees to small and medium enterprises to finance their development.
AFI will create a loan guarantee fund as a separate block of finance, recording all the transactions related to the implementation of the financial instrument.
Financial intermediary
The national specialised development financing institution (AFI) meets provisions laid down in the Article 7 of the Regulation no 480/2014, has the required professional experience and capacity; therefore will be directly assigned to implement the financial instrument.
Budget of financial instrument
The total budget of the financial instrument is envisaged at 20 million EUR (the amount invested in the loan guarantee fund by the fund-of-funds or the MA).
It is assumed that the financial intermediary’s (AFI) guarantee liabilities will be secured by the state guarantee, thus commercial banks will be able to appraise the loan guarantees as sovereign risk.
Investment amounts Within the financial instrument, the loan guarantee amount to a single enterprise can reach up to 1.5 million EUR for investments and 750 thousand EUR for working capital, with maturity up to 10 years.
The financial intermediary (AFI) issues the loan guarantee to cover up to 80% of the loan amount provided by the commercial bank. The risk sharing is proportional, and un-subordinated.
Investment period The financial intermediary (AFI) will issue loan guarantees to enterprises for up to 5 years, indicatively till December 31, 2020.
Duration of financial instrument
The expected duration of the loan guarantee fund is 15 years, which can be extended for further 2 years, if up to that point the financial intermediary (AFI) is still held liable for guaranteed loan re-payments.
Supported enterprises Eligible undertakings shall be small and medium enterprises.
Eligible undertaking cannot be in financial difficulty.
Eligible undertaking cannot be subject to an outstanding recovery order following a previous Commission decision declaring an aid illegal and incompatible with the internal market.
217

Ineligible sectors and activities
According to Article 1 (1) of the de minimis regulation, the financial instrument cannot support undertakings in the following sectors and activities:
(1) aid granted in the fishery and aquaculture sector, as covered by Regulation (EU) No 1379/2013 of the European Parliament and of the Council of 11 December 2013 on the common organisation of the markets in fishery and aquaculture products, amending Council Regulations (EC) No 1184/2006 and (EC) No 1224/2009 and repealing council Regulation (EC) No 104/2000;
(2) aid granted in the primary agricultural production sector;(3) aid granted in the sector of processing and marketing of
agricultural products, in the following cases:(i) where the amount of the aid is fixed on the basis of the price or quantity of such products purchased from primary producers or put on the market by the undertakings concerned; or(ii) where the aid is conditional on being partly or entirely passed on to primary producers;
(4) aid to export-related activities towards third countries or Member States, namely aid directly linked to the quantities exported, to the establishment and operation of a distribution network or to other current expenditure linked to the export activity;
(5) aid contingent upon the use of domestic over imported goods;(6) acquisition of road freight transport vehicles for undertaking
performing road freight transport for hire or reward;
In addition, the financial instrument cannot support undertakings in the following sectors and activities:
(1) operations with real estate;(2) gambling and betting activities;(3) production and trade of arms, ammunition, tobacco and tobacco
products, alcoholic beverages.
State aid regime The financial intermediary (AFI) will provide loan guarantees as de minimis aid, according to Article 4 (6) of the de minimis regulation.
Investment region The financial intermediary (AFI) will provide loan guarantees only to enterprises that operate in Latvia.
Funding The indicative funding structure of the loan guarantee instrument:
100% - the fund-of-funds or the MA.
Management costs The management fee of the financial intermediary (AFI) will be set respecting the limits laid out in Article 13 of the Regulation (EU) No 480/2014.
218

Principles of corporate governance
The financial intermediary (AFI) will take investment decisions based on business plans, feasibility assessment, and credit risk.
The financial intermediary (AFI) will manage the operations according to commercial principles.
The financial intermediary (AFI) will manage the operations according to the industry’s best practices, as well as the binding regulations of the European structural funds and state aid.
Reporting The financial intermediary (AFI) will provide regular quarterly reports to the RA/CB according to a pre-agreed form.
Monitoring and audit The financial intermediary (AFI) and supported enterprises will have to provide access to all documentation related to the financial instrument and the received support. This access will be provided to representatives of the European Commission, European Court of Auditors, MA, RA, CB.
Publicity The financial intermediary (AFI) will follow the binding publication requirements, performing adequate publicity activities to inform potential eligible undertakings about the financial instrument and its provided opportunities.
The loan guarantees instrument will be implemented under the de minimis regulation, in compliance with all the applicable rules and provisions. The financial intermediary (AFI) is a public institution, and there will be no private body involved in the implementation process at the level of financial instrument that could require an additional assessment of possible state aid implications apart from the de minimis aid at the level of final recipients.
The sub-section 4.5.2 describes all criteria that must be met to implement the financial instrument. The sub-section 4.5.5 outlines all procedures and tasks necessary for the implementation of the financial instrument. Consequently, the approval of the assessment by the monitoring committee on April 30, 2015 provides that criteria for the financial instrument (set in the assessment) are approved. Implementation of financial instruments should start after approval of state aid programs by Cabinet of Ministers without additional decisions by the monitoring committee.
219

4.5.3. Additional Resources Attracted
Based on the design of the loan guarantees instrument, the total estimated funding, including the ESI Funds, additional public and private resources raised, as well as the calculated leverage is provided below:
ESI Funds activity / Fund of funds level:The ESI Funds will directly or through the fund of funds transfer 20 million EUR to the loan guarantee fund.
Financial intermediary level:No further funding at the level of the financial intermediary.
Financial product level:The financial intermediary plans to apply for the COSME Loan Guarantee facility that would increase the capacity of the loan guarantee instrument by at least 40 %, an equivalent of 8 million EUR.
Final recipients level:The loan guarantee fund allows to secure loans at least 4* times over the fund’s amount (the multiplicator effect), and with loan guarantees covering on average 70 % of credit risk; private commercial banks will indirectly facilitate for the initiative further 132 million EUR.
Total funding:Total funding of the ESI Funds, additional public and private resources for the loan guarantee instrument amounts to 160 million EUR – the aggregate amount of loans by commercial banks covered by loan guarantees and issued to SMEs.
Leverage:The achieved leverage, calculated as the total estimated additional public and private resources raised divided by the ESI Funds expenditure, is 967 %.
* The loan guarantee multiplicator of at least 4 is indicative and will be specified in the implementation business plan of the financial instrument, as required by Article 8 (2) of CPR.
220

Considering the market gap analysis and findings and the implementation model of the loan guarantees instrument presented at the current version of the investment strategy, it is not feasible to attract additional private resources at the level of the loan guarantees fund or the financial product itself. However, if at a later stage of the 2014-2020 programming period a decision is made to increase the capacity of the loan guarantees instrument and at that point there are private investors identified that would be ready to participate in the initiative, the investment strategy will be amended accordingly. Moreover, the financial intermediary (AFI) will perform the exercise of analysing the most effective ways and means of attracting these private resources and the need for and extent of preferential remuneration for the private investors, and any state aid implications that may arise as a result.
The financial intermediary (AFI) plans to apply for the COSME Loan Guarantee facility launched by the EC and managed by EIF. If the application gets approved and the loan guarantee instrument gets the backing by COSME, it will further extend the amount of loans that can be covered. Considering the accessible terms and conditions of the COSME facility, particularly the loan guarantee inclusion criteria, the financial intermediary (AFI) estimates that it would extend the instrument’s capacity by at least further 40 %.
Regarding the incentives of commercial banks to issue loans covered by loan guarantees, the losses from defaulted loans are split between commercial bank and the financial intermediary (AFI) proportionally, and there are no features of asymmetric profit or loss sharing. The loan guarantee instrument is accessible to all regulated commercial banks or their subsidiaries operating in the market. The loan guarantees instrument will not provide any non-characteristic or market distorting incentive, remuneration or benefit to commercial banks that could possibly rise any state aid implications.
4.5.4. Expected Results
The expected result, output and performance indicators of the envisaged loan guarantees instrument, and the methodology for calculation and principles of measurement of these indicators are provided below:
Type of indicator
Name of indicator Unit Baseline Target Source
Result indicators
Number of SMEs per 1000 inhabitants
Number36,9
(2013)40
(2023)
SME Performance
Review
SME productivity per 1 employee
EUR12 196(2013)
16 575(2023)
SME Performance
Review
Output indicators
Supported enterprises Number - 128 Monitoring
Private investments matching public support to
EUR - - Monitoring
221

SMEs
Performance indicators
Volume of called guarantees / volume of total guarantees
Percent - 5 Monitoring
Management costs / volume of total guarantees outstanding
Percent - 2 Monitoring
Leverage; total additional funding / ESI Funds funding
Percent - 967 Monitoring
Methodology for calculating the output and performance indicators:
(1) The number of supported enterprises is calculated, assuming the total budget of the financial instrument is 20 million EUR, decreased by the total management costs (20%), multiplied by 4, representing the minimum guarantee fund risk leverage, and divided by the loan guarantee amount of 500 thousand EUR, representing the average amount of loan guarantees according to the historical data on previously implemented similar instruments;
(2) The management fee of the financial intermediary (AFI) will be set respecting the limits laid out in Article 13 of the Regulation (EU) No 480/2014;
(3) The leverage indicator is calculated as the total additional funding raised divided by the ESI Funds public funding at the level of investment in aggregate volumes.
To allow the MA to evaluate the actual performance of the loan guarantees instrument and to meet the regulatory obligations towards the Commission, the funding agreement establishing the financial instrument between the financial intermediary (AFI) and the CB will set specific provisions on reporting and monitoring. It will ensure data collection and availability in an acceptable format, as well as operational information and financial reports according to a common template, provided by the financial intermediary (AFI) on quarterly basis. These progress reports will include analyses of progress made in comparison to the investment strategy as well as the provisions of the funding agreement. Since the financial instrument is established as a separate block of finance, the financial report will include documentation on the separate financial accounts in regards to the loan guarantees SBF’s balance sheet, profit and loss, management costs and other accounting measurement units as defined in the funding agreement.
4.5.5. Implementation Timeline
The timeline for implementation of the loan guarantees instrument with all relevant procedures necessary for the implementation of the financial instrument and tasks and major milestone dates is provided below:
222

Activity Tasks Milestone date
Market gap assessment
Examine the supply and demand for loan guarantees
Estimate the amount of market gap and other aspects of market failure
The task is completed and conclusions delivered in the current document of the market gap assessment
(Additional market research may be required to assess specific aspects of the loan guarantees instrument in its design phase) April 2015
Design of financial instrument
The major terms of the financial instrument (AFI) are presented in the current investment strategy
The financial intermediary (AFI) performs a throughout assessment of the current loan guarantees measure implemented in the 2007-2013 programming period, drawing on the lessons learned and the changing market conditions
The financial intermediary (AFI) conducts focus groups with selected already and potentially supported enterprises to test and verify assumptions on their perception of the loan guarantees instrument and the required adjustments
The financial intermediary (AFI) performs negotiations with other stakeholders, the commercial banks, that are involved in the implementation and as potential beneficiaries of the measure
If necessary, the financial intermediary (AFI) performs additional feasibility studies
The financial intermediary (AFI) prepares detailed and comprehensive terms and conditions of loan guarantees in compliance with the relevant ESI Funds and state aid regulations, and sound financial management principles and practices August 2015
223

Activity Tasks Milestone date
Approval of financial instrument
The MA and the financial intermediary (AFI) prepare a project of national regulation governing the implementation of the loan guarantees instrument
The regulation draft and the terms and conditions of the loan guarantees instrument are scrutinised by the relevant authorities
(Additional notification or assistance from the Commission services may be required to ascertain or verify specific interpretations and application of the regulation)
The regulation on the implementation of the loan guarantees instrument is approved by the Cabinet of Ministers of the Republic of Latvia
September 2015
Approval of financial intermediary
The regulation on the implementation of the activity funded by the ESI Funds is prepared and approved by the Cabinet of Ministers of the Republic of Latvia
The RA invites the financial intermediary (AFI) to submit the project and business plan for the implementation of the activity
The financial intermediary (AFI) submits the required documentation to be appraised by the RA/CB
Upon successful completion of this process, the CB and the financial intermediary (AFI) signs the funding agreement November 2015
Preparations for implementation
The financial intermediary (AFI) performs preparatory tasks defined in the funding agreement
Prepare and approve the financial intermediary’s (AFI) internal procedures and policies in relation to the implementation of the loan guarantees instrument
Allocate and assign required human, technical and other resources
Create a separate block of finance December 2015
224

Activity Tasks Milestone date
Launch of financial instrument
The financial intermediary (AFI) starts to deliver loan guarantees to the market
From here onwards, the loan guarantees instrument is implemented according to the funding agreement, and the relevant national and EU regulations January 2016
225

4.6. Export Credit Guarantees
After identifying the market failures in the export credit insurance segment, the investment strategy proposes the following export credit guarantees instrument to address the market gap, and in particular introduce export credit guarantee products that targets exporting enterprises that are not able to receive export credit insurance from the private insurance companies operating in the market due to unmarketable short, medium and long term export credit commercial and political risks, including domestic trade transactions.
4.6.1. Value Added Assessment
The proposed export credit guarantees instrument and the planned specific financial products provide added value through ability to achieve a leverage effect; high potential market penetration with proximity to the targeted final recipients in all regions; high flexibility to adjust terms and conditions of the public intervention and the AFI’s guarantee policy, if required, as a result of any changes in the market conditions; continuation of the existing export credit guarantees instrument implemented by AFI and already accepted by the market; and the revolving effect, ability to recycle remaining funds.
4.6.2. Proposed Instrument
The implementation model of the export credit guarantees instrument, as intended at the time of drafting the investment strategy, is illustrated below:
Figure 67: the implementation model of the export credit guarantees instrument
According to the implementation model, AFI will set up a separate block of finance (SBF) created within AFI. AFI will contribute borrowed resources and recycled funding for the export credit
226
AFI
Export Credit Guarantees SBF
SMEs
Commercial banks
trade financing
export credit guarantees, compensation
recovery
Foreign Buyerstrade

guarantees instrument in the amount as indicated under the financial instrument’s term sheet. The resources of the export credit guarantees instrument will be spent to issue export credit guarantees to cover commercial and political risks to exporting SMEs or commercial banks that finance these SMEs and cover AFI’s management costs. All the remaining uncalled funds and recoveries from the called export credit guarantees, as well as all interest, fees and other related earnings within the financial instrument will remain in/return to/will be accumulated within the separate block of finance, to be re-utilized as prescribed in the ESI Funds regulations and to be decided on by the RA.
Following best practice, to ensure the effective implementation of wide range export insurance instruments it is considered to create an credit insurance agency, which will operate as a separate subsidiary of the national specialised development finance institution (AFI). If decision on the introduction of credit insurance agency will be made, the investment strategy will be appropriately adjusted.
The specific terms and conditions (the term sheet) of the proposed export credit guarantees instrument are provided below:
Scope of financial instrument
The financial instrument is aimed to facilitate expansion of small and medium enterprises in all development stages, by providing with export credit guarantees.
Implementation model
Within the financial instrument, the national specialised development financing institution (AFI) will provide export credit guarantees to small and medium enterprises to finance their development.
AFI will create a separate block of finance, recording all the transactions related to the implementation of the financial instrument.
If necessary, AFI will create two sub-accounts within the separate block of finance distinguishing short-term export credit guarantees and medium and long-term export credit guarantees.
Financial intermediary
The national specialised development financing institution (AFI) or special dedicated entity which meets provisions laid down in the Article 7 of the Regulation no 480/2014, has the required professional capacity; therefore will be directly assigned to implement the financial instrument.
Budget of financial instrument
The total budget of the financial instrument is envisaged at 20 million EUR or more
227

Investment amounts Within the financial instrument, the export credit guarantee amount for a single buyer can reach up to 1 million EUR for short-term transactions (with payment period of up to 2 years) and 5 million EUR for medium and long-term transactions (with payment period between 2 and 10 years).
The financial intermediary issues the export credit guarantee to cover up to 90% of the transaction’s commercial and political risk. The risk sharing is proportional, and un-subordinated.
The financial intermediary (AFI) will issue individual guarantees covering commercial and political risks of export transactions made to a single buyer and wholesale guarantees covering export transactions to a portfolio of multiple buyers.
The financial intermediary (AFI) will also cover commercial risks of domestic trade.
Investment period The financial intermediary (AFI) will issue export credit guarantees to enterprises for up to 5 years, indicatively till December 31, 2020.
Duration of financial instrument
The expected duration of the export credit guarantee fund is 7 years for short-term transactions and 15 years for medium and long-term transactions, which both can be extended for further 2 years, if up to that point the financial intermediary (AFI) is still held liable for guaranteed export credit payments.
Supported enterprises Eligible undertaking cannot be in financial difficulty.
Eligible undertaking cannot be subject to an outstanding recovery order following a previous Commission decision declaring an aid illegal and incompatible with the internal market.
Ineligible sectors and activities
Eligible undertakings of all sectors and activities are supported.
228

State aid regime The financial intermediary (AFI) provides export credit guarantees according to rules and regulations laid down by:
(1) Commission communication to the Member States pursuant to Article 88(1) of the Treaty applying Articles 87 and 88 of the Treaty to short-term export-credit insurance; and
(2) The national Export credit guarantee law, adopting Council Directive 98/29/EC of 7 May 1998 on harmonisation of the main provisions concerning export credit insurance for transactions with medium and long-term cover and Council Directive 84/568/EEC of 27 November 1984 concerning the reciprocal obligations of export credit insurance organizations of the Member States acting on behalf of the State or with its support, or of public departments acting in place of such organizations, in the case of joint guarantees for a contract involving one or more subcontracts in one or more Member States of the European Communities.
Investment region The financial intermediary (AFI) will provide export credit guarantees only to enterprises that operate in Latvia.
Funding The indicative funding structure of the export credit guarantee instrument:
100% - the financial intermediary (AFI).
Management costs The management fee of the financial intermediary (AFI) will be set respecting the limits laid out in Article 13 of the Regulation (EU) No 480/2014.
Principles of corporate governance
The financial intermediary (AFI) will take investment decisions based on business plans, feasibility assessment, and export credit risk.
The financial intermediary (AFI) will manage the operations according to commercial principles.
The financial intermediary (AFI) will manage the operations according to the industry’s best practices, as well as the binding regulations of the state aid.
Reporting The financial intermediary (AFI) will provide regular quarterly reports to the RA/CB according to a pre-agreed form.
Monitoring and audit The financial intermediary (AFI) and supported enterprises will have to provide access to all documentation related to the financial instrument and the received support. This access will be provided to representatives of the European Commission, European Court of Auditors, RA, MA, CB.
Publicity The financial intermediary (AFI) will follow the binding publication requirements, performing adequate publicity activities to inform potential eligible undertakings about the financial instrument and its provided opportunities.
229

The export credit guarantees instrument will be implemented according to the applicable national law and European regulations in the area of export credits. The financial intermediary (AFI) is a public institution, and there will be no private body involved in the implementation process at the level of financial instrument that could require an additional assessment of possible state aid implications. Moreover, the applicable state aid regime prohibits export credit guarantee fee or interest rate subsidies or any other form of grant; and the financial intermediary (AFI) will comply with the principle that all transactions have to be conducted under commercial market conditions.
The sub-section 4.6.2 describes all criteria that must be met to implement the financial instrument. The sub-section 4.6.5 outlines all procedures and tasks necessary for the implementation of the financial instrument. Consequently, the approval of the assessment by the monitoring committee provides that criteria for the financial instrument (set in the assessment) are approved. Implementation of financial instruments should start after approval of state aid programs by the Cabinet of Ministers without additional decisions by the monitoring committee.
4.6.3. Additional Resources Attracted
Considering that the ESI Funds will not finance the export credit guarantee instrument, and apart from the financial intermediary’s (AFI) own resources, no additional public or private resources are to be raised for the export credit guarantees directly. There might be a multiplier effect if private commercials banks or factoring companies are financing export transactions.
4.6.4. Expected Results
Although the financial instrument is not financed by the ESI Funds, for the monitoring purposes of performance assessment, the expected result, output and performance indicators comparable to other instruments are applied also to the envisaged export credit guarantees instrument, and the methodology for calculation and principles of measurement of these indicators are provided below:
Type of indicator
Name of indicator Unit Baseline Target Source
Result indicators
Number of SMEs per 1000 inhabitants
Number36,9
(2013)40
(2023)
SME Performance
Review
SME productivity per 1 employee
EUR12 196(2013)
16 575(2023)
SME Performance
Review
Output indicators
Supported enterprises Number - 85 Monitoring
Private investments matching public support to SMEs
EUR - - Monitoring
230

Type of indicator
Name of indicator Unit Baseline Target Source
Performance indicators
Volume of called guarantees / volume of total guarantees
Percent - 5 Monitoring
Management costs / volume of total guarantees outstanding
Percent - 2 Monitoring
Leverage; total additional funding / ESI Funds funding
Percent - - Monitoring
Methodology for calculating the output and performance indicators:
(1) The number of supported enterprises is calculated, assuming the total budget of the financial instrument is 20 million EUR, decreased by the total management costs (20%), multiplied by 4, representing the minimum guarantee fund risk leverage, and divided by the export credit guarantee amount of 750 thousand EUR, representing the average amount of export credit guarantees per enterprise according to the historical data on previously implemented similar instruments and considering the implementation of medium and long-term export credit cover with significantly higher guarantee amounts;
(2) The management fee of the financial intermediary (AFI) will be set respecting the limits laid out in Article 13 of the Regulation (EU) No 480/2014.
To allow the MA to evaluate the actual performance of the export credit guarantees instrument and to meet the regulatory obligations towards the Commission, the agreement establishing the financial instrument between the financial intermediary (AFI) and the CB will set specific provisions on reporting and monitoring. It will ensure data collection and availability in an acceptable format, as well as operational information and financial reports according to a common template, provided by the financial intermediary (AFI) on quarterly basis. These progress reports will include analyses of progress made in comparison to the investment strategy as well as the provisions of the funding agreement. Since the financial instrument is established as a separate block of finance, the financial report will include documentation on the separate financial accounts in regards to the export credit guarantees SBF’s balance sheet, profit and loss, management costs and other accounting measurement units as defined in the agreement.
231

4.6.5. Implementation Timeline
The timeline for implementation of the export credit guarantees instrument with all relevant procedures necessary for the implementation of the financial instrument and tasks and major milestone dates is provided below:
Activity Tasks Milestone date
Market gap assessment
Examine the supply and demand for export credit guarantees
Estimate the amount of market gap and other aspects of market failure
The task is completed and conclusions delivered in the current document of the market gap assessment
(Additional market research may be required to assess specific aspects of the export credit guarantees instrument in its design phase) April 2015
232

Activity Tasks Milestone date
Design of financial instrument
The major terms of export credit guarantees are presented in the current investment strategy
The financial intermediary (AFI) performs a throughout assessment of the current export credit guarantees measure implemented in the 2007-2013 programming period, drawing on the lessons learned and the changing market conditions
The financial intermediary (AFI) conducts focus groups with selected already and potentially supported enterprises to test and verify assumptions on their perception of the export credit guarantees instrument and the required adjustments
The financial intermediary (AFI) performs negotiations with other stakeholders, the commercial banks and broker companies, that are involved in the implementation or as potential beneficiaries of the measure
If necessary, the financial intermediary (AFI) performs additional feasibility studies
The financial intermediary (AFI) prepares detailed and comprehensive terms and conditions of export credit guarantees in compliance with the relevant ESI Funds and state aid regulations, and sound financial management principles and practices August 2015
Approval of financial instrument
The MA and the financial intermediary (AFI) prepare a business plan of the export credit guarantees instrument
The regulation draft and the terms and conditions of the export credit guarantees instrument are scrutinised by the relevant authorities of the MA
(Additional notification or assistance from the Commission services may be required to ascertain or verify specific interpretations and application of the regulation)
The regulation on the implementation of the export credit guarantees instrument is approved by the Cabinet of Ministers of the Republic of Latvia
September 2015
233

Activity Tasks Milestone date
Approval of financial intermediary
The regulation on the implementation of the activity funded by the ESI Funds is prepared and approved by the Cabinet of Ministers of the Republic of Latvia
The CB and the financial intermediary (AFI) signs the funding agreement
November 2016
Preparations for implementation
The financial intermediary (AFI) performs preparatory tasks defined in the funding agreement
Prepare and approve the financial intermediary’s (AFI) internal procedures and policies in relation to the implementation of the export credit guarantees instrument
Allocate and assign required human, technical and other resources
Create a separate block of finance December 2015
Launch of financial instrument
The financial intermediary (AFI) starts to deliver export credit guarantees to the market
From here onwards, the export credit guarantees instrument is implemented according to the funding agreement, and the relevant national and EU regulations January 2016
234

4.7. Accelerators
After identifying the market failures in the technology transfer financing and venture capital segment, the investment strategy proposes the following accelerator instrument to address the market gap, and in particular establish accelerator programs that will provide incubation services and early stage investments in new enterprises in their pre-seed development stages that are not able to receive financing due to high business risks and insufficient supply of financing for technology transfer in the market.
4.7.1. Value Added Assessment
The alternative financial public interventions that could potentially address the identified market failures in the technology transfer financing and venture capital segment and that are considered in the investment strategy within the value added assessment, are provided below:
Public intervention General description Advantages Disadvantages
Grants for enterprises requiring technology transfer financing
A grant scheme subsidizing a portion of technology transfer investment costs for new enterprises
Ability to transfer financing directly to the targeted final recipients, control and monitor the actual utilization of funds
Relatively easier to achieve the desired outcome results
No revolving effect, the funding gets fully exhausted, and limited leverage effect hence also low potential market penetration
The high level of support intensity rise concerns over state aid proportionality
Absent or limited participation of private structures, hence no positive externalities and often insufficient assessment of commercial viability and feasibility of supported enterprises
Accelerators The accelerator fund managed by a private financial intermediary
A leverage effect, dependant on the co-financing amount by
Reliance on private initiative to reach the expected output
235

Public intervention General description Advantages Disadvantages
(fund management company) provides early stage investments for supported enterprises
private investors
Involvement of private market participants, usage of their know-how
The financial intermediary takes an active role in investee enterprises, both monitoring and mentoring
Revolving effect, ability to recycle reimbursed and recovered funds
results
Based on the evaluation of the considered alternative public interventions, in the present market conditions the most feasible solution is accelerators.
236

4.7.2. Proposed Instrument
The implementation model of accelerators, as intended at the time of drafting the investment strategy, is illustrated below:
Figure 68: the implementation model of accelerators
According to the implementation model, the MA will provide funding via the capital of AFI to the fund-of-funds, a separate block of finance created within and managed by AFI. AFI meets provisions laid down in the Article 7 of the Regulation no 480/2014.
Through an open public tender, AFI selects the private financial intermediaries (accelerators) that will implement acceleration programs. All the returns and other related earnings within the financial instrument will return to the fund-of-funds according to the conditions provided below. Returns and other earning will be re-utilized as prescribed in the ESI Funds regulations and to be decided on by the RA.
The specific terms and conditions (the term sheet) of accelerators are provided below:
Scope of financial instrument
The financial instrument is aimed to develop new and innovative small enterprises of technologically intensive sectors in their pre-seed development stages, by providing acceleration services and pre-seed funding.
237
AFI
MA
Fund-of-funds
Accelerators SBF
SMEs
funding
return
Providers of acceleration programs

Implementation model
Within the financial instrument up to 3 accelerators (financial intermediaries) might be selected per call for tender. There will be up to 3 calls for tender for accelerators.
Accelerators (financial intermediaries):
(1) implement fixed term accelerator programs for period of 24 months;
(2) provide equity or quasi-equity investments or loans to specially selected enterprises, to finance the research, assessment and development of their business idea and provide acceleration services;
(3) financial intermediaries can perform follow-on investments in portfolio companies for further development of companies.
Financial intermediaries
Financial intermediaries (accelerators) will be teams of experienced professionals that operate according to the best practices and professional standards of the industry.
The selection of financial intermediaries (accelerators) will be conducted according to the Public Procurement Law.
Budget of financial instrument
The total budget of the financial instrument is envisaged at 10 million EUR.
At the financial instrument level no private financing is envisaged to be attracted.
Investment amounts Within the financial instrument, the initial investment amount in a single enterprise can reach up to 25 thousand EUR.
Acceleration services Financial intermediaries (accelerators) will provide the following acceleration services to the enterprises for a fee:
(1) Office space (mandatory);(2) Secretarial and back-office services (mandatory);(3) Accounting; and(4) Basic legal advisory.
The acceleration services are provided throughout the period of program (from 3 to 6 months).
Investment period Financial intermediaries (accelerators) may provide pre-seed investments in enterprises during the implementation of accelerator programs (for a 24-month period).
The accelerator programs will be financed till December 31, 2021.
238

Supported enterprises According to Article 22 (2) of the GBER, eligible undertakings shall be unlisted small enterprises up to five years following their registration, which have not yet distributed profits and have not been formed through a merger. For eligible undertakings that are not subject to registration the five years eligibility period may be considered to start from the moment when the enterprise either starts its economic activity or is liable to tax for its economic activity.
According to Article 1 (4) (c) of the GBER, eligible undertaking cannot be in financial difficulty.
According to Article 1 (4) (a) of the GBER, eligible undertaking cannot be subject to an outstanding recovery order following a previous Commission decision declaring an aid illegal and incompatible with the internal market.
Ineligible sectors and activities
According to Article 1 (3) of the GBER, the financial instrument cannot support undertakings in the following sectors and activities:
(1) aid to facilitate the closure of uncompetitive coal mines, as covered by Council Decision No 2010/787;
(2) the categories of regional aid excluded in Article 13 of the GBER;
In addition, the financial instrument cannot support undertakings in the following sectors and activities:
(1) operations with real estate;(2) gambling and betting activities;(3) production and trade of arms, ammunition, tobacco and tobacco
products, alcoholic beverages.
State aid regime Financial intermediaries (accelerators) provide investments and acceleration services as aid for start-ups, according to Article 22 of the GBER.
Investment region Financial intermediaries (accelerators) invest at least 50% of the total investment portfolio in enterprises that operate in Latvia.
Investments in enterprises operating outside the programme area will be made considering requirements of Article 70 of the CPR.
Investors The initial investor structure of the accelerator fund is 100 % the fund-of-funds. At the same time financial intermediaries are encouraged to attract private funding as well.
239

Management costs The management fee of the financial intermediary will be determined in the procurement process, however it is envisaged to not exceed on average 5% per annum of the total public funding of the acceleration program.
The management fee will cover all costs, expenses and fees, required to implement the acceleration program with the exception of the costs associated with the accelerator services offered to companies for a fee.
Financial bonuses will be provided in accordance with the results achieved (results will be measured by number of supported companies within accelerator programs, which have attracted next round investments).
Revenue distribution All revenues from pre-seed investments will be distributed in the following order:
(1) investors will get repaid their investments in proportion to their share;
(2) remaining revenues will be distributed – 50% (carry) to the financial intermediary and 50% to the investors.
Principles of corporate governance
Financial intermediaries (accelerators) will take investment decisions based on applications, which include description of product, calculations of turnover and profitability, assessment of feasibility, as well as investment exit strategy.
The financial intermediary makes investments according to commercial principles.
The financial intermediary makes investments according to the industry’s best practices, the guidelines of the European private equity venture capital association, as well as the binding regulations of the European structural funds and state aid.
Reporting The financial intermediaries (accelerators) will provide regular quarterly reports to the fund-of-funds according to a pre-agreed form.
Monitoring and audit The financial intermediaries (accelerators) and supported enterprises will have to provide access to all documentation related to the financial instrument and the received support. This access will be provided to representatives of the European Commission, European Court of Auditors, RA, MA, CB.
Publicity The financial intermediaries (accelerators) follow the binding publication requirements, performing adequate publicity activities to inform potential eligible undertakings about the financial instrument and its provided opportunities.
240

The sub-section 4.7.2 describes all criteria that must be met to implement the financial instrument. The sub-section 4.7.5 outlines all procedures and tasks necessary for the implementation of the financial instrument. Consequently, the approval of the assessment by the monitoring committee on April 30, 2015 provides that criteria for the financial instrument (set in the assessment) are approved. Implementation of financial instruments should start after approval of state aid programs by Cabinet of Ministers without additional decisions by the monitoring committee.
4.7.3. Additional Resources Attracted
No additional public or private resources are to be raised for the accelerators initiative, no leverage effect expected.
4.7.4. Expected Results
The expected result, output and performance indicators of the envisaged accelerators, and the methodology for calculation and principles of measurement of these indicators are provided below:
Type of indicator
Name of indicator Unit Baseline Target Source
Result indicators
Number of SMEs per 1000 inhabitants
Number36,9
(2013)40
(2023)
SME Performance
Review
SME productivity per 1 employee
EUR12 196(2013)
16 575(2023)
SME Performance
Review
Output indicators
Supported new enterprises Number - 90 Monitoring
Inc. supported new innovative and knowledge intensive enterprises
Number - 90 Monitoring
Private investments matching public support to SMEs
EUR - - Monitoring
Performance indicators
Volume of defaulted investments / total investments
Percent - 50 Monitoring
Management costs / volume of total investments outstanding
Percent - 5 Monitoring
Leverage; total additional funding / ESI Funds funding
Percent - - Monitoring
241

To allow the MA to evaluate the actual performance of the accelerator programs and to meet the regulatory obligations towards the Commission, the funding agreement establishing the fund-of-funds between the financial intermediary, AFI and the CB will set specific provisions on reporting and monitoring. It will ensure data collection and availability in an acceptable format, as well as operational information and financial reports according to a common template, provided by the financial intermediary on quarterly basis. These progress reports will include analyses of progress made in comparison to the investment strategy as well as the provisions of the funding agreement. Since the financial instrument is established as a separate legal entity, the financial report will include documentation on the financial statements in regards to the fund’s balance sheet, profit and loss, management costs and other accounting measurement units as defined in the funding agreement.
4.7.5. Implementation Timeline
The timeline for implementation of the accelerators with all relevant procedures necessary for the implementation of the financial instrument and tasks and major milestone dates is provided below:
242
Methodology for calculating the output and performance indicators:
(1) The number of supported enterprises is calculated, assuming the total budget of the financial instrument is 10 million EUR. Considering the specifics of accelerators, which provides investments in innovative and knowledge – intensive projects, accelerators will also contribute to the purpose of the TO no.1 strengthening research, technological development and innovations;
(2) The number of supported new innovative and knowledge-intensive enterprises is derived from the number of total supported enterprises;
(3) The investment default indicator, calculated as the volume of defaulted investments divided by the volume of total investments in percent, represents the average investment default rate according to the historical data on previously implemented similar instruments and that would be acceptable under sound financial management principles and the industry’s best practices, and considering the embedded risk level of the financial instrument;
(4) The management fee of the financial intermediary (AFI) will be set respecting the limits laid out in Article 13 of the Regulation (EU) No 480/2014.;
(5) The leverage indicator is calculated as the total additional funding raised divided by the ESI Funds public funding at the level of investment in aggregate volumes.

Activity Tasks Milestone date
Market gap assessment
Examine the supply and demand for technology transfer financing
Estimate the amount of market gap and other aspects of market failure
The task is completed and conclusions delivered in the current document of the market gap assessment
(Additional market research may be required to assess specific aspects of the financial instrument in its design phase) April 2015
Design of financial instrument
The major terms of the financial instrument are presented in the current investment strategy
The fund-of-funds manager (AFI) performs a throughout assessment of similar measures implemented in the 2007-2013 programming period, drawing on the lessons learned and the changing market conditions
The fund-of-funds manager (AFI) conducts focus groups with selected potentially supported enterprises to test and verify assumptions on their perception of the financial instrument and the required adjustments
The fund-of-funds manager (AFI) performs negotiations with other stakeholders, the fund management companies and investors, that may be involved in the implementation of the measure
If necessary, the fund-of-funds manager (AFI) performs additional feasibility studies
The fund-of-funds manager (AFI) prepares detailed and comprehensive terms and conditions of the accelerator fund in compliance with the relevant ESI Funds and state aid regulations, and sound financial management principles and practices April 2015
243

Activity Tasks Milestone date
Approval of financial instrument
The MA and the fund-of-funds manager (AFI) prepare a project of national regulation governing the implementation of the accelerators
The regulation draft and the terms and conditions of the accelerator fund instrument are scrutinised by the relevant authorities
(Additional notification or assistance from the Commission services may be required to ascertain or verify specific interpretations and application of the regulation)
The regulation on the implementation of the accelerators is approved by the Cabinet of Ministers of the Republic of Latvia May 2015
Selection of financial intermediary
The fund-of-funds manager (AFI) selects the financial intermediary according to a public procurement procedure
The selected financial intermediary and the fund-of-funds manager (AFI) signs the funding agreement (the general partnership agreement) December 2015
Preparations for implementation
The financial intermediary performs preparatory tasks defined in the funding agreement
The financial intermediary allocates and assigns required human, technical and other resources January 2016
Launch of financial instrument
The financial intermediary starts to implement acceleration programs
From here onwards, the accelerators are operating according to the funding agreement, and the relevant national and EU regulations March 2016
4.8. Business Angel Co-Investment Fund
After identifying the market failures in the business angel financing segment, the investment strategy proposes the following business angel co-investment fund instrument to address the market gap, and in particular establish a co-investment fund that will invest in new enterprises in their seed and start-up development stages that are not able to receive adequate amount of financing from business angels operating in the market.
244

4.8.1. Value Added Assessment
The alternative financial public interventions that could potentially address the identified market failures in the business angel financing segment and that are considered in the investment strategy within the value added assessment, are provided below:
Public intervention General description Advantages Disadvantages
Grants for enterprises requiring early stage financing
A grant scheme subsidizing a portion of investment costs for early stage enterprises
Ability to transfer financing directly to the targeted final recipients, control and monitor the actual utilization of funds
Relatively easier to achieve the desired outcome results
No revolving effect, the funding gets fully exhausted, and limited leverage effect hence also low potential market penetration
The high level of support intensity rise concerns over state aid proportionality
Absent or limited participation of private structures, hence no positive externalities and often insufficient assessment of commercial viability and feasibility of supported enterprises
Business angel co-investment fund
The business angel co-investment fund managed by a private financial intermediary (fund management company) provides seed and start-up investments for supported enterprises
A leverage effect, dependant on the co-financing amount by private investors in the co-investment fund and other sources of financing at the level of investment project
Involvement of private market participants, usage of their know-how
Reliance on private initiative to reach the expected output results
245

Public intervention General description Advantages Disadvantages
The financial intermediary takes an active role in investee enterprises, both monitoring and mentoring
Revolving effect, ability to recycle reimbursed and recovered funds
Based on the evaluation of the considered alternative public interventions, in the present market conditions the most feasible solution is the business angel co-investment fund instrument that, apart from the value added effects identified above, also promotes the implementation of a financing model that resembles the best practices of the equity financing industry and is accustomed by the private financial intermediaries, private investors and the market.
4.8.2. Proposed Instrument
The implementation model of the business angel co-investment fund instrument, as intended at the time of drafting the investment strategy, is illustrated below:
Figure 68: the implementation model of the business angels co-investment fund instrument
246
MA
Fund-of-fundsAFI
funding
funding, managementfunding return
Co-Investment Fund Financial intermediaryreturn
SMEsBusiness Angels
realizationsinvestments

According to the implementation model, the MA will provide funding via the capital of AFI to the fund-of-funds, a separate block of finance created within and managed by AFI. AFI meets provisions laid down in the Article 7 of the Regulation no 480/2014.
Through an open public tender, AFI selects the private financial intermediary that will set up the business angel co-investment fund. The fund-of-funds and the financial intermediary will provide funding for the business angel co-investment fund to invest in SMEs along with business angels and cover the financial intermediary’s management costs. All the returns and other related earnings within the financial instrument received along other investors in the business angel co-investment fund will return to the fund-of-funds, to be re-utilized as prescribed in the ESI Funds regulations and to be decided on by the RA.
The specific terms and conditions (the term sheet) of the proposed business angel co-investment fund instrument are provided below:
Scope of financial instrument
The financial instrument is aimed to develop new and innovative small and medium enterprises in their seed and start-up development stage, by providing risk financing in the form of loans, equity and quasi-equity investments, co-financed by business angels.
Implementation model
Within the financial instrument, one business angel co-investment fund (general partnership) will be created and managed by a private financial intermediary (general partner).
The co-investment fund will invest in small and medium enterprises to finance their establishment and access to markets, including follow-on investments to finance their further development.
Financial intermediary
The financial intermediary will be a team of experienced professionals that operate according to the best practices and professional standards of the industry.
The selection of the financial intermediary will be conducted according to the Public Procurement Law.
Budget of financial instrument
The total budget of the financial instrument is envisaged at 10 million EUR (the amount invested in the co-investment fund by the fund-of-funds).
The total subscribed capital of the co-investment fund, including private financing, is envisaged to reach 10.5 million EUR.
Investment amounts Within the financial instrument, the total investment amount in a single enterprise can reach up to 15% of the fund’s subscribed capital, or more if approved by the fund’s advisory board.
The co-investment fund will invest in an enterprise if the investment amount at every stage of the investment is matched by a single or conglomerate of business angel investors on pari passu conditions.
247

Investment period The co-investment fund will invest in enterprises for up to 5 years after the creation of the fund, indicatively till December 31, 2020 and follow-on investments till December 31, 2022.
Duration of financial instrument
The expected duration of the co-investment fund is 10 years, which can be extended for further 2 years, if up to that point the fund has not yet concluded all investment exits.
Supported enterprises According to Article 21 (5) of the GBER, eligible undertakings shall be unlisted small and medium enterprises.
According to Article 1 (4) (c) of the GBER, eligible undertaking cannot be in financial difficulty.
According to Article 1 (4) (a) of the GBER, eligible undertaking cannot be subject to an outstanding recovery order following a previous Commission decision declaring an aid illegal and incompatible with the internal market.
Ineligible sectors and activities
According to Article 1 (3) of the GBER, the financial instrument cannot support undertakings in the following sectors and activities:
(1) aid to facilitate the closure of uncompetitive coal mines, as covered by Council Decision No 2010/787;
(2) the categories of regional aid excluded in Article 13 of the GBER;
In addition, the financial instrument cannot support undertakings in the following sectors and activities:
(1) aid granted in the fishery and aquaculture sector, as covered by Regulation (EU) No 1379/2013 of the European Parliament and of the Council of 11 December 2013 on the common organisation of the markets in fishery and aquaculture products, amending Council Regulations (EC) No 1184/2006 and (EC) No 1224/2009 and repealing council Regulation (EC) No 104/2000;
(2) aid granted in the primary agricultural production sector;(3) aid granted in the sector of processing and marketing of
agricultural products, in the following cases:(i) where the amount of the aid is fixed on the basis of the price or quantity of such products purchased from primary producers or put on the market by the undertakings concerned; or(ii) where the aid is conditional on being partly or entirely passed on to primary producers;
(4) operations with real estate;(5) gambling and betting activities;(6) production and trade of arms, ammunition, tobacco and tobacco
products, alcoholic beverages.
State aid regime The co-investment fund provides investments as risk finance aid, according to Article 21 of the GBER.
248

Investment region The co-investment fund invests at least 90% of the total investment portfolio in enterprises that operate in Latvia.
Investments in enterprises operating outside the programme area will be made considering requirements of Article 70 of the CPR.
Investors The investor structure of the co-investment fund:
(1) from 95% to 98% - the fund-of-funds; and(2) from 2% to 5% - the financial intermediary.
According to Article 21 (5) of the GBER, if the co-investment fund invests in an enterprise that has been operating in any market for more than 7 years following their first commercial sale and the total investment amount would exceed 50% of their average annual turnover in the preceding 5 years, the total private investments has to reach at least 60% at the investment level.
Management costs The management fee of the financial intermediary will be determined in the procurement process, however it is envisaged to not exceed on average 2.5% per annum of the total subscribed capital in the investment period and of the remaining investment portfolio after the investment period.
The management fee will cover all costs, expenses and fees, required to establish and manage the fund’s operations.
The financial intermediary will cover a part of the management fee proportional to their share in the fund’s subscribed capital.
Revenue distribution All fund revenues will be distributed in the following order:
(1) the investors will get repaid their investments in the fund, including the management fees, proportion to their share in the fund’s subscribed capital; and
(2) the remaining revenues will be distributed – 20% (carry) to the financial intermediary and 80% to the investors.
Principles of corporate governance
The financial intermediary will take investment decisions based on investment business plans, which include description of product, calculations of turnover and profitability, assessment of feasibility, as well as investment exit strategy.
The financial intermediary will manage the fund according to commercial principles.
The financial intermediary will manage the fund according to the industry’s best practices, the guidelines of the European private equity venture capital association, as well as the binding regulations of the European structural funds and state aid.
Advisory board The investors of the fund will be elected into a special advisory board that oversees the operations of the financial intermediary and the fund.
249

Reporting The financial intermediary will provide regular quarterly reports to the fund-of-funds according to a pre-agreed form.
Monitoring and audit The financial intermediary and supported enterprises will have to provide access to all documentation related to the financial instrument and the received support. This access will be provided to representatives of the European Commission, European Court of Auditors, RA, MA, CB.
Publicity The financial intermediary will follow the binding publication requirements, performing adequate publicity activities to inform potential eligible undertakings about the financial instrument and its provided opportunities.
The sub-section 4.8.2 describes all criteria that must be met to implement the financial instrument. The sub-section 4.8.5 outlines all procedures and tasks necessary for the implementation of the financial instrument. Consequently, the approval of the assessment by the monitoring committee on April 30, 2015 provides that criteria for the financial instrument (set in the assessment) are approved. Implementation of financial instruments should start after approval of state aid programs by the Cabinet of Ministers without additional decisions by the monitoring committee.
250

4.8.3. Additional Resources Attracted
Based on the design of the business angel co-investment fund instrument, the total estimated funding, including the ESI Funds, additional public and private resources raised, as well as the calculated leverage is provided below:
ESI Funds activity / Fund of funds level:The ESI Funds through the fund of funds will transfer (invest) 10 million EUR to the co-investment fund.
Financial intermediary level:The financial intermediary will provide (invest) further 0.5 million EUR to the co-investment fund.
Financial product level:No additional resources are attracted at the level of the financial product.
Final recipients level:The co-investment fund will provide investments along with business angels for the total estimated aggregate amount of 8.5 million EUR.
Total funding:Total funding of the ESI Funds, additional public and private resources for the co-investment fund instrument amounts to 19 million EUR.
Leverage:The achieved leverage, calculated as the total estimated additional public and private resources raised divided by the ESI Funds expenditure, is 90 %.
Considering the market gap analysis and findings and the implementation model of the business angel co-investment fund instrument presented at the current version of the investment strategy, it is not feasible to attract additional private resources at the level of the co-investment fund apart from the financial intermediary (the fund management company) in the amount of the industry’s standard 2 to 5 % of the fund size, that will be determined precisely during the procurement process. The financial intermediary’s management fee will also be determined during the procurement process and will not exceed the industry’s standard 3 % annual rate. The financial intermediary’s carry rate will be set at the industry’s standard rate of 20 %. No asymmetric profit sharing or downside protection will be provided, i.e. all aggregate fund’s profits and losses will be split proportionally among the fund’s investors.
251

However, if at a later stage of the 2014-2020 programming period a decision is made to increase the capacity of the business angel co-investment fund instrument and at that point there are private investors identified that would be ready to invest in the co-investment fund, the investment strategy will be amended accordingly. Moreover, AFI and the financial intermediary will perform the exercise of analysing the most effective ways and means of attracting these private investors and the need for and extent of preferential remuneration for the private investors, and any state aid implications that may arise as a result.
Regarding the incentives of business angels that will co-invest along with the fund, these business angels will invest on pari passu conditions in at least the same amount as the co-investment fund. These business angels will not receive any asymmetric profit or loss sharing. Moreover, the co-investment fund will not provide any non-characteristic or market distorting incentive, remuneration or benefit to these business angels that could possibly rise any state aid implications.
4.8.4. Expected Results
The expected result, output and performance indicators of the envisaged business angel co-investment fund instrument, and the methodology for calculation and principles of measurement of these indicators are provided below:
Type of indicator
Name of indicator Unit Baseline Target Source
Result indicators
Number of SMEs per 1000 inhabitants
Number36,9
(2013)40
(2023)
SME Performance
Review
SME productivity per 1 employee
EUR12 196(2013)
16 575(2023)
SME Performance
Review
Output indicators
Supported enterprises Number - 33 Monitoring
Incl. supported new innovative and knowledge – intensive enterprises
Number - 17 Monitoring
Private investments matching public support to SMEs
EUR - 500 000 Monitoring
Performance indicators
Volume of defaulted investments / total investments
Percent - 25 Monitoring
Management costs / volume of total investments outstanding
Percent - 3 Monitoring
252

Leverage; total additional funding / ESI Funds funding
Percent - 90 Monitoring
Methodology for calculating the output and performance indicators:
(1) The number of supported enterprises is calculated, assuming the total budget of the financial instrument is 10.5 million EUR, decreased by the total management costs (20%), and divided by the investment amount of 250 thousand EUR. Considering investments in innovative and knowledge – intensive projects, business angels co-investment fund instrument will also contribute to the purpose of the TO no.1 strengthening research, technological development and innovations;
(2) The number of supported new innovative and knowledge – intensive enterprises is derived from the number of total supported enterprises, multiplied by 50%, representing the number of new innovative and knowledge – intensive enterprises supported as a percentage of total supported enterprises;
(3) The target amount of private investments matching public support to SMEs derives from the terms of the financial instrument as envisaged in the current version of the investment strategy, and is subject to change depending on the final terms agreed upon in the financing agreement and as a result of the financial intermediary’s selection process and the amount of private investments proposed/attracted in the process;
(4) The investment loss indicator, calculated as the volume of defaulted investments divided by the volume of total investments in percent, is indicative and represents the average investment default rate according to the historical data on previously implemented similar instruments and that would be acceptable under sound financial management principles and the industry’s best practices, and considering the embedded risk level of the financial instrument; and will be specified in the implementation business plan;
(5) The management fee of the financial intermediary (AFI) will be set respecting the limits laid out in Article 13 of the Regulation (EU) No 480/2014;
(6) The leverage indicator is calculated as the total additional funding raised divided by the ESI Funds public funding at the level of investment in aggregate volumes. The leverage target amount represents the average leverage achieved according to the historical data on previously implemented similar instruments and considering the terms of the financial instrument in regards to the requirements on additional private funding to be attracted.
To allow the MA to evaluate the actual performance of the business angel co-investment fund instrument and to meet the regulatory obligations towards the Commission, the funding agreement establishing the fund-of-funds between the financial intermediary, AFI and the CB will set specific provisions on reporting and monitoring. It will ensure data collection and availability in an acceptable format, as well as operational information and financial reports according to a common template, provided by the financial intermediary on quarterly basis. These progress reports will include analyses of progress made in comparison to the investment strategy as well as the provisions of the funding agreement. Since the financial instrument is established as a separate legal entity, the financial report will include documentation on the financial statements in regards to the fund’s
253

balance sheet, profit and loss, management costs and other accounting measurement units as defined in the funding agreement.
4.8.5. Implementation Timeline
The timeline for implementation of the business angel co-investment fund instrument with all relevant procedures necessary for the implementation of the financial instrument and tasks and major milestone dates is provided below:
Activity Tasks Milestone date
Market gap assessment
Examine the supply and demand for business angel co-investments
Estimate the amount of market gap and other aspects of market failure
The task is completed and conclusions delivered in the current document of the market gap assessment
(Additional market research may be required to assess specific aspects of the business angel co-investment fund in its design phase) April 2015
254

Activity Tasks Milestone date
Design of financial instrument
The major terms of the business angel co-investment fund are presented in the current investment strategy
The fund-of-funds manager (AFI) performs a throughout assessment of similar measures implemented in the 2007-2013 programming period, drawing on the lessons learned and the changing market conditions
The fund-of-funds manager (AFI) conducts focus groups with selected potentially supported enterprises to test and verify assumptions on their perception of the business angel co-investment fund instrument and the required adjustments
The fund-of-funds manager (AFI) performs negotiations with other stakeholders, the fund management companies and investors, that may be involved in the implementation of the measure
If necessary, the fund-of-funds manager (AFI) performs additional feasibility studies
The fund-of-funds manager (AFI) prepares detailed and comprehensive terms and conditions of the business angel co-investment fund in compliance with the relevant ESI Funds and state aid regulations, and sound financial management principles and practices October 2015
Approval of financial instrument
The MA and the fund-of-funds manager (AFI) prepare a project of national regulation governing the implementation of the business angel co-investment fund instrument
The regulation draft and the terms and conditions of the financial instrument are scrutinised by the relevant authorities
(Additional notification or assistance from the Commission services may be required to ascertain or verify specific interpretations and application of the regulation)
The regulation on the implementation of the business angel co-investment fund instrument is approved by the Cabinet of Ministers of the Republic of Latvia December 2015
255

Activity Tasks Milestone date
Selection of financial intermediary
The fund-of-funds manager (AFI) selects the financial intermediary according to a public procurement procedure
The selected financial intermediary and the fund-of-funds manager (AFI) signs the funding agreement (the general partnership agreement) of the business angel co-investment fund October 2016
Preparations for implementation
The financial intermediary performs preparatory tasks defined in the funding agreement
The financial intermediary allocates and assigns required human, technical and other resources
The financial intermediary creates a new legal entity (the general partnership) for the implementation of the business angel co-investment fund
The financial intermediary attracts other private investors as required by the funding agreement November 2016
Launch of financial instrument
The financial intermediary starts to deliver the business angel co-investment fund financing to the market
From here onwards, the business angel co-investment fund is implemented according to the funding agreement, and the relevant national and EU regulations December 2016
256

4.9. Venture Capital Funds
After identifying the market failures in the venture capital financing segment, the investment strategy proposes the following venture capital fund instrument to address the market gap, and in particular establish two venture capital funds that will invest in new enterprises in their start-up development stages that are not able to receive equity financing in the market due to insufficient supply of financing by private investors operating in the market.
4.9.1. Value Added Assessment
The alternative financial public interventions that could potentially address the identified market failures in the venture capital segment and that are considered in the investment strategy within the value added assessment, are provided below:
Public intervention General description Advantages Disadvantages
Grants for enterprises requiring start-up equity financing
A grant scheme subsidizing a portion of investment costs for start-up enterprises
Ability to transfer financing directly to the targeted final recipients, control and monitor the actual utilization of funds
Relatively easier to achieve the desired outcome results
No revolving effect, the funding gets fully exhausted, and limited leverage effect hence also low potential market penetration
The high level of support intensity rise concerns over state aid proportionality
Absent or limited participation of private structures, hence no positive externalities and often insufficient assessment of commercial viability and feasibility of supported enterprises
Venture capital fund The venture capital fund managed by a private financial intermediary (fund
A leverage effect, dependant on the co-financing amount by private investors in
Reliance on private initiative to reach the expected output results
257

Public intervention General description Advantages Disadvantages
management company) provides start-up investments for supported enterprises
the venture capital fund and other sources of financing at the level of investment project
Involvement of private market participants, usage of their know-how
The financial intermediary takes an active role in investee enterprises, both monitoring and mentoring
Revolving effect, ability to recycle reimbursed and recovered funds
Based on the evaluation of the considered alternative public interventions, in the present market conditions the most feasible solution is the venture capital funds instrument that, apart from the value added effects identified above, also promotes the implementation of a financing model that resembles the best practices of the equity financing industry and is accustomed by the private financial intermediaries, private investors and the market.
4.9.2. Proposed Instrument
The implementation model of the venture capital funds instrument, as intended at the time of drafting the investment strategy, is illustrated below:
Figure 69: the implementation model of the venture capital funds instrument
258
MA
Fund-of-fundsAFI
funding
funding, managementfunding return

According to the implementation model, the MA will transfer funding via the capital of AFI to the fund-of-funds, a separate block of finance created within and managed by AFI. AFI meets provisions laid down in the Article 7 of the Regulation no 480/2014.
Through an open public tender, AFI selects the financial intermediary that will set up the venture capital fund. The fund-of-funds, the financial intermediary and other private investors will provide funding for the venture capital fund to invest in SMEs and cover the financial intermediary’s management costs. All the returns and other related earnings within the financial instrument received along other investors in the venture capital fund will return to the fund-of-funds, to be re-utilized as prescribed in the ESI Funds regulations and to be decided on by the RA.
The specific terms and conditions (the term sheet) of the proposed venture capital fund instrument are provided below:
Scope of financial instrument
The financial instrument is aimed to develop new and innovative small and medium enterprises in their start-up development stage, by providing risk financing in the form of loans, equity and quasi-equity investments.
Implementation model
Within the financial instrument, one venture capital fund (general partnership) will be created and managed by a private financial intermediary (general partner).
The venture capital fund will invest in small and medium enterprises to finance their establishment and access to markets, including follow-on investments to finance their further development.
Financial intermediary
The financial intermediary will be a team of experienced professionals that operate according to the best practices and professional standards of the industry.
The selection of the financial intermediary will be conducted according to the Public Procurement Law.
259
Venture Capital Fund Financial intermediary
SMEs
returnPrivate Investors
investments realizations

Budget of financial instrument
The total budget of the financial instrument is envisaged at 30 million EUR (the amount invested in the venture capital fund by the fund-of-funds).
The amount of public resources invested in one venture capital fund is envisaged not to exceed 15 million EUR.
The total subscribed capital of one venture capital fund, including private financing, is envisaged to reach 20 million EUR.
Investment amounts Within the financial instrument, the total investment amount in a single enterprise can reach up to 15% of the fund’s subscribed capital, or more if approved by the fund’s advisory board.
Investment period The venture capital funds will invest in enterprises for up to 5 years after the creation of the fund, indicatively till December 31, 2020 and follow-on investments till December 31, 2022.
Duration of financial instrument
The expected duration of the venture capital funds is 10 years, which can be extended for further 2 years, if up to that point the fund has not yet concluded all investment exits.
Supported enterprises According to Article 21 (5) of the GBER, eligible undertakings shall be unlisted small and medium enterprises.
According to Article 1 (4) (c) of the GBER, eligible undertaking cannot be in financial difficulty.
According to Article 1 (4) (a) of the GBER, eligible undertaking cannot be subject to an outstanding recovery order following a previous Commission decision declaring an aid illegal and incompatible with the internal market.
260

Ineligible sectors and activities
According to Article 1 (3) of the GBER, the financial instrument cannot support undertakings in the following sectors and activities:
(1) aid to facilitate the closure of uncompetitive coal mines, as covered by Council Decision No 2010/787;
(2) the categories of regional aid excluded in Article 13 of the GBER;
In addition, the financial instrument cannot support undertakings in the following sectors and activities:
(1) aid granted in the fishery and aquaculture sector, as covered by Regulation (EU) No 1379/2013 of the European Parliament and of the Council of 11 December 2013 on the common organisation of the markets in fishery and aquaculture products, amending Council Regulations (EC) No 1184/2006 and (EC) No 1224/2009 and repealing council Regulation (EC) No 104/2000;
(2) aid granted in the primary agricultural production sector;(3) aid granted in the sector of processing and marketing of
agricultural products, in the following cases:(i) where the amount of the aid is fixed on the basis of the price or quantity of such products purchased from primary producers or put on the market by the undertakings concerned; or(ii) where the aid is conditional on being partly or entirely passed on to primary producers;
(4) operations with real estate;(5) gambling and betting activities;(6) production and trade of arms, ammunition, tobacco and tobacco
products, alcoholic beverages.
State aid regime The venture capital funds provide investments as risk finance aid, according to Article 21 of the GBER.
Investment region The venture capital funds invest at least 75% of the total investment portfolio in enterprises that operate in Latvia.
Investments in enterprises operating outside the programme area will be made considering requirements of Article 70 of the CPR.
261

Investors The investor structure of the venture capital funds:
(1) 75% - the fund-of-funds;(2) from 2% to 5% - the financial intermediary; and(3) from 20% to 23% - other private investors.
According to Article 21 (11) of the GBER, the venture capital funds will have to invest at least 50% of the total investment portfolio in enterprises that have not been operating in any market.
According to Article 21 (5) of the GBER, if the venture capital funds invests in an enterprise that has been operating in any market for more than 7 years following their first commercial sale and the total investment amount would exceed 50 % of their average annual turnover in the preceding 5 years, the total private investments has to reach at least 60% at the investment level.
Management costs The management fee of the financial intermediary will be determined in the procurement process, however it is envisaged to not exceed on average 2.5% per annum of the total subscribed capital in the investment period and of the remaining investment portfolio after the investment period.
The management fee will cover all costs, expenses and fees, required to establish and manage the fund’s operations.
The financial intermediary will cover a part of the management fee proportional to their share in the fund’s subscribed capital.
Revenue distribution All fund revenues will be distributed in the following order:
(1) the investors will get repaid their investments in the fund, including the management fees, proportion to their share in the fund’s subscribed capital;
(2) the investors will receive 6% (hurdle rate) per annum of their investments in the fund; and
(3) the remaining revenues will be distributed – 20% (carry) to the financial intermediary and 80% to the investors.
Principles of corporate governance
The financial intermediary will take investment decisions based on investment business plans, which include description of product, calculations of turnover and profitability, assessment of feasibility, as well as investment exit strategy.
The financial intermediary will manage the fund according to commercial principles.
The financial intermediary will manage the fund according to the industry’s best practices, the guidelines of the European private equity venture capital association, as well as the binding regulations of the European structural funds and state aid.
262

Advisory board The investors of the fund will be elected into a special advisory board that oversees the operations of the financial intermediary and the fund.
Reporting The financial intermediary will provide regular quarterly reports to the fund-of-funds according to a pre-agreed form.
Monitoring and audit The financial intermediary and supported enterprises will have to provide access to all documentation related to the financial instrument and the received support. This access will be provided to representatives of the European Commission, European Court of Auditors, the fund-of-funds and national bodies that perform audit and supervision functions.
Publicity The financial intermediary will follow the binding publication requirements, performing adequate publicity activities to inform potential eligible undertakings about the financial instrument and its provided opportunities.
The sub-section 4.9.2 describes all criteria that must be met to implement the financial instrument. The sub-section 4.9.5 outlines all procedures and tasks necessary for the implementation of the financial instrument. Consequently, the approval of the assessment by the monitoring committee on April 30, 2015 provides that criteria for the financial instrument (set in the assessment) are approved. Implementation of financial instruments should start after approval of state aid programs by the Cabinet of Ministers without additional decisions by the monitoring committee.
263

4.9.3. Additional Resources Attracted
Based on the design of the venture capital fund instrument, the total estimated funding, including the ESI Funds, additional public and private resources raised, as well as the calculated leverage is provided below:
ESI Funds activity / Fund of funds level:The ESI Funds through the fund of funds will transfer (invest) 30 million EUR to the venture capital fund.
Financial intermediary level:The private investors, including the financial intermediary, will provide (invest) further 10 million EUR to the venture capital fund.
Financial product level:No additional resources are attracted at the level of the financial product.
Final recipients level:The venture capital fund will provide certain investments along with other private investors for the total estimated aggregate amount of 6 million EUR.
Total funding:Total funding of the ESI Funds, additional public and private resources for the co-investment fund instrument amounts to 46 million EUR.
Leverage:The achieved leverage, calculated as the total estimated additional public and private resources raised divided by the ESI Funds expenditure, is 53 %.
Considering the market gap analysis and findings and the implementation model of the venture capital fund instrument presented at the current version of the investment strategy, it is feasible to attract additional private resources, including the financial intermediary’s (the fund management company) contribution, at the level of the venture capital fund for 25 % of the fund size. The financial intermediary’s management fee will be determined during the procurement process and will not exceed the industry’s standard 3 % annual rate. The financial intermediary’s carry rate will be set at the industry’s standard rate of 20 % and will be paid after the industry’s standard hurdle rate of 6 %. No asymmetric profit sharing or downside protection will be provided, i.e. all aggregate fund’s profits and losses will be split proportionally among the fund’s investors.
264

Regarding the incentives of other private investors that will invest along with certain investments by the venture capital fund, these other private investors will invest separately from the venture capital fund and not receive any asymmetric profit or loss sharing, or any other non-characteristic or market distorting incentive, remuneration or benefit that could possibly rise any state aid implications.
4.9.4. Expected Results
The expected result, output and performance indicators of the envisaged venture capital fund instrument, and the methodology for calculation and principles of measurement of these indicators are provided below:
Type of indicator
Name of indicator Unit Baseline Target Source
Result indicators
Number of SMEs per 1000 inhabitants
Number36,9
(2013)40
(2023)
SME Performance
Review
SME productivity per 1 employee
EUR12 196(2013)
16 575(2023)
SME Performance
Review
Output indicators
Supported innovative or knowledge – intensive enterprises
Number - 40 Monitoring
Incl. supported new enterprises
Number - 5 Monitoring
Private investments matching public support to SMEs
EUR - 10 000 000 Monitoring
Performance indicators
Volume of defaulted investments / total investments
Percent - 20 Monitoring
Management costs / volume of total investments outstanding
Percent - 3 Monitoring
Leverage; total additional funding / ESI Funds funding
Percent - 53 Monitoring
Methodology for calculating the output and performance indicators:
(1) The number of supported enterprises is calculated, assuming the total budget of the financial instrument is 40 million EUR, decreased by the total management costs (20%), and divided by the investment amount of 800 thousand EUR, representing the average amount of investments
265

according to the historical data on previously implemented similar instruments. Considering the focus of venture capital investments, it is expected that all investments will be made in innovative and knowledge – intensive projects, thus contributing to the purpose of the TO no.1 strengthening research, technological development and innovations;
(2) The number of supported new enterprises is derived from the number of total supported enterprises, multiplied by 25%, representing the number of new enterprises supported as a percentage of total supported enterprises according to the historical data on previously implemented similar instruments;
(3) The target amount of private investments matching public support to SMEs derives from the terms of the financial instrument as envisaged in the current version of the investment strategy, and is subject to change depending on the final terms agreed upon in the financing agreement and the financial intermediary and as a result of the financial intermediary’s selection process and the amount of private investments proposed/attracted in the process;
(4) The investment loss indicator, calculated as the volume of defaulted investments divided by the volume of total investments in percent, is indicative and represents the average investment default rate according to the historical data on previously implemented similar instruments and that would be acceptable under sound financial management principles and the industry’s best practices, and considering the embedded risk level of the financial instrument; and will be specified in the implementation business plan;
(5) The management fee of the financial intermediary (AFI) will be set respecting the limits laid out in Article 13 of the Regulation (EU) No 480/2014;
(6) The leverage indicator is calculated as the total additional funding raised divided by the ESI Funds public funding at the level of investment in aggregate volumes. The leverage target amount represents the average leverage achieved according to the historical data on previously implemented similar instruments and considering the terms of the financial instrument in regards to the requirements on additional private funding to be attracted.
To allow the MA to evaluate the actual performance of the venture capital fund instrument and to meet the regulatory obligations towards the Commission, the funding agreement establishing the fund and the fund-of-funds between the financial intermediary, AFI and the CB will set specific provisions on reporting and monitoring. It will ensure data collection and availability in an acceptable format, as well as operational information and financial reports according to a common template, provided by the financial intermediary on quarterly basis. These progress reports will include analyses of progress made in comparison to the investment strategy as well as the provisions of the funding agreement. Since the financial instrument is established as a separate legal entity, the financial report will include documentation on the financial statements in regards to the fund’s balance sheet, profit and loss, management costs and other accounting measurement units as defined in the funding agreement.
266

4.9.5. Implementation Timeline
The timeline for implementation of the venture capital funds instrument with all relevant procedures and tasks necessary for the implementation of the financial instrument and major milestone dates is provided below:
Activity Tasks Milestone date
Market gap assessment
Examine the supply and demand for venture capital financing
Estimate the amount of market gap and other aspects of market failure
The task is completed and conclusions delivered in the current document of the market gap assessment
(Additional market research may be required to assess specific aspects of the venture capital fund instrument in its design phase) April 2015
Design of financial instrument
The major terms of the venture capital funds are presented in the current investment strategy
The fund-of-funds manager (AFI) performs a throughout assessment of the current venture capital fund measure implemented in the 2007-2013 programming period, drawing on the lessons learned and the changing market conditions
The fund-of-funds manager (AFI) conducts focus groups with selected already and potentially supported enterprises to test and verify assumptions on their perception of the venture capital fund instrument and the required adjustments
The fund-of-funds manager (AFI) performs negotiations with other stakeholders, the fund management companies and investors, that may be involved in the implementation of the measure
If necessary, the fund-of-funds manager (AFI) performs additional feasibility studies
The fund-of-funds manager (AFI) prepares detailed and comprehensive terms and conditions of the venture capital fund in compliance with the relevant ESI Funds and state aid regulations, and sound financial management principles and practices June 2015
267
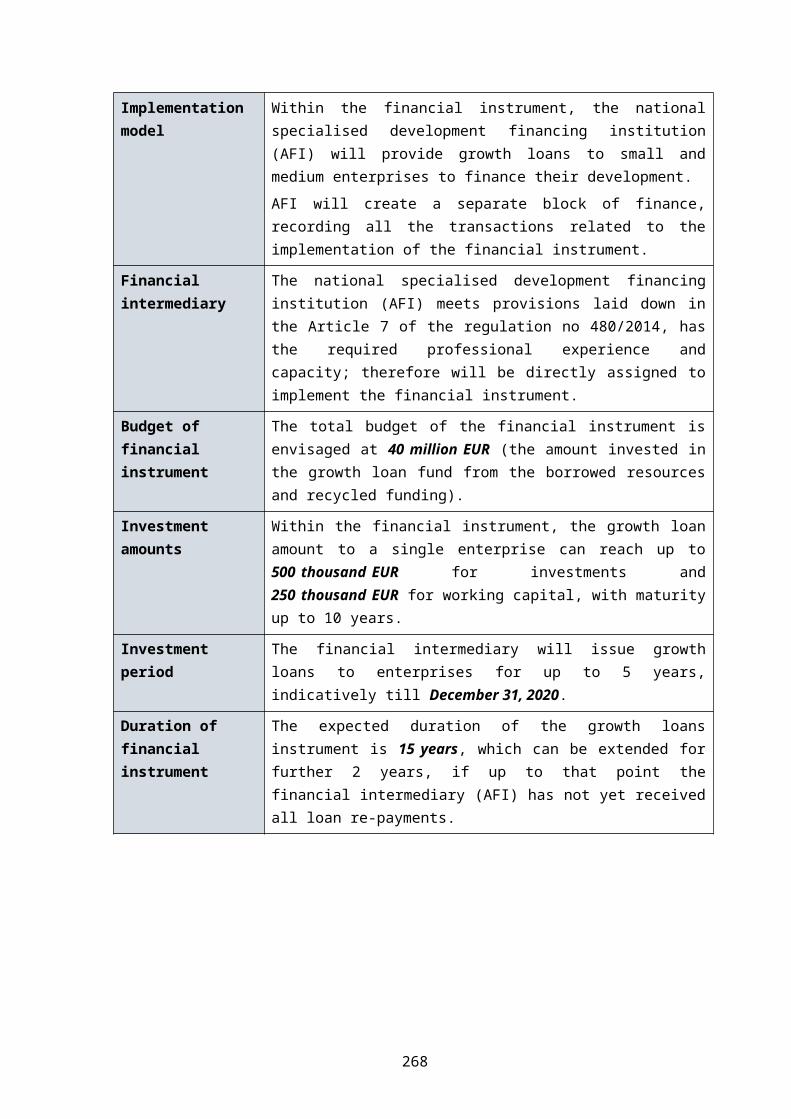
Activity Tasks Milestone date
Approval of financial instrument
The MA and the fund-of-funds manager (AFI) prepare a project of national regulation governing the implementation of the venture capital funds instrument
The regulation draft and the terms and conditions of the financial instrument are scrutinised by the relevant authorities
(Additional notification or assistance from the Commission services may be required to ascertain or verify specific interpretations and application of the regulation)
The regulation on the implementation of the venture capital fund instrument is approved by the Cabinet of Ministers of the Republic of Latvia August 2015
Selection of financial intermediary
The fund-of-funds manager (AFI) selects the financial intermediaries according to a public procurement procedure
The selected financial intermediaries and the fund-of-funds manager (AFI) signs the funding agreement (the general partnership agreement) of the venture capital fund March 2016
Preparations for implementation
The financial intermediaries perform preparatory tasks defined in the funding agreement
The financial intermediaries allocate and assign required human, technical and other resources
The financial intermediaries create a new legal entity (the general partnership) for the implementation of the venture capital fund
The financial intermediaries attract other private investors as required by the funding agreement April 2016
Launch of financial instrument
The financial intermediaries start to deliver the venture capital fund financing to the market
From here onwards, the venture capital funds are implemented according to the funding agreement, and the relevant national and EU regulations May 2016
268
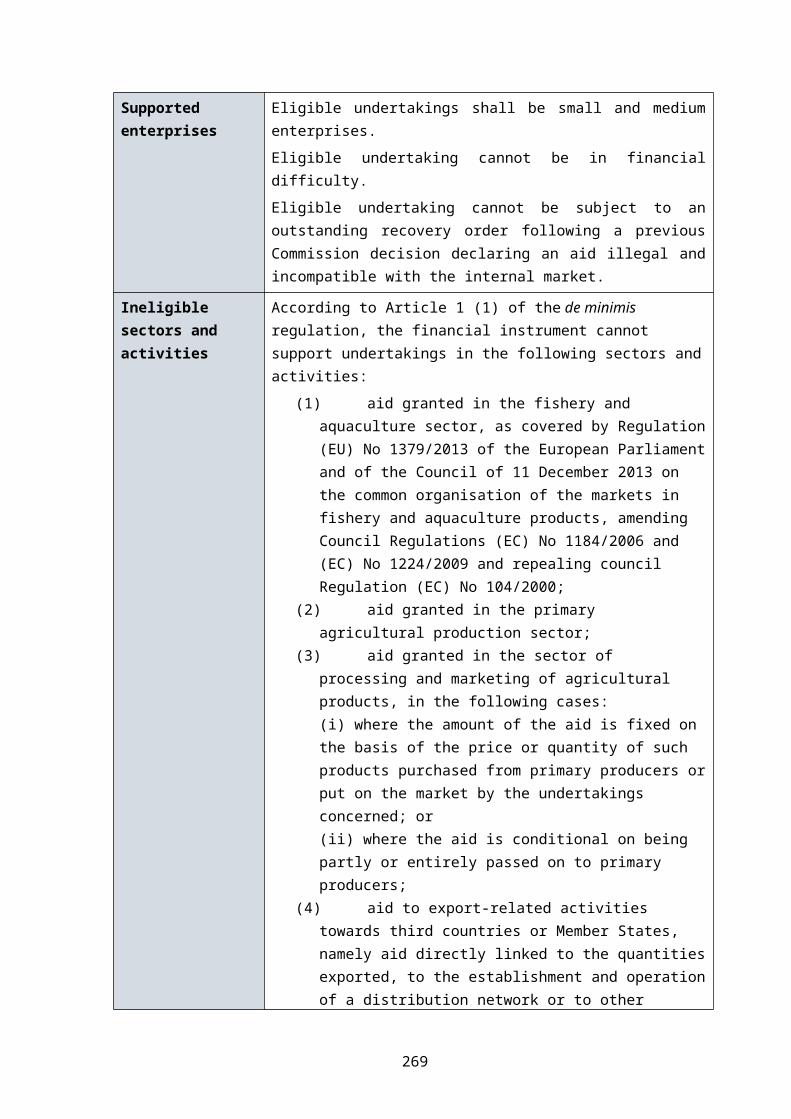
4.10. Growth Capital Funds
After identifying the market failures in the growth capital financing segment, the investment strategy proposes the following growth capital fund instrument to address the market gap, and in particular establish a growth capital funds that will invest in enterprises in their growth development stages that are not able to receive equity financing in the market due to insufficient supply of financing by private investors operating in the market.
4.10.1. Value Added Assessment
The alternative financial public interventions that could potentially address the identified market failures in the growth capital segment and that are considered in the investment strategy within the value added assessment are provided below:
Public intervention General description Advantages Disadvantages
Grants for enterprises requiring growth equity financing
A grant scheme subsidizing a portion of investment costs for supported enterprises
Ability to transfer financing directly to the targeted final recipients, control and monitor the actual utilization of funds
Relatively easier to achieve the desired outcome results
No revolving effect, the funding gets fully exhausted, and limited leverage effect hence also low potential market penetration
The high level of support intensity rise concerns over state aid proportionality
Absent or limited participation of private structures, hence no positive externalities and often insufficient assessment of commercial viability and feasibility of supported enterprises
Growth capital fund The growth capital fund managed by a private financial intermediary (fund
A leverage effect, dependant on the co-financing amount by private investors in
Reliance on private initiative to reach the expected output results
269

Public intervention General description Advantages Disadvantages
management company) provides growth investments for supported enterprises
the growth capital fund and other sources of financing at the level of investment project
Involvement of private market participants, usage of their know-how
The financial intermediary takes an active role in investee enterprises, both monitoring and mentoring
Revolving effect, ability to recycle reimbursed and recovered funds
Based on the evaluation of the considered alternative public interventions, in the present market conditions the most feasible solution is the growth capital fund instrument that, apart from the value added effects identified above, also promotes the implementation of a financing model that resembles the best practices of the equity financing industry and is accustomed by the private financial intermediaries, private investors and the market.
4.10.2. Proposed Instrument
The implementation model of the growth capital fund instrument, as intended at the time of drafting the investment strategy, is illustrated below:
Figure 70: the implementation model of the growth capital fund instrument
270
MA
Fund-of-fundsAFI
funding
funding, managementfunding return

According to the implementation model, the MA will provide funding via the capital of AFI to the fund-of-funds, a separate block of finance created with and managed by AFI. AFI meets provisions laid down in the Article 7 of the Regulation no 480/2014.
Through an open public tender, AFI selects two financial intermediaries that will set up the growth capital fund. The fund-of-funds, the financial intermediary and other private investors will provide funding for the growth capital fund to invest in SMEs and cover the financial intermediary’s management costs. All the returns and other related earnings within the financial instrument received along other investors in the growth capital fund will return to the fund-of-funds, to be re-utilized as prescribed in the ESI Funds regulations and to be decided on by the RA.
The specific terms and conditions (the term sheet) of the proposed growth capital fund instrument are provided below:
Scope of financial instrument
The financial instrument is aimed to develop innovative small and medium enterprises in their growth development stage, by providing risk financing in the form of loans, equity and quasi-equity investments.
Implementation model
Within the financial instrument, two growth capital funds (general partnerships) will be created and managed by private financial intermediaries (general partners).
The growth capital funds will invest in small and medium enterprises to finance their growth, product development and access to new markets, including follow-on investments to finance their further development.
Financial intermediary
The financial intermediaries will be teams of experienced professionals that operate according to the best practices and professional standards of the industry.
The selection of the financial intermediaries will be conducted according to the Public Procurement Law.
Budget of financial instrument
The total budget of the financial instrument is envisaged at 35 million EUR (the amount invested in the growth capital funds by the fund-of-funds).
The total subscribed capital of the growth capital funds, including private financing, is envisaged to reach 58 million EUR.
271
Growth Capital Funds Financial intermediaries
SMEs
returnPrivate Investors
investments realizations

Investment amounts Within the financial instrument, the total investment amount in a single enterprise can reach up to 15% of the fund’s subscribed capital, or more if approved by the fund’s advisory board.
Investment period The growth capital funds will invest in enterprises for up to 5 years after the creation of the fund, indicatively till December 31, 2020 and follow-on investments till December 31, 2022.
Duration of financial instrument
The expected duration of the growth capital funds is 10 years, which can be extended for further 2 years, if up to that point the fund has not yet concluded all investment exits.
Supported enterprises According to Article 21 (5) of the GBER, eligible undertakings shall be unlisted small and medium enterprises.
According to Article 1 (4) (c) of the GBER, eligible undertaking cannot be in financial difficulty.
According to Article 1 (4) (a) of the GBER, eligible undertaking cannot be subject to an outstanding recovery order following a previous Commission decision declaring an aid illegal and incompatible with the internal market.
Ineligible sectors and activities
According to Article 1 (3) of the GBER, the financial instrument cannot support undertakings in the following sectors and activities:
(1) aid to facilitate the closure of uncompetitive coal mines, as covered by Council Decision No 2010/787;
(2) the categories of regional aid excluded in Article 13 of the GBER;
In addition, the financial instrument cannot support undertakings in the following sectors and activities:
(1) aid granted in the fishery and aquaculture sector, as covered by Regulation (EU) No 1379/2013 of the European Parliament and of the Council of 11 December 2013 on the common organisation of the markets in fishery and aquaculture products, amending Council Regulations (EC) No 1184/2006 and (EC) No 1224/2009 and repealing council Regulation (EC) No 104/2000;
(2) aid granted in the primary agricultural production sector;(3) aid granted in the sector of processing and marketing of
agricultural products, in the following cases:(i) where the amount of the aid is fixed on the basis of the price or quantity of such products purchased from primary producers or put on the market by the undertakings concerned; or(ii) where the aid is conditional on being partly or entirely passed on to primary producers;
(4) operations with real estate;(5) gambling and betting activities;(6) production and trade of arms, ammunition, tobacco and tobacco
products, alcoholic beverages.
272
State aid regime The growth capital funds provide investments as risk finance aid, according to Article 21 of the GBER.
Investment region The growth capital funds invest at least 90% of the total investment portfolio in enterprises that operate in Latvia.
Investments in enterprises operating outside the programme area will be made considering requirements of Article 70 of the CPR.
Investors The investor structure of the growth capital funds:
(1) 60% - the fund-of-funds;(2) from 2% to 5% - the financial intermediary; and(3) from 35% to 38% - other private investors.
According to Article 21 (5) of the GBER, if the growth capital fund invests in an enterprise that has been operating in any market for more than 7 years following their first commercial sale and the total investment amount would exceed 50 % of their average annual turnover in the preceding 5 years, the total private investments has to reach at least 60% at the investment level.
Management costs The management fee of the financial intermediaries will be determined in the procurement process, however it is envisaged to not exceed on average 2.5% per annum of the total subscribed capital in the investment period and of the remaining investment portfolio after the investment period.
The management fee will cover all costs, expenses and fees, required to establish and manage the fund’s operations.
The financial intermediaries will cover a part of the management fee proportional to their share in the fund’s subscribed capital.
Revenue distribution All fund revenues will be distributed in the following order:
(1) the investors will get repaid their investments in the fund, including the management fees, proportion to their share in the fund’s subscribed capital;
(2) the investors will receive 6% (hurdle rate) per annum of their investments in the fund; and
(3) the remaining revenues will be distributed – 20% (carry) to the financial intermediary and 80% to the investors.
273

Principles of corporate governance
The financial intermediaries will take investment decisions based on investment business plans, which include description of product, calculations of turnover and profitability, assessment of feasibility, as well as investment exit strategy.
The financial intermediaries will manage funds according to commercial principles.
The financial intermediaries will manage funds according to the industry’s best practices, the guidelines of the European private equity venture capital association, as well as the binding regulations of the European structural funds and state aid.
Advisory board The investors of the funds will be elected into a special advisory board that oversees the operations of the financial intermediaries and the funds.
Reporting The financial intermediaries will provide regular quarterly reports to the RA/CB according to a pre-agreed form.
Monitoring and audit The financial intermediaries and supported enterprises will have to provide access to all documentation related to the financial instrument and the received support. This access will be provided to representatives of the European Commission, European Court of Auditors, RA, MA, CB.
Publicity The financial intermediaries will follow the binding publication requirements, performing adequate publicity activities to inform potential eligible undertakings about the financial instrument and its provided opportunities.
The sub-section 4.10.2 describes all criteria that must be met to implement the financial instrument. The sub-section 4.10.5 outlines all procedures and tasks necessary for the implementation of the financial instrument. Consequently, the approval of the assessment by the monitoring committee on April 30, 2015 provides that criteria for the financial instrument (set in the assessment) are approved. Implementation of financial instruments should start after approval of state aid programs by the Cabinet of Ministers without additional decisions by the monitoring committee.
4.10.3. Additional Resources Attracted
Based on the design of the growth capital fund instrument, the total estimated funding, including the ESI Funds, additional public and private resources raised, as well as the calculated leverage is provided below:
ESI Funds activity / Fund of funds level:The ESI Funds through the fund of funds will transfer (invest) 35 million EUR to the growth capital fund.
274

Financial intermediary level:The private investors, including the financial intermediary, will provide (invest) further 23 million EUR to the growth capital fund.
Financial product level:No additional resources are attracted at the level of the financial product.
Final recipients level:The growth capital fund will provide certain investments along with other private investors for the total estimated aggregate amount of 7 million EUR.
Total funding:Total funding of the ESI Funds, additional public and private resources for the co-investment fund instrument amounts to 65 million EUR.
Leverage:The achieved leverage, calculated as the total estimated additional public and private resources raised divided by the ESI Funds expenditure, is 86 %.
Considering the market gap analysis and findings and the implementation model of the growth capital fund instrument presented at the current version of the investment strategy, it is feasible to attract additional private resources, including the financial intermediary’s (the fund management company) contribution, at the level of the growth capital fund for 40 % of the fund size. The financial intermediary’s management fee will be determined during the procurement process and will not exceed the industry’s standard 3 % annual rate. The financial intermediary’s carry rate will be set at the industry’s standard rate of 20 % and will be paid after the industry’s standard hurdle rate of 6 %. No asymmetric profit sharing or downside protection will be provided, i.e. all aggregate fund’s profits and losses will be split proportionally among the fund’s investors.
Regarding the incentives of other private investors that will invest along with certain investments by the growth capital fund, these other private investors will invest separately from the growth capital fund and not receive any asymmetric profit or loss sharing, or any other non-characteristic or market distorting incentive, remuneration or benefit that could possibly rise any state aid implications.
4.10.4. Expected Results
The expected result, output and performance indicators of the envisaged growth capital fund instrument, and the methodology for calculation and principles of measurement of these indicators are provided below:
275

Type of indicator
Name of indicator Unit Baseline Target Source
Result indicators
Number of SMEs per 1000 inhabitants
Number36,9
(2013)40
(2023)
SME Performance
Review
SME productivity per 1 employee
EUR12 196(2013)
16 575(2023)
SME Performance
Review
Output indicators
Supported enterprises Number - 31 Monitoring
Supported new enterprises Number - - Monitoring
Private investments matching public support to SMEs
EUR - 23 000 000 Monitoring
Performance indicators
Volume of defaulted investments / total investments
Percent - 15 Monitoring
Management costs / volume of total investments outstanding
Percent - 3 Monitoring
Leverage; total additional funding / ESI Funds funding
Percent - 86 Monitoring
Methodology for calculating the output and performance indicators:
(1) The number of supported enterprises is calculated, assuming the total budget of the financial instrument is 58 million EUR, decreased by the total management costs (20%), and divided by the investment amount of 1.5 million EUR, representing the average amount of investments according to the historical data on previously implemented similar instruments;
(2) The target amount of private investments matching public support to SMEs derives from the terms of the financial instrument as envisaged in the current version of the investment strategy, and is subject to change depending on the final terms agreed upon in the financing agreement and as a result of the financial intermediary’s selection process and the amount of private investments proposed/attracted in the process;
(3) The investment loss indicator, calculated as the volume of defaulted investments divided by the volume of total investments in percent, represents the average investment default rate according to the historical data on previously implemented similar instruments and that would be acceptable under sound financial management principles and the industry’s best practices, and considering the embedded risk level of the financial instrument;
(4) The management fee of the financial intermediary will be set respecting the limits laid out in Article 13 of the Regulation (EU) No 480/2014;
276

(5) The leverage indicator is calculated as the total additional funding raised divided by the ESI Funds public funding at the level of investment in aggregate volumes. The leverage target amount represents the average leverage achieved according to the historical data on previously implemented similar instruments and considering the terms of the financial instrument in regards to the requirements on additional private funding to be attracted.
To allow the MA to evaluate the actual performance of the growth capital fund instrument and to meet the regulatory obligations towards the Commission, the funding agreement establishing the fund and the fund-of-funds between the financial intermediary, AFI and the CB will set specific provisions on reporting and monitoring. It will ensure data collection and availability in an acceptable format, as well as operational information and financial reports according to a common template, provided by the financial intermediary on quarterly basis. These progress reports will include analyses of progress made in comparison to the investment strategy as well as the provisions of the funding agreement. Since the financial instrument is established as a separate legal entity, the financial report will include documentation on the financial statements in regards to the fund’s balance sheet, profit and loss, management costs and other accounting measurement units as defined in the funding agreement.
4.10.5. Implementation Timeline
The timeline for implementation of the growth capital fund instrument with all relevant procedures and tasks necessary for the implementation of the financial instrument and major milestone dates is provided below:
Activity Tasks Milestone date
Market gap assessment
Examine the supply and demand for growth capital financing
Estimate the amount of market gap and other aspects of market failure
The task is completed and conclusions delivered in the current document of the market gap assessment
(Additional market research may be required to assess specific aspects of the growth capital fund instrument in its design phase) April 2015
277

Activity Tasks Milestone date
Design of financial instrument
The major terms of the growth capital fund are presented in the current investment strategy
The fund-of-funds manager (AFI) performs a throughout assessment of the current growth capital fund measure implemented in the 2007-2013 programming period, drawing on the lessons learned and the changing market conditions
The fund-of-funds manager (AFI) conducts focus groups with selected already and potentially supported enterprises to test and verify assumptions on their perception of the growth capital fund instrument and the required adjustments
The fund-of-funds manager (AFI) performs negotiations with other stakeholders, the fund management companies and investors, that may be involved in the implementation of the measure
If necessary, the fund-of-funds manager (AFI) performs additional feasibility studies
The fund-of-funds manager (AFI) prepares detailed and comprehensive terms and conditions of the growth capital fund in compliance with the relevant ESI Funds and state aid regulations, and sound financial management principles and practices June 2015
Approval of financial instrument
The MA and the fund-of-funds manager (AFI) prepare a project of national regulation governing the implementation of the growth capital fund instrument
The regulation draft and the terms and conditions of the financial instrument are scrutinised by the relevant authorities
(Additional notification or assistance from the Commission services may be required to ascertain or verify specific interpretations and application of the regulation)
The regulation on the implementation of the growth capital fund instrument is approved by the Cabinet of Ministers of the Republic of Latvia August 2015
278
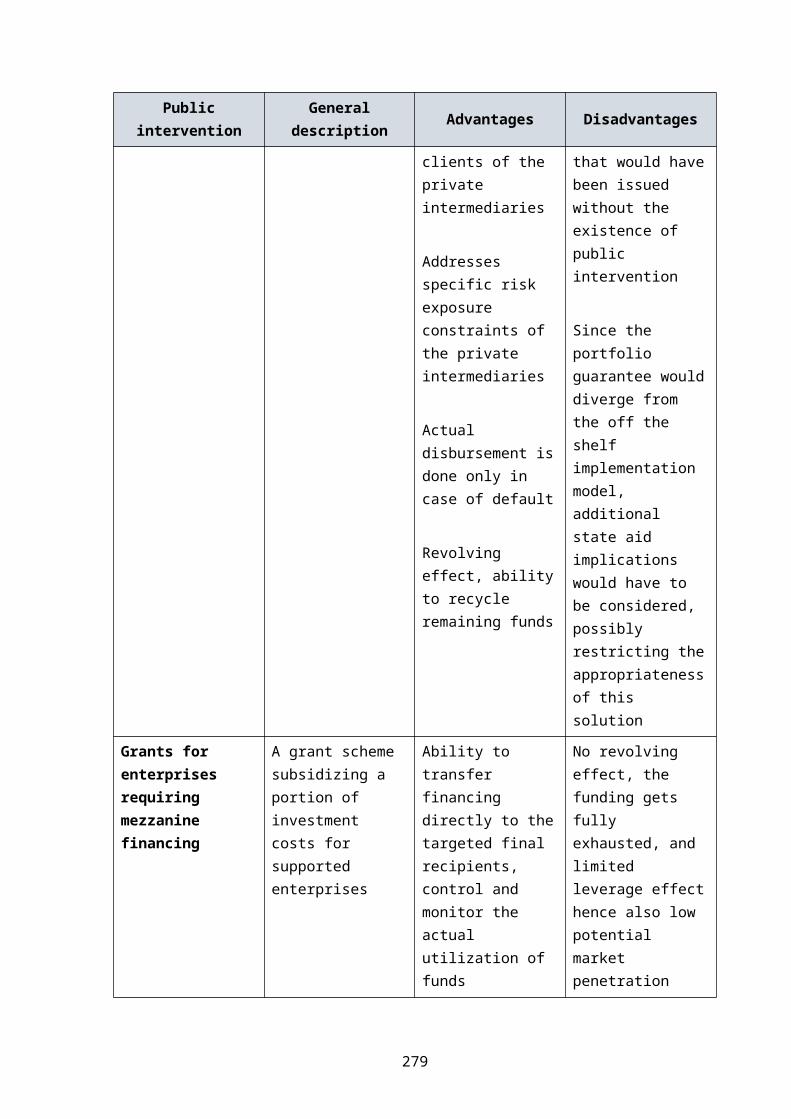
Activity Tasks Milestone date
Selection of financial intermediary
The fund-of-funds manager (AFI) selects the financial intermediary according to a public procurement procedure
The selected financial intermediary and the fund-of-funds manager (AFI) signs the funding agreement (the general partnership agreement) of the growth capital fund March 2016
Preparations for implementation
The financial intermediary performs preparatory tasks defined in the funding agreement
The financial intermediary allocates and assigns required human, technical and other resources
The financial intermediary creates a new legal entity (the general partnership) for the implementation of the growth capital fund
The financial intermediary attracts other private investors as required by the funding agreement
September 2016
Launch of financial instrument
The financial intermediary starts to deliver the growth capital fund financing to the market
From here onwards, the growth capital fund instrument is implemented according to the funding agreement, and the relevant national and EU regulations October 2016
279
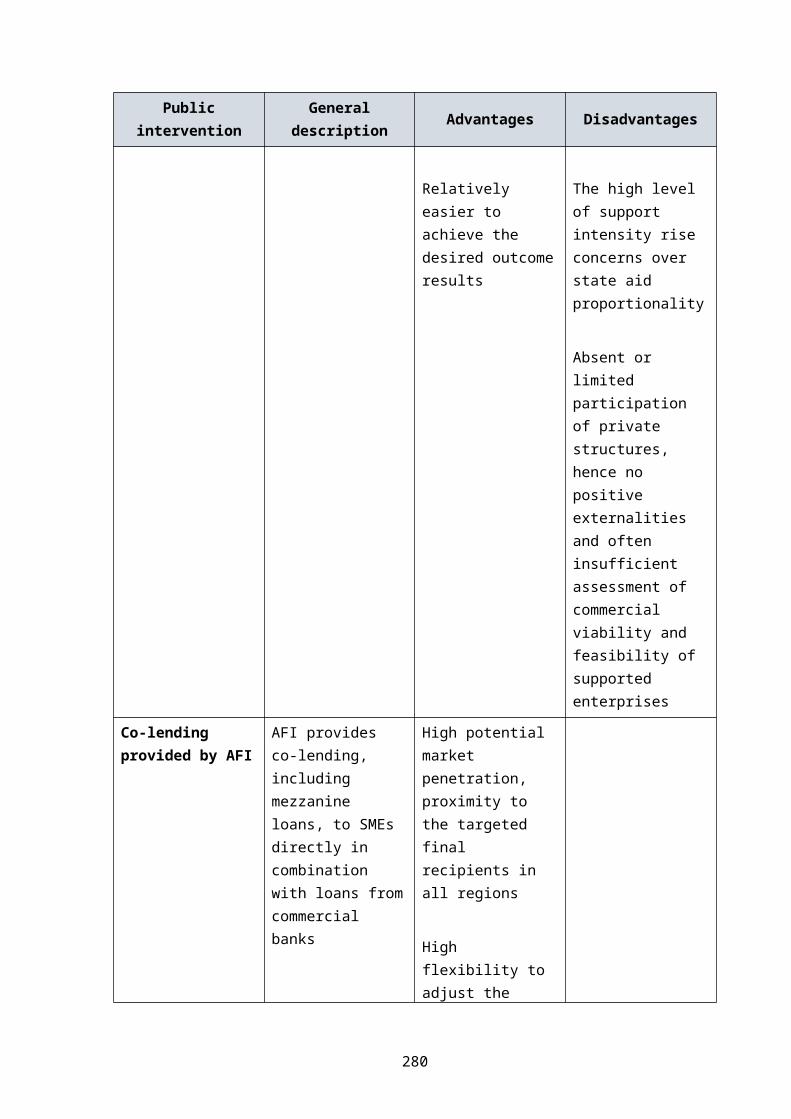
4.11. Rescue and Restructuring Facility
After identifying the market failures in the rescue and restructuring financing segment, the investment strategy proposes the following rescue and restructuring guarantees and loans instrument (potentially grant)to address the market gap, and in particular introduce guarantee and loan products that targets enterprises in financial difficulties that are not able to receive financing from the private financial intermediaries operating in the market due to their financial situation and consequential high credit risks.
4.11.1. Value Added Assessment
Since the envisaged financial instrument described below in this chapter directly follows the applicable EU regulations, the value added assessment does not consider any alternative financial instrument solutions that could potentially address the identified market failures in the rescue and restructuring financing segment.
Nonetheless, the proposed recue and restructuring guarantees and loans instrument and the planned specific financial products provide added value through high potential market penetration with proximity to the targeted final recipients in all regions; high flexibility to adjust terms and conditions of the public intervention and the AFI’s guarantee and credit policy, if required, as a result of any changes in the market conditions; and the revolving effect, ability to recycle remaining funds.
4.11.2. Proposed Instrument
The implementation model of the rescue and restructuring guarantees and loans instrument, as intended at the time of drafting the investment strategy, is illustrated below:
Figure 71: the implementation model of the rescue and restructuring guarantees and loans instrument
280
AFIRescue and Restructuring SBF
SMEs
Commercial banks
loans
guarantees, compensation recovery
reimbursement, recoveryloans

AFI will set up a separate block of finance within AFI for the implementation of the rescue and restructuring instrument. AFI will contribute recycled funding from the financial instruments of the 2007-2013 programming period, to the financial instrument in the amount as indicated under the financial instrument’s term sheet. The resources of the financial instrument will be spent to issue guarantees securing loans by commercial banks to SMEs and/or directly issue loans to SMEs, or provide grants to SMEs and cover AFI’s management costs. All the remaining uncalled funds and recoveries from the called guarantees, loan reimbursements and recoveries, as well as all interest, fees and other related earnings within the financial instrument will remain in/return/will be accumulated within the separate block of finance, to be re-utilized as to be decided on by the RA.
The specific terms and conditions (the term sheet) of the proposed rescue and restructuring guarantees and loans instrument are provided below:
Scope of financial instrument
The financial instrument is aimed to rescue and restructure small and medium enterprises in difficulties that can return to economic viability, by providing rescue and restructuring guarantees and loans. Rescue and temporary restructuring support may also be granted to undertakings that are not in difficulty but that are facing acute liquidity needs due to exceptional and unforeseen circumstances.
Implementation model
Within the financial instrument, the national specialised development financing institution (AFI) will provide rescue and restructuring guarantees and loans to small and medium enterprises to finance their recovery.
AFI will create a rescue and restructuring guarantee and loan fund as a separate block of finance, recording all the transactions related to the implementation of the financial instrument.
Financial intermediary
The national specialised development financing institution (AFI) meets provisions laid down in the Article 7 of the Regulation no 480/2014, has the required professional experience and capacity; therefore will be directly assigned to implement the financial instrument.
Budget of financial instrument
The total amount of the rescue and restructuring guarantee and loan fund (recycled funding) is envisaged to reach 10 million EUR.
Investment amounts Within the financial instrument, the rescue and restructuring guarantee and loan amount to a single enterprise can reach up to 500 thousand EUR.
The financial intermediary (AFI) may also provide a grant of a limited amount to cover additional costs related to the rescue and restructuring of SME.
Investment period The financial intermediary will issue rescue and restructuring guarantees and loans to enterprises for up to 5 years, indicatively till December 31, 2020.
281

Duration of financial instrument
The expected duration of the rescue and restructuring guarantee and loan fund is 15 years, which can be extended for further 2 years, if up to that point the financial intermediary (AFI) has not yet received all loan re-payments or the financial intermediary (AFI) is still held liable for guaranteed loan re-payments.
Supported enterprises Eligible undertakings shall be small and medium enterprises, registered not earlier than 3 years ago.
Eligible undertaking shall be in financial difficulty.
Eligible undertaking cannot be subject to an outstanding recovery order following a previous Commission decision declaring an aid illegal and incompatible with the internal market.
Ineligible sectors and activities
The financial instrument cannot support undertakings in the following sectors and activities:
(1) the coal sector;(2) the steel sector;(3) the financial sector;(4) the rail transport sector;(5) operations with real estate;(6) gambling and betting activities;(7) production and trade of arms, ammunition, tobacco and tobacco
products, alcoholic beverages.
State aid regime The financial intermediary (AFI) provides rescue and restructuring guarantees and loans within an aid scheme for SMEs to be approved according to the Community guidelines on state aid for rescuing and restructuring firms in difficulty.
Investment region The financial intermediary (AFI) will provide rescue and restructuring guarantees and loans, and grants only to enterprises that operate in Latvia.
Funding The funding structure of the rescue and restructuring guarantee and loan instrument:
100% - the financial intermediary (AFI).
Management costs The management fee of the financial intermediary (AFI) will be set respecting the comparable limits laid out in Article 13 of the Regulation (EU) No 480/2014.
282

Principles of corporate governance
The financial intermediary (AFI) will take investment decisions based on the supported enterprise’s restructuring plan, feasibility assessment, and credit risk.
The financial intermediary (AFI) will manage the operations according to commercial principles.
The financial intermediary (AFI) will manage the operations according to the industry’s best practices, as well as the binding state aid regulations.
Reporting The financial intermediary (AFI) will provide regular quarterly reports to the RA/CB according to a pre-agreed form.
Monitoring and audit The financial intermediary (AFI) and supported enterprises will have to provide access to all documentation related to the financial instrument and the received support. This access will be provided to representatives of the European Commission, European Court of Auditors, RA, MA, CB.
Publicity The financial intermediary (AFI) will follow the binding publication requirements, performing adequate publicity activities to inform potential eligible undertakings about the financial instrument and its provided opportunities.
The sub-section 4.11.2 describes all criteria that must be met to implement the financial instrument. The sub-section 4.11.5 outlines all procedures and tasks necessary for the implementation of the financial instrument. Consequently, the approval of the assessment by the monitoring committee on April 30, 2015 provides that criteria for the financial instrument (set in the assessment) are approved. Implementation of financial instruments should start after approval of state aid programs by the Cabinet of Ministers without additional decisions by the monitoring committee.
4.11.3. Additional Resources Attracted
Considering that the ESI Funds will not finance the rescue and restructuring guarantees and loans instrument, no additional public or private resources are to be raised for the initiative, there is no leverage effect.
4.11.4. Expected Results
Although the financial instrument is not financed by the ESI Funds, but the recycled funds of the 2007-2013 programming period, for the monitoring purposes of performance assessment, the expected result, output and performance indicators comparable to other instruments are applied also to the envisaged rescue and restructuring guarantees and loans instrument, and the methodology for calculation and principles of measurement of these indicators are provided below:
Type of indicator
Name of indicator Unit Baseline Target Source
Result Number of SMEs per 1000 Number 36,9 40 SME
283

indicators
inhabitants (2013) (2023)Performance
Review
SME productivity per 1 employee
EUR12 196(2013)
16 575(2023)
SME Performance
Review
Output indicators
Supported enterprises Number - 20 Monitoring
Supported new enterprises Number - - Monitoring
Private investments matching public support to SMEs
EUR - - Monitoring
Performance indicators
Volume of defaulted projects / total volume of projects
Percent - 25 Monitoring
Management costs / volume of total projects outstanding
Percent - 2 Monitoring
Leverage; total additional funding / ESI Funds funding
Percent - - Monitoring
Methodology for calculating the output and performance indicators:
(1) The number of supported enterprises is calculated, assuming the total budget of the financial instrument is 10 million EUR, decreased by the total management costs (20%), and divided by the average guarantee and/or loan amount of 400 thousand EUR;
(2) The management fee of the financial intermediary (AFI) will be set to cover its costs.
To allow the MA to evaluate the actual performance of the rescue and restructuring guarantees and loans instrument and to meet the regulatory obligations towards the Commission, the agreement establishing the financial instrument between the financial intermediary (AFI) and the CB will set specific provisions on reporting and monitoring. It will ensure data collection and availability in an acceptable format, as well as operational information and financial reports according to a common template, provided by the financial intermediary (AFI) on quarterly basis. These progress reports will include analyses of progress made in comparison to the investment strategy as well as the provisions of the funding agreement. Since the financial instrument is established as a separate block of finance, the financial report will include documentation on the separate financial accounts in regards to the rescue and restructuring guarantees and loans SBF’s balance sheet, profit and loss, management costs and other accounting measurement units as defined in the agreement.
284

4.11.5. Implementation Timeline
The timeline for implementation of the rescue and restructuring guarantees and loans instrument with all relevant procedures and tasks necessary for the implementation of the financial instrument and major milestone dates is provided below:
Activity Tasks Milestone date
Market gap assessment
Examine the supply and demand for rescue and restructuring guarantees and loans
Estimate the amount of market gap and other aspects of market failure
The task is completed and conclusions delivered in the current document of the market gap assessment
(Additional market research may be required to assess specific aspects of the financial instrument in its design phase) April 2015
Design of financial instrument
The major terms of rescue and restructuring guarantees and loans are presented in the current investment strategy
The financial intermediary (AFI) performs a throughout assessment of similar measures implemented in the 2007-2013 programming period, drawing on the lessons learned and the changing market conditions
The financial intermediary (AFI) prepares detailed and comprehensive terms and conditions of rescue and restructuring guarantees and loans in compliance with the relevant state aid regulations, and sound financial management principles and practices July 2015
Approval of financial instrument
The regulation draft and the terms and conditions of the financial instrument (AFI) are scrutinised by the relevant authorities
The financial instrument (AFI) is notified to the Commission according to the relevant regulation and procedures
Upon successful completion of this process, the regulation on the implementation of the rescue and restructuring guarantees and loans instrument is approved by the Cabinet of Ministers of the Republic of Latvia August 2015
285

Activity Tasks Milestone date
Approval of financial intermediary
Since the rescue and restructuring guarantees and loans instrument is not funded by the ESI Funds, the financial intermediary (AFI) is directly appointed by the regulation on the implementation of the financial instrument
Nevertheless, the financial intermediary (AFI) prepares the business plan for the implementation of the financial instrument August 2015
Preparations for implementation
The financial intermediary (AFI) performs preparatory tasks defined in the regulation on the implementation of the rescue and restructuring guarantees and loans instrument
Prepare and approve the financial intermediary’s (AFI) internal procedures and policies in relation to the implementation of the financial instrument
Allocate and assign required human, technical and other resources
Create a separate block of finance August 2015
Launch of financial instrument
The financial intermediary (AFI) starts to deliver rescue and restructuring guarantees and loans to the market
From here onwards, the financial instrument is implemented according to the funding agreement, and the relevant national and EU regulations August 2015
286

4.12. Other Support Activities
After identifying the market failures, including conclusions on the financing eco-system, in additional to the described envisaged financial instruments, the investment strategy proposes the following additional support activities that would improve SME access to finance.
4.12.1. Facility Promoting Pre-Seed Workshops and Networking Events
The market analysis shows that the lack of information on available options to attract private investments is detrimental for the creation and development of new enterprises. On the other hand, private investors struggle to find suitable investment opportunities. As a result, the private equity investment amounts increase so slowly in Latvia.
In order to succeed, start-up companies often need to face international competition, networks and private investors. However, education and guidance on pitching and project presentation in international start-up events (e.g. Slush conference, Pioneers Festival and others) is missing in start-up eco-system of Latvia. The instrument to be launched in accordance with the de minimis aid rules.
To address this market failure, in September 2014 LGA launched a de minimis grant scheme to co-finance training, workshop and networking events for new enterprises organized by private institutions like start-up incubators and business angel co-operations with the total budget of 500 thousand EUR. This scheme promotes private initiatives to educate and guide entrepreneurs on how to conceptualize business ideas, commercialize and apply innovations, as well as present to and network with potential investors and other stakeholders.
The investment strategy proposes to introduce the acceleration funds and business angel co-financing fund instruments within the 2014-2020 programming period that target the same segment of enterprises and in their own way address the same market failures. However, based on the assessment of the results and effectiveness of this grant scheme at the end of year 2015, the MA could decide to prolong the scheme. These public interventions could co-exist, with the grant scheme acting as an additional catalyst promoting entrepreneurship and boosting investment pipeline for the financial instruments. Additional component with the aim to prepare and support most perspective start-up companies for participation in international events could be added to the scheme.
4.12.2. Facility Promoting Access to Stock Exchange Financing
The market analysis indicates that private investors are less eager to invest due to limited exit options. It has been concluded in the market findings and noted by various market participants that promoting SME access to stock exchange financing is one of the alternative solutions. Public interventions in this field would not only facilitate alternative means for SME access to financing, but also allow to diversify investment opportunities for investors and to promote the development of stock exchange market in Latvia. The instrument to be launched in accordance with the de minimis aid rules.
287

Based on the results of an additional impact study and survey of relevant stakeholders, the MA could decide on renewing the grant scheme to support SME entry to the regulated or alternative stock exchange market, previously implemented in the fall of year 2008. The scheme would cover a certain portion of administrative expenses accrued by enterprises in relation to initial public offering, such as the stock exchange entry fee, the annual fee, and charges by certified consultants for preparing a prospect and advising on how to fulfil other documentary requirements.
Another public initiative under consideration is an investment guarantee scheme that would cover for private investors a portion of credit risk of corporate bonds they acquire in the regulated or alternative stock exchange markets. Such a scheme would benefit enterprises that issue corporate bonds as an alternative source of financing.
4.12.3. Initiative Improving SME Awareness of Available Financing Instruments
The market findings also point out that there is a continuous lack of SME awareness of the available private and public financing instruments. Even though there are various information dissemination and publicity channels and knowledge centres already in place under responsibility of different public bodies that share the task of improving this awareness, all these activities are un-coordinated and in most cases with unassessed results and efficiency.
In order to improve on the current situation, it would be required to perform an assessment audit of all available public activities that are implemented to improve SME awareness of the available financing instruments. This assessment should also identify any inadequacies and inefficiencies in achieving a greater level of SME awareness.
Consequently, based on this assessment, a combined and co-ordinated information, publicity and possibly even SME training strategy could be developed to improve SME awareness. The national development financing institution AFI could take on the central role for the implementation of this strategy and any practical activities and tasks required by it.
288

4.13. Summary
The compiled list of all envisaged financial instruments within the investment strategy is provided below:
# Financial instrument
Financing at the level of financial instrument, million EUR
ESI Funds
Other public sources
Private sources
Total budget***
AFI borrowed sources*
Recycled funding 2007
– 2013**
1 Direct microloans 3 7 - - 10
2 Indirect microloans 3 12 - 2,65 16,65
3 Start-up loans 10 10 - - 20
4 Growth loans - 37 3 - 40
5 Co-lending 5 10 - - 15
6 Loan guarantees 20 - - - 20
7 Export credit guarantees - 10 10 - 20
8 Accelerators 10 - - 0 10
9 Business angel co-investment fund 10 - - 0.5 10.5
10 Venture capital fund 30 - - 10 40
11 Growth capital fund 35 - - 23 58
12 Rescue and restructuring facility - 10 - 10
126 86 23 36,15 270,15
Financing at the level of financial instrument is indicative and recycled or other public funding might be added to any financial instruments and later market gap amended.
* the amount of borrowed sources will decrease in proportion to the amount of repaid funding after 2014** unused repaid funding of the 2007-2013 programming period (data on March 2015)*** RA envisage to review and, if necessary, to increase the allocation of funding to FIs in 2018
289

290

The list of implementation timeline is provided below:
Financial instrument
Market gap assessment
Design of financial
instrument
Approval of financial
instrument
Approval of financial
intermediary
Selection of financial
intermediary
Preparations for implementation
Launch of financial
instrumentMicroloans
(direct)
April 2015
August 2015 December 2015 January 2016 February 2016 March 2016
Microloans (indirect) August 2015 December 2015 January 2016 March 2016 June 2016
Start-up Loans August 2015 October 2015 November 2015 December 2015 January 2016
Growth Loans August 2015 October 2015 November 2015 December 2015 January 2016
Co-lending August 2015 December 2015 January 2016 March 2016 June 2016
Loan Guarantees August 2015 September 2015 November 2015 December 2015 January 2016
Export Credit Guarantees August 2015 September
2015 November 2015 December 2015 January 2016
Accelerators April 2015 May 2015 December 2015 January 2016 March 2016Business Angel Co-Investment
Fund
October 2015 December 2015 October 2016 November 2016 December 2016
Venture Capital Funds June 2015 August 2015 March 2016 April 2016 May 2016
Growth Capital Funds June 2015 August 2015 March 2016 September 2016 October 2016
Rescue and Restructuring
FacilityJuly 2015 August 2015 August 2015 August 2015 August 2015

The overview of the market segment coverage by the envisaged financial instruments within the investment strategy is provided below:
Development stage of supported enterprises
Pre-seed Seed Start-up Development Redevelopment
Equity
Loans
Guarantees
Start-up loans Growth loans
Co-lending
Rescue and restructuring facility
Loan guarantees
Export credit guarantees
Accelerator funds
Business angel co-investment fund
Venture capital fund
Growth capital fund
Business microloans

ANNEXES

Annexes
I. Assessment Completeness Checklist
Requirement CPR referenceCovered in the market gap ex-ante
assessment document
Identification of market problems existing in the country or region in which the financial instrument is to be established
Article 37 (2) (a) The market demand and supply analysis of the respective financing segments (sub-chapters of Section 3 “Market Analysis and Findings”)
Analysis of the gap between supply and demand of financing and the identification of suboptimal investment situation
Article 37 (2) (a) The market gap findings of the respective financing segments (sub-chapters of Section 3 “Market Analysis and Findings”)
Quantification of the investment (to the extent possible)
Article 37 (2) (a) The investment strategy and the envisaged financial instruments (Section 4 “Investment Strategy”)
Identification of the quantitative and qualitative dimensions of the value added of the envisaged financial instrument
Article 37 (2) (b) The value added assessment of the envisaged financial instruments (sub-chapters 4.x.1 “Value Added Assessment” of the respective financial instruments in Section 4 “Investment Strategy”)
Comparison of the added value of alternative approaches
Article 37 (2) (b) The value added assessment of the envisaged financial instruments, including the considered alternative solutions (sub-chapters 4.x.1 “Value Added Assessment” of the respective financial instruments in Section 4 “Investment Strategy”)
294

Requirement CPR referenceCovered in the market gap ex-ante
assessment document
Consistency of the envisaged financial instrument with other forms of public intervention
Article 37 (2) (b) The proposed financial instruments and their interrelation with other financial instruments of the investment strategy and other forms of public intervention (sub-chapters 4.x.2 “Proposed Instrument” of the respective financial instruments in Section 4 “Investment Strategy”) and the summary of the financial instruments (sub-chapter 4.13 “Summary” of Section 4 “Investment Strategy”)
State aid implications of the envisaged financial instrument
Article 37 (2) (b) The proposed financial instruments and related state aid implications (sub-chapters 4.x.2 “Proposed Instrument” of the respective financial instruments in Section 4 “Investment Strategy”)
Identification of additional public and private resources to be potentially raised by the envisaged financial instrument and assessment of indicative timing of national co-financing and of additionality contributions (mainly private)
Article 37 (2) (c) The proposed financial instruments and their sources of funding (sub-chapters 4.x.2 “Proposed Instrument” of the respective financial instruments in Section 4 “Investment Strategy”) and overview of additional resources to be attracted (sub-chapters 4.x.3 “Additional Resources Attracted” of the respective financial instruments in Section 4 “Investment Strategy”)
Estimation of the leverage of the envisaged financial instrument
Article 37 (2) (c) The estimation of achievable leverage of the financial instruments (sub-chapters 4.x.3 “Additional Resources Attracted” of the respective financial instruments in Section 4 “Investment Strategy”)
295

Requirement CPR referenceCovered in the market gap ex-ante
assessment document
Assessment of the need for, and level of, preferential remuneration based on experience in relevant markets
Article 37 (2) (c) The overview of preferential remuneration to be applied for the financial instruments, where applicable (sub-chapters 4.x.3 “Additional Resources Attracted” of the respective financial instruments in Section 4 “Investment Strategy”)
Collation of relevant available information on past experiences, particularly those that have been set up in the same country or region as the envisaged financial instrument
Article 37 (2) (d) The financial instruments implemented in the previous programming periods (sub-chapter 2.3 “Existing SME Financing Instruments” of Section 2 “Market Environment”)
Identification of main success factors and/or pitfalls of these past experiences
Article 37 (2) (d) The analysis of the financial instruments implemented in the previous programming periods within the respective financing segments (sub-chapters of Section 3 “Market Analysis and Findings”)
Using the collected information to enhance the performance of the envisaged financial instrument (e.g. risk mitigation)
Article 37 (2) (d) The proposed financial instruments and their terms and conditions, the implementation model and corporate governance arrangements, where applicable (sub-chapters 4.x.2 “Proposed Instrument” of the respective financial instruments in Section 4 “Investment Strategy”)
Definition of the level of detail for the proposed investment strategy (maintaining a certain degree of flexibility)
Article 37 (2) (e) The proposed financial instruments and their term sheets (sub-chapters 4.x.2 “Proposed Instrument” of the respective financial instruments in Section 4 “Investment Strategy”)
Definition of the scale and focus of the financial instrument in line with the results of the market assessments and value added assessment
Article 37 (2) (e) The proposed financial instruments (sub-chapters 4.x.2 “Proposed Instrument” of the respective financial instruments in Section 4 “Investment Strategy”)
296

Requirement CPR referenceCovered in the market gap ex-ante
assessment document
Selection of the financial product to be offered and the target final recipients
Article 37 (2) (e) The proposed financial instruments and specification of the financial products and their target groups (sub-chapters 4.x.2 “Proposed Instrument” of the respective financial instruments in Section 4 “Investment Strategy”)
Definition of the governance structure of the financial instrument
Article 37 (2) (e) The proposed financial instruments and their implementation model, as well as the planned governance structure (sub-chapters 4.x.2 “Proposed Instrument” of the respective financial instruments in Section 4 “Investment Strategy”)
Selection of the most appropriate implementation arrangement and the envisaged combination of grant support
Article 37 (2) (e) The proposed financial instruments and their combination with grant support, where applicable (sub-chapters 4.x.2 “Proposed Instrument” of the respective financial instruments in Section 4 “Investment Strategy”)
Set up and quantification of the expected results of the envisaged financial instrument by means of output indicators, result indicators and financial instrument performance indicators as appropriate
Article 37 (2) (f) The result, output and performance indicators of the financial instruments and the methodology for calculating these indicators (sub-chapters 4.x.4 “Expected Results” of the respective financial instruments in Section 4 “Investment Strategy”)
Specification of how the envisaged financial instrument will contribute to deliver the desired strategic objectives
Article 37 (2) (f) The result and output indicators of the financial instruments contributing for the strategic objectives (sub-chapters 4.x.4 “Expected Results” of the respective financial instruments in Section 4 “Investment Strategy”)
297

Requirement CPR referenceCovered in the market gap ex-ante
assessment document
Definition of the monitoring system in order to efficiently monitor the financial instrument, facilitate reporting requirements and identify any improvement areas
Article 37 (2) (f) The monitoring arrangements of the financial instruments (sub-chapters 4.x.2 “Proposed Instrument” of the respective financial instruments in Section 4 “Investment Strategy”) and the overview of the monitoring system (sub-chapters 4.x.4 “Expected Results” of the respective financial instruments in Section 4 “Investment Strategy”)
Definition of the conditions and/or the timing in which a revision or an update of the ex-ante assessment is needed
Article 37 (2) (g) The planning and conditionality of updating the assessment (sub-chapter 1.5 “Provisions to Review and Update the Assessment” of Section 1 “Introduction”)
Ensure that this flexibility, and trigger points, is reflected in the monitoring and reporting provisions
Article 37 (2) (g) The expected results of the financial instruments and the overview of the monitoring system (sub-chapters 4.x.4 “Expected Results” of the respective financial instruments in Section 4 “Investment Strategy”)
The ex-ante assessment is submitted to the monitoring committee for information purposes and in accordance with fund-specific rules
Article 38 (3) The requirement will be complied with
Publication of summary findings and conclusion of the ex-ante assessment within three months of their date of finalisation
Article 38 (3) The requirement will be complied with; a summary of the assessment will be available publicly on the national ESI Funds information portal www.esfondi.lv
298

II. Note on Survey Analysis
There have been 228 responses obtained from various SMEs based in Latvia. Though the size of the sample is substantial given the time and resource constraints and the size of Latvian economy, the survey results need to be scrutinized to evaluate how reliable the results are for further analysis. Firstly, the sample is compared to the population in order to judge about how representative is the obtained sample to the population of SMEs in Latvia. Secondly, the quality of survey responses is analysed to evaluate more in depth the quality or lack thereof of responses at the level of particular questions.
Sample comparison to population
The sample is analysed and compared to the population of SMEs in Latvia based on three dimensions:
1. Distribution of SMEs by size
2. Distribution by sectors
3. Geographical distribution
Distribution of SMEs by size
Figure 71: Distribution of SMEs in Latvia by size, %
91%
7% 1%0%
Micro Small Medium Others (1)
299

Figure 72: Distribution of the respondents by size, %
72%
16%
6%
6%
Micro Small Medium Others (1)
Note: (1) Others include both large companies and companies with unknown size category
Source: Central Statistical Bureau, available on http://data.csb.gov.lv/pxweb/lv/uzreg/uzreg__ikgad__01_skaits/SR0041.px/?rxid=cdcb978c-22b0-416a-aacc-aa650d3e2ce0; and survey on SMEs
Observation: the sample of respondents is more skewed towards micro companies (91%), and representing less small and medium companies in the sample if compared to the population.
300

Distribution by sectors
Figure 73: Distribution of companies in Latvia by sector, %
(A) AGRICULTURE, FORESTRY AND FISH-ING; 19%
(G) WHOLESALE AND RETAIL TRADE;REPAIR OF MOTOR
VEHICLES AND MOTORCYCLES; 17%
(S) OTHER SERVICE ACTIVITIES; 12%(M) PROFESSIONAL, SCIENTIFIC AND TECHNICAL
ACTIVITIES; 10%
(L) REAL ESTATE ACTIVITIES; 8%
(C) MANUFACTURING; 6%
(F) CONSTRUCTION; 5%
(H) TRANSPORTATION AND STORAGE; 4%
(N) ADMINISTRATIVE AND SUPPORT SERVICE ACTIVITIES; 3%
(Q) HUMAN HEALTH AND SOCIAL WORK ACTIVITIES; 3%
(J) INFORMATION AND COMMUNI-CATION; 3%
(R) ARTS, ENTERTAINMENT AND RECREATION; 3%
(I) ACCOMMODATION AND FOOD SERVICE ACTIVITIES; 2% (P) EDUCATION; 2%
(K) FINANCIAL AND INSURANCE ACTIVITES ; 1% (O) PUBLIC ADMINISTRATION AND DEFENSE; SOCIAL SECURITY; 0%(D) ELECTRICITY,GAS,STEAM AND AIR CONDITIONING
SUPPLY; 0%
(E) WATER SUPPLY;SEWERAGE,WASTE MANAGEMENTAND REMEDIATION ACTIVITIES; 0%
(B) MINING AND QUARRYING; 0%
Source: Central Statistical Bureau, available on http://data.csb.gov.lv/pxweb/lv/uzreg/uzreg__ikgad__01_skaits/SR0020.px/?rxid=cdcb978c-22b0-416a-aacc-aa650d3e2ce0; and survey on SMEs
301

Figure 74: Distribution of the respondents in survey by sector, %
(A) AGRICULTURE, FORESTRY AND FISHING;
27%
(G) WHOLESALE AND RETAIL TRADE;REPAIR OF MOTOR
VEHICLES AND MOTORCYCLES; 10%
(S) OTHER SERVICE ACTIVITIES; 8%
(M) PROFESSIONAL, SCIENTIFIC AND TECHNICALACTIVITIES; 4%
(C) MANUFACTURING; 23%
(F) CONSTRUCTION; 5%
(H) TRANSPORTATION AND STORAGE; 2%
(Q) HUMAN HEALTH AND SOCIAL WORK ACTIVITIES; 3%
(J) INFORMATION AND COMMUNI-CATION; 4%
(R) ARTS, ENTERTAINMENT AND RECREATION; 2%
(I) ACCOMMODATION AND FOOD SERVICE ACTIVITIES; 4%
(P) EDUCATION; 1%
(K) FINANCIAL AND INSURANCE ACTIVITES ; 2%(D) ELECTRICITY,GAS,STEAM AND AIR CONDITIONING
SUPPLY; 2%
(B) MINING AND QUARRYING; 1%
Observation: while most of industries were presented in by the sample of respondents, share of manufacturing industry representative was significantly higher compared to the population, while real estate activities were not covered by the survey sample.
Geographical distribution
Figure 75: Geographical distribution of companies in Latvia, %
56%
10%
12%
10%
12%
Riga regionVidzemeKurzemeZemgaleLatgale
302

Figure 76: Geographical distribution of the respondents, %
26%
25%20%
15%
14%
Riga regionVidzemeKurzemeZemgaleLatgale
Source: CSB, SRG041. Ekonomiski aktīvās statistikas vienības sadalījumā pa lieluma grupām un statistiskajiem reģioniem. Available on http://data.csb.gov.lv/pxweb/lv/uzreg/uzreg__ikgad__01_skaits/SR0041.px/?rxid=cdcb978c-22b0-416a-aacc-aa650d3e2ce0; and conducted survey of SMEs
Observation: while most of the economic activity is in Riga (56% in terms of number of companies), the survey respondents are more dispersed (26% in Riga), while the regions excluding Riga region (Vidzeme, Kurzeme, Zemgale, Latgale) are somewhat similarly distributed if compared to the population.
Survey response quality
Survey on SMEs contained 42 questions to which respondents were asked to give either quantitative or qualitative answers.
Sample of obtained responses was reviewed for visible inconsistencies in data. Several checks were performed:
1. Entries with outliers in quantitative answers used for analysis were excluded from the sample.
2. Entries with visible inconsistencies in responses were eliminated, e.g. respondent indicated supply that exceeds demand or apparent outliers.
Initial review of the sample resulted in exclusion of 46 entries. Apart from the above mentioned sample testing, entries with indicated volumes less than 10 EUR were excluded from calculations, thus avoiding systemic mistakes in the data collection and non-reliable entries.
Conclusion: There are disparities observable if the sample is comparable to the population, suggesting that the survey is not fully representable of the population. However, the disparities are not excessive and it is not unreasonable to conclude that the survey results if extrapolated to the population would provide to some extent an indication of the existence, as well as the size of the market viable gap among other insights.
303

Figure 77: Survey quality
Q1: Geo
grap
hy of r
esponden
ts
Q3 Q5 Q7
Q9: Num
ber o
f em
ploye
es
Q11: Fin
ancia
l data
Q13: How
much
hav
e bee
n SMEs
seek
ing in
2012-2
014 per
iod
Q15: How
succ
essfu
l were
resp
ondent i
n in o
btain
ing t
he fundin
g
Q17Q19
Q21Q23
Q25Q27
Q29Q31
Q33
Q35: How
much
finan
cing d
o you en
visa
ge to
ask f
or 2014-2
016
Q37Q39
Q410%
20%
40%
60%
80%
100%
120%
Note: Key questions used in gap calculations
Source: conducted survey of SMEs
304
% o
f res
pond
ents
of t
otal
re
spon
dent
s

III. Questionnaire for Survey
1. In which region is your company based?
2. In which sector does your business primarily operate?
3. What is the legal form of your business?
4. In which year was your business first established?
5. How was your company started?
• Personally started the business;
• Took over from an existing business;
• Took over from family;
• Spin-off from another company;
• Bought an existing business;
• Spin-off from a University or a research institution project; and
• Other.
6. Would you consider your business as a start-up? A start-up is a young company with a high potential for growth and job creation. (Please indicate Yes or No)
7. What is the current stage of development of your business?
• Seed [business model created, no commercial production];
• Start-up [prospecting, production not commercialised];
• Post-creation [activities started, no profits];
• Expansion / development [development of profitable activities];
• Maturity [stable commercial activities with low or no growth];
• Redeployment; and
• Buyout / transmission.
8. Please indicate if you have any of the following staff (Please indicate Yes or No)
• CEO / Managing Director;
• COO / Head of Operations;
• CFO / Head of Finance;
• Human Resources Director;
• Director for Legal Affairs; and
• CIO / Head of IT.
9. Over the last three years (this year, last year and two years ago), how many full-time
305

equivalent (FTEs) were working in your company on average?
• 0 and 9 employees;
• 10 and 49 employees; and
• 50 and 249 employees.
10. What was the majority ownership situation of your business at the beginning of the last three years (this year, last year and two years ago)?
• Sole proprietor, family and friends;
• Subsidiary of a national company;
• Subsidiary of a foreign company;
• Private equity, i.e. the provision of capital and management expertise to companies in order to create value and generate capital gains after a medium to long holding period;
• Partnership; and
• Listed company.
11. Please provide us with the following financial information regarding your business for the last two years (last year and two years ago):
• Sales;
• Cash;
• Total Assets;
• Total Long-Term Debt;
• Total Short-Term Debt;
• Grants; and
• Proportion of domestic market as compared to international market (% of sales).
12. Over the last three years (this year, last year and two years ago), which source(s) of funding has your company used?
• Short-term loans, bank overdrafts and credit lines;
• Medium and long-term loans;
• Public bank loans;
• Family and / or friends;
• Investments by the owner(s);
• Private grants or donations;
• Government grants;
• Public institutions supporting investments (through commercial banks);
• Leasing;
• Factoring;
306

• Credit guarantees;
• Export credit guarantees;
• Venture capital funds, i.e. capital provided by investors acting together in a fund set up for the purpose of providing finance to start-up and small businesses;
• Technology transfer funds;
• Business angels, i.e. entrepreneurs (usually individual entrepreneurs) who provide capital for a business start-up, usually in return for owning part of the business;
• Replacement, rescue / turnaround and buyout capital;
• Mezzanine or hybrid financing, i.e. loan financing that gives the lender the rights to convert to an equity interest in the business if the loan is not fully repaid on time;
• Private investors;
• Retained earnings;
• Equity investment (including quasi-equity products);
• Corporate bonds;
• Microcredit; and
• Not Applicable: Our company did not use any source of funding.
13. How much of loan and equity funding did you SEEK during the last three years (this year, last year and two years ago) in Euro?
• Loan (all types of credit including microcredit); and
• Equity finance (all types of equity and quasi-equity financing).
14. How much of loan and equity funding did you OBTAIN during the last three years (this year, last year and two years ago) in Euro?
• Loan (all types of credit including microcredit); and
• Equity finance (all types of equity and quasi-equity financing).
15. How successful were you in obtaining each type of the products listed below over the last three years (this year, last year and two years ago)? (Please indicate the level of success for each of the following sources: Successful, Partially successful or Unsuccessful)
• Short-term loans, bank overdrafts and credit lines;
• Medium and long-term loans;
• Leasing;
• Factoring;
• Subsidised loans;
• Subsidies by the government (government grants);
• Foreign government bodies or international organisations;
307

• Trade credits (by suppliers);
• Advanced payments (by customers);
• Credit guarantees;
• Export credit guarantees;
• Venture capital funds, i.e. capital provided by investors acting together in a fund set up for the purpose of providing finance to start-up and small businesses;
• Technology transfer funds;
• Business angels, i.e. entrepreneurs (usually individual entrepreneurs) who provide capital for a business start-up, usually in return for owning part of the business;
• Replacement, rescue / turnaround and buyout capital;
• Mezzanine or hybrid financing i.e. loan financing that gives the lender the rights to convert to an equity interest in the business if the loan is not fully repaid on time;
• Equity; and
• Microcredit.
16. What were the reasons / needs for the financing means you sought over the last three years (this year, last year and two years ago)?
• Finance working capital;
• Ensure debt consolidation;
• Acquire another company;
• Acquire land / building;
• Acquire machineries / equipment;
• Launch a new product / service;
• Develop international activities / enter a new market (geographic expansion);
• Finance export sales;
• Finance R&D and innovation; and
• Not Applicable: Our company did not seek for funding.
17. How did the following factors change over the last three years (between two years ago and this year)? (Please indicate your answers in Much worse, Worse, Unchanged, Better, Much better, No opinion)
• The financial situation of your business;
• The cost (interest and other) of obtaining finance for your business;
• The debt / turnover ratio of your business;
• Other terms or conditions of finance (e.g. loan maturity, collateral levels, covenants, guarantee, conditions, duration, etc.);
308

• The burden of effort of obtaining finance for your business; and
• The willingness of banks to provide finance.
18. When asking for finance during the last three years (this year, last year and two years ago), according to you, what were the reason(s) behind the difficulties you experienced? (Please indicate one or more of the options listed below)
• The financial situation of your business;
• The cost (interest and other) of obtaining finance for your business;
• The debt / turnover ratio of your business;
• Other terms or conditions of finance: loan maturity, collateral levels, covenants, guarantee, conditions, duration, etc.;
• The burden or effort in obtaining finance for your business;
• The lack of capability of your team to find the best option;
• The lack of equity investors;
• The difficulty for you to fulfil the applications requirements;
• The lack of willingness of banks to provide finance; and
• Not Applicable: Our company did not experience any difficulty.
19. Over the last three years (this year, last year and two years ago), have you ever felt discouraged in seeking finance? (Please indicate Yes or No)
20. How successful were you in obtaining loan finance from each of the following sources over the last three years (this year, last year and two years ago)? (Please indicate the level of success for each of the following sources: Successful, Partially successful or Unsuccessful)
• The owner(s) / director(s);
• Other employees of your business;
• Family, friends or other individuals outside your business;
• Other businesses;
• Commercial banks;
• Development banks;
• Public entity (national, regional or city); and
• Not Applicable: Our company did not request loan financing in these years.
21. Over the last three years (this year, last year and two years ago), how did you guarantee your loan? (Please indicate one or more of the options listed below)
• Owner collaterals;
• Family and friends;
• Company collaterals;
309

• Business partners;
• Mutual guarantee schemes such as cooperatives;
• Other guarantee schemes fully or partly provided by the government (any level);
• Financial institution; and
• Not Applicable: Our company did not use loan financing or did not guarantee its main loan in these years.
22. Over the last three years (this year, last year and two years ago), which were the reasons for being unsuccessful - or partially unsuccessful - in receiving loan financing? (Please indicate one or more of the options listed below)
• Poor credit rating;
• Lack of own capital;
• Insufficient collateral or guarantee;
• Insufficient or risky potential (of the business or project);
• Already too many loans or too much debt;
• No loan history;
• Poor loan history;
• No reason given;
• Interest rates were too high;
• Non-interest-rate related conditions of the loan were inacceptable (e.g. maturity, covenants); and
• Not Applicable: Our company did not request loan financing or was successful in receiving loan financing in these years.
23. Did you experience changes in bank financing terms and conditions in the past 12 months? (Please indicate any changes in the bank's terms and conditions - of any – Increased, Unchanged or Decreased).
• Level of interest rates;
• Level of cost of financing (other than interest rate);
• Available size of the loan / credit line;
• Available maturity of the loan;
• Collateral requirements; and
• Loan covenants / Information requirements, etc.
24. Over the last three years (this year, last year and two years ago), what sources for equity finance did you use?
• Existing shareholders;
• Directors not previously shareholders;
310

• Other employees of your business;
• Venture capital funds i.e. capital provided by investors acting together in a fund set up for the purpose of providing finance to start-up and small businesses;
• Business angels i.e. entrepreneurs (usually individual entrepreneurs) who provide capital for a business start-up, usually in return for owning part of the business;
• Mezzanine or hybrid financing i.e. loan financing that gives the lender the rights to convert to an equity interest in the business if the loan is not fully repaid on time;
• Family, friends or other individuals, not any of the above;
• Initial Public Offering (IPO) or other stock market offerings i.e. the first issue of shares by a private company to the public in order to generate capital;
• Banks;
• Other financial institutions e.g. finance houses and subsidiaries of banks;
• Other businesses;
• Government;
• Other equity finance source; and
• Not Applicable: Our company did not seek for equity finance in these years.
25. If you have not opted for equity financing over the last three years (this year, last year and two years ago), could you please indicate the reasons?
• Existing shareholders did not feel able to subscribe for more shares;
• New investors asked for too much equity in exchange for the funds offered;
• New investors were asking for too many concessions / control in exchange for equity finance;
• New investors felt the development potential of the business was insufficient or too risky;
• New investors felt that the business had too many debts;
• Absence of equity investment in my sector;
• Absence of equity investment in my region / country;
• None of the above; and
• Not Applicable: Our company opted for raising equity finance.
26. Would you be willing to give a seat in your Board in order to raise equity? (Please indicate Yes or No)
27. Over the last three years (this year, last year and two years ago), have you ever been in contact with...
• A commercial bank proposing you a EU funded financial instrument;
• A commercial bank proposing you a bank loan;
311
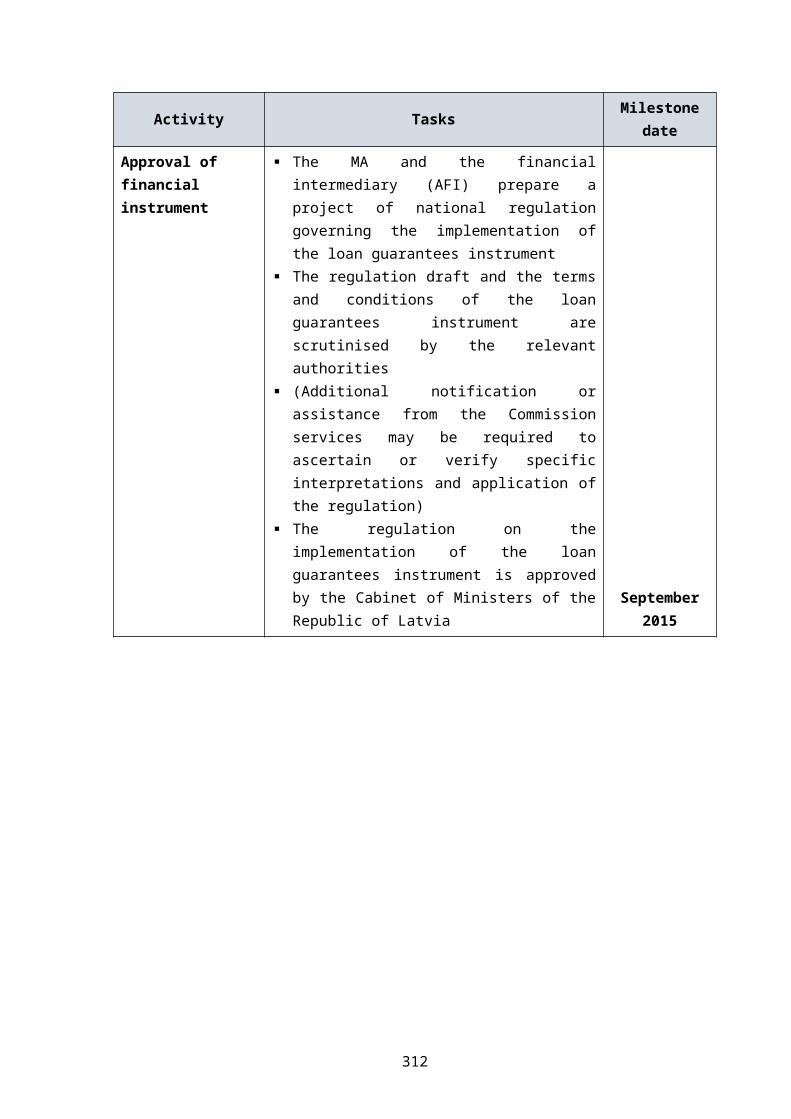
• A public bank;
• A bank proposing private equity financing;
• A national programme;
• A regional programme;
• Business angels;
• Venture capitalists;
• Incubators;
• Accelerators;
• None of the above.
28. Have your ever raised funds (debt, equity or other types of finance) from a financial institution located...? (Please indicate Yes or No)
• ___;
• Outside your country but within the European Union; and
• Outside the European Union.
29. Do you feel you have sufficient access to the following financial products? (Please indicate Yes or No)
• Bank guarantees;
• Debt financing;
• Equity financing;
• Hybrid financing; and
• Venture capital.
30. Please rank your preferred form of financing.
• Bank guarantees;
• Debt financing;
• Equity financing;
• Hybrid Financing; and
• Venture Capital.
31. To what extent did you feel comfortable in fulfilling the following requirements? (Felt comfortable, Needed assistance, Had no capacity)
• Filling in the application forms;
• Fulfilling the administrative information;
• Meeting specific requirements; and
• Preparing your business plan.
312

32. Did you have to pay unexpected fees to secure funding? (Please indicate Yes or No)
33. To what extent, do you face a lack of transparency or scarce information when looking for finance?
34. Considering all kinds of financing, to what extent are the complexity and the cost of procedures a barrier to ask for financing?
35. When looking for finance, do you feel you lacked support from: (Please indicate Yes or No)
• Your region / city;
• The government;
• Public financial institutions;
• Guarantee fund;
• Development banks;
• Equity funds;
• Business angels;
• Commercial banks; and
• Chamber of commerce.
36. Do you know the following initiatives supporting SME in your Country/Region? (Please indicate Yes or No)
37. Did you encounter any illegal practices during the development of your business? (Please indicate Yes or No)
38. What volume of each of the following financing sources do you envisage to ask for during each of the NEXT three years (next year, in one year, in two years) in Euro?
• Short-term loans, bank overdrafts and credit lines;
• Medium and long-term loans;
• Leasing;
• Factoring;
• Subsidised loans;
• Subsidies by the government (government grants);
• Foreign government bodies or international organisations;
• Trade credits (by suppliers);
• Advanced payments (by customers);
• Guarantees (including export guarantees);
• Venture capital funds, i.e. capital provided by investors acting together in a fund set up for the purpose of providing finance to start-up and small businesses;
• Technology transfer funds;
313

• Business angels, i.e. entrepreneurs (usually individual entrepreneurs) who provide capital for a business start-up, usually in return for owning part of the business;
• Replacement, rescue / turnaround and buyout capital;
• Mezzanine or hybrid financing i.e. loan financing that gives the lender the rights to convert to an equity interest in the business if the loan is not fully repaid on time;
• Equity; and
• Microcredit.
39. What would be the purpose of this funding for the NEXT three years (next year, in one year, in two years)?
• Finance working capital;
• Ensure debt consolidation;
• Acquire another company;
• Acquire land / building;
• Acquire machineries / equipment;
• Launch a new product / service;
• Develop international activities / enter a new market (geographic expansion);
• Finance export sales;
• Finance R&D and innovation; and
• Not Applicable: Our company does not envisage to ask for funding in these years.
40. From what different sources do you plan to secure your future funding over the NEXT three years (next year, in one year, in two years)? (Please indicate the five most relevant finance sources)
• The owner(s) / director(s) of your business;
• Other employees of your business;
• Family, friends or other individuals outside your business, excluding business angels;
• Other businesses;
• Leasing companies;
• Commercial banks;
• Public banks;
• Other financial institutions;
• Venture capital funds i.e. capital provided by investors acting together in a fund set up for the purpose of providing finance to start-up and small businesses;
• Business angels i.e. entrepreneurs (usually individual entrepreneurs) who provide capital for business start-up, usually in return for owning part of the business;
314

• Mezzanine or hybrid financing i.e. loan financing that gives the lender the rights to convert to an equity interest in the business if the loan is not fully repaid on time;
• An Initial Public Offering or other stock market offerings i.e. the first issue of shares by a private company to the public in order to generate capital;
• A government body within Bulgaria (government grants);
• Foreign government bodies or international organisations; and
• Not Applicable: Our company does not plan to ask for funding in the next three years.
41. In five years’ time, do you intend to: (Please indicate Yes or No)
• Keep the business;
• Sell it / spin it off; and
• Have an Initial Public Offering (IPO).
42. Please rank the following factors limiting business growth: (Please rank the five most important factors in the short-term (up to 1 year), the five most important factors in the mid- term (from 1 to 3 years) and the five most important factors in the long-term (from 3 to 5 years)
• General economic situation;
• Political situation;
• Limited demand in the local / domestic markets;
• Limited demand in foreign markets;
• Limited availability of suitable new personnel;
• Loss of existing personnel;
• Business transfer problems e.g. inheritance;
• Cost of labour increasing;
• Inability to finance necessary investment into equipment;
• Products getting outdated (R&D necessary, product lead time);
• Inability to follow the technological competition;
• Change in the competition (as new entrants in the market);
• Price competition / small margins;
• Unfair competition, e.g. dumping;
• Regulatory framework;
• Lack of fiscal incentives;
• Difficult access to information technology (e.g. broadband);
• Other infrastructure weakness;
• Not enough offer of financing;
315

• Available financing not appropriate to your need; and
• Do not see constraints (nothing ticked above).
316

IV. List of Interviews
No Stakeholder Interviewees Date
1 Imprimatur Capital Tobie Moore, Lelde Kļaviņa, Jānis Janēvičs 25.08.2014
2 ZGI Capital Normunds Igolnieks 25.08.2014
3 Tech Hub Riga Andris K. Bērziņš 26.08.2014
4 Baltcap Atra Neimane, Dagnis Dreimanis 02.09.2014
5 Proks Capital Anatolijs Prohorovs 03.09.2014
6 LVCA Edgars Pigoznis 09.09.2014
7 Swedbank Harijs Švarcs 09.09.2014
8 LatBan Juris Birznieks 09.09.2014
9 Ministry of Economics Andris Liepiņš 10.09.2014
10 NASDAQ OMX RIGA Daiga Auziņa-Melalksne, Maija Orbidāne 10.09.2014
11 Capitalia Juris Grišins 11.09.2014
12 Commercialization Reactor Nikolajs Adamovičš 11.09.2014
13 DNB Bank Armands Ločmelis, Tarass Buka 16.09.2014
14 SEB bank Karlis Danevics 24.09.2014
15 SwedbankVadims Frolovs, Dace Kalnciema, Aivars Rupeiks, Ilze Kukute
29.09.2014
16Unicredit Leasing; and Latvian Commercial Bank Association
Jevgenijs Belezjeks 01.10.2014
17 Citadele Karlis Kronbergs, Valters Abele, Agita Nicmane 02.10.2014
18 LTRK Janis Butkevics 06.10.2014
19 Ministry of Finance Liga Klavina 06.10.2014
20 ALTUM Jēkabs Krieviņš 06.10.2014
21 Coface Māris Lukins 06.10.2014
22 LGA Klavs Vasks 09.10.2014
317

V. Questionnaire for Interviews
Supply side interview structure
Part 1: Interviewee’s investments in SMEs
1. Could you please briefly describe the three main financing products currently offered to SMEs?
a) What is the volume of each financing product and your capacity for the next three years?
b) What are the eligibility criteria?
c) Are you adopting a single or multi-player approach? If you apply a multi-player approach which actors do you involve in the process (co-investment, investment fund or special purpose vehicle)?
The illustrative options for answers:
- Description - Equity, debt, hybrid, guarantee, other
- Volume - Amount of present and future supply (in number of and nominal value of loans, equity investments, guarantees, other)
- Eligibility criteria - e.g. size of investment and company, sector, location, type of investment (target activities / objectives), and (personal) collateral
- Key challenges and obstacles - e.g. cost, market acceptance, legal complexity, expectations for guarantees and collateral, and risk profile
- Approach - Single or multi-player
2. What are the key Strengths, Weaknesses, Opportunities and Threats of the current funding offer to SMEs?
3. What are some of the reasons why you declined to make investments (e.g. related to management, product, and commercial considerations)?
4. What specific obstacles do you face as a venture capitalist / bank / promotional bank / agency investing in SMEs (e.g. cost, market acceptance, legal complexity, expectations for guarantees, risk profile, and better conditions outside your country)?
318

5. Have you been involved in implementation of any publicly backed financial instruments funding SMEs? Could you describe the effectiveness and results of these financial instruments and any challenges implementing them? What are the main lessons learned and what kind of changes you would advise if financial instruments of similar type were to be implemented in future?
Part 2: Market trends and challenges
1. How would you quantify the market demand for financing SMEs? How many companies fit into your potential pipeline? Which companies and according to what criteria do not fit your investment policy and why?
2. Which sectors would you say are most likely to experience a growth in demand? What would be the most likely objectives or target areas for investment?
3. What are the key challenges for funding SMEs?
4. What are the emerging trends in SME financing in terms of:
a) Instruments from the private sector;
b) Instruments and mechanisms from the public sector; and
c) Policy framework?
5. Is market demand higher than the current supply? Is there a funding gap?
Part 3: Prospective solutions
1. Which are the most effective models to fund SMEs?
2. How do you see the role of public sector funding for supporting SME funding?
3. Is there a market need for specific instruments for SMEs? If you were to define an ideal vehicle to put in place for SMEs tomorrow what would its characteristics be?
4. What other supporting activities you would consider necessary to facilitate SME funding and business ecosystem in general?
319

Policy maker interview structure
Part 1: Market trends and challenges
1. How would you quantify the market demand for financing SMEs?
2. Which sectors would you say are most likely to experience a growth in demand? What would be the most likely objectives or target areas for investment?
3. What are the key challenges for funding SMEs?
4. What are the emerging trends in SME financing in terms of:
a) Instruments from the private sector;
b) Instruments and mechanisms from the public sector; and
c) Policy framework?
5. Is market demand higher than the current supply? Is there a funding gap?
6. Could you describe the effectiveness and results of the currently implemented publicly backed financial instruments funding SMEs and any challenges implementing them? What are the main lessons learned and what kind of changes you would foresee if financial instruments of similar type were to be implemented in future?
Part 2: Prospective solutions
1. Which are the most effective models to fund SMEs?
2. How do you see the role of public sector funding for supporting SME funding?
3. Is there a market need for specific instruments for SMEs? If you were to define an ideal vehicle to put in place for SMEs tomorrow what would its characteristics be?
4. What other supporting activities you would consider necessary to facilitate SME funding and business ecosystem in general?
320

VI. Stakeholders
This Annex presents overview of key market participants for analysed financial instruments.
Microfinance
CAPITALIA
Capitalia states to be the leading financing and transaction advisory provider for small and medium enterprises operating in the Baltic States. The company was established in 2007 and up till now has invested in more than 300 enterprises with the volume exceeding EUR 15m in start-up, expansion and restructuring capital.355 CAPITALIA main business focus is providing microloans to micro companies. CAPITALIA is attracting funds from external investors by listing its securities on Riga Stock Exchange.356 CAPITALIA has managed to reduce the previously offered average of 40% microfinance rate to 20% with the support of LGA public financing.357
Grand Credit
GRAND CREDIT has been established in 2007 and provides loans both to individuals and corporates (mainly small and medium enterprises). Microfinance program has been launched in cooperation with LGA and supports Micro companies. The main distinguishing factor from Capitalia is that Grand Credit offers micro financing requiring real estate collateral.
ALTUM
ALTUM is a Latvian governmental investment institution aimed to encourage development of Latvian economics and creation of added value. ALTUM focus is provision of state aid through one of six existing support programs, including microloans for SMEs. ALTUM administrates both Latvian state and European Union structural funds.358 ALTUM supports SMEs by balancing 50% of interest payments in microloan programs and is intermediary in Latvian-Swill cooperation program aimed to stimulate microfinance.
SWEDBANK
SWEDBANK is the leading financial institution in Latvia. Swedbank focus is both consumer and corporate lending with four main markets: Sweden, Estonia, Latvia and Lithuania.359
355 CAPITALIA. Available on http://www.capitalia.lv/en/about-company/company. Last visited on 18 September 2014356 Interview with Juris Grišins. Capitalia, September 11, 2014 357 Interview with Juris Grišins. Capitalia, September 11, 2014 358 ALTUM, Mission. Available on: http://www.hipo.lv/lv/par_banku. Last visited on 10 September 2014359 Swedbank, Available on https://www.swedbank.lv/en/par_swedbank/par_swedbank_grupu/. Last visited on 10 September 2014
321

CITADELE
CITADELE is financial institution that apart from banking activities also offers micro-financing to entrepreneurs.360
Bank lending
Swedbank
SWEDBANK is the leading financial institution in Latvia. Swedbank focus is both consumer and corporate lending with four main markets: Sweden, Estonia, Latvia and Lithuania.361
SEB banka
SEB Banka is also serving both consumer and corporate customers. It offers corporate banking, trading and capital markets and global transaction services, including such products as servicing daily finances, savings, loans, pension solutions, cards, wealth management and life insurance.362
DNB banka
DNB banka is the third largest Scandinavian bank operating in Latvia. DNB banka provides both corporate and individual banking services.363
ABLV Bank
ABLV Bank is one of the largest private banks in the Baltic States with headquarters in Riga, Latvia. ABLV main lines of business are: private banking, investment and advisory services. Bank’s customer portfolio is primarily formed by non-EU residents.364
Rietumu Bank
Rietumu Banka is one of the largest banks in the Baltics States, specialized in corporate banking and affluent individuals both from the CIS and Baltic States.365
Citadele Bank
Citadele Bank is a local bank, which was created as a result of restructuring Parex Bank, taken over by the Latvian government in year 2008. Citadele Bank provides banking, financial and wealth management services for both, private individuals and companies.366
360 Citadele, Microfinancing, Available on http://www.citadele.lv/lv/business/financing/micro/. Last visited on 10 October 2014361 Swedbank. Available on: https://www.swedbank.lv/en/par_swedbank/par_swedbank_grupu/. Last visited on 10 September 2014362 SEB. Available on: http://sebgroup.com/en/About-SEB/Who-we-are/Our-stakeholders/. Last visited on 10 September 2014363 DNB, DNB in Latvia. Available on: https://www.dnb.lv/en/about-us/dnb-latvia. Last visited at 19 September 2014364 ABLV. Available on: http://www.ablv.com/en/about. Last visited on 8 September 2014365 Rietumu. Available on: http://www.rietumu.lv/bank. Last visited on 8 September 2014366 Citadele. Available on: http://www.citadele.lv/lv/about/. Last visited on 8 September 2014
322

Leasing and factoring
SEB LĪZINGS
SIA ‘’SEB LĪZINGS” is a subsidiary of one of the biggest banks of Latvia, ‘’SEB Unibanka’’. SEB LIZINGS was established in 1997 and is currently one of the leading companies in the Latvian leasing market. SEB LIZINGS cooperates very closely with the largest Swedish leasing company SEB Finans. 367 SEB LIZINGS offers the following products:
- Leasing of new and used cars
- Leasing of industrial equipment
- Leasing of commercial transport
- domestic and export factoring
SWEDBANK LĪZINGS
“Swedbank Līzings” Ltd belongs to Scandinavian based Swedbank Group. SWEDBANK LĪZINGS closely cooperates with SWEDBANK that operates on Latvian market as the bank. 368 “HL Leasing” ltd was acquired by Swedbank Group with existing client portfolio. Currently the company continues to service existing HL leasing customers. SWEDBANK LĪZINGS offers the following products: 369
- Car leasing
- Lease of industrial and commercial vehicles
- factoring services
CITADELE LĪZINGS
“Citadele līzings un faktorings” Ltd is a subsidiary of local financial institution - AS “Citadele banka” that was founded in year 2005. CITADELE LĪZINGS offers the following products:
- Financial and operational leasing or cars, commercial vehicles and industrial equipment
- Leaseback
- Factoring services
367 SEB. Seb Leasing. Available on: http://www.seb.lv/en/about/us/related-companies/lizings/. Last visited on 28 September 2014368 Swedbank. Leasing. Available on: https://www.swedbank.lv/en/pakalpojumi_uznemumiem/lizings/. Last visited on 28 September 2014369 LLDA, Members. Available at: http://www.llda.lv/lv/par-asociaciju/biedri.html. Last visited on 14 September 2014
323

DNB LĪZINGS
SIA ‘’DNB līzings’’ is a subsidiary of AS DNB bank, which is successfully operating in Latvian leasing market since 2004 and places in the Top-3 of Latvian leasing companies. DNB LĪZINGS offers the following products: 370
- Lease of new and used cars
- Equipment or commercial financial lease and rental assistance
- Factoring services
LKB LĪZINGS
SIA LKB Leasing is “Latvijas Krājbanka” JSC subsidiary company, founded in 2007.371 LKB LĪZINGS offers the following products:
- car financial or operating leasing
- commercial transport and equipment leasing services for corporate customers
- factoring services
MOGO
MOGO Ltd is a non-banking financial institution specialized on debt financing available to private individuals for collateral in form of vehicles.372
NORDEA FINANCE LATVIA
Nordea Finance belongs to Nordea Group operating in the Nordic and Baltic region. Nordea Finance Latvia began its work in 1997 and is one of the fastest growing leasing companies, taking 6.5% of the Latvian leasing and factoring market. NORDEA FINANCE LATVIA offers asset financing through: 373
- financial and operating lease
- full service NF-Fleet car rent
- factoring
- sales financing for car and equipment sellers
UNICREDIT LEASING
“UniCredit Leasing” Ltd is a leasing company which is active in Latvian leasing market since 1998 and is a part of UniCredit financial group. It is one of the leading market players in the country with a 370 LLDA, Members. Available at: http://www.llda.lv/lv/par-asociaciju/biedri.html. Last visited on 14 September 2014371 LLDA, Members. Available at: http://www.llda.lv/lv/par-asociaciju/biedri.html. Last visited on 14 September 2014372 Mogo.lv, Available on: https://www.mogo.lv/lv/par-mogo/. Last visited on 28 September 2014373 LLDA, Members. Available at: http://www.llda.lv/lv/par-asociaciju/biedri.html. Last visited on 14 September 2014
324

many-year experience in the area of leasing, stably ranking in the TOP 3 positions over years. 374 UNICREDIT LEASING offers the following products:
- Financial solutions for car and equipment financing.
- Provides funding for car, bus, logging, road construction, quarrying, woodworking, metalworking equipment, medical equipment, as well as trailers, tractor, trailer, wagon, as well as other establishment for the purchase of an item.
Venture Capital and Growth Capital
Baltcap Management Latvia, Ltd.
BaltCap is the leading private equity and venture capital investor in the Baltic countries. BaltCap partners with ambitious management teams to deliver transformational growth through active operational engagement. It was founded in 1995 and has seen investments in more than 60 companies through private equity and venture capital funds.375
Imprimatur Capital Fund Management
Imprimatur Capital Fund Management is based in Latvia and is focused on innovative technology start-ups sourced from international network of universities, research institutions, technology incubators and technology entrepreneurs. Prime areas of interest include digital media, enterprise data management, homeland security, medical technology, biotech, new materials and clean technology.
Imprimatur Capital Fund Management manages seed and start-up funds with investors including the Latvian Guarantee Agency, other institutional investors and some private investors.376
Expansion Capital, Ltd.
Expansion Capital is primarily focused on growth stage companies that have already accomplished product design and development stage. Expansion Capital offers funding starting form EUR 100t and up to EUR 1.5m to companies looking to launch commercial production of their product, invest in aggressive marketing and distribution.377
ABLV Private Equity Management
ABLV Private Equity Management invests in private capital of Latvian non-public companies. Fund raises funds for investments from offering investors at least 20% of return.
374 LLDA. Members. Available on: http://www.llda.lv/lv/par-asociaciju/biedri.html. Last visited on 14 September 2014375 BaltCap. Available on: http://www.baltcap.lv/company/about-us. Last visited on 25 25 September 2014376 Imprimatur Capital, Available on: http://www.icfm.lv/en/about-us. Last visited on 25 September 2014377 LGA, How to get risk capital? Available on: http://www.lga.lv/index.php?id=77. Last visited on 25 September 2014
325

Karma Ventures
Karma Ventures expects to be launched after fundraising in 2015. EIF has approved EUR 25 m investment from BIF. The fund’s strategy is to cover seed stage (up to 60%) and early stage (up to 40%) companies in the Baltics. The fund is expected to have a portfolio of up to 15 seed and 10 early-stage companies, investing up to EUR 5m per company and targeting between 10% and 40% ownership stakes.378
378 Communication with Martins Jansons, EIF, 29 September 2014
326

VII. Bibliography
1. A. Prohorovs. Attraction of Investments into Venture Capital and Private Equity Funds of Latvia, 2013
2. A. Prohorovs. Riska kapitāla piesaistīšana Latvijas ekonomikā, 20133. A. Prohorovs. The Volume of Venture Capital Funds of Latvia and Their Financing
Sources. China-USA Business Review, No. 4, vol. 13., 20144. A. Vanags, J., Staševska, & A., Paalzow. Venture Capital in Latvia Revisited. Telia Sonera
Institute at the Stocholm Schoool of Economics, paper No 9, 7-38, 2010.Financing Sources. China-USA Business Review, ISSN 1537-1514, April 2014, Vol. 13, No. 4, 217-234
5. A., Groh, H., Liechtenstein, & K., Lieser., The Global Venture Capital and Private Equity Country Attractiveness Index, 2012.
6. ABLV. Available on: http://www.ablv.com/en/about. Last visited on 8 September 20147. AECM, What are guarantees? Available on: http://www.aecm.eu/en/what-are-
guarantees.html?IDC=65. Last visited on 21 September 2014.8. ALTUM, Mikrokreditēšanas programma. Available on:
http://www.hipo.lv/lv/attistibas_programmas/mikrokreditesanas_programma. Last visited on 10 September 2014.
9. ALTUM, Mikrokredītu programma. Available on: http://www.atbalstaprogrammas.lv/mikrokrediti.php. Last visited on 13 September 2014.
10. ALTUM, Mission. Available on: http://www.hipo.lv/lv/par_banku. Last visited on 10 September 2014
11. ALTUM, MVU Mikrokreditēšanas programma.. Available on: http://www.hipo.lv/lv/attistibas_programmas/mvu_mikrokreditesanas_programma. Last visited on 10 September 2014.
12. BaltCap. Available on: http://www.baltcap.lv/company/about-us. Last visited on 25 25 September 2014
13. Balticexport, Riska kapitāla apjoms Latvijā - 20-30 miljoni latu. Available on http://balticexport.com/?lang=lv&article=riska-kapitala-apjoms-latvija-20-30-miljoni-latu. Last visited on 17 September 2014
14. Bank of England, Quarterly Bulletin: The financing of technology-based small firms: a review of the literature, 2001
15. BBC. Ask.fm bought by Ask.com and Tinder owner. Available on http://www.bbc.com/news/technology-28776254#sa-ns_mchannel=rss&ns_source=PublicRSS20-sa. Last visited on 4 September 2014
16. BIS. SME Access to External Finance, 201217. C.Silbernagel, D.Vaitkunas. Mezzanine Finance. Bond Capital, 201218. Calculations based on FCMC quarterly reports on operation of financial institutions, Ceturkšņa
pārskati. Available on: http://www.fktk.lv/lv/statistika/kreditiestades/ceturksna_parskati/. Last visited on 13 September 2014
19. CAPITALIA, Available on http://www.capitalia.lv/en/about-company/company. Last visited on 18 September 2014
20. CAPITALIA, Long term capital for companies. Available on: http://www.capitalia.lv/en/financing/mezzanine-loan. Last time visited on 23 September 2014.
21. CAPITALIA, Mikrokredīts. Available on: http://www.capitalia.lv/lv/finansejums/mikrokredits. Last visited on 10 September 2014.
22. CAPITALIA, presentation to the Ministry of Economics, 201423. Cavallo et al., “The price impact of joining a currency union: evidence from Latvia” , June 2014,
(NBER Working paper)
327

24. Central Statistical Bureau of Latvia. Available on: http://www.csb.gov.lv/en. Last visited on October 20, 2014
25. Citadele, Microfinancing, Available on http://www.citadele.lv/lv/business/financing/micro/. Last visited on 10 October 2014
26. Citadele. Available on: http://www.citadele.lv/lv/about/. Last visited on 8 September 201427. Commercial register, Number of active companies operating in Latvia between 1995 and 2014.
Available on: http://www.ur.gov.lv/statistika.html?a=1080. Last visited on 1 September 2014.28. Commercializationreactor, Points you should know about commercialization reactor Available
on: http://www.commercializationreactor.com/about-us/learn-more. Last visited on 4 September 2014
29. Cross-Sectoral Coordination Centre, National Development Plan of Latvia for 2014-2020, http://nap.lv/images/NAP2020%20dokumenti/NDP2020_English_Final.pdf
30. CSB, Patstāvīgo iedzīvotāju skaits un vecuma struktūra gada sākumā (pa 5 gadu vecuma grupām). Available on: http://data.csb.gov.lv/pxweb/lv/Sociala/Sociala__ikgad__iedz__iedzskaits/IS0022.px/?rxid=cdcb978c-22b0-416a-aacc-aa650d3e2ce0. Last visited on 13 September 2014.
31. CSES, Evaluation of EU Member States’ Business Angel Markets and Policies Final report. 201232. D.Gagliardi, et al. A recovery on The horizon? Annual report on european SMEs 2012/2013.
European Commission, 201333. db.lv, Ēnu ekonomikas īpatsvars Latvijā – 23,8%. Available on:
http://www.db.lv/finanses/makroekonomika/enu-ekonomikas-ipatsvars-latvija-23-8-proc-414840. Last visited on 16 September 2014.
34. Diena, Ātrie kredīti - jau daudzmiljonu nozare, ko finanšu tirgus radars neuzrauga. Available on: http://www.diena.lv/latvija/zinas/atrie-krediti-jau-daudzmiljonu-nozare-ko-finansu-tirgus-radars-neuzrauga-13962321. Last visited on 26 September 2014.
35. DNB, DNB in Latvia. Available on: https://www.dnb.lv/en/about-us/dnb-latvia. Last visited at 19 September 2014
36. Doing Business. Doing Business 2014 Economy Profile: Latvia. World Bank Group, 201437. Draugiem Group. Available on: http://www.draugiemgroup.com/en. Last visited on 4
September 201438. E., Gualandru, V., Venturelli. Assessing and Measuring the Equity Gap and the Equity
Requirements for Innovative SMEs. CEFIN Working Paper No. 7, 201439. E., Kichler, P. Haiss. Market Structure as Determinant: the Case of Leasing in Banking Industry
Transformation in Central and South Eastern Europe. EuropaInstitut, 200840. EBAN, Business angel. Available on:
http://www.eban.org/glossary/business-angel-ba/#.VBmd3ZSSxqU. Last visited on 16 September 2014.
41. Eegloo, (2014). Available at: http://blog.eegloo.net/. Last visited on September 4, 2014.42. European Central Bank. Survey on the Access to Finance of Small and Medium-Sized
Enterprises in the Euro Area, 2014
43. European Commission, 2013 SMEs’ Access to Finance survey: Analytical Report. 2013
44. European Commission, Alternative investments, Available on: http://ec.europa.eu/internal_market/investment/alternative_investments/index_en.htm. Last visited on 10 October 2014
45. European Commission, Communication аrom the Commission to the European Parliament, the Council, the European Economic and Social Committee and the Committee of the Regions Research and Innovation as Sources of Renewed Growth, Brussels, COM(2014) 339 final
46. European Commission, Enterprise and Industry. Available on: http://ec.europa.eu/enterprise/policies/finance/data/enterprise-finance-index/access-to-finance-indicators/venture-capital/index_en.htm. Last visited on 22 September 22 2014.
47. European Commission, Entrepreneurship in the EU and beyond. 2012
328

48. European Commission, Entrepreneurship: Country report for Latvia, Flash Eurobarometer, 2012
49. European Commission, European Economic Forecast. Spring 2014. Available on: http://ec.europa.eu/economy_finance/publications/european_economy/2014/pdf/ee3_en.pdf. Last visited on October 20, 2014
50. European Commission, Ex-ante assessment methodology for financial instruments in the 2014-2020 programming period. Volume III. Enhancing the competitiveness of SME, including agriculture, microcredit and fisheries (Thematic Objective 3). Study commissioned by the EIB, co-financed by the European Commission (DG REGIO) and assigned to a consortium led by PwC. Version 1.0. March 2014. Forthcoming Q2/2014.
51. European Commission, Ex-ante assessment methodology for financial instruments in the 2014-2020 programming period. Volume I. General methodology covering all thematic objectives. Study commissioned by the EIB, co-financed by the European Commission (DG REGIO) and assigned to a consortium led by PwC. Version 1.0. March 2014. Forthcoming Q2/2014.
52. European Commission, Expert evaluation network delivering policy analysis on the performance of Cohesion policy 2007-2013 Year 2 – 2012 Task 2: Country Report on Achievements of Cohesion policy: Latvia. 2012
53. European Commission, Factsheet - Financial Instruments in Cohesion Policy 2014-2020.54. European Commission, Financing technology transfer & Seed finance Discussion document for
the workshops, 200655. European Commission, Financing technology transfer & Seed finance Discussion document for
the workshops. 200656. European Commission, Guarantees. Available on:
http://ec.europa.eu/enterprise/policies/finance/data/enterprise-finance-index/access-to-finance-indicators/guarantees/index_en.htm. Last visited on 23 September 2014.
57. European Commission, Loans. Available on: http://ec.europa.eu/enterprise/policies/finance/data/enterprise-finance-index/access-to-finance-indicators/loans/index_en.htm. Last visited on 14 September 2014
58. European commission, Microcredits. Available on: http://ec.europa.eu/enterprise/policies/finance/borrowing/microcredit/index_en.htm. Last visited on 8 September 2014.
59. European Commission, National Reform Programme of Latvia for the Implementation of the “EU2020” strategy, http://ec.europa.eu/europe2020/pdf/nrp/nrp_latvia_en.pdf
60. European Commission, Progress Report on the Implementation of the National Reform Programme of Latvia within the “EU2020” strategy, http://ec.europa.eu/europe2020/pdf/nd/nrp2013_latvia_en.pdf
61. European Commission, SMAF Access to Finance Index. Available on: http://ec.europa.eu/enterprise/policies/finance/data/enterprise-finance-index/index_en.htm. Last visited on October 20, 2014
62. European Commission, SME Performance Review. Available on: http://ec.europa.eu/enterprise/policies/sme/facts-figures-analysis/performance-review/index_en.htm. Last visited on October 20, 2014
63. European Commission, Summary of data on the progress made in financing and implementing financial engineering instruments reported by the MAs in accordance with Article 67(2)(j) of Council Regulation (EC) No 1083/2006. Programming period 2007-2013 (situation as at 31 December 2012).
64. European Commission, The EU Single Market. Available on: http://ec.europa.eu/internal_market/bank/regcapital/legislation-in-force/index_en.htm. Last visited on 14 September 2014
65. European Commission. Innovation Union Scoreboard 2014. 2014
66. European Court of Auditors, 2012b
329

67. European Investment Fund, EIF in Estonia, 201468. European Investment Fund, European Small Business Finance Outlook, 201369. European Investment Fund, FINANCING TECHNOLOGY TRANSFER. 2009.70. European Investment Fund, Guidelines for SME Access to Finance Market Assessments.
Working paper 2014/22.71. European Investment Fund, H. Kraemer-Eis, F. Lang. Guidelines for SME Access to Finance
Market Assessments (GAFMA), Working Paper 2014/2272. European Investment Fund, Progress for Microfinance in Europe, Working paper 2012/13,
201273. European Investment Fund, Technology Transfer : Converting Research into Products for the
Market, Available at: http://www.eif.org/what_we_do/equity/technology_transfer/index.htm, Last visited on September 14, 2014.
74. European Investment Fund, The importance of leasing for SME finance. Working paper, 2012/2015
75. European microfinance network, Overview of the microcredit sector in the European Union 2010-11, 2012
76. Eurostat, Hourly labour costs. Available on: http://epp.eurostat.ec.europa.eu/statistics_explained/index.php/Hourly_labour_costs. Last visited on October 20, 2014
77. Eurostat, People at risk of poverty or social exclusion by age group. Available at: http://epp.eurostat.ec.europa.eu/statistics_explained/index.php/File:People_at_risk_of_poverty_or_social_exclusion_by_age_group,_2012.png. Last visited on 13 September 2014.
78. Eurostat, People at risk of poverty or social exclusion. Available on: http://epp.eurostat.ec.europa.eu/tgm/graph.do?tab=graph&plugin=0&pcode=tsdsc100&language=en&toolbox=data. Last visited on 9 September 2014.
79. Eurostat, Science, technology and innovation in Europe 2013 edition, European Commission, 2014
80. EVCA, 2013 Europe Private Equity Activity: Statistics on Fundraising, Investments & Divestments, 2014
81. EVCA, 2013 European Private Equity Activity: Statistics on Fundraising, Investments & Divestments, 2014
82. EVCA, 2013 Pan-European Private Equity Activiy: Statistics on Fundraising, Investments & Divestments, 2014
83. EVCA, 2013 Pan-European Private Equity Performance Benchmarks Study.201484. EVCA, Central and Eastern Europe Statistics 2013, 201485. EVCA, Yearbook 2012: Activity Data on Fundraising, Investments and Divestments by Private
Equity and Venture Capital Firms in Europe, 201286. EY, EY Eurozone Forecast March 2014 – Latvia. Available on:
https://webforms.ey.com/Publication/vwLUAssets/EY-Eurozone-Forecast-March-2014-Latvia/$FILE/EY-Eurozone-Forecast-March-2014-Latvia.pdf. Last visited on October 20, 2014
87. FCMC, Publiskie ceturkšņa pārskati banku dalījumā (2013. gads). Available on: http://www.fktk.lv/lv/statistika/kreditiestades/publiskie_ceturksna_parskati_i/2013-06-07_publiskie_ceturksna_parskati_banku_dalijuma_par_2013_gada_1_ceturksni/. Last visited on 12 September 2014.
88. Grand Credit, Kredīts Uzņēmumiem. Available on: http://www.grandcredit.lv/?pageid=7&sub=10. Last visited on 10 September 2014.
89. H.Kraemer-Eis, F.Lang. Guidelines for SME Access to Finance Market Assessments (GAFMA), Working Paper 2014/22, EIF, 2014
90. Hall, B. H., & Lerner, J. The financing of R&D and innovation. Handbook of the Economics of Innovation, 2010
330

91. Harvard Business Review, HBR Blog Network. Available on http://blogs.hbr.org/2013/07/can-crowdfunding-solve-the-sta/. Last visited on 25 September 2014
92. I. Kurzemniece, Esošās situācijas izvērtējums pētniecībā un attīstībā, 201393. IESE Business School, The Venture Capital & Private Equity Country Attractiveness Index.
Available on: http://blog.iese.edu/vcpeindex/latvia/. Last visited on October 12, 201494. IFG GIAR, Global Industry Activity Report. 201295. Imprimatur Capital, Available on: http://www.icfm.lv/en/about-us. Last visited on 25
September 201496. Inno Support. LEBIC: Busines Innovation Centre of Latvian Electronic Industry. Available on:
http://www.bizred.de/index.cfm?f=346&r=1338&b=3328. Last visited on 16 September 2014.97. International Monetary Fund, Baltic Cluster Report. Available on:
https://www.imf.org/external/pubs/cat/longres.aspx?sk=41541.0. Last visited on October 20, 2014
98. International Monetary Fund, IMF Country Report No. 14/115. Available on: http://www.imf.org/external/pubs/cat/longres.aspx?sk=41539.0. Last visited on October 20, 2014
99. J.Darcy, H.Kraemer-Eis, et al. Financing technology transfer. EIF, 2009100. J.E.Amoros, N.Bosma. Global Entrepreneurship Monitor 2013 Global Report: Fifteen years of
assessing entrepreneurship across the Globe. GEM, 2014101. K. Avots, R. Strenga and A. Paalzow. Baltic International Centre for Economic Policy Studies
jointly with Stockholm School of Economics in Riga. Baltic Journal of Economics. No. 1, vol. 13. 2013
102. K., Avots, R., Strenga, (2013). “Does the Money Meet the Ideas? Evaluation of Public Venture Capital in Latvia”
103. K.Avots, R.Strenga, A.Paalzow, Public venture capital in Latvia. Baltic Journal of Economics, 2013
104. K.Wilson, F. Silva. Policies for Seed and Early Finance: Findings from the 2012 OECD Financing Questionnaire. OECD, 2013
105. K.Wilson, F.Silva, Policies for Seed and Early Finance, OECD, 2013
106. Karen E. Wilson, Filipe Silva. Policies for Seed and Early Stage Finance, OECD, 2013107. Klaus Schwab. The Global Competitiveness Report 2014-2015. World Economic Forum, 2014108. Labklājības ministrija, Informatīvais ziņojums par valsts fondēto pensiju shēmas darbības
izvērtējumu, 2012, 9 October 2012
109. Latvijas Banka, Līzinga sabiedrību saraksts 2014. gada 1. Ceturksnī. Available on: http://www.bank.lv/statistika/datu-telpa/galvenie-raditaji/lizinga-sabiedribu-saraksts-2014-gada-1-ceturksni. Last visited on 16 September 2014.
110. Latvijas Republikas Finanšu Ministrija, Finanšu Ministrija palielina IKP izaugmes prognozes. Available on: http://www.fm.gov.lv/lv/aktualitates/jaunumi/makroekonomika/46730-finansu-ministrija-palielina-ikp-izaugsmes-prognozes. Last visited on 19 September 2014.
111. Leaseurope, Leasing to European SMEs. 2012
112. Leaseurope, The Voice of leasing and Automotive Rental in Europe. 2009-2012113. Letter by LVCA Chairman to Ministry of Finance on „Par nodokļu jomu regulējošo normatīvo
aktu saskaņošanu ar alternatīvo ieguldījumu fondu darbību Latvijas uzņēmējdarbībā”, dated 2 July 2014
114. LGA, Annual Report 2013: Latvian Guarantee Agency Financial instruments for development. 2014
115. LGA, Annual Report Latvian Guarantee Agency: Financial instruments for development. 2014
331

116. LGA, Eiropas Investīciju fonds ir izvēlējies pirmo Baltijas Inovāciju fonda riska kapitāla pārvaldītāju - “BPM Capital”. Available on: http://www.lga.lv/index.php?id=102. Last visited on 25 September 2014.
117. LGA, How to get risk capital? Available on: http://www.lga.lv/index.php?id=77. Last visited on 25 September 2014
118. LGA, Latvian Guarantee agency. 2014119. LGA, Purpose of the Mezzanine Loan. Available on: http://www.lga.lv/index.php?id=55&L=1.
Last visited on 25 September 2014120. LGA, What is provided by credit guarantee. Available on: http://www.lga.lv/index.php?
id=41&L=1. Last visited on 21 September 2014.121. LGA. Financial Instruments for Development. 2013122. Likumi.lv, Noteikumi par garantijām komersantu un atbilstošu lauksaimniecības pakalpojumu
kooperatīvo sabiedrību konkurētspējas uzlabošanai. Available on: http://likumi.lv/doc.php?id=220826. Last visited on 23 September 2014.
123. Likumi.lv, Par Koncepciju par mikrouzņēmumu atbalsta pasākumiem. Available on: http://likumi.lv/doc.php?id=200709. Last visited on 3 September 2014.
124. Likumi.lv. Ministru kabineta noteikumi Nr.327 “Noteikumi par mikroaizdevumiem saimnieciskās darbības veicēju konkurētspējas uzlabošanai”. Available on: http://likumi.lv/doc.php?id=257784#p1&pd=1. Last visited on 10 September 2014.
125. LLDA, Members. Available at: http://www.llda.lv/lv/par-asociaciju/biedri.html. Last visited on 14 September 2014
126. Loan Market Association, Legal&Regulatory. Available on: http://www.lma.eu.com/landing_legal_regulatory.aspx. Last visited on 14 September 2014.
127. LSM.LV, Bankas nesteidz izmantot lēto ECB aizdevumu. Available on: http://www.lsm.lv/lv/raksts/zinju-analiize/zinas/bankas-nesteidz-izmantot-leto-eiropas-centralas-bankas-aizdevumu.a100714/. Last visited on 21 September 2014.
128. LTC. Innovation. Available on: http://www.innovation.lv/ltc/. Last visited on 16 September 2014.
129. LTP. About us. Available on: http://www.ltp.lv/. Last visited on 16 September 2014.
130. LVCA, Latvian private equity and venture capital association. Available on: http://www.lvca.lv/en/par-asociaciju/. Last visited on September 16 2014.
131. Manapensija, Actual data. Available on: http://www.manapensija.lv/lv/pensiju-2-limenis/aktualie-dati/. Last visited on 19 September 19 2014
132. Merger Market. Trend Report, 2014133. Mill Riga, (2014). Available at: http://millriga.com/. Last visited on September 4, 2014.134. Ministry of Economics of the Republic of Latvia, Guidelines on the National Industrial Policy for
2014-2020, http://www.em.gov.lv/images/modules/items/Industrialas%20politikas%20politisko%20vadliniju%20dokuments%20FINAL.pdf
135. Ministry of Environmental Protection and Regional Development of the Republic of Latvia, Sustainable Development Strategy of Latvia until 2030, http://www.varam.gov.lv/in_site/tools/download.php?file=files/text/dokumenti/pol_doc//LIAS_2030_en.pdf
136. Ministry of Finance of the Republic of Latvia, Partnership Agreement for the European Union Investment Funds Programming Period 2014-2020, http://www.esfondi.lv/upload/Planosana/FMPlans_230714_PA_updated.pdf
137. Mogo.lv, Available on: https://www.mogo.lv/lv/par-mogo/. Last visited on 28 September 2014
332

138. moneyguru24.com, Payday loan interest rates in Europe. Available on: http://www.moneyguru24.com/Content/Themes/Images/blog/EuropeLoansAPR.jpg. Last visited on 26 September 2014.
139. NASDAQ, IPO. Available on http://www.nasdaqomxbaltic.com/market/?pg=auctions&ProcedureType=IPO&lang=en¤cy=0&downloadcsv=0&start=13.08.2014&end=13.12.2014. Last visited 20 September 2014
140. Nasdaq, Nasdaq Riga & Latvian CSD. Available on: http://www.nasdaqomxbaltic.com/en/exchange-information/about-us/nasdaq-omx-riga-3/. Last visited on 19 September 2014
141. OECD, Alternative Financing Instruments for SMEs and Entrepreneurs: the Case of Mezzanine Finance. 2013
142. OECD, Financing High-Growth Firms: The Role of Angel Investors, 2011143. OECD, SME and Entrepreneurship Financing: The Role of Credit Guarantee Schemes and
Mutual Guarantee Societies in supporting finance for small and medium-sized enterprises. 2013
144. Official Journal of the European Union, Regulation (EC) No 25/2009 of The European Central Bank, L 15/14, 20.1
145. Olivier Blanchard, Mark Griffiths and Bertrand Gruss. ‘Boom, Bust, Recovery – Forensics of the Latvia Crisis’. Available on: http://web.mit.edu/kjforbes/www/Papers/Forbes-BPEA-Discussion%20Latvia.pdf. Last visited on October 20, 2014
146. R.Pelly, H.Kramer-Eis. Creating a Better Business Environment for Financing Business, Innovation and Green Growth. 2011
147. Reuters Pe Hub, (2014). Available at: http://www.pehub.com/2014/02/latvia-based-infogr-am-grabs-funding/. Last visited on September 4, 2014.
148. Rietumu. Available on: http://www.rietumu.lv/bank. Last visited on 8 September 2014149. S.R.Xavier, D.Kelley et al. Global Entrepreneurship Monitor 2012 Global Report. GEM, 2013150. SEB. Available on: http://sebgroup.com/en/About-SEB/Who-we-are/Our-stakeholders/. Last
visited on 10 September 2014151. SEB. Seb Leasing. Available on: http://www.seb.lv/en/about/us/related-companies/lizings/.
Last visited on 28 September 2014152. smscredit.lv. Available on: https://www.smscredit.lv. Last visited on 26 September 2014.153. Sorainen, Baltic M&A Deal Points Study 2013.154. Swedbank, Aizdevums auto iegādei. Available on:
https://ib.swedbank.lv/business/finance/leasing/car?language=LAT. Last visited on 10 September 2014.
155. Swedbank, Available on https://www.swedbank.lv/en/par_swedbank/par_swedbank_grupu/. Last visited on 10 September 2014
156. Swedbank. Leasing. Available on: https://www.swedbank.lv/en/pakalpojumi_uznemumiem/lizings/. Last visited on 28 September 2014
157. TC. FullContact Acquires Cobook To Build A Better Universal Address Book. Available on http://techcrunch.com/2014/01/15/fullcontact-acquires-cobook-to-build-a-better-universal-address-book/. Last visited on 4 September 2014
158. TC. Infogr.am Secures $1.8M To Scale Its Simple Real-Time Info-Graphics Platform. Available on http://techcrunch.com/2014/02/13/infogr-am-secures-1-8m-to-scale-its-simple-real-time-info-graphics-platform/. Last visited on 4 September 2014
159. Techhub, We help startups get better, faster. Available on: http://www.techhub.com/. Last visite on 4 September 2014
160. The Denver Post. Techknow Bytes. Denver’s FullContact acquires Cobook to improve contact management on gadgets. Available on http://blogs.denverpost.com/techknowbytes/2014/01/15/denver-based-fullcontact-acquires-cobook-to-improve-contact-management/12774/. Last visited on 4 September 2014
333
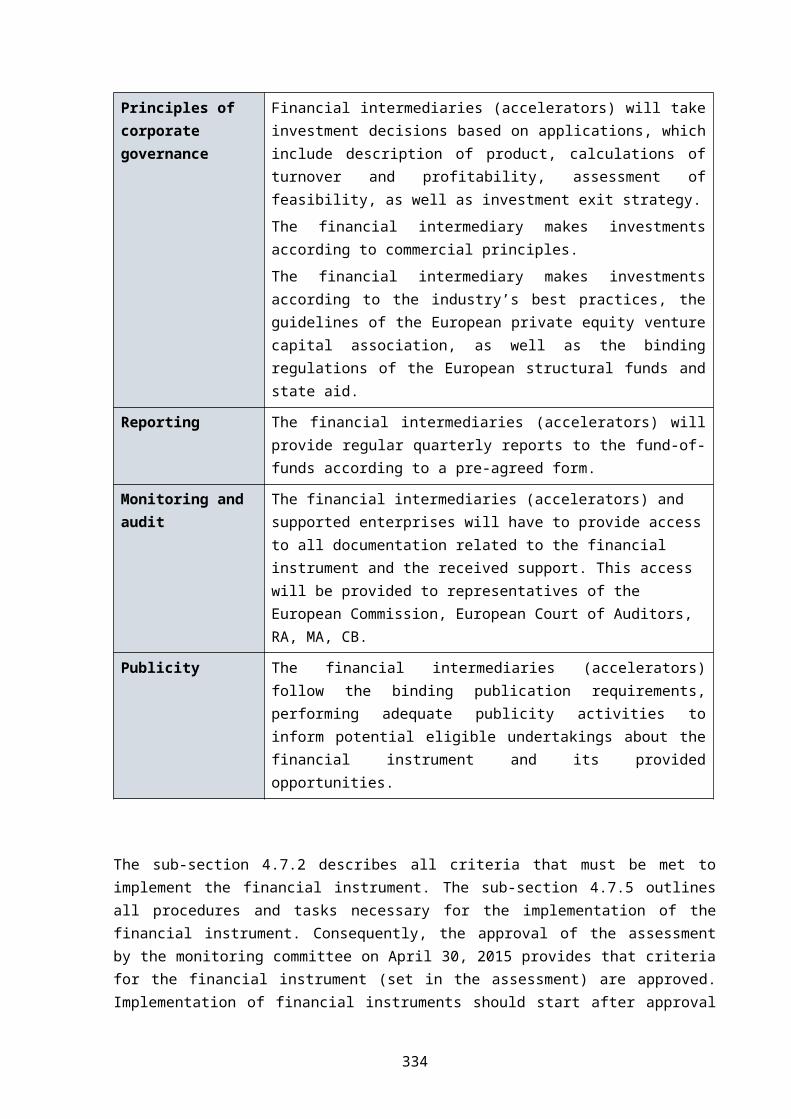
161. The Economist Intelligence Unit, Available on: http://www.eiu.com/home.aspx. Last visited on October 20, 2014
162. The Economist Intelligence Unit, Country forecast. Latvia, 2014163. Van der Ver, Koen. Private Trade Credit Insurers during the Crisis: The Invisible Banks. World
Bank, 2011164. Venture Village. Startup of the Week – Cobook could be the address book tool we’ve been
waiting for. Available on http://venturevillage.eu/startup-of-the-week-cobook. Last visited on 4 September 2014
165. vivus.lv. Available on: https://www.vivus.lv. Last visited on 26 September 2014.166. WIPO, Statistical country profile: Latvia. Available on:
http://www.wipo.int/ipstats/en/statistics/country_profile/countries/lv.html. Last visited on 14 September 2014
167. World Bank Group, Ease of Doing Business in Latvia. Available on: http://www.doingbusiness.org/data/exploreeconomies/latvia/. Last visited on October 12, 2014
168. World Bank, CIA World Factbook, UN, World Economic Forum, Transparency International, Reporters Without Borders. Available on: https://www.cia.gov/library/publications/the-world-factbook. Last visited on October 20, 2014.
334


