TABLE OF CONTENTS Abstract Preface Abbreviations and ... · PDF fileKeywords: biorefinery,...
108
TABLE OF CONTENTS Abstract Preface Abbreviations and Acronyms List of Figures List of Tables 1 Introduction 2 Literature Review on the Production of Protein Concentrate, Dextrose, Briquettes and Ethanol 3 Approach and Design Basis – Foundation for Simulation of PoE technology by Aspen Plus 4 Description of Process Simulation on Aspen Plus 5 Heat Integration of the Ethanol Plant – Pinch Analysis 6 Process Economics 7 Discussion 8 Conclusions References Appendix A – Parameters and thermodynamic properties for Aspen Plus Appendix B – Material balances prior to simulation by Aspen Plus
Transcript of TABLE OF CONTENTS Abstract Preface Abbreviations and ... · PDF fileKeywords: biorefinery,...

TABLE OF CONTENTS
Abstract
Preface
Abbreviations and Acronyms
List of Figures
List of Tables
1 Introduction
2 Literature Review on the Production of Protein Concentrate,
Dextrose, Briquettes and Ethanol
3 Approach and Design Basis – Foundation for Simulation of PoE
technology by Aspen Plus
4 Description of Process Simulation on Aspen Plus
5 Heat Integration of the Ethanol Plant – Pinch Analysis
6 Process Economics
7 Discussion
8 Conclusions
References
Appendix A – Parameters and thermodynamic properties for Aspen
Plus
Appendix B – Material balances prior to simulation by Aspen Plus

Overall process analysis for on-farm production
of bioethanol and protein from leguminous crops
Alaia Sola Saura
Stockholm, Sweden
January 30, 2015

Aalto University
School of Engineering
Department of Energy Technology
Nordic Master’s programme in Innovative and Sustainable Energy Engineering
Alaia Sola Saura
Overall process analysis for on-farm production of bioethanol and protein from leguminous crops
Thesis submitted in partial fulfillment of the requirements for the degree of
Master of Science in Technology
Stockholm, Sweden
January 30, 2015
Supervisor: Prof. Mika Järvinen, Aalto University
Instructor: Dr. David Bauner, KTH Royal Institute of Technology and Renetech AB
AALTO-UNIVERSITY
SCHOOL OF ENGINEERING PB 11000, 00076 AALTO http://www.aalto.fi
ABSTRACT OF THE MASTER’S THESIS
Author: Alaia Sola Saura
Title: Overall process analysis for on-farm production of bioethanol and protein from leguminous crops
Department: Department of Energy Technology
Professorship: Energy Engineering and Environmental Protection
Code: Ene-47
Supervisor: Prof. Mika Järvinen Instructor: Dr. David Bauner
One of the main challenges the current world must face is feeding its
population. Focusing on the European Union, one of the commodities that
suffer from a significant imbalance between local/regional production and
consumption is high-protein crops, such as legumes. The advantages of
decreasing import dependency are obvious, but a successful commercial
production of selected high-value components from grain legumes - i.e.
protein concentrate for direct food or feed use - will only be possible along
with the exploitation of all fractions of the plant. At this point, the term
“biorefinery” appears. “Peas on Earth” is a concept that aims to enhance
the yield of feasible product outputs from leguminous crops, offering an
opportunity for European farmers to make legumes more available as part
of their crop rotation. The outputs of the proposed biorefinery are protein
concentrate, sugar (and/or bioethanol) and biomass briquettes. In order to
commercialize this technology, detailed calculations on product mass
balance, energy use of the biorefinery and heat integration opportunities
are required. The objective of this work was, therefore, to supply all this
information. This was performed by describing, building and using a
simulation model on Aspen Plus that calculates mass and energy balances
of the overall process. Pinch analysis was chosen as the methodology for
heat integration purposes. The results of the simulations provided the
annual production of the plant and a considerably realistic basis for energy
demand estimation and for gross profit calculations. The heat integration
analysis indicated potential heat savings by transferring heat between
specific process streams.
Date: January 30, 2015 Language: English Number of pages: 97
Keywords: biorefinery, legumes, bioethanol, protein, Aspen Plus, Pinch analysis

AALTO-UNIVERSITETET HÖGSKOLAN FÖR INGENJÖRVETENSKAPER
PB 11000, 00076 AALTO http://www.aalto.fi
SAMMANFATTNING AV EXAMENSARBETET
Författare: Alaia Sola Saura
Rubrik: Totalt processanalys för produktion av bioetanol och protein från
baljväxter
Avdelning: Institutionen för energiteknik
Professur: Energiteknik och miljöskydd Kod: Ene-47
Handledare: Prof. Mika Järvinen Instruktör: Dr. David Bauner
En av de största utmaningarna som dagens värld möter är att föda sin
befolkning. En av de råvaror i Europa som påvisar en betydande obalans
mellan lokal/regional produktion och konsumtion är proteingrödor, som
t.ex. baljväxter eller trindsäd. Fördelarna med ett minskat importberoende
är uppenbara. Dock är kommersiell produktion av utvalda
högvärdeskomponenter från trindsäd - dvs. proteinkoncentrat för direkt
livsmedel eller foder - endast möjligt om alla fraktioner av växten utnyttjas.
Det är i ett sådant sammanhang som begreppet “bioraffinaderi" blir
relevant. "Peas on Earth" är ett projekt och koncept som syftar till att öka
utbytet av produkter från baljväxter och att erbjuda möjligheter till EU:s
jordbrukare för att göra baljväxter mer tillgängliga som en del av
växtföljden. Produkterna från bioraffinaderiet är proteinkoncentrat, socker
(och/eller bioetanol) och cellulosabriketter. För att kommersialisera denna
teknik krävs detaljerade beräkningar på produkters uteffekt,
energianvändning av bioraffinaderiet och möjlighet till värmeväxlings
integration. Syftet med detta arbete var därför att tillhandahålla denna
information. Detta utfördes genom att beskriva och bygga en
simuleringsmodell på Aspen Plus. Simuleringsmodellen beräknar
material- och energibalanser i de olika processdelarna. ”Pinch”-analys
valdes som metod för värmeintegrationsändamål. Resultaten av
simuleringarna förutsatt anläggningens årsproduktion och en betydlig
realistisk grund för uppskattningen av energiefterfrågan och för
bruttovinstberäkningar. Värmeintegrations analys visade potentiell värme
besparing genom att överföra värme mellan processflöden.
Datum: Januari 30, 2015 Språk: Engelska Antal sidor: 97
Nyckelord: bioraffinaderi, baljväxter, bioetanol, protein, Aspen Plus,“Pinch”-analys

i
Preface
The work for this thesis is a contribution to the Peas on Earth concept
carried out under the auspices of the Swedish company Renetech AB.
Renetech AB is focused on project development in the areas of renewable
energy as well as nutrient recycling in agriculture from biomass. In this
project, Renetech collaborates with Ecoetanol AB, a Swedish company
that aims at implementing a patented process for processing field beans
for food, feed and various fuels, which indirectly also justifies the
increased cultivation of this nitrogen-fixing crop. This report is my final
thesis for the Master of Science degree at Aalto University in Finland, as a
part of a Double-Degree programme shared with KTH Royal Institute of
Technology in Sweden. The instructor for this work David Bauner, CTO of
Renetech, is warmly thanked for the coordination, help and fruitful
discussions, as well as the president of Renetech, Tom Walsh. I would also
like to thank them for valuable experience and friendly atmosphere. Prof.
Mika Järvinen and Dr. Loay Saeed are gratefully acknowledged for the
supervision and feedback on the final report. Finally, I would like to thank
the whole group of partners in the Peas on Earth project for their
willingness to help me in any question that appeared during the execution
of this thesis.
Stockholm, December 2014.

ii
Abbreviations and Acronyms
CFuge Centrifuge filter
CO2 Carbon dioxide C5 Pentose C6 Hexose
DM Dry matter DSTWU Model for Shortcut distillation design on Aspen Plus
EU European Union HEN Heat exchanger network
HMF Hydroxymethyl furfural H2O Water
IG Ideal Gas mCp Specific heat capacity flow rate
mCpCj Specific heat capacity flow rate of a cold stream in the analysis mCpHi Specific heat capacity flow rate of a hot stream in the analysis
MER Maximum Energy Recovery MW Molecular weight
N Number of process streams & utility types above & below pinch nC Number of cold process streams present at the Pinch points
nH Number of hot process streams present at the Pinch points NREL U.S. National Renewable Energy Laboratory
NRTL Non-random two-liquid activity coefficient model O2 Oxygen
PDS Product design specification PoE Peas on Earth
ProtSol Dissolved protein RadFrac Model for Rigorous distillation design on Aspen Plus
RKS Redlich-Kwong-Soave equation RStoic Stoichiometric reactor
Solunkn Unknown soluble solids TCBB Ireland’s national Technology Center for Biorefining and Bioenergy
Tpinch Pinch temperature Tpinch cold Pinch temperature for cold streams
Tpinch hot Pinch temperature for hot streams Umin,MER Minimum number of units in MER network
UNIFAC Universal functional activity coefficient model UNIQUAC Universal quasi-chemical model
VLE Vapor-Liquid Equilibrium ∆Tmin Minimum allowed temperature difference in heat exchangers
h hour kg kilogram
kWh Kilowatt hour L Litre
SEK Swedish crown

iii
Contents
Preface ...................................................................................................... i
Abbreviations and Acronyms...................................................................... ii
List of Figures ........................................................................................... v
List of Tables ............................................................................................. vi
1 Introduction ........................................................................................... 1
1.1 Background on Legumes as Feedstock for Protein Concentrate&Biofuel..1
1.2 Peas on Earth Project .............................................................................. 4
1.3 Goal of the Study .................................................................................... 5
1.4 Thesis Layout .......................................................................................... 6
2 Literature Review on the Production of Protein Concentrate, Dextrose,
Briquettes and Ethanol……………………………………………………………....7
2.1 Protein-Starch Separation in Bean Fraction ............................................ 7
2.2 Production of Protein Concentrate........................................................... 8
2.3 Dextrose Production ................................................................................ 9
2.4 Briquettes Production ............................................................................. 10
2.5 Starch-derived Ethanol Production ......................................................... 11
2.6 Lignocellulose-derived Ethanol Production .............................................. 12
2.7 Downstream Ethanol Processing Techniques .......................................... 14
3 Approach and Design Basis – Foundation for Simulation of PoE technology
by Aspen Plus……………………………………………………………………………16
3.1 Methodology ........................................................................................... 16
3.2 Block Diagram of the Process ................................................................. 18
3.3 Physical Property Methods ...................................................................... 20
3.3.1 Global Property Method: Vapor-Liquid Equilibria ..................................... 21
3.3.2 Solubility of CO2: Henry’s Law ................................................................. 22
3.3.3 Solids Definition ...................................................................................... 23
3.4 Thermodynamic Parameters and Properties ............................................ 23
3.5 Plant Location, Size and Operation Parameters ....................................... 25
3.6 Product Design Specification ................................................................... 25
3.7 Feedstock Composition and Mass Flow Rates ......................................... 26
3.8 Bean Fraction Pretreatment: Dehulling and Starch-Protein Separation ... 28
3.8.1 Bean Fraction Pretreatment described by PoE .......................................... 28
3.8.2 Limitations on Available Data .................................................................. 29
3.8.3 Dehulling ................................................................................................ 30
3.8.4 Starch-Protein Separation ....................................................................... 31
3.9 Protein Concentrate Processing .............................................................. 32
3.10 Starch-to-Glucose Process .................................................................... 32
3.10.1 General Parameters ............................................................................... 32
3.10.2 Stoichiometry ........................................................................................ 33
3.10.3 pH Control ........................................................................................... 34
3.11 Lignocellulose Hydrolysis including Pretreatment ................................. 34
3.11.1 General Parameters ............................................................................... 34
3.11.2 Stoichiometry ........................................................................................ 36

iv
3.12 Fermentation for Starch-derived Ethanol Production ............................... 37
3.12.1 General Parameters ............................................................................... 37
3.12.2 Stoichiometry ........................................................................................ 38
3.12.3 Micro-organism Growth ......................................................................... 39
3.13 Fermentation for Lignocellulose-and-Starch-derived Ethanol
Production .................................................................................................... 39
3.13.1 General Parameters ............................................................................... 39
3.13.2 Stoichiometry ........................................................................................ 40
3.14 Distillation ............................................................................................ 40
4 Description of Process Simulation on Aspen Plus………………………………42
4.1 Process Design 1 ..................................................................................... 42
4.1.1 Protein Concentrate Production ............................................................... 42
4.1.2 Dextrose Production ................................................................................ 43
4.1.3 Briquettes Production.............................................................................. 44
4.2 Process Design 2 ..................................................................................... 46
4.2.1 Protein Concentrate Production ............................................................... 47
4.2.2 Starch-derived Ethanol Production .......................................................... 47
4.2.3 Briquettes Production.............................................................................. 47
4.3 Process Design 3 ..................................................................................... 48
4.3.1 Protein Concentrate Production ............................................................... 48
4.3.2 Starch Fraction Treatment ...................................................................... 48
4.3.3 Lignocellulose Fraction Treatment ........................................................... 48
4.3.4 Fermentation and Ethanol Purification .................................................... 49
5 Heat Integration of the Ethanol Plant – Pinch Analysis………………………51
5.1 Background on Pinch Analysis ................................................................ 51
5.2 Heat Integration of Process Design 2 ....................................................... 54
5.3 Heat Integration of Process Design 3 ....................................................... 67
6 Process Economics……………………………………………………………………….74
6.1 Comments on Results from Simulations ................................................. 74
6.2 Economic Assessment ............................................................................. 75
6.2.1 Process Design 1 ..................................................................................... 73
6.2.2 Process Design 2 ..................................................................................... 79
6.2.3 Process Design 3 ..................................................................................... 80
7 Discussion…………………………………………………………………………………..81
8 Conclusions…………………………………………………………………………………85
References……………………………………………………………………………………..88
APPENDICES
Appendix A – Parameters and thermodynamic properties for Aspen Plus...93
Appendix B – Material balances prior to simulation by Aspen Plus………….96

v
List of Figures
Figure 3.1: Flow diagram for the approach followed in this study ...................... 18
Figure 3.2: Block diagram of Process design 3 .................................................. 19
Figure 3.3: Guidelines for choosing a property method (Aspen Plus, 2003)……..21
Figure 4.1: Aspen Plus flowsheet of Process design 1 ........................................ 45
Figure 4.2: Aspen Plus flowsheet of Process design 2 ........................................ 46
Figure 4.3: Aspen Plus flowsheet of Process design 3 ........................................ 50
Figure 5.1: Cooling duty shares of each hot stream out of the total cooling
demand ............................................................................................................. 56
Figure 5.2: Heating duty shares of each cold stream out of the total heating
demand ............................................................................................................. 56
Figure 5.3: Composite curves for Process design 2 ............................................ 58
Figure 5.4: Grid diagram with streams, matches between process streams and
utility matches for Process design 2 .................................................................. 63
Figure 5.5: Grand Composite Curves for Process design 2 ................................ 66
Figure 5.6: Cooling duty shares of each hot stream out of the total cooling
demand ............................................................................................................. 69
Figure 5.7: Heating duty shares of each cold stream out of the total heating
demand ............................................................................................................. 69
Figure 5.8: Composite Curves for Process design 3 ........................................... 69
Figure 5.9: Grid diagram with streams, matches between process streams and
utility matches for Process design 3 .................................................................. 71

vi
List of Tables
Table 3.1: Required properties for NRTL method (Aspen Plus, 2003) ................. 24
Table 3.2: Facility operation parameters ........................................................... 25
Table 3.3: Dry matter Composition of each fraction out of wet thresher ............ 27
Table 3.4: Mass flow rates and moisture content of each fraction ...................... 28
Table 3.5: Dry Mass distribution on dehulling process (Jensen et al., 2010) ..... 30
Table 3.6: Composition of each fraction after dehulling. Input to Aspen Plus .... 31
Table 3.7: Details of the reaction in coagulation reactor block ........................... 32
Table 3.8: Details of the reaction in saccharification reactor block .................... 34
Table 3.9: Details of the reactions in weak-acid pretreatment reactor block ...... 36
Table 3.10: Details of the reaction in enzymatic hydrolysis reactor block .......... 37
Table 3.11: Details of the reaction in starch-derived fermentation reactor ......... 38
Table 3.12: Details of the reactions in co-fermentation reactor blocl ................. 40
Table 5.1: Thermal data for hot streams in Process design 2 ............................. 55
Table 5.2: Thermal data for cold streams in Process design 2............................ 55
Table 5.3: Pinch temperature ............................................................................ 58
Table 5.4: Matches between process streams above pinch suggested for Process
design 2 without integration of distillation columns or reactors ........................ 62
Table 5.5: Hot streams related to distillation columns and reactors .................. 64
Table 5.6: Cold streams related to distillation columns and reactors ................. 64
Table 5.7: Summary of key figures of proposed HEN for Process design 2 ......... 67
Table 5.8: Thermal data for hot streams in Process design 3 ............................. 67
Table 5.9: Thermal data for cold streams in Process design 3............................ 68
Table 5.10: Pinch temperature .......................................................................... 69
Table 5.11: Matches between process streams above pinch suggested for Process
design 3 without integration of distillation columns or reactors ........................ 70
Table 5.12: Hot streams related to distillation columns and reactors ................ 72
Table 5.13: Cold streams related to distillation columns and reactors ............... 72
Table 5.14: Summary of key figures of proposed heat exchanger network for
Process design 3 ............................................................................................... 73
Table 6.1: Variable Operating Costs for purchased items .................................. 76
Table 6.2: Current cost in Sweden of the fuels considered for steam
generation ......................................................................................................... 77
Table 6.3: Revenues Variable Operating Costs .................................................. 77

1
Chapter 1
Introduction
1.1 Background on Legumes as Feedstock for Protein
Concentrate & Biofuel
One of the main challenges the current world must face is feeding its
population, a population that is steadily increasing in size and wealth
(Godfray et al., 2010). Apart from the increase in number of inhabitants
on the Earth, the increased wealth of part of this population exacerbates
this challenge, as wealthy populations tend to demand more meat in their
diets (McMichael et al., 2007). In terms of protein content and energy use,
animal feed requirements are much higher than actual human
requirements when accounting for the daily maintenance of the animals
(Dale et al., 2009). As a consequence, it is clear that one of the main
challenges for food security is providing enough animal feed, rather than
direct human consumption. Although animal nutrition is complex and
demands several nutritional requirements, the two dominant
requirements are caloric intake and protein (Ensminger & Olentine, 1978).
The latter component, protein, is the focus of this thesis.
Although all food plants provide protein, the seeds of the plants that
belong to the legume family (Fabaceae) are especially rich in protein. The
so-called protein crops are therefore legumes and include those generally
used for their seeds, i.e. grain legumes (also known as pulses in some
countries), e.g. species like faba bean, pea, chickpea, lupins and soya
bean (European Union, Committee on Agriculture and Rural Development,
2013). In general terms, the production of protein crops within the
European Union has followed a decreasing tendency during the last
decades. Protein crops are now grown on only 1.8% of arable land in the
EU compared with 4.7% in 1961, this probably due to the comparative
yield advantage of cereals over protein crops grown in Europe in part due
to challenges in legume cultivation. However, European consumption of
2
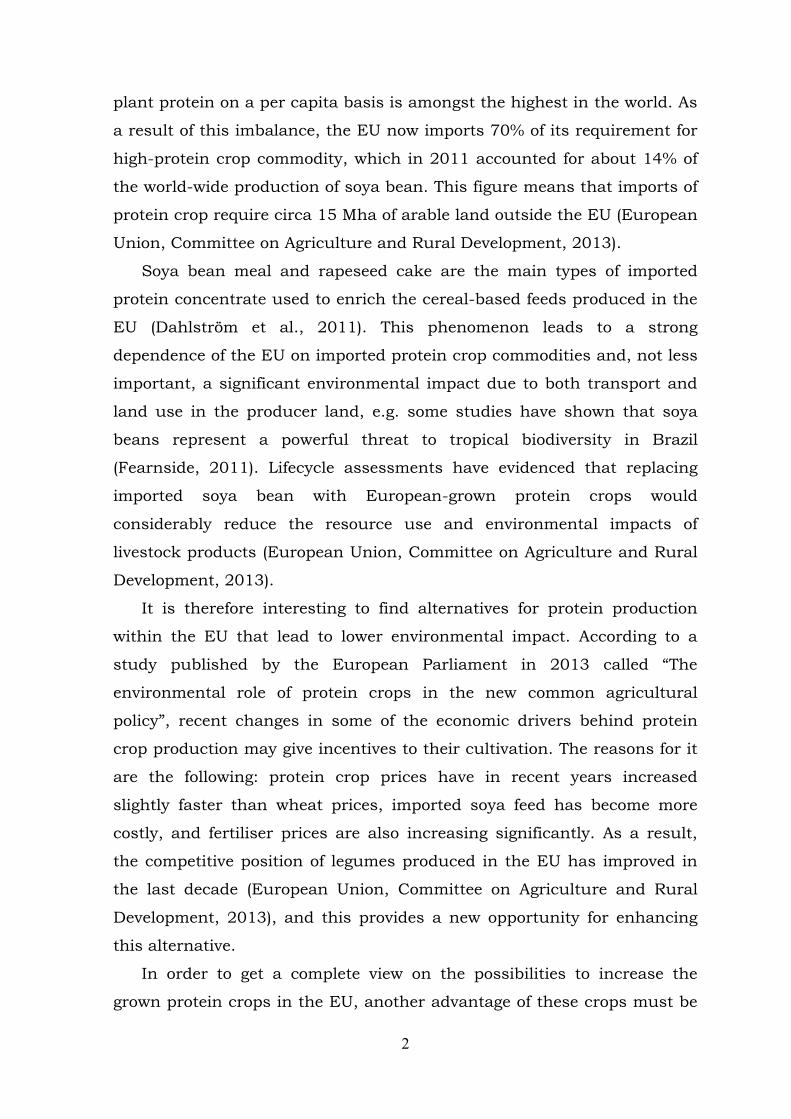
plant protein on a per capita basis is amongst the highest in the world. As
a result of this imbalance, the EU now imports 70% of its requirement for
high-protein crop commodity, which in 2011 accounted for about 14% of
the world-wide production of soya bean. This figure means that imports of
protein crop require circa 15 Mha of arable land outside the EU (European
Union, Committee on Agriculture and Rural Development, 2013).
Soya bean meal and rapeseed cake are the main types of imported
protein concentrate used to enrich the cereal-based feeds produced in the
EU (Dahlström et al., 2011). This phenomenon leads to a strong
dependence of the EU on imported protein crop commodities and, not less
important, a significant environmental impact due to both transport and
land use in the producer land, e.g. some studies have shown that soya
beans represent a powerful threat to tropical biodiversity in Brazil
(Fearnside, 2011). Lifecycle assessments have evidenced that replacing
imported soya bean with European-grown protein crops would
considerably reduce the resource use and environmental impacts of
livestock products (European Union, Committee on Agriculture and Rural
Development, 2013).
It is therefore interesting to find alternatives for protein production
within the EU that lead to lower environmental impact. According to a
study published by the European Parliament in 2013 called “The
environmental role of protein crops in the new common agricultural
policy”, recent changes in some of the economic drivers behind protein
crop production may give incentives to their cultivation. The reasons for it
are the following: protein crop prices have in recent years increased
slightly faster than wheat prices, imported soya feed has become more
costly, and fertiliser prices are also increasing significantly. As a result,
the competitive position of legumes produced in the EU has improved in
the last decade (European Union, Committee on Agriculture and Rural
Development, 2013), and this provides a new opportunity for enhancing
this alternative.
In order to get a complete view on the possibilities to increase the
grown protein crops in the EU, another advantage of these crops must be

3
also highlighted. Not only are legumes interesting due to their high
content in protein, but also almost all of them perform biological nitrogen
fixation. This functional property is unique among crops, and the legume
plant supplies the soil with nitrogen and therefore reduces the need for
fertiliser nitrogen in the following crops (European Union, Committee on
Agriculture and Rural Development, 2013). Thus, legumes can play a
critical role in crop rotation, by reducing fertilizer (and thus energy) costs,
improving soil physical conditions and decreasing pest and weed
populations (Jensen et al., 2010). In fact, several studies have been done
on the capacity of legumes for climate change mitigation (see the review
article by Jensen et al., 2010).
Eventually, an increase in demand for grain legumes and the
aforementioned improvement in their competitive position may increase
the attractiveness of this commodity to European producers as a rotation
crop. However, if European protein crop production is to compete better
with the more profitable European cereals production, a successful
commercial production of selected high-value components from grain
legumes (i.e. protein isolate or concentrate for direct food or feed use) will
require the exploitation of all fractions of the plant, in order to maximize
plant biomass valorization and minimize the production of residues. At
this point, the concept of “biorefinery” appears. According to Cherubini
(2010), the fundamental aim of a biorefinery is “to deliver multiple
products by polymerising and deoxygenating the feedstock components,
thereby maximising the value derived for the biomass feedstock”. One of
these multiple outpus is very commonly a biofuel, e.g. biogas, bioethanol,
or biomass briquettes. Indeed, grain legumes are very interesting as a
substrate for biorefineries, particularly because leguminous plants are not
dependent on nitrogen fertilisation. Their capacity to fix nitrogen leads to
lower fossil energy use, which in turn leads to a lower carbon footprint
(Karlsson et al., 2014).
If the biorefinery concept is brought into consideration for the legumes
case, the agricultural sector in charge of growing protein crops can be re-
created to support both increased feed needs and biofuels production.

4
Like that, the two challenges mentioned at the beginning of this text may
be tackled simultaneously, i.e. the high protein content and energy use in
animal feed requirements, which in turn is continuously increasing due to
wealthier populations in some parts of the world. Accordingly, crops such
as faba beans (Vicia faba L.), which contain significant amounts of both
protein and starch, are seen as an agronomically viable alternative. Yet for
the protein concentrate production from faba beans to be economically
feasible, all the possible by-products need to be made profitable.
Many studies have already been performed on the ability to separate
protein from starch in beans, and it has been shown that bean starch is
readily convertible to ethanol using the same process and enzymes applied
to corn - see for example Nichols et al. (2011). Consequently, on-farm
production of bioethanol from the starch contained in legumes after
protein separation is an attractive option for a biorefinery proposal,
together with the exploitation of other possible by-products. Among these
we find the explotation of the lignocellulosic fraction of the leguminous
plant. Lignocellulose refers to agricultural residues such as rice straw,
wheat straw, corn stover, bagasse, and plant residues in general (Tojo &
Hirasawa, 2013). This type of biomass may be processed to produce
biomass briquettes or pellets for self-heating purposes, or to produce
lignocellulose-derived ethanol that would increase the biofuel yield of the
biorefinery.
1.2 Peas on Earth Project
The company Ecoetanol AB, based in Sweden, has developed a technology
concept where ensilaged pea or bean plants are decomposed into three
fractions: protein-rich liquid extract, beans and stalks. This concept is
called Peas on Earth (PoE).
This separation is done by means of processing the whole plant above
ground by first ensilaging it, and then passing the ensilaged biomass
through a wet thresher earlier developed by Ecoetanol. The objective of the
PoE concept is that the three fractions are further processed into a variety

5
of products. Therefore, the concept as a whole can be referred to as a
biorefinery. The products considered as possible outputs of this
biorefinery concept are: protein concentrate, sugar (dextrose), briquettes,
bioethanol, and fertiliser. In order to produce these commodities, one of
the crucial steps in the biomass processing is the separation of the protein
content from the starch content of the bean or pea grains.
According to Ecoetanol, by enhancing the yield of the feasible product
outputs from leguminous crops, the PoE technology appears as a clear
opportunity for European farmers to make legumes more accessible as
part of crop rotation; this by simultaneously increasing the amount of
organic matter in the soil and reducing the need for mineral fertilizer,
while offering additional income from the products mentioned above.
The partners taking part in the concept’s development are Ecoetanol
AB, Renetech AB (both based in Sweden), the Technology Center for
Biorefining and Bioenergy (TCBB, based in Ireland), and Industrias
Agrarias Castellanas S.A. (based in Spain).
1.3 Goal of the Study
This thesis has been performed in collaboration with Renetech AB, which
has engaged in managing market aspects and industry permits for
commercialization of the PoE technology. Moreover, Renetech works with
the development of the system aspect of the PoE technology, and with the
project management required to develope a Demonstrator, i.e. a pilot plant
of the future commercial biorefinery. For all these reasons, Renetech is
interested in obtaining detailed calculations on the product mass outputs,
energy use of the plant, and opportunitites for heat integration, according
to a given input of leguminous biomass with a characteristic composition.
The aim of the thesis was therefore to provide Renetech with this
desired information. This was performed by describing, building and using
a simulation model that calculates mass and energy balances of the
overall process. The process converts the three fractions obtained from the
ensilaged legumes into a variety of products, such as bioethanol, protein

6
for feed/food grades and, eventually, other by-products interesting for
sales. The model should provide an easy-to-use, yet rigorous, tool for
evaluation of the mass and energy balances. Opportunities for heat
integration in the process should also be identified.
The target group for the study was Renetech and, secondly, the rest of
the partners in the PoE project. Results should be useful as information
for economic evaluations, but also for comparison of the environmental
performance of the products from the present biorefinery with
conventional products.
It must be highlighted that the product mass outputs and economic
assessment included in this work was considered as sensitive information
that all partners in the PoE concept’s development would like to keep
confidential. Therefore, due to the Non-Disclosure Agreement signed with
Renetech AB, two versions of the thesis report have been elaborated. Only
the classified report that is delivered to the company contains this
confidential data.
1.4 Thesis Layout
This thesis includes eight chapters. Chapter 1 introduces the motivations
and the objectives in developing this study. Chapter 2 shows an overview
of the most relevant information obtained from literature review during the
earlier steps of the study. Chapter 3 reviews step-by-step the approach to
build the foundations required before developing the simulation models.
Chapter 4 gives a description of the built models in the simulation
software. Chapter 5 describes in detail the heat integration analysis
executed on two of the Process designs. Chapter 6 covers the scheme
followed to do the economic assessment. Chapter 7 is the discussion of
the results and incorporates some recommendations for future work.
Finally, Chapter 8 presents the conclusions of this work.
7
Chapter 2
Literature Review on the Production of Protein
Concentrate, Dextrose, Briquettes and Ethanol
A literature review gives an overview of the field of inquiry. In this case,
the goal of the literature review was to get familiar with the essential
background on the production process of each of the possible outputs of
the biorefinery. This step was crucial in order to later build the
foundations for the simulation model and, thus, to build the model itself.
2.1 Protein-Starch Separation in Bean fraction
Researchers have tried different methods to separate starch and protein
from legumes and improve starch and protein purification. But the
isolation of starch fraction from legume seeds is difficult to achieve due to
the presence of insoluble flocculent proteins and fine fibre which
diminishes sedimentation, as these fractions co-settle with the starch
fraction (Emami et al., 2007).
Most of the literature found regarding commercial separation of
protein and starch concerned corn fractionation, which mainly uses the
wet milling process. In this process, the grains are steeped in sulphur
dioxide and lactic acid followed by a grinding step. The starch and protein
are then separated using settling, centrifugation or hydrocycloning
(Lindeboom, 2005). All of these processes are based on the difference in
density between the starch and the hydrated protein particles. Thus,
sedimentation is a proper technique to separate these two components.
In general, the separation of starch and protein often consists of the
solubilisation of the protein (called as protein extraction) and the
sedimentation of starch granules out of a slurry. For the beans case, the
bean seeds first need to be milled to flour. Pin-milling of bean seeds, either
whole or dehulled seeds, yields thus flours that contain two distinct types
of particles based on both their size and density. This distinction can be
exploited to produce a protein concentrate (the light population of

8
particles) and a starch-riched slurry (the heavy population of
particles) (Vose et al., 1976).
Starch sedimentation occurs due to the average density of starch
granules (1.5 g/cm3), which is greater than that of the protein particles
(1.1 g/cm3) (Lindeboom, 2005). The rate of this phenomenon could be
determined by Stokes’ law, which proves the relationship between particle
density and sedimentation.
2.2 Production of Protein Concentrate
As described for the starch-protein separation process, protein is generally
recovered from the feedstock by extraction with a suitable solvent (usually
aqueous) with the aim of producing an enriched protein product.
Depending on the type of proteins present in the feedstock, the protein is
best extracted in water, aqueous salt solution, 70-80% ethanol or
alkali/acid. The result of protein extraction is an intermediate that is
much diluted with the extraction medium. Therefore, the next step in
protein production is concentration (Lindeboom, 2005).
In the case for this study, the extracted protein from the beans fraction
is mixed with the juice extract, i.e. one of the three outputs from the wet
thresher. The protein in the juice extract can be concentrated through a
variety of methods, however, the most common method is heat
coagulation (Bals et al., 2012). This unit operation is required because the
protein particles will not sediment with conventional physical methods
(e.g. filtration or settling) unless they are first agglomerated through
coagulation. What occurs during coagulation is that proteins are
denatured due to high temperature, thus hydrophobic sites are open up
and this causes the proteins to coagulate and precipitate. Coagulation can
be achieved through heating in a short residence time. The coagulated
protein produced is then separated from the de-proteinated juice by
filtration. Finally, the filtrated protein is dried (Bals et al., 2012). After this
purification process, the extracted proteins are referred to as protein
9
concentrates or protein isolates, depending on the protein purity of the
sample.
2.3 Dextrose Production
Dextrose or glucose is an all-purpose sweetener that is used in countless
foods, beverages, sweets, and nutraceutical products across the globe
(Hobbs, 2009). Dextrose can be produced from starch processing, as
starch is formed by long chain molecules built by glucose (i.e. a molecule
classified as hexose, since it contains 6 carbon atoms).
Acid hydrolysis of starch was the main technique used in the past.
However, acid hydrolysis is now largely replaced by enzymatic processes,
as the former one required the use of corrosion resistant materials, gave
rise to high colour and salt and ash content, needed more energy for
heating and was relatively difficult to control (Chaplin & Bucke, 1990).
Today, commercial processes on dextrose production which are based
on enzyme-catalysed conversion have mainly three stages. It starts with
the starch slurry (30% to 40% dry solids) undergoing the so-called
gelatinisation step. In this step, the slurry is first pasted at a temperature
of 80–90°C, which leads to a phase transition. The gelatinisation process
breaks down the intermolecular bonds of starch molecules in the presence
of water and heat. This irreversibly dissolves the starch granule, and the
heat causes the chains to begin to separate into an amorphous form
(Hobbs, 2009). At this point, the starch thickens considerably and would
be difficult to process if an enzyme was not added, partially hydrolyzing
the starch to lower molecular weight molecules (Borglum, 1980).
In the next step the slurry undergoes liquefaction. Various
manufacturers use different approaches to starch liquefaction but the
principles are the same. Starch is treated with a ‘heat-stable’ enzyme
alpha-amylase at the temperature of gelatinisation, i.e. 80-90ºC. During
liquefaction, the enzyme alpha-amylase attacks the starch polysaccharide
randomly, producing maltose (two glucose monomers together) and higher
oligomers, according to:

10
α-amylase
starch + H2O → oligosaccharides
The principal objective for liquefaction is to reduce the viscosity of the
gelatinised starch to ease subsequent processing. The resulting solution of
this process step is more capable of flowing, i.e. is liquefied (Chaplin &
Bucke, 1990).
The last step in the process involves saccharification of the liquefied
product using a gluco-amylase enzyme. During saccharification, gluco-
amylase attacks the non-reducing end of maltose and of higher oligomers,
releasing mainly glucose molecules (fermentable sugars), but also maltose
molecules (McAloon et al, 2000). Before the enzyme is added, the liquefied
product is cooled down to 60ºC. The reaction occurring during
saccharification is depicted as follows:
gluco-amylase
oligosaccharides/maltose + H2O → glucose/maltose mixture
In order to refine the resulting liquor from saccharification and make a
dextrose (glucose) syrup, the fats and protein are removed by filtration.
The syrup is then carbon bleached, i.e. it is passed through pulsed beds of
activated carbon for clarification and bleaching. After the carbon beds, the
liquor is passed through ‘check’ filters designed to remove escaping
carbon fines. Next, the syrup is demineralized through anion and cation
exchange resins prior to being isomerized. The resulting refined stream is
then concentrated to the desired solids level (typically 75 - 85 % solids)
and packaged for sale globe (Hobbs, 2009).
2.4 Briquettes Production
Briquettes are squared or round pieces intended for heating, and
produced by compression of biomass particles. Fuel briquettes are at least
25 mm in diameter or width, and they usually have a moisture content
below 15%.

11
The basis of regular briquettes production is the lignin plasticitation
mechanism. Lignin and cellulose are the two major compounds of
biomass. Lignin is a non-crystallized aromatic polymer that, if heated to
200–300°C, starts to be soft, melted and liquefied. Then, if pressure is also
applied, lignin will glue cellulose together which solidifies the biomass and
make it become briquettes after cooling down. If no lignin is present in the
biomass, a binder must be added.
In general, briquetting biomass involves the following steps: crushing,
drying (natural or induced) to moisture content of 6 – 14%, densification
at 4-60 MPa and 160-280ºC, cooling and packing for storage (Zhanbin,
2011).
2.5 Starch-derived Ethanol Production
In order to produce ethanol from the starch fraction of bean seeds, the
first part of the process may be described as exactly the same as for the
process described in sub-section 2.3, i.e. dextrose production process.
Thus, gelatinisation, liquefaction and saccharification are also required to
produce ethanol. However, in this case, saccharification can be completed
either before fermentation or by a continuous saccharification during
fermentation. If the first of these two methods is used, then the method is
essentially the same as for dextrose production, but with an additional
step at the end (fermentation). In this case, the syrup obtained after
saccharification is diluted with water to 19 wt% (weight percent) solids
and cooled to fermentation temperature, i.e. 30ºC.
Currently, the most frequently used micro-organism for fermenting
bioethanol in the industry is the yeast Saccharomyces cerevisiae, which is
capable of fermenting hexoses. This organism is added for fermentation,
which converts glucose molecules to ethanol and carbon dioxide, CO2
(Borglum, 1980). The fermentation process continuously generates heat
and thus requires cooling to keep the temperature constant and avoid
killing the yeast. The product leaving the fermentation process is water
containing grain solids and about 10% - 15% ethanol (Kelly, 2007).

12
2.6 Lignocellulose-derived Ethanol Production
The stalks obtained as plant residue from the separation of grains and the
rest of the leguminous crop are classified as lignocellulosic biomass.
Lignocellulose is composed of carbohydrate polymers or polysaccharides
(cellulose, hemicellulose), and an aromatic polymer (lignin). Ethanol
biofuel can also be produced by fermentation of the hexoses and pentoses
(sugars with 5 carbon atoms) that are contained in cellulose and
hemicellulose chains.
The first step in conversion of lignocellulose to ethanol is size
reduction and pretreatment. Since lignocellulosic materials are mostly
insoluble in water, the goal of the pretreatment step performed before
hydrolysis is to remove the recalcitrance of this feedstock and expose the
cellulose fibers to enzymes (Hahn-Hägerdal et al., 2006). Hemicellulose is
normally chemically converted in this step, since its amorphous structure
allows an easier conversion than cellulose. The resulting monosaccharides
from hemicellulose hydrolysis are both hexoses and pentoses. There are
four different types of processes for pretreatment of lignocellulosic
materials: physical, physico-chemical, chemical and biological processes.
The choice of type of pretreatment depends on the type of feedstock used
for bioethanol production (Balat, 2011).
The hydrolysis step involves breaking the glycosidic bonds of
polysaccharides, which are the pretreated feedstock, into fermentable
sugars, i.e. monosaccharides (either hexoses or pentoses depending on the
polysaccharide). This is performed by supplying a water molecule to
render each broken bond inactive, and this reaction needs a catalyser
(Wang, 2008). Depending on the catalyser, the methods for the hydrolysis
of lignocellulosic materials can be classified in two groups: chemical
hydrolysis and enzymatic hydrolysis. Chemical hydrolysis involves the
exposure of biomass to a chemical (predominantly an acid) for a period of
time at a specific temperature. However, one of the major disadvantages of
chemical hydrolysis is that sugars can be converted to degradation
products like tars, besides environmental and corrosion problems due to
acid consumption. In order to prevent these problems, enzymes may be

13
used. The enzymatic hydrolysis has also a low utility cost compared to
chemical hydrolysis because it is conducted at mild conditions, besides
being an environmentally friendly alternative (Balat, 2011).
If focusing on enzymatic hydrolysis, cellulose is hydrolysed by an
enzyme called cellulase, which is actually the name given to a group of
enzymes that synergistically hydrolyses cellulose. These enzymes are
endoglucanases and exoglucanases or cellobiohydrolases (Balat, 2011).
Endoglucanases randomly attack cellulose chains breaking them to
release oligosaccharides (being it easier with chains in the amorphous
regions), and cellobiohydrolases cleave both cellulose chains and
oligosaccharides at their ends releasing soluble sugars such as glucose
(Hahn-Hägerdal et al., 2006). Also, hemicellulose is broken down by the
enzyme xylanase.
The next step is fermentation. In contrast to fermentation for
production of starch-derived ethanol, in the present case fermenting
pentoses efficiently is as important as fermenting hexoses. Depending on
the lignocellulose source, the feed for fermentation process produced in
the hydrolysis step will normally consist of the monosaccharides glucose,
xylose, arabinose, galactose, mannose, fucose, and rhamnose (Balat,
2011). Fermentation of this mixture of sugars achieves higher ethanol
yields by adding specially developed micro-organisms for their
fermentation. The S. Cerevisiae yeast suggested for the production process
of ethanol from starch can only convert the hexoses, and not the pentoses
that are found in the hydrolysis product. Therefore, other micro-
organisms are required. As an example, the micro-organism Zymomonas
mobilis efficiently produces bioethanol from the hexose sugars but, as S.
cerevisiae, not from pentose sugars. However, some researchers have
generated a xylose fermenting Z. mobilis by introducing a xylose-
metabolizing pathway from Escherichia coli (Balat, 2011). Thus, this
organism can be added for fermentation, which will convert both hexoses
and pentoses to ethanol and carbon dioxide.
Actually, conversion of lignocellulose to ethanol by using enzymes may
be performed by following different configurations. Firstly, if enzymatic

14
hydrolysis is performed separately from fermentation step is known, the
technique is called “Separate hydrolysis and fermentation”. On the other
hand, if these two processes are performed in the same vessel, the
configuration is called “Simultaneous saccharification and fermentation”,
where cellulases and xylanases convert the carbohydrate polymers to
fermentable sugars and other micro-organisms convert them to ethanol,
everything in the same vessel. This process has an enhanced rate of
hydrolysis compared to the “Separate hydrolysis and fermentation”
configuration (Balat, 2011).
2.7 Downstream Ethanol Processing Techniques
After fermentation is completed, the resulting solution containing ethanol
is considerably diluted with water and contains several impurities. As a
consequence, downstream purification and concentration of ethanol is
required before it can be sold as biofuel.
As previously stated, a product of fermentation apart from ethanol is
CO2. This compound is sent to a scrubber that recovers the ethanol and
other soluble compounds before emitting the CO2 to the atmosphere (or
collecting it in order to sell it commercially to, for example, the soft drinks
industry). Additional CO2 may be removed by heating the stream and
passing it through a degasser drum to flash off CO2 (Kelly, 2007).
At this point, the ethanol solution must be concentrated. The
distillation process removes the majority of the remaining water on the
solution based on the difference in boiling points of the two major
components, i.e. ethanol and water. The system is most commonly
comprised of two or three columns for high concentration. Reboilers in the
distillation columns are used to heat the ethanol/water mixture to drive
the process. The solids and water, called stillage, are removed from the
bottom of the first column. The vapour leaving the first column is 40 -
50% ethanol and flows to the second column, i.e. the so-called rectifier
column. The rectifier takes the vapour from the first column and the
distillation process continues until it is concentrated to 90%-95% ethanol.

15
Eventually, a third column may be added, the so-called side stripper. This
component takes the water out of the bottom of the rectifier and strips out
any remaining ethanol in order to recover it (Kelly, 2007).
Finally, the ethanol purity may be further enhanced according to
customer requirements. This is done by the process called dehydration.
The dehydration process consists of two molecular sieves units that are
cycled so one unit is regenerating (after it became saturated with water)
while the other is operating. The vapour leaving the last distillation
column passes through a bed of beads where the water is adsorbed on the
beads and the ethanol vapour passes through. The ethanol vapour is then
cooled in a condenser to convert it to liquid for storage (Kelly, 2007).

16
Chapter 3
Approach and Design Basis – Foundation for
Simulation of PoE Technology on Aspen Plus
Due to the variety of possible outputs from the biorefinery depending on
the chosen conversions paths, three Process designs for the PoE
technology are suggested and simulated as part of this thesis. The designs
are chosen on the basis of commercial viability. The description of each
Process design is the following:
Process design 1: This case is the simplest one among the three designs.
The products obtained in the biorefinery are the following: protein
concentrate for feed grades, purified sugar (dextrose) for the food
industry, and briquettes for heating. Thus, in this design, the glucose
obtained from starch processing is purified and sold as dextrose/sugar,
and no bioethanol production is considered.
Process design 2: In this design, bioethanol production is included,
which leads to the exclusion of sugar production for sales to the food
industry. The products obtained in the biorefinery are the following:
protein concentrate for feed grades, bioethanol derived from the starch,
and briquettes for heating.
Process design 3: In this design, ethanol production from lignocellulose
is integrated. Thus, briquettes are not produced and instead
lignocellulosic biomass is used to produce ethanol. The products of this
design are protein concentrate and bioethanol derived from starch,
cellulose and hemicellulose.
3.1 Methodology
The goal of separating the simulations in three different Process designs is
to obtain the information required to perform an analysis on the trade-offs
of producing one commodity or another.
Mass balances are a foundation for process design since they
determine the quantities of raw materials required and the corresponding

17
products created according to the sales purposes. In order to simulate the
processes and obtain the outputs of the potential products for different
plant configurations, mass balances are solved for the three process
designs by using Aspen Plus® modelling software (Aspen Technology Inc.,
USA), supported by Excel® when necessary. Aspen Plus is a commercially
available software tool that performs as a steady-state chemical process
simulator. The user of the model needs to specify the key parameters of
each unit operation and of the inlet streams. Also, thermodynamic
databases are required which describe the key physical and chemical
properties of each chemical component (National Research Council of the
National Academies, 2005). Aspen Plus has been frequently used in
modeling of biorefineries (Kadam et al., 2000; Nguyen & Saddler, 1991;
Sassner et al., 2008; Wingren et al., 2003a; Wingren et al., 2003b;
Wingren et al., 2005; Wooley et al., 1999), and this is the reason why it
was chosen for the present work.
As for the energy balances, data on heating and cooling requirements
within the process are also obtained by Aspen Plus software. The
opportunities for heat integration of the processes are later defined by
using another simulation software, i.e. the so-called HINT software. HINT®
is specialized in heat integration analysis by Pinch technology and was
found as suitable for the purposes of this study (see Chapter 6 for more
details).
In Chapter 3, a detailed foundation for simulation of PoE technology
on Aspen Plus is provided. It must be highlighted, however, that some unit
operations (mainly solid-liquid separators) were modelled with data from
results and estimates found on the literature or on other commercial
technologies. Thus, solids removal and liquid retention in the solid
streams is normally fixed, due to lack of own PoE experimental data. The
following sub-sections procure the details of the decisions, calculations
and assumptions made prior to and during simulation of the three process
designs on Aspen Plus.
18
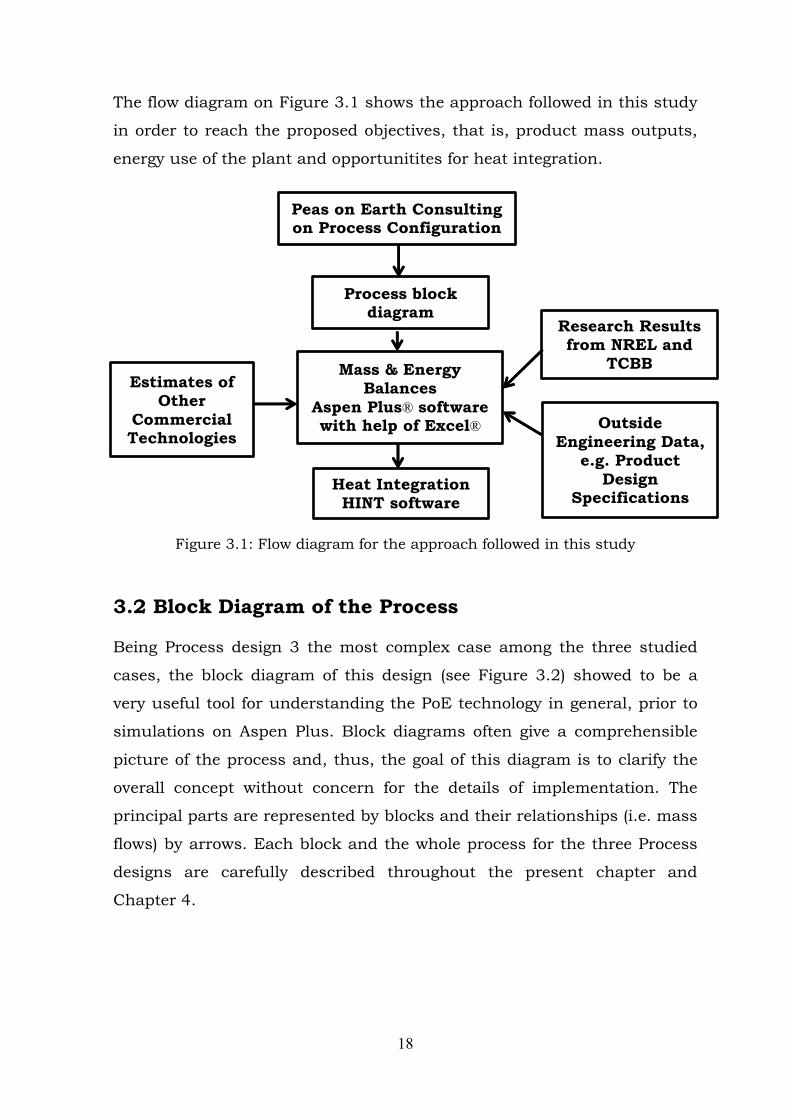
The flow diagram on Figure 3.1 shows the approach followed in this study
in order to reach the proposed objectives, that is, product mass outputs,
energy use of the plant and opportunitites for heat integration.
Figure 3.1: Flow diagram for the approach followed in this study
3.2 Block Diagram of the Process
Being Process design 3 the most complex case among the three studied
cases, the block diagram of this design (see Figure 3.2) showed to be a
very useful tool for understanding the PoE technology in general, prior to
simulations on Aspen Plus. Block diagrams often give a comprehensible
picture of the process and, thus, the goal of this diagram is to clarify the
overall concept without concern for the details of implementation. The
principal parts are represented by blocks and their relationships (i.e. mass
flows) by arrows. Each block and the whole process for the three Process
designs are carefully described throughout the present chapter and
Chapter 4.
Process block diagram
Mass & Energy Balances
Aspen Plus® software with help of Excel®
Peas on Earth Consulting on Process Configuration
Estimates of Other
Commercial Technologies
Research Results from NREL and
TCBB
Outside
Engineering Data, e.g. Product
Design Specifications
Heat Integration HINT software

Stalks
Bean flour
Skimmed protein
Starch-rich slurry
Special micro-organism that ferments both C5,C6 sugars
H2O
Skimmed protein
Cellulose/hemicellulose (+lignin& impurities) Cellulases +
Glucosidases C5 + C6 Sugars
(+ impurities)
ETHANOL
α and gluco-Amylases
Stillage
Maltodextrin
Glucose solution
Ethanol solution
Transfer solution
Semi-solid coagulated protein solution
Bean hulls
Recycled Transfer solution
CO2
α and gluco-Amylases
H2O solution rich in N
Wet protein-rich fraction
Viscous starch
H2O
H2O vapour
Coagulation
Distillation
(distillation/rectifier) Pre-Treatment: Weak-acid
Filtration by pressing
Gelatinisation
Saccharification
Fermentation
Decanter
Extract
Splitter
Liquefaction
Enzymatic hydrolysis
Mixer
Dryer PROTEIN CONCENTRATE
Solids separator

20
3.3 Physical Property Methods
Aspen Plus modelling software requires many parameters and properties
of all components present in the simulations. The aim of the collection of
parameters and properties prior to simulation is to make the overall
designs in the study thermodynamically rigorous and including all the
required physical properties. The physical properties were collected from
Aspen Plus database and from property data developed by the U.S.
National Renewable Energy Laboratory, NREL, specifically for biochemical
processes (Wooley & Putsche, 1996).
A property method is a group of methods and models that a simulation
software uses to compute thermodynamic and transport properties. Since
it is the user who can define the property method, the choice of physical
property method is an initial key decision that will determine the accuracy
of any simulation results. The most important factors that should be
considered when selecting a property method are: the composition of the
mixture, the temperature and pressure range, and the availability of
parameters (i.e. availability in the simulation software or in literature)
(Aspen Plus, 2003). Aspen Plus includes many databanks that contain
properties for components as well as binary parameters for different
property methods.
In the presented model simulations, high temperature or pressure in
the unit operations are not encountered. However, the system becomes
highly complex due to the presence of three different phases of matter:
solid phase, gas phase, and liquid phase. Consequently, a single physical
property method is not sufficient for accurate simulation of this system,
and a selection of different methods is done instead.
Aspen Plus offers a guideline for choosing the appropate property
methods. This guideline is illustrated in the following diagrams and it was
employed for the decision-making process prior to simulations.

21
Figure 3.3: Guidelines for choosing a property method (Aspen Plus, 2003)
3.3.1 Global Property Method: Vapor-Liquid Equilibria
First, the global property method has to be defined. The global property
method is the default method used by Aspen for all property calculations,
unless a different property method is specified for a specific unit operation
block or flowsheet section (Aspen Plus, 2003).
According to the guidelines by Aspen Plus, the same path on the
diagram in Figure 3.3 is followed for the global property method selection
in the three process designs, since all of them involve liquid phase
reactions. First, the processes involve polar and non-electrolyte
compounds at low pressure. Second, the interaction parameters for vapor-
liquid equilibrium of ethanol, water and acetic acid are available on Aspen
Plus. And finally, due to the presence of a distillation column, vapor-liquid
equilibrium is present, but no liquid-liquid equilibria interaction nor
vapor-phase association are expected.
After answering these questions, the guideline diagram leads to a
variety of options for activity coefficient methods, such as non-random two-
liquid activity coefficient model (NRTL), Wilson model, universal quasi-
chemical model (UNIQUAC) and universal functional activity coefficient
model (UNIFAC). These methods are verified methods and have shown to
22
be successful in predicting Vapor-Liquid Equilibrium (VLE) of non-
electrolyte solutions (Wooley et al., 1999). Moreover, these methods are
also suggested by Aspen Plus guide (Aspen Plus, 2003) in case of presence
of azeotropic separations and/or liquid phase reactions, which are the
cases for the studied technology.
According to this, NRTL method is selected as the global property
method due to a variety of reasons. The property method NRTL has a wide
application for low-pressure ideal and non-ideal chemical systems and it
can handle any combination of polar and non-polar compounds, up to
very strong non-ideality. Moreover, the standard NRTL model is most
commonly used in simulation of ethanol production due to the need to
distill ethanol and handle dissolved components (Wooley et al., 1999). On
the other hand, the availability of pure-component and binary parameters
is a crucial factor for calculating pure-component or mixture properties.
Since gathering of experimental data and its regression are not within the
scope of this project, the choice of property method becomes highly
dependent on the availability of the required parameters on Aspen Plus or
on the literature found. Many binary parameters are available for NRTL
model in Aspen databases, becoming this another reason for choosing this
method.
Finally, the selection of NRTL as the global property method on Aspen
Plus includes the NRTL liquid activity coefficient model, Henry’s law for
the dissolved gases, and RKS (Redlich-Kwong-Soave) equation of state for
the vapor phase.
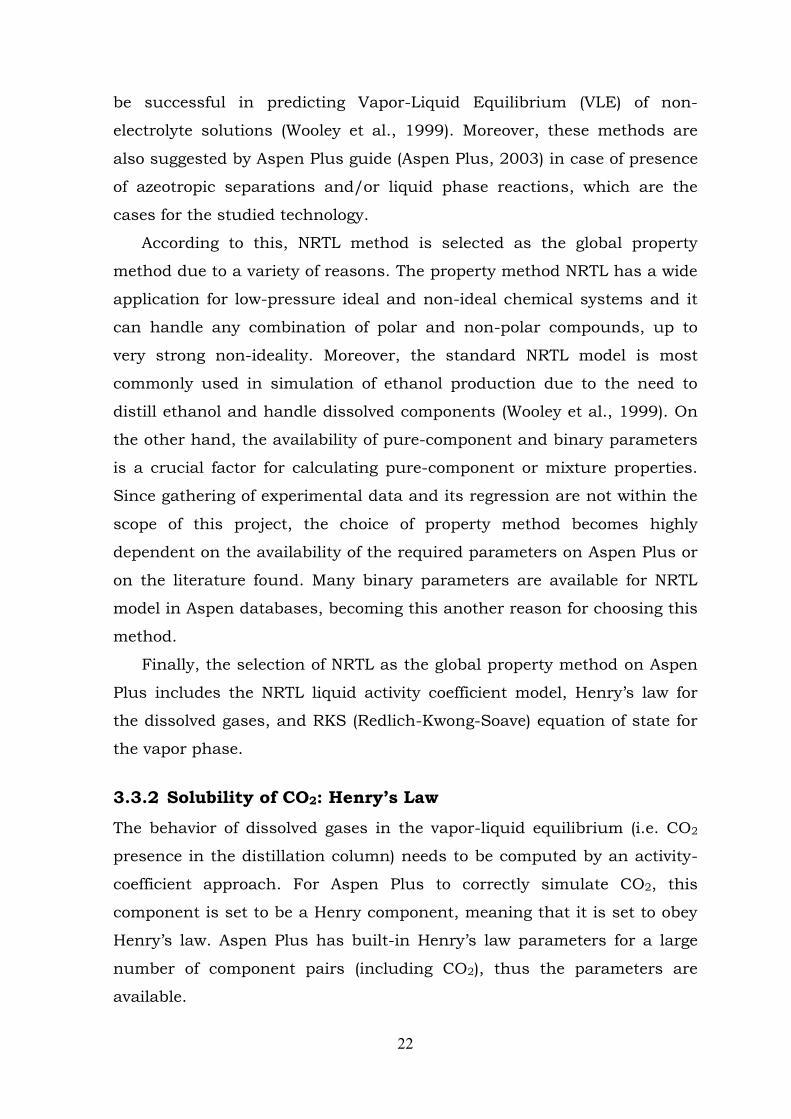
3.3.2 Solubility of CO2: Henry’s Law
The behavior of dissolved gases in the vapor-liquid equilibrium (i.e. CO2
presence in the distillation column) needs to be computed by an activity-
coefficient approach. For Aspen Plus to correctly simulate CO2, this
component is set to be a Henry component, meaning that it is set to obey
Henry’s law. Aspen Plus has built-in Henry’s law parameters for a large
number of component pairs (including CO2), thus the parameters are
available.

23
3.3.3 Solids Definition
Aspen Plus can model solids anywhere in a process flowsheet. A wide
range of unit operation models for solids handling equipment is available,
e.g. for crushing or grinding. NRTL method is used to calculate properties
for components in the liquid and vapor phases, thus another property
method needs to be specified for the flowsheet section where solids are
processed. In this case the chosen property method is called SOLIDS,
which is a property method developed by Aspen Plus for general solids
applications (Aspen Plus, 2003).
As a summary, two different physical property methods in Aspen Plus
are selected in order to simulate the thermodynamic properties of the
components as accurately as possible: standard NRTL method to calculate
properties for components in the liquid and vapor phases, and SOLID
method to do the respective with solid phases.
3.4 Thermodynamic Parameters and Properties
Thermodynamic parameters and component properties for most of the
compounds in the system are obtained from Aspen Plus. However, the
property data of the components that are not in the Aspen databank are
obtained from the database developed by NREL (Wooley & Putsche, 1996)
mentioned in sub-section 3.3, which is specificalized in biochemical
processes.
For compounds involved in vapor-liquid equilibrium, the software
needs a complete set of properties to allow it to do flash calculations. This
applies even to the compounds that have very high boiling points and will
stay in the liquid phase exclusively. NRTL uses the Ideal Gas (IG) at 25°C
as the standard reference state, thus it requires the heat of formation at
these conditions (Aspen Plus, 2003). Table 3.1 presents the minimum
required properties that must be provided to the software in case NRTL
method is applied.

24
Table 3.1: Required properties for NRTL method (Aspen Plus, 2003)
Liquids and Gases Conventional Solids
Critical Temperature IG Heat Capacity Heat of Formation
Critical Pressure Heat of Vaporization Heat Capacity
IG Heat of Formation Liquid Density Density
Vapor Pressure
On the one hand, materials such as glucose and proteins, which are
commonly solids but will be used in aqueous solution in a large part of the
process, will be treated as liquids in those units. On the other hand, the
compounds that are always solids and are identifiable, e.g. starch, ash,
cellulose or lignin, are assumed to comprise conventional solids on the
simulation software. The advantage of conventional solids on Aspen Plus
is that property requirements are very minimal, because they do not need
to be described by attributes but by a chemical formula instead (Aspen
Plus, 2003). For the polymeric compounds, e.g. cellulose or starch, a
chemical formula corresponding to a single repeat unit is used.
The databanks VLE and HENRY on the software were developed by
AspenTech using binary vapour-liquid equilibrium data from the
Dortmund databank (DDBST Dortmund Data Bank Software & Separation
Technology GmbH). In addition to the parameter values, the databanks in
Aspen contain temperature, pressure, and composition limits of the data
as well as average and maximum deviations (der Merwe & Blignault,
2010). Therefore, for these databank parameters, it is assumed that Aspen
can simulate the binary vapour-liquid systems involved in this study and
data regression analyses are not done.
Appendix A includes tables with the specification of all the components
used from NREL databank, as well as the respective assumptions,
properties and parameteres used.
3.5 Plant Location, Size and Operation Parameters
For this project, plant location in terms of geographical area is not
specified, although the first plant of PoE project is intended to be built in
Sweden. When choosing the plant location, proximity to a sufficient

25
supply of fuel for thermal energy must be considered. The flexibility to
utilize more than one source of energy may also be advantageous.
Furthermore, the facility also requires adequate electricity and water
supply. As for cooling water, it is assumed that the well water is available
at the same temperature year round.
The calculation is based on the assumption that the facility will
operate at its maximum capacity 24 hours a day, year-round, with time
set aside for maintenance and repairs. The uptime is approximately 96%,
i.e. 8400h annual operating time. This allows for roughly two weeks of
downtime every year, as imposed by PoE. PoE has set the annual input of
silaged biomass to the plant to 3500 DM (dry matter) tonnes.
Table 3.2: Facility operation parameters
Facility Type Chemical Processing
Operating Mode Continuous Process
Operating Hours per Year 8400
Annual whole-crop input 3500 DM tonnes
Process Fluids Liquids, Gases, and Solids
3.6 Product Design Specification
A product design specification (PDS) is “a statement of what a not-yet-
designed product is intended to do” (The Open University, 2001). By
applying PSD, it is ensured that the subsequent design and development
of a product will meet the needs of the purchaser. In other words, the PDS
is a specification of what is required but not the specification of the
product itself. It acts as an initial boundary in the development of
products (The Open University, 2001). In terms of product purity for this
study, the following objectives were defined as minimum requirements,
which the simulations aimed to fulfil:
Protein concentrate: An example of a study performed on the
production of bean protein concentrate was used as a guide for our
concentrate purity. The study (Kohnhorst et al., 1991) shows most of
the concentrates from beans with 80-83 wt% protein. Therefore, the
composition of the concentrate obtained by the simulations is intended
26
to approach the values of the concentrate specification shown on this
article.
Dextrose: Typical values for dextrose monohydrate purity sold as a
starch-derived sweetener is 99% dextrose on dry basis. Furthermore, a
maximum of 9.5% moisture content and 0.03% ash content are
desired (Hobbs, 2009). These values are assumed as target for the
simulation.
Ethanol: Because of the azeotropic properties of an ethanol-water
solution, the distillation process can practically produce an ethanol-
water solution that is purified to the maximum of approximately 95%
ethanol and 5% water (Vander Griend, 2007). A target purification of
90% is set for the simulations in this study, assuming that a
dehydration process will later be added to increase purity to >99% to
reach fuel ethanol requirements for blending with gasoline
(Taherzadeh & Karimi, 2008).
Briquettes: Moisture content in the briquettes ready to be sold should
be about 12 wt% (Grover & Mishra, 1996). Since stalks and hulls are
already assumed to have a 10% moisture content obtained by natural
drying (lab analyses performed sometime after ensiling showed this
moisture content), further drying is not simulated. As for the material
size, due to the lack of information on the feedstock particle size
distribution, simulations of the solids shredding and grinding are not
performed. The focus on the simulations is rather given to the heating
requirement of the briquetting or densification step.
3.7 Feedstock Composition and Mass Flow Rates
In general terms, the composition and moisture of legumes is subject to a
number of factors (e.g. bean variety, region, weather, soil type, fertilization
practices, harvesting and storage practices, time in storage, among others)
and can therefore vary to a great extent (Crépon et al., 2010).
In this study, calculations and simulations were performed for a
specific feedstock according to the data provided by PoE project. PoE

27
provided this study with the compositional analyses of a sample of
ensilaged biomass from a harvest of the legume specie Faba bean, also
called broad bean. Moreover, lab analyses of the three fractions after
processing the aforementioned ensilaged crop through the wet thresher
were also provided.
Table 3.3: Dry matter Composition of each fraction out of wet thresher
Composition on
Dry basis (g/kg) Bean fraction Stalk fraction Extract fraction
Protein 257 126 734
Starch 450 - -
Sugars - 7 5
Fibre
Cellulose
Hemicellulose
206
-
-
-
171
334
-
-
-
Lignin 0 6 -
Ash 33 108 261
Oil 9 - -
Solunkn* 45 247 -
*Solunkn: Unknown soluble solids
Where the mass balance did not sum to 100%, the “unknown soluble
solids” component was used to close it by difference. This measure was
observed to be applied by Wooley et al. (1999) on their simulations for
ethanol production processes, thus it was accepted as valid for the
present case.
It must be considered that some assumptions and calculations were
required prior to simulations in order to adapt the limited available
experimental data and properties to the broader data requirements of the
simulation software. First, in order to obtain the moisture content of each
fraction, some assumptions were made. The reason for this is that
compositional analyses performed on the three fractions were performed
some time after the fractions separation, which meant that all fractions –
even if mainly the stalks and the extract fractions – had dried.
Consequently, the water content directly after the wet thresher separation
was not known when this study was performed.
PoE set the annual input of silaged biomass to the plant as 3500 DM
tonnes. Based on that, Appendix B includes all the assumptions and mass

28
balances that were required to start with the simulations. The obtained
mass flow rates and moisture content of the three fractions out of the wet
thresher are summarized in Table 3.4.
Table 3.4: Mass flow rates and moisture content of each fraction
Bean Fraction Stalk Fraction Extract fraction
Mass flow rate (kg/h) 274.91 280.42 391.64
Moisture content (%) 18.19 40.00 94.00
3.8 Bean Fraction Pretreatment: Dehulling and Starch-
Protein Separation
The main aim of this study is to represent the unit operations described
by PoE project by simulations on Aspen Plus in order to predict its
outputs and their respective composition. Bean fraction pretreatment, for
example, showed to be a significantly complicated process step in terms of
representation on the simulation software. This sub-section, thus,
describes the approach and design basis applied to simulate bean
pretreatment on Aspen Plus. Furthermore, the following sub-sections in
Chapter 3 describe the approach followed in each unit operation of the
technology in order to build a simulation model as true as possible to PoE
description.
3.8.1 Bean Fraction Pretreatment described by PoE
In order to separate the starch and protein fractions in the bean grains,
the beans need to be first dehulled. According to PoE, the hulls of the
beans have mostly been open during ensilage but not separated from the
bean. In order to completely separate the seeds from the hulls, the beans
pass in between polyurethane (PU) rollers, which make the two parts fall
apart. Since hulls are lighter than bean seeds, they are then separated in
a liquid bath. Hulls are lighter and float, while seeds are heavier and
sediment to the bottom of the liquid. Next, beans are ground with an ultra
mixer. The obtained bean flour contains two distinct groups of particles
based on both their size and density. First, the light fraction of the bean
29
flour is rich in protein and, second, the heavy fraction is rich in starch.
Because of the difference in their size and density, starch-protein
separation is done by means of sedimentation in a decanter. First, the
bean flour is mixed with a so-called transfer solution in a collector. The
transfer solution is one of the process streams, more specifically, the
stream outlet from the saccharification vessel. The transfer solution
consists of water mixed with glucose and small quantities of other
compounds, causing a specific gravity (density) of approximately 1.15
g/cm3. The separation of starch and protein consists of the solubilization
of protein and the sedimentation of starch granules contained in the bean
flour. The starch-rich fraction settles due to its average density (1.5
g/cm3) being greater than that of the protein particles (1.1 g/cm3) (Biss
and Cogan 1988; Gausman et al. 1952; Steinke & Johnson 1991) and
than that of the transfer solution. On the contrary, most of the protein
remains soluble and appears floating on the surface of the transfer
solution due to its lower density, while a smaller part of the protein settles
with the starch fraction. After the sedimentation step, most of the protein
content is skimmed by mechanical means from the surface of the transfer
solution and sent to the protein coagulation tank. The used transfer
solution is then recycled to the fermentation vessel. As a result, two new
streams are produced: the protein-rich solution (the light fraction) and the
starchy slurry (the heavy fraction).
3.8.2 Limitations on Available Data
As this study is an initial assessment of the PoE technology, there are
limitations on the available data. On one hand, due to lack of
experimental data on chemical composition distribution during beans
dehulling for the present feedstock, and due to the absence of an
appropriate unit on Aspen Plus software suitable to model this separation,
assumptions were required. Experimental values found on the literature
were used in order to assume the separation outcome, and the results of
these assumptions were directly inserted on Aspen Plus. On the other
hand, no experimental results at the time of this study on the separation

30
efficiency of the sedimentation process were provided either. This process
step was partly modelled by a decanter unit on Aspen Plus and partly
user-specified. Finally, as the particle size distribution of the bean grains
was unknown, beans were assumed as already milled to bean flour fot the
input to Aspen Plus. This section gives details of all the assumptions.
3.8.3 Dehulling
As already mentioned, the mass flows and compositions of the streams
obtained after beans dehulling were calculated supported by results of
studies found during the literature review. Like that, the seeds stream and
the hulls stream were directly inserted in the software as a feedstock to
the plant. First, the dry matter on the beans fraction out of the wet
thresher was divided into two sub-fractions, i.e. seeds fraction and hulls
fraction. In order to do so, the typical dry matter distribution found by
Jensen et al. (2010) for legumes dehulling was assumed as applicable.
Table 3.5: Dry Mass distribution on dehulling process (Jensen et al., 2010)
Seeds fraction (% of DM in bean fraction) 80.35 %
Hulls fraction (% of DM in bean fraction) 19.65 %
Secondly, the composition of each stream was also calculated with the
help of results of previous compositional analyses on legume seeds found
on the literature (Youssef et al., 1987; Mateos-Aparicio et al., 2010)
performed before and after dehulling. These studies provided how much
percent of each compound follows seeds and how much follows hulls
when dehulling beans. When the % following each fraction was not given,
some assumptions were applied by aiming to approach the final
composition of seeds and hulls shown on the aforementioned studies.
Table 3.6 presents the compositions and mass flows of the input streams
on Aspen.

31
Table 3.6: Composition of each fraction after dehulling. Input to Aspen Plus
Seeds composition (%) Hulls composition (%)
Protein 25.33 3.42
Starch 43.76 8.43
Fibre 4.19 68.57
Solunkn 4.38 0.84
Oil 0.92 0.00
Ash 3.23 0.55
Water 18.19 18.19
MASS FLOW (kg/h) 220.86 54.05
3.8.4 Starch-Protein Separation
The best way to simulate sedimentation on Aspen Plus is assumed to be
by using the so-called decanter block included on the software. The
separation sharpness - slope of the separation curve - is specified and the
model calculates a separation curve based on the settling velocity of the
particles and the user input. Consequently, the governing classification
characteristic is the settling velocity of the particles. However, the
limitations on the available data meant that some assumptions were
required in order to obtain more realistic results on the composition of the
resulting streams out of the decanter unit.
The first limitation is that, since the fibre, starch and ash components
of the bean flour are specified as “solids” in the software, these
components are automatically sent to the heavy fraction out of the
decanter, i.e. to the starch-rich fraction. However, according to the
literature (Tyler et al., 1981), the lighter protein fraction floating on the
surface of the transfer solution out of the decanter must have a relatively
high content in soluble fibre and ash.
On the other hand, the second limitation is related to the mechanical
skimming process used to separate the floating protein-rich fraction from
the transfer solution after the decanter centrifuge. The decanter block
provides stream results for one heavy fraction (which should represent the
starch-rich) and one light fraction (the rest). However, the model library of
Aspen Plus does not contain any specific model that can represent
mechanical skimming processes, thus the separation of the protein-rich
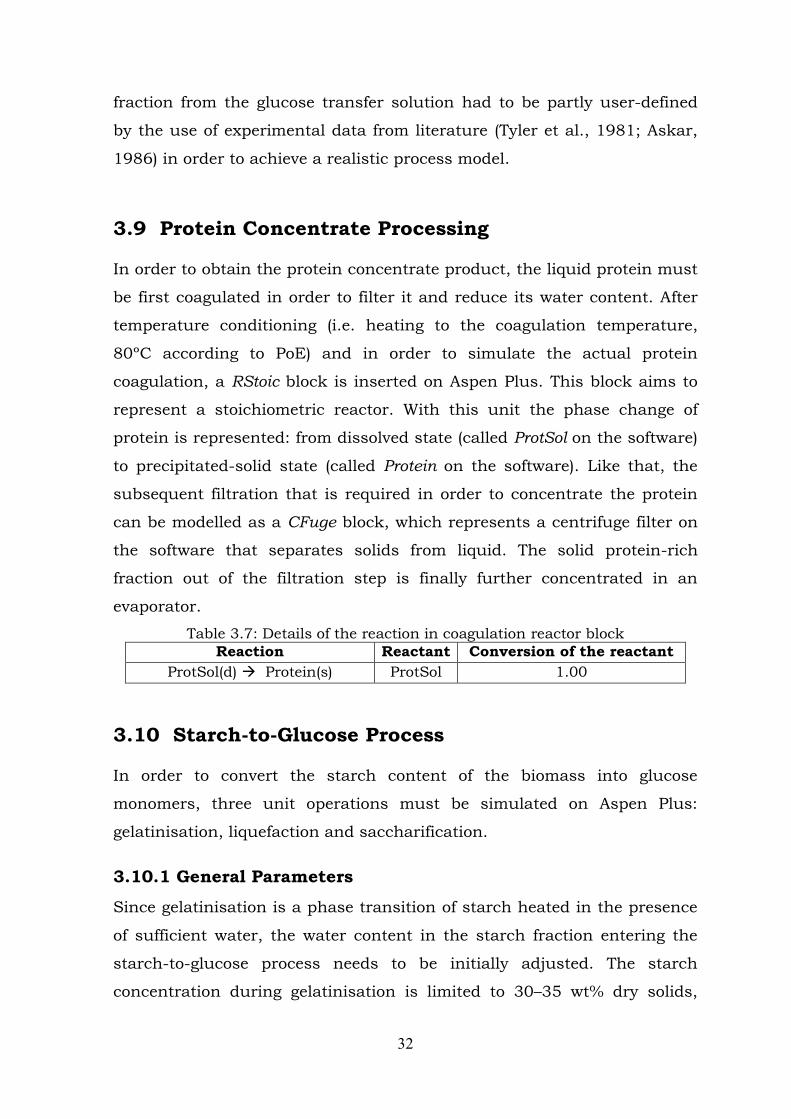
32
fraction from the glucose transfer solution had to be partly user-defined
by the use of experimental data from literature (Tyler et al., 1981; Askar,
1986) in order to achieve a realistic process model.
3.9 Protein Concentrate Processing
In order to obtain the protein concentrate product, the liquid protein must
be first coagulated in order to filter it and reduce its water content. After
temperature conditioning (i.e. heating to the coagulation temperature,
80ºC according to PoE) and in order to simulate the actual protein
coagulation, a RStoic block is inserted on Aspen Plus. This block aims to
represent a stoichiometric reactor. With this unit the phase change of
protein is represented: from dissolved state (called ProtSol on the software)
to precipitated-solid state (called Protein on the software). Like that, the
subsequent filtration that is required in order to concentrate the protein
can be modelled as a CFuge block, which represents a centrifuge filter on
the software that separates solids from liquid. The solid protein-rich
fraction out of the filtration step is finally further concentrated in an
evaporator.
Table 3.7: Details of the reaction in coagulation reactor block
Reaction Reactant Conversion of the reactant
ProtSol(d) Protein(s) ProtSol 1.00
3.10 Starch-to-Glucose Process
In order to convert the starch content of the biomass into glucose
monomers, three unit operations must be simulated on Aspen Plus:
gelatinisation, liquefaction and saccharification.
3.10.1 General Parameters
Since gelatinisation is a phase transition of starch heated in the presence
of sufficient water, the water content in the starch fraction entering the
starch-to-glucose process needs to be initially adjusted. The starch
concentration during gelatinisation is limited to 30–35 wt% dry solids,

33
because higher concentrations cannot be processed in the screw/heat
exchanger (Baks, 2007). More precisely, according to Lee et al. (2005)
gelatinisation requires a moisture exceeding 66.7%, thus addition of water
to the starch fraction stream is included in the simulations in order to
adjust the water content to approximately 67%. Gelatinisation is thus
simulated in a heat exchanger where the dilute starch fraction is heated
until reaching the temperature of 83ºC (suggested by PoE), temperature at
which gelatinisation of starch chains occurs.
As for liquefaction, this process step should be represented by a
reactor with the addition of alpha- and glucoamylases, which break the
long starch chains into shorter ones. However, there is lack of data on the
reactions occurring during starch liquefaction and the length of the partly-
hydrolysed chains, i.e. the products of these reactions. As a consequence,
simulation of liquefaction on Aspen Plus involves no rections. Instead, the
subsequent saccharification reactor in the model (at 60ºC and 1 atm) is
used to represent the conversion rate of the overall reaction occurring
between liquefaction and saccharification steps, i.e. the overall conversion
of long starch chains to directly glucose monomers. The conversion rate of
this reaction is the result of the action of enzymes, and it was obtained
from the literature (Borglum, 1980).
Even if both liquefaction and saccharification steps require the
addition of enzymes (alpha- and glucoamylases), but this aspect is not
considered in the Aspen model due to lack of data on enzyme structure
and its properties. Enzyme purchase is however considered in the
economic assessment. The decision of obviating enzyme on Aspen model
but including it in the economic assessment is assumed as reasonable, as
ethanol plants generally purchase enzymes from outside suppliers, and
enzyme recycling is currently not practiced (Dunn et al., 2012).
3.10.2 Stoichiometry
The reactions in the liquefaction and saccharification reactors could not
be modelled with kinetic expressions. The reason for it is the low level of
development of regression of experimental data within the field of
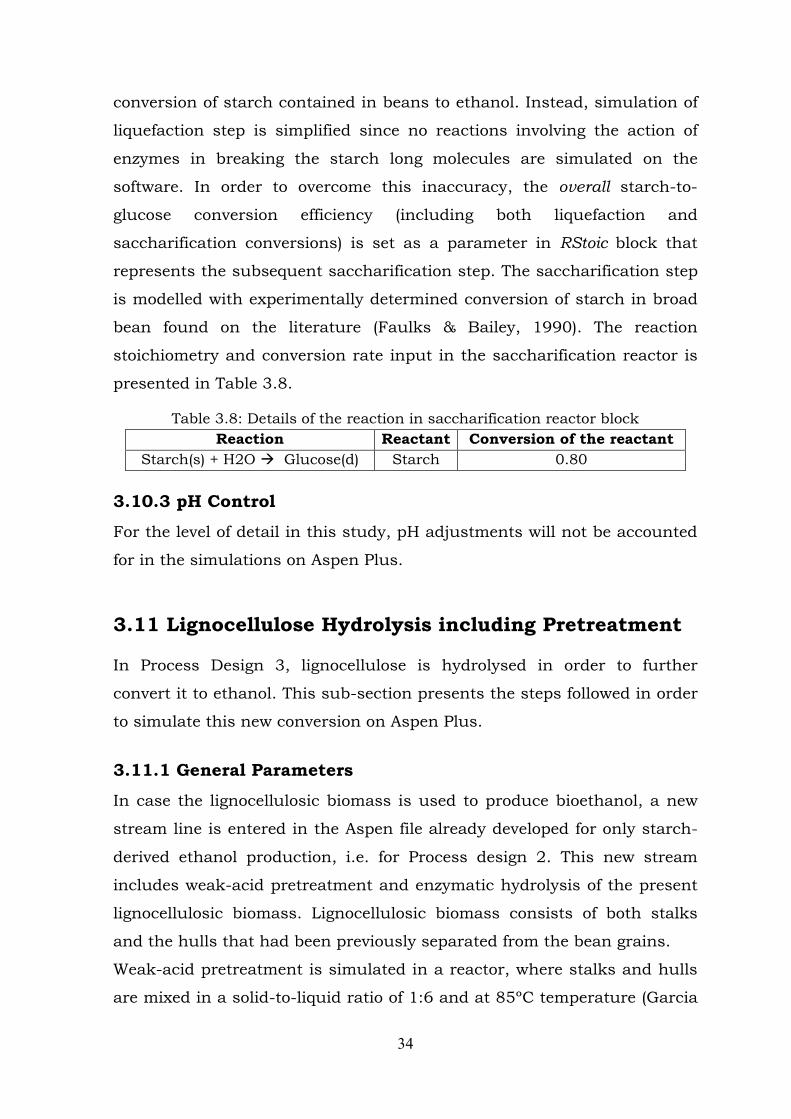
34
conversion of starch contained in beans to ethanol. Instead, simulation of
liquefaction step is simplified since no reactions involving the action of
enzymes in breaking the starch long molecules are simulated on the
software. In order to overcome this inaccuracy, the overall starch-to-
glucose conversion efficiency (including both liquefaction and
saccharification conversions) is set as a parameter in RStoic block that
represents the subsequent saccharification step. The saccharification step
is modelled with experimentally determined conversion of starch in broad
bean found on the literature (Faulks & Bailey, 1990). The reaction
stoichiometry and conversion rate input in the saccharification reactor is
presented in Table 3.8.
Table 3.8: Details of the reaction in saccharification reactor block
Reaction Reactant Conversion of the reactant
Starch(s) + H2O Glucose(d) Starch 0.80
3.10.3 pH Control
For the level of detail in this study, pH adjustments will not be accounted
for in the simulations on Aspen Plus.
3.11 Lignocellulose Hydrolysis including Pretreatment
In Process Design 3, lignocellulose is hydrolysed in order to further
convert it to ethanol. This sub-section presents the steps followed in order
to simulate this new conversion on Aspen Plus.
3.11.1 General Parameters
In case the lignocellulosic biomass is used to produce bioethanol, a new
stream line is entered in the Aspen file already developed for only starch-
derived ethanol production, i.e. for Process design 2. This new stream
includes weak-acid pretreatment and enzymatic hydrolysis of the present
lignocellulosic biomass. Lignocellulosic biomass consists of both stalks
and the hulls that had been previously separated from the bean grains.
Weak-acid pretreatment is simulated in a reactor, where stalks and hulls
are mixed in a solid-to-liquid ratio of 1:6 and at 85ºC temperature (Garcia
35
et al., 2013). Pretreatment is used to sterilize the lignocellulose and almost
totally dissolve the contained hemicelluloses. Furthermore, at these
conditions some of the lignin is also solubilized and cellulose is “exposed”
for subsequent enzymatic hydrolysis (Aden et al., 2002). According to
TCBB, the partner in the PoE project in charge of running tests for
lignocellulose hydrolysis, pretreatment is carried out with 1 wt% of nitric
acid solution. However, the addition of this chemical compound is not
included on simulations on Aspen Plus. Instead, the reaction conversion
rate is directly inserted in the reactor block.
Next, the resulting slurry out of the pretreatment reactor, which
contains the dissolved and solid lignocellulosic components, is sent to
enzymatic hydrolysis after temperature conditioning in a heat exchanger.
The goal for this unit is to dissolve most of the contained cellulose into
glucose with the help of enzymes, since hemicellulose chains are already
hydrolyzed in the pretreatment step (Garcia et al., 2013). As defined by
TCBB during their experimental tests, enzymatic hydrolysis is simulated
in a reactor at 55ºC and 1 atm. The solids content is also adjusted before
hydrolysis, since total solid content of the flow must be 20 ± 0.1 wt%
(Aden et al., 2002). As for the case of starch-to-glucose conversion, due to
lack of data on enzyme structure and properties, the simulation of
hydrolysis steps will involve no enzymatic load. Instead, directly the
conversion rates of the reactions – which are the result of enzymes action
– are introduced in the software.
The research by TCBB to date has included weak-acid pretreatment,
using a sample of bean stalks and a self-developed enzyme cocktail. This
has been performed at lab scale to test enzyme activity, since the
optimized enzymes are not yet available. The produced enzyme cocktail
showed to hydrolyze both hydrocarbons present in the sample, i.e.
cellulose and hemicellulose, with a conversion rate of 41.5%.
Consequently, these preliminary results obtained by TCBB in the first run
of experiments on stalks hydrolysis are used in this study. Nevertheless, it
must be remarked that, according to the previsions by TCBB, the
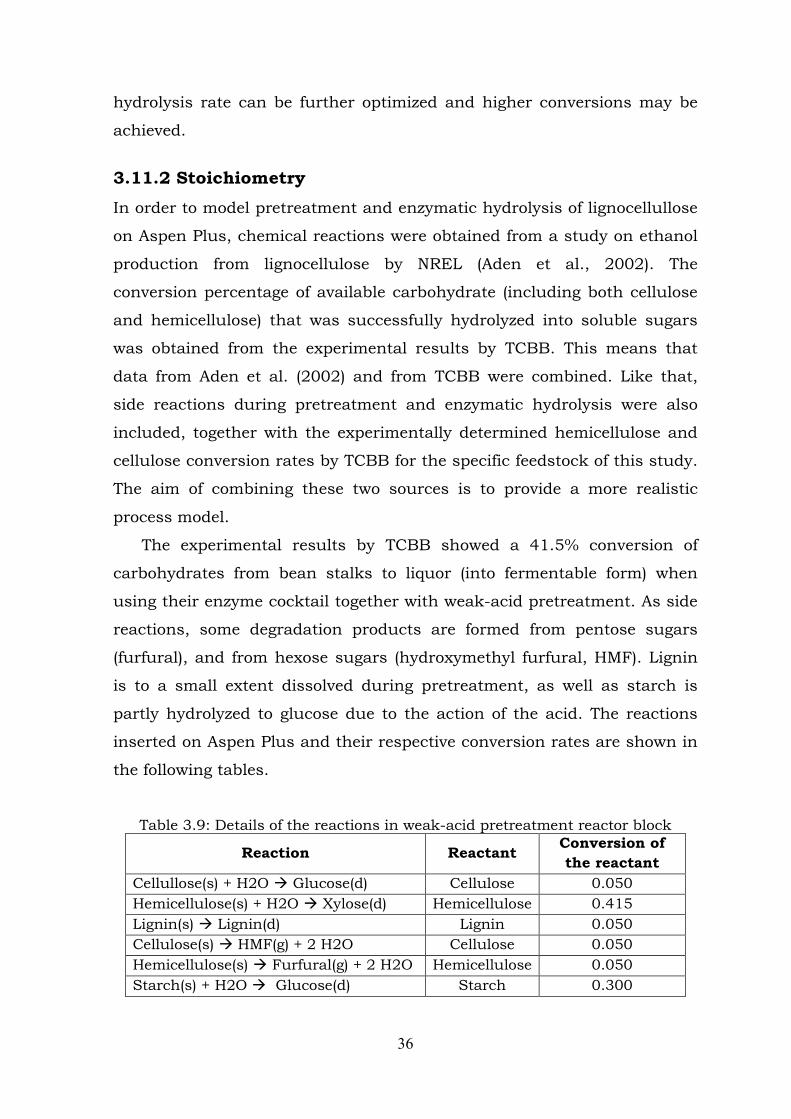
36
hydrolysis rate can be further optimized and higher conversions may be
achieved.
3.11.2 Stoichiometry
In order to model pretreatment and enzymatic hydrolysis of lignocellullose
on Aspen Plus, chemical reactions were obtained from a study on ethanol
production from lignocellulose by NREL (Aden et al., 2002). The
conversion percentage of available carbohydrate (including both cellulose
and hemicellulose) that was successfully hydrolyzed into soluble sugars
was obtained from the experimental results by TCBB. This means that
data from Aden et al. (2002) and from TCBB were combined. Like that,
side reactions during pretreatment and enzymatic hydrolysis were also
included, together with the experimentally determined hemicellulose and
cellulose conversion rates by TCBB for the specific feedstock of this study.
The aim of combining these two sources is to provide a more realistic
process model.
The experimental results by TCBB showed a 41.5% conversion of
carbohydrates from bean stalks to liquor (into fermentable form) when
using their enzyme cocktail together with weak-acid pretreatment. As side
reactions, some degradation products are formed from pentose sugars
(furfural), and from hexose sugars (hydroxymethyl furfural, HMF). Lignin
is to a small extent dissolved during pretreatment, as well as starch is
partly hydrolyzed to glucose due to the action of the acid. The reactions
inserted on Aspen Plus and their respective conversion rates are shown in
the following tables.
Table 3.9: Details of the reactions in weak-acid pretreatment reactor block
Reaction Reactant Conversion of
the reactant
Cellullose(s) + H2O Glucose(d) Cellulose 0.050
Hemicellulose(s) + H2O Xylose(d) Hemicellulose 0.415
Lignin(s) Lignin(d) Lignin 0.050
Cellulose(s) HMF(g) + 2 H2O Cellulose 0.050
Hemicellulose(s) Furfural(g) + 2 H2O Hemicellulose 0.050
Starch(s) + H2O Glucose(d) Starch 0.300
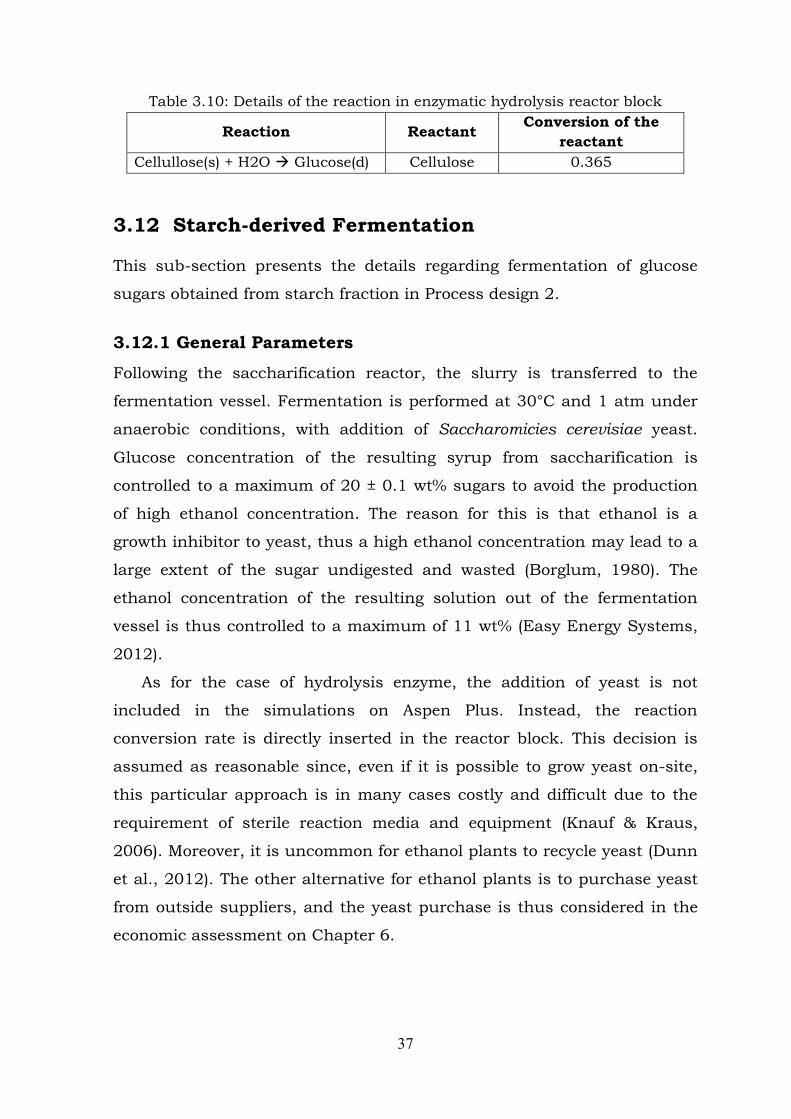
37
Table 3.10: Details of the reaction in enzymatic hydrolysis reactor block
Reaction Reactant Conversion of the
reactant
Cellullose(s) + H2O Glucose(d) Cellulose 0.365
3.12 Starch-derived Fermentation
This sub-section presents the details regarding fermentation of glucose
sugars obtained from starch fraction in Process design 2.
3.12.1 General Parameters
Following the saccharification reactor, the slurry is transferred to the
fermentation vessel. Fermentation is performed at 30°C and 1 atm under
anaerobic conditions, with addition of Saccharomicies cerevisiae yeast.
Glucose concentration of the resulting syrup from saccharification is
controlled to a maximum of 20 ± 0.1 wt% sugars to avoid the production
of high ethanol concentration. The reason for this is that ethanol is a
growth inhibitor to yeast, thus a high ethanol concentration may lead to a
large extent of the sugar undigested and wasted (Borglum, 1980). The
ethanol concentration of the resulting solution out of the fermentation
vessel is thus controlled to a maximum of 11 wt% (Easy Energy Systems,
2012).
As for the case of hydrolysis enzyme, the addition of yeast is not
included in the simulations on Aspen Plus. Instead, the reaction
conversion rate is directly inserted in the reactor block. This decision is
assumed as reasonable since, even if it is possible to grow yeast on-site,
this particular approach is in many cases costly and difficult due to the
requirement of sterile reaction media and equipment (Knauf & Kraus,
2006). Moreover, it is uncommon for ethanol plants to recycle yeast (Dunn
et al., 2012). The other alternative for ethanol plants is to purchase yeast
from outside suppliers, and the yeast purchase is thus considered in the
economic assessment on Chapter 6.

38
3.12.2 Stoichiometry
The fermentor vessel is simulated as an RStoic block and is modelled with
experimentally determined conversions of specific reactions found on the
literature. This type of modelling still satisfies the mass and energy
balances. According to the results in some studies, it is expected that the
remaining starch or the partly-hydrolyzed starch chains from
saccharification continue being hydrolysed in the fermentation vessel due
to the presence of remaining glucoamylase and alpha-amylase (Borglum,
1980). However, this “Simultaneous Saccharification and Fermentation”
aspect is not modeled in this study. Starch-to-glucose conversion is rather
simulated to take place fully in the saccharification reactor block, since
this is how the conversion data for the whole starch-to-ethanol process
was found in the literature (Borglum, 1980).
On the other hand, not 100% of the glucose is converted to ethanol
and carbon dioxide during fermentation. In the typical fermentation
conditions, there is ethanol loss due to carbohydrate used for yeast growth
and for formation of small amounts of non-ethanol products, i.e.
formation of acetaldehyde, methanol, butanol, acetic acid and glycerol
(Franceschin, 2010). Consequently, the ethanol loss means that the yield
is actually lower than the yield of stoichiometric formation of ethanol from
glucose. According to the literature, glucose-to-ethanol fermentation will
typically yield an 85% fermentation efficiency overall (Borglum, 1980) and,
therefore, this conversion factor is used in the simulations. The side
reactions are not included on the simulations due to lack of data (both
experimental data and/or from the literature).
Table 3.11: Details of the reaction in starch-derived fermentation reactor
Reaction Reactant Conversion of the
reactant
Glucose(d) 2 Ethanol(d) + 2 CO2(g) Glucose 0.85

39
3.12.3 Micro-organism Growth
For the level of detail in this study, reactions for micro-organism growth
and the related addition of nutrient sources will not be accounted for in
the simulations on Aspen Plus.
3.13 Lignocellulose-and-Starch-derived Fermentation
In Process design 3, simultaneous fermentation of pentose and hexose
sugars occurs in the fermentation vessel. The approach required to
simulate this unit operation on Aspen Plus is described in this sub-
section.
3.13.1 General Parameters
Following the enzymatic hydrolysis reactor where stalks and hulls have
been processed, the resulting stream rich in pentoses and hexoses is
transferred to the fermentation vessel. However, due to the presence of
insoluble solids in the hydrolysate (which would hinder the fermentation
rate) a cyclone block is required before fermentation.
The fermentation reactor block on Aspen Plus is the same one where
the glucose-rich streams from starch saccharification are sent to.
Therefore, fermentation of pentoses and hexoses coming from both starch
and lignocellulosic feedstock is carried out in the same vessel.
It must be highlighted that own experimental data on co-fermentation
of pentoses and hexoses of the feedstock for PoE project was not avilable
at the time of this study. Consequently, data from literature was used
instead. Fermentation is thus assumed to be performed at 41°C and 1atm,
with addition of recombinant Zymomonas mobilis bacterium used as
biocatalyst (Zhang et al., 1995). The total solids content in the reactor
inlet is controlled to a maximum of 20 ± 0.1 wt%. In the study by Zhang et
al., the organism Z. mobilis ferments both glucose and xylose to ethanol.
On the other hand, even if it is known that some hydrolysis will occur
during fermentation due to the action of remaining enzymes
(glucoamylases and cellulases) in the solution, cellulose hydrolysis is

40
modelled to take place entirely in the enzymatic hydrolysis vessel. This is
due to the lack of a better understanding on the extent of hydrolysis
occuring at fermentation conditions.
3.13.2 Stoichiometry
As experimental runs to get the yield of co-fermentation of pentoses and
hexoses were not obtained at the time of this study, fermentation is
modelled with conversion rates found on the literature (Aden et al., 2002;
Zhang et al., 1995) in a RStoic block on Aspen Plus.
Table 3.12: Details of the reactions in co-fermentation reactor block
Reaction Reactant Conversion of the reactant
Glucose(d) 2 Ethanol(d) + 2 CO2(g) Glucose 0.950
3 Xylose(d) 5 Ethanol(d) + 5 CO2(g) Xylose 0.850
Glucose(d) 3 Acetic acid(d) Glucose 0.015
Xylose(d) + H2O Xylitol(d) + 0.5 O2(g) Xylose 0.046
2 Xylose(d) 5 Acetic acid(d) Xylose 0.014
These conversion rates are based on the assumption that a total of 3% of
the sugars available for fermentation are lost to contamination (Aden et
al., 2002). This is modelled as a streams splitter, allowing the model to
assign a percent loss to contamination. Like that, conversions in the
fermentor model do not have to be adjusted.
3.14 Distillation
The fermentation product is processed in a two-step distillation process.
The first distillation column facilitates the separation of the ethanol-water
mixture from the slurry (i.e. the unconverted insoluble and dissolved
solids). This is intended to lead to a distillate with an ethanol content of
approximately 75 wt%. This step is followed by a rectification column that
further concentrates the ethanol.
First of all, trays are employed as the sort of contacting device for the
distillation columns since they are the most common contactor in use for
this type of separation unit system (Katzen et al., 1997). Nutter V-grid
41
trays are used for this purpose as these trays tolerate the solids well and
have a relatively good efficiency (Aden et al., 2002).
The specifications of distillation columns were first estimated by using
the DSTWU shortcut method included in Aspen Plus. This method
employs the Winn-Underwood-Gilliland method, which provides an
estimate of the minimum number of theoretical stages and reflux ratio,
the feed stage, and the products split. By using this information together
with the inlet streams composition obtained by Aspen, the rigorous
calculation of distillation columns could be next performed using the
RadFrac model of Aspen Plus (Quintero & Cardona, 2011). For our
purposes, it is assumed that the towers have no pressure drop. The
condenser and reboiler pressures are therefore set to 1 atm. As a
summary, each column is designed from scratch and optimised as follows:
Design specifications are entered in terms of recovery of ethanol in
both the top and bottoms products. These specifications are input to
the DSTWU column block in order to obtain the final column
characteristics.
Next, number of stages and feed stream stage are also specified
according to results obtained by firstly applying the DSTWU method,
which provides the minimum reflux ratio as well.
Finally, for each design specification, a design variable must be
specified on the RadFrac model. In this case, distillate rate and reflux
ratio are specified.
Design of the columns is a tedious process that requires continuous
adjustment. If there are any changes in the feed stream of the column,
this design process must be repeated to re-optimize the column for the
new feed.

42
Chapter 4
Description of Process Simulation on Aspen Plus
This section describes in detail the models on Aspen Plus software
developed for the three plant configurations according to the different
outputs.
4.1 Process Design 1
Three different process areas are found in this simulation: conversion of
protein-rich streams to protein concentrate, conversion of starch-rich
stream to purified dextrose, and conversion of lignocellulose to briquettes.
Figure 4.1 on the upcoming pages presents the flowsheet developed on
Aspen Plus for Process design 1.
4.1.1 Protein Concentrate Production
The extract liquid fraction from the wet thresher is one of the input
streams to the model. First, this stream is mixed with the two protein-rich
streams obtained during mechanical skimming of the floating protein in
the starch treatment section (see Sub-section 4.1.2). The resulting mixture
is heated (COAGHEAT) in order to reach protein coagulation temperature
(80ºC). Next, the heated stream is sent to the reactor (COAGULAT) where
the coagulation of protein – change of phase from liquid to solid – is
performed at the aforementioned temperature. The resulting stream is
sent to filtration (FILTRAT). This block unit is a CFuge block, which
represents liquid-solid separation using centrifuge filters. The resulting
cake out of the filter enters a component separator (PRECIP) that
represents the refining of the protein concentrate – removal of other solids
such as starch, ash, or fibre. Last, the protein concentrate enters a two-
outlet flash block (DRYER) that models the evaporation of part of the
moisture content at 103ºC.

43
4.1.2 Dextrose Production
The bean fraction out of the wet thresher is assumed as already dehulled
and ground when input to Aspen Plus. Therefore, the ground seeds, which
have the form of bean flour, are first mixed with the glucose solution –
also called “transfer solution” by PoE, i.e. a part of the stream outlet from
the saccharification vessel – and the mixture is sent to the sedimentation
step (DECANTER). In the decanter block, a separation sharpness of 0.70
is specified. Next, two user-defined adjustments are required for both
fractions out of the decanter. First, the heavy fraction goes through a
component separator block (SOLIDSEP) where part of the solids are
separated and will follow the light protein-rich fraction. Second, the light
fraction goes through a component separator (PROSKIM1) that intends to
simulate the mechanical protein skimming process. The skimmed protein
is sent to the protein coagulation tank (COAGULAT). The used transfer
solution is then recycled to the fermentation vessel and is thus sent to the
collector of glucose-rich streams (MIXER3). As a result, two new streams
have been obtained: the protein-rich stream (SKIPROT1) and the starchy
slurry (STARCH1). The starchy slurry is mixed with water in order to lower
its solids content before gelatinisation. The resulting stream is sent to
gelatinisation, modelled as a heat exchanger (GELATINI) that warms the
stream up to 83ºC. The hot stream is then sent to a streams mixer
(LIQUEFAC) that intends to represent the liquefaction step. Next, a second
mechanical protein skimming is simulated, modelled as a component
separator (PROSKIM2) as for the first skimming case. The resulting
skimmed protein-rich fraction is sent to the protein treatment area. The
liquefied starch stream (STARCH6) is cooled down to saccharification
temperature (60ºC) in a heat exchanger (COOLSTA). The stream enters the
saccharification reactor (SACCHARI). The product stream (GLUCOSE1)
contains the product, that is, the dextrose compound. The stream is
further cooled down to 30ºC in a heat exchanger (COOLGLU), and it is
next split (SPLITTER) in two streams. Half of the glucose-rich stream
(GLUCSEDI) is used as transfer solution, thus it is sent to the initial
collector (TRASNMIX) used before the sedimentation step. The other half of
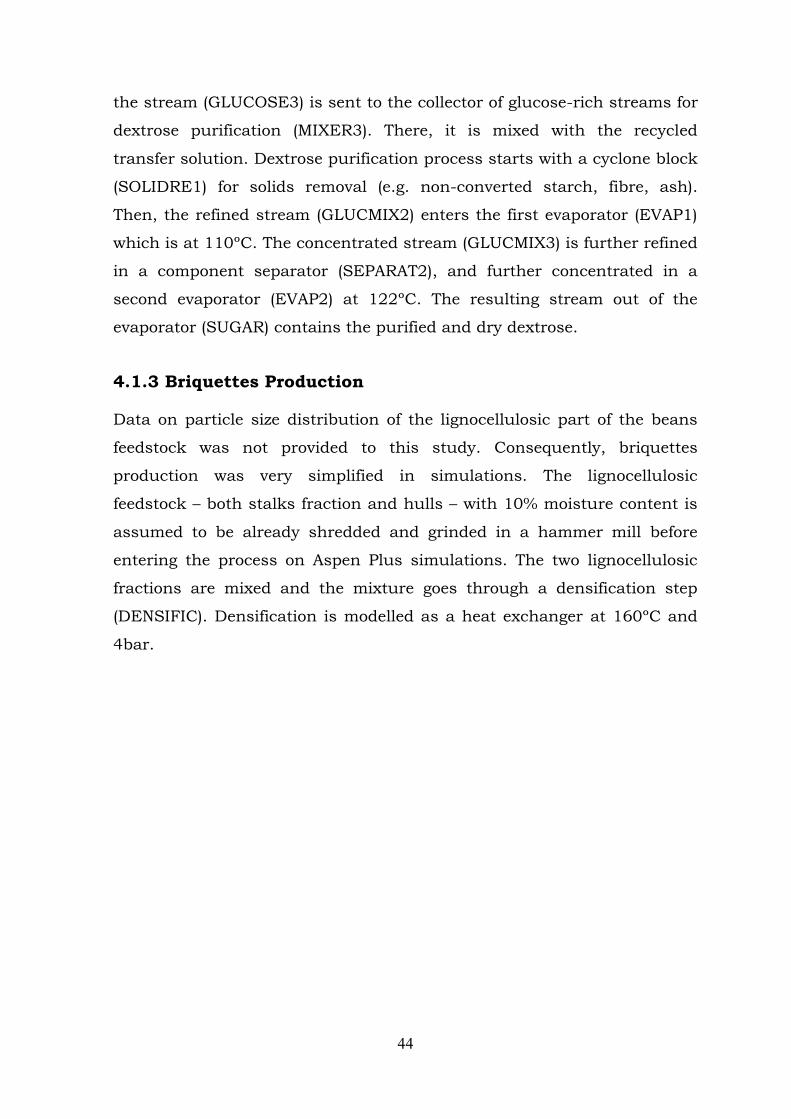
44
the stream (GLUCOSE3) is sent to the collector of glucose-rich streams for
dextrose purification (MIXER3). There, it is mixed with the recycled
transfer solution. Dextrose purification process starts with a cyclone block
(SOLIDRE1) for solids removal (e.g. non-converted starch, fibre, ash).
Then, the refined stream (GLUCMIX2) enters the first evaporator (EVAP1)
which is at 110ºC. The concentrated stream (GLUCMIX3) is further refined
in a component separator (SEPARAT2), and further concentrated in a
second evaporator (EVAP2) at 122ºC. The resulting stream out of the
evaporator (SUGAR) contains the purified and dry dextrose.
4.1.3 Briquettes Production
Data on particle size distribution of the lignocellulosic part of the beans
feedstock was not provided to this study. Consequently, briquettes
production was very simplified in simulations. The lignocellulosic
feedstock – both stalks fraction and hulls – with 10% moisture content is
assumed to be already shredded and grinded in a hammer mill before
entering the process on Aspen Plus simulations. The two lignocellulosic
fractions are mixed and the mixture goes through a densification step
(DENSIFIC). Densification is modelled as a heat exchanger at 160ºC and
4bar.
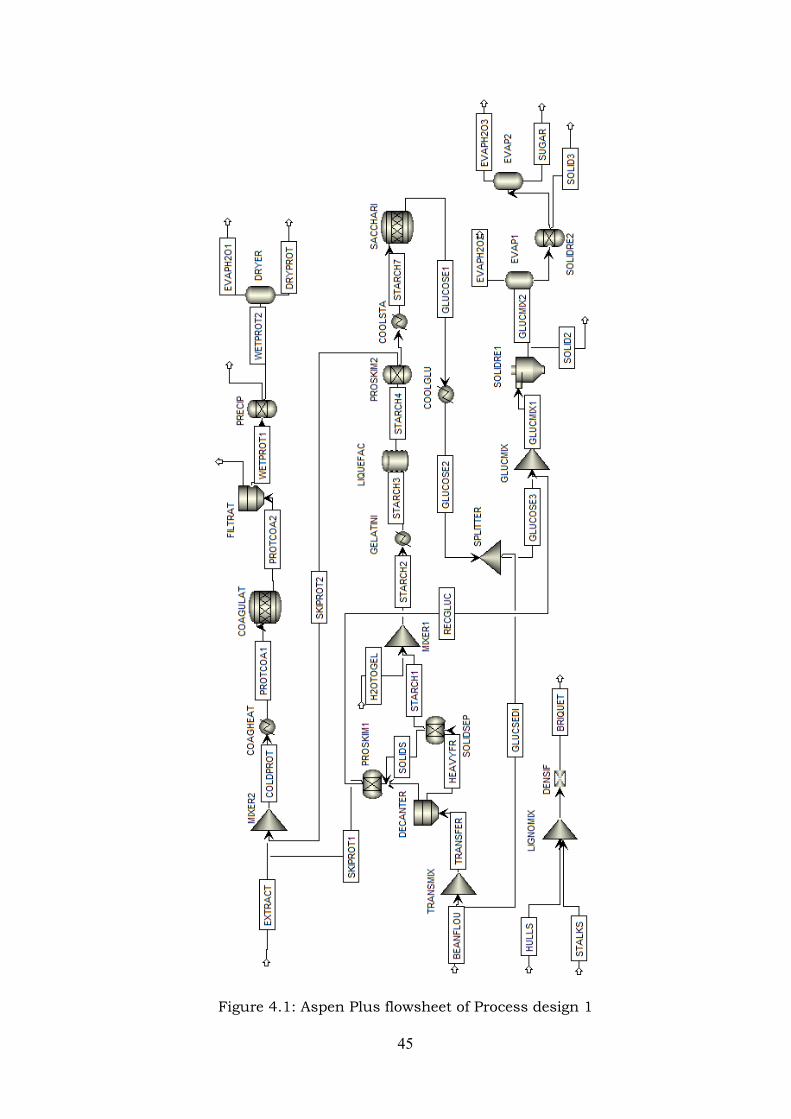
45
Figure 4.1: Aspen Plus flowsheet of Process design 1
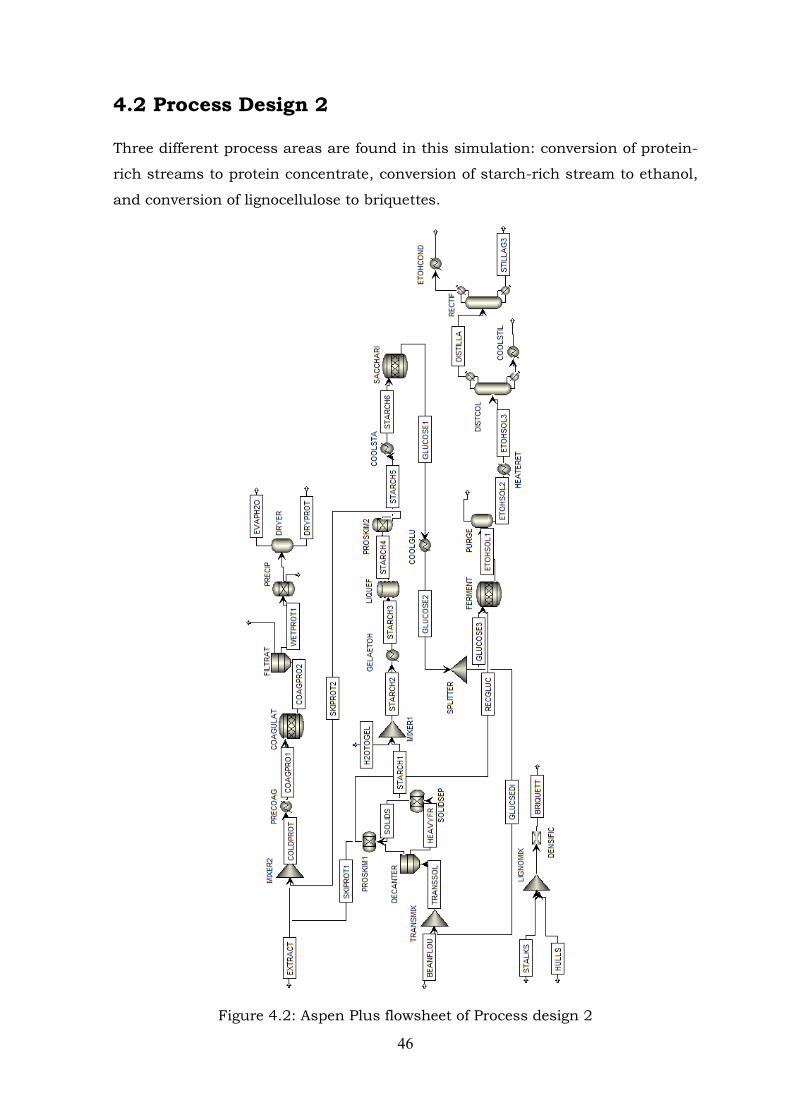
46
4.2 Process Design 2
Three different process areas are found in this simulation: conversion of protein-
rich streams to protein concentrate, conversion of starch-rich stream to ethanol,
and conversion of lignocellulose to briquettes.
Figure 4.2: Aspen Plus flowsheet of Process design 2
47
4.2.1 Protein Concentrate Production
The simulation on Aspen Plus of the protein concentrate production line is
exactly the same as for Process design 1.
4.2.2 Starch-derived Ethanol Production
This process is exactly the same as for Process design 1 until the unit for
glucose-rich streams splitting (SPLITTER). One of the output streams
(GLUCOSE3) of the splitter is sent to the collector of glucose-rich streams
(MIXER3). There, it is mixed with the recycled transfer solution, and the
water content is adjusted according to fermentation requirements. The
mixture enters the fermentation reactor (FERMENT), which operates at
30ºC. The product stream contains CO2 gas and is first sent to a flash
drum (PURGE) to simulate the gas escaping that occurs in the
fermentation vessel. In this way, the pressure in the vessel (atmospheric
pressure) can be kept constant. The flash drum is at the same conditions
(temperature and pressure) as the fermenter is. Next, the ethanol-rich
stream is pre-heated to nearly distillation temperature in a heat exchanger
(HEATERET), that is, to 77.5ºC. The stream enters the first distillation
column (DISTCOL). The distillate obtained is then sent to the next
distillation column (RECTIF). The bottoms of the first column are cooled
down to 50ºC in a heat exchanger (COOLSTIL). The second distillation
column (RECTIF) has two output streams: the distillate, i.e. the final
ethanol product (ETOHVAP), and the bottoms (STILLAG3). The ethanol
stream is condensed in a heat exchanger (ETOHCOND) down to the
stream’s bubble point.
4.2.3 Briquettes Production
The simulation on Aspen Plus of the briquettes production line is exactly
the same as for Process design 1.
48
4.3 Process Design 3
Three different process areas are found in this simulation: treatment of
proten-rich streams to protein concentrate, treatment of starch-rich
stream to ethanol, and lignocellulose treatment to ethanol.
4.3.1 Protein Concentrate Production
The simulation on Aspen Plus of the protein concentrate production line is
exactly the same as for Process design 1.
4.3.2 Starch Fraction Treatment
This process is exactly the same as for Process design 1 and 2 until the
cooling unit (COOLGLU) for the product stream out of saccharification. In
this design, the stream is cooled to 41ºC, which is the new fermentation
temperature. Then, it is directed to the stream splitter. One half of the
glucose-rich stream is sent to the decanter block after the splitter. The
other half (GLUCOSE3) is sent to the collector of glucose-rich streams
(MIXER3). There, it is mixed with the recycled transfer solution, and with
the stream rich in hexoses and pentoses from lignocellulose treatment
(C5ANDC63).
4.3.3 Lignocellulose Fraction Treatment
Hulls and stalks are first mixed and, next, the water content of the
mixture is adjusted in a stream mixer (MIXPRET) according to the
pretreatment requirements. The mixture is heated to 85ºC and sent to the
pretreatment reactor (PRETREAT). The reactor product needs further
water content adjustment. The stream is then cooled to enzymatic
hydrolysis temperature (55ºC) in a heat exchanger (COOLIGNO) and
enters the hydrolysis reactor (ENZYHYDR). Next, lignin and some other
solids need to be removed from the stream before entering fermentation,
and this is done in the Sub-stream splitter block of Aspen Plus
(LIGNOSEP). Finally, a 3% of the remaining stream is removed in a stream
splitter (CONTAMIN), which aims to represent the 3% of losses by
contamination that are accounted on the fermentation conversion rates.

49
4.3.4 Fermentation and Ethanol Purification
In a stream mixer (SUGARMIX), all the streams containing fermentable
sugars are mixed before fermentation. The mixture is first cooled down to
41ºC, the fermentation temperature, in a heat exchanger (SUGARCOO).
The cooled stream enters the fermentation reactor (FERMENT). After
fermentation, the product stream contains CO2 gas and is first sent to a
flash drum (PURGE) to simulate the gas escaping that occurs in the
fermentation vessel. The flash drum is at the same conditions
(temperature and pressure) as the fermenter is. Next, the ethanol-rich
stream is pre-heated to nearly distillation temperature (77ºC) in a heat
exchanger (HEATERET). The stream enters the first distillation column
(DISTCOL). The distillate is sent to the next distillation column (RECTIF).
The bottoms of the first column are cooled down in a heat exchanger
(COOLSTIL) to 38ºC. The second distillation column (RECTIF) has two
output streams: the distillate, i.e. the final ethanol product (ETOHVAP),
and the bottoms (STILLAG3). The ethanol stream is condensed in a heat
exchanger (ETOHCOND) down to the stream’s bubble point.

50
Figure 4.3: Aspen Plus flowsheet of Process design 3

51
Chapter 5
Heat Integration of the Ethanol Plant – Pinch
Analysis In Chapter 3, the importance of mass balances in process design was
highlighted, as one of the main goals of simulations on Aspen Plus is to
obtain the flow rates of the product outputs and make sure they
accomplish the product design specifications. However, the availability of
economical and reliable energy sources is essential for stable operation of
the facility. Hence, an emphasis on efficient energy use at the facility -
which will reduce the burden on required natural resources - is as
interesting as the production rates of the outputs, in terms of plant
design.
Energy balances are the key design practice in order to find the
potential energy savings and, consequently, potential economic savings of
the proposed design. Energy balances help in understanding the energy
flows and where there is abundance and scarcity of energy within the
overall process. According to that, a pinch technology analysis is
performed in order to optimize the energy use (heating and cooling) of the
plant. Heat integration analyses of the two latter process designs, i.e.
Process designs 2 and 3, are found to be of significant interest due to their
large energy use. Since the cost for electrical energy (used generally for
grinding and running electric motors) in the ethanol production process is
usually a minor cost item compared to thermal energy requirements
(Gildred/Butterfield Limited Partnership, 1984), electricity will not be
included in the energy balances.
5.1 Background on Pinch Analysis
The object of the heat integration analysis is to analyse the heat
distribution system within the plant. The process has several sinks and
sources of heat at various qualities and quantities, and if some of them
can be matched, the external utility load of the plant can be reduced. The
52
result of this analysis will then be used to derive a heat exchanger
network (HEN) to distribute the energy as economic as possible within the
system (Bösch et al., 2008).
Up to now, the ability to optimise the use of energy in chemical
processes has been successfully applied by mainly two methodologies: the
Heat Exchanger Network Synthesis problem and the Pinch method. The
first methodology is very useful to find the best possible solution for the
heat exchanger network, but it is also limited in providing the information
about the possibilities to modify the process to reduce its minimum energy
consumption. On the other hand, pinch method or technology gives full
control of the design to the engineer and helps in identifying the
parameters of the process that limit the energy savings. For this reason,
Pinch technology is a very well-established tool for HEN design (Martin &
Mato, 2008) and will be used for heat integration of the present cases.
Based on thermodynamic principles, Pinch technology offers a
systematic approach to optimum energy integration in a process. This is
done through setting an energy target for the design, i.e. the minimum
theoretical energy demand for the overall process. Firstly, the energy
targets for the process can be set without having to design the heat
exchanger network and utility system. These energy targets can be
calculated directly from the material and energy balance (Smith, 2005).
Secondly, the objective of this technology is to match cold and hot process
streams with a network of exchangers in order to reach the
aforementioned energy targets. To do so, Pinch technology establishes a
temperature, i.e. the pinch point, which separates the overall operating
temperature region observed in the process into two temperature regions.
At this temperature, driving forces for heat transfer are minimal and the
heat transfer is equal to zero. Above Pinch temperature, there is a
temperature region with heat deficit that must be covered by heating.
Below Pinch, there is correspondingly a temperature region with heat
surplus that must be removed by cooling. According to pinch method, it is
not profitable to transfer heat from a deficit region (above Pinch) to a
surplus region (below Pinch). Such a methodology will maximize the heat
53
recovery in the process with the establishment of a heat exchanger
network based on pinch analysis principles. Once Pinch analysis is
performed, the best design for an energy-efficient heat exchanger network
will result in a trade-off between the energy recovered and the capital
costs involved in this energy recovery, i.e. in the heat exchangers network
itself (Smith, 2005; Gundersen, 2000).
To summarise, the understanding of Pinch analysis gives three rules
that must be obeyed in order to achieve the minimum energy targets for a
process: (1) Heat must not be transferred across the pinch; (2) there must
be no external cooling above the pinch; and (3) there must be no external
heating below the pinch. Violating any of these rules leads to cross-pinch
heat transfer resulting in an increase in the energy requirement beyond
the target (March, 1998).
The following network design process will intend to satisfy these rules.
However, often practical constraints prevent the theoretical assumption
that any hot stream can be matched with any cold stream providing there
is feasible temperature difference between them (Smith, 2005). There are
many design-related reasons why constraints might be imposed. For
example, a reason for a constraint might be that a stream can only
exchange heat in maximum 2 or 3 heat exchangers (either with process
streams or external utilities) in order to avoid unacceptably complex heat
exchanger networks for a small-scale plant, as it is the present case. Also,
potential control and start-up problems might call for constraints, e.g. in
distillation columns and reactors (see sub-section 6.2 for further details).
In consequence, Pinch analysis will be altered by these constraints and
their effect on the energy performance of the plant will be evaluated using
the Pinch method itself together with a little common sense.
Finally, even if the calculations required by the Pinch method are
conceptually simple and can be done by hand, they become tedious and
time-consuming if applied to a real-scale problem as the present case.
Consequently, a computer software that performs those repetitive tasks
was used. The ASPEN package that was available for this study did not
include heat integration tools when streams with solid phase were

54
present, thus pinch analyses were separately performed on the software
called HINT (Heat Integration). HINT® is a free piece of educational
software for HEN design based on the Pinch method developed by
professors in the University of Valladolid (Martin & Mato, 2008). Detailed
analyses, determining the energy recovered versus the capital cost
involved, are not done for the process designs in this study, but is
recommended for more detailed designs in the future.
5.2 Pinch Analysis of Process Design 2
The first task in applying a pinch analysis is to extract the required
thermodynamic data for construction of the composite curves. All the
process streams that undergo an enthalpy change need to be identified,
i.e. all the 'hot' streams (those that need cooling) and 'cold' streams (those
that need heating) of the process (Shing et al., 1997). The required
thermodynamic data refers to stream flow rates, thermal properties, phase
changes, and temperature ranges through which they must be heated or
cooled. These data can only be obtained after mass balances have been
performed and temperatures and pressures have been established for the
process streams.
For process design 2, eighteen streams were identified as having a
change in their enthalpy. The corresponding heat duties, specific heat
capacity flow rate (mCp) and start and target temperatures of each stream
were thus obtained from simulations on Aspen Plus. Only the start and
target temperatures are displayed due to confidentiality constraints.

55
Table 5.1: Thermal data for hot streams in Process design 2
ID HOT STREAMS Tstart (ºC) Ttarget (ºC)
H1 Glucose cooling after saccharification 60 30
H2 Starch cooling after liquefaction 83 60
H3 Ethanol product condensation* 78.1 50
H4 Stillage cooling for first distillation column 101.2 50
H5 Fermentation 30 30
H6 Condenser in first distillation column 82.4 82.4
H7 Condenser in rectifier column 78.1 78.1
The only stream (excluding distillation columns) with phase change is H3.
The cooling process for this stream starts at the stream’s dew point and
finishes at its bubble point, thus the stream does not need to be broken
up into dummy streams of different mCp values, but a constant mCp
value may be assumed as approximated enough (King et al., 1999).
Table 5.2: Thermal data for cold streams in Process design 2
ID COLD STREAMS Tstart (ºC) Ttarget (ºC)
C1 Starch heating during gelatinisation 21.8 83
C2 Ethanol pre-heating before distillation 30 77.5
C3 Protein heating for coagulation 37 80
C4 Heating of solid part of wet protein 80 103
C5a Heating of water content in wet protein up to
boiling point 80 100
C5b Evaporation of water content in wet protein dryer 100 100
C5c Superheating of vapor in wet protein dryer 100.1 103
C6 Densification - Heating of lignocellulose 30 160
C7 Saccharification 60 60
C8 Reboiler in first distillation column 101.4 101.4
C9 Reboiler in rectifier column 84.3 84.3
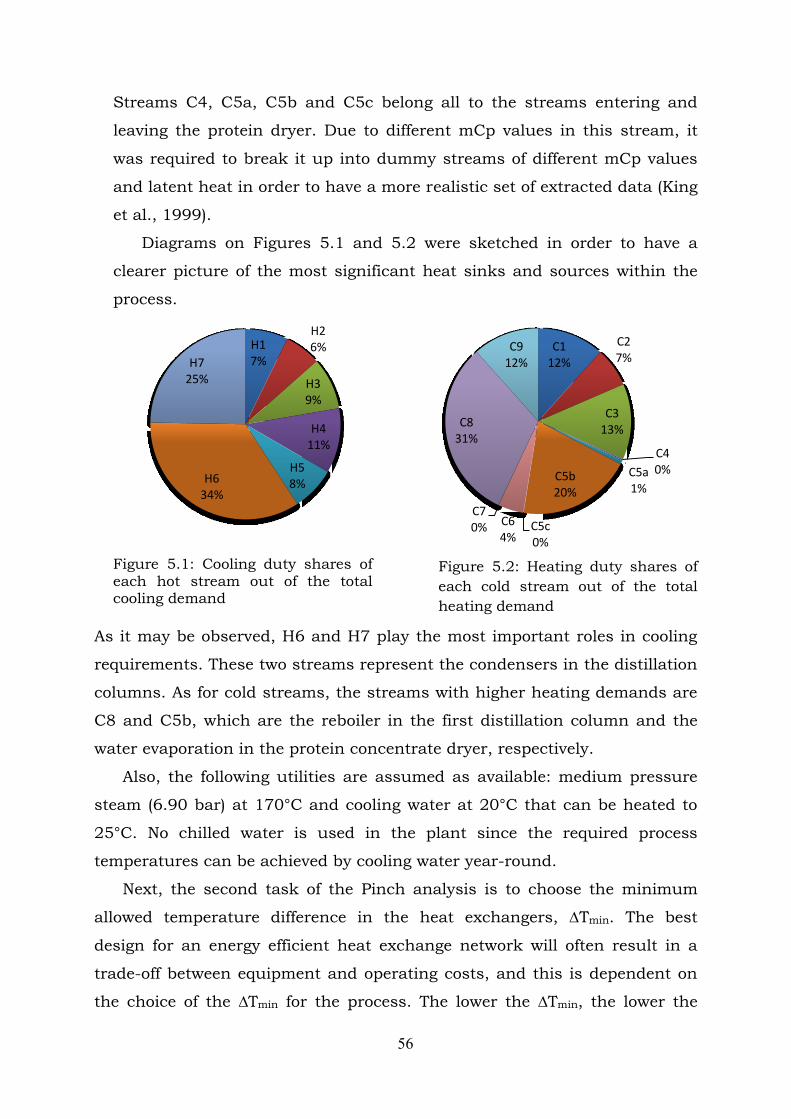
56
C1 12%
C2 7%
C3 13%
C4 0% C5a
1% C5b 20%
C5c 0%
C6 4%
C7 0%
C8 31%
C9 12%
Streams C4, C5a, C5b and C5c belong all to the streams entering and
leaving the protein dryer. Due to different mCp values in this stream, it
was required to break it up into dummy streams of different mCp values
and latent heat in order to have a more realistic set of extracted data (King
et al., 1999).
Diagrams on Figures 5.1 and 5.2 were sketched in order to have a
clearer picture of the most significant heat sinks and sources within the
process.
Figure 5.1: Cooling duty shares of each hot stream out of the total cooling demand
Figure 5.2: Heating duty shares of
each cold stream out of the total
heating demand
As it may be observed, H6 and H7 play the most important roles in cooling
requirements. These two streams represent the condensers in the distillation
columns. As for cold streams, the streams with higher heating demands are
C8 and C5b, which are the reboiler in the first distillation column and the
water evaporation in the protein concentrate dryer, respectively.
Also, the following utilities are assumed as available: medium pressure
steam (6.90 bar) at 170°C and cooling water at 20°C that can be heated to
25°C. No chilled water is used in the plant since the required process
temperatures can be achieved by cooling water year-round.
Next, the second task of the Pinch analysis is to choose the minimum
allowed temperature difference in the heat exchangers, ∆Tmin. The best
design for an energy efficient heat exchange network will often result in a
trade-off between equipment and operating costs, and this is dependent on
the choice of the ∆Tmin for the process. The lower the ∆Tmin, the lower the
H1 7%
H2 6%
H3 9%
H4 11%
H5 8% H6
34%
H7 25%
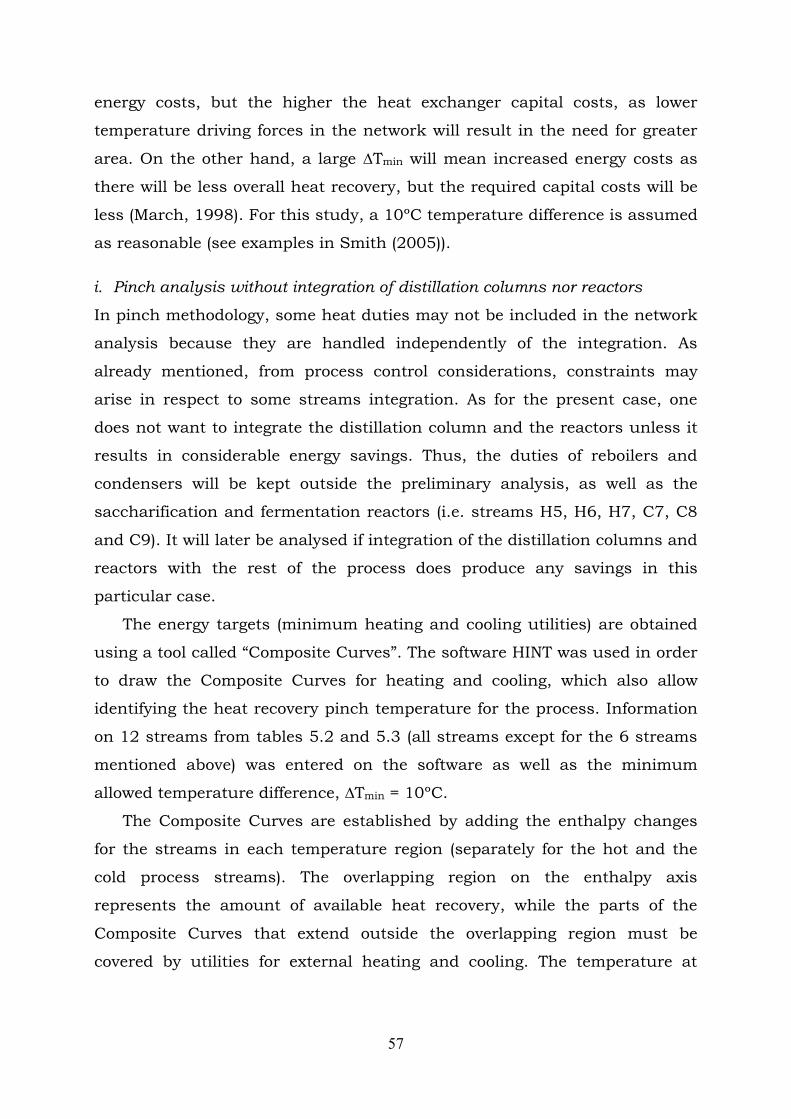
57
energy costs, but the higher the heat exchanger capital costs, as lower
temperature driving forces in the network will result in the need for greater
area. On the other hand, a large ∆Tmin will mean increased energy costs as
there will be less overall heat recovery, but the required capital costs will be
less (March, 1998). For this study, a 10ºC temperature difference is assumed
as reasonable (see examples in Smith (2005)).
i. Pinch analysis without integration of distillation columns nor reactors
In pinch methodology, some heat duties may not be included in the network
analysis because they are handled independently of the integration. As
already mentioned, from process control considerations, constraints may
arise in respect to some streams integration. As for the present case, one
does not want to integrate the distillation column and the reactors unless it
results in considerable energy savings. Thus, the duties of reboilers and
condensers will be kept outside the preliminary analysis, as well as the
saccharification and fermentation reactors (i.e. streams H5, H6, H7, C7, C8
and C9). It will later be analysed if integration of the distillation columns and
reactors with the rest of the process does produce any savings in this
particular case.
The energy targets (minimum heating and cooling utilities) are obtained
using a tool called “Composite Curves”. The software HINT was used in order
to draw the Composite Curves for heating and cooling, which also allow
identifying the heat recovery pinch temperature for the process. Information
on 12 streams from tables 5.2 and 5.3 (all streams except for the 6 streams
mentioned above) was entered on the software as well as the minimum
allowed temperature difference, ∆Tmin = 10ºC.
The Composite Curves are established by adding the enthalpy changes
for the streams in each temperature region (separately for the hot and the
cold process streams). The overlapping region on the enthalpy axis
represents the amount of available heat recovery, while the parts of the
Composite Curves that extend outside the overlapping region must be
covered by utilities for external heating and cooling. The temperature at
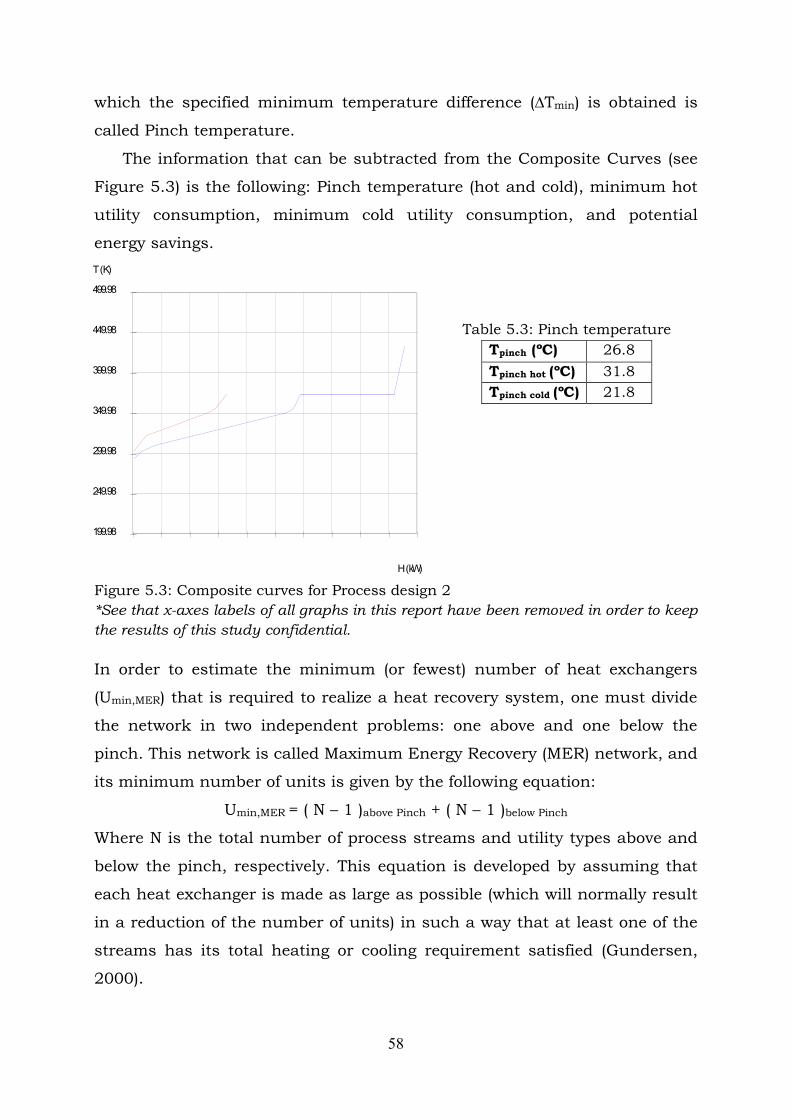
58
which the specified minimum temperature difference (∆Tmin) is obtained is
called Pinch temperature.
The information that can be subtracted from the Composite Curves (see
Figure 5.3) is the following: Pinch temperature (hot and cold), minimum hot
utility consumption, minimum cold utility consumption, and potential
energy savings.
Table 5.3: Pinch temperature
Tpinch (ºC) 26.8
Tpinch hot (ºC) 31.8
Tpinch cold (ºC) 21.8
Figure 5.3: Composite curves for Process design 2
*See that x-axes labels of all graphs in this report have been removed in order to keep
the results of this study confidential.
In order to estimate the minimum (or fewest) number of heat exchangers
(Umin,MER) that is required to realize a heat recovery system, one must divide
the network in two independent problems: one above and one below the
pinch. This network is called Maximum Energy Recovery (MER) network, and
its minimum number of units is given by the following equation:
Umin,MER = ( N – 1 )above Pinch + ( N – 1 )below Pinch
Where N is the total number of process streams and utility types above and
below the pinch, respectively. This equation is developed by assuming that
each heat exchanger is made as large as possible (which will normally result
in a reduction of the number of units) in such a way that at least one of the
streams has its total heating or cooling requirement satisfied (Gundersen,
2000).
0. 10. 20. 30. 40. 50. 60. 70. 80. 90. 100.
199.98
249.98
299.98
349.98
399.98
449.98
499.98
H (kW)
T (K)
Composite Curves

59
In order to identify the total number of process streams and utility types
above and below the pinch, the so-called Stream Grid tool is used. This
representation (where the hot and cold process streams and utilities are
drawn in a counter-current manner) is also the most common design
environment for heat exchanger networks. Here, Pinch decomposition is
obvious and driving forces in the hot and cold ends of the heat exchanger
can be easily checked (Gundersen, 2000). The Stream grid for this process
design is obtained by HINT and is shown in Figure 5.4 (see that the suitable
matches that are found on the next step are directly incorporated in this
figure).
The total number of process streams and utility types above and below
the pinch is hence calculated from Figure 5.4: Nabove pinch = 13 and Nbelow pinch
= 2. As a consequence, in order to apply a heat recovery system where only
the minimum hot and cold external utilities previously calculated are
required, the minimum number of heat exchanger units (including both
matches between process stream and matches with external utilities) is the
following:
Umin,MER = ( 13 – 1 )above Pinch + ( 2 – 1 )below Pinch = 13
At this point, a MER heat exchanger network can be designed by using the
Pinch Design Method. The method involves some ground rules or strategy for
setting up the heat exchanger matches between the process streams.
The strategy of Pinch method suggests starting to find matches at the
Pinch region, since the pinch is the most constrained region of the problem
due to the restrictions in possible matches that ∆Tmin imposes. Quite often
there are essential matches to be made, but if such matches are not made,
the result will be an excessive use of utilities resulting from heat transfer
across the pinch (Smith, 2005). Furthermore, for temperature feasibility of
the matches close to the pinch, the mCp value of the streams going out of
the pinch needs to be greater than the mCp value of the stream coming into
the pinch. Thus for temperature feasibility there is a "mCp rule":
Above Pinch: mCpCj ≥ mCpHi ; Below Pinch: mCpHi ≥ mCpCj
Like that, the streams diverge from ∆Tmin and the match is feasible.
60
Above Pinch, where there is heat deficit, the main task is to cool the hot
streams to Pinch temperature without the use of external cooling, in order to
maximize the use of the limited heating resources. Because there is a
requirement for minimum driving forces (∆Tmin), each cold stream can only
cool one hot stream to Pinch temperature. Correspondingly below Pinch,
where there is heat surplus, the main task is to heat the cold streams to
Pinch temperature without the use of external heating, in order to maximize
the use of the limited cooling resources. For driving force reasons, each hot
stream can only heat one cold stream to Pinch temperature. Thus, the
following must be satisfied with respect to the number of streams above and
below Pinch:
Above Pinch: nC ≥ nH ; Below Pinch: nH ≥ nC
Here, nH and nC are the number of hot and cold process streams that are
present at the actual Pinch points. Following these restrictions, the matches
found are the so-called Pinch Exchangers, which are those units where either
(1) both the hot outlet temperature and the cold inlet temperature (above
Pinch) or (2) both the hot inlet temperature and the cold outlet temperature
(below Pinch) coincide with the hot and cold Pinch temperatures
(Gundersen, 2000).
The results of the software calculations show that there is only one
possible match for Pinch exchangers, and it is placed above the Pinch (since
there is only one stream present below the pinch, no stream matches are
possible in this temperature region). This match is between the streams H1-
C1. Whenever a match is selected, its duty is maximized in order to reduce
the number of units in the network. This simply means that the duty of the
heat exchanger is set equal to the smaller between the cooling needed by the
hot stream and the heating needed by the cold stream. This is called the
“tick-off” heuristic, which steers the design toward the minimum number of
units (Smith, 2005).
Occasionally, it appears not to be possible to create the appropriate
matches to satisfy all the pinch streams above and below the pinch. The
reason for this is that one or both of the two aforementioned design criteria
for Pinch matches cannot be satisfied (i.e. rule for mCp value and rule for
61
the number of hot/cold streams). In those cases, stream splitting is
inevitable for a minimum utility design. In order to proceed with heat
integration, hot and/or cold streams may be split into two (or more)
branches, hence increasing the number of hot and/or cold stream branches
at the same time as reducing the mCp values for the stream branches
(Gundersen, 2000).
At this point, the first constraint on HEN design for the ethanol plants in
this study is imposed: no stream splitting is allowed. As more splitting is
done in a HEN design, additional cost of controlling the flow rates in each of
the branches is added and, generally, a certain degree of complexity is
inserted in the system design (Shah et al., 1988). And according to the
inventor of PoE technology, one of the main attractions of the biorefinery is
its design simplicity and simple operation and maintenance.
The second constraint on HEN design is that each stream can only pass
through maximum 2 heat exchangers (where it exchanges heat with either
other process streams or external utilities) in order to avoid unacceptably
complex heat exchanger networks for a small-scale plant as the present
case.
Once all the feasible Pinch Exchangers have been selected by respecting
the multiple design constraints, the network must be completed by utilizing
the rest of the heating resources in the hot streams above Pinch, as well as
the rest of the cooling resources in the cold streams below Pinch (if present).
The mCp inequality only applies when a match is made between two streams
that are both at the pinch. Away from the pinch, temperature differences
increase, and it is no longer essential to obey mCp inequalities. Thus, in
these process-process heat exchangers, the inequalities for mCp values do
not strictly apply, and the designer can discriminate on the basis of e.g.
operability or plant layout (Gundersen, 2000).
Due to the external design constraints imposed by the technology
inventor, only four feasible matches between process streams could be
selected. Consequently, the hot stream H4 could not be completely cooled by
other process streams to its target temperature, and one of the pinch
methodology rules was not fulfilled. As a result, external heating is needed

62
above the pinch, and the minimum hot and cold utilities consumption
obtained in the Composite Curves cannot be reached. The resulting HEN is
not a MER network and involves more heat exchanger units than the
minimum number of units for MER network. Notwithstanding, the obtained
external utilities demand for this network proposal is very close to the
minimum value in case of MER network.
Table 5.4: Matches between process streams above pinch suggested for Process
design 2 without integration of distillation columns or reactors
Match Description of the streams in
the match Match
Description of the streams in
the match
H1-C1
Glucose cooling and starch
heating for gelatinisation.
Starch needs external heating
H3-C3
Ethanol product condensation
and protein heating for
coagulation. Protein needs
external heating
H2-C2 Starch cooling and ethanol pre-
heating before distillation H4-C2
Stillage cooling and ethanol
pre-heating before distillation.
Stillage needs external cooling
The other 9 heat exchanger units required are related to the satisfaction of
the remaining heating demand of all the cold streams by the use of external
utilities, and the remaining cooling demand of streams H4 and H1 by
external cooling. These 9 units are depicted as red and blue circles on the
Grid Diagram.
However, in reality, streams C4, C5a, C5b and C5c above pinch
constitute the protein dryer and may be counted as a single stream with one
single match with external heating utility. As for temperatures below pinch,
there is no possibility for a match between process streams as it can be
observed in Figure 5.4. As a result, in total, 10 heat exchanger units are
required on the Grid Diagram by accounting for C4, C5a, C5b and C5c as a
single stream.
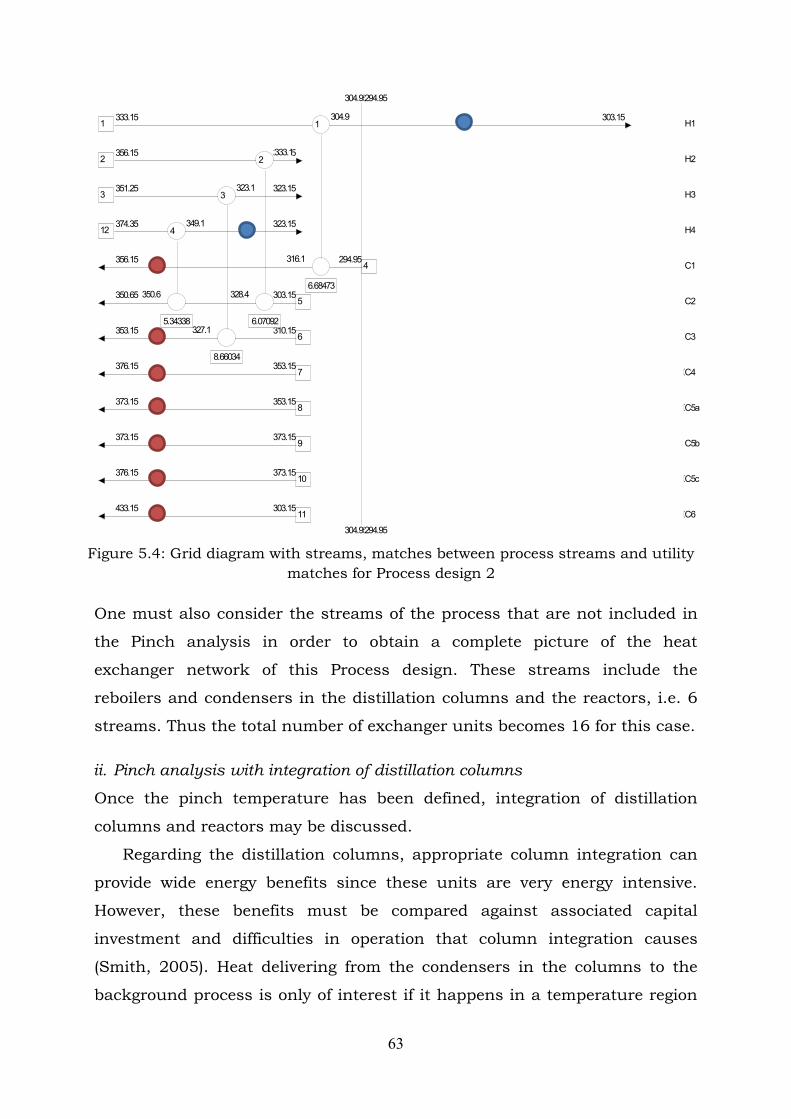
63
Figure 5.4: Grid diagram with streams, matches between process streams and utility
matches for Process design 2
One must also consider the streams of the process that are not included in
the Pinch analysis in order to obtain a complete picture of the heat
exchanger network of this Process design. These streams include the
reboilers and condensers in the distillation columns and the reactors, i.e. 6
streams. Thus the total number of exchanger units becomes 16 for this case.
ii. Pinch analysis with integration of distillation columns
Once the pinch temperature has been defined, integration of distillation
columns and reactors may be discussed.
Regarding the distillation columns, appropriate column integration can
provide wide energy benefits since these units are very energy intensive.
However, these benefits must be compared against associated capital
investment and difficulties in operation that column integration causes
(Smith, 2005). Heat delivering from the condensers in the columns to the
background process is only of interest if it happens in a temperature region
1-7.11142 0.237047 H1333.15 303.15
2-6.07092 0.263953 H2356.15 333.15
3-8.66034 0.308197 H3351.25 323.15
12-10.8269 0.211463 H4374.35 323.15
419.346 0.316111 C1294.95356.15
511.4143 0.240301 C2303.15350.65
621.9591 0.510677 C3310.15353.15
70.34754 1.51104e-002C4353.15376.15
81.21905 6.09525e-002C5a353.15373.15
933.0455 - C5b373.15373.15
108.2541e-002 2.75137e-002C5c373.15376.15
117.36524 5.66557e-002C6303.15433.15
304.95
304.95
294.95
294.95
1
6.68473
304.9
316.1
2
6.07092
333.1
328.4
3
8.66034
323.1
327.1
4
5.34338
349.1
350.6

64
where the process has heat deficit, i.e. above the pinch. Conversely, the
reboilers in the columns could receive heat from the background process,
but only if it happens in a temperature region where the process has heat
surplus, i.e. below the pinch.
As for the reactors, integration of exothermic reactors is only of interest if
it occurs above the pinch, i.e. where there is heat deficit. Alternatively,
integration of endothermic reactors is only of interest if the temperature of
the reactor is below the pinch. The following tables summarize the decision-
making process for integration of these process units.
Table 5.5: Hot streams related to distillation columns and reactors
HOT STREAMS
Unit Temperature (ºC) Above or below the
pinch
Interesting for
Integration
Fermentation
(exothermic) 30 Below No
Condenser in
distillation
column
82.42 Above Yes
Condenser in
rectifier 78.10 Above Yes
Table 5.6: Cold streams related to distillation columns and reactors
COLD STREAMS
Unit Temperature (ºC) Above or below the
pinch
Interesting for
Integration
Saccharification
(endothermic) 60 Above No
Reboiler in
distillation column 101.44 Above No
Reboiler in rectifier 84.26 Above No
Since the condensers temperatures in both the distillation column and the
rectifier (82.42ºC and 78.104°C, respectively) are above the Pinch
temperature (which for hot streams is 31.8°C), these condensers act as a
heat source in the same region where the process has heat deficit.
Consequently, there could be savings from integrating these units. However,
integration of distillation columns with the rest of the process (the so-called
“background process”) is only appropriate if the temperatures of the
column’s processes lie on one side of the pinch (i.e. if the column is not

65
placed across the pinch) and if the columns can be accommodated by the
Grand Composite Curve (see below for explanation) of the background
process (March, 1998). For this heat integration analysis, all reboilers and
condensers temperatures lie above the pinch temperature of the background
process, thus columns are appropriately placed.
Another aspect to consider is that, if both the reboiler and condenser of a
column are integrated with the process, this can make the column very
difficult to start up and control (Chen, 2007). Consequently, the option that
better suits this problem is that, above the pinch, the reboilers are serviced
directly from the hot utility and the condensers are intended to be integrated
with the background process. In order to find whether the condensers can be
fully or only partly integrated with the background process, the Grand
Composite Curve of the background process is used. This graph is plotted by
HINT software. The Grand Composite Curve is obtained from the Heat
Cascade, which is constructed by establishing temperature intervals based
on the supply and target temperatures for all the streams. A heat balance is
then established for each of these temperature intervals based on heat
delivered from the hot streams and heat removed by the cold streams within
the interval. Finally, heat surplus in one interval is cascaded down to the
next interval (Gundersen, 2000). If the medium temperatures in each
temperature interval are plotted against the corresponding heat flows in the
cascade, the Grand Composite Curve is obtained. Thus, the profile of the
Grand Composite Curve represents residual heating and cooling demands
after recovering heat within the temperature intervals in the Heat Cascade
(Smith, 2005).
With this graphical tool, it can be readily observed how much heat can be
exchanged at a certain temperature with the background process. In this
case, at the temperature of the hottest condenser (i.e. 82.42ºC or 355.57K),
only a bit over half of the total condenser duty can be exchanged with other
process streams (see purple horizontal line in Figure 5.5). Thus, not all the
condenser duty can be exchanged with the background process. The reason
for this is that large part of the required minimum hot utility must be
provided at a higher temperature than the temperature of the condenser.

66
Figure 5.5: Grand Composite Curves for Process design 2
At this point, another constraint is applied to avoid complex heat integration
arrangements for the sake of operability and control. This constraint
imposes to perform the heat recovery from the condenser towards a single
sink of heat, rather than towards two or three sinks of heat. If this
constraint was not applied, difficult starts and control of the column would
appear. According to that, a cold stream with a heat duty equal or higher
than the duty of the condenser is the only possibility for a match with this
part of the distillation column. Even by considering the duties of both
condensers, there is no cold stream in the system that fulfils this condition
except for stream C5b. However, stream C5b belongs to the protein dryer,
i.e. it is just a part of the combined stream that enters and leaves the dryer
unit. Subsequently, the eventual match between C5b stream and a
condenser would lead to potential control problems. Moreover, the two
streams are expected to be geographically distant from each other within the
plant. For all these reasons, integration of distillation columns in this system
does not seem a feasible improvement according to the constraints in plant
design.
As a conclusion, the heat exchanger network proposed without
integration of distillation columns shows to be the most appropriate for
energy recovery in Process design 2. Table 5.7 presents the required number
of heat exchangers for the proposed HEN, as well as the proportion of the
0. 10. 20. 30. 40. 50. 60. 70.
199.98
249.98
299.98
349.98
399.98
449.98
499.98
H (kW)
T (K)
Grand Composite Curve

67
actual energy savings obtained by the proposed HEN compared to the
potential energy savings in MER network design. This value differs from
100% due to the variety of design constraints imposed. The total external
heating and cooling loads were also obtained in line with the actual energy
savings of the proposed HEN but are kept as confidential.
Table 5.7: Summary of key figures of proposed HEN for Process design 2
Proportion of actual energy savings obtained by the proposed
HEN compared to the potential energy savings in MER network 82.99%
Number of matches between process streams 4
Total number of heat exchanger units 16
5.3 Pinch Analysis of Process Design 3
For process design 3, twenty-two streams were identified as having a change
in their enthalpy. The corresponding heat duties, specific heat capacity flow
rate (mCp) and start and target temperatures of each stream were obtained
from the simulations on Aspen Plus. Only the start and target temperatures
are displayed due to confidentiality constraints.
Table 5.8: Thermal data for hot streams in Process design 3
ID HOT STREAMS Tstart (ºC) Ttarget (ºC)
H1 Glucose cooling after saccharification 60 41
H2 Starch cooling after liquefaction 83 60
H3 Stillage cooling for first distillation column 101.7 38
H4 Ethanol product condensation 78 41.4
H5 Lignocellulose cooling after pretreatment 78.6 55
H6 Sugars cooling to fermentation temperature 51.83 41
H7 Fermentation 41 41
H8 Exothermic reactor 55 55
H9 Condenser in first distillation column 81.52 81.52
H10 Condenser in rectifier column 77.98 77.98

68
Table 5.9: Thermal data for cold streams in Process design 3
ID COLD STREAMS Tstart (ºC) Ttarget (ºC)
C1 Starch heating during gelatinisation 23.2 83
C2 Etanol pre-heating before distillation 41 77
C3 Protein heating for coagulation 37.4 80
C4 Heating of solid part of wet protein 80 102
C5a Heating of water content in wet protein to boiling
point 80 100
C5b Evaporation of water in wet protein 100 100
C5c Superheating of vapor in wet protein dryer 100 102
C6 Lignocellulose heating before pretreatment 21.56 85
C7 Saccharification 60 60
C8 Lignocellulose pretreatment 85 85
C9 Reboiler in first distillation column 101.75 101.75
C10 Reboiler in rectifier column 83.77 83.77
The following utilities are assumed as available: medium pressure steam
(MP) at 175°C and cooling water at 20°C that can be heated to 25°C.
Furthermore, a ∆Tmin of 10ºC is also assumed as reasonable for Process
design 3.
Diagrams on Figures 5.6 and 5.7 give a picture of the streams with
higher heating and cooling demands. As it can be observed on those Figures,
for Process design 3, the largest cooling demand is not located in both
condensers of the distillation columns as for the case of Process design 2.
Now, it is the stream H3 which has the second largest cooling demand, i.e.
the stream that represents the stillage cooling after first distillation column.
As for cold streams, stream C9 represents almost half of the heating demand
of the process, being this the reboiler of the first distillation column. The
second largest heating demand lies in the stream C6, which represents
lignocellulose heating to pretreatment temperature (85ºC).
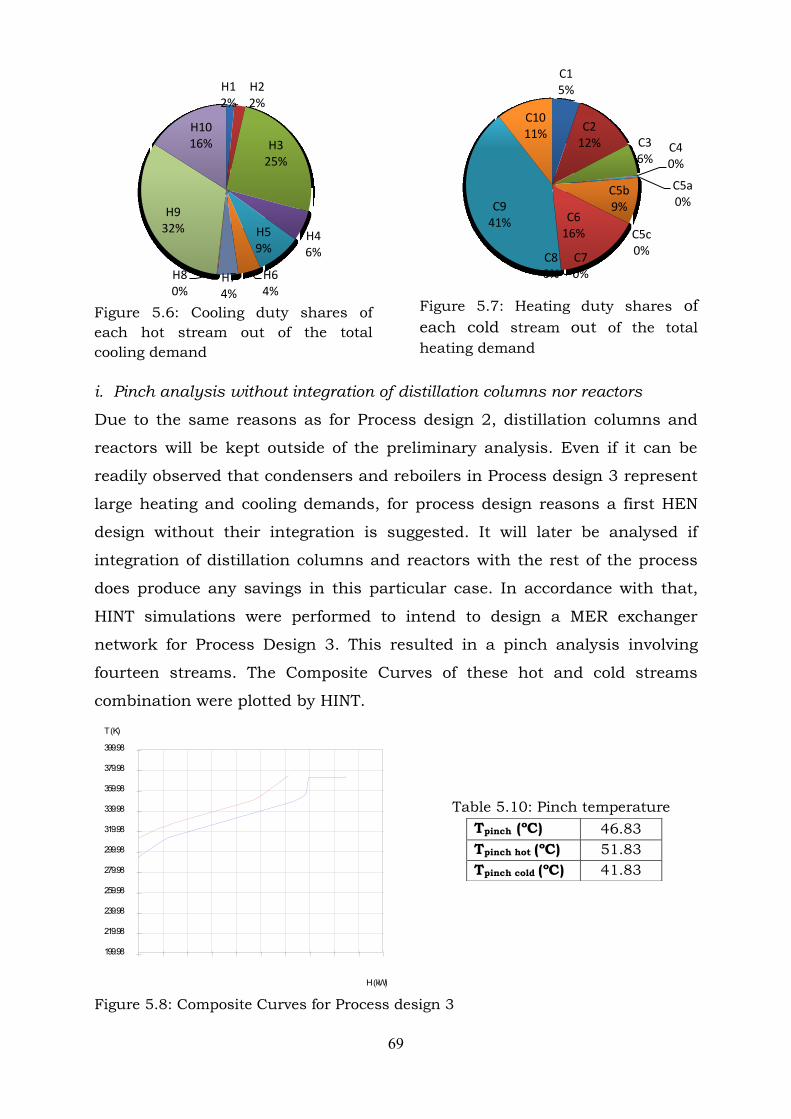
69
C1 5%
C2 12% C3
6% C4 0%
C5a 0%
C5b 9%
C5c 0%
C6 16%
C7 0%
C8 0%
C9 41%
C10 11%
Figure 5.6: Cooling duty shares of
each hot stream out of the total
cooling demand
Figure 5.7: Heating duty shares of
each cold stream out of the total
heating demand
i. Pinch analysis without integration of distillation columns nor reactors
Due to the same reasons as for Process design 2, distillation columns and
reactors will be kept outside of the preliminary analysis. Even if it can be
readily observed that condensers and reboilers in Process design 3 represent
large heating and cooling demands, for process design reasons a first HEN
design without their integration is suggested. It will later be analysed if
integration of distillation columns and reactors with the rest of the process
does produce any savings in this particular case. In accordance with that,
HINT simulations were performed to intend to design a MER exchanger
network for Process Design 3. This resulted in a pinch analysis involving
fourteen streams. The Composite Curves of these hot and cold streams
combination were plotted by HINT.
Table 5.10: Pinch temperature
Figure 5.8: Composite Curves for Process design 3
Tpinch (ºC) 46.83
Tpinch hot (ºC) 51.83
Tpinch cold (ºC) 41.83
0. 20. 40. 60. 80. 100. 120. 140. 160. 180. 200.
199.98
219.98
239.98
259.98
279.98
299.98
319.98
339.98
359.98
379.98
399.98
H (kW)
T (K)
Composite Curves
H1 2%
H2 2%
H3 25%
H4 6%
H5 9%
H6 4%
H7 4%
H8 0%
H9 32%
H10 16%
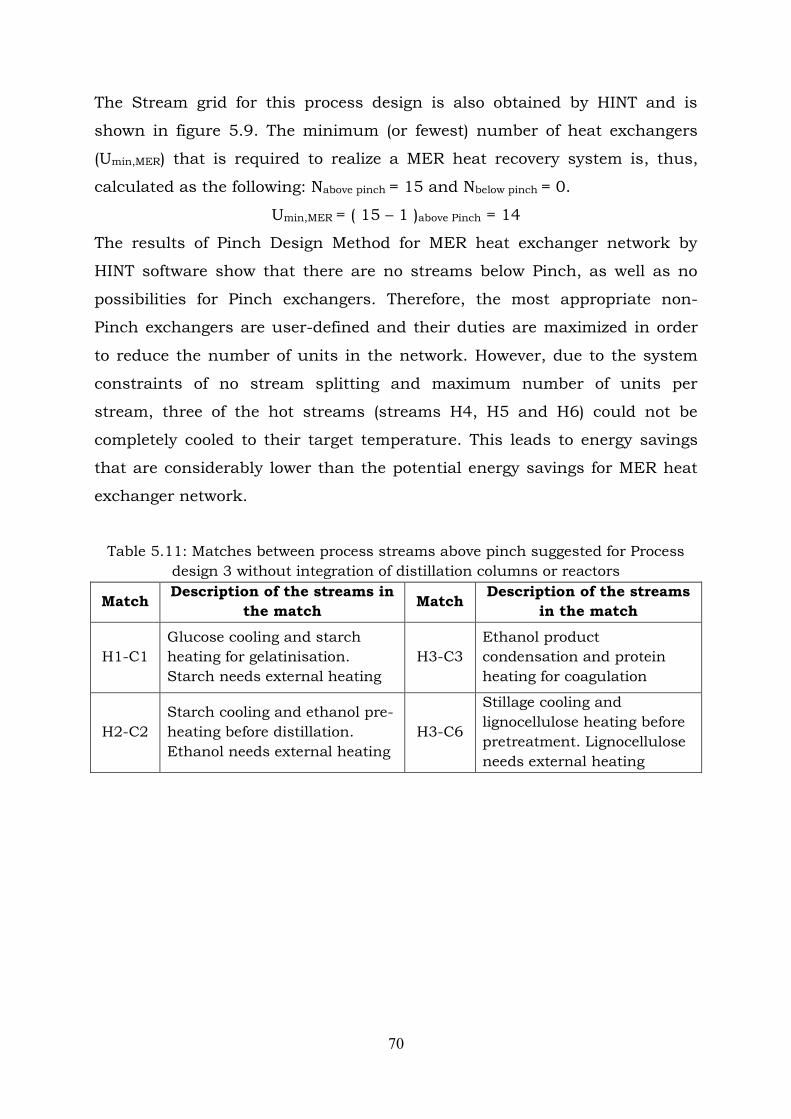
70
The Stream grid for this process design is also obtained by HINT and is
shown in figure 5.9. The minimum (or fewest) number of heat exchangers
(Umin,MER) that is required to realize a MER heat recovery system is, thus,
calculated as the following: Nabove pinch = 15 and Nbelow pinch = 0.
Umin,MER = ( 15 – 1 )above Pinch = 14
The results of Pinch Design Method for MER heat exchanger network by
HINT software show that there are no streams below Pinch, as well as no
possibilities for Pinch exchangers. Therefore, the most appropriate non-
Pinch exchangers are user-defined and their duties are maximized in order
to reduce the number of units in the network. However, due to the system
constraints of no stream splitting and maximum number of units per
stream, three of the hot streams (streams H4, H5 and H6) could not be
completely cooled to their target temperature. This leads to energy savings
that are considerably lower than the potential energy savings for MER heat
exchanger network.
Table 5.11: Matches between process streams above pinch suggested for Process
design 3 without integration of distillation columns or reactors
Match Description of the streams in
the match Match
Description of the streams
in the match
H1-C1
Glucose cooling and starch
heating for gelatinisation.
Starch needs external heating
H3-C3
Ethanol product
condensation and protein
heating for coagulation
H2-C2
Starch cooling and ethanol pre-
heating before distillation.
Ethanol needs external heating
H3-C6
Stillage cooling and
lignocellulose heating before
pretreatment. Lignocellulose
needs external heating
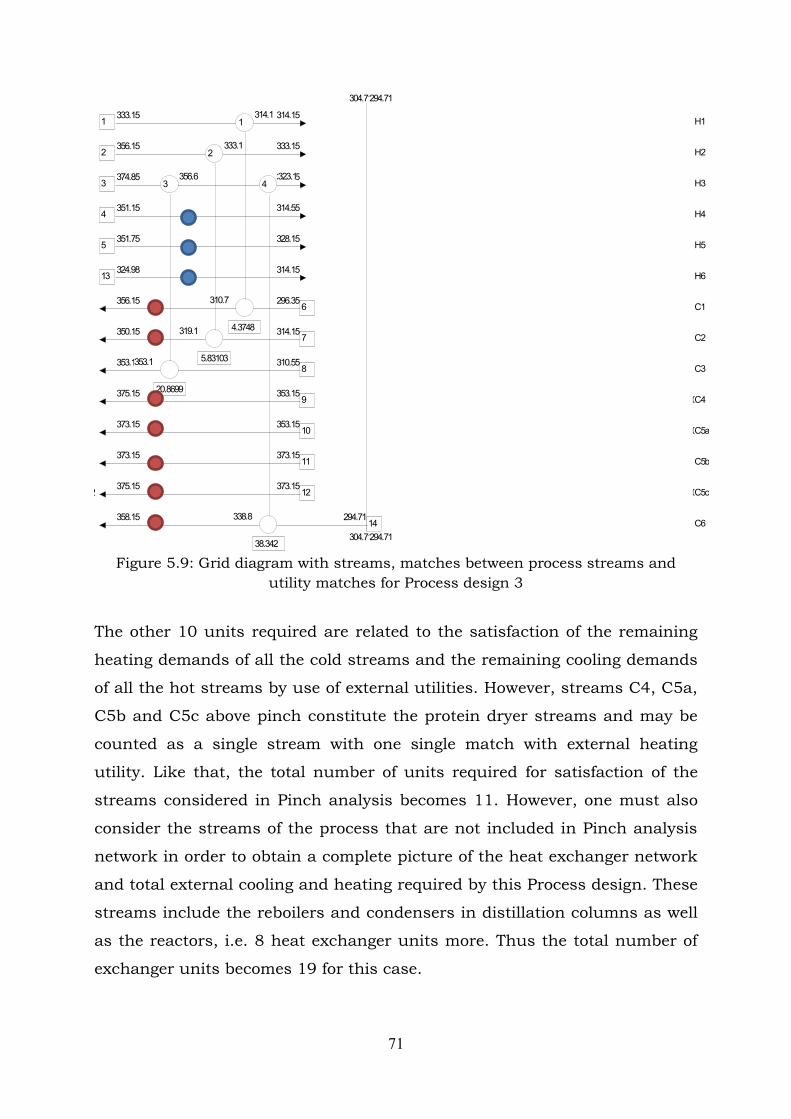
71
Figure 5.9: Grid diagram with streams, matches between process streams and
utility matches for Process design 3
The other 10 units required are related to the satisfaction of the remaining
heating demands of all the cold streams and the remaining cooling demands
of all the hot streams by use of external utilities. However, streams C4, C5a,
C5b and C5c above pinch constitute the protein dryer streams and may be
counted as a single stream with one single match with external heating
utility. Like that, the total number of units required for satisfaction of the
streams considered in Pinch analysis becomes 11. However, one must also
consider the streams of the process that are not included in Pinch analysis
network in order to obtain a complete picture of the heat exchanger network
and total external cooling and heating required by this Process design. These
streams include the reboilers and condensers in distillation columns as well
as the reactors, i.e. 8 heat exchanger units more. Thus the total number of
exchanger units becomes 19 for this case.
1-4.3748 0.230253 H1333.15 314.15
2-5.83103 0.253523 H2356.15 333.15
3-59.261 1.14625 H3374.85 323.15
4-16.3916 0.447858 H4351.15 314.55
5-24.0329 1.01834 H5351.75 328.15
13-12.0295 1.11076 H6324.98 314.15
618.1761 0.303948 C1296.35356.15
742.3618 1.17672 C2314.15350.15
820.8699 0.489904 C3310.55353.15
90.48045 2.18386e-002C4353.15375.15
101.12609 5.63045e-002C5a353.15373.15
1130.5258 - C5b373.15373.15
125.08316e-002 2.54158e-002C5c373.15375.15
1455.1386 0.869146 C6294.71358.15
304.71
304.71
294.71
294.71
1
4.3748
314.1
310.7
2
5.83103
333.1
319.1
3
20.8699
356.6
353.1
4
38.342
323.1
338.8
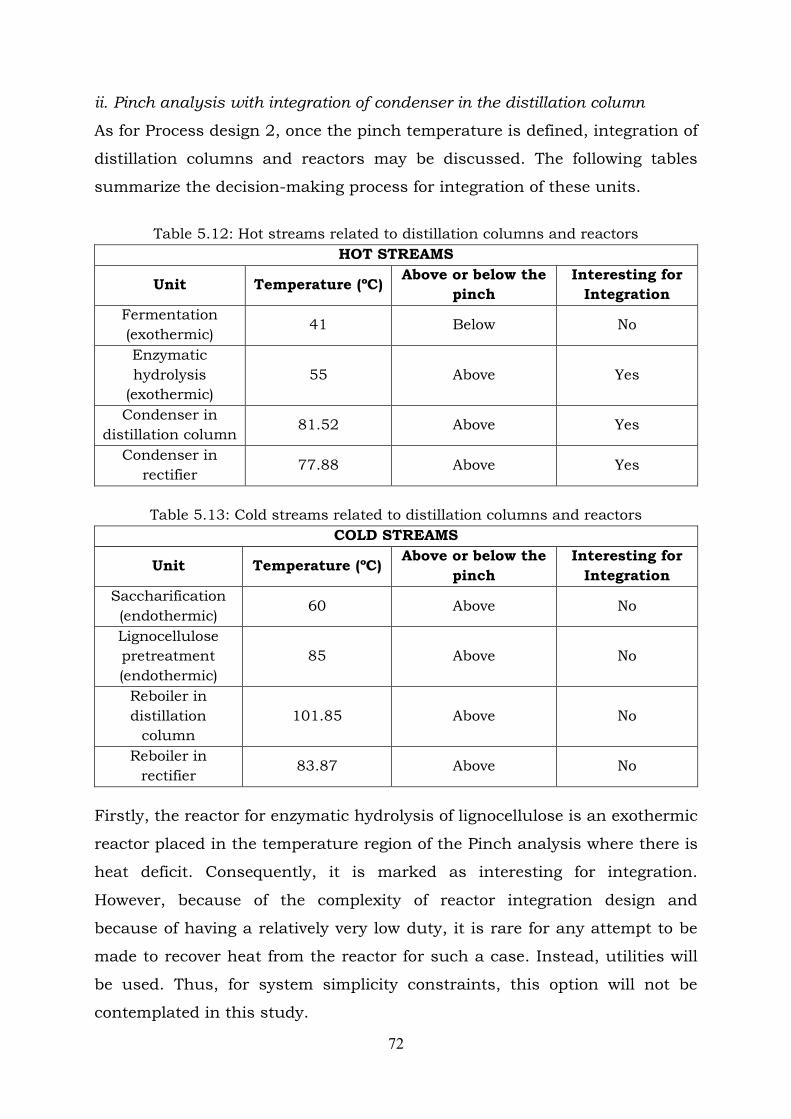
72
ii. Pinch analysis with integration of condenser in the distillation column
As for Process design 2, once the pinch temperature is defined, integration of
distillation columns and reactors may be discussed. The following tables
summarize the decision-making process for integration of these units.
Table 5.12: Hot streams related to distillation columns and reactors
HOT STREAMS
Unit Temperature (ºC) Above or below the
pinch
Interesting for
Integration
Fermentation
(exothermic) 41 Below No
Enzymatic
hydrolysis
(exothermic)
55 Above Yes
Condenser in
distillation column 81.52 Above Yes
Condenser in
rectifier 77.88 Above Yes
Table 5.13: Cold streams related to distillation columns and reactors
COLD STREAMS
Unit Temperature (ºC) Above or below the
pinch
Interesting for
Integration
Saccharification
(endothermic) 60 Above No
Lignocellulose
pretreatment
(endothermic)
85 Above No
Reboiler in
distillation
column
101.85 Above No
Reboiler in
rectifier 83.87 Above No
Firstly, the reactor for enzymatic hydrolysis of lignocellulose is an exothermic
reactor placed in the temperature region of the Pinch analysis where there is
heat deficit. Consequently, it is marked as interesting for integration.
However, because of the complexity of reactor integration design and
because of having a relatively very low duty, it is rare for any attempt to be
made to recover heat from the reactor for such a case. Instead, utilities will
be used. Thus, for system simplicity constraints, this option will not be
contemplated in this study.

73
On the other hand, both condensers also operate above pinch, thus their
integration in pinch analysis may be of interest since there is heat deficit in
that region. The reboilers also lie above pinch, consequently being the
columns not placed across the pinch.
As discussed for pinch analysis of Process design 2, integration of the
condenser is limited by one of the constraints to achieving its complete
cooling by using only one cold stream. This measure is adopted for design
simplicity purposes. According to that, a cold stream with a heat duty equal
or higher than the duty of the condenser is the only possibility for a match
with this unit of the distillation column. As occurred already for Process
design 2, the duties of both condensers are higher than any other duty
among the cold streams in the system. For this reason, integration of
distillation columns in this system does not seem a feasible improvement
according to the constraints in the present plant design.
As a conclusion, the heat exchanger network proposed without
integration of distillation columns shows to be the most appropriate for
energy recovery in Process design 3.
Table 5.15 presents the required number of heat exchangers for the
proposed HEN, as well as the proportion of the actual energy savings
obtained by the proposed HEN compared to the potential energy savings in
MER network design.
Table 5.14: Summary of key figures of proposed heat exchanger network for Process
design 3
Proportion of actual energy savings obtained by the proposed
HEN compared to the potential energy savings in MER network 70.08%
Number of matches between process streams 4
Total number of heat exchanger units 19

74
Chapter 6
Process Economics Results on the total cost and revenues of each of the three Process designs in
this study would lead to the ability to perform a trade-off between dextrose
and starch-derived ethanol, and a trade-off between briquettes and
lignocellulose-derived ethanol. According to the available information at the
time of this study, a simplified economic assessment is performed in line
with the results from the accomplished mass and energy balances.
6.1 Comments on Results from Simulations
As already stated in Sub-section 1.3 “Goal of this study”, the results on mass
balances by Aspen Plus are kept outside this report due to their
confidentiality.
The following list aims to give a vision of the accomplished calculations
and interesting results obtained by simulations on Aspen Plus in this study,
even though the figures are not shown in this version of the report:
1) Product mass output of protein concentrate and its composition – same
for Process design 1, 2 and 3.
2) Product mass output of briquettes and their composition for Process
design 1 and 2.
3) Product mass output of dextrose/sugar and its composition/purity for
Process design 1.
4) Product mass output of starch-derived ethanol and its purity for Process
design 2.
5) Product mass output of starch- and lignocellulose-derived ethanol and its
purity for Process design 3.
6) Product mass output of stillage from the distillation columns and their
composition for Process design 2 and 3.
7) Heating and cooling requirements for each Process design.

75
All these results were used for the economic assessment, although only the
scheme followed to do this evaluation is shown in this chapter provided that
the results are confidential.
6.2 Economic Assessment
The total cost of the proposed Process designs has two main elements:
capital cost and production & operating costs. The capital cost is determined
partly by the plant design, equipment chosen, and installation cost. On the
other hand, production & operating costs are associated with the day-to-day
operation of the plant. Important production & operating costs are, for
example, from raw materials and utilities.
By performing mass and energy balances on Aspen Plus, detailed
information is provided for the production & operating expenses. However,
enough information on capital cost was not available at the moment of this
study and, thus, only the available production & operating costs are
analysed. The lack of data due to the early phase of PoE project hinders this
study on the ability to analyse the project for net profitability. The trade-off
between the different products is hence performed by comparing the
products revenues only with some of the production & operating expenses.
In general terms, the major factors affecting plant production & operating
costs for the plants in the present study are the following fixed and variable
costs: feedstock, labour, energy, enzymes, yeast, chemicals (e.g. nitric acid
for lignocellulose pretreatment, anti-foaming chemicals, or chemicals for pH
control), waste handling charges, and fixed charges (i.e. depreciation,
licenses, maintenance, taxes and insurance). All these factors lead to the
evidence that the costs of this type of biorefineries on a small scale can be
extremely variable. A profitable operation requires a complete understanding
of each of the variables affecting operating costs and the ability to keep these
costs to a minimum. Furthermore, the ability to profitably sell or use the
products is required as well (Gildred/Butterfield Limited Partnership, 1984).
Raw material quantities used and wastes produced were determined
using the Aspen mass and energy balance model. Table 6.1 presents the

76
costs of some of these items used for the economic assessment. In agreement
with the accessible data, only the following variable costs are estimated:
biomass feedstock, enzymes, yeast and organisms, and heating demand
(electricity and cooling demands are a minor cost compared to heating
demand).
Table 6.1: Variable Operating Costs for purchased items
Biomass feedstock 0.1369 €/kg DM ensilage
Enzymes (glucoamylase, alpha-amylase) 0.00735 €/L ethanol
Cellulase enzyme 0.021 €/L cellulosic ethanol
Yeast (S. Cerevisiae) 0.00209 €/L ethanol
Co-fermentation Organism (Z. Mobilis) 0.005461 €/L ethanol
Ensilage price is obtained from the report of the Proceedings of Forage
Conference 2014, published by the Swedish University of Agricultural
Sciences (Sveriges lantbruksuniversitet. Institutionen för
växtproduktionsekologi, 2014). They based this figure on the prevailing
prices in Sweden at the end of February 2013. Amylase enzyme and yeast
costs for starch processing are obtained from a study by U.S. NREL
(McAloon et al., 2000) which, in turn, got the costs from an industry source.
The cost for the recombinant organism Z. mobilis is obtained from the same
study, even if NREL assumes that the organism is grown on site, which was
not included in the present study. It is thus recommended that better
approximations are done for this cost in future studies by PoE. As for
cellulase enzyme, its cost is also obtained from a study by NREL (Aden et al.,
2002), which based this cost on purchased, delivered enzyme. All prices were
converted to Euro for practical purposes.
As for the heating utilities, the briquettes may be considered to be used
as a potential fuel source to meet the plant's own energy requirements.
However, their direct sale as fuel to other industrial users or electricity
generating companies is also attractive. As a consequence, two financial
scenarios to evaluate the performance of the plant depending on the heating
fuel are performed. In other words, the two scenarios represent a trade-off

77
between selling the briquettes and using them as fuel for the own plant’s
heating demand.
Firstly, it will be assumed that the steam is generated by an industrial
boiler run by wood chips with 70% efficiency (based on the assumptions for
full load efficiency and continuous operation (Lantbrukarnas Riksförbund,
2011; International Energy Agency, 2010)). Secondly, the combination of
self-produced briquettes and purchased wood chips will be considered for
Process designs 1 and 2. In this second case, it is assumed that the installed
wood chip boiler can also burn briquettes. Furthermore, it is also assumed
that there is an improvement in the boiler efficiency due to the incorporation
of briquettes, thus the boiler efficiency is set to 75%. Finally, for Process
design 3 it is assumed that there is only one possible scenario where
purchased wood chips are the unique fuel. Table 6.2 presents the cost of
wood chips for purchase in the Swedish market, and the price of briquettes
in the same market - at which the self-produced briquettes may be sold.
Table 6.2: Current cost in Sweden of the fuels considered for steam generation
Wood chips Briquettes (self-produced)
Cost/Price per unit of energy 0.02033 €/kWh* 0.02907 €/kWh*
*Source: Sveriges Officiella Statistik (2014)
An estimation of the revenues from sales of the obtained products is also
accomplished. Like that, another outcome of the economic assessment is the
share of sales revenues by each product depending on the Process design,
which will help PoE in managing market aspects for commercialization of the
PoE technology. In this case, the eventual sales of the by-product fertiliser
are not included due to lack of available data.
Table 6.3: Revenues Variable Operating Costs
Ethanol 0.6867 €/L ethanol
Protein concentrate 0.63826 €/ kg protein concentrate
Briquettes 0.13081 €/kg briquettes
Dextrose/sugar 0.3947 €/kg white sugar
Ethanol price is obtained from Börjesson et al. (2013). Protein concentrate
price is obtained from the same source as ensilage cost (Sveriges
lantbruksuniversitet. Institutionen för växtproduktionsekologi, 2014).
78
Briquettes price per unit of mass is calculated by using the Higher Heating
Value (HHV) of briquettes (i.e. 4.5 kWh/kg) (Kalmarenergi AB, 2014) and the
briquettes cost presented in Table 6.2. The source for sugar price is obtained
from the European commission Portal (European Commission, 2014).
6.2.1 Process design 1
As Pinch analysis of Process design 1 is not performed for this study,
calculations on gross profit for this process design are accomplished by
making the assumption of no plant heat integration. Like that, the
comparison of sales revenues with production & operating costs assumes the
complete fulfilment of the plant’s heating load by the on-site boiler (which
burns different type of fuels depending on the scenario). The total heating
demand of Process design 1 is obtained from the energy balances previously
performed on Aspen Plus.
i. Biomass Heating System using Wood Chips
In these calculations, it is assumed that briquettes production is fully used
for sales whereas wood chips are the fuel used to meet the heating
requirements of the plant. In order to calculate the annual energy that must
be delivered by wood chips, the annual total external heating required by the
plant is divided by the boiler efficiency, i.e. 70% Once the need for wood
chips fuel purchase (the amount of kWh per year) is defined, the total
variable costs of the plant for Process design 1 are calculated by multiplying
the individual costs of biomass feedstock, enzymes and wood chips by their
annual demand. As for revenues calculation, the individual selling price of
each product (i.e. dextrose, protein concentrate and briquettes) is multiplied
by their annual production. Finally, by comparing the sales revenues with
the annual production & operating costs, a first estimation of the gross profit
of the plant is obtained.
ii. Biomass Heating System using Wood Chips and Briquettes
In this case, it is assumed that briquettes production is completely used on-
site for steam generation in the plant, by burning in a 75%-efficient boiler. In

79
order to calculate the remaining heating demand to be covered by wood
chips, the following steps are followed:
1) The useful heat provided by briquettes is obtained by multiplying the
annual production of briquettes by the boiler efficiency, i.e. 0.75.
2) The resulting figure for the useful heat provided by briquettes is
subtracted to the total external heating required by the plant.
3) This remaining energy must be provided by the wood chips, thus this
value is divided by 0.75 in order to get the annual required heating that
must be contained in purchased wood chips.
With these calculations, the share of heating requirements that could be met
by burning briquettes could also be provided as interesting informastion to
PoE. Once the need for wood chips fuel purchase has been defined, the total
variable costs of the plant for Process design 1 are calculated. The only
difference with the previous case is the purchase of wood chips. On the other
hand, in this case the revenues include only revenues from the products
dextrose and protein concentrate. Finally, by comparing the sales revenues
with the annual production & operating costs, a first estimation of the gross
profit of the plant is obtained.
As a result, for Process design 1 the simulations and the
aforementioned calculations on economic assessment clearly point to one of
the scenarios as more economically feasible. However, this information is
kept as confidential.
6.2.2 Process design 2
i. Biomass Heating System using Wood Chips
Calculations on the need for wood chips purchase are the same for this
scenario as for the case of considering that briquettes are sold in Process
design 1. Data on external heating demand required by the plant is obtained
from Pinch analysis on Chapter 5. Once the need for wood chips fuel
purchase has been defined, the total variable costs of the plant for Process
design 2 are calculated. In this case, apart from biomass feedstock and
enzymes, yeast is also added in the annual costs. The revenues of the
product outputs for Process design 2 if briquettes are sold include ethanol,

80
protein concentrate and briquettes sales. Finally, by comparing the sales
revenues with the annual production & operating costs, a first estimation of
the gross profit of the plant is obtained.
ii. Biomass Heating System using Wood Chips and Briquettes
The same steps for calculations on the need for wood chips purchase are
followed for this scenario as for the case of considering that briquettes are
burned on-site in Process design 1. Once the need for wood chips fuel
purchase has been defined, the total variable costs of the plant for Process
design 2 are calculated. The only difference with the scenario above is the
purchase of wood chips. In this case, the revenues include only revenues
from the products ethanol and protein concentrate. By comparing the sales
revenues with the annual production & operating costs, a first estimation of
the gross profit of the plant is obtained. For Process design 2, the
simulations and the aforementioned calculations on economic assessment
point to one of the two scenarios as more economically feasible.
Furthermore, in terms of comparing Process design 1 and 2, the calculations
provide information on which alternative is more economically feasible, thus
on the trade-off between producing sugar or ethanol from the starch fraction.
6.2.3 Process design 3
In these calculations, burning wood chips fuel is considered as the only
alternative to meet the heating demand of the plant. Thus, same calculations
are done to find the need for wood chips purchase, and the total variable
costs of the plant for Process design 3 are calculated. In this design, the
variable costs include biomass feedstock, amylase enzymes, cellulose
enzyme, fermenting organism Z. Mobilis, and wood chips. The annual
revenues include sales of ethanol and protein concentrate.
As a conclusion of the results in Chapter 6, the alternative with the
highest annual gross profit by only considering the available annual
production & operating costs is obtained.
81
Chapter 7
Discussion
The purpose of this work was to create a model for each of the PoE plant
configurations that calculates mass and energy balances and operates safely
in Aspen Plus simulations, together with performing a heat integration
analysis to observe the potential heat savings by exchanging heat between
process streams.
When starting this work, the assignment was relatively open and there
were not many restrictions in what should and should not be included in the
model. Consequently, there was a lot of freedom to focus on the parts of
interest. Because of the "commercial context" in which this thesis was
performed, it was obvious from the beginning that a significant focus would
be put on obtaining reliable data on the product mass flow outputs of the
plant and on the energy use.
The first decision to take was on how to approach the plant-level
modelling, since one may choose between a theoretical and an empirical
approach. A theoretical approach will try to construct the model according to
the laws of nature, by developing mass and energy balances for each process
area, including detailed chemistry and physics for each unit. In an empirical
model, on the other hand, available empirical data (i.e. inputs and outputs of
individual process areas) is used to fit a regression equation or system of
equations in each process area, and then all areas are linked to describe an
entire plant (National Research Council of the National Academies, 2005). At
the beginning, the intention was to use both the aforementioned approaches
so that the model would be based on both theory and data.
First, examples of process units that were modelled with the theoretical
approach are distillation columns or evaporators and dryers. However, as the
work progressed, it became obvious that the data needed to use the
empirical approach with some other units was in some cases not available,
and neither was available the required detailed chemistry and physics for
those same cases. Thus, the solution found was to fit empirical data from
other studies found in the literature. These studies treated a similar

82
feedstock and had the same goal as the unit operations in the present
model. Examples of it are starch-protein separation in the decanter by
means of adding the so-called “transfer solution”, and protein skimming by
mechanical means.
The main effect of the lack of available data is that validating the model
has been difficult. Thus, focus has instead been put on constructing a user-
friendly model that operates in a robust way. It should, however, be stated
that the model is in need of a thorough validation. Fortunately, such a
validation is actually the next step in the plans on Peas on Earth project.
PoE is planning to empirically validate the yields of the technology by
collaborating with an existing testing facility for production of pilot
quantities of new bioproducts. Therefore, the simulations in this study are
valuable for PoE, since they allow knowing which process steps are critical in
terms of product yield validation and where to put the strongest optimization
efforts.
As for the heat integration analysis, results were also revealing since two
of the heat exchangers in the proposed HEN had already been proposed by
PoE before this study, although no detailed heat transfer analysis had been
done until the moment. The present work revealed that further heating was
required in order to warm the 2 cold streams in heat exchangers H1-C1 and
H2-C2 up to target temperatures, since the corresponding hot streams did
not have enough heat load. Moreover, new feasible matches between hot and
cold streams were proposed in this study.
The economic assessment in Chapter 6 did not have a significant
importance due to the lack of information on capital cost investment.
Nevertheless, information on the shares of revenues income by each product
was interesting in order to do a first rough evaluation of the trade-offs
between starch-derived ethanol and dextrose, and between briquettes and
lignocellulose-derived ethanol. But in any case, these trade-offs will only be
completely reliable if capital costs are considered as well.
Hence, due to all the discussion presented in this chapter, it is
recommended that this work is expanded by PoE to the areas that follow.

83
First, the collection in a testing facility of empirical data on the outputs of
the most critical unit operations is recommended, i.e. on starch-protein
separation in a decanter (while defining also if it will be a decanter by gravity
or centrifuge), protein skimming by mechanical means, and lignocellulose-
to-ethanol conversion.
Second, narrowing the Product Design Specifications according to real
potential customers’ requirements has been observed as key factor for more
reliable simulations.
Third, specifications for each piece of equipment together with process
equipment costing should be defined, in order to develop purchased
equipment and installation costs. Equipment costs may be obtained from
vendor quotations when possible, especially for uncommon equipment such
as pretreatment reactors. NREL, for example, developed its own process
engineering equipment database both for ethanol production from corn and
from lignocellulose (Aden et al., 2002), with detailed specifications of design
and cost estimation, thus this database could be used as a good first source
for equipment specifications. Once the equipment costs are obtained,
overhead and contingency factors may be applied to determine a total plant
investment cost. That cost, along with the plant operating costs (mostly
considered in this work with some exceptions, e.g. water consumption,
cooling or electricity consumption) may be used in a discounted cash flow
analysis to determine the production costs, using a set discount rate (Aden
et al., 2002).
Fourth, effects of technical development on the energy demand may be
examined. For example, in case of including ethanol production from
lignocellulose, “Simultaneous saccharification and fermentation” may lead to
better yields for ethanol production than the simulated “Separate hydrolysis
and fermentation”, as many studies on lignocellulosic ethanol have shown
(Balat, 2011). Another example may be a new design consisting of an
integrated distillation column with a fermentor, which could decrease the
ethanol content in the fermentor stream and increase the ethanol content in
inlet column stream. The new design would reduce the ethanol inhibition to

84
yeast growth and save energy demand in the distillation section (Mei, 2006).
These new designs could also be modelled on Aspen Plus.
Fifth, inclusion of wastewater treatment and combustor-boiler system in
Aspen Plus simulations should be considered to have a complete view for
plant integration purposes, as well as the recovery of valuable compounds
from the residues of the plant.
Finally, it is also recommended to perform a study on the available
renewable fuels that could be used for heating purposes depending on plant
location, and on the environmental performance of the products from the
present biorefinery with conventional products.

85
Chapter 8
Conclusions This thesis has been performed in collaboration with Renetech AB, which
has engaged in the development of the system aspect of Peas on Earth
technology. Renetech was interested in obtaining detailed calculations on the
product mass outputs, energy use, and opportunitites for heat integration of
the PoE technology. The aim of the thesis was therefore to provide Renetech
with this desired information. This was accomplished by building and
describing a simulation model that calculates mass and energy balances of
the overall biorefinery process on the simulation software Aspen Plus®. The
simulated process converts the three fractions obtained from the ensilaged
legumes into a variety of products, such as bioethanol fuel, protein for
feed/food grades, dextrose to be sold as sweetener, and briquettes fuel,
depending on the chosen plant configuration.
At the beginning of the work, the not-experienced user behavior resulted
in time consuming problems with the simulations. But these problems were
overcome after some time by learning from the committed errors. The
resulting model constructed on Aspen Plus has demonstrated to be a robust
tool for simulation and evaluation of complex processes like those involved in
ethanol production, leading to thorough mass balances of every plant
configuration. However, the lack of available empirical data on some specific
unit operations (e.g. starch-protein separation in a decanter and protein
skimming) was a significant drawback against obtaining a more correct and
near-reality simulation of the operation units. Nevertheless, results on mass
balances should be useful as information for economic evaluations, but also
for comparison of the environmental performance of the products from the
biorefinery with conventional products.
The model provides a considerably realistic basis for energy demand
estimation and for economic analysis. The economic assessment gave results
of the gross profit of each plant configuration, since information on capital
cost was not available at the moment of this study. Also, one of the
questions answered in this work was how much share of the heating
86
requirements could be met by burning the lignocellulosic residues of the
plant previosuly converted to briquettes. Moreover, a comparison of two
scenarios for briquettes handling was done, that is, a scenario where
briquettes are burned in the on-site boiler and a scenario where they are
sold instead. The simulations and calculations on economic assessment
clearly pointed to one of the alternatives as more economically feasible,
among the three Process designs. Like that, a first trade-off could be done
between sugar and ethanol from starch, and between briquettes and
lignocellulose-derived ethanol.
Another outcome of the economic assessment in this study is the share
of sales revenues by each product depending on the Process design, which
will help PoE in managing market aspects for commercialization of the
technology.
As for the energy balances by Aspen Plus, they showed that (for the cases
where ethanol production is considered) condensers in the distillation
columns are among the most energy-intensive hot streams and require most
of the cooling load of the plant. Also, due to the vast mass flow of the stream
entering distillation when lignocellulose-derived ethanol is also produced,
the cooling demand of the stillage from the bottoms of the first distillation
column is very high. On the other hand, the plant in general requires more
heating than cooling load. Again, distillation columns represent some of the
highest heating demands in their reboilers, together with the protein
concentration dryer and (in case of lignocellulose-derived ethanol
production) the heating of lignocellulose up to pretreatment temperature.
According to the results of these energy balances, a Pinch analysis was
done with help of HINT software, which showed the opportunities for heat
integration in the process. It must be remarked that this analysis involved
many constraints in order to maintain the plant simplicity that PoE planned
to include as an attractive feature of their technology. Consequently, the
constraints lead to lower energy savings compared to the potential savings
obtained when performing a pure Pinch analysis, i.e. results suggested that
only 83% of the actual potential energy savings could be obtained by
implementing the proposed HEN for Process design 2 (with 4 matches

87
between process streams), and a 70% of the potential energy savings could
be obtained for Process design 3. Both cases involved no heat integration of
the distillation columns even if this case was evaluated since they act as
main energy consumers, due to the complexity that this heat integration
would involve. PoE had already planned some heat exchanger matches
before this study, and the present work revealed new feasible matches
between hot and cold streams that would act as a measure for saving further
energy in the plant. These suggestions will be considered when developing
more in detail the PoE technology.
As a final conclusion, the main challenges encountered during the work
were connected with the initial gathering of data to be input in the
simulation. Aspen Plus requires a vast quantity of parameters and properties
of all components to make the overall designs in the study
thermodynamically rigorous, thus finding them in the literature while there
is no empirical part in the thesis work became a time-consuming task.
Another difficulty in simulating the plant was in the assumptions to be made
in the separation units due to lack of information on the specific separation
techniques that PoE was planning to apply. For all these reasons, a further
study on simulations of the plant is recommended, but only after having
obtained more extense empirical data of the outcomes of the processes that
this exact feedstock goes through in the proposed biorefinery.
88
References
Aden, A., Ruth, M., Ibsen, K., Jechura, J., Neeves, K., Sheehan, J., Wallace, B., Montague,
L., Slayton, A. & Lukas J. (2002) Lignocellulosic Biomass to Ethanol Process Design and
Economics Utilizing Co-Current Dilute Acid Prehydrolysis and Enzymatic Hydrolysis for Corn Stover. National Renewable Energy Laboratory Report.
Andersen, M., & Kiel, P. (2000) Integrated utilisation of green biomass in the green biorefinery. Industrial Crops and Products. 11 (2). p. 129-137.
Askar, A. (1986) Faba beans (Vicia faba L.) and their role in the human diet. Food and nutrition bulletin (USA).
Aspen Plus. (2003) Aspen Plus user guide. Cambridge, MA: Aspen Technology Limited.
Baks, T. (2007) Process development for gelatinisation and enzymatic hydrolysis of starch at
high concentrations. PhD Thesis. Wageningen Universiteit.
Balat, M. (2011) Production of bioethanol from lignocellulosic materials via the biochemical pathway: A review. Energy conversion and management. 52 (2). p. 858-875.
Bals, B. D., Dale, B. E., Balan, V., Bergeron, C., Carrier, D. J., & Ramaswamy, S. (2012) Recovery of Leaf Protein for Animal Feed and High‐Value Uses. In: Biorefinery Co-Products: Phytochemicals, Primary Metabolites and Value-Added Biomass Processing. p. 179-197.
Biss, R., and Cogan, U. (1988) The significance of insoluble protein solubilization in corn steeping. Cereal Chem. 65. p. 281-284.
Borglum, G. B., (1980) Starch Hydrolysis for Ethanol Production, Miles Laboratories, Inc.
Elkhart, Indiana. p. 264-269.
Börjesson, P., Lundgren, J., Ahlgren, S., & Nyström, I. (2013) Dagens och framtidens
hållbara biodrivmedel: Underlagsrapport från f3 till utredningen om Fossil Fri Fordonstrafik. The Swedish Knowledge Centre for Renewable Transportation Fuels.
Bösch, P., Schausberger, P., Beckmann, G., Jelemensky, K., & Friedl, A. (2008) Example of optimisation and heat integration on a basis of ethanol plants. Strojnicky Casopis.
Chaplin, M. F., & Bucke, C. (1990) Enzyme technology. Cambridge: Cambridge University
Press. Chen, C. (2007) Process Integration for Efficient Use of Energy. Department of Chemical
Engineering. National Taiwan University.
Cherubini, F. (2010) The biorefinery concept: using biomass instead of oil for producing energy and chemicals. Energy Conversion and Management. 51 (7). p. 1412-1421.
Crépon, K., Marget, P., Peyronnet, C., Carrouée, B., Arese, P., & Duc, G. (2010) Nutritional value of faba bean (Vicia faba L.) seeds for feed and food. Field crops research. 115 (3). p.
329-339.
Dale, B. E., Allen, M. S., Laser, M., & Lynd L. R. (2009). Protein feeds coproduction in biomass conversion to fuels and chemicals. Biofuels, bioproducts and biorefining. 3 (2). p.
219-230.
Dahlström, J., Eskilsson, K., Gredegård, S., Molander, C. & Wejdemar, K. (2011) Jordbruksverkets foderkontroll 2010. Jönköping: Jordbruksverket.

89
Dunn J.B., Mueller S., Wang M. & Han J. (2012) Energy consumption and greenhouse gas
emissions from enzyme and yeast manufacture for corn and cellulosic ethanol production. Biotechnol Lett. 34 (12). p. 2259-2263.
Easy Energy Systems. (2012) Ethanol Process Overview. [Online] Available from:
http://www.easyenergysystems.com/HowItWorks/EthanolProcessOverview.[Accessed: 20th
September 2014].
Emami, S., Tabil, L. G., Tyler, R. T., & Crerar, W. J. (2007) Starch–protein separation from chickpea flour using a hydrocyclone. Journal of food engineering. 82 (4). p. 460-465.
Ensminger, M. E., & Olentine, C. G. (1978) Feeds and nutrition, Ensminger Publishing,
Clovis.
Escribano, M. R., Santalla, M., & De Ron, A. M. (1997) Genetic diversity in pod and seed quality traits of common bean populations from northwestern Spain. Euphytica. 93 (1). p.
71-81.
European Commission (2014). Agriculture and rural development. Sugar. [Online] Available
from: http://ec.europa.eu/agriculture/sugar/index_en.htm. [Accessed: 11th November
2014]. European Union. Committee on Agriculture and Rural Development. (2013) The environmental role of protein crops in the new common agricultural policy. Brussels: Policy
Department B: Structural and cohesion policies (IP/B/AGRI/IC/2012-067).
Faulks, R. M., & Bailey, A. L. (1990). Digestion of cooked starches from different food sources by porcine α-amylase. Food chemistry. 36 (3). p. 191-203.
Fearnside, P. M. (2001) Soybean cultivation as a threat to the environment in Brazil. Environmental Conservation. 28 (01). p. 23-38.
Franceschin, G. (2010) Bioethanol: A contribution to bridge the gap between first and
second generation processes. PhD Thesis. Università degli Studi di Padova.
García, A., Egüés, I., Sánchez, C., Barta, Z., & Labidi, J. (2013) Study of Different Bio-Processing Pathways in a Lignocellulosic Biorefinery by Process Simulation. CHEMICAL ENGINEERING, 35.
Gausman, H. W., Ramser, J. H., Dungan, G. H., Earle, F. R., MacMasters, M. M., Hall, H. H., and Baird, P. D. (1952) Some effects of artificial drying of corn grain. Plant Physiol. 27. p.
794-802.
Gildred/Butterfield Limited Partnership. (1984) Farm-scale ethanol fuel production plant.
Design Report. The Gildred/Butterfield Fuel Alcohol Plant. [Online] Available from:
http://journeytoforever.org/biofuel_library/Butterfield/butterfield1.html. [Accessed: 25th August 2014].
Godfray, H. C. J., Beddington, J. R., Crute, I. R., Haddad, L., Lawrence, D., Muir, J. F. & Toulmin, C. (2010) Food security: the challenge of feeding 9 billion people. Science. 327
(5967). p. 812-818.
Grover, P. D., & Mishra, S. K. (1996) Biomass briquetting: technology and practices. Food
and Agriculture Organization of the United Nations.
Gundersen, T. (2000) Pinch Analysis for Continuous Processes. Nordic Energy Research.
Process Integration.
90
Hahn-Hägerdal, B., Galbe, M., Gorwa-Grauslund, M. F., Lidén, G., & Zacchi, G. (2006) Bio-ethanol–the fuel of tomorrow from the residues of today. Trends in biotechnology. 24 (12). p.
549-556. Hobbs, L. (2009) Sweeteners from starch: production, properties and uses. Starch: Chemistry and Technology. 3rd Ed. London: Academic Press, Elsevier. p. 797-832.
International Energy Agency (2010) Industrial Combustion Boilers. IEA ETSAP - Technology
Brief I01.
Jensen, E. S., Peoples, M. B., & Hauggaard-Nielsen, H. (2010) Faba bean in cropping systems. Field Crops Research. 115 (3). p. 203-216.
Kadam, K.L., Wooley, R., Aden, A., Nguyen , Q. A., Yancey , M.A., & Ferraro, F.M.(2000)
Softwood forest thinnings as a biomass source for ethanol production: A feasibility study for California. Biotechnology Progress. 16. p. 947-957.
Kalmarenergi AB (2014). Briketter. [Online] Available from:
http://kalmarenergi.se/Foretag/kundcenter/briketter. [Accessed: 11th November 2014].
Karlsson, H., Ahlgren, S., Hansson, P.A., & Strid, I. (2014) Åkerböna som råvara för bioraffinaderier- en studie av klimatpåverkan. Uppsala: Sveriges lantbruksuniversitet.
Institutionen för energi och teknik.
Katzen, R., Madson, P. W. & Moon Jr, G. D. (1997) Ethanol distillation: the fundamentals. The Alcohol Textbook. p. 269-299.
Kelly, N. (2007) Ethanol Benchmarking and Best Practices. The Production Process and Potential for Improvement. St. Paul, MN: Minnesota Technical Assistance Program and
Minnesota Pollution Control Agency.
King, S. et al. (1999) Acetone Heat Exchanger Design. [Online] Available from:
http://www.owlnet.rice.edu/~ceng403/gr3499/project.html. [Accessed: 11th September
2014].
Knauf, M. & Kraus, K. (2006) Specific yeasts developed for modern ethanol production. Sugar Ind. 131. p. 753–758.
Kohnhorst, A. L., Smith, D. M., Uebersax, M. A., & Bennink, M. R. (1991) Production and characterization of a protein concentrate from navy beans (Phaseolus vulgaris). Food chemistry. 41 (1). p. 33-42.
Lantbrukarnas Riksförbund. (2011) Närvärme med gemensam fliseldad värmecentral. [Online]. Available from: www.bioenergiportalen.se/biblioteket/närvärme.[Accessed: 20th
November 2014].
Lee, H. J., Shanks, R. A., & Small, D. M. (2005) The application of differential scanning calorimetry to a study of gelatinisation of commercial mung bean starch. Cereals 2005.
Lindeboom, N. (2005) Studies on the characterization, biosynthesis and isolation of starch and protein from quinoa (Chenopodium quinoa Willd). PhD Thesis. University of
Saskatchewan.
March, L. (1998) Introduction to pinch technology. England: Targeting House, Gadbrook Park.
Martin, A., & Mato, F. A. (2008) Hint: An educational software for heat exchanger network design with the pinch method. Education for Chemical Engineers. 3(1). p. e6-e14.

91
Mateos-Aparicio, I., Redondo-Cuenca, A., Villanueva-Suárez, M. J., Zapata-Revilla, M. A., &
Tenorio-Sanz, M. D. (2010) Pea pod, broad bean pod and okara, potential sources of functional compounds. LWT-Food Science and Technology. 43 (9). p. 1467-1470.
McAloon, A., Taylor, F., Yee, W., Ibsen, K., & Wooley, R. (2000) Determining the cost of producing ethanol from corn starch and lignocellulosic feedstocks. National Renewable Energy Laboratory Report.
McMichael, A. J., Powles, J. W., Butler, C. D., & Uauy, R. (2007) Food, livestock production, energy, climate change, and health. The lancet. 370 (9594). p. 1253-1263.
Mei, F. (2006) Mass and energy balance for a corn-to-ethanol plant. PhD Thesis. Washington
University.
der Merwe, V., & Blignault, A. (2010) Evaluation of different process designs for biobutanol production from sugarcane molasses. PhD Thesis. Stellenbosch University.
National Research Council of the National Academies. (2005) Interim Report of the Committee on Changes in New Source Review Programs for Stationary Sources of Air Pollutants.
Washington: the National Academies Press.
Nguyen, Q.A., & Saddler, J.N. (1991) An integrated model for technical and economic evaluation of an enzymatic biomass conversion process. Bioresource Technology. 35. p. 275-
282.
Nichols, N. N., Sutivisedsak, N., Dien, B. S., Biswas, A., Lesch, W. C., & Cotta, M. A. (2011) Conversion of starch from dry common beans (Phaseolus vulgaris L.) to ethanol. Industrial
Crops and Products. 33 (2011). p. 644-647.
Quintero, J. A. & Cardona, C. A. (2011) Process simulation of fuel ethanol production from lignocellulosics using Aspen Plus. Ind. Eng. Chem. Res. 50 (10). p. 6205–6212.
Sassner, P., Galbe, M., & Zacchi, G. (2008) Techno-economic evaluation of bioetanol production from three different lignocellulosic materials. Biomass and Bioenergy. 32. p. 422-
430.
Shah, R. K., Subbarao, E. C., & Mashelkar, R. A. (1988). Heat transfer equipment design.
USA: CRC Press.
Singh, I., Riley, R., & Seillier, D. (1997) Using pinch technology to optimize evaporator and vapor bleed configuration at the Malelane Mill. Proceedings of the South African Sugar Technological Association. 71. p. 207-216.
Smith, R. M. (2005) Chemical process: design and integration. Hoboken, NJ: John Wiley &
Sons.
Steinke, J. D., and Johnson, L. A. (1991) Steeping maize in the presence of multiple enzymes. I. Static batchwise steeping. Cereal Chem. 68. p. 7-12.
Sveriges lantbruksuniversitet. Institutionen för växtproduktionsekologi. (2014) Vallkonferens 2014. Konferensrapport. Uppsala: Organisationskommittén för Vallkonferens 2014.
Sveriges Officiella Statistik. (2014) Trädbränsle- och torvpriser. Nr 4. SCB, Enheten för
energi- och transportstatistik.
Taherzadeh, M. J., & Karimi, K. (2008) Pretreatment of lignocellulosic wastes to improve ethanol and biogas production: a review. International journal of molecular sciences. 9 (9). p.
1621-1651.
92
The Open University. (2001) T881 Manufacture Materials Design: Block 1: The design activity
model. p. 10. United Kingdom: Milton Keynes. The Open University.
Tojo, S., & Hirasawa, T. (2013) Research Approaches to Sustainable Biomass Systems. San
Diego: Elsevier Science Publishing Co Inc.
Tyler, R. T., Youngs, C. G., & Sosulski, F. W. (1981) Air classification of legumes [beans,
lentils, peas]. I. Separation efficiency, yield, and composition of the starch and protein fractions. Cereal Chemistry (USA).
Vander Griend, D. L. (2007) U.S. Patent No. 7,297,236. Washington, DC: U.S. Patent and
Trademark Office.
Vose, J. R., Basterrechea, M. J., Gorin, P. A. J., Finlayson, A. J., & Youngs, C. G. (1976) Air
classification of field peas and horsebean flours: chemical studies of starch and protein fractions. Cereal Chem. 53. p. 928-936.
Wang, N. S. (2008) Experiment No. 4 Cellulose Degradation. Department of Chemical &
Biomolecular Engineering. University of Maryland College Park.
Wingren, A., Galbe, M. and Zacchi, G. (2003a) Techno-economic evaluation of producing
ethanol from softwood: comparison of SSF and SHF and identification of bottlenecks, Biotechnology Progress. 19. p. 1109-1117.
Wingren, A., Galbe, M., Roslander, C., Rudolf, A., & Zacchi, G. (2005) Effect of reduction in
yeast and enzyme concentrations in a simultaneous-saccharification and fermentation based bioethanol process. Applied Biochemistry and Biotechnology. 121-124. p.485-499.
Wingren, A., Söderström, J., Galbe, M. and Zacchi, G. (2003b) Process considerations and
economic evaluation of two-step steam pretreatment for production of fuel etanol from softwood. Biotechnology Progress. 20. p. 1421-1429.
Wooley, R. J., & Putsche, V. (1996) Development of an ASPEN PLUS physical property database for biofuels components (p. 38). Golden, CO: National Renewable Energy
Laboratory.
Wooley, R. J., Ruth, M., Sheehan, J., Ibsen, K., Majdeski, H. and Galvez, A. (1999) Lignocellulosic biomass to ethanol process design and economics utilizing co-current dilute acid prehydrolysis and enzymatic hydrolysis current and futuristic scenarios. National Renewable Energy Laboratory Report.
Youssef, M. M., Abd El-Aal, M. H., Shekib, L. A., & Ziena, H. M. (1987) Effects of dehulling, soaking and germination on chemical composition, mineral elements and protein patterns of faba beans (Vicia faba L.). Food chemistry. 23 (2). p. 129-138.
Zhanbin, C. (2011) Normal temperature briquetting technology for biomass with original moisture content. In: International Conference on Bioenergy Utilization and Environment
Protection–6th LAMNET Conference, Dalian, China. Zhang, M., Eddy, C., Deanda, K., Finkelstein, M., & Picataggio, S. (1995) Metabolic engineering of a pentose metabolism pathway in ethanologenic Zymomonas mobilis. Science.
267 (5195). p. 240-243.

93
APPENDIX A – Parameters and thermodynamic properties for Aspen Plus The parameters and thermodynamic properties of the compounds that were
not readily available on Aspen Plus were obtained from a database developed
by NREL, which is specificalized in biochemical processes. This database is
called ASPEN PLUS INHSPCD, i.e. In-house Pure Component Database
(Wooley & Putsche, 1996).
Compound name Formula in Aspen Plus Normal
state
Starch C6H10O5 Solid
Protein CH0.1097O5.0594N0.3662S0.00278 Solid
Protsol (solubilized protein) CH0.1097O5.0594N0.3662S0.00278 Liquid
Fiber C6H10O5 Solid
Ash CaO Solid
Oil C18H34O2 Liquid
Water H2O Liquid
Solunkn C0.5HO0.5 Liquid
Glucose C6H12O6 Liquid
Ethanol C2H6O-2 Liquid
Carbon dioxide CO2 Gas
Cellullose C6H10O5 Solid
Hemicellullose C5H8O4 Solid
Xylose CH10O5 Liquid
Lignin C10H13.9O1.3 Solid
Lignsol (solubilized lignin) C10H13.9O1.3 Liquid
Furfural C5H4O2 Liquid
HMF C6H6O3 Liquid
Xylitol C0.5HO0.5 Liquid
Table A1: Formulas for components used in the simulations, from Aspen Plus INHSPCD (NREL Biofuels) Databank

94
Assumptions for the simulations (same assumptions as the ones taken by
McAloon et al. (2000)):
Starch is considered to be a solid throughout the process and will never
be in solution. Additionally, starch is a polymer, but its molecular weight
formula will be taken as the repeat unit only.
Glucose, although generally considered a solid at the temperatures
involved in the ethanol process, is exclusively in aqueous solution. It will
therefore be modeled as a liquid, although it will never exist as a pure
liquid in the process.
Protein is considered as completely dissolved, i.e. exclusively in aqueous
solution. Therefore, it will be modeled as a liquid except for the streams
after the coagulation tank.
Solunkn is an unknown compound. It was given a reduced formula of
xylose for material balances purpose only.
Liquid component
MW Tc (ºC) Pc (atm) DHFORM (cal/mol)
RKTZRA (cum/kmol)
Vc (cum/kmol)
Glucose 180.16 737.95 61.18924 -300407.02 0.35852 -
ProtSol 98.28 737.95 61.189 -182827.75 0.09908 0.4165
Oil 282.46 507.85 13.718 -1.52e+5 0.2377 -
Water 18.0152 373.98 217.666 -57756.28 0.243172 -
Ethanol 46.06 240.77 60.676 -56116.84 0.248507 -
CO2 44.00 31.06 72.86 -93988.24 0.2727 -
Solunkn 15.01 737.95 61.18924 -28441.68 0.09404 0.4165
Xylose 150.13 617.27 64.91685 -248570.74 0.29936 0.3425
LignSol 122.49 737.95 61.18924 -4.69e+5 0.35852 0.4165
HMF 126.11 457.86 51.6734 -77340.45 0.1982 0.3425
Xylitol 152.15 737.95 61.1892 -28422.66 0.09404 0.4165
Table A2: Values for liquid components in Aspen Plus INHSPCD Databank
Values for parameters to define PLXANT, CPIG and DHVLWT on the software
were also obtained from NREL’s INHSPCD Databank although they are not
displayed in this Appendix.
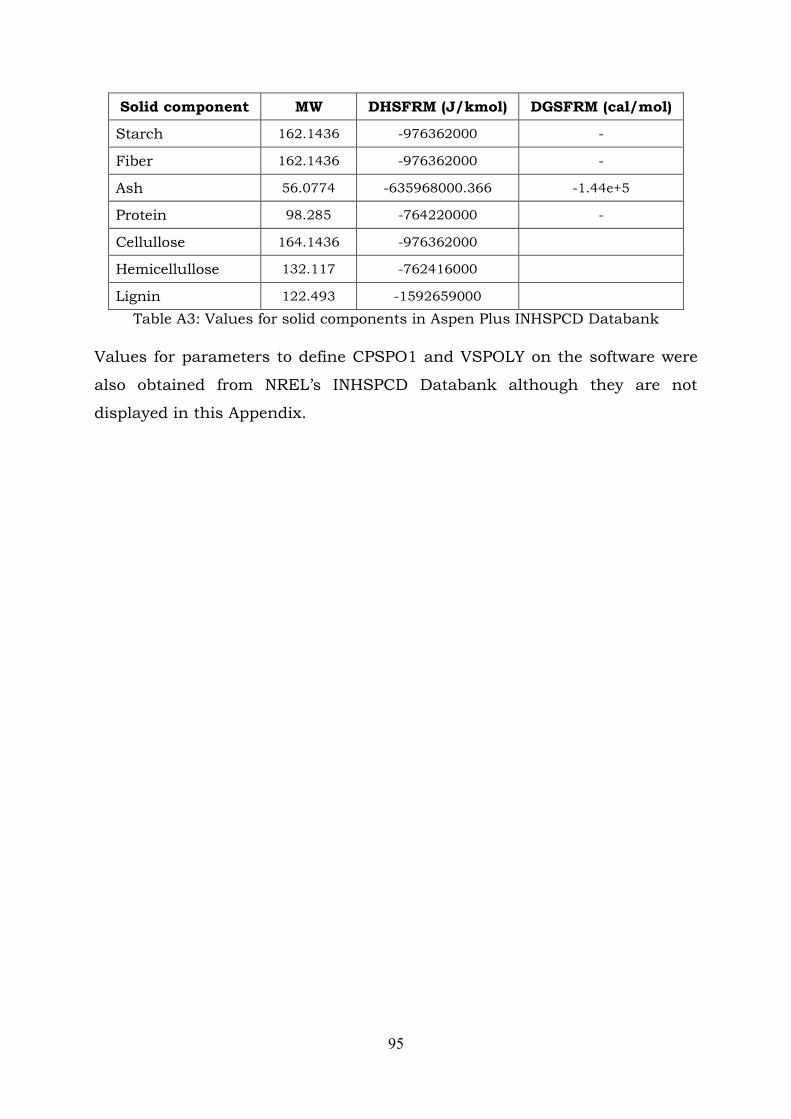
95
Solid component MW DHSFRM (J/kmol) DGSFRM (cal/mol)
Starch 162.1436 -976362000 -
Fiber 162.1436 -976362000 -
Ash 56.0774 -635968000.366 -1.44e+5
Protein 98.285 -764220000 -
Cellullose 164.1436 -976362000
Hemicellullose 132.117 -762416000
Lignin 122.493 -1592659000
Table A3: Values for solid components in Aspen Plus INHSPCD Databank
Values for parameters to define CPSPO1 and VSPOLY on the software were
also obtained from NREL’s INHSPCD Databank although they are not
displayed in this Appendix.
96
Appendix B – Material balances prior to simulation by Aspen Plus
According to the lab analyses of the sample, both moisture and protein
contents of the biomass after ensiling are the following: 56% of moisture and
23.1% of protein on a dry basis. All the pieces of data obtained by lab
analayses that are interesting for the material balances prior to simulations
are listed as following:
Annual input: 3500 tonnes DM biomass/year
44% of DM in input biomass
23.1% of DM in biomass is Protein
12.6% of DM in stalks is Protein
73.4% of DM in extract is Protein
25.7% of DM in beans is Protein
As for the moisture content in both the stalks and the extract fraction,
reasonable assumptions are required due to lack of data:
40% of moisture in stalks fraction. Same assumption as in previous
study by SLU on PoE lifecycle analysis (Karlsson et al., 2014).
6% of DM in the liquid extract fraction (Andersen & Kiel, 2000).
In order to calculate the mass flows of each of the three fractions obtained
from the wet thresher, a further assumption is required:
A 53.98% of DM in biomass follows the beans fraction - data for Faba
bean by Jensen et al. (2010).
The goal of the calculations on material balances is to obtain the moisture
content of the bean fraction, as well as the three mass flow rates entering the
plant, i.e. mass flow rates of bean fraction, stalks fraction and liquid extract
fraction. The annual wet biomass input is 7954.54 tonnes biomass/year. If
the operating hours per year are 8400h, then the annual wet biomass input
is 946.07 kg/h. The mass balances are the following:
1) Total mass balance:
2) Mass balance on moisture content:
( )

97
3) Mass balance on “fraction of dry biomass following beans fraction”:
( )
4) Protein mass balance:
( )
Where = mass flow of Stalks fraction (kg/h); = mass flow of liquid
Extract fraction (kg/h); = mass flow of Beans fraction (kg/h); and
= moisture content of Beans fraction (decimal fraction).
The results of this equations system with 4 equations and 4 unknown
variables are:
The result for beans moisture is close to typical moisture contents present in
other studies (See example in Escribano et al. (1997)).