TABLE OF CONTENTS 13. POPULATION AND …Prevent the use of forced labour and child labour in project...
35
J339 – OMAS ESIA Page 1 of 35 TABLE OF CONTENTS 13. POPULATION AND SOCIETY....................................................................................................... 2 13.1 INTRODUCTION ......................................................................................................................... 2 13.1.1 Objectives ...................................................................................................................... 2 13.2 SUMMARY POLICY CONTEXT ..................................................................................................... 2 13.2.1 International Standards ................................................................................................. 2 13.2.2 International Conventions and Treaties ........................................................................ 3 13.2.3 European Directives ...................................................................................................... 4 13.2.4 Turkish Legislation......................................................................................................... 6 13.2.5 Project Standards .......................................................................................................... 8 13.3 SCOPE AND ASSESSMENT METHODOLOGY ................................................................................ 8 13.3.1 Spatial Scope ................................................................................................................ 8 13.3.2 Temporal Scope .......................................................................................................... 11 13.3.3 Assessment Methodology ........................................................................................... 11 13.3.4 Limitations ................................................................................................................... 12 13.4 BASELINE............................................................................................................................... 12 13.4.1 Introduction .................................................................................................................. 12 13.4.2 Population and Growth ................................................................................................ 12 13.4.3 Age and Gender .......................................................................................................... 19 13.4.4 Urban and Rural Population & Population Movements ............................................... 21 13.4.5 Ethnicity, Religion and Languages .............................................................................. 23 13.4.6 Vulnerable Groups....................................................................................................... 25 13.4.7 Formal Social Governance Structure .......................................................................... 26 13.4.8 Political overview ......................................................................................................... 27 13.4.9 Informal Governance ................................................................................................... 27 13.4.10 Social Cohesion........................................................................................................... 29 13.5 IMPACT ASSESSMENT ............................................................................................................. 30 13.5.1 Construction, Operations and Closure Phase Impacts and Mitigation Measures ....... 30 13.5.2 Summary of Impacts and Mitigation Measures ........................................................... 33 13.6 MONITORING REQUIREMENTS ................................................................................................. 35 Figures Figure 13-1: Social Study Area................................................................................................................ 9 Figure 13-2: Tangible Cultural Heritage Survey Location ..................................................................... 10 Figure 13-3: National Population and Population Rate (1927 – 2014) ................................................. 13 Figure 13-4: Percentage of aged population (2008 – 2012) ................................................................. 13 Figure 13-5: National Birth rate (births/1,000 population) ..................................................................... 14 Figure 13-6: Population density (Number of people per km2) .............................................................. 15 Figure 13-7: Population Growth of Kayseri Province ............................................................................ 16 Figure 13-8: Comparison of Population Increase Rates of Turkey and Kayseri, (%) ........................... 17 Figure 13-9: Population Growth of Develi District ................................................................................. 17 Figure 13-10: Population Distribution of Turkey by Age and Gender ................................................... 19 Figure 13-11: Population Distribution of Kayseri by Age and Gender .................................................. 20 Figure 13-12: Population Distribution of Develi by Age and Gender .................................................... 21 Tables Table 13-1: Rural and Urban Population Distribution of Turkey (2014) ................................................ 12 Table 13-2: Total Fertility Rate, Child Mortality, Contraceptive use and female education (1993 – 2008) ............................................................................................................................................................... 14 Table 13-3: Population Indicators of Turkey.......................................................................................... 15 Table 13-4: Population in neighbourhoods in the study area, ............................................................... 18 Table 13-5: General Election Results .................................................................................................... 27 Table 13-6: General Election Results Kayseri....................................................................................... 27 Table 13-7: General Election Results Develii ........................................................................................ 27 Table 13-8: List of Organisations Communicated Most Frequently by Neighbourhood ....................... 28 Table 13-9: Summary of Impacts and Mitigation Measures .................................................................. 34 Table 13-10: Population and Society Monitoring Requirements ........................................................... 35
Transcript of TABLE OF CONTENTS 13. POPULATION AND …Prevent the use of forced labour and child labour in project...
J339 – OMAS ESIA Page 1 of 35
TABLE OF CONTENTS
13. POPULATION AND SOCIETY ....................................................................................................... 2
13.1 INTRODUCTION ......................................................................................................................... 2 13.1.1 Objectives ...................................................................................................................... 2
13.2 SUMMARY POLICY CONTEXT ..................................................................................................... 2 13.2.1 International Standards ................................................................................................. 2 13.2.2 International Conventions and Treaties ........................................................................ 3 13.2.3 European Directives ...................................................................................................... 4 13.2.4 Turkish Legislation......................................................................................................... 6 13.2.5 Project Standards .......................................................................................................... 8
13.3 SCOPE AND ASSESSMENT METHODOLOGY ................................................................................ 8 13.3.1 Spatial Scope ................................................................................................................ 8 13.3.2 Temporal Scope .......................................................................................................... 11 13.3.3 Assessment Methodology ........................................................................................... 11 13.3.4 Limitations ................................................................................................................... 12
13.4 BASELINE ............................................................................................................................... 12 13.4.1 Introduction .................................................................................................................. 12 13.4.2 Population and Growth ................................................................................................ 12 13.4.3 Age and Gender .......................................................................................................... 19 13.4.4 Urban and Rural Population & Population Movements ............................................... 21 13.4.5 Ethnicity, Religion and Languages .............................................................................. 23 13.4.6 Vulnerable Groups....................................................................................................... 25 13.4.7 Formal Social Governance Structure .......................................................................... 26 13.4.8 Political overview ......................................................................................................... 27 13.4.9 Informal Governance ................................................................................................... 27 13.4.10 Social Cohesion ........................................................................................................... 29
13.5 IMPACT ASSESSMENT ............................................................................................................. 30 13.5.1 Construction, Operations and Closure Phase Impacts and Mitigation Measures ....... 30 13.5.2 Summary of Impacts and Mitigation Measures ........................................................... 33
13.6 MONITORING REQUIREMENTS ................................................................................................. 35
Figures
Figure 13-1: Social Study Area................................................................................................................ 9 Figure 13-2: Tangible Cultural Heritage Survey Location ..................................................................... 10 Figure 13-3: National Population and Population Rate (1927 – 2014) ................................................. 13 Figure 13-4: Percentage of aged population (2008 – 2012) ................................................................. 13 Figure 13-5: National Birth rate (births/1,000 population) ..................................................................... 14 Figure 13-6: Population density (Number of people per km2) .............................................................. 15 Figure 13-7: Population Growth of Kayseri Province ............................................................................ 16 Figure 13-8: Comparison of Population Increase Rates of Turkey and Kayseri, (%) ........................... 17 Figure 13-9: Population Growth of Develi District ................................................................................. 17 Figure 13-10: Population Distribution of Turkey by Age and Gender ................................................... 19 Figure 13-11: Population Distribution of Kayseri by Age and Gender .................................................. 20 Figure 13-12: Population Distribution of Develi by Age and Gender .................................................... 21
Tables
Table 13-1: Rural and Urban Population Distribution of Turkey (2014) ................................................ 12 Table 13-2: Total Fertility Rate, Child Mortality, Contraceptive use and female education (1993 – 2008) ............................................................................................................................................................... 14 Table 13-3: Population Indicators of Turkey .......................................................................................... 15 Table 13-4: Population in neighbourhoods in the study area, ............................................................... 18 Table 13-5: General Election Results .................................................................................................... 27 Table 13-6: General Election Results Kayseri....................................................................................... 27 Table 13-7: General Election Results Develii ........................................................................................ 27 Table 13-8: List of Organisations Communicated Most Frequently by Neighbourhood ....................... 28 Table 13-9: Summary of Impacts and Mitigation Measures .................................................................. 34 Table 13-10: Population and Society Monitoring Requirements ........................................................... 35
J339 – OMAS ESIA Page 2 of 35
13. Population and Society
13.1 Introduction
This chapter of the ESIA is the first socio-economic section and therefore provides a summary of the
policy context, as well as the scope and assessment methodology for all social sections. This information
is presented one time in this chapter, but is applicable to all social chapters.
The chapter provides population and demographic data for Turkey, Kayseri Province, Develi District and
the neighbourhoods located in the social study area. The Chapter presents key population measures
including total population and growth, age composition and gender balance, ethnicity, literacy and
migration trends.
The impact assessment then presents an assessment of the predicted impacts associated with
population dynamics during the construction, operation, and decommissioning phases of the Project.
This may include Project-induced in-migration from direct or indirect jobseekers, or induced in-migration
for those seeking work or economic opportunities in support of those engaged in the Project, or Project-
induced out-migration from the social study area.
13.1.1 Objectives
The specific objectives of this population dynamics impact assessment are to:
Describe baseline demographics in Turkey, Kayseri Province, Develi District and neighbourhoods
in the social study area;
Identify the potential positive and negative impacts of Project including assessing the potential for
Project-induced in- or out-migration;
Develop attainable mitigation measures to enhance positive impacts and reduce or avoid negative
impacts;
Develop management and monitoring measures to be implemented throughout the life of the project.
13.2 Summary Policy Context
13.2.1 International Standards
Guidance on the approach to environmental and social assessment for EBRD-funded projects is
provided by PR1, which establishes the importance of integrated assessment to identify the
environmental and social impacts and issues associated with projects and the management of
environmental and social performance throughout the life of the project, through an Environmental and
Social Management System (ESMS).
Guidance on the approach to labour and working conditions for EBRD-funded Projects is provided in
PR2, which establishes the need for treating workers fairly and providing them with safe and healthy
working conditions, such that Projects may create tangible benefits, such as enhanced efficiency and
productivity of their operations. The objectives of this PR are to:
Respect and protect workers’ rights;
Promote fair treatment, non-discrimination and equal opportunities of workers;
Establish, maintain and improve a sound worker-management relationship;
Promote compliance with any collective agreements, national labour and employment laws;
Protect and promote the safety and health of workers, and safe and healthy working conditions;
Prevent the use of forced labour and child labour in project activities.

J339 – OMAS ESIA Page 3 of 35
PR4 recognises the importance of avoiding or mitigating adverse health and safety impacts and issues
associated with project activities on workers, project-affected communities and consumers. It
recognises that project activities may increase potential community exposure to health and safety risks
and impacts including those associated with construction, operations and decommissioning, or of
transport of raw and finished materials.
The objectives of PR4 are:
To protect and promote the safety and health of workers, by ensuring safe and healthy working
conditions and implementing a health and safety management system, appropriate to the relevant
issues and risks associated with the project;
To anticipate, assess, and prevent or minimise adverse impacts on the health and safety of project-
affected communities and consumers during the project life cycle from both routine and non-routine
circumstances.
Guidance on land acquisition, resettlement and economic displacement for EBRD funded projects is
provided by PR5, which states that involuntary resettlement refers both to physical displacement
(relocation or loss of shelter) and economic displacement (loss of assets or resources, and/or loss of
access to assets or resources that leads to loss of income sources or means of livelihood) as a result
of project-related land acquisition and/or restrictions on land use.
The objectives of PR5 are to:
Avoid or, when unavoidable, minimise, involuntary resettlement by exploring alternative project
designs; mitigate adverse social and economic impacts from land acquisition or restrictions on
affected persons’ use of and access to assets and land by:
- Providing compensation for loss of assets at replacement cost;
- Ensuring that resettlement activities are implemented with appropriate disclosure of information,
consultation and the informed participation of those affected.
Restore or, where possible, improve the livelihoods and standards of living of displaced persons to
pre-displacement levels.
Improve living conditions among physically displaced persons through the provision of adequate
housing, including security of tenure at resettlement sites.
The approach to information disclosure and stakeholder engagement for EBRD-funded projects is
provided by PR10, which applies to all projects that are likely to have adverse environmental and social
impacts and issues on the environment, workers or the local communities directly affected by the project.
PR’s 1 and 10 are complimentary and are considered together.
Guidance on the protection of archaeological remains for EBRD-funded projects is provided by
Performance Requirement 8. PR8 defines cultural property as sites having archaeological,
palaeontological, historical, religious and unique natural values. EBRD’s policy is to assist in the
preservation of cultural properties and to seek to avoid their removal or damage.
Performance Requirement 8 recognises the importance of cultural heritage for present and future
generations with the aim of protecting cultural heritage and to avoid or mitigate adverse impacts on
cultural heritage in the course of operations. The EBRD expects projects to take a precautionary
approach to their management and sustainable use of cultural heritage.
Both tangible and intangible cultural heritage are important assets for economic and social development
and are an integral part of the continuity of cultural identity and practices (including traditional skills,
knowledge, beliefs and/or minor dialects and languages).
13.2.2 International Conventions and Treaties
In relation to the socio-economic aspects of the ESIA, relevant international conventions are relevant
primarily to aspects of labour and working conditions and cultural heritage.
J339 – OMAS ESIA Page 4 of 35
PR2 on Labour and Working Conditions is based on the eight core conventions of the International
Labour Organisation, all of which are ratified and in force in Turkey:
C029 - Forced Labour Convention, 1930 (No. 29)
C087 - Freedom of Association and Protection of the Right to Organise Convention, 1948 (No. 87)
C098 - Right to Organise and Collective Bargaining Convention, 1949 (No. 98)
C100 - Equal Remuneration Convention, 1951 (No. 100)
C105 - Abolition of Forced Labour Convention, 1957 (No. 105)
C111 - Discrimination (Employment and Occupation) Convention, 1958 (No. 111)
C138 - Minimum Age Convention, 1973 (No. 138)
C182 - Worst Forms of Child Labour Convention, 1999 (No. 182)
In addition, the list below is a summary list of other relevant ILO conventions ratified by Turkey is as
follows:
Labour Clauses (Public Contracts) Convention, 1949
Protection of Wages Convention, 1949
Social Security (Minimum Standards) Convention, 1952
Abolition of Forced Labour Convention, 1957
Equality of Treatment (Social Security Convention, 1962
Workers' Representatives Convention, 1971
Human Resources Development Convention, 1975
Tripartite Consultation (International Labour Standards) Convention, 1976
Occupational Safety and Health Convention, 1981
Termination of Employment Convention, 1982
Occupational Health Services Convention, 1985
Safety and Health in Construction Convention, 1988
Safety and Health in Mines Convention, 1995
Promotional Framework for Occupational Safety and Health Convention, 2006
In relation to cultural heritage, Turkey is a signatory to the Convention Concerning the Protection of the
World Cultural and Natural Heritage which recognises that the duty of ensuring the identification,
protection, conservation, presentation and transmission to future generations of the cultural and natural
heritage situated within its territory, belongs primarily to the State.
Turkey also became party to the UNESCO Convention for the Safeguarding of Intangible Cultural
Heritage in 2006, which is aimed at safeguarding the uses, representations, expressions, knowledge
and techniques that communities, groups and, in some cases, individuals, recognised as an integral
part of their cultural heritage. Turkey has 10 elements registered on the UNESCO List of Intangible
Cultural Heritage in Need of Urgent Safeguarding, which is composed of intangible heritage elements
that concerned communities and States Parties consider require urgent measures to keep them alive.
13.2.3 European Directives
The EBRD is committed to promoting the European Union’s environmental requirements and is a
signatory of the European Principles for the Environment. The requirements for environmental and
social impact assessment at an EU level as set out in the EU Environmental Impact Assessment

J339 – OMAS ESIA Page 5 of 35
Directive (85/337/EEC, as amended). Article 3 of the most recent amendment (2014/52/EU) explicitly
includes “population and human health” within the scope of an ESIA.
Occupational Health and Safety
EU Directives relevant to OHS aspect of the mine and are outlined below.
Directive 89/654/EEC on Workplace Requirements, Concerning the Minimum Safety and Health
Requirements for the Workplace (first individual directive within the meaning of Article 16 (1) of
Directive 89/391/EEC).
Directive 2003/10/EC on the Minimum Health and Safety Requirements Regarding the Exposure of
Workers to the Risks Arising from Physical Agents (Noise).
Directive 1989/391/EEC on the Introduction of Measures to Encourage Improvements in the Safety
and Health of Workers at Work.
Directive 92/104/EEC – OHS in mineral-extracting industries.
Directive 92/91/EEC – OHS in drilling in mineral-extracting industries.
Directive 3002/105/EC and 96/61/EC on Control of Major Accident Hazards Involving Dangerous
Substances (Seveso II Directive).
Directive 2002/15/EC, European Road Transport Working Time Directive.
Cultural Heritage
Archaeology and cultural heritage within Europe are governed by two main EU Conventions:
The European Convention on the Protection of the Archaeological Heritage (Revised), 1992. The aim
of this (revised) Convention is to protect the archaeological heritage as a source of the European
collective memory and as an instrument for historical and scientific study, including:
the preservation and study of archaeological heritage remains and objects and any other traces of
mankind from past epochs of which help to retrace the history of mankind and its relation with the
natural environment;
archaeological heritage for which excavations or discoveries and other methods of research into
mankind and the related environment are the main sources of information.
The archaeological heritage shall include structures, constructions, groups of buildings, developed sites,
moveable objects, monuments of other kinds as well as their context, whether situated on land or under
water.
The Council of Europe Framework Convention on the Value of Cultural Heritage for Society (2011),
which aims to:
Recognise that rights relating to cultural heritage are inherent in the right to participate in cultural
life, as defined in the Universal Declaration of Human Rights;
Recognise individual and collective responsibility towards cultural heritage;
Emphasise that the conservation of cultural heritage and its sustainable use have human
development and quality of life as their goal;
Take the necessary steps to apply the provisions of this Convention concerning:
- the role of cultural heritage in the construction of a peaceful and democratic society, and in the
processes of sustainable development and the promotion of cultural diversity;
- greater synergy of competencies among all the public, institutional and private actors concerned.
Directive 2014/52/EU of the European Parliament and of the Council of 16 April 2014 (amending
Directive 2011/92/EU) on the assessment of the effects of certain public and private projects on the
environment ensures that environmental impacts on cultural heritage are identified, described and
assessed for both direct and indirect significant effects of a project.
J339 – OMAS ESIA Page 6 of 35
The Directive promotes the protection of cultural heritage of certain urban historical sites and landscapes
as outlined in:
European Convention for the Protection of the Archaeological Heritage of 6 May 1969.
Convention for the Protection of the Architectural Heritage of Europe of 3 October 1985.
European Landscape Convention of 20 October 2000.
Framework Convention on the Value of Cultural Heritage for Society of 27 October 2005.
The Directive also outlines the importance to address the visual impact of projects, namely the change
in the appearance or view of the built or natural landscape and urban areas, in environmental impact
assessments.
13.2.4 Turkish Legislation
The Turkish regulation for EIA studies includes the requirement for social baseline studies, it does not
however require social impact assessment studies.
Occupational Health and Safety
All OHS issues are implemented in line with the Occupational Health and Safety Law (Law No: 6331,
Date of Enactment: 20/06/2012).
Labour Law
The Labour Law (Act. No. 4857) regulates the individual employment relations between an employer
and an employee. The law covers both the employment contract of blue and white collar employees,
but excludes public service employees.
The Labour Law also covers requirements related to the employment of people with disabilities, ex-
convicts and victims of terror.
Turkish Environmental, Health and Safety Standards
A number of health and safety standards are in place in Turkey to directly protect the workforce in, and
indirectly protect communities from, hazardous industries, including:
Regulation for Manual Handling Operations in Workplaces
Regulation on Health and Safety Measures in Working with Chemicals
Regulation on Personal Protective Equipment
Health and Safety Regulation for Mining Works
Regulation on Health and Safety Signs
Regulation on Dust Control
Regulation on Occupational Health and Safety in Construction Works
Regulation on the Protection of Workers from Noise Related Risks
Regulation on Protection of Workers from the Risks of Explosive Atmospheres
Regulation on the Protection of Workers from Vibration Related Risks
Regulation on Procedures and Principles of Occupational Health and Safety Training of Workers
Regulation on Health and Safety Restrictions of Equipment Usage in Workplaces
Regulation on Duty, Authority and Responsibility and Training of Occupational Safety Specialists
Regulation on Risk Assessment Regarding Occupational Health and Safety
Regulation on Emergency Situations in Workplaces

J339 – OMAS ESIA Page 7 of 35
The 1982 Constitution recognises the right of all Turkish citizens to a healthy environment, as well as
the duty of the State and of citizens to upgrade the environment, protect environmental health and
prevent pollution. Turkey is a party to all key international environmental conventions that provide
appropriate policy frameworks and promote cooperation and coherent action at global, regional and
national levels to address environmental problems.
Land
Land registration in Turkey is based on the Land Registration, and the Cadastral laws. In addition to
these, there are more than 30 laws and regulations including some decrees relating to land tenure. The
responsible organisation for both land registration and the cadastre is the General Directorate of Land
Registry and Cadastre (GDLRC).
The GDLRC carries out its work via the District and Local Directorates of Land Registry and Cadastre.
The technical aspects of the cadastre can be contracted to private surveyors.
The Turkish cadastral work covers all areas within municipal boundaries including privately owned
cadastral parcels, parcels owned by foundations and public areas. In the cadastral context there are
different land types. These can be classified as:
Privately owned land (registered in the land registry), according to Civil Law, the title deed represents
an ownership of the parcel, which is secured with the state authority;
State-owned land (registered in the land registry);
Land that is not subject to registration, known as unregistered state-owned lands. There have been
incorrect cadastral operations and some land of this category of land has been registered under
private names.
The use of state-owned lands (pastureland, forestry lands, treasury lands) by citizens is rule-bound.
Citizens can rent pastureland after receiving the required Permits from the relevant Pastureland
Commission that is a sub-unit of the Ministry of Food, Agriculture and Livestock. Citizens can also rent
treasury lands for agricultural, commercial, sports and social activities, fishing or other reasons.
Forestry land cannot be used for personal purposes, be it agriculture, grazing or other purposes. The
use of these lands is allowed only for mining projects, projects for the public welfare (dams, highways,
etc.) and for the projects with touristic purposes only if they can receive the required Permits from the
relevant governmental authorities.
In line with a bill approved on April 18, 2013 land classified as “2B land”, which was formerly classified
as forest land but which has been occupied and used by individuals without payment and without title
deeds, may now be bought by its users. It also appears that some 2B land, which has not been occupied
yet, will now also be open for sale.
The main land tenure regulation in Turkey is the Land Registry Law No. 2644, amended by Law No.
6302 (effective 18 May 2012). According to the Turkish laws and regulations, transfer of ownership of
a property is only possible with an official deed and registry, signed at the Land Registry Directorate.
Under Article 2 of the Regulation on the Naturalization of Lands Degraded by Mining Operations1, lands
designated as forest, agricultural or meadow lands are excluded from the scope of the Regulation.
However, the OMAS Mine Closure Framework will cover all land areas directly impacted by the Project
to ensure that where possible land is restored as closely as possible to its former land use (for features
such as open pits, WRD of HLF, this will not be possible).
Cultural Heritage
Cultural property (heritage) is defined in the Law on the Conservation of Cultural and Natural Property2,
as
1 Effective upon its publication in the Official Gazette no. 27471 on 23 January 2010 2 Law No. 2863 of July 21, 1983 on Conservation of Cultural and Natural Property (as last amended by Law No. 648 of August 8, 2011 and Law No. 653 of August 23, 2011)

J339 – OMAS ESIA Page 8 of 35
“movable and immovable property on the ground, under the ground or under the water pertaining to
science, culture, religion and fine arts of before and after recorded history or that is of unique scientific
and cultural value for social life before and after recorded history” (Article 3 (1)).
Within the law, examples of immovable cultural property include, but are not limited to: archaeological
sites, acropolis and necropolis, castles, fortresses, towers, walls, historic barracks, places of worship
and tunnels (Article 6 (d)). Movable cultural property includes:
“…all kinds of cultural and natural property from geological periods, prehistory and recorded history,
having documentary value in terms of geology, anthropology, prehistory, archaeology and art history
reflecting the social, cultural, technical and scientific characteristics and level of the period they belong
to” (Article 23 (a)).
Some examples are: all kinds of animal and plant fossils, human skeletons, struck stone tools, volcanic
glass (obsidian), all kinds of tools made of bones or metal, tiles, ceramics, similar pots and pans, statues,
figurines, tablets, weapons to cut, for defence and assault, anchors, leather, cloth, papyrus, parchment
or documents inscribed or described on metal and portable goods and their parts made of tiles, earth,
glass, wood, and textiles (Article 23 (a)).
Cultural heritage (including archaeology) is regarded as important due to, but not limited to, the following
factors:
Archaeological heritage is a fragile and non-renewable cultural resource;
Archaeology and cultural heritage are important to civilization and cultural life, therefore they are
protected and potentially damaging activities are subject to regulation;
Cultural heritage can be important to national and local identity and economic activities (tourism).
The obligation to inform the relevant authorities when a potential cultural heritage site is found is
regulated by Article 4. If movable and/or immovable cultural and natural properties are found there is an
obligation on the project to inform the nearest Museum Directorate, village muhtar or civil administrative
body no later than 3 days after the find. The General Directorate for Cultural Heritage and Museums of
the Ministry of Culture and Tourism and the relevant Regional Cultural Heritage Preservation Council
are responsible for the registration of the find. Once the cultural heritage find has been registered it is
then the responsibility of the project proponent to obtain permission from the relevant Regional Cultural
Heritage Preservation Council before any works can be undertaken.
13.2.5 Project Standards
The Project will meet the requirements outlined above in Sections 13.2.1 – 13.2.4.
The Project will align with the Voluntary Principles on Security and Human Rights3.
13.3 Scope and Assessment Methodology
13.3.1 Spatial Scope
The project is located in the Kayseri province of Central Turkey and in the Develi District, one of sixteen districts in the province.
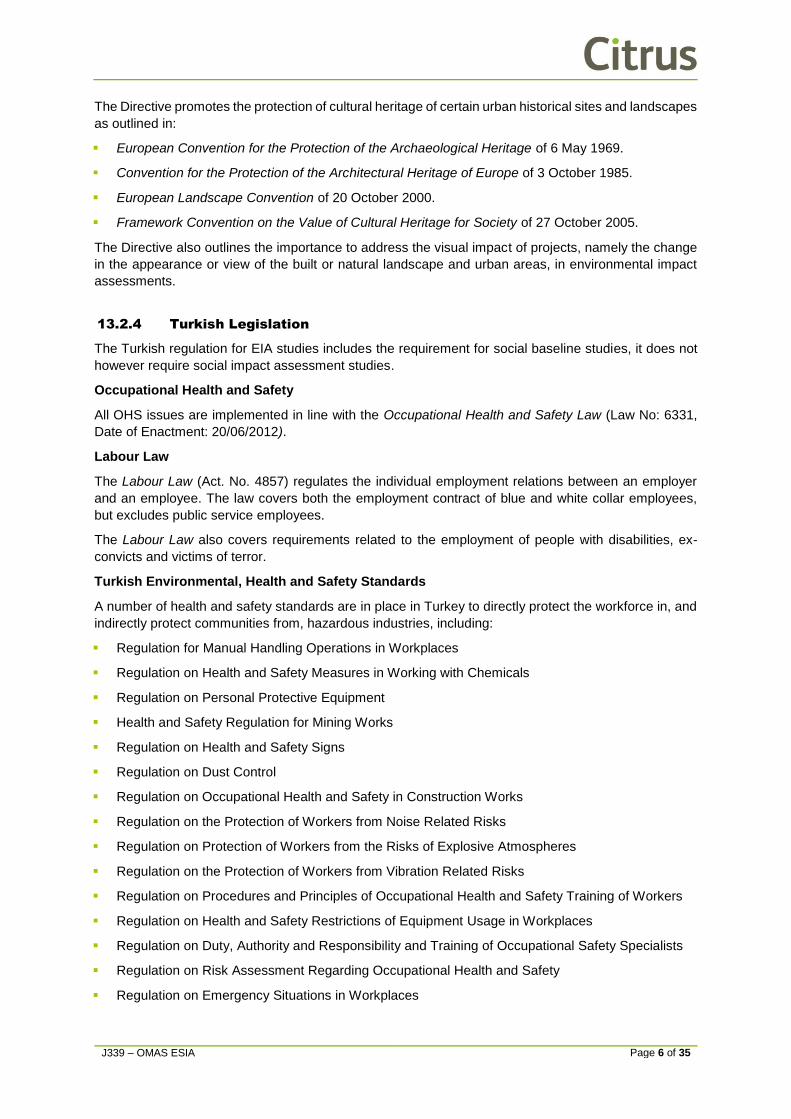
The spatial scope of the social study area is defined as the neighbourhoods and land between them, surrounding the Project Area (the EIA Permitted Area and infrastructure corridors), the powerline
corridor (100 m either side of the alignment) and three neighbourhoods immediately to the south of this corridor. The social study area is indicated in Figure 13-1 below. Settlements within the social study
area are defined as: Öksüt, Gazi, Sarıca, Zile, Tombak, Yukarı Develi, Yazıbaşı, Gömedi, Epçe and Develi; neighbourhoods to the south of the powerline are Çayırözü, Soysallı and Sindelhöyük.
3 http://www.voluntaryprinciples.org/
J339 – OMAS ESIA Page 9 of 35
Figure 13-1: Social Study Area
J339 – OMAS ESIA Page 10 of 35
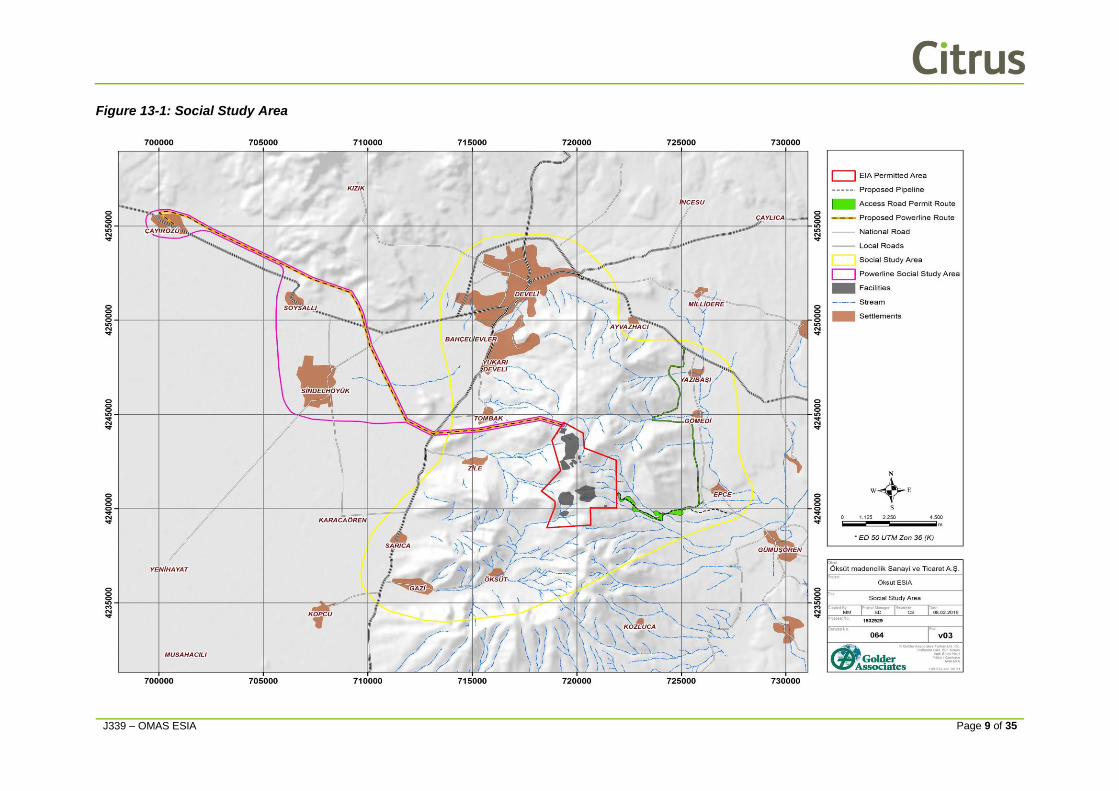
For tangible cultural heritage, the spatial extent of the ESIA was determined by the geographical area
potentially affected by the Project. The study area for tangible cultural heritage has focused on the
geographical area potentially affected by Project activities: the 2012 and 2013 tangible cultural heritage
surveys concentrated on the area within the OMAS Licenses, as shown in Figure 13-2 below. The study
area for intangible cultural heritage is defined as the social study area as defined in Figure 13-1 above,
which included focus group discussions and key informant interviews in all the aforementioned
settlements.
Figure 13-2: Tangible Cultural Heritage Survey Location
J339 – OMAS ESIA Page 11 of 35
13.3.2 Temporal Scope
The temporal scope of this assessment is the full lifecycle of the Project, that is, planning and
development phase, construction, operations and closure. The closure phase will include activities on
site to ensure the pit, WRD and HLF are decommissioned, safe and stable, and the fenced area will be
reduced such that during the post-closure phase, land use activities that occurred pre-mining can be
reintroduced around the EIA Permitted Area. At this time, the mine site will transition to a care and
maintenance scenario under which monitoring of the site will be undertaken.
13.3.3 Assessment Methodology
Baseline Data
The information and data used in this section are compiled from different sources listed below.
Secondary Data
Census data of TurkStat database between 1965- 2000.
Address-Based Population Registration System database between 2007-2014.
Ministry of Environment and Urbanization (2013) Environmental Status Report of Kayseri Province.
Turkish Statistical Institute: Statistical Indicators 1923-2013.
Turkish Statistical Institute (2013) Turkey’s Statistical Yearbook.
Turkish Employment Organization (2014), Unemployment and Employment Statistics.
Turkish Statistical Institute, Press Releases (2015).
CIA World Fact book, Turkey (2015).
Primary Data
Household survey analyses.
Analyses of the data collected during focus group discussions and key informant interviews.
Household surveys were conducted in two villages closest to the mine site, Öksüt and Zile. Based on
population and household figures provided by local government, 50% of the households in each
settlement were interviewed – 89 in Öksüt and 58 in Zile. The surveys were conducted in December
2014. Results were blindly selected and households not present were replaced by the neighbouring
household. Efforts concentrated only on permanent residents. Lists noted permanent and summer
residents. No summer residents were surveyed.
Qualitative data collection took place in all settlements in the study area, including Develi. The majority
of the key informant’s interviews were conducted in December 2014. Supplementary information has
been collected in January and February 2016.
In total, there were 23 key informant interviews with government representatives, neighbourhood muhtars. Interview formats follow a semi-structured format with some specific questions, but with the freedom to ask follow on questions for topics deemed most relevant by the interviewer.
Fifteen focus groups were held. A total of at least 96 people participated in these events and almost all settlements included separate meetings with men and women to better understand gender dynamics and perceptions across all baseline topics. Similar to one-on-one interviews, the format was based on a set of standard questions, but allowed for more in-depth conversations on topics deemed most appropriate for the group.
J339 – OMAS ESIA Page 12 of 35
Impact Assessment
Professional judgment and experience was used to assess potential impacts in the social study area.
Reference is made to EBRD Performance Requirements and interviews with affected and interested
stakeholders where applicable.
13.3.4 Limitations
The limitations to the data presented in this Chapter include the following:
There are differences between official (TurkStat) records and those held by neighbourhood muhtars
with respect to population data, including variation between summer and winter numbers, during
which parts of the population migrate between the neighbourhoods in the study area and other parts
of Turkey;
Qualitative data sources (i.e. that which was obtained during focus group discussions and/or key
informant interviews) may not always agree with official data; however, these sources are
considered useful indicators for the purposes of triangulating key messages from the baseline
research in the neighbourhoods.
13.4 Baseline
13.4.1 Introduction
This section provides demographic information about Turkey, Kayseri province, Develi district and the
neighbourhoods of Çayırözü, Soysallı and Sindelhöyük, Epçe, Gazi, Gömedi, Öksüt, Sarıca, Tombak,
Yazıbaşı, Zile and Yukarı Develi, including discussion on population growth, age and gender, population
movement and ethnicity.
13.4.2 Population and Growth
National Level
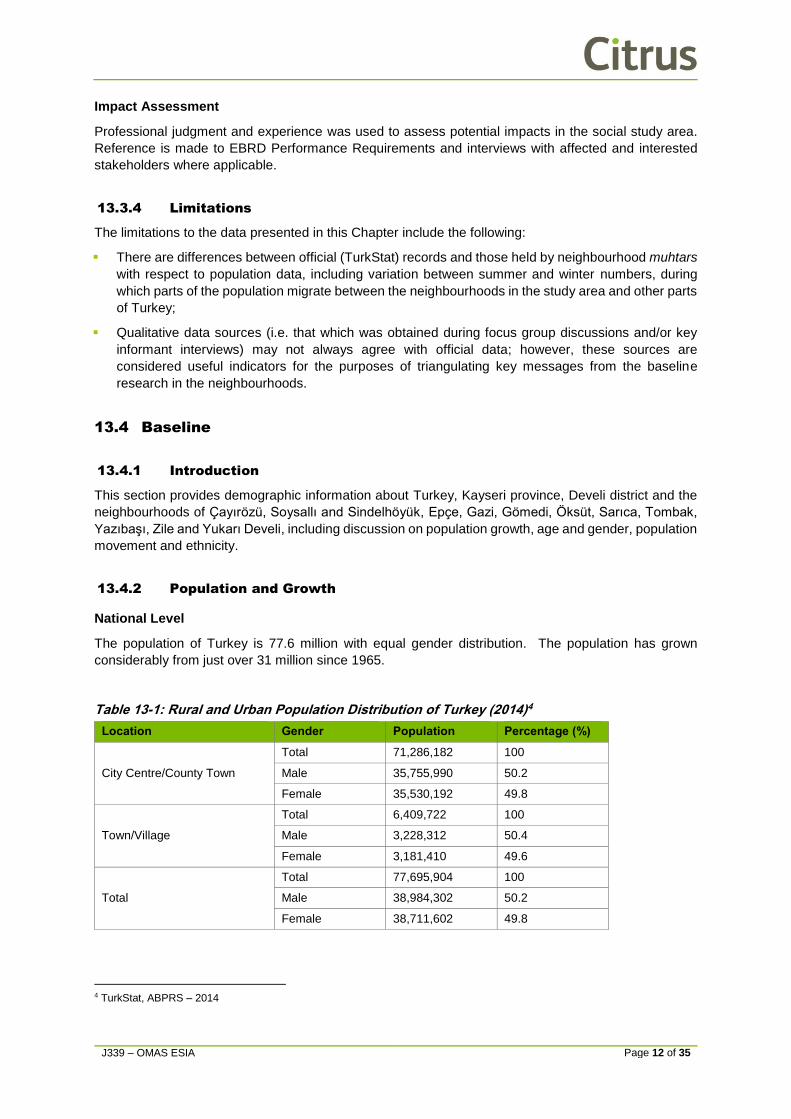
The population of Turkey is 77.6 million with equal gender distribution. The population has grown
considerably from just over 31 million since 1965.
Table 13-1: Rural and Urban Population Distribution of Turkey (2014)4
Location Gender Population Percentage (%)
City Centre/County Town
Total 71,286,182 100
Male 35,755,990 50.2
Female 35,530,192 49.8
Town/Village
Total 6,409,722 100
Male 3,228,312 50.4
Female 3,181,410 49.6
Total
Total 77,695,904 100
Male 38,984,302 50.2
Female 38,711,602 49.8
4 TurkStat, ABPRS – 2014
J339 – OMAS ESIA Page 13 of 35
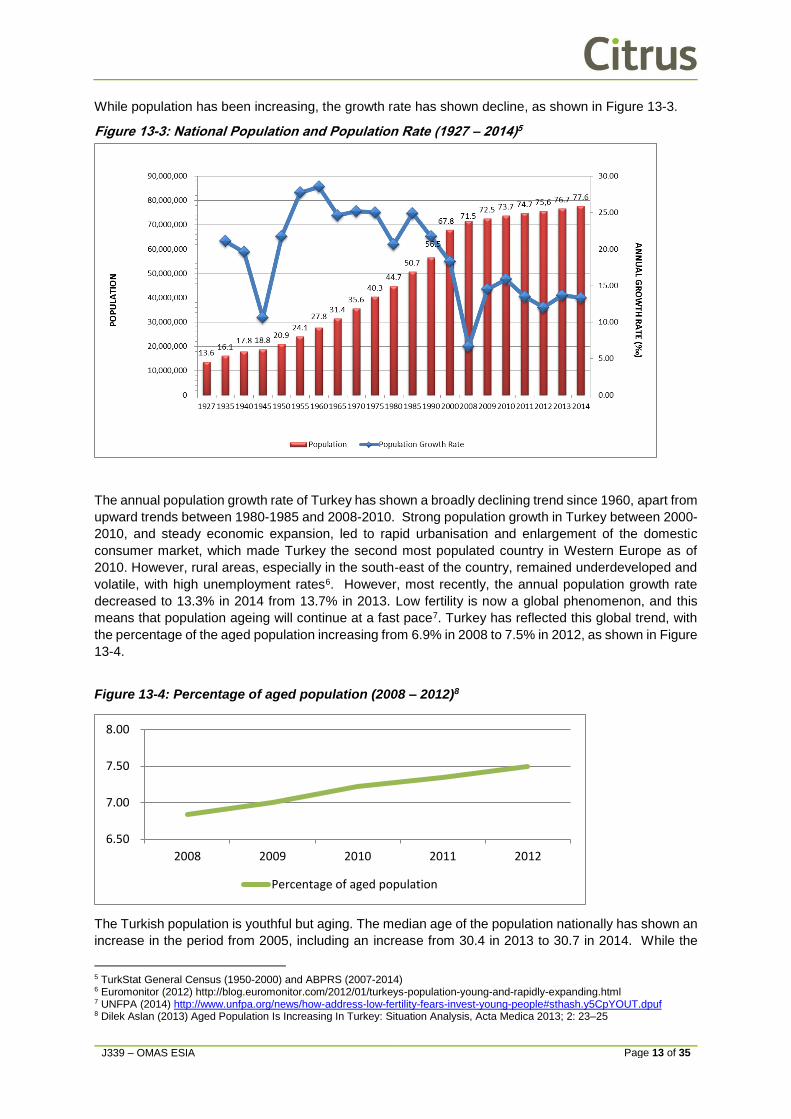
While population has been increasing, the growth rate has shown decline, as shown in Figure 13-3.
Figure 13-3: National Population and Population Rate (1927 – 2014)5
The annual population growth rate of Turkey has shown a broadly declining trend since 1960, apart from
upward trends between 1980-1985 and 2008-2010. Strong population growth in Turkey between 2000-
2010, and steady economic expansion, led to rapid urbanisation and enlargement of the domestic
consumer market, which made Turkey the second most populated country in Western Europe as of
2010. However, rural areas, especially in the south-east of the country, remained underdeveloped and
volatile, with high unemployment rates6. However, most recently, the annual population growth rate
decreased to 13.3% in 2014 from 13.7% in 2013. Low fertility is now a global phenomenon, and this
means that population ageing will continue at a fast pace7. Turkey has reflected this global trend, with
the percentage of the aged population increasing from 6.9% in 2008 to 7.5% in 2012, as shown in Figure
13-4.
Figure 13-4: Percentage of aged population (2008 – 2012)8
The Turkish population is youthful but aging. The median age of the population nationally has shown an
increase in the period from 2005, including an increase from 30.4 in 2013 to 30.7 in 2014. While the
5 TurkStat General Census (1950-2000) and ABPRS (2007-2014) 6 Euromonitor (2012) http://blog.euromonitor.com/2012/01/turkeys-population-young-and-rapidly-expanding.html 7 UNFPA (2014) http://www.unfpa.org/news/how-address-low-fertility-fears-invest-young-people#sthash.y5CpYOUT.dpuf 8 Dilek Aslan (2013) Aged Population Is Increasing In Turkey: Situation Analysis, Acta Medica 2013; 2: 23–25
6.50
7.00
7.50
8.00
2008 2009 2010 2011 2012
Percentage of aged population

J339 – OMAS ESIA Page 14 of 35
median age was 30.1 for males, it was 31.3 for females in 2014. Average life expectancy is 76.62 years
and the total fertility rate is just under 2 children per woman. Turkey experiences relatively higher birth
and fertility rates compared to most Western European economies, which is driving economic growth in
the country and expanding the labour market. However, birth rates have been trending downward (refer
Figure 13-5), which accelerates population ageing and shrinks the labour force, thereby causing skills
shortages and pressures on state health and pension provisions9. An increase in the population in 2008-
09 may have been due to an increase in the number of western Europeans in Turkey, who, due to
changes in property rights in 2005, have been able to purchase property and retire in the country10.
Figure 13-5: National Birth rate (births/1,000 population)11
Contributing to this trend of declining total fertility rates is the increase in education of girls and access
to contraception. Table 13-2 shows an overall decline in total fertility rates with an increase in girls’
education completion, increase in contraceptive use and decline in mortality of babies under five years
old.
Table 13-2: Total Fertility Rate, Child Mortality, Contraceptive use and female education (1993 –
2008)12
1993 1998 2003 2008
Total fertility rate (females age 15 - 49)13 2.73 2.61 2.22 2.15
Contraceptive prevalence rate (any type, %) 62.6 63.9 71 73
Under 5 mortality14 61 52 37 24
Females age 15 - 19 with completed primary education
(%)
90.4 89.4 85.1 91.3
Females age 15 - 19 with completed secondary
education (%)
27.4 27.7 44.2 57.6
Turkey’s population is increasingly urbanised. The proportion of the population residing in provincial
and district centres increased to 91.8% in 2014 from 91.3% in 2013, while the proportion of the
9 Euromonitor (2012) http://blog.euromonitor.com/2012/01/turkeys-population-young-and-rapidly-expanding.html 10 https://en.wikipedia.org/wiki/Demographics_of_Turkey#Property_acquisition_since_the_1990s 11 CIA World Factbook, Turkey (2000-2014) 12 Hacettepe University, Institute of Population Studies http://www.hips.hacettepe.edu.tr/eng/dokumanlar/Summary_Indicators.pdf 13 The average number of children that would be born per woman if all women lived to the end of their childbearing years and bore children according to a given fertility rate at each age. 14 The number of deaths of infants under 5 years old in a given year per 1,000 live births in the same year
14.5
15
15.5
16
16.5
17
17.5
18
18.5
19
2000 2001 2002 2003 2004 2005 2006 2007 2008 2009 2010 2011 2012 2013 2014
Birth rate (births/1,000 population)

J339 – OMAS ESIA Page 15 of 35
population living in towns and villages was 8.2%15. The rate of urbanisation is 1.97 percent annual rate
of change (2010 – 15 estimated)16, and the population density nationally is trending upward from 2003,
to 92.1 people per km2 in 2014 as shown in Figure 13-6.
Figure 13-6: Population density (Number of people per km2)17
The summary population indicators of Turkey and its world ranking are provided in Table 13-3,
demonstrating the ongoing trends shown above on total fertility rate and under five mortality, as well as
other indicators.
Table 13-3: Population Indicators of Turkey18
Indicator Value World Ranking19
Crude Birth Rate 15,546 births/thousand 113th
Crude Death Rate 5,715 deaths/thousand 115th
Crude Net Migration Rate -0.611 people/thousand 118th
Life Expectancy (both sexes) 76.62 years 60th
Life Expectancy (Male) 73.29 years 69th
Life Expectancy (Female) 79.88 years 56th
Total Fertility Rate 1.961 children/woman 120th
Net Reproduction Rate 0.932 surviving daughters/woman 121st
Sex Ratio At Birth 1.05 males per female 83rd
Infant Mortality Rate 8.991 deaths/1,000 live births 123rd
Under Five Mortality 13.285 deaths/thousand 112th
Mean Age at Childbearing 28.212 years 128th
Provincial Level
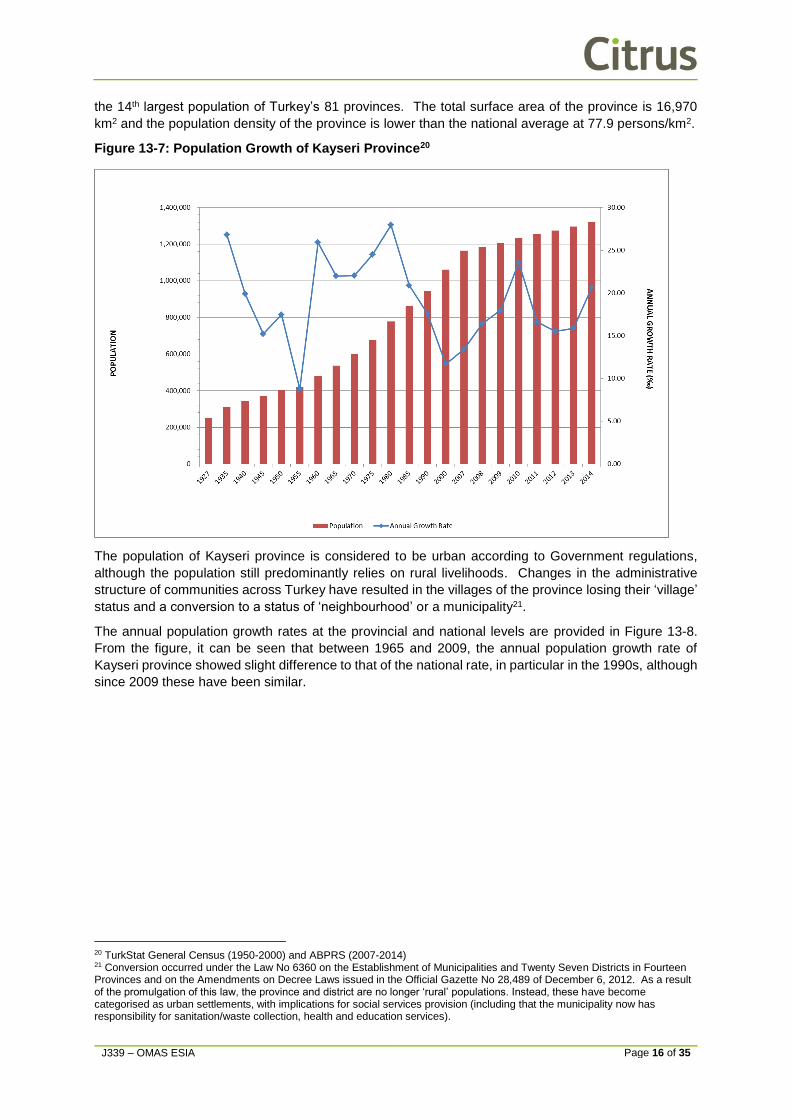
The population of Kayseri province is 1,322,376 (2014) and it has increased regularly from 250,490
people in 1927 (Figure 13-7). The provincial population growth rates mirror trends of the national level,
however with higher peaks in growth rates in 2010 and 2014, now currently just over 20%. Kayseri has
15 TurkStat, ABPRS (2014) 16 CIA World Fact Book, Turkey (2015) 17 CIA World Fact Book, Turkey (2015) 18 World Population Prospects - Global demographic estimates and projections by the United Nations (2015) 19 World ranking of 7.349 billion people (UN, 2015) http://esa.un.org/unpd/wpp/Publications/Files/Key_Findings_WPP_2015.pdf
75
80
85
90
95
100
105
110
2003 2004 2005 2006 2007 2008 2009 2010 2011 2012 2013 2014
Population Density
J339 – OMAS ESIA Page 16 of 35
the 14th largest population of Turkey’s 81 provinces. The total surface area of the province is 16,970
km2 and the population density of the province is lower than the national average at 77.9 persons/km2.
Figure 13-7: Population Growth of Kayseri Province20
The population of Kayseri province is considered to be urban according to Government regulations,
although the population still predominantly relies on rural livelihoods. Changes in the administrative
structure of communities across Turkey have resulted in the villages of the province losing their ‘village’
status and a conversion to a status of ‘neighbourhood’ or a municipality21.
The annual population growth rates at the provincial and national levels are provided in Figure 13-8.
From the figure, it can be seen that between 1965 and 2009, the annual population growth rate of
Kayseri province showed slight difference to that of the national rate, in particular in the 1990s, although
since 2009 these have been similar.
20 TurkStat General Census (1950-2000) and ABPRS (2007-2014) 21 Conversion occurred under the Law No 6360 on the Establishment of Municipalities and Twenty Seven Districts in Fourteen Provinces and on the Amendments on Decree Laws issued in the Official Gazette No 28,489 of December 6, 2012. As a result of the promulgation of this law, the province and district are no longer ‘rural’ populations. Instead, these have become categorised as urban settlements, with implications for social services provision (including that the municipality now has responsibility for sanitation/waste collection, health and education services).

J339 – OMAS ESIA Page 17 of 35
Figure 13-8: Comparison of Population Increase Rates of Turkey and Kayseri, (%)22
District Level
The population of Develi district has fluctuated from 54,159 people in 1965 to a peak of 72,825 in 1990
to its current total of 64,550. The total surface area of the district is 1,892 km2 and the population density
of the district is 34.1 person/km2, reflective of the rural lifestyle of the population in the district. Annual
population growth rates have been highly variable since 1970 with a peak of approximately 20%, but
have shown an upward trend since 2012, currently at just under 10% (current at 2014).
Figure 13-9: Population Growth of Develi District23
22 TurkStat, 1965-2014 Population Data 23 TurkStat General Census (1950-2000) and ABPRS (2007-2014)
J339 – OMAS ESIA Page 18 of 35
The population of Develi shows strong seasonal variation, with an increase in summer. During this
period, the Develi Mayor reported that the population exceeds 100,000 as one in every two households
has relatives living in different provinces and/or countries who visit Develi every summer. This dynamic
was also discussed in interviews with muhtars, who report that summer populations can increase by
50% in summer months. Due to inadequate job opportunities in the district, young population in particular
migrate to Ankara and İstanbul. The estimated population living in Ankara and İstanbul and who are
originally from Develi is almost 300,000 people24.
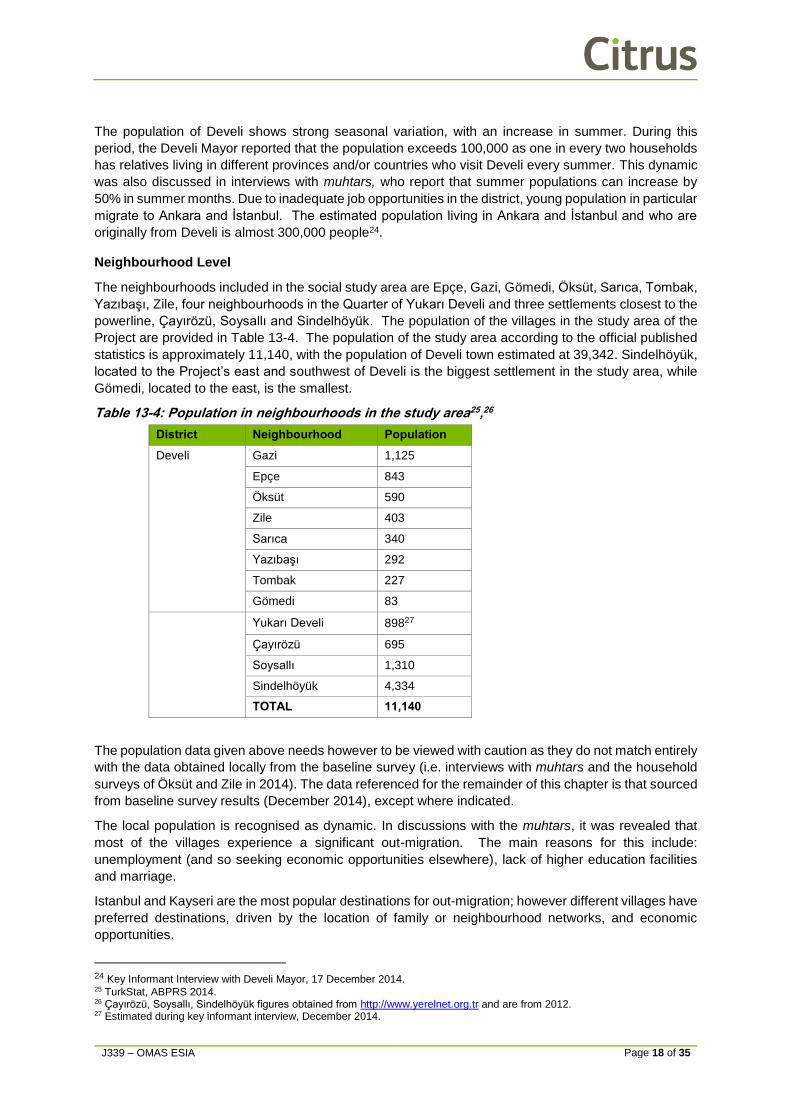
Neighbourhood Level
The neighbourhoods included in the social study area are Epçe, Gazi, Gömedi, Öksüt, Sarıca, Tombak,
Yazıbaşı, Zile, four neighbourhoods in the Quarter of Yukarı Develi and three settlements closest to the
powerline, Çayırözü, Soysallı and Sindelhöyük. The population of the villages in the study area of the
Project are provided in Table 13-4. The population of the study area according to the official published
statistics is approximately 11,140, with the population of Develi town estimated at 39,342. Sindelhöyük,
located to the Project’s east and southwest of Develi is the biggest settlement in the study area, while
Gömedi, located to the east, is the smallest.
Table 13-4: Population in neighbourhoods in the study area25,26
District Neighbourhood Population
Develi Gazi 1,125
Epçe 843
Öksüt 590
Zile 403
Sarıca 340
Yazıbaşı 292
Tombak 227
Gömedi 83
Yukarı Develi 89827
Çayırözü 695
Soysallı 1,310
Sindelhöyük 4,334
TOTAL 11,140
The population data given above needs however to be viewed with caution as they do not match entirely
with the data obtained locally from the baseline survey (i.e. interviews with muhtars and the household
surveys of Öksüt and Zile in 2014). The data referenced for the remainder of this chapter is that sourced
from baseline survey results (December 2014), except where indicated.
The local population is recognised as dynamic. In discussions with the muhtars, it was revealed that
most of the villages experience a significant out-migration. The main reasons for this include:
unemployment (and so seeking economic opportunities elsewhere), lack of higher education facilities
and marriage.
Istanbul and Kayseri are the most popular destinations for out-migration; however different villages have
preferred destinations, driven by the location of family or neighbourhood networks, and economic
opportunities.
24 Key Informant Interview with Develi Mayor, 17 December 2014. 25 TurkStat, ABPRS 2014. 26 Çayırözü, Soysallı, Sindelhöyük figures obtained from http://www.yerelnet.org.tr and are from 2012. 27 Estimated during key informant interview, December 2014.
J339 – OMAS ESIA Page 19 of 35
Perceptions of migration differ: Actually migrating people create positive effects. For example, the
economic level has increased thanks to decrease of population. One of the most important negative
effects of migration is that the secondary school is closed in the village … however; departure of young
people from the village caused a decrease in the number of shepherds. (Male respondent, Öksüt)
None of the neighbourhood muhtars reported that they receive in-migration from different settlements;
instead they emphasised that population declines due to a lack of job opportunities or for marriage.
There were no other remarkable reasons reported for out-migration or a decrease in population over the
last five years.
13.4.3 Age and Gender
National Level
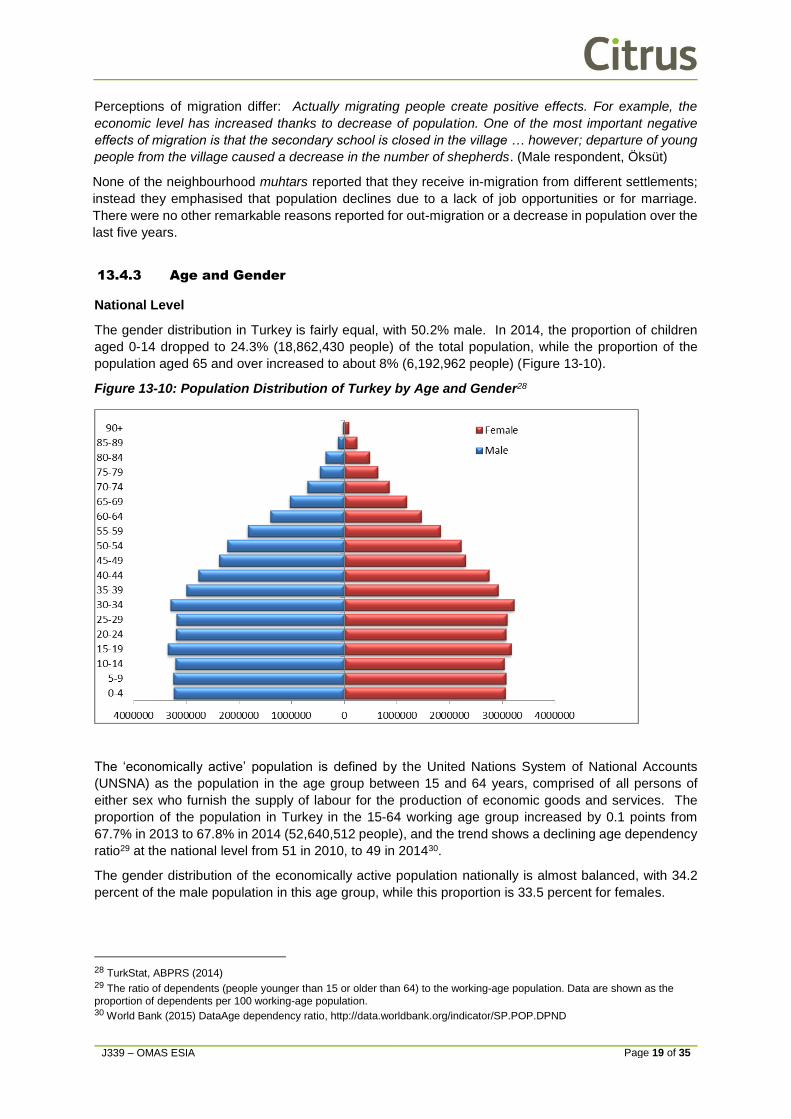
The gender distribution in Turkey is fairly equal, with 50.2% male. In 2014, the proportion of children
aged 0-14 dropped to 24.3% (18,862,430 people) of the total population, while the proportion of the
population aged 65 and over increased to about 8% (6,192,962 people) (Figure 13-10).
Figure 13-10: Population Distribution of Turkey by Age and Gender28
The ‘economically active’ population is defined by the United Nations System of National Accounts
(UNSNA) as the population in the age group between 15 and 64 years, comprised of all persons of
either sex who furnish the supply of labour for the production of economic goods and services. The
proportion of the population in Turkey in the 15-64 working age group increased by 0.1 points from
67.7% in 2013 to 67.8% in 2014 (52,640,512 people), and the trend shows a declining age dependency
ratio29 at the national level from 51 in 2010, to 49 in 201430.
The gender distribution of the economically active population nationally is almost balanced, with 34.2
percent of the male population in this age group, while this proportion is 33.5 percent for females.
28 TurkStat, ABPRS (2014) 29 The ratio of dependents (people younger than 15 or older than 64) to the working-age population. Data are shown as the
proportion of dependents per 100 working-age population. 30 World Bank (2015) DataAge dependency ratio, http://data.worldbank.org/indicator/SP.POP.DPND

J339 – OMAS ESIA Page 20 of 35
Provincial Level
Ratios of the male and female population of the total population of Kayseri Province are respectively
50.2% and 49.8%. Figure 13-11 shows the provincial population pyramid.
Figure 13-11: Population Distribution of Kayseri by Age and Gender31
The economically active population of the province comprises 66.7 percent of the total Kayseri
population, and 50.5 percent of this economically active population is male (Figure 13-11). The male
population which falls in the working age group comprises 37.2 percent of the male provincial population,
while this proportion is 66.3 percent for the female population. That is, approximately two thirds of all
women and men in Kayseri are working age.
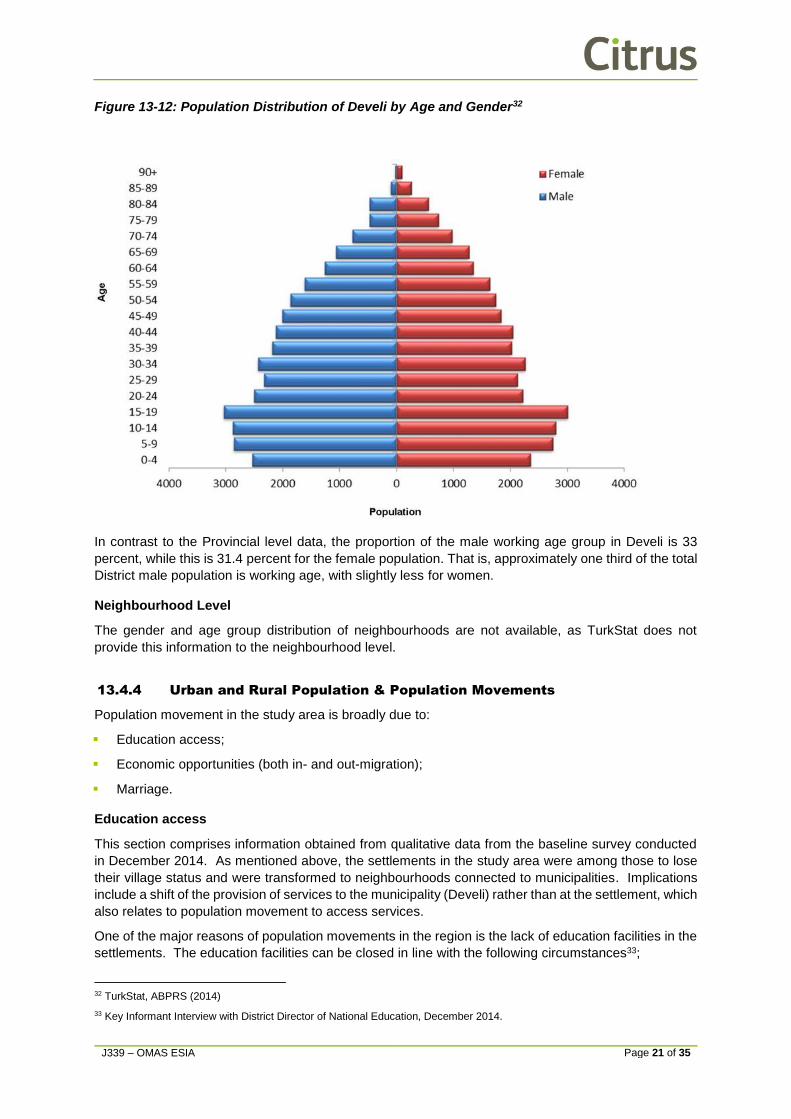
District Level
The gender distribution of Develi district is fairly equal, with 50.3 percent being male. The economically
active population (15-64 age group) comprises 64.4 percent of the district population with 51.3 percent
of these being male (Figure 13-12).
31 TurkStat, ABPRS (2014)
J339 – OMAS ESIA Page 21 of 35
Figure 13-12: Population Distribution of Develi by Age and Gender32
In contrast to the Provincial level data, the proportion of the male working age group in Develi is 33
percent, while this is 31.4 percent for the female population. That is, approximately one third of the total
District male population is working age, with slightly less for women.
Neighbourhood Level
The gender and age group distribution of neighbourhoods are not available, as TurkStat does not
provide this information to the neighbourhood level.
13.4.4 Urban and Rural Population & Population Movements
Population movement in the study area is broadly due to:
Education access;
Economic opportunities (both in- and out-migration);
Marriage.
Education access
This section comprises information obtained from qualitative data from the baseline survey conducted
in December 2014. As mentioned above, the settlements in the study area were among those to lose
their village status and were transformed to neighbourhoods connected to municipalities. Implications
include a shift of the provision of services to the municipality (Develi) rather than at the settlement, which
also relates to population movement to access services.
One of the major reasons of population movements in the region is the lack of education facilities in the
settlements. The education facilities can be closed in line with the following circumstances33;
32 TurkStat, ABPRS (2014)
33 Key Informant Interview with District Director of National Education, December 2014.
J339 – OMAS ESIA Page 22 of 35
For primary schools; if the number of students is less than 9;
For secondary schools; if the number of students are less than 60;
For kindergartens; if the number of students are less than 10.
So, mobile education is almost a requisite for all of the settlements. Students travel to different districts
for their compulsory education, and for those seeking further education, young people will then again
migrate to different settlements for university education.
Economic migration
Out-migration
The second major reason for migration is the lack of job opportunities in the region. In particular, young
people migrate to different provinces and districts, reported to be typically over summer for 4 to 6
months.
In Öksüt, may people have worked in İstanbul as painters; while there are some young people who have
migrated to Russia and Azerbaijan to work in trades in the construction sector (e.g. as painters,
plasterers, turners).
The population of Yukarı Develi work in the manufacturing sector and also as shoemakers and painters
in İstanbul, Ankara or Kayseri provinces.
Seasonal migration is common in Epçe. There are approximately 100 people working abroad,
particularly in Russia and Arab countries. In Epçe there are households in which both father and son
leave the household for 4 to 6 months and work abroad. In addition to people working abroad, there
are also people migrating to Ankara and İstanbul.
In Gazi, seasonal migration is not as common, however there are several repatriates (i.e. those who
return to the home village) who live in the village only for two months during summer. The younger
population migrate to Develi and Kayseri in order to work in trades including as painters, plasterer and
floor-and-wall tiling workers.
In Yazıbaşı, young people migrate, especially to Antalya, in order to work in construction as painters
and floor-and-wall tiling works. There are also some people migrating to Ankara and Konya provinces
and to Germany.
In Sarıca, one third of the population lives in Ankara and another one third lives in İstanbul for economic
opportunities. This migrating population is usually engaged in bodywork, painting, shoe-making and
textile business.
The population migrating out from Gömedi report that it is common to work abroad for three to six months
as construction workers (including in painting, plastering, and whitewash works). There are also some
young people going to Ankara and İstanbul to secure jobs between spring and autumn, when work is
available.
The population of Sindelhöyük, Soysallı and Çayırözü do not report any substantial outmigration.
Migration for economic opportunities is gendered. That is, the population migrating to different regions
for job purposes are predominantly males.
In-migration
Administratively, although the villages have been transferred to neighbourhood status, the lifestyle and
economic activities of householders have not changed thus far. This includes that as the villagers remain
engaged in agricultural activities, the settlements located in the study area receive seasonal workers
predominantly from the eastern side of Turkey for harvesting or other agricultural work.
In-migrating seasonal workers generally come for agricultural work.
In Öksüt, the majority of the seasonal workers come from Şanlıurfa province to work between July
and September, and the majority of these workers are Kurdish people;
J339 – OMAS ESIA Page 23 of 35
Yazıbaşı also receives seasonal workers from Syria and Şanlıurfa province between May and
September. The workers are engaged in pumpkin seed harvest;
Sarıca is one of the neighbourhoods receiving seasonal workers from Gaziantep and Urfa provinces.
The workers are mainly responsible for the harvesting of sugarbeet and vegetables. The majority of
the workers coming to Sarıca also work for the neighbouring settlements in the harvest of pumpkin
seed and chickpeas. They stay in the village between May and October;
Seasonal workers arriving in Gömedi are responsible for the harvest of pumpkin seeds in
September. Seasonal workers also arrive in spring for seeding period. The majority of the workers
are from Şanlıurfa and Diyarbakır provinces;
Zile and Yukarı Develi are the settlements which do not receive seasonal workers from different
provinces.
Sindelhöyük does not report any worker in-migration. Because Soysallı and Çayırözü livelihoods are
more linked to herding, these settlements also report that seasonal agricultural workers are not common.
Accommodation for seasonal workers varies. The seasonal workers coming to the region may stay in
their own tents or in special areas built by the government for the seasonal workers. They do not pay
for their accommodation. The majority of the workers arrive as a household/family and stay and work
together.
The residents of the neighbourhoods are open to living with other people coming for seasonal work
however; they do not prefer to live together with foreigners coming to their neighbourhood permanently.
As reported in one focus group discussion:
Our people migrate out, (but) we do not receive many people. There is one Syrian family (working on a
farm)… There were more Syrian people to come, but we did not want that. … he does not know Turkish,
they keep away from us. (Female respondent, Epçe).
Household migration
Household survey data revealed trends in migration to and from Öksüt and Zile, showing that just over
one quarter of Zile residents travel outside the village, and half of these travelled to stay with children or
relatives.
Marriage
Quantitative data on migration for marriage was not recorded. However in qualitative surveying it was
reported that women migrate both within and between villages in the study area, as well as the
surrounds, for marriage. It was reported that:
“Our brides are mostly from neighbouring settlements. They marry if there is someone from the city who
has a job... In arranged marriages, they ask the opinion of the girl, too. In the old days, they never
asked”34.
13.4.5 Ethnicity, Religion and Languages
National level
The official language of Turkey is Turkish, while other minority languages are also spoken. The vast
majority of the population is Muslim (mostly Sunni), whilst there is a small minority of Christians and
Jews. There are numerous ethnic groups. The largest group are the Turks (comprising 70-75%)
followed by Kurdish people (18%). Other minorities compose 7-12% of the total population35.
34 Zile women’s focus group discussion, December 2014. 35 Central Intelligence Agency, The World Factbook, May 2013. Retrieved from https://www.cia.gov/library/publications/the-world-factbook/geos/tu.html [02.08.2015, 23:30].
J339 – OMAS ESIA Page 24 of 35
Neighbourhood level
During the key informant meetings conducted with the muhtars of the neighbourhoods it was reported
that the settlements are composed of only Turkish people36. The population speaks Turkish, however
as almost every neighbourhood has family members and households living abroad for work purposes
there are also some people who can speak additional languages other than Turkish.
Ethnicity
There are 12 households in the neighbourhood that speak Zaza language in addition to Turkish. The
Zazas are an ethnic Iranian people whose native language is Zazaki spoken in eastern Anatolia. They
primarily live in the eastern Anatolian provinces: Adıyaman, Aksaray, Batman, Bingöl, Diyarbakır,
Elazığ, Erzurum, Erzincan, Gümüşhane, Kars, Malatya, Muş, Şanlıurfa, Sivas, and Tunceli provinces.
Although Zaza-speakers are sometimes classified as a separate ethnic group, few communities of
speakers of the Zaza language actually consider themselves Kurds37. The muhtar of Yazıbaşı
neighbourhood described that the Zaza population in the neighbourhood as Sunni, and that the majority
are Turkish people and a few Kurdish people. The presence of this group of people of different ethnic
origin in the neighbourhood is not reported to create any conflict issues within or between local residents.
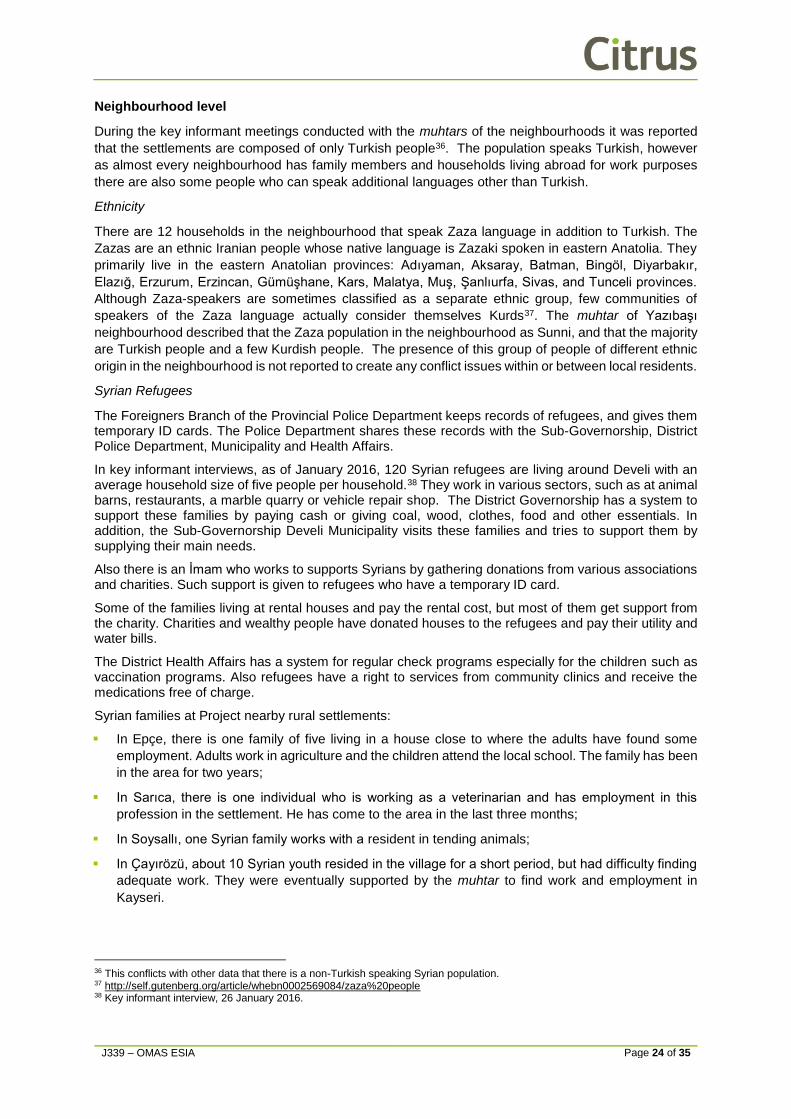
Syrian Refugees
The Foreigners Branch of the Provincial Police Department keeps records of refugees, and gives them temporary ID cards. The Police Department shares these records with the Sub-Governorship, District Police Department, Municipality and Health Affairs.
In key informant interviews, as of January 2016, 120 Syrian refugees are living around Develi with an average household size of five people per household.38 They work in various sectors, such as at animal barns, restaurants, a marble quarry or vehicle repair shop. The District Governorship has a system to support these families by paying cash or giving coal, wood, clothes, food and other essentials. In addition, the Sub-Governorship Develi Municipality visits these families and tries to support them by supplying their main needs.
Also there is an İmam who works to supports Syrians by gathering donations from various associations and charities. Such support is given to refugees who have a temporary ID card.
Some of the families living at rental houses and pay the rental cost, but most of them get support from the charity. Charities and wealthy people have donated houses to the refugees and pay their utility and water bills.
The District Health Affairs has a system for regular check programs especially for the children such as vaccination programs. Also refugees have a right to services from community clinics and receive the medications free of charge.
Syrian families at Project nearby rural settlements:
In Epçe, there is one family of five living in a house close to where the adults have found some
employment. Adults work in agriculture and the children attend the local school. The family has been
in the area for two years;
In Sarıca, there is one individual who is working as a veterinarian and has employment in this
profession in the settlement. He has come to the area in the last three months;
In Soysallı, one Syrian family works with a resident in tending animals;
In Çayırözü, about 10 Syrian youth resided in the village for a short period, but had difficulty finding
adequate work. They were eventually supported by the muhtar to find work and employment in
Kayseri.
36 This conflicts with other data that there is a non-Turkish speaking Syrian population. 37 http://self.gutenberg.org/article/whebn0002569084/zaza%20people 38 Key informant interview, 26 January 2016.

J339 – OMAS ESIA Page 25 of 35
Some Syrian refugees were reported to participate in seasonal work in Yazıbaşı. Such workers usually
are in the area in May, June and September. They live in tents during their temporary stay. There are
no reported problems with any seasonal workers.39
Languages
In Öksüt and Zile there are several people who have migrated abroad in order to work, and they have
learnt elementary level of some second languages, including Russian, German, Arabic, Kazakh, Kurdish
and English.
13.4.6 Vulnerable Groups
Vulnerable groups have been identified and assessed through consultation with key stakeholders in the
study area and the definition is informed by an understanding of the study area. Vulnerable groups are
defined as:
Women, in particular female-headed households;
People with disabilities;
Elderly;
Widows and widowers, especially with children;
Illiterate.
Women
Women are considered vulnerable for several reasons. Women have less and sometimes no formal
education in the study area. Women are not empowered to make significant decisions in their
households, as men and the elderly are the main decision makers in the home. Women typically enter
into marriages arranged by their families; however their consent is received prior to formalising the
arrangement. The women are often financially dependent on the men in the household and it is only
the relative independence of involvement in animal husbandry and some other basic subsistence
economic activity that provides women a stake in the economic power relations within the community.
People with Disabilities
Disability is further defined in Turkish law under the Regulation on Disability Criteria, Classification and
Health Committee Reports for Disable Individuals. Disability is determined in state hospitals. As part of
tax benefits, disabilities are group in three categories: Level 3 is a loss of 40% of a person’s normal
ability; Level 2 is a loss of 60% and Level 1 is an 80% loss.
Elderly
The minimum age defined for being an elder will be accepted as the retirement age in Turkey, which is
65.
Widows and Widowers, especially with Dependent Children
Single headed households face a variety of challenges. While this situation is most difficult for women,
it is still hard for men. The situation is even more difficult with dependent children, which adds costs and
responsibilities for adults trying to work and provide for other members of the household.
Illiterate
Illiteracy is more common in older people, with people 65 and over being most commonly illiterate.
Generally, reading is taught during primary school and one who completes primary school successfully
is considered literate.
39 Yazıbaşı men’s focus group discussion, December 2014.
J339 – OMAS ESIA Page 26 of 35
Identified vulnerable people
The quantitative and qualitative household and neighbourhood level surveys sought to identify
vulnerable groups who may be more impacted by the proposed Project than others in the community.
No statistical data was available for the number of vulnerable groups living in the social study area;
however the categories were discussed with muhtars during key informant interviews.
In most cases, muhtars were able to provide estimates of the numbers of vulnerable people in a
neighbourhood. Percentages are indicative figures only and based on qualitative interviews. In all cases,
less than 3% of the population was disabled and most settlements reported having less than 1%, which
considered physical and mentally disabled. Female-headed household are reported to range from less
than 1% (Çayırözü) to just under 10% (Epçe). Muhtars have an understanding of elderly in need of daily
assistance, which ranges from 1-4% of the total population. Illiteracy was reported to be no more than
10% of the population and some settlements report only 2-3 individuals who could not read. In all cases,
illiterate are usually people 65 or older in age.
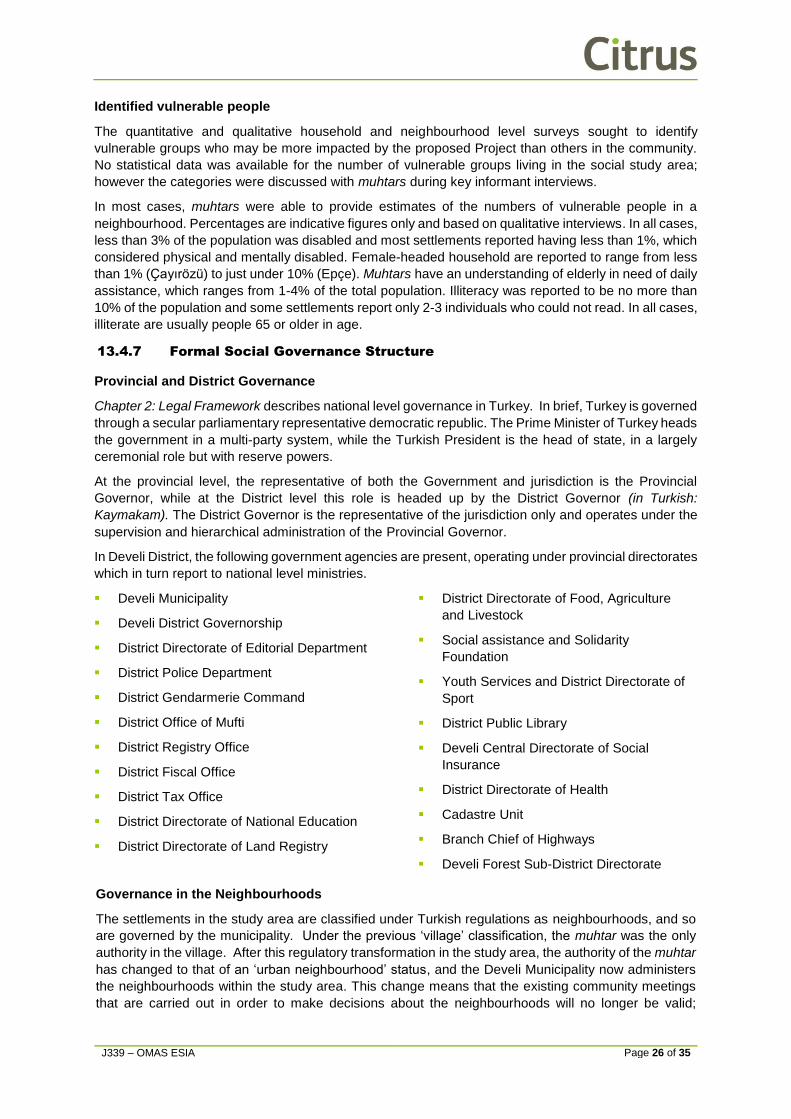
13.4.7 Formal Social Governance Structure
Provincial and District Governance
Chapter 2: Legal Framework describes national level governance in Turkey. In brief, Turkey is governed
through a secular parliamentary representative democratic republic. The Prime Minister of Turkey heads
the government in a multi-party system, while the Turkish President is the head of state, in a largely
ceremonial role but with reserve powers.
At the provincial level, the representative of both the Government and jurisdiction is the Provincial
Governor, while at the District level this role is headed up by the District Governor (in Turkish:
Kaymakam). The District Governor is the representative of the jurisdiction only and operates under the
supervision and hierarchical administration of the Provincial Governor.
In Develi District, the following government agencies are present, operating under provincial directorates
which in turn report to national level ministries.
Develi Municipality
Develi District Governorship
District Directorate of Editorial Department
District Police Department
District Gendarmerie Command
District Office of Mufti
District Registry Office
District Fiscal Office
District Tax Office
District Directorate of National Education
District Directorate of Land Registry
District Directorate of Food, Agriculture
and Livestock
Social assistance and Solidarity
Foundation
Youth Services and District Directorate of
Sport
District Public Library
Develi Central Directorate of Social
Insurance
District Directorate of Health
Cadastre Unit
Branch Chief of Highways
Develi Forest Sub-District Directorate
Governance in the Neighbourhoods
The settlements in the study area are classified under Turkish regulations as neighbourhoods, and so
are governed by the municipality. Under the previous ‘village’ classification, the muhtar was the only
authority in the village. After this regulatory transformation in the study area, the authority of the muhtar
has changed to that of an ‘urban neighbourhood’ status, and the Develi Municipality now administers
the neighbourhoods within the study area. This change means that the existing community meetings
that are carried out in order to make decisions about the neighbourhoods will no longer be valid;

J339 – OMAS ESIA Page 27 of 35
however, they will be valid for the purposes of representing the demands of the local people for
submission to the district authorities. Local citizens can additionally communicate with the district
authorities both verbally and in writing to represent their views.
In rural areas, the muhtar, as the village chief executive, represents his village and takes responsibility
for carrying out local services, and also acts as the representative of central government for the
locality. This was the case in the study area until the recent regulatory change. The tasks, powers,
organs, organisation, finance and work principles of the villages are defined in the Village Act of 1924,
number 442. A corresponding structure also exists in urban neighbourhoods, each of which elects their
own muhtar. However, urban neighbourhood muhtars – as now applies in the study area - lack the
executive power of the rural equivalent and operates within a very limited framework. The main
responsibilities of the muhtars are to keep records of local inhabitants, and convey information about
problems in their area to the relevant local or central administration.
13.4.8 Political Overview
The most recent elections were held in November 2015. Turkey’s Supreme Election Board (YSK)
announced the official results, noting that the Justice and Development Party (AKP), Republican
People’s Party (CHP), Peoples’ Democratic Party (HDP) and Nationalist Movement Party (MHP)
obtained 317, 134, 59 and 40 seats, respectively.
The number of registered voters was reported to be just under 57 million people and the turnout rate
was 84.4 %.
Table 13-5: General Election Results40
Contesting Parties Votes (%) Seats in Parliament
AKPARTI Justice and Development Party 49.5 317
CHP Republicans People’s Party 25.3 134
MHP Nationalist Movement Party 11.9 40
HDP People’s Democratic Party 10.8 59
Table 13-6: General Election Results Kayseri41
Contesting Parties Votes (%) Seats in Parliament
AKPARTI Justice and Development Party (AKP) 65.6 7
MHP Nationalist Movement Party 18.4 1
CHP Republicans People’s Party 12.2 1
Table 13-7: General Election Results Develii42
Contesting Parties Votes (%)
AKPARTI Justice and Development Party (AKP) 71.5
MHP Nationalist Movement Party 17.3
CHP Republicans People’s Party 8.0
13.4.9 Informal Governance
Family life is important in the local culture; however leisure time is often spent separately by men and
women. Men meet in the local coffee shop and in the mosque to catch up with local news and to discuss
village matters. Women rarely meet in public places, but gather in a home of one of the women or in
40 http://www.ysk.gov.tr/ysk/content/conn/YSKUCM/path/Contribution%20Folders/SecmenIslemleri/Secimler/2015MVES/96-D.pdf. 41 www.ysk.gov.tr. 42 www.ysk.gov.tr.
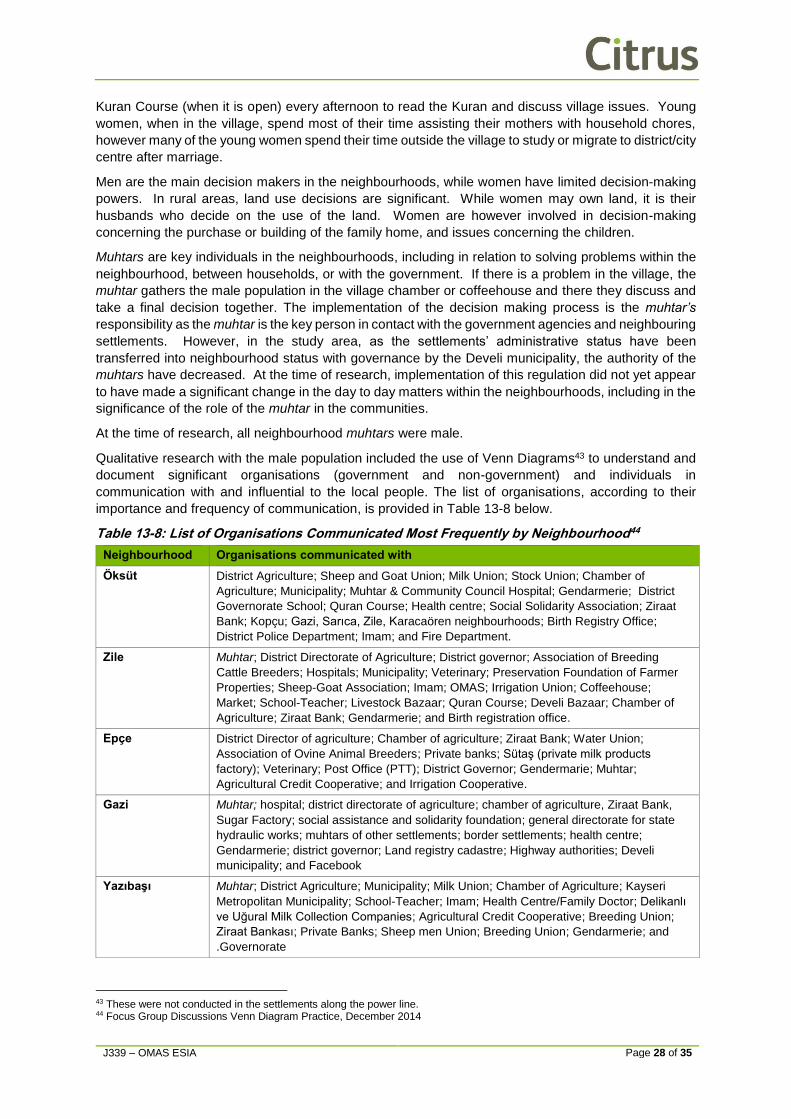
J339 – OMAS ESIA Page 28 of 35
Kuran Course (when it is open) every afternoon to read the Kuran and discuss village issues. Young
women, when in the village, spend most of their time assisting their mothers with household chores,
however many of the young women spend their time outside the village to study or migrate to district/city
centre after marriage.
Men are the main decision makers in the neighbourhoods, while women have limited decision-making
powers. In rural areas, land use decisions are significant. While women may own land, it is their
husbands who decide on the use of the land. Women are however involved in decision-making
concerning the purchase or building of the family home, and issues concerning the children.
Muhtars are key individuals in the neighbourhoods, including in relation to solving problems within the
neighbourhood, between households, or with the government. If there is a problem in the village, the
muhtar gathers the male population in the village chamber or coffeehouse and there they discuss and
take a final decision together. The implementation of the decision making process is the muhtar’s
responsibility as the muhtar is the key person in contact with the government agencies and neighbouring
settlements. However, in the study area, as the settlements’ administrative status have been
transferred into neighbourhood status with governance by the Develi municipality, the authority of the
muhtars have decreased. At the time of research, implementation of this regulation did not yet appear
to have made a significant change in the day to day matters within the neighbourhoods, including in the
significance of the role of the muhtar in the communities.
At the time of research, all neighbourhood muhtars were male.
Qualitative research with the male population included the use of Venn Diagrams43 to understand and
document significant organisations (government and non-government) and individuals in
communication with and influential to the local people. The list of organisations, according to their
importance and frequency of communication, is provided in Table 13-8 below.
Table 13-8: List of Organisations Communicated Most Frequently by Neighbourhood44
Neighbourhood Organisations communicated with
Öksüt District Agriculture; Sheep and Goat Union; Milk Union; Stock Union; Chamber of
Agriculture; Municipality; Muhtar & Community Council Hospital; Gendarmerie; District
Governorate School; Quran Course; Health centre; Social Solidarity Association; Ziraat
Bank; Kopçu; Gazi, Sarıca, Zile, Karacaören neighbourhoods; Birth Registry Office;
District Police Department; Imam; and Fire Department.
Zile Muhtar; District Directorate of Agriculture; District governor; Association of Breeding
Cattle Breeders; Hospitals; Municipality; Veterinary; Preservation Foundation of Farmer
Properties; Sheep-Goat Association; Imam; OMAS; Irrigation Union; Coffeehouse;
Market; School-Teacher; Livestock Bazaar; Quran Course; Develi Bazaar; Chamber of
Agriculture; Ziraat Bank; Gendarmerie; and Birth registration office.
Epçe District Director of agriculture; Chamber of agriculture; Ziraat Bank; Water Union;
Association of Ovine Animal Breeders; Private banks; Sütaş (private milk products
factory); Veterinary; Post Office (PTT); District Governor; Gendermarie; Muhtar;
Agricultural Credit Cooperative; and Irrigation Cooperative.
Gazi Muhtar; hospital; district directorate of agriculture; chamber of agriculture, Ziraat Bank,
Sugar Factory; social assistance and solidarity foundation; general directorate for state
hydraulic works; muhtars of other settlements; border settlements; health centre;
Gendarmerie; district governor; Land registry cadastre; Highway authorities; Develi
municipality; and Facebook
Yazıbaşı Muhtar; District Agriculture; Municipality; Milk Union; Chamber of Agriculture; Kayseri
Metropolitan Municipality; School-Teacher; Imam; Health Centre/Family Doctor; Delikanlı
ve Uğural Milk Collection Companies; Agricultural Credit Cooperative; Breeding Union;
Ziraat Bankası; Private Banks; Sheep men Union; Breeding Union; Gendarmerie; and
.Governorate
43 These were not conducted in the settlements along the power line. 44 Focus Group Discussions Venn Diagram Practice, December 2014

J339 – OMAS ESIA Page 29 of 35
Neighbourhood Organisations communicated with
Sarıca District Agriculture; Chamber of Agriculture; Beet Authorities; Independent Veterans;
Stock Unions; Schools; Quran course; Merchants; Municipality; District Governorate; and
muhtar.
Gömedi District Agriculture; Chamber of Agriculture; District Government; muhtar; Municipality;
Milk Union; Stock Union; Wheat, kernel merchants; KASKİ (Kayseri Water and Sewerage
Affairs); Ziraat Bankası; and muhtar.
Tombak Chamber of Agriculture; District Agriculture; Beet Cooperative; Merchant; and TMO.
Yukarı Develi The Venn Diagram could not be developed as participants did not want to participate.
The Venn Diagram activity demonstrated that the organisations and individuals with the most significant
contact with the local community is highly dependent on the main economic activity of the local
residents. While the majority of the governmental agencies engaging with the communities are the
same across all neighbourhoods, their relative importance differed in accordance with economic
priorities and issues of local concern.
Across all neighbourhoods, the male participants described the varying degrees of influence and
interest of key organisations and individuals. Noted across all neighbourhoods in the social study area
included:
The muhtar;
Livestock and/or farm produce unions;
The District Directorate of Agriculture.
Also featured in most but not all discussions included:
The Develi municipality;
Bank.
During research, the participants discussed the problems with agencies and organisations, which
although the Venn Diagram component was held with groups of men, also raised issues of concern
with female citizens. In Öksüt, participants mentioned that they have problems with State Hydraulic
Works (DSİ) and the Kayseri Water and Sewerage Administration (KASKİ) because of frequent water
cuts. Further, they described challenges with the Ziraat Bank due to high interest for agricultural credit
opportunities, and with the Quran Course (which is attended by women) because they do not have a
hodja (Muslim schoolmaster).
In Zile, participants raised the issue of low animal prices (15-20 TRY), lower compared to the eastern
side of Turkey (75 TRY); Kayseri has been recognized as a wealthy province and hence from that
district farmers cannot gain higher prices. On the other hand, the participants mentioned that they
would like to participate in informative meetings conducted by the Develi Directorate of District Food
Agriculture and Livestock about credit opportunities, support and/or other relevant foundational courses.
The most common means of communication with the government agencies was described as written
communications; however there are some cases that people contact departments verbally. The majority
of the local residents who participated in focus group discussions have mentioned that the muhtar is
the most accessible and communicative agency in the region.
13.4.10 Social Cohesion
Reports from the Kayseri Free Zone, an initiative to promote exports of goods and services, indicate
the challenges of differing social behavioural expectations between the larger cities in Turkey (such as
Ankara and Istanbul) and provincial centres including Kayseri. This includes that certain behaviours,
such as drinking alcohol in public are not encouraged45, and at the municipality level this is not
45 Kayseri: Eye of the Anatolian Tiger, US Cable, 22 Feb 2007 (https://wikileaks.org/plusd/cables/07ANKARA385_a.html)

J339 – OMAS ESIA Page 30 of 35
permitted46. The reported Kayseri experience suggests that these social standards have resulted in
challenges to attract and retain a workforce unused to living in a conservative social environment.
Baseline research revealed generally conservative neighbourhoods in the study area with respect to a
willingness to accept outsiders into their communities. While research participants stated that there
were no problems with outsiders, most focus group discussions reflected the view that outsiders are
not easily accepted. Exceptions were:
Where outsiders come recommended from someone within the neighbourhood;
Where outsiders comply with the behaviours expected in the neighbourhood;
Seasonal workers not seeking permanent residency;
Women from outside a neighbourhood who marry a resident (noting that brides are migrating in
from other neighbourhoods within the study area).
Another particular exception (one instance across all neighbourhoods in the study area) is of a refugee
household where it appeared the family could stay, provided there was little integration with the wider
neighbourhood community. This may also have been due to or influenced by language barriers of the
in-migrants.
13.5 Impact Assessment
This section identifies and assesses impacts to the population and society in the social study area for
the construction, operations and closure phases of the Project.
Scoped In
Impacts on the study area population will potentially occur during the Project’s construction, operations
and closure phases. Anticipated impacts include:
Influx Disruption to Communities.
Scoped Out
No impacts were scoped out.
13.5.1 Construction, Operations and Closure Phase Impacts and Mitigation
Measures
Influx Disruption to Communities
Impact Assessment
Impact Influx Disruption to Communities
Receptor
Sensitivity47
High
Impact
Magnitude
Indirect, long term, localised and likely to occur.
High impact magnitude
Significance Major adverse
Influx is a complex topic that is linked and overlaps with numerous other topics considered in the socio-
economic sections of the ESIA. Some of the more specific topics, inflation and changes in infrastructure,
46 Baseline research December 2014 47 Sensitivity for social impacts, unlike environmental impacts that are linked to the quality and rarity of the receptor, is linked to the consequence of a change and whether a change would impair (or benefit) quality of life. “Very high” would seriously impair (or substantially improve) quality of life. “Low” would be a change from baseline conditions, but not impair or change the quality of life.

J339 – OMAS ESIA Page 31 of 35
are considered in other sections, whereas this section will deal with less tangible aspects such changes
in social capital, relations between outsiders and newcomers and the other indirect changes newcomers
can make on the study area.
An influx of workers is associated with numerous indirect impacts, especially during construction.
Planned well, the arrival of new workers has relatively small or noticeable impacts. But without
appropriate mitigation steps, the arrival of new workers can create increased competition for resources
and attract other economic migrants looking for employment or new livelihoods, affecting baseline
migration trends. Without commitments to address these potential issues, influx is expected to
contribute to the overall negative impact in the local areas around the Project site.
Impact analysis considers these elements of influx and the key assumptions linked to direct employment
and worker accommodation. As possible, it also aims to consider common indirect changes such as
non-employee workers who come to the study area outside of the control of OMAS.
Social maladies – increased, alcohol and drug use or other behaviours not consistent with local norms
– are a common indirect element of influx. This can be more severe when workers are living away from
their spouses and families for extended periods of time. Baseline research indicates that the more rural
areas are likely to be more conservative than urban skilled workers who may come from larger towns
and cities in Kayseri or other parts of Turkey.
Interviews with authorities suggest that there is no prostitution or related businesses, which is attributed
to the conservative and religious population. Alcohol is not served publically in restaurants in Develi.48
While there is some alcohol consumption, this is not seen in public. Drug use and gambling, also
reported in the study area, are not easy to quantify. Anecdotal information suggests that the mixture of
limited economic and employment opportunities, coupled with alcohol or drug use among young men,
create the most common causes of crime. The crime that is most commonly reported is linked to
burglary, which is higher in winter months when properties are more likely to be vacant. The District
Gendarmerie Command said that there has been no noticeable change in crime rates over the last five
years. When asked about the dynamic of Syrian refugees, he reported that this has not affected crime.
Engagement has demonstrated the potential for social fracture due to influx, or non-inclusion of
outsiders, between and within neighbourhoods. This suggests the potential for fracture or conflict if the
Project is, or is perceived to be, the source of new and unwelcome households in the study area.
Jealousies from securing (or not securing) training or employment with the mine compared to in-
migrants or citizens from other neighbourhoods may also disrupt social capital.
Perceived or actual differences between and within neighbourhoods may also come from a number of
other sources, potentially leading to social fracture or disruption in the study area, including:
Antisocial behaviour -- for example, exploitative sexual behaviour, alcohol/drug use, petty crime --
due to their accessibility, or in response to social changes in the study area;
Wage differences within or between OMAS employees and contractors.
The Project anticipates 405 workers during construction with 456 expected during operations. The
multiplier effect of these positions, explained in more detail in Chapter 14 on Economics and
Employment, predicts a range of additional or “induced” influx from 1,140 - 2,098. The workforce will be
incentivised to live in Develi rather than the neighbourhoods, with the exception of those individuals that
are local to the neighbourhood or have an existing connection there.
Key assumptions around housing workers is that:
All unskilled and semi-skilled workers will be hired locally (within Develi District) and will live at home
and travel daily to their place of work;
All OMAS skilled workers for construction will be hired from outside Develi District and will require
accommodation;
48 Key informant interview, 26 January 2016.
J339 – OMAS ESIA Page 32 of 35
35% of Contractor skilled workers will be hired from outside Develi District (reducing to 20% in
operations) and will require accommodation;
No accommodation will be provided in the fence line;
Construction contractors for the access road and pipeline may use temporary camps along the
alignment, subject to pastureland permit approval;
All in-coming workers will be housed in Develi or in Kayseri, if required;
Accommodation for OMAS and contractors will meet EBRD/IFC work accommodation guidelines.
Receptor sensitivity is identified as high given the range of aspects influencing influx. While not all
aspects are easy to quantify, changing dynamics can have important consequences for local
settlements. The impact is indirect and long term, though the most critical time for influx is when
newcomers first arrive. The impact will be localised and the changes are likely to occur. Considered
together with baseline conditions and the assumptions above, the significance is considered to be of
high magnitude for a significance of major adverse prior to mitigation.
Impact Mitigation
The most important aspect to mitigating the negative impact of influx is related to the management of
workers in OMAS and those in contractors. How and where people are housed, how they behave and
how they treat current residents will all influence how the change affects community cohesion.
As part of its decision-making on worker housing, OMAS consulted with Develi authorities responsible
for security, housing and accommodation, health and infrastructure49. The purpose of the meetings
specifically raised questions around the municipalities ability absorb newcomers working at the mine.
In all cases, officials stated that a population increase associated with the worker estimates for OMAS
and contractors would not create noticeable change for a town of almost 40,000 people.
OMAS will provide housing allowances and encourage relocating workers to settle in Develi town,
providing transport for workers to and from the mine site. By trying to maximise local employment, which
includes setting standards and guidelines for local employment among its contractors, OMAS will
minimise the number of newcomers. For those that do come to the study area, they will not be housed
in smaller settlements outside of Develi except in the instances of construction of the powerline and
access road. In each of those instances, if camps are needed, they will be short term.
Even short term presence, however, can be a problem. To address this, human resource policies
(described in more detail in Chapter 14 on Economics and Employment) require workers and
contractors to uphold laws and it forbids discrimination or harassment. The human resources policies
also uphold principles of transparency in recruitment and employment, which reduce the risk of
perceived corruption or nepotism within the employment process, another dynamic than can affect
social cohesion. The Local Employment and Training Procedure (OMAS-HR-PRC-004) includes
important commitments to train workers and provides for OMAS’s and contractor employment
processes to be open to audits. This level of transparency provides a check on both employment
practice, as well as external perceptions of workers. The monitoring process explicitly includes
contractors and is outlined in the Contractor Management Framework (OMAS-ESMS-CM-PLN-001).
The Community Conflict and Resolution Policy (OMAS-HSEC-POL-003) is an existing OMAS policy
that aims to solve issues that may arise with all external stakeholders in a proactive way. The policy
creates clear lines of management responsibility for potential community problems between the
Community Relations Manager and Security Manager. It is reliant upon proactive stakeholder
engagement to ensure that all citizens are aware of how to raise a grievance with any real or perceived
impact on the community. This proactive engagement and efforts to identify problems through
engagement activities and making the grievance widely available are key to identifying hard-to-predict
impacts of influx.
49 Officials met are included in section 13.3.3 on Methodology.
J339 – OMAS ESIA Page 33 of 35
Engagement activities include regular meetings with muhtars and the municipality to minimise
speculative migration by jobseekers to the study area, including monitoring any demographic changes
in comparison to baseline data, to limit the potential for in-migration and so, conflict, with communities.
This engagement includes liaising with government agencies to include any issues of law enforcement
requirements and/or anti-social behaviour that may result due to the Project.
Residual Effects
With the appropriate application of the cited mitigation measures, the residual significance of influx is
considered to be moderate adverse. The residual effect takes into account that some newcomers will
be outside of the control of OMAS. Individuals and businesses not affiliated with OMAS or its contractors
that move into Develi or surrounding parts of the study area create a risk. The responsibility for this
primarily falls to the government authorities. As it can, OMAS will cooperate with the authorities through
its ongoing engagement.
13.5.2 Summary of Impacts and Mitigation Measures
A summary of potential impacts and proposed mitigation measures as described above are summarised
in Table 13-9 below.

J339 – OMAS ESIA Page 34 of 35
Table 13-9: Summary of Impacts and Mitigation Measures
Impact Receptor Receptor
Sensitivity
Impact
Categorisation
Magnitude
of Impact
Potential
Effect
Significance
Design and Mitigation Measures Management Plans,
Policies and
Procedures
Residual
Effect
Significance
Influx
Disruption to
Communities
Develi High Indirect
Long term
Localised
Likely to occur
High Major
adverse
Provide housing allowance to
encourage settlement in Develi
town.
Adhere to human resources
policies that seek to establish
fair, transparent and equal
opportunity employment.
Adhere to the Community
Conflict and Resolution Policy to
minimise worker/community
conflicts.
Engage in regular meetings with
muhtars and the municipality to
manage influx and monitor
demographic changes or
problems.
Human Resources
Policy
Respectful Workplace
Policy
Human Resources
Policy and Procedure
Local Employment and
Training Procedure
Community Conflict
and Resolution Policy
Stakeholder
Engagement Plan
Grievance Procedure
Moderate
adverse

J339 – OMAS ESIA Page 35 of 35
13.6 Monitoring Requirements
The following Table 13-10 specifies the monitoring requirements for population and society.
Table 13-10: Population and Society Monitoring Requirements
Source Document Monitoring Location Parameters Frequency
Stakeholder
Engagement Plan
OMAS-ESMS-SEP-
PLN-001 and
Grievance Procedure
OMAS-HSEC-PRC-003
CR Office
Communities
Stakeholder
Engagement
Register
Grievance register
Commitments audit
records
Survey results with
key stakeholders
Ongoing and monthly
reviews
Annual reporting for life
of mine
Community Relations
and Conflict
Prevention Protocol
OMAS-HSEC-POL-003
CR Office
Security office
Contractor office
Communities
Stakeholder
Engagement
Register
Grievance register
Contractor records
Security records
Incident reports
Ongoing and monthly
reviews
Annual reporting for life
of mine
Construction Impacts
Management
Procedure
OMAS-HSEC-PRC-001
Project Manager
office
Construction
Contractor office
Communities
Stakeholder
Engagement
Register
Grievance register
Contractor records
Incident reports
Daily unforeseen
disruption reports
Weekly reporting for
construction phase
Community
Development
Framework
OMAS-ESMS-CD-PLN-
001
CR Office
Communities
Stakeholder
Engagement
Register
Grievance register
Commitments audit
records
Survey results with
key stakeholders
Ongoing and monthly
reviews
Annual reporting for life
of mine