T3 Webinar September 2012 Performance Measures Edward J. Smaglik September 18 th, 2012.
17
T3 Webinar September 2012 Performance Measures Edward J. Smaglik September 18 th , 2012
-
Upload
larissa-bufkin -
Category
Documents
-
view
216 -
download
2
Transcript of T3 Webinar September 2012 Performance Measures Edward J. Smaglik September 18 th, 2012.

T3 WebinarSeptember 2012
Performance Measures
Edward J. SmaglikSeptember 18th, 2012

T3 WebinarSeptember 2012
Green Occupancy Ratio (GOR) and Arrival Type (AT)
Data requirementsTheoryPerformance data Signal Performance Progression Performance

T3 WebinarSeptember 2012
Data Requirement
Event based data (0.1 second resolution) Controller or other data collection
device
Phase and detector status GOR: Phase, stopbar presence AT: Phase, advance count (presence
can be used)
T3 WebinarSeptember 2012
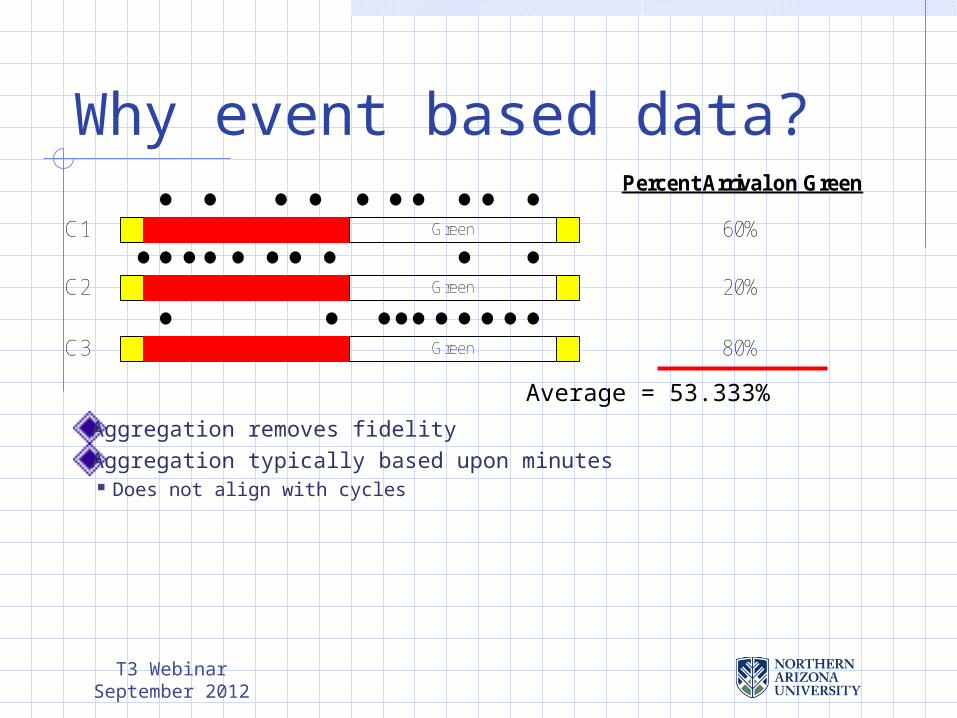
Average = 53.333%
Why event based data?
Aggregation removes fidelityAggregation typically based upon minutes Does not align with cycles
Green
Percent Arrival on Green
60%
Green 20%
Green 80%
C1
C2
C3

T3 WebinarSeptember 2012
Green Occupancy Ratio
where Og = Occupancy of a green interval
i Ld = Length of detection zone Lc = Length of vehicle
i
g
g
OGOR
tg
DetectionZone
th
Lc
Vc
Lc Ld
n
i ci
dcig V
LLO
1
)(
Vc = Velocity of vehicle tg = time gap between vehicles th = time headway
between vehicles
T3 WebinarSeptember 2012
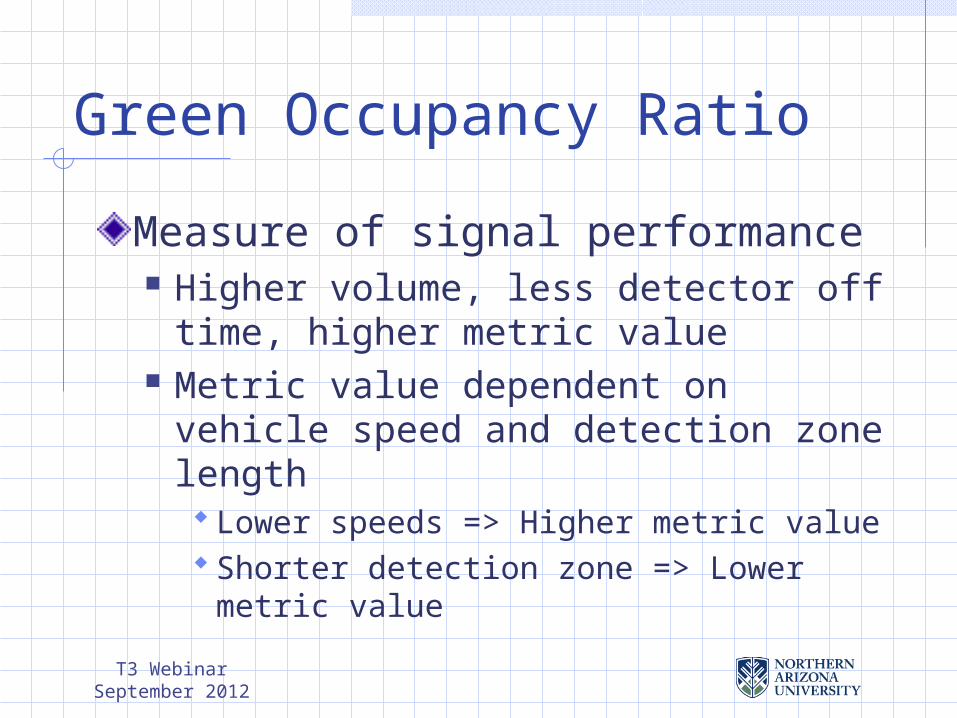
Green Occupancy Ratio
Measure of signal performance Higher volume, less detector off time,
higher metric value Metric value dependent on vehicle
speed and detection zone length Lower speeds => Higher metric valueShorter detection zone => Lower metric
value
T3 WebinarSeptember 2012
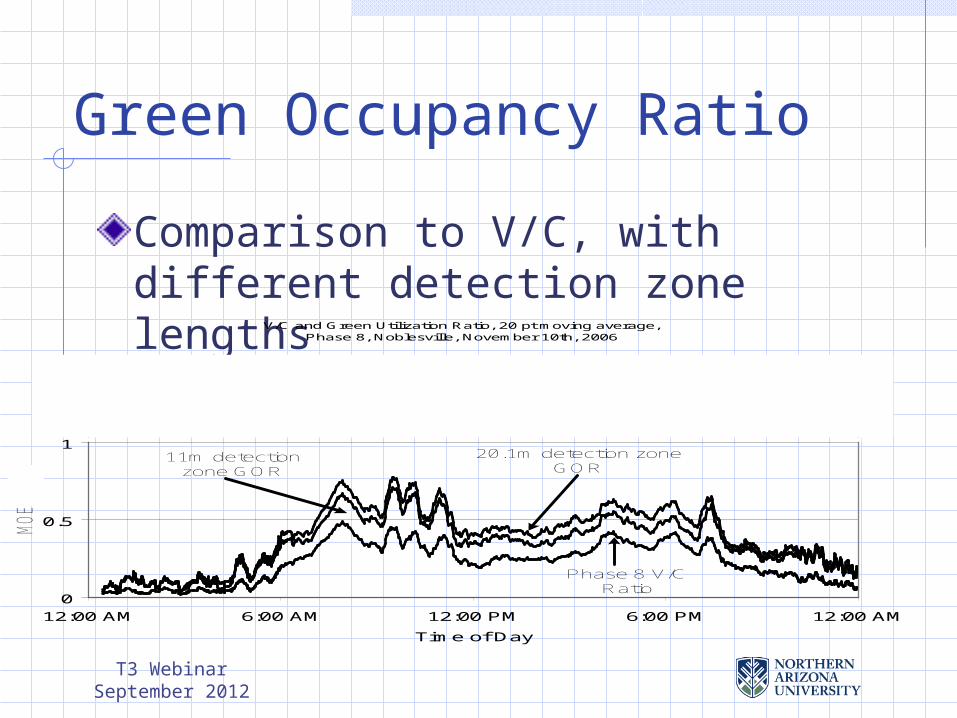
Green Occupancy Ratio
Comparison to V/C, with different detection zone lengths
20.1m detection zoneGOR
11m detectionzone GOR
Phase 8 V/CRatio
V/C and Green Utilization Ratio, 20 pt moving average,Phase 8, Noblesville, November 10th, 2006
0
0.5
1
1.5
12:00 AM 6:00 AM 12:00 PM 6:00 PM 12:00 AM
Time of Day
MO
EMO
E

T3 WebinarSeptember 2012
Arrival Type
Measure of progression performanceWell known Highway Capacity Manual concept Value has impact on delay calculation Value can be developed
QualitativelyQuantitatively
T3 WebinarSeptember 2012
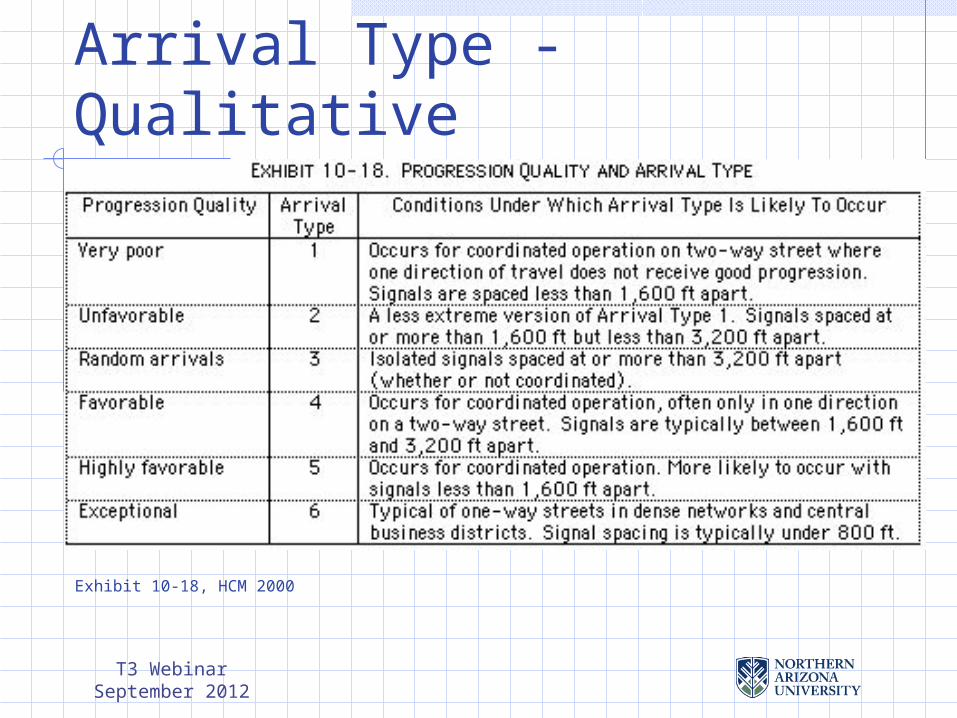
Arrival Type - Qualitative
Exhibit 10-18, HCM 2000
T3 WebinarSeptember 2012
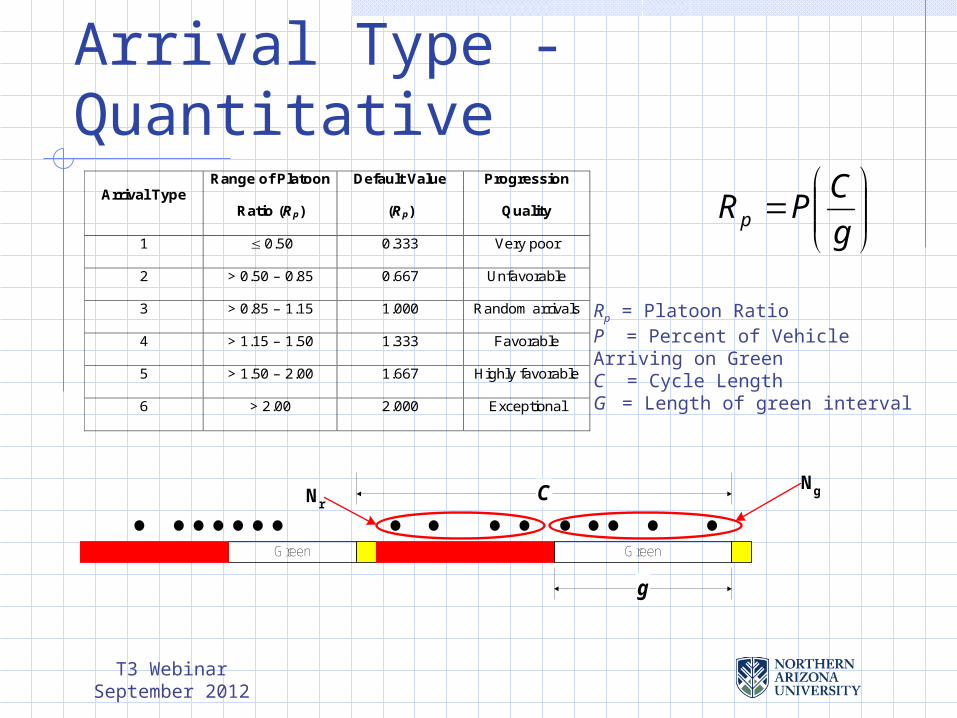
Arrival Type - Quantitative
g
CPRp
Arrival Type Range of Platoon
Ratio (Rp)
Default Value
(Rp)
Progression
Quality
1 0.50 0.333 Very poor
2 > 0.50 – 0.85 0.667 Unfavorable
3 > 0.85 – 1.15 1.000 Random arrivals
4 > 1.15 – 1.50 1.333 Favorable
5 > 1.50 – 2.00 1.667 Highly favorable
6 > 2.00 2.000 Exceptional
Rp = Platoon RatioP = Percent of Vehicle Arriving on GreenC = Cycle LengthG = Length of green interval
Green Green
g
C NgNr
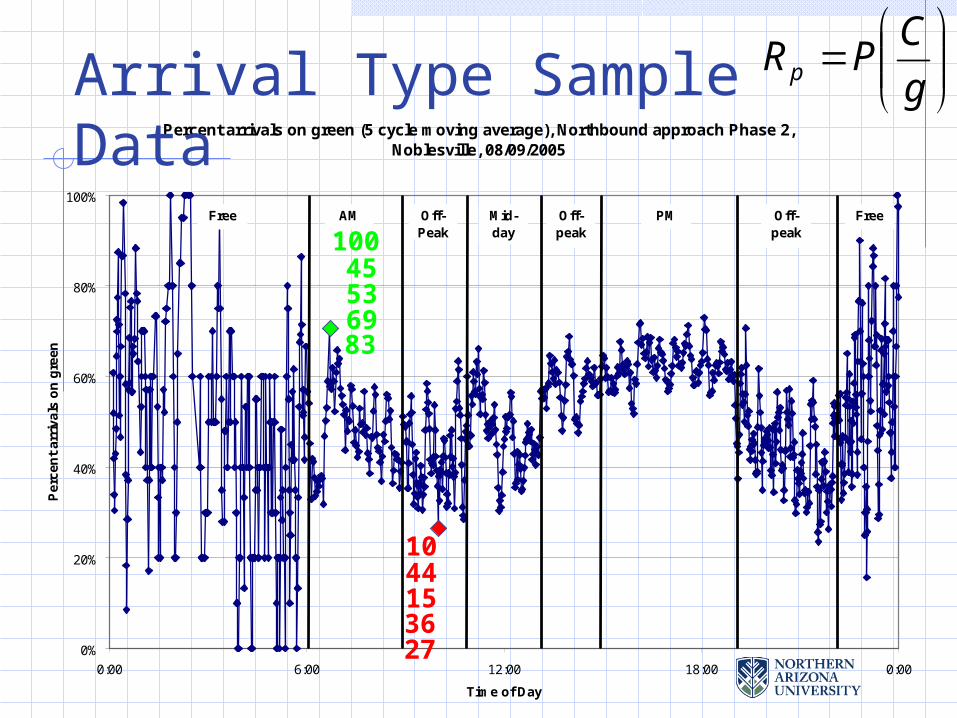
Percent arrivals on green (5 cycle moving average), Northbound approach Phase 2, Noblesville, 08/09/2005
0%
20%
40%
60%
80%
100%
0:00 6:00 12:00 18:00 0:00
Time of Day
Per
cen
t ar
riva
ls o
n g
reen
AM Off-Peak
Mid-day
Off-peak
PM Off-peak
FreeFree
10045536983
1044153627
g
CPRpArrival Type Sample Data

T3 WebinarSeptember 2012
Arrival Type (20 cycle moving average), Northbound approach Phase 6, Noblesville, 07/25/2006ASC/3 Data
0
1
2
3
4
5
6
0:00 6:00 12:00 18:00 0:00
Time of Day
Arr
ival
Typ
e
Arrival Type Lane A Lane B Lane C Estimated Continuous Arrival Type
AM Off-Peak
Mid-day
PM Off-peak
FreeFree Off-Peak
g
CPRp
Progression
Quality
Very poor
Unfavorable
Random arrivals
Favorable
Highly favorable
Exceptional
Progression
Quality
Very poor
Unfavorable
Random arrivals
Favorable
Highly favorable
Exceptional
Progression
Quality
Very poor
Unfavorable
Random arrivals
Favorable
Highly favorable
Exceptional
Arrival Type Sample Data

T3 WebinarSeptember 2012
City of Mesa test intersection
E. Southern Rd & S. Power Ave located on the east side of MesaGeography Adjacent to Shopping Mall and
Retirement Community ½ mi north of US 60 Wide Streets
Adaptive control system location

T3 WebinarSeptember 2012

T3 WebinarSeptember 2012
Generic Data Collection Diagram
Coax cablefrom camera
8 inputs LT green Th green
6 auxiliary for detector monitoring
24V signal orload switch
Loop detectorrack outputs
Overlay
Data fileCoax Cable from camera
Phase Status SDLC Bus
Detection Device Status
(Loop or other)
TS1 Contact Closure Inputs (16)
DataCollection
Device
T3 WebinarSeptember 2012
4
3
2
1
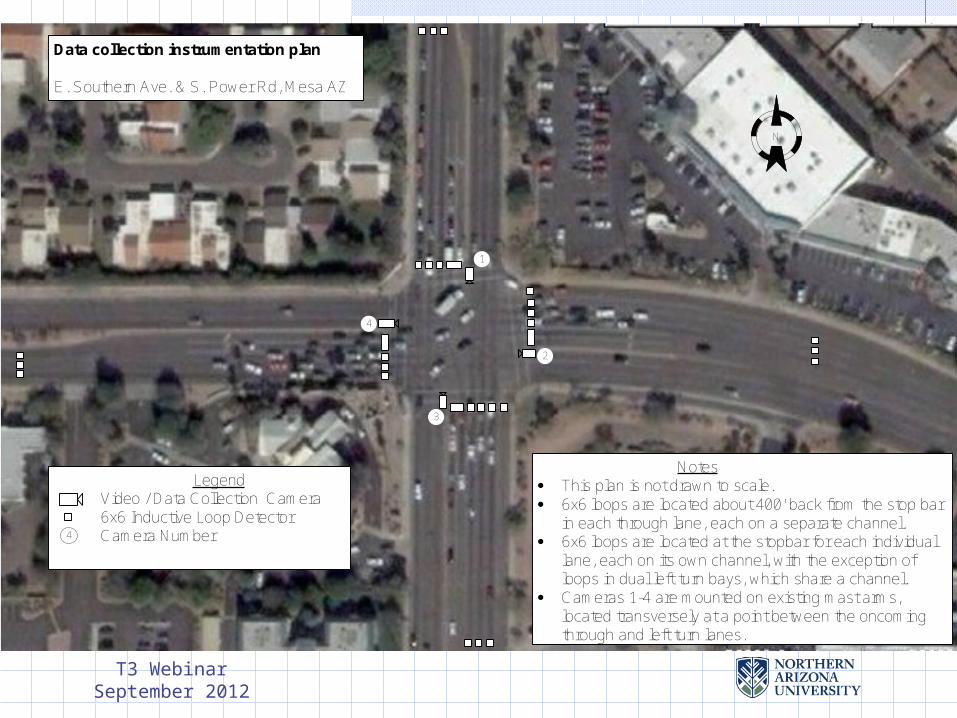
LegendVideo / Data Collection Camera6x6 Inductive Loop DetectorCamera Number
N
Data collection instrumentation plan
E. Southern Ave. & S. Power Rd, Mesa AZ
Notes· This plan is not drawn to scale.· 6x6 loops are located about 400' back from the stop bar
in each through lane, each on a separate channel.· 6x6 loops are located at the stopbar for each individual
lane, each on its own channel, with the exception of loops in dual left turn bays, which share a channel.
· Cameras 1-4 are mounted on existing mast arms, located transversely at a point between the oncoming through and left turn lanes.
4
T3 WebinarSeptember 2012
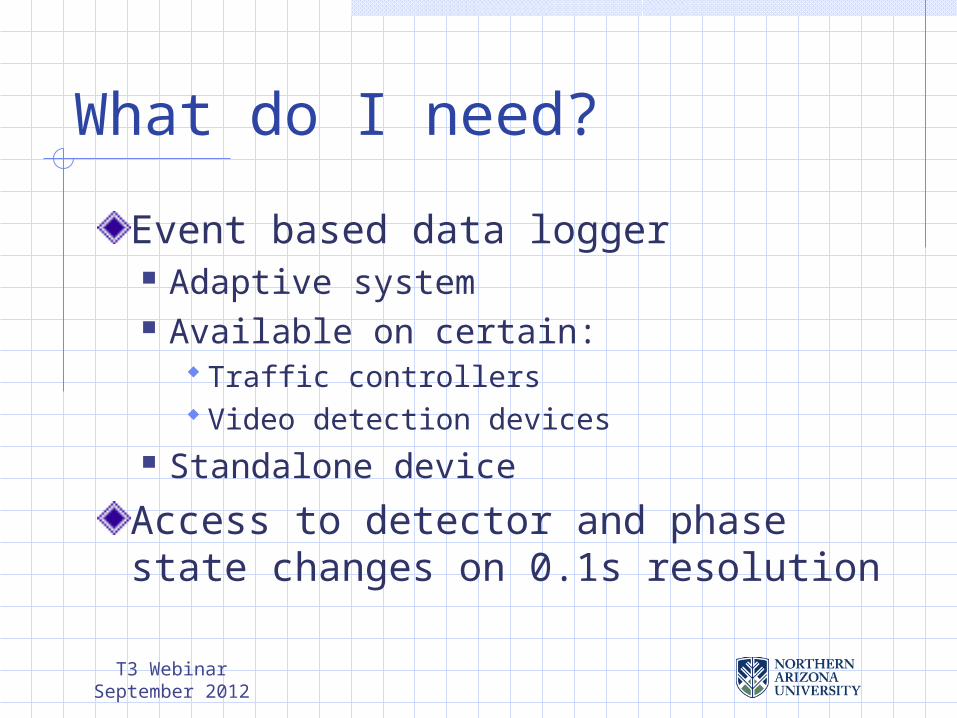
What do I need?
Event based data logger Adaptive system Available on certain:
Traffic controllersVideo detection devices
Standalone device
Access to detector and phase state changes on 0.1s resolution


![Friday, 21 September Saturday, 22 September Alessandro ... · A neuromechanical approach to neuromuscular responses to exercise [Polo Zanotto - Aula T3] Chair: Francesco Felici (Rome)](https://static.fdocuments.us/doc/165x107/5c8e0a5609d3f20b4a8c01b7/friday-21-september-saturday-22-september-alessandro-a-neuromechanical.jpg)


![HometownRx Formulary - September 2020 · 9/11/2020 · ALDACTAZIDE TABLET [T3] [BP] ALDACTONE TABLET [T3] [BP] ALDARA CREAM [T3] [BP] ALECENSA CAPSULE [T4] [PA][SP] For plan specific](https://static.fdocuments.us/doc/165x107/6064a5dc71a98271fe20e794/hometownrx-formulary-september-2020-9112020-aldactazide-tablet-t3-bp.jpg)