T3 - Project Proposal and Feasibility Study · PDF fileTable of Contents 1. ... Project...
75
Project P Proposal Bry N Er Na C Senior E Dece Cal l and Fea yan Bandstra ate Barker rik Barton ate Sportel hris Vonk Design Proj ENGR 339 ember 8, 200 lvin College asibility S a ject 06 Study
Transcript of T3 - Project Proposal and Feasibility Study · PDF fileTable of Contents 1. ... Project...

Project PProposal
BryNErNaC
Senior E
DeceCal
l and Fea
yan Bandstraate Barker rik Barton ate Sportel hris Vonk
Design Proj
ENGR 339 ember 8, 200lvin College
asibility S
a
ject
06
Study

ii
Abstract The primary objective of this project is to design and produce an aftermarket system that will be able to detect the speed and distance of a vehicle directly ahead of the adaptive cruise control equipped vehicle (ACCEV) and automatically adjust the speed of the ACCEV to maintain a minimum separation. This will be accomplished using radar, vehicle BUS interconnect, and control software. Relevant information and controls will be displayed on a LCD touch screen. A prototype system will be designed for the 2002 Chrysler Sebring LX. The project has been determined to be feasible in scope, schedule, and cost, and will be completed by the appointed deadline of May 5, 2007. We estimate that we will be able to sell our system for approximately $1,850, and sell approximately 7,500 units in our first year.

iii
Table of Contents 1. Introduction ............................................................................................................................. 1
1.1. Team Description ............................................................................................................. 2 1.2. Project Proposal and Feasibility Study Overview ............................................................ 3
2. Terms ...................................................................................................................................... 4 3. Objectives ............................................................................................................................... 5 4. Project Management ............................................................................................................... 6
4.1. External Organization ...................................................................................................... 6 4.2. Internal Organization ........................................................................................................ 6 4.3. Project Timeline ............................................................................................................... 7
4.3.1. Major Milestones ...................................................................................................... 7 4.3.2. Timeline Risks .......................................................................................................... 7
5. Design Norms ......................................................................................................................... 8 5.1. Cultural Appropriateness .................................................................................................. 8 5.2. Transparency and Integrity ............................................................................................... 8 5.3. Stewardship ...................................................................................................................... 9 5.4. Justice & Caring ............................................................................................................. 10 5.5. Humility ......................................................................................................................... 10
6. Research ................................................................................................................................ 11 6.1. Existing Adaptive Cruise Control Systems .................................................................... 11
6.1.1. System Types .......................................................................................................... 11 6.1.2. Current Users .......................................................................................................... 11 6.1.3. Current Third Party ACC Manufacturers ............................................................... 11 6.1.4. Current System Cost ............................................................................................... 11
6.2. Cruise Control ................................................................................................................ 12 6.2.1. General .................................................................................................................... 12 6.2.2. Cruise Control Buttons ........................................................................................... 13 6.2.3. Other Components .................................................................................................. 14
6.3. Communication with Existing Car Cruise Control System ........................................... 15 6.4. Audio in Vehicle ............................................................................................................ 16
6.4.1. Audible Warning with Safety Belts ........................................................................ 16 6.4.2. Mobileye-AWS ....................................................................................................... 16
6.5. Patents ............................................................................................................................ 17 6.5.1. Abstract – Patent # 7,054,733 – Adaptive Cruise Control System for Vehicle (15) 17 6.5.2. Background of the Invention .................................................................................. 17 6.5.3. Summary of the Invention ...................................................................................... 17
6.6. FCC Regulations ............................................................................................................ 18 7. System Architecture .............................................................................................................. 19
7.1. Detection Unit ................................................................................................................ 19 7.2. User Input and Output/Feedback .................................................................................... 19
7.2.1. Input ........................................................................................................................ 19 7.2.2. Output/Feedback ..................................................................................................... 19
7.3. BUS System ................................................................................................................... 19 9. Project Requirements ............................................................................................................ 20

iv
9.1. Function .......................................................................................................................... 20 9.1.1. Detection ................................................................................................................. 20 9.1.2. Operation................................................................................................................. 20 9.1.3. BUS System ............................................................................................................ 20
9.2. Performance ................................................................................................................... 21 9.2.1. Environmental ......................................................................................................... 21
9.3. Physical .......................................................................................................................... 21 10. Safety Features ................................................................................................................... 23
10.1. Maintain and Monitor a Safe Driving Distance.......................................................... 23 10.2. An Override Switch .................................................................................................... 23 10.3. Brake Disengagement of System ................................................................................ 23 10.4. Displays and Warnings ............................................................................................... 24 10.5. Overflow Prevention................................................................................................... 24 10.6. The Turning Situation ................................................................................................. 24 10.7. The Hill Situation ....................................................................................................... 24 10.8. The Drunk Driver Situation ........................................................................................ 24 10.9. Range of Use .............................................................................................................. 24
11. Calculations........................................................................................................................ 26 11.1. Fuel Economy Estimations ......................................................................................... 26
11.1.1. Background ......................................................................................................... 26 11.1.2. Method of Calculation ......................................................................................... 26 11.1.3. Conclusion ........................................................................................................... 27
11.2. Following Distance ..................................................................................................... 28 11.2.1. Calculating Following Distance .......................................................................... 28 11.2.2. Clarifications ....................................................................................................... 28
12. Design Decisions ............................................................................................................... 30 12.1. System Architecture ................................................................................................... 30
12.1.1. Basic Overview ................................................................................................... 30 12.1.2. Physical Hardware ............................................................................................... 30 12.1.3. Computer Hardware ............................................................................................ 31 12.1.4. Computer Software ............................................................................................. 31
12.2. Detection Method ....................................................................................................... 31 12.2.1. mm-Wave Radar ................................................................................................. 31 12.2.2. Laser .................................................................................................................... 32 12.2.3. Image Recognition .............................................................................................. 32 12.2.4. Ultrasonic ............................................................................................................ 33 12.2.5. Detection Method Decision ................................................................................. 33
12.3. Display ........................................................................................................................ 36 12.3.1. No Display – Buttons Only ................................................................................. 37 12.3.2. LED Display ........................................................................................................ 37 12.3.3. LCD Display ....................................................................................................... 38 12.3.4. Display Design Decision Conclusion .................................................................. 39
12.4. Sound .......................................................................................................................... 40 12.4.1. Sound Display Design Conclusion ...................................................................... 40
13. System Design ................................................................................................................... 41 14. Prototype Description ........................................................................................................ 43

v
15. Testing................................................................................................................................ 44 15.1. Barriers to Testing ...................................................................................................... 44
15.1.1. Test Phase Safety ................................................................................................ 44 15.1.2. FCC License ........................................................................................................ 44
15.2. Test Parameters........................................................................................................... 44 15.2.1. Detection Unit ..................................................................................................... 44
15.3. Test Plans .................................................................................................................... 45 15.3.1. Detection Unit ..................................................................................................... 45 15.3.2. Control Unit......................................................................................................... 47 15.3.3. Final Prototype .................................................................................................... 47
16. Contingency Plans ............................................................................................................. 48 16.1. Introduction ................................................................................................................ 48 16.2. Unavailable Radar Unit .............................................................................................. 48 16.3. Difficulty Connecting to Vehicle BUS ....................................................................... 48 16.4. Inadequate Testing Facilities ...................................................................................... 48 16.5. Trouble Obtaining a FCC License .............................................................................. 48 16.6. Difficulty Getting the LCD and Controller to Communicate ..................................... 48
17. Budget and Financial Planning .......................................................................................... 50 17.1. Introduction ................................................................................................................ 50 17.2. Expenses ..................................................................................................................... 50
17.2.1. Design Cost ......................................................................................................... 50 17.2.2. Building Cost ....................................................................................................... 50 17.2.3. Machine Cost ....................................................................................................... 51 17.2.4. Prototype Cost ..................................................................................................... 51 17.2.5. Parts Cost............................................................................................................. 51 17.2.6. Advertising and Marketing Costs ........................................................................ 52 17.2.7. Business Strategy and Variable Costs ................................................................. 53
18. Conclusion ......................................................................................................................... 61 19. Works Cited ....................................................................................................................... 62 20. Acknowledgements ............................................................................................................ 64 21. Appendices ......................................................................................................................... 65
21.1. Project Timeline ......................................................................................................... 65 21.2. Supplemental Calculation Information ....................................................................... 66 21.3. Market Information..................................................................................................... 67

vi
Table of Tables Table 2-1 - Table of Acronyms ....................................................................................................... 4 Table 9-1 - Fuel Economy Improvements .................................................................................... 27 Table 10-1 - Detection Methods Decision Matrix ........................................................................ 33 Table 10-2 - Detection Method Decision Criteria ........................................................................ 34 Table 10-3 - Visteon Radar System Specifications ...................................................................... 34 Table 10-4 - TRW AC10 Radar System Specifications ............................................................... 35 Table 10-5 - Display Type Decision Matrix ................................................................................. 36 Table 10-6 - Display Decision Criteria ......................................................................................... 36 Table 10-7 - Sound Decision Matrix ............................................................................................ 40 Table 10-8 - Sound Decision Criteria ........................................................................................... 40 Table 19-1 - Travel Log ................................................................................................................ 66 Table 19-2 - Third Party ACC Developers ................................................................................... 67
Table of Equations
Equation 9-1 - Following Distances ............................................................................................. 28

vii
Table of Figures Figure 1-1 - Passenger Vehicle Injury Statistics ............................................................................. 1 Figure 1-2 - Calvin Cruise Team Picture ........................................................................................ 2 Figure 6-1 - Basic Cruise Control Block Diagram ....................................................................... 12 Figure 6-2 - Cables to Gas Pedal and Vacuum Actuator .............................................................. 13 Figure 6-3 - Vacuum Actuator That Controls Throttle ................................................................. 14 Figure 6-4 - The Brains of Cruise Control .................................................................................... 15 Figure 6-5 - J1850 Transmission Signal Format ........................................................................... 15 Figure 6-6 - Mobileye-AWS Display Unit ................................................................................... 16 Figure 10-1 - Architecture Decisions ............................................................................................ 30 Figure 10-2 - Basic LED Display ................................................................................................. 37 Figure 10-3 - Advanced LED Display .......................................................................................... 38 Figure 10-4 - LCD Touch Screen Display .................................................................................... 39 Figure 11-1 - Basic System Design .............................................................................................. 41 Figure 13-1 - Detection Unit Test Setup 1 .................................................................................... 46 Figure 13-2 - Detection Unit Test Setup 2 .................................................................................... 46 Figure 19-1 - Project Timeline ...................................................................................................... 65

1
1. Introduction Every year the highways of the United States become more congested, with an increasing number of vehicles occupying a limited amount of space. However, as a result of increased car safety features, the number of fatalities and injuries in passenger vehicle accidents has not increased (Figure 1-1). (1)
Figure 1-1 - Passenger Vehicle Injury Statistics
Team Calvin Cruise wants to add another aftermarket safety option to vehicles. Our goal is to create an automated system that helps prevent tailgating and rear-end collisions on highways. This design will consist of several parts: a detection unit to detect the distance and closure speed (how fast the vehicles are approaching each other) of a vehicle ahead of the equipped vehicle, a control unit to change the cruise speed of the equipped vehicle, and a display unit to display relevant information to the user in a timely fashion.
150,000,000
160,000,000
170,000,000
180,000,000
190,000,000
200,000,000
210,000,000
1,500,000
2,000,000
2,500,000
3,000,000
3,500,000
4,000,000
1986 1988 1990 1992 1994 1996 1998 2000 2002
Num
ber o
f Reg
iste
red
Vehi
cles
Num
ber o
f Inj
ury
Cra
shes
/Inju
red
Pers
ons
Year
Injury Crashes Injured Persons Registered Vehicles

2
1.1. Team Description TCC is made up of five electrical concentration engineering seniors at Calvin College.
Figure 1-2 - Calvin Cruise Team Picture
(From left to right: Erik Barton, Nate Barker, Nate Sportel, Bryan Bandstra, Chris Vonk) Bryan Bandstra was born and raised in Terrace, British Columbia, where he attended Centennial Christian School from kindergarten through grade twelve. Bryan came to Calvin as an undeclared major, but quickly moved into engineering. After graduation Bryan hopes to move back to the west coast to pursue a career in electrical engineering. Nate Barker is from Hudsonville Michigan and chose to go concentrate in electrical engineering because he has always been interested in computers. Nate likes the challenge of engineering and loves being creative and innovative. After he graduates, Lord willing, Nate hopes to work as an electrical engineer in the field and eventually go on to get his Masters in Business Administration (MBA). Erik Barton lived in Corvallis, Oregon for fourteen years before moving to Holland, Michigan in 1999. He chose an electrical engineering concentration because he has always been interested in electronics and computers and was also good at math and logic. After graduating Erik plans on entering the workforce as an electrical engineer. Nate Sportel grew up in Portage, Michigan and was educated in the Kalamazoo Christian school system. He is now a senior engineering student at Calvin College concentrating in electrical and computer engineering. He always had a strong interest in computers and electronics and decided to pursue electrical engineering. Next year he plans to attend law school and pursue intellectual property law.

3
Chris Vonk hails from Hamilton, Ontario. Chris came into Calvin planning on concentrating in mechanical engineering, but due to his strong affinity for electronics and computers, he decided to switch to the electrical and computer concentration. After graduation Chris hopes to attend law school.
1.2. Project Proposal and Feasibility Study Overview This document will cover the following areas:
1) Terms A basic summary of abbreviations.
2) Objectives The goal of this project.
3) Project Management How TCC managed by the Engineering department and by itself.
4) Design Norms What non-technical aspects were considered in this project.
5) Research Research into existing technologies and patents.
6) Project Requirements Specific requirements for different project components.
7) Safety Features A discussion of different potentially unsafe situations and how TCC plans to address them.
8) Calculations Calculations on fuel economy and following distances.
9) Design Decisions How different components were chosen for the project.
10) System Design How the system is laid out.
11) Prototype Description What the prototype will consist of.
12) Testing Outline of how TCC plans to test the prototype.
13) Contingency Plans How TCC plans to cope with various issues.
14) Budget and Financial Planning Financial analysis of turning the prototype into a production model.
15) Conclusion The determination of TCC on the feasibility of this project.
16) Works Cited Where TCC has located information.
17) Acknowledgements Different people who have aided TCC.
18) Appendices Various different additional discussions.

4
2. Terms
Table 2-1 - Table of Acronyms AC10 Autocruise 10AC20 Autocruise 20ACC Adaptive Cruise ControlACCEV Adaptive Cruise Control Equipped VehicleFE Fuel EconomyFPGA Field Programmable Gate ArrayGUI Graphical User InterfaceITS Intelligent Transportation Systemmm-Wave Millimeter WaveMPG Miles Per GallonNACCEV Non Adaptive Cruise Control Equipped VehicleNeoVi Network over Vehicle InterfaceOEM Original Equipment ManufacturerPLC Programmable Logic ControllerPPFS Project Proposal and Feasibility StudyT3 Team 3TCC Team Calvin CruiseTRW Thompson Ramo Wooldridge Inc.UI User InterfaceUS United States

5
3. Objectives The primary objective of this project is to design and produce an aftermarket adaptive cruise control (ACC) system that will be able to detect the speed and distance of a vehicle directly ahead of the adaptive cruise control equipped vehicle (ACCEV). This product will then automatically adjust the speed of the ACCEV in order to maintain a prescriber inter-vehicle distance. As a proof of concept, we will prototype our system on the 2002 Chrysler Sebring LX.

6
4. Project Management 4.1. External Organization
Being part of the Calvin College Engineering Departments Senior Design course has subjected Calvin Cruise to a certain number of external requirements. These requirements take place in the form of various weekly status reports, presentations, meetings, a design review, and other deliverables. These deliverables include the Project Proposal and Feasibility Study (this document), the Final Design Report (to be completed at the conclusion of this project), and budget reports. Calvin Cruise has also been assigned an industrial consultant and a faculty team advisor. Tim Theriault is the industrial consultant for Calvin Cruise and is met with twice over the course of the project: once in the fall and once in the spring. Mr. Theriault is a manager at Smiths Aerospace and serves as an outside reviewer. Professor Steven VanderLeest is the faculty team advisor for Calvin Cruise, and is the rough equivalent of a manager for Calvin Cruise. Calvin Cruise also has the benefit of a team mentor; Mark Michmerhuizen of Johnson Controls, Inc. Mr. Michmerhuizen provides Calvin Cruise another source of information, contacts and material.
4.2. Internal Organization Calvin Cruise also subjects itself to internal management in order to maintain an appropriate schedule. Bryan Bandstra has been chosen to act as team lead, and as such he is responsible for assigning each team members tasks to accomplish. Erik Barton has been chosen to track costs, Nate Barker compiles and submits the weekly status reports, Nate Sportel is in charge of the business plan, and Chris Vonk maintains the team schedule and is the team contact to TRW and the FCC. The various major design components have been divided among the group members for the interim and spring semester. These roles are as follows. Bryan Bandstra will be primarily working on both the BUS system as well as integrating the separate design components into one entity. Nate Barker will primarily be working on the BUS system. Erik Barton will be primarily working on the processor and the LCD display. Nate Sportel will primarily be working on the radar unit. Chris Vonk will be primarily working on the PLC and the radar. During the first part of the semester Calvin Cruise had trouble with a lack of fixed, enforced due dates. After a mid-semester review, Calvin Cruise decided to address this problem by devising the following system. Each week, various goals and objectives would be assigned by the group to each member. These would be kept roughly equivalent by estimating the time that would be spent on each task. Then each goal would be assigned a due date and a priority rating (low, medium, high). As an incentive for each member to complete their assigned objectives, a monetary penalty will be assessed for each day that the objective is late (low - $1, medium - $2, high - $5). Any funds from this would go directly into the team’s operating budget for the project.

7
4.3. Project Timeline The project timeline is a Gantt chart that was developed in Microsoft Project.1 Figure 20-1 (2) outlines the main tasks of the ACC design. Bases on the timeline, TCC estimated that based on their records, the entire project will take approximately 600 hours. This calculation was based on the fact that the PPFS work took about 300 hours, thus TCC assumed that the total number of hours would be double that amount. TCC expects this number to increase as the prototype phase of the project progresses.
4.3.1. Major Milestones The Gantt chart also displays TCC’s major project milestones; the PPFS (December 8, 2006), prototype testing (April 21, 2006), and the final design (May 5, 2007). TCC’s ability to complete this project within the deadline relies on this schedule and project organization. TCC is confident that the final design will be assembled by the deadline of May 6, 2007.
4.3.2. Timeline Risks Despite TCCs effort to organize the project thus far, there are still a couple risks in the timeline. Figure 20-1 will show that one of TCC’s tasks is to acquire FCC licensing in order to test the project. The success of TCC’s project relies on this license and it can take months to acquire. If TCC does not have this license on time, it would pose a serious problem to TCC’s testing timeline. Also, as Figure 20-1 shows, the timeline for the spring semester is not mapped out in total detail. This is because TCC still is not sure exactly what the testing methods will be. This is a risk to TCC’s timeline because there may be some unexpected circumstances TCC has not yet planned for. Thus TCC must be able to adapt to any circumstance that may arise. TCC currently has a set of plans for contingency actions; these are outlined in section 16.
1 See Microsoft Project File – “WBS_Final_Dec_2006”

8
5. Design Norms When viewing design from a Christian Reformed perspective, it is important to consider not only the technical and engineering requirements, but also to hold in a higher regard the ethical requirements that reflect Christian Reformed principles. These Christian Reformed principles are summarized by certain design norms that together point to how a faith in Jesus Christ should affect the designs of the Christian engineer. These Design norms are: Cultural Appropriateness, Transparency, Stewardship, Justice, Integrity, Caring, Trust, and Humility (S. VanderLeest, ENGR 339 Lecture, September 11, 2006). The ACC system meets the design norms as explained below.
5.1. Cultural Appropriateness This design norm takes into consideration the culture that a technology is being integrated, relating the technology and its appropriateness for the respective culture. In today’s fast paced world, technological advancements are being made every day; many of them emerging from within the automotive industry. Cruise control systems have been integrated into vehicles since 1958 (3), yet since this time the basic principles of cruise controls have not significantly changed. The technology itself had improved dramatically, however, the basic principles of cruise control has remained the same. It has only been since the late-90s that engineers have been working to expand the functionality cruise control systems, by adding systems like Adaptive Cruise Control. TCC is delving into an area of cruise control that is relatively undeveloped. Thus there is much work yet to be done with ACC systems. It is our goal to further the development of ACC to continue the integration of such systems in today’s culture. TCC has decided that there is a need for the ACC technology in today’s culture. In today’s culture, the automotive industry has been mainly concerned with growth in the general safety standards of manufactured vehicles. With the advent of safety features such as rear-parking sensors, side-curtain airbags, and stability control, the automotive industry and the government have been looking for ways to improve the safety of United States (US) highways. Thus the US government has been working with companies like the OmniAir Consortium (4) to develop the standards of Intelligent Transportation Systems (ITS) (5). ITS is being developed in the US to provide communication between vehicles and the highway itself in order to improve safety and efficiency of traffic.
5.2. Transparency and Integrity Transparency and integrity rely on feedback mechanisms in order to develop a technology that communicates well with its user. Included in these feedback mechanisms are aesthetics, understandability, and consistency. The first thing a person notices when assessing a new technology is its appearance. Aesthetics is what provides the first impression of new technologies to the end-user. If a new technology is

9
bulky and unattractive user may automatically draw the conclusion that the inner design of the technology must be cumbersome and inefficient. In order to avoid negative feedback through aesthetics, TCC plans to design the final product to be sleek, using a clean interface and integrating the radar sensor behind the grill of the vehicle; so as to keep the original appearance of the vehicle intact. Another aspect of transparency is understandability. With new technologies today, there needs to be a certain level comprehension that the user intuitively gains about how to use the system; that is the user should know how to use the technology without any outside reference. A new technology that is user friendly must have a low learning curve. This ides of intuitive comprehension aspect will be a major factor in the ACC system; particularly in the UI (User Interface). Since the user will be driving while using the ACC system, the design specifies that there is to be minimal added distraction for the driver; thus the system must be easy to use and require very little interaction with the user. The last and possibly most important aspect of transparency is the issue of consistency. Consistency is concerned with the integrity and repeatability of a new technology. As with all technologies, the systems are expected to perform the task that it was designed to do consistently and accurately. Consistency will also be a major factor in the design of the ACC system. When an ACC equipped vehicle approaches a slower moving vehicle, the user expects the vehicle to adjust its speed accordingly. It is also expected that the ACC system will not be thrown into an unstable state, taking the control of the vehicle away from the user.
5.3. Stewardship Reformed Christian engineers are called to be wise stewards of all that is given to them. It is with this principle in mind that the Christian engineer must ask: is this technology utilizing and promoting the proper use of natural and synthetic resources? The engineer must consider the outputs of the system, and whether its outputs will have any negative effects (short-term and/or long-term) on the surrounding environment. This is certainly an applicable design norm for the ACC system. It is commonly known that the more a vehicle’s speed is controlled the higher the fuel economy of that vehicle. In fact just by using cruise control the fuel economy of a vehicle is improved by an average of about seven percent. (6) Since the ACC system controls the speed variations due to impeding traffic, it is the goal of TCC to improve the fuel economy of the equipped vehicle even more (section 11.1). This would be a wise use of resources.

10
5.4. Justice & Caring Justice and Caring are the two design norms that mainly focus on others. Reformed Christian engineers are called, first and foremost to love the Lord and second, to love, respect, and care for others before themselves. The Reformed engineers show their love for the Lord by: concerning themselves with the safety of others, respecting the rights of the individual, and considering the wellbeing of all who are affected by a new technology. TCC realizes that the ACC system provides added safety using cruise control for those who have equipped vehicles. It is also realized that everyone has a right to safety, not just those who can afford to buy high-end vehicles; this is why TCC is designing an aftermarket system. This design norm comes in particularly important when TCC considers the effect of the ACC system on the wellbeing of the end-user. It is the belief of TCC that this system will only benefit the wellbeing of the user by providing added safety and decreasing the impact of human error while using cruise control.
5.5. Humility Humility is the design norm that leads the Christian engineer to admit that he or she is not perfect. Despite all the research, calculations, testing, and re-working that it put into a design, The Christian engineer, realizing that since everything in this world is tainted by sin, knows that there will never be a perfect design. It is vital for the Christian engineer to realize that he or she is fallible, thus they must take every possible precaution to keep the end-user of a new technology safe. TCC will use this design norm when it designs the safety systems and safety requirements for the ACC system. Humility also must take into account the fallibility of all mankind. It is for this reason that many new technologies are created. It is the goal of TCC to reduce the effects of human fallibility by developing the ACC to improve the safety of drivers while using cruise control.

11
6. Research 6.1. Existing Adaptive Cruise Control Systems
6.1.1. System Types There are currently two different types of ACC systems: laser and radar. The laser systems are mostly used by the Japanese, and the radar systems are mainly used in the US and Europe. Laser is currently being pushed out of the market, due to the fact that the laser sensor cannot operate in some weather conditions such as in heavy rain or fog. Laser based systems are currently being pushed out of the market, due to issues with consistency in certain weather conditions. Laser based systems use laser to detect distance and speed between two vehicles. Since this system is optically based, the system cannot be used in heavy weather or fog due to refraction of the laser beam. Refraction will result in incorrect measurements or no measurements at all. Radar based systems use radars in the millimeter-wave (mm-Wave) spectrum, to detect the distance and speed between two vehicles. The FCC has currently regulated the use of mm-Wave Frequencies of 76-GHz to 81-GHz. (Section 6.6) The radar-based systems have a clear advantage over their laser-based counterparts, as radar is not affected by heavy weather conditions. Thus, the majority of ACC systems today utilize the radar detection system.
6.1.2. Current Users Mercedes-Benz, BMW, Jaguar, Infinity, and Lexus are a few examples of company’s who are currently integrating ACC systems into their high-end models. Mercedes has developed its own ACC system, while others are purchasing their systems from third party manufacturers. Two of the major third party systems are analyzed in brief detail below. There is a list of other third party ACC system suppliers. Table 11-1 shows a list of companies that are currently involved with the development ACC systems.
6.1.3. Current Third Party ACC Manufacturers Due to the current market drive to be integrating ACC systems, two major automotive contracting manufactures have been developing ACC systems. These two third party manufacturers are Delphi-Delco and TRW. Each respective system is radar-based, and uses its own operating frequencies. The Delphi radar sensor operates at 76-GHz, and has a detection range of 150 meters. The TRW Autocruise system operates at 77-GH. TRW recently enhanced it’s transmit-receive module for its radar detection unit, extending the range of detection up from 150 meters to 200 meters.
6.1.4. Current System Cost Due to the fact that exact pricing of these systems is proprietary and not readily available, and is usually proprietary, an exact price of the system is available. However, TCC determined an estimated cost based on the accumulated cost of the prototype components. This price was determined to be approximately $3,900 per unit. (section 17.2)

It is impproductiounit. (sec
6.2. C6
Cruise coThe drivspeedomassists th Cruise ctransmissto a compspeed harelies oncontrol is
The contspeed of is kept intransmissmemory connectediaphragmthe accelmodulate
portant to non unit. The ction 17.2)
Cruise Co6.2.1. Geneontrol is a syver is usuall
meter and chahe driver by c
ontrol worksion. This seputer. The sp
as a unique n this freques below in F
trol box of ththe vehicle
n memory unsion sensor avia the set p
ed to the acm receives. lerator linkaes the amoun
ote that thisapproximate
ntrol eral ystem that ally responsibanging the gcontrolling t
ks by using ensor sends ppeed of the vfrequency a
ency in ordeigure 6-1. (7
Figure
he cruise conwhen the sentil the ignitiand comparepoint. The thccelerator liThe more pu
age. Vacuumnt of vacuum
s price is foe price of th
llows a vehicble for contgas pedal prthe throttle to
a speed senpulses that avehicle corre
associated wer to maintai7)
e 6-1 - Basic C
ntrol has threet button is pion is off. Tes the frequehird functioninkage. Theulses, the m
m force is adm the diaphr
for our protohe production
cle to maintatrolling the ressure and o maintain a
nsor which are generatedesponds dire
with it so it cin constant
ruise Control
ee main jobspressed whilehe second fuency of thosn is to send pe pulses sen
more vacuum dded until thragm receive
otype systemn model was
ain a constanspeed of thbraking acc
a constant set
is mountedd by a magnectly to the fcan be distinspeed. A ba
l Block Diagra
s. The first fue driving at tunction is thse pulses to tpulses to a vnt regulate
and the morhe set point es in an effo
m and not ts determined
nt speed ovehe vehicle b
cordingly. Tht speed.
d on the outet spinning pfrequency ofnguished. Thasic block d
am
function is tothe desired s
hat it receivethe frequenc
vacuum contrthe amountre vacuum this reached.
ort to mainta
the price fod to be $1,85
er varying terby watchinghe cruise co
tput shaft opast a sensof the pulses. he cruise co
diagram of c
o store the cuspeed. This vs pulses from
cy value storrolled diapht of vacuumhe more forcThe system
ain the numb
12
or the 50 per
rrain. g the ontrol
of the r coil Each
ontrol cruise
urrent value m the red in hragm m the ce on
m then ber of

13
pulses coming from the speed sensor as close to the stored value as possible. In Figure 6-2 (8) below, the cables connecting to the throttle and vacuum actuator can be seen. (9)
Figure 6-2 - Cables to Gas Pedal and Vacuum Actuator
6.2.2. Cruise Control Buttons2
6.2.2.1. On and Off The on and off buttons engage and disengage cruise control operation. The off button turns the cruise control off even if it is engaged. Some cruise controls do not have these buttons; instead, they turn off when the driver hits the brakes, and turn on when the driver hits the set button. 2 These key assignments and functionality reference the control settings on the 2002 Chrysler Sebring. Different manufacturers may have different key assignments, but they will most likely maintain the same basic functionality.

14
6.2.2.2. Set The set button tells the car to maintain the speed you are currently driving. If you hit the set button at 45 mph, the car will maintain your speed at 45 mph.
6.2.2.3. Resume/Accel If you recently disengaged the cruise control by hitting the brake pedal, hitting the resume button will command the car to accelerate back to the most recent speed setting. Holding down the resume/accel button will make the car accelerate; and on this car, tapping it once will make the car go 1 mph faster.
6.2.2.4. Coast Holding down the coast button will cause the car to decelerate, just as if you took your foot completely off the gas. On this car, tapping the coast button once will cause the car to slow down by 1 mph.
6.2.2.5. Cancel, Brake and Clutch The cancel button will deactivate the speed control without erasing the memory. Similarly, the brake pedal and clutch pedal each have a switch that deactivates the cruise control as soon as the pedal is pressed, so you can shut off the cruise control with a light tap on the brake or clutch. Although cruise control is typically installed on automatic transmission vehicles, manual transmission cruise control systems are also available.
6.2.3. Other Components The vacuum actuator controls the throttle and is pictured below in Figure 6-3. (10)
Figure 6-3 - Vacuum Actuator That Controls Throttle
The diagram below, Figure 6-4 (11), shows how the cruise control computer interacts with the vehicle.

15
Figure 6-4 - The Brains of Cruise Control
An important part of the cruise control system is the vehicle speed signal (VSS). The cruise control computer uses the VSS along with a PID controller to maintain a constant vehicle speed.
6.3. Communication with Existing Car Cruise Control System Our system will currently need to communicate through two different BUS protocols, SAE J1850 VPW and CAN. The J1850 is a protocol developed by the Society of Automotive Engineers. It is a variable pulse width that transfers data at 10.4 kbps over a single wire. The signal format is shown in Figure 6-5. (12)
Figure 6-5 - J1850 Transmission Signal Format
The 2002 Chrysler Sebring uses a J1850 VPW BUS to connect the different modules of the car and for diagnostic purposes. We can connect to this BUS through an OBD II connector found under the steering column of the 2002 Sebring. We will connect this to a neoVi, which converts the J1850 signal into a RS-232 signal with programming capability to filter out the signals needed and time the responses back into the appropriately. The neoVi, made by Intrepid Control Systems, Inc., is a vehicle interface system designed to connect multiple types of vehicle bus’s and interface them to a PC. A user can them use custom self programmed software using visual basic, C++, or LabVIEW or the off-the-shelf software purchased from Intrepid. Prices for the neoVi range from $995 to $4995 depending on the version. (13) The neoVi has the capability to add a second bus line and send the information through the same RS-232 port simultaneous to the J1850. This becomes especially useful because the TRW AC10 radar unit we have uses a CAN bus. With the neoVi we will be able to get speed and distance from the radar over the CAN, and speed, increment cruise speed signals, decrement cruise speed signals, and the cruise control status from the Sebring over the J1850 and be able to run calculations on the data

16
simultaneously. The neoVi also comes with developer’s lite edition software that will allow us to create custom software for the neoVi tailored to our needs.
6.4. Audio in Vehicle An audible is an important indication to warn the driver that the traffic in front of them was slowing down at a rate greater than allowed by our ACC system. In situations where our ACC system is not capable of reacting in time, it is imperative that the driver be alerted. Many people may not notice alarms if they were only represented graphically, but an audible alarm usually gains the drivers attention effectively. Further research was done in the area of discovering if an audible warning would be appropriate inside of the vehicle.
6.4.1. Audible Warning with Safety Belts Some manufacturers have voluntarily installed innovative systems that go beyond the Federal standard and provide additional warnings when occupants are not using safety belts. These systems have visual and/or audio warnings to remind drivers to buckle up; a system to warn passengers is not yet available. In addition, some of these systems also sense how fast the vehicle is traveling, and increase the frequency of the warning.
6.4.2. Mobileye-AWS The Mobileye-AWS system uses a small display unit and both left and right speakers to provide both visual and audio information to the user. Supporting three different driving style profiles, Standard, Sporty, and Cautious, the Mobileye-AWS can be configured to match the desired driving style. This system provides forward collision warnings, headway indication and warning, and lane departure warning. It uses a single camera along with advanced algorithms to calculate distance to vehicles, tracking of vehicles, the time till collision, the boundary of a lane, distance to that boundary, and lane departure and collision warnings. Their display can be seen in Figure 6-6. (14)
Figure 6-6 - Mobileye-AWS Display Unit

17
6.5. Patents Since the adaptive cruise control idea is not a unique idea, the team had to do patent searches. Many automobile manufacturers already have an adaptive cruise control system applied in vehicles today, and any patent information about these systems could give the team a direction on how the team should approach the project as well as limitations to final product marketing.
6.5.1. Abstract – Patent # 7,054,733 – Adaptive Cruise Control System for Vehicle (15)
An adaptive cruise control for a host vehicle is designed to calculate a target vehicles speed and to calculate driving force based on target vehicle speed. This is used to limit the increase of driving force when the vehicle changes from decelerating to accelerating. This is accomplished by controlling the engine throttle based on the target driving force.
6.5.2. Background of the Invention This invention is an adaptive cruise control that operates as a vehicle cruise control. The system maintains the host vehicle’s set cruise speed unless another vehicle directly ahead of the host vehicle in the same lane is impeding the host vehicle’s speed. In this case the system will adapt the host vehicles speed to match the forward vehicles for any slower speed than the host vehicles set cruise speed. The system will also change the host vehicles speed to maintain an inter-vehicle following distance.
6.5.3. Summary of the Invention There is a possibility that the host vehicle employing this technique may experience a shock due to the host vehicle changing from a decelerating state to an accelerating state. Similarly, shock may be caused when the host vehicle changes from an accelerating state to a decelerating state. These shocks can make the drive of the host vehicle seem strange to a vehicle occupant. One of the goals of this invention is to provide an adaptive cruise control which minimizes these shocks. This will prevent an occupant in the host vehicle from having strange feelings about the host vehicles drive. An aspect of the invention of this adaptive cruise control system is the controller. This controller will set the target host vehicles speed along with the setting the target driving force applied to the vehicle. The controller is also designed to control the driving force depending on the target driving force and to limit the rate of change of the driving force within a predetermined value. Another aspect of the invention of this adaptive cruise control system is the vehicle speed and distance detector. This detector will detect the speed of a vehicle directly in front of the host vehicle in the same lane as the host vehicle. The detector will also determine the distance to the forward vehicle. Then detector is then coupled to the controller which can use the information to determine target driving force and target host vehicle speed. A further aspect of the invention is the method of executing the adaptive cruise control in the host vehicle. This comprises of operations to set the host vehicles speed and driving force. These

18
will change depending on the output of the controller regarding target host vehicle speed, target driving force, and target limiting rate of change of the driving force.
6.6. FCC Regulations Since 1995, the FCC has been regulating any device that operates on the 76 GHz-78 GHz, and 91 GHz-96 GHZ frequencies. These regulations were specifically developed for the use of mm-Wave radar in the automotive industry. They were set in place to prevent any interference caused by amateur use of these bandwidths. The FCC is currently requiring anyone doing testing and/or otherwise utilizing the 76 GHz-78 GHz bandwidth to have a license to do so. Thus in order for TCC to test this ACC device a special testing license. This license is only temporary and will only be valid over the period specified on the license. This license has a cost of $60 which will come out of the team budget. The FCC also requires that the radar devices be able operate on variable frequencies. This is meant to avoid interference between multiple vehicles that may have devices operating at the same frequencies; this is a concern for TCC’s design as well. TCC plans on solving this problem by designing the operating frequency of the radar to vary its frequency to avoid interfering with other systems.

19
7. System Architecture 7.1. Detection Unit
The detection unit detects a vehicle that is directly ahead of the ACCEV. It then outputs this detection and range to the system controller, which processes the data.
7.2. User Input and Output/Feedback 7.2.1. Input
This system will require several inputs, such as on/off and desired following distance. This should be done as to make the system as intuitive and transparent as possible for the user.
7.2.2. Output/Feedback This system will involve outputting information such as the status of the system and possibly additional information, such as closure rate, relative distance, and the other vehicles speed.
7.3. BUS System The vehicles BUS system will be used to connect the ACC system to the vehicle. It will read the vehicle speed and cruise control status and adjust the cruise speed as required.

20
9. Project Requirements 9.1. Function
9.1.1. Detection 19) The detection unit shall primarily detect only the vehicle in the lane in front of the
ACCEV.3 20) The detection unit shall have a minimum detection range of 110 meters. This is the
following distance for the maximum supported speed of 130 km/h (Equation 11-1).
9.1.2. Operation 1) The user shall be able to enable/disable the ACC ability, allowing for the use of the
standard cruise control. 2) Vehicle speed changes shall be made by applying a signal to the vehicle BUS. 3) The system shall not use the vehicles brakes. 4) The brake pedal shall disable both the ACC system and the standard cruise control. 5) The ACC shall operate at speeds between 80 km/h and 130 km/h (approximately 50 mph
and 80 mph). The ACC system shall not function outside of this range. 6) The vehicle shall operate at the user defined speed where there are no vehicles ahead
detected by the detection unit. 7) The system shall slow down the vehicle if a vehicle ahead is detected that is moving at a
slower speed than the ACCEV. 8) The system shall display a warning if the closure rate of the ACCEV is too great for the
vehicle to avoid without driver intervention.4 9) The ACCEV shall not accelerate past the set cruise control speed. 10) The system display shall be able to switch between metric and U.S. systems of measure. 11) The system shall have a driver override button that shall allow for the ACC system to be
disabled while leaving the vehicles original cruise control functional.
9.1.3. BUS System 1) The vehicle BUS shall be used to read and write vehicle speed messages.
3 As the radar unit has not been received yet, we are unable to test the functionality at this time. 4 This data has not been collected at this time. This will require measuring the rate at which the ACCEV slows down with cruise control deactivated.

21
2) The CAN BUS messages shall be used in conjunction with the radar to obtain range and relative speed readings between two vehicles.
3) The BUS messages shall be timed according to existing periodic messages.5 4) BUS messages entered into the system shall be able to override priority of existing
messages on the vehicle bus.6 5) The interaction with the BUS shall not override or replace any current BUS messages. 6) The interaction with the BUS shall be able to interact with the existing messages without
causing conflict.
9.2. Performance 1) The default vehicle cruise control shall take over if the speeds are below 80 km/h or
above 130 km/h (approximately 50 mph to 80 mph). 2) These speeds have been determined from the state law of Michigan. In Section 5240(8)
the law states: “declare a reasonable and safe maximum or minimum speed limit on that freeway that is not more than 70 miles per hour but not less than 55 miles per hour…” (16)
3) We have expanded these requirements to allow for variability between states as well as different traffic flow speeds.
4) The system shall operate the acceleration and deceleration features of the ACCEV in a transparent manner so that the vehicle occupants notice minimal jerk (change in acceleration).7 9.2.1. Environmental
5) The system shall operate in sleet, hail, snow, fog, and intense rain. 6) The system shall operate between the temperatures of -30° C to 80° C. This is the
automotive class operating temperature range. (17)
9.3. Physical 1) The system shall connect to existing vehicle electronics without destructive (e.g.
cutting/splicing of wires) modifications.
5 The exact specifics of the BUS protocol have not been obtained yet. 6 The vehicle BUS message priority has not been determined yet. 7 The exact rate of change has not been determined yet.

22
2) The system shall be integrated with the vehicle in such a manner that only the display will be seen.
3) The display shall be orientated to provide the optimal viewing angle for the driver. 4) The system shall be powered by the vehicle.

23
10. Safety Features Because we are dealing with an automotive product, and given that roads and highways can be very dangerous places, safety always needs to be a main consideration when doing any design on our project. We will implement certain aspects of our design in order to assure safety of the driver and passengers. These safety features are listed below.
10.1. Maintain and Monitor a Safe Driving Distance The radar system will monitor the distance of the car in front of the cruising car and also measure its speed. According to smartmotorist.com a recommended driving distance is achieved by using the three second rule (18). What the three second rule means is there should be three seconds of space between your car and the car in front. This rule of thumb is supported by a study by Marc Green entitled “How Long Does It Take to Stop?” – Methodological Analysis of Driver Perception-Brake Times. (19) Green found that an average driver reacted to an unexpected event (such as an object suddenly moving in front of the vehicle) to be approximately one and a half seconds. Using this, if we add a safety factor of two times, a following distance of approximately three seconds is obtained. Also, having a three second buffer will give the car enough time to slow down by only releasing the throttle in most situations. With a few calculations the system will determine a safe driving distance based on the assumption that there should be three seconds of space between cars (these calculations are presented in section 11.1). At highway speeds this should give ample distance between cars which will allow the system to lower the speed as well as give the driver time to react if a situation calls for the brakes to be applied. Having a safe driving distance of this should encourage safety for all drivers as well as many drivers do not sustain a three second buffer between vehicles.
10.2. An Override Switch Many times a driver may be in heavy traffic and may want to pass a car. Our system should slow down the car to obtain the safe driving distance and then either match the speed of the car in front or resume the user set speed. In certain situations this may not be possible because so many cars are in a small amount of space. The user may still want to cruise but does not want to be constantly slowing down to get the system to give the car the safe driving distance. For such a situation we will install a driver override button that will turn off the adaptive cruise control but will resume the normal user set cruising speed using the basic cruise control system. Because this could be confusing to the user, we will display on the LCD screen that the cruise control system is still engaged but the adaptive cruise control is not. Our system will still detect speed and distance to the user but the ACC will not control any acceleration or deceleration of the car.
10.3. Brake Disengagement of System Like any normal cruise control system, the brake pedal will turn off the cruise control. If our product is working correctly the user shouldn’t have to ever use the brake pedal in cruising situations. However, if the occasion should arise then of course the brake pedal will work as a safety feature turning off our system. The system will not lose the input speed value and if the resume button is pressed the system will start adaptively cruising again, unless the override is turned on.
24
10.4. Displays and Warnings Our system will include an LCD monitor and an auditory component to enhance driver safety. If our system detects that vehicles in front that are slowing down faster than the rate our system can slow without applying the brakes, the ACC system will turn off and a warning will be presented visually and audibly to let the driver know that the system is off and that the brakes should be applied immediately. We will also use the LCD display to alert the driver whether or not the override is turned on, whether a safe driving distance has been achieved and any other pertinent information for using our system.
10.5. Overflow Prevention As with any digital system size of numbers is limited. In order to account for overflow we will be sure to include limits of the size of numbers that we will let our system use. If numbers reach that limit the system will maintain the cruising speed it is currently doing and reset the numbers and the system. Once the system is reset it will again begin normal operation.
10.6. The Turning Situation When considering the problems that could accompany our project we realized that sharper turns in the highways could cause potential problems. For example, if the radius of the radar beam is not wide enough to read a vehicle already in a turn as the ACCEV is just entering a turn a potentially unsafe situation may occur. This occurrence may signal to the system that there is no car in front of the ACCEV. The ACCEV may then speed up dangerously close to the car ahead before that car is detected. One possible solution is to have the radar turn on an axis at a similar rate of the steering wheel. This would keep the radar beam constantly pointed at the car in front even during turns. However, this is beyond the scope of this project, and will not be considered further.
10.7. The Hill Situation We foresee that hills could be a potential problem, especially at the top of a hill. Again, like a turn, due to the angle the front end of the car is pointing, the beam of the radar may or may not be pointing at the car in front when going over a hill. Like turns, this would send an “all clear” message to the processor allowing it to send acceleration signals to the engine. In this situation the driver of the ACCEV will be required to monitor the potentially dangerous situation and be ready to act accordingly. This is not any different from what the driver would have to do if they were driving a non-ACCEV.
10.8. The Drunk Driver Situation There is the situation on the road where a car in front of the ACCEV will weave from lane to lane causing the radar to read the car, read no car, read the car, etc. With all these unit step inputs it could cause instability in our system. In this situation the ACC system will disable itself and display an appropriate message on the LCD screen.
10.9. Range of Use Since this product really only makes sense on the highway, we will limit the range of speeds that our cruise control will operate. We will set a lower speed limit of 80 km/hr (50 mph) and an upper limit of 130 km/hr (80 mph). This feature should limit the product’s use to only on

25
highways. City driving involves a lot of braking, and since our project does not intend on using the brake we cannot guarantee safety in city driving. Also we cannot anticipate stop lights so it is not practical to allow our system to be used at city speeds. We will also use the LCD to convey to the user that adaptive cruise control is not engaged even though regular cruise control may be at lower speeds.

26
11. Calculations 11.1. Fuel Economy Estimations
11.1.1. Background These calculations were necessary and used to provide TCC with some insight on the estimated improvement of fuel economy due to the use ACC system. This data is only an estimate, based on minimal information about the improvements of fuel economy using regular cruise control over the fuel economy with no cruise control.
11.1.1.1. Research Issues There was very limited data available for the improvement of fuel economy of an ACC equipped vehicle over a vehicle with regular cruise control. The only data that was available was an estimated improvement of regular cruise control over a vehicle without cruise control. Among other sources the general consensus for this improvement is about seven percent. (6)
11.1.2. Method of Calculation 11.1.2.1. Premise of Calculations
This calculation is based on the data collected by Bryan Bandstra on his trip from Terrace, BC to Grand Rapids, MI. This trip was made with the prototype vehicle, a 2002 Chrysler Sebring, and was made from August 28, 2005 to September 2, 2005. The log for this trip can be seen in Table 20-1. .
11.1.2.2. Estimation of Average Speed and Miles Traveled From the total distance traveled, 2935 miles, and the total time spent on the road, 45 hours, 58 minutes, the average speed can be determined to be approximately 63.9 mph. This speed was mostly completed at highway speeds with cruise control enabled, but with some city driving as well.
11.1.2.3. Calculating Fuel Economy Using Regular Cruise Control The first calculation that was performed was the fuel economy while using regular cruise control. It was calculated by dividing the number of miles traveled by the total fuel consumed. This resulted in a fuel economy of 32 miles per gallon (MPG). These calculations can be seen in Table 11-1.

27
Table 11-1 - Fuel Economy ImprovementsTotal Fuel Consumed (Gallons) 91.6# of Miles Traveled (miles) 2935Avgerage Speed (Miles per hour) 64Estimated FE improvement of RCC* over NCC** 7%Estimated FE improvement of ACC*** over NCC** 10%
Calculations ‐ Units of Miles per Gallon (MPG)
FE Normal Conditions (NCC) 29.8FE Using RCC 32.0FE Using ACC 32.8
*Regular Cruise Control
**No Cruise Control
***Adaotive Cruise Control
11.1.2.4. Calculating Fuel Economy Using No Cruise Control This calculation was based on data from Edmonds.com which states that using cruise control can increase the fuel economy up to seven percent. (6) Thus, the fuel economy using no cruise control was estimated as a seven percent reduction of the fuel economy using regular cruise control; the result was 30 MPG.
11.1.2.5. Estimated Fuel Economy Using Adaptive Cruise Control This final calculation was based on an estimated percent increase that TCC expects from the ACC system. This estimation had to be made since all of the available reference to ACC improving fuel economy did not include any numbers; an example of this is from the IHS which analyzes a recent technology developed by Delphi. (20) Since there was no legitimate data available that estimated the increase in fuel economy of an ACC system, TCC had to make a reasonable estimate of about ten percent fuel economy improvement. This number will change when TCC is able to gather data during the testing phase of the ACC prototype. Once this estimation of ten percent was established the fuel economy using ACC was calculated by increasing the fuel economy using no cruise control by ten percent; resulting in an fuel economy of 33 MPG.
11.1.3. Conclusion Based on these estimations, TCC can be reasonably confident that using an ACC system will further improve the current increase in fuel economy using regular cruise control by an additional 3%. Thus simply by using TCC’s ACC system users can hope to achieve a 10% increase in fuel economy while using the ACC.

28
11.2. Following Distance In our prototype, we hope to use the TRW AC10 radar unit to do the necessary measurements. The TRW AC10 Radar device will measure both the speed and distance of the car in front of the ACCEV. Based on the measurement of the speed of the car in front of the ACCEV it will be necessary to decide if the system should accelerate or decelerate. If the car in front of the ACCEV is going at a speed faster than the set cruise control speed the system will do nothing.
11.2.1. Calculating Following Distance For the ACC, a driving distance of three seconds has been decided on. The reasons for this are shown in section 10.1. So, based on the set cruise control speed, the desired distance will vary. Calculations for the desired speed are shown below in Equation 11-1:
Equation 11-1 - Following Distances
Follow_Time 3s:=
Speedmax 130kmhr
:= Speedmax 36.111ms
=
Speedmin 80kmhr
:= Speedmin 22.222ms
=
Distancemax SpeedmaxFollow_Time⋅:= Distancemax 108.333m=
Distancemin Speedmin Follow_Time⋅:= Distancemin 66.667m=
11.2.2. Clarifications
We know that the maximum range that our radar reads is 200m so the range for these speeds will fully be within the limits of our equipment. We will use the measurement of distance to keep the car at a safe driving distance away from the car in front. We also must keep in mind that the design of our system will not use the brakes. So our controller will use the Res/Accel and Coast features of the existing cruise control system. At highway speeds it is important to keep that safe driving distance, that way our system will be safer and allow for reaction time of the driver or for our system to make the necessary adjustments to the cruising speed. All calculations will be done in the microprocessor controlling our whole system. It will have to do calculations like unit conversion and multiplying by three seconds as demonstrated above. It will also have to do comparison calculations like how much slower the car in front is going than the ACCEV and/or how much closer the car in front is than the desired safe driving distance. These comparison calculations will simply be a subtraction of the value from the radar detector and the values stored when the user set the cruise control. These user values will be saved in the memory of the microprocessor and will not be erased until the user sets the system again. These comparison calculations will need to be done in order to send out signals telling the ACCEV how to behave. In order to minimize jerk (change in acceleration), the system be designed to

29
gradually increase the speed of the ACCEV, such as triggering an increase in speed at predefined intervals.

30
12. Design Decisions 12.1. System Architecture
12.1.1. Basic Overview The system architecture was found to as shown in Figure 12-1.
Figure 12-1 - Architecture Decisions
The layout of the system can be broken down into three layers: physical hardware, computer hardware, and computer software. The physical hardware includes the actual hardware pieces that would be connected for the system to physically connect together.
12.1.2. Physical Hardware The physical hardware consists of a central neoVI card used to communicate between the different CAN and J1850 buses. The neoVI was chosen for the prototype because JCI engineers said that it would allow communication between the differing buses. For the actual production design, a custom processor would be built to lower cost, and simplify design. For the prototype, however, since the neoVI was donated by JCI, the team found it the most viable option to pursue. The neoVI then takes the BUS communication from the vehicle and the radar and sends the

31
signals to the DE2 board for processing. This is done via a USB connection from the neoVI to the DE2 Board. The DE2 development board was chosen to do all of the processing and controlling. The DE2 board can then interface between the Touch Screen via a RS-232 connection. The data can be entered into the processor by the user via the touch screen display. Data can also be sent for the user to see on the touch screen as well from the DE2 board.
12.1.3. Computer Hardware The DE2 board is connected to the computer hardware via a USB connection. This connection to a desktop computer is temporarily used to program the DE2 board with VHDL that will create computer hardware that can be used as a stand-alone method in the vehicle. The VHDL would be programmed in Quartus and then transported to the DE2 board via a USB connection. The actual implementation of the production design would include a custom designed microcontroller. For the prototype, however, the DE2 board was chosen due to the versatility and familiarity of programming.
12.1.4. Computer Software The actual computer software used to calculate distance and speed will be either written in C++ or some other type of controller software—possibly MATLAB. The software has not been looked into extensively for the prototype yet but the feasibility was assured by experts in the field at Johnson Controls. The neoVI communication will have to be looked into more in depth when the neoVI unit comes. The software for programming the neoVI will come with the device itself and will make it possible for communication between the various vehicle components and BUS systems involved.
12.2. Detection Method The detection unit is the primary component of this project. The primary objective of the detection unit is to detect a vehicle ahead of the ACC equipped vehicle and determine the distance between the two vehicles. This will allow the control software to calculate the closure speed, therefore allowing the control system to make the appropriate adjustments to the cruise control speed. To this end, several different detection units were considered: mm-wave radar, laser, image recognition, and ultrasonic. These are discussed below.
12.2.1. mm-Wave Radar Radar is useful because of its ability to measure both speed and distance in a variety of weather conditions. Radar works by sending out radar waves and waiting for the time it takes for those waves to bounce off of an object. The amount of time between the time the radar wave is sent out and the time it is received back is used to determine the distance of an object from the radar. Radar uses the radar pulse to measure speed as well. When the radar wave is sent out it is sampled over time. The changing distance over time can be used to find the relative velocity of a moving vehicle.

32
According to the University of St. Andrews “millimeter waves occupy the region of the electromagnetic spectrum between microwaves and the far infrared.” Automotive radars use either a 24, 60, or 77 GHz frequency. In radar their shorter wavelength compared to microwaves offers higher resolution and greater bandwidth, as well as narrower beam-widths and physically smaller hardware. Millimeter waves are also better than terahertz (THz), the infrared and the visible parts of the spectrum, at penetrating obscurants such as dust and cloud. They also have better penetration through tissue and many materials than optical wavelengths. This is our product of choice. It can detect object at the required range and in weather conditions. The detection beam can also be focused to only pick up one lane. By narrowing the angle of the broadcasted radio wave, the radar detection can be narrowed to pick up only one lane.
12.2.2. Laser The way lasers detect distance is similar to radar, only using infrared light. The laser will send out a short burst of laser light and wait for it to be reflected off an object. It measures the time it takes to receive the light back, divides by 2 and multiplies by the speed of light to determine the distance the object is away. Laser can detect the speed of objects by taking over 1000 samples per second. A laser will not detect things 150 meters away while still being under our estimated budget of $2000 allocated for at detection device. We need our system to detect a vehicle directly ahead of the ACC equipped vehicle from 150 meters away so that our system can adapt the speed and range of the equipped vehicle without causing an accident. Since a laser is a straight beam of light, the laser does not work well around corners. If the laser doesn’t pick up a forward vehicle around a corner, it could speed the equipped vehicle back up to its originally set cruise speed and cause an accident. A laser does not do well in bad weather conditions (i.e. rain, snow, etc). Because a laser range finder depends on light returning to the device, anything that interrupts the beam distorts the information received.
12.2.3. Image Recognition Pattern recognition has been developed that enables a system to make stable and reliable detections using monocular processing alone. The images are collected with multiple cameras placed in a stereo setup. The detection range varies based on the field of view of the given camera. For example, a 50 degrees lateral field of view provides a detection range starting from 90 m with a follow-through up to 120m. The system locks to the object until the maximum range of the devices is exceeded (no minimal range constraints). The system detects the rear end of vehicles of all types and sizes along with motorcycles under a wide variety of weather and illumination conditions. The system is invariant to traffic density and performs equally well in highway or urban settings. The system is also capable of distinguishing between static and moving targets. (21)

33
12.2.4. Ultrasonic Ultrasonic is a possible solution for the needs of the system. This type of detection is unaffected by dirt on the sensor, dust or high moisture environments like fog. However, rain and snow will still be a problem for ultrasonic detection, as the liquid particles will cause interference and send false signals to the system. Also, a disadvantage of ultrasonic detection is that it, like laser, will only detect distance. Another significant problem of ultrasonic sensors is the limited range. According to INVENT (intelligent traffic and user-friendly technology) the range of ultrasonic does not exceed 40 feet with accuracy. This problem is unacceptable as it does not give the system a safe driving distance. The closest safest driving distance going at 50 mph is approximately 67 meters according to our calculations with a three second following distance (Equation 11-1). The 40 feet would not be enough time to assure the vehicle can slow down fast enough, especially since the brakes will not be used by this ACC system. The cost of ultrasonic is lower than radar, but higher than laser. However, again, we cannot rate cost in the same way as safety when on the roads. Therefore, ultrasonic sensors may be functional, but not feasible for a final design.
12.2.5. Detection Method Decision The decision matrix can be found below in Table 12-1, and the explanation of the decision matrix can be found in

34
Table 12-2.
Table 12-1 - Detection Methods Decision Matrix
Range Cost Weather Installation Ease of UseDirectional Sensitivity Total
Weighting 20 25 20 5 10 20 100mm-Wave Radar 10 5 10 5 10 10 85Microwave Radar 5 5 8 5 7 9 66Laser 5 8 2 8 8 10 66Ultrasonics 3 5 8 6 8 4 54Image Recognition 10 4 7 5 4 10 71

35
Table 12-2 - Detection Method Decision Criteria Criteria Explanation Range The effective range of the Detection Unit. This
includes working at short as well as long ranges (1-150m). The longer the range, the higher the score.
Cost How much money it takes to produce the technology including the unit cost, and design cost associated with the technology. Low cost corresponds to high score.
Weather How the Detection Unit can handle adverse weather conditions. The more adverse weather conditions the unit can handle,
Installation The time of installation. The longer the installation time the less of a score.
Ease of Use How easily the user can interact with the technology. The more user-intuitive, the better the score.
Directional Sensitivity How precise device can focus in on objects in the current lane. The more precision and accuracy a device has without spread, the better the score.
In the area of radar research documentation on vehicle radar was scarce. However information was found on the TRW AC10 and the Visteon Radar systems. The information gathered regarding both radar systems can be seen below in Table 12-3 and Table 12-4.
Table 12-3 - Visteon Radar System Specifications • Moving object detection from 1 to 150 meters (7 dBsm object - motorcycles). • Moving object detection from 1 to 150 meters (7 dBsm object - motorcycles). • Moving object detection from 1 to 175 meters (20 dBsm object - cars). • Stopped object detection to 60 meters. • +/- .5° short range (≤ 40 m) detection. • +/- 4.0° long range (≤ 100 m) detection. • +/- 2° elevation coverage. • 0.7° self-alignment capability.
• 77 GHz digital FM with MMIC technology. • ≤ 3 meter range resolution. • ≤ +/- 1 meter short range (≤ 20 m) accuracy. • ≤ +/- 5% long range (> 20 m) accuracy. • ≤ 0.15 KM/HR relative velocity resolution. • ≤ 0.5 KM/HR relative velocity accuracy. • Dimensions: 99 mm x 99 mm x 55 mm. • Weight: < 800 grams without bracket.

36
Table 12-4 - TRW AC10 Radar System Specifications • Frequency • Range • Field of View • Speed Resolution • Angular Accuracy • Operative Temperature • Velocity Operation Range • Size
• 76 – 77 GHz • 1 to 150 m • 11° • 0.09 km/hr • 0.3° • -40°C to +75°C • 30 to 180 km/hr • 212 mm x 115 mm x 63 mm
The two radar systems are comparable in many aspects including range and frequency of usage. The TRW AC10 is an attractive option for the prototype because TRW offered to donate a unit to the group. In an analysis of the two radar options the Visteon wins out on actual dimensions, but the TRW was more readily available. With the ability to read both distance and speed the system TRW system has a more accurate speed resolution of 0.09 km/hr compared to the Visteon’s speed resolution of 0.15 km/hr. Also, this product will read in all weather conditions. This is extremely important, as it would be undesirable for the system to fail in rain or snowy conditions. Also, this system operates within the range of 1 to 150m. This gives the system ample room for a safe driving distance, while still making accurate readings. Also, having readings up to that range will improve the overall safety of this system. Of course with this system are some disadvantages. The main disadvantage is the high cost. This specific system costs well over $2500 and is on average $1000 more than either the laser or video camera system. The optical laser would not be as ideal in adverse weather conditions because it needs a clear line of site back to the vehicle for reflection. Image recognition has proved to withstand the effects of weather, but the processing power needed to analyze each image is beyond the scope of our project. The weather conditions such as rain, hail, sleet, and mud are some common driving conditions that the system will encounter. The radar’s ability to withstand extreme weather conditions makes it more versatile. Another disadvantage of radar is that it must comply with FCC regulations. Certain frequency ranges must be defined for use and an FCC license to use the frequency band of 77 GHz must be obtained in order to use our radar in the device. The team has started the FCC licensing process and is working with Calvin to obtain a license in order to use the frequency. The process of obtaining an FCC license was found to be feasible and is currently under way. For the prototype system our group has acquired a TRW AC10 radar courtesy of TRW. In the overall production design radar would also win over the systems described. The increased cost of radar was found to be offset by its reliability, versatility, and the ease of processing and installation. Therefore radar was chosen for the production design as well. The high cost of buying retail radar could be reduced by in-house manufacturing to lower the cost and make it more affordable.

37
12.3. Display With this adaptive cruise control we need to have a way to have the user set, interact, and easily enable and disable the ACC system. Inputting and outputting data must be done with some sort of display or I/O device. The three main types of I/O devices researched as possibilities include having no display—buttons only, round LEDs, or a full-featured touch screen LCD display. The decision matrix for our display design is shown in Table 12-5 and a brief description of each component is provided below in Table 12-6.
Table 12-5 - Display Type Decision Matrix
Expandibility Cost Installation ObtrusivenessAmount of Information
Ease of Readability Total
Weighting 10 20 10 15 25 20 100No Display-buttons only 0 10 10 10 0 5 55LED Display 5 9 8 8 3 6 64LCD Display 8 4 4 5 10 7 66Touch LCD Display 10 4 4 3 10 9 70
Table 12-6 - Display Decision Criteria
Criteria Explanation Expandability The more features available the better the score.
The ability to take a simple device and add peripherals to increase total value of the system and incentive for a user to purchase.
Cost How much money it takes to produce the technology including the unit cost, and design cost associated with the technology. Low cost corresponds to high score.
Installation How much time it takes to install the unit into the vehicle. The more time it takes the harder the installation. Installation would be done by an authorized dealer or an advanced user. The less time it takes the higher the score will be.
Obtrusiveness How visually distracting the unit will be. The less distracting units have higher scores.
Amount of Information How much information the unit will provide at a glance on the screen for a user. The greater the amounts of information readily available the higher the score.
Ease of Readability How easily data is able to be read in multiple lighting conditions. The easier to read the higher the score.

38
12.3.1. No Display – Buttons Only The main advantage of having no display is the design time would be less than that of the other alternatives. This would also affect unit cost because the design time and hardware involved would be less than that of the other options. Having a button interface only and no feedback display would allow user input, but would not allow the end user to see the feedback of the system. However, we felt that these advantages were not large enough to overcome the lack of information provided to the driver of the ACC equipped vehicle (reflected by the zero in the amount of information provided category). The feasibility matrix was consulted and the score for the buttons only option ended up having the least score. This was the reason why the team dismissed this option as the most appealing and feasible I/O option for the ACC.
12.3.2. LED Display The main advantage of the LED is that it would be simple to implement and inexpensive (reflected by the nine in the cost category). The only signal a LED would need is a voltage sent to it and it will turn on. Other more complex models include designing an appropriate circuit to select the correct LED depending on the signal being sent. This would require the use of encoding hardware and software. Also, a LED is just a diode so it would be an inexpensive item to include. If we were to buy LEDs from Digi-Key the part would likely cost less than a dollar. The main problem with it is that it cannot display very much information to the user (reflected by the three in the amount of information category). The basic LED display consists of a “system on”, “system set”, “distance warning” and three distance LEDs. The “close distance” LED would turn on if the vehicle in front was less than 30 m away. The medium Distance would turn on from ranges of 50m to 100m, and the far distance LED would turn on if the vehicle is greater than 150m away. If nothing is ahead of the vehicle the distance LEDs would remain off. A sample layout is show in Figure 12-2.
Figure 12-2 - Basic LED Display
The advanced display includes using 7-segment LEDs to communicate the appropriate information. The 7-segment display is useful in the fact that words and numbers can be displayed for the user so this makes it much easier to understand and interpret. This is show in Figure 12-3.
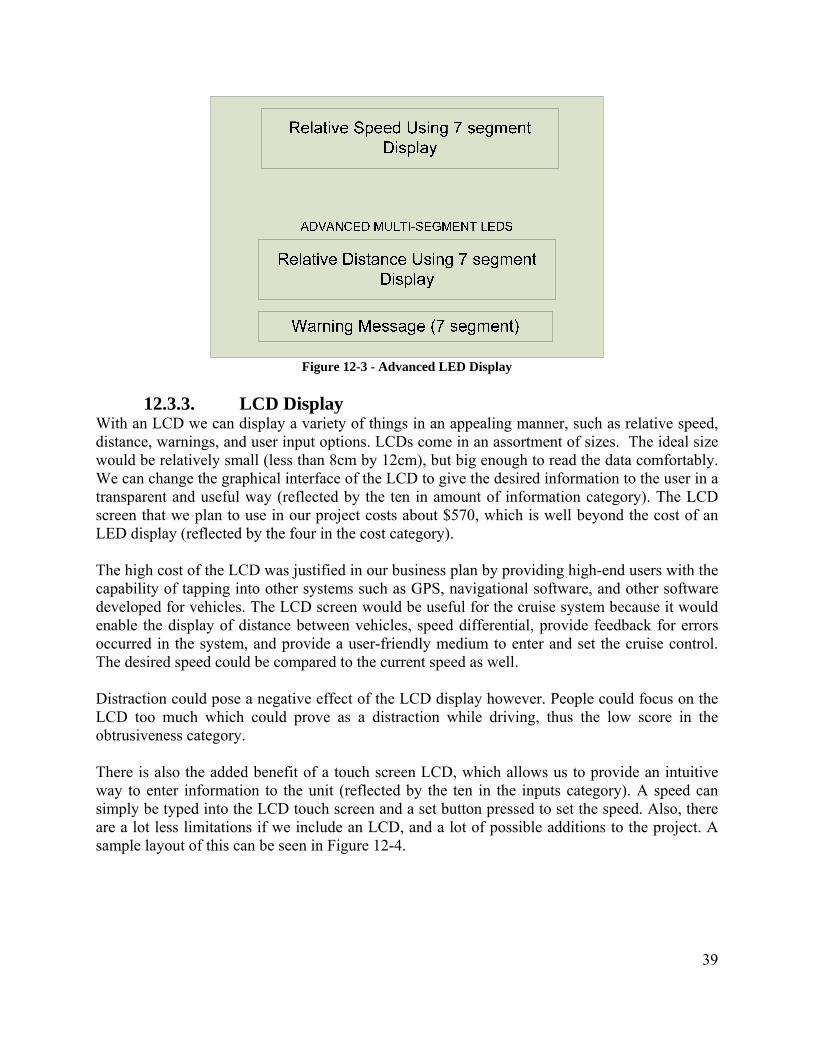
39
Figure 12-3 - Advanced LED Display
12.3.3. LCD Display
With an LCD we can display a variety of things in an appealing manner, such as relative speed, distance, warnings, and user input options. LCDs come in an assortment of sizes. The ideal size would be relatively small (less than 8cm by 12cm), but big enough to read the data comfortably. We can change the graphical interface of the LCD to give the desired information to the user in a transparent and useful way (reflected by the ten in amount of information category). The LCD screen that we plan to use in our project costs about $570, which is well beyond the cost of an LED display (reflected by the four in the cost category). The high cost of the LCD was justified in our business plan by providing high-end users with the capability of tapping into other systems such as GPS, navigational software, and other software developed for vehicles. The LCD screen would be useful for the cruise system because it would enable the display of distance between vehicles, speed differential, provide feedback for errors occurred in the system, and provide a user-friendly medium to enter and set the cruise control. The desired speed could be compared to the current speed as well. Distraction could pose a negative effect of the LCD display however. People could focus on the LCD too much which could prove as a distraction while driving, thus the low score in the obtrusiveness category. There is also the added benefit of a touch screen LCD, which allows us to provide an intuitive way to enter information to the unit (reflected by the ten in the inputs category). A speed can simply be typed into the LCD touch screen and a set button pressed to set the speed. Also, there are a lot less limitations if we include an LCD, and a lot of possible additions to the project. A sample layout of this can be seen in Figure 12-4.

40
Relative Speed
RelativeDistance On/Off Button
Set ButtonMain Menu1 2 3
4 5 6
7 8 9 0 .
Set Speed Actual SpeedACC On/ACC
Off
+ 1mph
- 1mph
Resume
Warning Indicator
Figure 12-4 - LCD Touch Screen Display
The buttons above can be formatted in a variety of ways on the touch screen LCD. The basic functionality includes a num pad to enter in a set speed. The “set speed” display shows the current set speed, and the “actual speed” buttons shows the current speed of the vehicle. The relative speed shows the speed differential between the ACC vehicle and a forward vehicle. The distance shows the distance between the vehicles. The resume button accelerates the vehicle to the predetermined speed. The increment/decrement buttons work the same as an existing cruise system. The warning indicator flashes when a vehicle is too close. The on/off button turns the system on and off. The ACC on/ACC off turns the ACC system off while still maintaining regular cruise control. The Main Menu button provides support for multiple screens and navigation between those screens.
12.3.4. Display Design Decision Conclusion We have decided to use the LCD because we believe that the information, displayed as described above, to the user is important enough to justify the cost. We also believe that this is a good business decision. Having a LCD screen could possibly open up doors for future projects and parts that a company could sell on top of and in addition to the ACC system. Projects that could include navigation, satellite radio, or a whole in car system due to the touch screen. This in car system would include things like connecting to an MP3 player and controlling it through the LCD touch screen. There are many possibilities that would exist for features to add to our system if we include the LCD. Also, if we were to include a blind spot detection system to our project, the LCD approach could be useful in displaying warning data in a sharp and catchy manner. The LED approach would also work for this use, but would be less visually appealing. So, given all the benefits of an LCD to be included in our system be believe that it is worth the increase in cost for our product. Specifically the touch screen LCD would be of great use, due to the fact that input data and output data could be implemented on the device in an organized and convenient

41
manner. For the prototype an LCD touch screen was donated. This played a significant impact on our choice for using LCD touch screen for our prototype model. The specific type of LCD display used is still under discussion and will be finalized within the coming month.
12.4. Sound We have also considered the addition of an audible component to our system. A decision matrix showing the comparison of sound to no sound is shown below in Error! Reference source not found.. The categories for our decision are the same as shown in Table 12-7. An explanation for our categories is found in Table 12-8.
Table 12-7 - Sound Decision Matrix
CostAmount of Information Installation Obtrusiveness Total
Weighting 20 50 15 15 100No Sound Alert 10 0 10 10 67Sound Alert 5 10 3 8 71
Table 12-8 - Sound Decision Criteria Criteria Explanation Cost How much money it takes to produce the
technology including the unit cost, and design cost associated with the technology. Low cost corresponds to high score.
Installation How much time it takes to install the unit into the vehicle. The more time it takes the harder the installation. Installation would be done by an authorized dealer or an advanced user. The less time it takes the higher the score will be.
Obtrusiveness How visually distracting the unit will be. The less distracting units have higher scores.
Amount of Information How much safety information the unit will provide the user with audible messaging. The more audible warnings information readily available the higher the score.
Ease of Readability How easily data is able to be read in multiple lighting conditions. The easier to read the higher the score.
12.4.1. Sound Display Design Conclusion Based on our research into existing vehicle systems involving sound we have decided to include an audible component to our design. We feel that the advantages of adding additional warning of potentially dangerous systems more than outweighs the additional design time and system cost.

42
13. System Design
Figure 13-1 - Basic System Design
The system contains six major components: a power source, controller, display, detection device, BUS controller, and of course the vehicle. TCC chose this division based on the requirements. Our requirements stated that a device is needed to receive and interpret information as well as send information to change the ACCEV speed and we called this device the controller. The display is needed because the requirements listed that the system needed to provide the driver with adequate information to enable driver vehicle maneuvering decisions. Because those sections would require external power, a power supply was added. The requirements stated that the system needs to detect a forward vehicle, so the detection device block was added. Because the vehicle and detection device would use two different types of BUS systems, and signals need to be filtered out of the BUS’s simultaneously, and because signals need to be put on the BUS of the vehicle, the team decided that a BUS controller was needed. The last block is the vehicle, which is needed because ACC is used on vehicles. Descriptions of each of these blocks are given in the following paragraphs. Depending on which power source we use we may have to use converters to get the required voltages to our parts. This is shown on the right of the diagram. The power supply needs to be attached to the vehicles power supply either using a cigarette lighter adapter or a direct connection to the vehicles battery. The controller is the part of the system running calculations and sending signals to control vehicle speed. The controller receives signals like speed and distance to a forward vehicle from

43
the radar, and receives the cruise control status and the speed of the ACCEV from the vehicle BUS. Using this information the controller can determine if the ACC system should be running and then calculate the speed change required by the ACCEV to match the speed of a forward vehicle and maintain a safe separation distance. Changing the ACCEVs speed requires signals sent back to the equipped vehicle. Also display information such as distance to the forward vehicle, the other vehicles speed, the speed differential, and the set following distance on the touch screen requires signals sent from the controller with this information. The display will display information such as distance to the other vehicle, the other vehicles speed, the speed differential, and the set following distance. These signals will need to be received from the controller. The screen will also be used to activate our system and to set the following distance. These signals will need to be sent back to the controller. The design decisions for the display are in 12.3. The detection device is the part of our system that determines the distance between the ACCEV and a vehicle in the lane directly ahead as well as the other vehicles speed. For the system to use this information, the detection device needs to send the information to the controller. The design decisions for the detection device are in 12.2. The BUS controller is used to transmit information to and from the vehicle and the detection device. The BUS controller needs to filter out information from the vehicles BUS, such as the cruise control status and the vehicles speed. The BUS controller also needs to simultaneously filter out the speed and distance information from the detection device BUS. When the BUS controller filters out this information it will need to send the information to the controller. In addition, for the system to change the ACCEVs speed, the BUS controller will need to receive information such as increment or decrement set cruise speed from the controller and place that information on the vehicles BUS. The vehicle that will be using the adaptive cruise control also has a couple of requirements. The vehicle needs to have a BUS system, capable of sending and receiving information. The information that the vehicle needs to provide on the BUS are the vehicles cruise status, the vehicles current speed, and the vehicles current set cruise speed.

44
14. Prototype Description There are many parts of the prototype design that team Calvin Cruise has decided on. The team needed five basic parts of the system determined from the requirements, and the parts listed in the following paragraphs meet these requirements. The first part of the prototype is the use of Bryan Bandstra’s 2002 Chrysler Sebring as the vehicle going to be equipped with the system. The requirements demand that a 2000 or newer vehicle be used because of BUS restrictions before that time. Bryan Bandstra’s vehicle was the only team vehicle built in that time frame and acquiring a donated vehicle for testing the system on was infeasible. The second part of the prototype is the DE2 board used as the controller of the system. The controller needed to have multiple ports such as USB and RS-232 as well as handle digital processing. The DE2 board fills these requirements and even gives us other ports such as VGA that allow the team to be more flexible when a more detailed system design is created in the second semester. The DE2 board is being loaned by the Calvin College Engineering Department. The third component of the prototype system is the TRW AC10 radar unit. The requirements stated that the detection device needed to detect vehicles from 150 meters away plus work in different weather conditions such as rain, snow, and heat. The TRW radar has met these requirements and the added bonus of being donated generously by TRW saves the team from needed to acquire $2,500 to buy one. A fourth part of the adaptive cruise control system prototype is neoVi. With previous decisions to use the Sebring and the TRW radar the system needed a way filter out signals simultaneously from both a J1850 BUS (Sebring) and a CAN BUS (radar). The system also needed a way to place signals, such as decrease the set cruise speed of the vehicle, onto the vehicle BUS. The neoVi is capable of doing everything that is required. With free software that comes with the neoVi, the team can filter out any signal it wants and place signals onto the BUS as well. The neoVi also has the benefit of connecting to a computer or controller either through RS-232 or USB which gives the team flexibility in the second semester design. In addition, the $1,000 neoVi has been donated by Johnson Controls. The fifth part of the prototype system is the Maple touch screen. The requirements stated that both a display and sound alarm are needed in the system to provide the driver with proper information and warnings for dangerous situations. The Maple touch screen has the ability to meet both of these requirements. A 256 color 5.6” x 3.5” touch screen with audible alarm, the Maple touch screen is able to display enough information to the driver to be useful for effective driving decisions. The audible alarm will also be able to gain the driver’s attention if the system detects a dangerous situation. The Maple touch screen, which costs $400, has been donated by Highlight Industries.

45
15. Testing Testing is perhaps the most important aspect of TCC’s design. In light of the design norms (section 5) TCC must extensively test the ACC system to keep the design norms intact. This section will outline the important tests that the ACC must pass in order to ensure that the system is safe, reliable and follow the design norms.
15.1. Barriers to Testing There are certain barriers that TCC must overcome in order to conduct testing with some of the individual components of the system and the full-scale prototype.
15.1.1. Test Phase Safety Since safety in the testing phase is critical, TCC cannot just bolt the system to a car and conduct testing on the highway. If the system becomes unstable while testing on the highway, the vehicle could go out of control and potentially harm a TCC member and/or other drivers. Thus TCC needs to avoid highway testing at all costs; TCC must develop ways to conduct testing without causing potential risks to human life.
15.1.2. FCC License Due to FCC regulations (section 6.6) TCC must acquire a temporary license in order to with the ACC system. Thus if TCC cannot acquire this license, tests cannot legally be conducted with the radar system. In case of this situation TCC must have set in place contingencies in order to show the feasibility of the proof of concept without the full-scale prototype (section 14).
15.2. Test Parameters In keeping with the safety features (section 10), TCC must developed testing standards to ensure that the ACC system will be reliable, repeatable and robust. In order to maintain these standards TCC has design a strategy for testing that first tests the major components separately, then to test the final full-scale prototype.
15.2.1. Detection Unit The detection unit consists of the radar unit and its connection to the control unit. Tests will be conducted to determine the detection unit’s ability to: provide the control unit the distance and speed differential to the control unit, detect objects at the minimum angle of detection, and ignore foreign objects or vehicles in adjacent lanes.
15.2.1.1. Control Unit These tests will be used to validate the control unit’s ability to provide the vehicle BUS system the proper information needed to effectively adjust the cruise control speed. Tests will be conducted on to determine the control unit’s ability to: avoid states of instability, and adjust the BUS signals to change the cruise control speed.

46
15.2.1.2. Graphical User Interface These tests will be used to determine the functionality of the LCD user interface. The LCD will be used partially to verify the results of the detection unit and the control unit; thus in the process the LCD will be testing throughout this process.
15.2.1.3. Final Prototype These tests will be conducted when each of the other components have been tested and verified individually. This will be the final testing phase, the main purpose of which is to verify that the final prototype meets all of the project requirements (section 7).
15.3. Test Plans Since TCC has not yet fully developed the ACC system, it is only possible to basic test plans. The sections below describe one possible test for each of the previously outlined criteria. Thus TCC plans on designing much more extensive test plans once a better understanding of the actual system is achieved. In addition to this, the criteria for a successful test will be must more extensive.
15.3.1. Detection Unit 15.3.1.1. Distance and Speed
One possible test that can be conducted is to set up the detection unit and have a car drive past the radar. The driver of the car would make note of the speed at which the car is moving and the driver would stop the car a pre-marked distance (x). Figure 15-1 shows the possible set up of this test. If the speed that the driver records matches the speed found by the detection unit, the test will be considered a success. Another adaption of this would be to drive the car towards to the detection unit and compare the values recorded by the driver and the detection unit; if the values match the test will be considered a success. TCC still has yet to decide a location for this test. The test will be conducted in a low traffic area, such as Old Chicago Drive, or an empty parking lot, so as not to interfere with traffic.

47
Figure 15-1 - Detection Unit Test Setup 1
15.3.1.2. Minimum Angle of Deflection
This Test will be very similar to the previous test; the only variation will be to change the angle (Ø) of the detection unit, to make sure that it still detects the speed and distance of the moving vehicle. Figure 15-2 shows a graphical representation of the possible test setup.
Figure 15-2 - Detection Unit Test Setup 2
48
15.3.2. Control Unit 15.3.2.1. Instability
The controller needs to be able to respond to many situations including slow approach to a forward vehicle, fast approach to a forward vehicle, and objects suddenly appearing in front of and close to the equipped vehicle. The last case could be caused from deer crossing the road, objects falling on the road, vehicles changing lanes in front of the equipped vehicle, or vehicles merging onto the road in front of you. Using Quartus II’s waveform editor the team will simulate these different distances and suddenly appearing distances and analyze the results of the system. If the system outputs any strange or unexpected information for longer than an undetermined amount of time the controller will be called instable.
15.3.2.2. Speed Adjustment One possible test for the controller is simulating the design to ensure proper change in vehicle cruise speed. Based on inputs to the controller from the radar and the equipped vehicle, the controller needs to calculate what speed the equipped vehicles needs to be traveling at, the time available to change the speed, and the maximum rate of change of speed for the vehicle. Using Quartus II’s waveform editor, we plan on simulating the input of different inter-vehicle distances, different equipped vehicle’s speed, different forward vehicles speed, and different set following distances. The team will evaluate the controller’s response to these changing inputs, and if the controller outputs change the equipped vehicles speed without encroaching on the forward vehicle the controller changing vehicle cruise speed will be called a success.
15.3.3. Final Prototype As mentioned in section 15.1, in order to properly test the final prototype, TCC must gain access to a test track of sorts to be able to test the final prototype. A possible test for the final prototype consists of three phases:
15.3.3.1. Phase One The plan is to conduct this test using two vehicles in a controlled environment. The first car will not be ACC equipped and will be travelling slower than the second vehicle, which will be equipped with ACC. The ACCEV will have its cruise control set a given speed and will b following the non ACC equipped vehicle (NACCEV). If the ACCEV adjusts its speed to adjust to the speed of the NACCEV, phase one will be considered a success.
15.3.3.2. Phase Two The NACCEV will then switch lanes and move out of the way of the ACCEV. If the ACCEV then re-accelerates to it previously set cruising speed phase two will be considered a success.
15.3.3.3. Phase Three This phase will consist of putting foreign objects, such as construction pylons or a parked car in the adjacent lane and repeating phase one and two. If phase one and phase two are completed successfully with no instability caused by the introduction of the foreign objects in the response of the ACCEV phase three will be successful.

49
16. Contingency Plans 16.1. Introduction
Part of effective planning is planning for the unexpected. The ACC design may be an effective design, but what would happen if one or more of the parts became unavailable to the team or if the scope to complete a part of the system goes beyond the time the team has to complete the project? What if planned testing methods become unavailable? TCC has thought about these cases and came up with a list of possible obstacles the team may come across along with a contingency plan for each obstacle.
16.2. Unavailable Radar Unit The first obstacle is: what if the radar unit became unavailable to the team? TCC decided that in this case the project would fall back onto using a laser detection device. Having a laser already donated and in hand, the team would be able to design around not having a radar. There are limitations to using a laser. The first is the limited distance the laser obtained can detect. The IFM laser obtained can only detect objects from ten meters away, much shorter than the required 150 meters. TCC has decided that this could be worked around, for the prototype stage, by using scale model testing and not implementing the system in a real vehicle.
16.3. Difficulty Connecting to Vehicle BUS The second obstacle is: what if connecting to the vehicle BUS increases the scope beyond the team’s ability to handle? In this case, the team has decided to have a secondary device, such as another DE2 board, create the exact signals that the adaptive cruise control would require. Using this method the system would not be able to be implemented in a real vehicle, but the team would still be able to test the controller and the rest of the system.
16.4. Inadequate Testing Facilities A third obstacle is: what if the team cannot get access to a test track, which is needed to test the ACC safely away from the general public? The team had originally decided that testing on Calvin’s dyno would be impractical due to the high speeds at which the vehicle will be operating. At high speeds, the vehicle might slide back and forth on a dyno making that testing method extremely unsafe. However, if a test track becomes unavailable to the team, the team could scale down the speeds the adaptive cruise control is designed for, and test the system at slower speeds on the dyno.
16.5. Trouble Obtaining a FCC License The fourth obstacle is: what if the team is unsuccessful at obtaining an FCC radar license? Because radar operates within the radio spectrum, any use of the radio band requires a license from the FCC. In this case, the team decided to use the scaled laser design mentioned in the first obstacle.
16.6. Difficulty Getting the LCD and Controller to Communicate The fifth obstacle is: what if the team is unable to get the LCD touch screen and the controller to communicate with each other. The DE2 board has a built in LCD screen. This screen is much smaller (2” x 1”), not color, and it is not a touch screen. Because of those reasons the team would

50
like to use an external LCD touch screen, however, if the team is unable to get the LCD touch screen to communicate with the controller the team would fall back onto the built-in LCD screen of the DE2 board. With work done using the DE2 board’s LCD screen in other classes (ENGR 325) the team has the ability and the knowledge to use the DE2 board’s LCD screen.

51
17. Budget and Financial Planning 17.1. Introduction
This design is not feasible unless it results in a marketable product that can be sold for a profit. Obviously, many of these numbers are guesses given that TCC cannot perfectly estimate demand of this product in the market or guess how much of a discount companies would give us for parts, etc. These numbers are estimates but TCC has taken into account most of the money invested into operating a company for the purpose of marketing this project. The way that TCC went about evaluating the finances of the business it would create based on the senior design project was a step by step process. It started with finding all the fixed costs. The team then had to do research for the expected market of this product. Once the team had a good idea for the size of the market, it could conservatively estimate how many units it could sell as a company. In order to estimate, a strong business plan for growth had to be attained. Now, since the amount of units per year was determined, the next step was to calculate the variable costs. Finally, the last step was to do capital budgeting by adding up all the costs and the gains. Based on a desired rate of return a profit margin could be solved for. The desired rate of return was over the cost of capital of 10% but not too much for the price not to be competitive. The steps are shown in more detail below.
17.2. Expenses 17.2.1. Design Cost
The first fixed cost is to estimate design costs (primarily due to engineering hours). Engineering hours were estimated using a Work Breakdown Structure analysis done using Microsoft Project (WBS_Final_Dec_2006.mpp). TCC assumes an hourly engineering wage of $100 per hour.
Design Hours Hours from Task spec 193 days 8 team hours/day 1.6 individual hours/day
1544.4 Total Team Design Hours
$100 per hour $154,440 Total Amount Spent
These design hours are going to be a yearly fixed cost because any company that hopes to survive must continually be creating new products. Therefore, design time must be spent to improve old products and create new products.
17.2.2. Building Cost The next step is to estimate how much money will have to be spent during the first year on machines and facilities to create a production facility to manufacture our project. In order to estimate this, TCC did a search on the Re/Max industrial real estate site. The result of this search was the finding of a building with 17,600 square feet. It costs $700,000 to buy the building, and

52
to lease the building is $5 per square foot. The functions of this building will be to provide office space for the engineers, marketing team, and the upper management. The building should also provide a manufacturing floor for the creation of our product. The lease vs. buy decision is listed below.
Building $700,000 Cost Buy Building $5/sq. foot Per Month $(88,000.00) Cost Lease Prime Interest Rate Now 8% Present Value of Lease $351,358.48
From this data, it is clear that the company should lease the building. If the company was going to stay in this facility for longer, it might consider buying the building, but based on the rate the company is projected to grow (see below) a larger and better facility might be needed. The lease seems like the logical choice.
17.2.3. Machine Cost Another fixed cost is the cost of any machines the company might need. In the business plan, it plans to outsource the PCB creation, so all it really needs is a machine to solder the FPGA’s to the printed circuit board. TCC did some research and called a company called Novastar Technologies for an average price of their soldering machines. They told us that the average cost for their machines was $50,000 which is the number used below.
Soldering Machine $ 50,000.00 Total $ 50,000.00
17.2.4. Prototype Cost
Also, based on the design work, there must be a well thought out estimate of the cost per unit. First, TCC needs to calculate the price of the actual prototype that TCC will be building for Senior Design.
Prototype $2,000 Radar $400 LCD $1,000 NeoVi $500 DE2 Board $3,900 Total
The PLC will not actually be manufactured so much as programmed. TCC will still buy chips from a supplier but will manipulate those chips to do the process of Automated Cruise Control. Also, the NeoVi card would not be used in the production model
17.2.5. Parts Cost The Parts Bought values are known values because these are the exact parts that are part of our prototype. The Parts manufactured are estimates. These will likely be FPGA chips or something

53
of the like. The chips will be electronic chips that TCC will program not manufacture, thus the low cost associated with them. TCC figures that they will not be able to afford buying in bulk from a supplier like Motorola or Intel or the like. Therefore, these chips will simply be FPGA’s because the initial cost from buying from a supplier would be too high for a start-up company. Then, it is reasonable to assume that some of the parts will come at a discount, given that TCC will be buying the in large quantities. That is, if they have a good relationship with our suppliers. For our example, TCC will assume that they can work out an average 30% discount from all suppliers. The new LCD was found from a different supplier for less money. It does all of the same things as the prototype model, but saves us $185. (22)
Price per Unit Parts Bought $2,000.00 Radar
$ 215.00 LCD Found a 7” monitor intended for automotive use. (22)
Parts Manufactured/Produced/Programmed $200.00 Chip to interface car bus $200.00 CPU $2,615.00 per unit on parts 30% Discount from suppliers $1,830.50 Unit Price Assume 1 hour to assemble on an assembly line $19.69 per hour for unskilled worker (23) $1,850.19 Total cost per unit to produce on assembly line
Using the assumptions above, TCC can calculate our price to manufacture each unit is $1,850.
17.2.6. Advertising and Marketing Costs According to http://www.manufacturing.net getting the product to full distribution could take up to 18 months. The team can use this research and number to assume that our product will sell weakly at first but continue to get better and better distributed with the hard work of our sales and marketing team as well as word of mouth due to our advertising campaign. Regardless, our sales and marketing team will constantly be working each year to improve sales, and also looking for new product possibilities. The marketing costs are listed below:

54
Sales Representatives $24 per hour 5 number of employees 37.4 hours per week 1944.8 Hours per year $46,636.30 Salary (based on hourly wage) $233,181.52 Total Cost of All Sales Employees per year
The company will not give out commissions because they do not want to lower our hourly wage. The company will start with five employees doing marketing and sales. This number may need to expand given demand or lack of demand; however for our budgeting purposes TCC will assume five will be sufficient
17.2.7. Business Strategy and Variable Costs TCC now will analyze the variable costs, or the costs that depend on how many units they sell. However, in order to do this a well supported estimate of how many units TCC expects to sell needs to be formulated. TCC found a Market forecast for Adaptive Cruise Control systems. (24) TCC now needs to come up with a business strategy, and, based on that strategy, come up with an estimate of our market share.
Market Forecast 1,895,000,000 2007 2,384,333,333.33 2008 2,873,666,666.67 2009 3,363,000,000.00 2010 3,852,333,333.33 2011
First, TCC needs to formulate a business strategy for the next few years. Our first step will be to use our prototype to target only after market. This step will be in year one of our company (assuming year zero will be used to design the original system). The second step of the business

55
strategy will begin immediately after the first step is underway. Step two is to create a new product implementing brakes and more advanced features that will build on our original design. The goal will to be just an improvement from the original and keep it at the same price. The third step of the business strategy will be to continue to lower costs for the system. This step would likely involve creating a customized detection/radar system that could be created at a lower cost; a system that could be produced at a much lower cost that the cost for buying it from TRW or another Radar detection system provider. Each step of the business strategy should increase the company’s market share. Currently ACC units are OEM and prices are proprietary. Therefore, TCC cannot come up with a well researched number for market share. Also, really this is just forecasting the future which is basically impossible to do perfectly. There is strong competition for this area of the automotive industry. For our estimates we will just assume an initial market share of 5%. After step two of the business plan, it will go up to maybe 7-8% and then lastly jump into the automotive supplier industry and hopefully undercut many other suppliers that the company will attain 15% of the market share. These numbers are complete estimates and are hopefully conservative.
Our Share of the Market 1% Year 1 2% Year 2 3% Year 3 3% Year 4 6% Year 5 Number of units 7,580 Year 1 19,075 Year 2 34,484 Year 3 40,356 Year 4 92,456 Year 5
Now, in order to get a financial value for the price of these units, the price of the unit created for step 3 of the company’s business plan. Since the radar will no longer be purchased, there will no longer be a margin on profit. Based on general assumptions, markups are usually double the price to make a product. Based on that number, the radar would be half of the price that the company paid for ($1,000). However, the company will not have any previous work creating radars, so that ideal number is unlikely. For this calculation, the TCC will assume that the company can create radars for 65% of the price to buy a radar unit.

56
Business Strategy Step 3 Parts Bought $ 1,300.00 Radar $ 215.00 LCD Parts Manufactured/Produced/Programmed $200.00 Chip to interface car bus $200.00 CPU $19.69 Labor $1,555.19 per unit on parts
. ** number takes into account supplier discounts
Now that the expected number of units sold is found, variable costs can be calculated. From TCC sees that auto companies spend roughly 1-2% of sales on advertising. (25) TCC will use this since TCC is in a similar industry.
Advertising 1.0% spent on advertising 140,244 year 1 352,918 year 2 638,020 year 3 746,663 year 4 1,574,239 year 5
17.2.7.1. Warranty
Another variable cost that needs to be taken into consideration is the warranty. In order to determine this value, a formula (26) which gives a value in terms of percent of the number of failed items. The equation for warranty is:
1 1 where MTTF is mean time to failure and W is warranty length in terms of months. The mean time to failure used is 60 months or 5 years, which is the number used for electronics in depreciation calculations. The company’s determined warranty length is 1 year or 12 months.

57
Warranty and Customer service costs 12.00 months $1,850 unit cost $1,555.19 step 3 unit cost 60.00 months 9% how many will break How this is calculated
1-(Mean Time to Failure/Warranty Length)*(1-EXP(-Warranty Length/Mean Time to Failure))
Warranty Costs per year $1,313,442 year 1 $3,305,206 year 2 $5,975,293 year 3 $6,992,777 year 4 $14,743,342 year 5
The company has the intention of trying to lower the initial capital expenditures as much as possible to assure investors payback as quickly as possible. What this means for the business plan is that the company will not be investing in heavy duty machines right away. For step one and two of the business plan, the company will be outsourcing printed circuit board creation and soldering. Because of this decision, machining becomes a variable cost. After doing some research, TCC found a company called Sunstone Circuits that gave quotes for printed circuit board creation. (27)
Machining Print Circuit Board Costs $910 per 100 units
$10 Total Shipping Costs per unit
$144,778 Year 1 $364,326 Year 2 $658,644 Year 3 $770,800 Year 4 $1,765,910 Year 5
Because of this business decision, it is clear what the next step in the business plan would be. Assuming that the company follows through with the plan and becomes profitable, it probably has enough cash and good enough credit to invest in machining for creating its own parts and product completely internally and get rid of the need for outsourcing. The decision now is to determine what the profit margin or markup percentage should be. The way TCC determined this amount was by doing capital budgeting; the goal is to find a markup that would assure the company of a positive net present value. This markup was found using trial and error on the Excel Spreadsheet.

58
Profit Margin
12.9% Profit Margin Percent
$15,833,593 Year 1 $39,844,394 Year 2 $72,032,404 Year 3 $84,298,216 Year 4 $177,731,591 Year 5
After seeing the results of the Capital Budgeting (shown below), TCC determined that 12.9% was a good profit margin. After the company is well established and its initial losses and year one expenses are paid off, this profit margin will go down to be competitive. TCC expects this will happen after year 5 so it is not displayed in the Capital budgeting or profit margin calculations. Based on the 12.9% markup the cost to sell the stage one and stage three product is shown below:
Cost to Sell $2,089 Price Per Unit $1,756 Price per Stage 3 Unit
Capital Budgeting Year 0 Initial Investments $50,000 Capital Expenditures $154,440 Initial Design Time $3,900 Prototype $208,340 Total Year 1 Costs Year 2 Cost $88,000.00 Lease $233,181.52 Sales $154,440 Design 14,024,440.20 Unit Cost 140,244 Ads $1,313,441.63 Warranty $144,778 Machining $ 16,098,525.75 Total Gain $15,833,592.99 Net $ (264,932.77)

59
Year 2 Costs $88,000.00 Lease $233,181.52 Sales $154,440 Design 35,291,757.52 Unit Cost 352,918 Ads $3,305,205.98 Warranty $364,326 Machining $39,789,828.73 Total Gain $39,844,394.24 Net $54,565.51 Year 3 Costs $88,000.00 Lease $233,181.52 Sales $154,440 Design 63,801,951.96 Unit Cost 638,020 Ads $5,975,293.04 Warranty $658,644 Machining $71,549,530.44 Total Gains $72,032,403.76 Net $482,873.32 Year 4
$50,000.00 Another Soldering Machine
$88,000.00 Lease $233,181.52 Sales $154,440 Design 74,666,267.64 Unit Cost 746,663 Ads $6,992,777.11 Warranty $770,800 Machining $83,702,128.55 Total

60
Gains $84,298,216.17 Net $596,087.62 Year 5 $88,000.00 Lease $233,181.52 Sales $154,440 Design 157,423,906.64 Unit Cost 1,574,239 Ads $14,743,341.62 Warranty $1,765,910 Machining $175,983,018.45 Total Gains $177,731,590.60 Net $1,748,572.15 WACC 10% $ (208,340.00) Year 0 $ (264,932.77) Year 1 $54,565.51 Year 2 $482,873.32 Year 3 $596,087.62 Year 4 $1,748,572.15 Year 5 NPV $1,319,599.06 IRR 63%
Payback period
PV0 ($1,658,340.00) PV1 ($198,478.05) PV2 $142,024.25 PV3 $522,091.70 PV4 $610,766.58 PV5 $1,497,981.64 Sum of first 4 years ($581,935.51) remaining period 0.39 Payback Period 4.39

61
TCC determined that the net present value is positive and that TCC will be paid back within 5 years, so this will be a fruitful project to undertake. Payback is this way because of the high risk involved in this start up company

62
18. Conclusion Team Calvin Cruise has come to the conclusion that the concept of the Adaptive Cruise control system is feasible. In terms of budget, TCC has acquired all of the major components of the prototype system without yet using the team's budget. The radar sensor, PLC, analog card, LCD screen, and neoVI card have all been graciously donated by various contributors. This leaves the rest of the budget for various costs including the FCC licensing and other miscellaneous costs. The work is just beginning as that conclusion of this study paves the way for TCC to begin writing software and designing the controller hardware needed for the ACC system. TCC is confident that the system will be completely developed and implemented into the Chrysler Sebring LX at the appointed deadline of May 5, 2007.

63
Works Cited 1. Trends in Motor Vehicle Crashes. Crash Reports. [Online] December 6, 2001. [Cited: October 18, 2006.] http://ai.fmcsa.dot.gov/CarrierResearchResults/Archives.asp?p=21. 2. Adaptive Cruise Control Market. Tier One. [Online] [Cited: December 7, 2006.] http://www.tierone.com/accmtrtoc.html. 3. Cruise Control. Wikipedia. [Online] December 5, 2006. [Cited: December 5, 2006.] http://en.wikipedia.org/wiki/Cruise_control. 4. About. OmniAir. [Online] 2006. [Cited: December 7, 2006.] http://www.omniair.org/about/. 5. SwRI Supports Advancement of Intelligent Transportation Technology. IHS. [Online] December 4, 2006. [Cited: December 7, 2006.] http://auto.ihs.com/news/swri-intelligent-transportation.htm. 6. Reed, Philip and Hudson, Mike. We Test the Tips. Edmunds. [Online] November 22, 2005. [Cited: December 6, 2006.] http://www.edmunds.com/advice/fueleconomy/articles/106842/article.html. 7. cruise-control.gif. Model Problems. [Online] October 31, 1995. [Cited: December 6, 2006.] http://www.cs.cmu.edu/~ModProb/cruise-control.gif. 8. How Cruise Control Systems Work. HowStuffWorks. [Online] 2000. [Cited: December 6, 2006.] http://static.howstuffworks.com/gif/cruise-control-cables.jpg. 9. Cruise Control Basics. Mister Fixit. [Online] 1998. [Cited: December 6, 2006.] http://www.misterfixit.com/cruise1.htm. 10. How Cruise Control Systems Work. HowStuffWorks. [Online] 2000. [Cited: December 6, 2006.] http://static.howstuffworks.com/gif/cruise-control-actuator.jpg. 11. How Cruise Control Systems Work. HowStuffWorks. [Online] 2000. [Cited: December 6, 2006.] http://static.howstuffworks.com/gif/cruise-control-diagram.gif. 12. J1805 Bus. Interface BUS. [Online] October 28, 2006. [Cited: November 28, 2006.] http://www.interfacebus.com/Automotive_SAE_J1850_Bus.html. 13. Vehicle Electronics. Intrepid Control Systems. [Online] 2006. [Cited: December 8, 2006.] http://www.intrepidcs.com/catalog/index.php?cPath=21&osCsid=247e75411da2a2b92e5c23cf71cd1911. 14. Mobileye AWS. Mobileye. [Online] [Cited: October 26, 2006.] http://www.mobileye.com/aws.shtml. 15. Kubota, Kenta, Kubota, Masanori and Watanabe, Kenichi. Adaptive Cruise Control System for Vehicle. 7,054,733 United States of America, February 14, 2003. 16. Michigan. Enrolled House Bill No. 5240. Michigan Legislature. [Online] April 2, 2006. [Cited: December 6, 2006.] http://www.legislature.mi.gov/documents/2005-2006/publicact/htm/2006-PA-0085.htm. 17. Arnold, Henri. Widescreen TFT LCD displays deliver industrial levels of specification. EE Times Europe. [Online] November 24, 2006. [Cited: December 6, 2006.] http://www.eetimes.eu/products/displays/196100161;jsessionid=TMSTX4ZANJHHMQSNDLSCKHA. 18. Maintain a Safe Following Distance (The 3 Second Rule). Smart Motorist. [Online] 2004. [Cited: December 5, 2006.] http://www.smartmotorist.com/tai/tai.htm. 19. Green, Marc. How Long Does It Take To Stop? Transportation Human Factors. 2000, Vol. 2, 3. 20. IHS. IHS. [Online] May 12, 2006. http://uia-auto.ihs.com/news-06Q2/delphi-cylinder%20deactivation.jsp.

64
21. Adaptive Cruise Control. Mobileye. [Online] 2006. [Cited: December 8, 2006.] http://mobileye-vision.com/default.asp?PageID=328. 22. VM7000 7" Touchscreen. Mini-Box. [Online] 2006. [Cited: December 7, 2006.] http://www.mini-box.com/s.nl/it.A/id.401/.f?sc=8&category=101. 23. Table 10. Private industry, by industry group. Bureau of Labor Statistics. [Online] September 22, 2006. [Cited: December 7, 2006.] http://www.bls.gov/news.release/ecec.t10.htm. 24. ACC Market &Technology - Excerpt. Tier One. [Online] [Cited: December 7, 2006.] http://www.tierone.com/accmtrexcerpt.html. 25. George Bittlingmayer. Advertising. The Concise Encyclopeida of Economics. [Online] 2002. [Cited: December 6, 2006.] http://www.econlib.org/library/ENC/Advertising.html . 26. Warranty Cost: An Introduction. Quanterion Solutions. [Online] April 2004. [Cited: December 3, 2006.] http://quanterion.com/ReliabilityQues/V3N3.html. 27. Pricing. Suntone Circuits. [Online] 2006. [Cited: December 7, 2006.] http://www.sunstone.com/default.aspx?id=151.

65
19. Acknowledgements Professor VanderLeest – Calvin College Mark Michmerhuizen – JCI Tim Theriault – Industrial Consultant Doug Papay – JCI Colin – JCI Jim Reier – JCI Bill VanderRoest – TRW Peter Austen – TRW Bob Dornbos – Campus Safety Mike Carlet – Automotive Aftermarket Industry Association

66
20. Appendices 20.1. Project Timeline
Figure 20-1 - Project Timeline

67
20.2. Supplemental Calculation Information
Table 20-1 - Travel Log Day Odometer Location Time In Time Out Drive Time Liters $/Liter Gallons $/Gallon Cost (Can) Cost (US)8/28/2005 59021 Terrace 19:45
59228 Smithers 22:00 2:15:00207 2:15:00
8/29/2005 59228 Smithers 8:2059374 Burns Lake 10:00 10:10 1:40:00 9.62 1.039 10.0059596 Prince George 12:17 12:42 2:07:00 42.56 1.099 46.7760053 Hinton 17:34 17:44 4:52:00 39.75 1.039 41.3060141 Edson 18:20 18:54 0:36:0060347 Edmonton 20:59 2:05:00 14:24 1.014 25.931119 11:20:00 117.53 124.00
8/30/2005 60361 Edmonton 14:0660714 Calgary 17:57 3:51:00
353 3:51:00
8/31/2005 60717 Calgary 35.58 0.944 33.5935.58 33.59
9/1/2005 60737 Calgary 7:1661042 Medicine Hat 10:18 10:28 3:02:00 27.293 0.964 26.3161437 Moose Jaw 13:53 14:43 3:25:00 34.83 1.039 36.0061672 Estevan 16:57 17:14 2:14:0061717 North Portal 17:45 18:30 0:31:0061887 Minot 20:20 21:20 1:50:00 10.17 3.199 32.8362060 Bismarck 22:57 23:07 1:37:0062219 Jamestown 0:33 0:45 1:26:00 4.07 3.199 29.0062362 Fargo 2:15 1:30:001625 15:35:00 62.123 14.236 62.31 61.83
9/2/2005 62362 Fargo 10:0362716 Minneapolis 13:20 14:00 3:17:00 10.97 2.999 32.9063172 Madison 18:20 18:30 4:20:00 9.76 3.219 31.4263485 Chicago 21:45 22:20 3:15:0063717 Grand Rapids 0:25 2:05:001355 12:57:00 20.731 64.32
37TOTAL 4696 km 45:58:00 215.23 34.97 219.90 126.15
2935 mi
Total Distance: 2935 miTotal Time: 45:58:00 hr
Average Speed: 63.9 mphTotal Fuel: 91.6 gal

68
20.3. Market Information
Table 20-2 - Third Party ACC Developers
Supplier ProgramsADC Systems Ltd. LucasVarityAlliant Techsystems M/A‐COMArmatron MeritorAscor MillitechAutocruise MitelAutoliv‐Celsius Mitsubishi ElectricBosch MotorolaContinental‐Teves MurataDassault OmronDelphi RaytheonDenso Sensor TechnologiesEaton‐Vorad SiemensFujitsu Ten Texas InstrumentsHitachi TRWHighway Information Technologies Ltd. VisteonIntel Wysco