T-tests and ANOVA using JMP Kristopher Patton April 7, 2015 *...
54
T-tests and ANOVA using JMP Kristopher Patton April 7, 2015 *http://gipedu.org/virginia- polytechnic-institute-state- university-virginia-tech/
-
Upload
buddy-quinn -
Category
Documents
-
view
215 -
download
2
Transcript of T-tests and ANOVA using JMP Kristopher Patton April 7, 2015 *...

T-tests and ANOVA using JMP
Kristopher Patton
April 7, 2015
*http://gipedu.org/virginia-polytechnic-institute-state-university-virginia-tech/

Laboratory for Interdisciplinary Statistical
Analysis
Collaboration From our website request a meeting for personalized statistical advice
Great advice right now:Meet with LISA before collecting your data
Short Courses Designed to help graduate students apply statistics in their research
Walk-In Consulting
OSB 103: Mon. – Fri. from 1:00 to 3:00GLC Room A: Tues., Thurs., Fri. from 10:00 to 12:00 Hutcheson 403-J: Wed. from 10:00 to 12:00
All services are FREE for VT researchers. We assist with research—not class projects or homework.
LISA helps VT researchers benefit
from the use of Statistics
www.lisa.stat.vt.edu
Designing Experiments • Analyzing Data • Interpreting ResultsGrant Proposals • Using Software (R, SAS, JMP, Minitab...)

Hypothesis Test3
A hypothesis test is a detailed protocol for decision-making concerning a population by examining a sample from that population.

Hypothesis Tests vs. Criminal Trials
4
Burden of Proof—Obligation to shift the conclusion using evidence
TrialHypothesis Test
Innocent until proven guilty
Assume the initial hypothesis is true until
the data suggests otherwise

Steps in a Hypothesis Test
1. Test
2. Assumptions
3. Hypotheses
4. Mechanics
5. Conclusion
5

One Sample t-Test• Used to test whether the population mean is different from
a specified value.
6

Medical Example• In a glaucoma study, the following intraocular pressure
(mm Hg) values were recorded from a sample of 21 elderly subjects. Based on this data, can we conclude that the mean intraocular pressure of the population from which the sample was drawn differs from 14 mm Hg?*
7
Intraocular Pressure
14.5 12.9 14 16.1 12 17.5 14.1
12.9 17.9 12 16.4 24.2 12.2 14.4
17 10 18.5 20.8 16.2 14.9 19.6
*Wayne, D. Biostatistics: A Foundation for Analysis in the Health Sciences. 5th ed. New York: John Wiley & Sons, 1991.
𝑦=15.6238 𝑠=3.383

Assumptions
• The data are randomly sampled from the population.
• The data are approximately normally distributed.
• Our data are representative of the variable of interest, which is also referred to as the response variable.
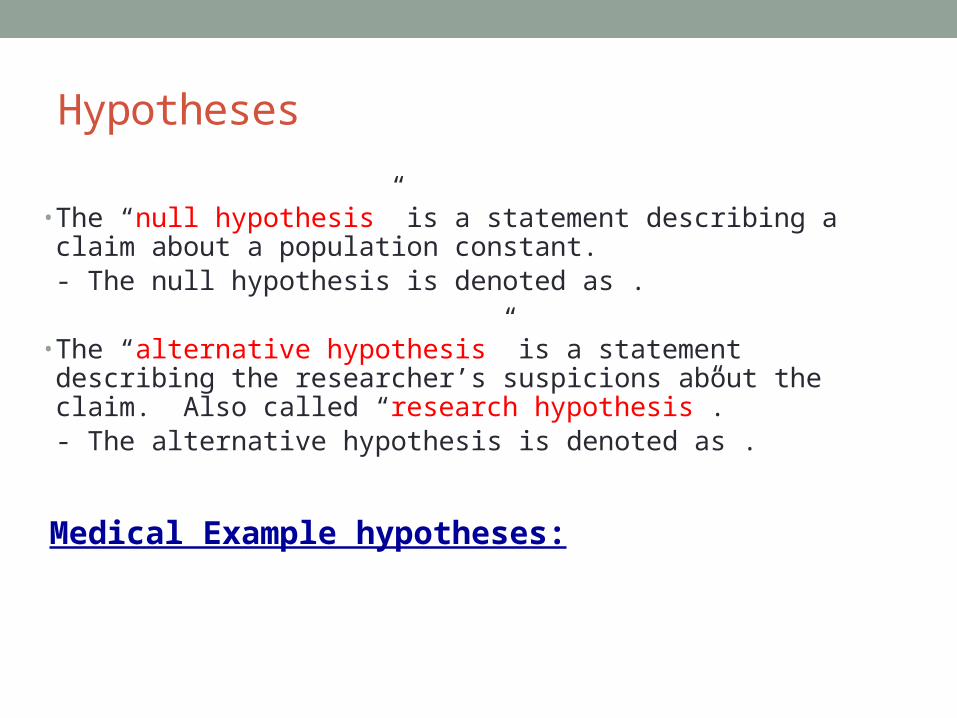
Hypotheses
• The “null hypothesis” is a statement describing a claim about a population constant. - The null hypothesis is denoted as .
• The “alternative hypothesis” is a statement describing the researcher’s suspicions about the claim. Also called “research hypothesis”.- The alternative hypothesis is denoted as .
Medical Example hypotheses:

Hypotheses
• For hypothesis testing there are three versions for testing that are determined by the context of the research question.
• Left Tailed Hypothesis Test (less than)• Right Tailed Hypothesis Test (greater than)• Two Tailed or Two Sided Hypothesis Test (not equal to)

Mechanics
• Rejection Rule: Reject the null hypothesis () if the p-value
• Test Statistic: Compute the test statistic, which is a standardization of the sample mean, and is needed for the p-value computation.
• P-value: The chance of observing your sample results or more extreme results assuming that the null hypothesis is true. If this chance is “small” then you may decide the claim in the null hypothesis is false.
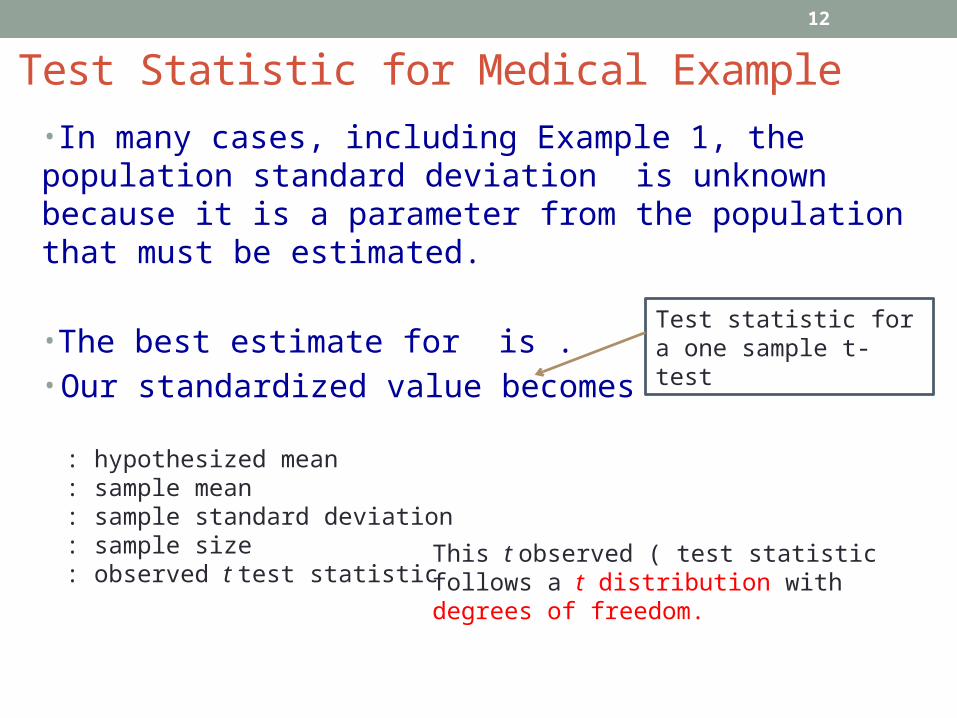
Test Statistic for Medical Example
•In many cases, including Example 1, the population standard deviation is unknown because it is a parameter from the population that must be estimated.
•The best estimate for is .• Our standardized value becomes
12
: hypothesized mean: sample mean: sample standard deviation: sample size: observed t test statistic
Test statistic for a one sample t-test
This t observed ( test statistic follows a t distribution with degrees of freedom.

Test Statistic for Medical Example
• In the example it was given that and .
𝒕𝒐𝒃𝒔=𝒚−𝝁𝟎
𝒔/√𝒏=𝟏𝟓 .𝟔𝟐𝟑𝟖−𝟏𝟒
𝟑 .𝟑𝟖𝟑 /√𝟐𝟏=𝟐 .𝟐𝟎

P-value• The p-value is determined based on the sign of the
alternative hypothesis.
1. . If this is the case, then the p-value is the area in both tails of the t distribution.
0.4
0.3
0.2
0.1
0.0
Densi
ty
-t_obs
1/2 p-value
t_obs
1/2 p-value
0

P-value• The p-value is determined based on the sign of the
alternative hypothesis.
2. . If this is the case, then the p-value is the area to the left of the observed test statistic.
0.4
0.3
0.2
0.1
0.0
Densi
ty
t_obs
p-value
0

P-value• The p-value is determined based on the sign of the
alternative hypothesis.
3. . If this is the case, then the p-value is the area to the right of the observed test statistic.
0.4
0.3
0.2
0.1
0.0
Densi
ty
t_obs
p-value
0

Medical Example
• P
0.4
0.3
0.2
0.1
0.0
t
Densi
ty
-2.2
0.01986
2.2
0.01986
0

Conclusion
• Conclusions should always include:• Decision: reject or fail to reject
(not accept ).• Context: what your decision means in context of the
problem.
• Medical Example: With a p-value=0.0398, which is less than 0.05, we reject . There is sufficient sample evidence to conclude that the true mean intraocular pressure differs from 14 mm Hg.

Summary of One Sample t-test
• Test Statistic:
• Degrees of Freedom:
• Assumption: The population from which the sample is drawn is normal or approximately normal.
19
2-Tailed Test Right-Tailed Left Tailed
Null hypothesis
Alternative hypothesis

Importing Data into JMP
20
*http://nuke.progettiesistemi.com/SimpleBusiness/tabid/97/Default.aspx

Egyptian Skulls Data Set
• Four measurements of male Egyptian skulls from 5 different time periods. Thirty skulls are measured from each time period.
• Variables• MB: Maximal Breadth of Skull• BH: Basibregmatic Height of Skull • BL: Basialveolar Length of Skull• NH: Nasal Height of Skull• Year: Approximate Year of Skull Formation
• (negative = B.C., positive = A.D.)
21
*Thomson, A. and Randall-Maciver, R. (1905) Ancient Races of the Thebaid, Oxford: Oxford University Press. *http://members.ozemail.com.au/
~rdunlop/CoplandMain/MathsLG/CollandEntDataLG.htm
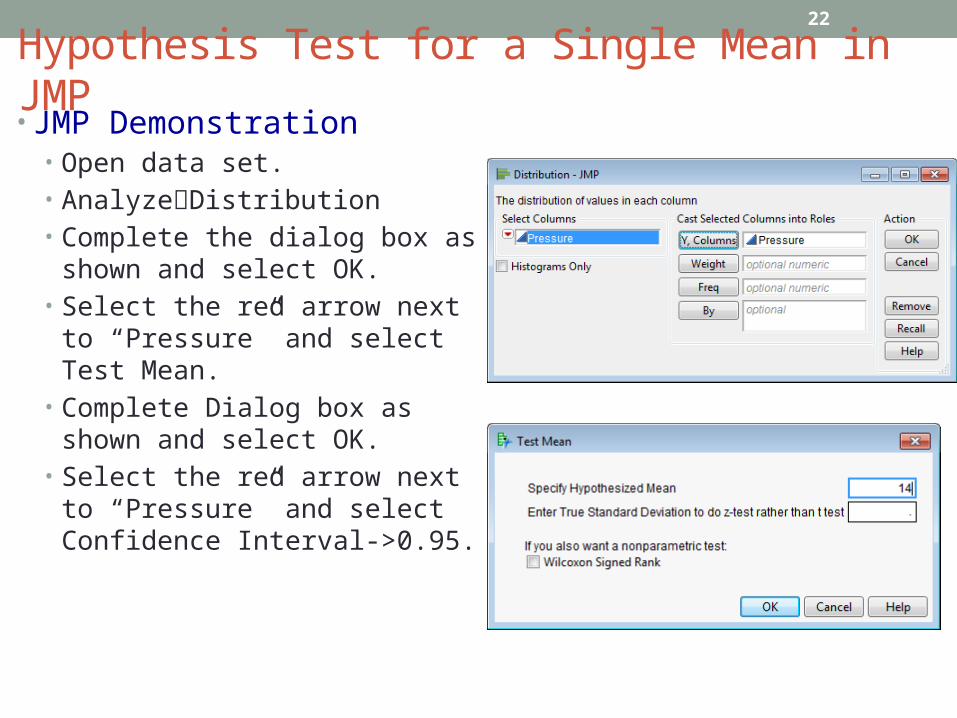
Hypothesis Test for a Single Mean in JMP• JMP Demonstration
• Open data set.• AnalyzeDistribution• Complete the dialog box as shown
and select OK.• Select the red arrow next to
“Pressure” and select Test Mean.• Complete Dialog box as shown
and select OK.• Select the red arrow next to
“Pressure” and select Confidence Interval->0.95.
22

Two Sample T-Test• The major goal is to determine whether a difference exists
between two populations.
• Examples:• Compare blood pressure for male and females.• Compare the proportion of smokers and nonsmokers
with lung cancer.• Compare weight before and after treatment.• Is the mean cholesterol of people taking drug A lower than the
mean cholesterol of people taking drug B?
23
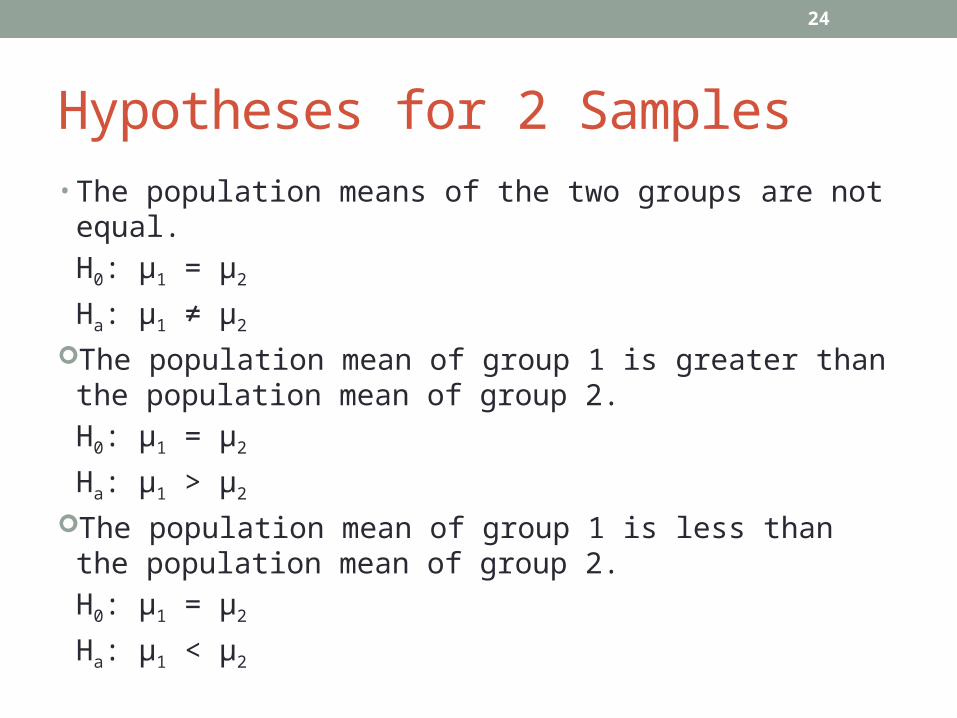
Hypotheses for 2 Samples• The population means of the two groups are not equal.
H0: μ1 = μ2
Ha: μ1 ≠ μ2
The population mean of group 1 is greater than the population mean of group 2.
H0: μ1 = μ2
Ha: μ1 > μ2
The population mean of group 1 is less than the population mean of group 2.
H0: μ1 = μ2
Ha: μ1 < μ2
24

Two Sample Assumptions• The two samples are random and independent.
• The populations from which the samples are drawn are approximately normal.
• The populations have the same standard deviation.
25

Test Statistic for TWO Samples
• Upon calculation of the test-statistic, we can then
calculate the p-value and draw our conclusion.
26
𝒔𝒑=√ (𝒏𝟏−𝟏) 𝒔𝟏𝟐+ (𝒏𝟐−𝟏) 𝒔𝟐
𝟐
𝒏𝟏+𝒏𝟐−𝟐

Summary: Two Sample t-Test
• Test Statistic:
27
2-Tailed Test Right-Tailed Left Tailed
Null
Alternative
Assumption: The populations from which both samples are drawn are normal or approximately normal.

VA Lung Cancer Data Set
• Veteran's Administration lung cancer trial.• Variables
• stime: Survival of follow-up time in days.• status: Dead or Censored.• treat: Treatment type of either Standard or Test.• age: Patient’s age in years.• Karn: Karnofsky score of patient's performance on a scale of 0
(dead) to 100 (perfectly normal). • diag.time: Time since diagnosis in months at entry to the trial.• cell: One of four cell types.• prior: Did the patient receive prior therapy?
28
*Kalbfleisch, J.D. and Prentice R.L. (1980) The Statistical Analysis of Failure Time Data. Wiley.
*http://lungcancernewstoday.com/2015/03/05/fda-grants-licensing-application-to-opdivo-for-the-treatment-advanced-squamous-nsclc/

JMP • JMP Demonstration:
Analyze Fit Y By X
Y, Response: Karnofsky Score (Karn)
X, Factor: Treatment (treat)
Select: Means/ANOVA/Pooled t
29
Paired t-Test• The objective of paired comparisons is to minimize
sources of variation that are not of interest in the study by pairing observations with similar characteristics.
• Example:
A researcher would like to determine if background noise causes people to take longer to complete math problems. The researcher gives 20 subjects two math tests one with complete silence and one with background noise and records the time each subject takes to complete each test.
30

Hypotheses for Paired t-Test
• The population mean difference is not equal to zero.
H0: μdifference = 0
Ha: μdifference ≠ 0
• The population mean difference is greater than zero.
H0: μdifference = 0
Ha: μdifference > 0
• The population mean difference is less than a zero.
H0: μdifference = 0
Ha: μdifference < 0
31

Assumptions for Paired t-Test
• The sample is random.
• The data is matched pairs.
• The differences have a normal distribution.
32

Test Statistic for Paired t-Test
33
Where bar is the mean of the differences and sd is the standard deviations of the differences.
• Upon calculation of the test-statistic, we can then calculate the p-value and draw our conclusion.
• Test Statistic:

Summary of Paired t-Test
• Test Statistic:
• Degrees of Freedom:
34
2-Tailed Right Tailed Left Tailed
Null
Alternative
Assumption: The population of differences is normal or approximately normal.

Egyptian Skulls Data Set
• Four measurements of male Egyptian skulls from 5 different time periods. Thirty skulls are measured from each time period.
• Variables• MB: Maximal Breadth of Skull• BH: Basibregmatic Height of Skull • BL: Basialveolar Length of Skull• NH: Nasal Height of Skull• Year: Approximate Year of Skull Formation
• (negative = B.C., positive = A.D.)
35
*Thomson, A. and Randall-Maciver, R. (1905) Ancient Races of the Thebaid, Oxford: Oxford University Press. *http://members.ozemail.com.au/
~rdunlop/CoplandMain/MathsLG/CollandEntDataLG.htm

Paired T-Test Example
• JMP Analysis:• Create a new column of Diff = MB – BH• Analyze Distribution• Y, Columns: Diff
• Test Mean• Specify Hypothesized Mean: 0
36

One-Way ANOVA• ANOVA is used to determine whether three or more
populations have different distributions.
37
A B C
Medical Treatment

ANOVA Strategy
• The first step is to use the ANOVA F test to determine
there are any significant differences among the population
means.
• If the ANOVA F test shows that the population means are
not all the same, then follow up tests can be performed to
see which pairs of population means differ.
38

One-Way ANOVA Model
i
ij
i
ij
ijiij
nj
ri
N
y
y
,,1
,,1
),0(~
groupith theofmean theis
levelfactor ith on the jth trial theof response theis
Where
2
39
In other words, for each group the observed value is the group mean plus some random variation.

One-Way ANOVA Hypothesis
• Test whether there is a difference in the population means.
40
equal. allnot are The :
: 210
ia
r
H
H

ANOVA Assumptions
• The samples are random and independent of each other.
• The populations are normally distributed.• The populations all have the same standard deviations.
• The ANOVA F test is robust to the assumptions of normality and equal standard deviations.
41

Step 3: ANOVA F Test
42
Compare the variation within the samples to the variation between the samples.
A B C A B C
Medical Treatment

ANOVA Test Statistic
MSE
MSG
Groupswithin Variation
Groupsbetween Variation F
43
Variation within groups small compared with variation between groups → Large F
Variation within groups large compared with variation between groups → Small F

MSG
1-r
)(n)(n)(n
1 -r
SSGMSG
21r
222
211
yyyyyy
44
• The mean square for groups, MSG, measures the
variability of the sample averages.
• SSG stands for sums of squares groups.
• r = “# of groups”
MSE
1
)(
s
Wherer -n
1)s - (n1)s - (n 1)s - (n
r -n
SSE MSE
1i
2rr
222
211
i
n
jiij
n
yyi
45
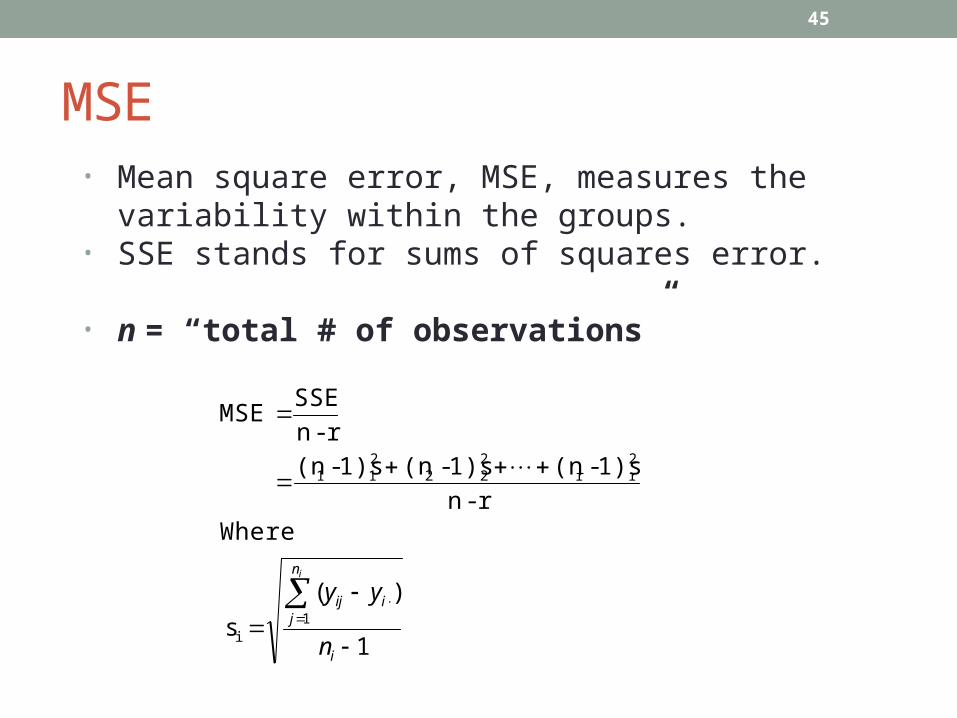
• Mean square error, MSE, measures the variability within the groups.
• SSE stands for sums of squares error.
• n = “total # of observations”

ANOVA in JMP
• JMP demonstration• Analyze Fit Y By X
• Y, Response: MB• X, Factor: Year (change to nominal)
Normal Quantile Plot Plot Actual by Quantile
Means/ANOVA
46
Follow-Up Test
• If the F-test results in a significant p-value, we can then use Tukey’s HSD Test to determine which pairs of groups are significant!
47

Tukey Tests• Tukey’s test simultaneously tests
• JMP demonstration:• Oneway ANOVA Compare Means All Pairs, Tukey HSD
48
'a
'0
:H
:H
ii
ii
for all pairs of factor levels.
Two-Way ANOVA• We are interested in the effect of two categorical factors
on the response. • We are interested in whether either of the two factors
have an effect on the response and whether there is an interaction effect. • An interaction effect means that the effect on the response of one
factor depends on the level of the other factor.
49

Interaction
Low High Dosage
Impr
ovem
ent
No Interaction
Drug A Drug B
50
Low High Dosage
Impr
ovem
ent
Interaction
Drug A Drug B

Two-Way ANOVA Model
ij
ijk
ij
j
i
ijk
ijkijjiijk
nk
bj
ai
N
y
y
,...,1
,,1
,,1
),0(~
Bfactor of leveljth theandA factor of levelith theofeffect n interactio theis )(
Bfactor of leveljth theofeffect main theis
Afactor of levelith theofeffect main theis
mean overall theis
level Bfactor jth theand levelA factor ith on the kth trial theof response theis
Where
)(
2
51

VA Lung Cancer Data Set
• Veteran's Administration lung cancer trial.• Variables
• stime: Survival of follow-up time in days.• status: Dead or Censored.• treat: Treatment type of either Standard or Test.• age: Patient’s age in years.• Karn: Karnofsky score of patient's performance on a scale of 0
(dead) to 100 (perfectly normal). • diag.time: Time since diagnosis in months at entry to the trial.• cell: One of four cell types.• prior: Did the patient receive prior therapy?
52
*Kalbfleisch, J.D. and Prentice R.L. (1980) The Statistical Analysis of Failure Time Data. Wiley.
*http://lungcancernewstoday.com/2015/03/05/fda-grants-licensing-application-to-opdivo-for-the-treatment-advanced-squamous-nsclc/

Two-Way ANOVA in JMP
• JMP demonstration• Analyze Fit Model• Y: Karn• Highlight treat and status and click Macros Factorial to Degree• Run Model
53

Acknowledgements
• Tonya Pruitt, LISA Administrative Specialist, VT Department of Statistics
• Dr. Chris Franck, Assistant Research Professor, VT Department of Statistics
• Dr. Anne Ryan Driscoll, Assistant Research Professor, VT Department of Statistics
54