T S - 3 Efficiency Improvement in Auxiliary Equipement
59
III-1 KEYNOTE ADDRESS ON ENERGY CONSERVATION MEASURES IN THERMAL POWER PLANTS S. Rajaram, General Manager, BHEL, Tiruchirapalli 1.0 INTRODUCTION Energy is one of the foremost requirements for development in any country. Every nation ,developed or developing, requires energy to increase productivity. Hence increasing the energy efficiency and conservation of energy is the need of hour and is the concern for all in the power sector. For achieving this each of the partners, the power equipment manufacturer, the utility and the service provider, has to play his role effectively. Energy Conservation can be achieved by increasing the efficiency of power generation, improving the heat rate, reducing the auxiliary power consumption etc., And all this has to be achieved at the least cost and without compromising on the environmental norms. Finally the cost and the equipment availability are emerging as the two most important criteria governing the design of modern steam generating equipment. BHEL as an equipment manufacturer for power plants is always geared up to meet the energy conservation requirements and some of its contributions towards this are briefed here. 2.0 BHEL’S EFFORTS IN ENERGY CONSERVATION Importance is attached to design and operation of boilers, keeping the exit gas temperature of the boiler as low as possible, by proper design of burner, furnace, pressure parts and airheaters. This coupled with optimum excess air levels of combustion, results in higher efficiencies. For every 10ÚC reduction in exit gas temperature, a saving of nearly 7000 tons / year of coal for a 210 MW boiler and 16500 tons / year of coal for a 500 MW boiler is achievable(for a coal calorific value of 3500 Kcal/Kg). Many of the operating coal fired units were originally designed for the exit gas temperature of 150ÚC in 1980s. New designs adopt only 125ÚC or lower as exit gas temperature with low sulphur fuels. The efficiency of the older units can also be improved by reducing the exit gas temperature to 125ÚC. 2.1 Introduction of higher pressure and temperature cycles Depletion of fossil fuel reserves and ever increasing cost of fuel coupled with environmental protection requirements warrant higher pressure and temperature cycles to be introduced in power generation. BHEL adapted to this change even from the early years. While the pressure rating is 96 ata for the 60MW boilers, the pressure rating has been gradually increased to 130 ata for the 210 MW LP units, to 150 ata for the 210 MW (HP) units and later on to 170 ata for the 500 MW units introduced in the country. This has considerably reduced the station heat rate to the tune of 400 to 450 Kcal/ National Symposium on Energy Conservation Measures in Generating Sector, Nov. 17-18, 2005, Bangalore TECHNICAL SESSION - III EFFICIENCY IMPROVEMENT IN AUXILIARY EQUIPEMENT
-
Upload
moorthymtps54120305 -
Category
Documents
-
view
21 -
download
11
description
tt
Transcript of T S - 3 Efficiency Improvement in Auxiliary Equipement

III-1
KEYNOTE ADDRESS ONENERGY CONSERVATION MEASURES IN THERMAL POWER
PLANTS
S. Rajaram,General Manager, BHEL, Tiruchirapalli
1.0 INTRODUCTION
Energy is one of the foremost requirements for development in any country. Every nation ,developedor developing, requires energy to increase productivity. Hence increasing the energy efficiency andconservation of energy is the need of hour and is the concern for all in the power sector. Forachieving this each of the partners, the power equipment manufacturer, the utility and the serviceprovider, has to play his role effectively.
Energy Conservation can be achieved by increasing the efficiency of power generation, improvingthe heat rate, reducing the auxiliary power consumption etc., And all this has to be achieved at theleast cost and without compromising on the environmental norms. Finally the cost and the equipmentavailability are emerging as the two most important criteria governing the design of modern steamgenerating equipment. BHEL as an equipment manufacturer for power plants is always geared upto meet the energy conservation requirements and some of its contributions towards this are briefedhere.
2.0 BHEL’S EFFORTS IN ENERGY CONSERVATION
Importance is attached to design and operation of boilers, keeping the exit gas temperature of theboiler as low as possible, by proper design of burner, furnace, pressure parts and airheaters. Thiscoupled with optimum excess air levels of combustion, results in higher efficiencies. For every10ÚC reduction in exit gas temperature, a saving of nearly 7000 tons / year of coal for a 210 MWboiler and 16500 tons / year of coal for a 500 MW boiler is achievable(for a coal calorific value of3500 Kcal/Kg). Many of the operating coal fired units were originally designed for the exit gastemperature of 150ÚC in 1980s. New designs adopt only 125ÚC or lower as exit gas temperaturewith low sulphur fuels. The efficiency of the older units can also be improved by reducing the exitgas temperature to 125ÚC.
2.1 Introduction of higher pressure and temperature cycles
Depletion of fossil fuel reserves and ever increasing cost of fuel coupled with environmental protectionrequirements warrant higher pressure and temperature cycles to be introduced in power generation.BHEL adapted to this change even from the early years. While the pressure rating is 96 ata for the60MW boilers, the pressure rating has been gradually increased to 130 ata for the 210 MW LPunits, to 150 ata for the 210 MW (HP) units and later on to 170 ata for the 500 MW units introducedin the country. This has considerably reduced the station heat rate to the tune of 400 to 450 Kcal/
National Symposium on Energy Conservation Measures in Generating Sector, Nov. 17-18, 2005, Bangalore
TECHNICAL SESSION - III
EFFICIENCY IMPROVEMENT INAUXILIARY EQUIPEMENT

III-2
KW-hr. BHEL is also gearing up to improve the plant efficiency and to further reduce the heat rateby going in for supercritical pressure cycles and higher steam temperatures.
2.2 Efforts in reducing auxiliary power consumption
Another significant area is in the reduction of auxiliary power consumption. High efficiency axialfans are designed and supplied to power plants. These axial fans are compact in design and havea smooth operating hydraulic-servo motor for varying the blade pitch for various operating conditions.Higher efficiencies over a wide range of operation is the speciality of this design. For radial fans,variable frequency drive systems have been developed and supplied to control motor and fanspeed for achieving better efficiencies at part loads, thereby saving auxiliary power considerably.For example, the Variable frequency drive (VFD) in a 500 MW induced draft fan can save about350 KW to 400 KW of power per boiler.
BHEL has also introduced the advanced microprocessor based “Integrated Operating System” forElectrostatic Precipitators. This system while maintaining the precipitator efficiency at the samelevels, reduces corona power consumption by more than 50%.
2.3 Smart wall blowing system
BHEL has developed and supplied Smart wall blowing system (SWBS) to Raichur TPS 210MWboiler. It has the potential to increase the cycle efficiency, improve the heat rate of the boiler, reducethe tube erosion and marginally improve the creep life of SH/RH tubes. The system has featuressuch as indigenously developed heat flux sensors mounted on the water walls of the furnace andassociated electronic hardware/software system with a capability to interact with the existing sootblower control system. The system has reduced wall blowing by about 70% resulting in savings ofRs 62 lakhs per year per 210 MW boiler by way of reduced steam requirement for wall blowing,reduced make up water addition and increased life of heat transfer surfaces.
2.4 Acoustic steam leak detection-a proactive measure
BHEL has developed indigenous Acoustic steam leak detection system for early detection of tubeleakages in water walls and Superheater/Reheater areas. This will help in attending to the leakingtubes in time and also further prevent the damages to the other tubes. This will improve the meantime to repair and thus contribute to improved availability.
2.5 Visible light scanners
Introduction of visible light flame scanner in place of ultra-violet scanners, with additionalredundancies in controls, has further helped to reduce fuel oil consumption to a very great extentby avoiding spurious trips of boiler.
S. Rajaram

III-3
2.6 Improving availability through water chemistry audits
BHEL conducts water chemistry audit in power plants based on the request from the utilities. Itinvolves reviewing the present method followed, identifying the deviations in water chemistry andsuggesting remedial measures to be taken to correct the deviation, if any and also modifications inthe method followed. This will drastically reduce the problems of forced outages arising due to poorwater chemistry.
2.7 Coal beneficiation for multiple benefits
Reducing the cost of power produced is the ultimate goal in power sector. In this connection BHELis of the opinion that use of washed coal in power generation will considerably yield the desiredresults. A preliminary study in a 500 MW unit shows that a saving of as much as 20% can beachieved through optimization of boiler and auxiliaries design and through reduced auxiliary powerconsumption if we use the washed coal of 24% ash when compared to the 45% ash coal presentlyused in Indian power plants. Coal washing reduces the ash and increases the calorific value of fuel.About 90 million tons of coal (45%ash) are transported up to a distance of 1000KM from the mineson an average in India today. It is estimated that on reducing the ash content to 32% by beneficiation,the cost of transportation will reduce by Rs1000crores for 18 million tons of coal (20% rejects) asper 1999-2000 estimates. No doubt coal washing yields washery rejects. But these washery rejectscan also be used as a fuel in CFBC and AFBC boilers to generate power. Utilities have to take theinitiative in the use of washed coals in their plants. Further availability will improve due to minimalproblems due to erosion and O&M costs are bound to come down.
2.8 RLA studies for planned improvement
BHEL is conducting the Residual Life Assessment (RLA) and Life Extension Programs (LEP) forboilers. Several of the boilers have been operating for a few decades and many have well crossedtheir theoretical design life. Hence, from the safety and performance point of view, it becomesimperative to check the health of the components and to certify the boiler for continued service forsome more years. Hence these programs have assumed great significance in today’s contextmarked by financial crunch and acute shortage of electric power in the country. BHEL has carriedout about 200 RLA studies both on Non-BHEL and BHEL supplied boilers. This helps in turn to goin for predictive maintenance schedules and improve availability to a higher extent.
BHEL has developed BHELMOLT, a state-of-the-art technology for non-destructive, insitu,measurement of the steam side oxide scale build up in tubes. Ultrasonic measurements of thesteam side oxide scale thickness and the tube wall thickness are made at critical locations in thehigh flux zone and near the bottom bend of superheater and reheater coils. These values are usedas inputs by BHELMOLT’s powerful computer-based software, which accurately calculates tubemetal temperatures for the entire cross section of tubes and provides a graphical representation ofthe residual life. Studies show that one of the major causes of forced outages in power plants is thefailure of superheater and reheater tubes which are subjected to creep due to constant operation
Energy conservation measures in thermal power plants

III-4
under high temperature and pressure condition. Accurate assessment of the residual life of tubesis the effective method to minimize forced outage due to tube rupture and improve the operatingavailability of power plants.
3.0 CONCLUSION
Energy conservation is a continuous effort to be put forth by Equipment manufacturer, Utility andService provider. Introducing new/reliable technologies for improving the heat rate, improving theboiler efficiency, reducing the auxiliary power consumption and developing new tools for predictivemaintenance and improved operational efficiency are some of the measures adopted by BHEL incontributing to energy conservation and availability improvement.
BIO-DATA OF SPEAKER
Dr.S. Rajaram is General Manager (Engineering & Commercial/FB) in BHEL,Trichy-14. He is a Post Graduate from REC, Trichy & Ph.D in Mechanical Enggfrom Bharatidasan University. He joined BHEL, Trichy as Graduate Apprenticein December 1969. He underwent training in Combustion Engineering USA.He has over 35 years experience in Engineering, Commercial and ProjectManagement. He has been instrumental in development & commercialisationof Fluidised Bed Boilers and Heat Recovery Steam Generators. He has severalPapers in International Seminars and Conferences to his credit. He is a Recipientof Foster Wheeler Award of Institute of Energy, UK. At present, he is responsible
for Engineering, Contracts and implementation of Strategic Plan at BHEL, Trichy
S. Rajaram

III-5
IMPROVEMENT IN ENERGY EFFICIENCY OF AUXILIARYEQUIPMENT IN TPS
Rajashekar P. MandiEnergy Conservation & Development Division,Central Power Research Institute, Bangalore -560 080Phone: 080 2360 4682, Fax: 080 2360 1213, E-mail: [email protected],
ABSTRACT: This paper describes the results of energy conservation measures invarious thermal power plants spread over the country. Energy savings in various majorauxiliaries are summarized here with improved performance. Staggering of auxiliaryloads, reduction in hydrodynamic resistance of pipes and ducts, adoption of new energyefficient technologies, efficient control techniques, reduction in furnace ingress andmonitoring of coal size at mill inlets will lead to substantial amount of energy savings.The energy conservation schemes are economically attractive with a break even periodof 1 to 5 years.
1.0 INTRODUCTION
The thermal power plant availability depends largely upon the operational reliability of the auxiliaryequipment and the capability of the auxiliary system. Coal fired stations are the backbone of theIndian power generating sector and account for over 76 % of the generated power [1,2]. The netoverall efficiency of the coal fired thermal power plants are in the range of 19.23 % (30 MW plant)and 30.69 % (500 MW plant). The auxiliary power consumption is varying between 7 % (500 MWplant) and 12 % (30 MW plant). The auxiliary power consumption is on higher side as compared toother developed countries due to the use of poor coal quality, excessive steam flow, excessivewater flow, internal leakage in equipment, inefficient drives, lack of operational optimization ofequipment, ageing of equipment, hesitation in technology upgradation, obsolete equipment, designdeficiencies, oversizing of equipment, use of inefficient controls, etc.,
The auxiliary power consumption can be reduced, by improving the design of the equipment, byoperational optimization, adoption of control techniques and implementation of energy conservationmeasures. The saved energy can be pumped into the grid with nominal investment.
2.0 AUXILIARY POWER CONSUMPTION (APC)
The progressive changes over the years in unit size and operating parameters of thermal generatingsets, indicates a steady development in unit sizes with a variety of technologies, upgradation ofoperating parameters, etc. The diversity of unit sizes in thermal power stations in India ranges from30 MW to 500 MW of capacity. Most of the capacity addition done in the late seventies and mid-eighties have been in the 110 MW/210 MW unit capacity sizes which have completed about 50 %of their useful life. As the size of the unit increases, the auxiliary power consumption (i.e., thedifference between gross and net efficiency) decreases. Therefore, the present trend has been to
National Symposium on Energy Conservation Measures in Generating Sector, Nov. 17-18, 2005, Bangalore

III-6
add larger unit sizes of 250 MW/500 MW capacity. Alongside the growth in unit sizes, considerabletechnological innovations have also been taken place in upgradation of auxiliary systems andimprovement in designs of auxiliary equipment. These changes have increased the operationalreliability and efficiency of the auxiliaries.
The variation of auxiliary power with unit size can be computed by:
)1(%684.12.0193.0.052 2 +−−= PRPREAP
Where AP is auxiliary power in % of plant load, PR is the unit size in MW.
210 MW plants contribute the largest share in the India generating sector which accounts for 48.3% of total installed capacity) and generating 53 % of the total energy supply. 110 MW or smallersize units accounts for 33.3 % of total installed capacity & 27 % of the total energy generation while500 MW units had a share of 8.4 % in installed capacity with a 20 % share in energy generation.
Figure 1 gives the variation of auxiliary power with plant load factor (PLF) [3]. The auxiliary powerconsumption is greatly influenced by the PLF. As the PLF increases, the auxiliary power consumptiondecreases. Therefore, the plants have to be operated near to their full load. The total auxiliarypower can be computed by using the following curve fit:
Figure 1 : Variation of auxiliary power with plant load.
0
2
4
6
8
10
12
70 75 80 85 90 95 100 105Plant load factor, %
Au
xilia
ry p
ow
er, %
of
gro
ss g
en.
Out-lying
In-house
Total APC
)2(%8416.1.2696.0.002.0 2 ++−= PRPLFAP
Where PLF is plant load factor in %.
The In-house HT auxiliary power accounts for 5.5 – 7.5 %, the In-house LT accounts for 0.4 – 0.6%, out-lying HT & LT auxiliary equipment accounts for 0.7 – 0.95 % and losses account 0.35 – 0.55% of plant load. The In-house auxiliary power vary with plant load factor and can be curve fitted to:
)3(%82.13.0762.0.052 2 +−−= PLFPLFEIAP
Rajashekar P. Mandi

III-7
Where IAP is In-house auxiliary power in % of plant load
The out-lying auxiliary power will remain almost same and can be curve fitted to:
)4(%5264.2.0002.0 += PLFOAP
Where OAP is Out-lying auxiliary power in % of plant load
The major energy consuming auxiliary equipment in a coal fired thermal power plants are as follows:
a) Boiler auxiliary system : Induced draft (ID) fan, Forced draft (FD) fan, Primary air (PA) fan,Coal mills, Electrostatic precipitators, etc.
b) Turbine auxiliary system: Boiler feed pump (BFP), Condensate extraction pump (CEP),Circulating water pump (CWP), Cooling tower pump (CTP), Cooling tower (CT) fans, vacuumpumps, etc.
c) Ash handling system: Low Pressure (LP) Pump, High Pressure (HP) Pump, Ash Slurry Pump,Seal Water Pump, etc
d) Coal handling system: Crushers, conveyors, tipplers, stacker/reclaimer, etc.
The turbine auxiliary system accounts for about 52 to 58 % of the total auxiliary power consumptionfollowed by the boiler auxiliary equipment accounts for about 30 to 35 % of the total auxiliaryconsumption. The remaining auxiliary consumption is in ash handling and coal handling systems
3.0 REASONS FOR HIGH AUXILIARY CONSUMPTION
The factors responsible for high auxiliary power consumption can broadly be classified into threecategories:
a) plant specific factors
b) external factors; and
c) grid specific factors.
3.1 Plant specific factors
Plant specific factors can be further classified as follows:
a) Design deficiencies
b) Technology
c) Lack of Instrumentation & control
d) Forced outages
e) Operational practices and constraints
3.1.1 Design deficiencies
Generally to keep the safety margins and to operate the plant more than 60 % of the capacity by
Improvement in energy efficiency of auxiliary equipment in TPS

III-8
operating with single stream (air cycle or water cycle) due to non-availability of other stream, thefans and pumps are designed with high reserve capacities. Figure 2 gives the variation of reservecapacities of major fans and pumps. Operating the equipment at partial load will reduce the efficiencyof equipment. This will increase the auxiliary power consumption.
Figure 2: Capacity of individual equipment at 210 MW plant
69.20 %74.30 %
55.60 %
77.00 %
52.10 %
65.40 %
87.80 %
93.20 %
79.70 %83.23 %
30
40
50
60
70
80
90
100
110
BFP (flow) BFP (pressure) CEP (flow) CEP (pressure) IDF (flow) IDF (pressure) FDF (flow) FDF (pressure) PAF (flow) PAF (pressure)
Cap
acit
y, %
of
equ
ipm
ent
dis
. val
ue
Design valueOperating point
It can be seen from the Figure 2 that the design capacity of ID fan pressure and flow are 52.1 % and65.4 % respectively whereas the operating values are in the range of 70 – 79 % for flow and 45 – 95% for pressure. The design capacity of FD fan pressure and flow are 55.6 % and 77 % respectivelywhereas the operating values are very low i.e., 60 – 68 % for flow and 33 – 51 % for pressure.Sometimes, the FD fan motors are under loaded to below 60 % whose efficiency and power factorwill be very low. The design capacity of PA fan pressure and flow are 69.2 % and 74.3 % respectivelywhereas the operating flow are very low (40 – 61 %) and for pressure (69 – 79 %).
The design capacity of BF pumps are 79.7 % and 83.23 % respectively for flow and pressure. Theoperating conditions of BF pumps vary between 71 – 91 % on flow and 74 – 88 % on pressure side.The design capacity of CE pumps pressure and flow are 87.8 % and 93.2 % whereas the operatingpressure of CE pumps vary between 85 – 105 % and operating flow vary between 70 – 98 %. Sometimes the CE pumps are overloaded.
3.1.2 Technology adoption
Since the most of the unit size below 210 MW are installed before seventies, the auxiliary equipmentare of very old technologies. The same are being continued with lesser efficiency and higher auxiliarypower. If these older technology equipments are replaced with new technology, the substantialamount of auxiliary power consumption can be reduced.
3.1.2.1 Variable frequency drives for ID fans
The load on ID fans will be continuously varying between 60 – 75 %. It is beneficial to install the
Rajashekar P. Mandi

III-9
variable frequency drives. The installation of VFD will reduce the energy consumption by 5.3 MU/year per one 210 MW plant and the payback period will be 3 years. The other advantages over theprevailing technology of hydraulic and fixed speed motor drives are:
� smooth control of flue gas
� absence of limitation of number of starts
� no voltage dips in the system from direct-on-line starting of large size motors
� increased efficiency over wide operating speed range
� increased life of motors due to soft starts
� simple arrangements & no necessity of large cooling equipment for hydraulic coupling
� reduction in size of unit/station transformer rating & switchgear fault level,
3.1.2.2 Variable frequency drives for BF pumps
The load on boiler feed pumps will be varying. The installation of VFD will reduce the energyconsumption by 13.8 MU/year per one 210 MW plant and the payback period will be 3 – 3.5 years.
3.1.2.3 Steam driven BF pumps
Boiler feed pump is the single largest auxiliary in a power plant and accounts for approximately2.0 to 2.5 % of the gross generated power. It accounts for 20 to 25 % of the auxiliary power. If theBFP is re-powered by a service steam turbine drive instead of the present electric motor, theefficiency of conversion can be enhanced from 33 % to 35 % and the equivalent electrical power ofabout 7 MW can be released to the grid.
Steam driven BFPs are in use in the 30 MW, 62.5 MW and a few 110 MW units apart from 500 MWunits. The steam driven BFPs will provide better controllability (capacity modulation) as comparedto electric motor.
Variable pressure operation is possible at part loads with steam driven BFP. Presently, the BFPoutlet pressure is constant and is reduced by a valve at the turbine inlet. the BFP outlet pressurecan be varied according to the load, savings in energy consumption of the BFP can be achieved atpart loads
3.1.2.4 FRP fan blades for cooling towers:
The replacement of CT fan blades from GRP to FRP material [4] had reduced the power consumptionby 34.4 % (Table 1), the cooling tower Range had increased from 9.7 oC to 11.6 oC, the Approachhad decreased from 11.0 to 9.7 oC, the overall heat removal capacity (Effectiveness) had improvedfrom 46.86 % to 54.46 %, the fan air delivery capacity had increased from 4632 to 6030 m3/s (anincrease of 30.2 %) and the SEC had decreased from 26.12 to 13.17 W/t of air. The total energysaving for one 210 MW (i.e., nine CT fans) will be 1.84 MU/year. The anticipated investment willbe Rs. 33.75 lakhs and the pay back period will be 1.6 years.
Improvement in energy efficiency of auxiliary equipment in TPS

III-10
3.1.2.5 Retrofit of ash handling system
The existing wet ash handling system can be retrofitted by employing a dry fly ash evacuationsystem (silo system). This will reduce the power consumption by 3.3 MU/year per 210 MW plant.The pay back period will be about 13 years with an investment of Rs. 800 lakhs.
3.1.3 Instrumentation and control
The instrumentation plays a major role in energy conservation. At many plants the malfunctioningof instruments will draw more auxiliary power. For example, the closure of damper at mill inlet, theindicator at control room will be showing the damper is closed fully but at site the damper will bepartially closed and air will be passing through the non-working mill. Sometimes, the placing ofoxygen probe in the flue gas duct also mislead about the excess air. The oxygen probe must be atthe centre of the duct. The measurement of flue gas temperature at flue gas circuit will also misleadsometimes. Therefore, the instruments have to be calibrated once in a year.
Table 1: Performance results of replacement of GRP by FRP fans
Sl. Particulars GRP FRPNo.
1 Average Wet bulb temperature,( oC) 23.5 23.8
2 Average CW inlet temperature, (oC) 44.2 45.1
3 Average CW outlet temperature, (oC) 34.5 33.5
4 Condenser absolute pressure, (kPa) 9.5 9.4
5 Total power, (kW) 522.63 342.99
6 Reduction in power, (%) - 34.37
7 Average Air velocity, (m/s) 6.99 9.10
8 Total Air flow, (m3/s) 4632.1 6030.4
9 Increase in air flow, (%) - 30.19
10 Range, (oC) 9.7 11.6
11 Approach, (oC) 11.0 9.7
12 Effectiveness, (%) 46.86 54.46
13 Increase in effectiveness, (%) - 7.6
14 SEC, (W/t of air) 26.12 13.17
15 Reduction in SEC, (%) - 49.58
16 Average Fan efficiency, (%) 32.55 64.58
17 Increase in efficiency, (%) - 32.03
Rajashekar P. Mandi

III-11
The control system also contribute conservation of energy. The idle operation of crusher and conveyormotors can be avoided by providing the automatic control signal to the crusher and conveyor motorssequentially with minimum time lapse. The other control techniques like FD fan pitch operation canbe put in auto by sensing the oxygen in flue gas, PA air flow to the mill can be controlled by sensingthe coal air mixture temperature and coal-air ratio, etc..
When the wet bulb temperature is low, the circulating water temperature at condenser inlet will alsobe low (when all the 9 fans are in service), then the condensate is cooled below its saturationtemperature for example, when 9 fans are in service, the condenser absolute pressure is 9.0 kPa,the corresponding saturation temperature of condensate will be 43.76oC but the actual condensatetemperature at hot well is 38.7oC (less by 5.06 oC). This temperature has to be gained in the LPheaters. Therefore, in order to maintain the correct CW temperature, automatic controller for CTfans can be installed. The CT fan operation can be controlled by sensing the CW water temperatureat condenser inlet. The installation of controller will lead to energy saving of 14.77 MU/year. Theanticipated investment is about Rs. 80 lakhs and the pay back period is 4 months.
Some of the major auxiliaries require flow/ capacity adjustments to operate at varied loadingconditions of the unit. With fixed speed drives this is achieved by valves, dampers, etc. Inlet guidevane control is commonly used for ID fan and vane or variable pitch control is used for FD fans. ForBFP a hydraulic coupling with scoop control is quite commonly used in 210 MW units. Such controldevices create turbulence in the path of the fluid, thereby drastically reducing the device efficiencyand consume full power even when partly loaded. Instead, when the flow is controlled by varyingthe speed of the fan/ pump, smoother fluid flow results in higher efficiency for most of the operatingregion of the devices and hence for the system as a whole. The energy input is also reduced at partload, resulting in energy savings.
3.1.4 Operational optimization
Some of the operational parameters to be monitored on-line continuously to keep the plant healthyand operate with energy efficient and are as follows:
� Motor current with different frequency and voltage.
� O2 in flue gas at APH I/L with different load.
� Suction pressure and discharge pressure of pumps and fans with different loading.
� Winding temperature of motors.
� Bearing temperature of motors
� Air – coal ratio in mills
� Coal and air flow in mills
� Primary and secondary air flow
� Furnace draft, windbox pressure and flue gas pressure at different locations for differentplant load
Improvement in energy efficiency of auxiliary equipment in TPS

III-12
� Feed water and condensate flow
� CW inlet and outlet pressure and temperature
Some of the parameters to be monitored off-line and necessary actions required are:
� Water to ash ratio (on daily basis) : The water flow of HP and LP flush pumps may beadjusted.
� Pulverized coal fineness (once in a week for each mill): the classifier adjustment.
� O2 measurement at APH O/L, ESP I/L, ESP O/L and ID I/L (on weekly basis).
� Unburnt carbon in fly ash and bottom ash (daily basis)
3.2 External factors
a) Coal shortages. Due to shortfall in coal receipts, thermal units operate with very littlecoal stocks and there have been a number of instances of units having to run at lowloads or shut down due to coal shortages. This results in low PLF for the unit as well asthe plant, and increases the auxiliary consumption of the unit.
b) Poor coal quality. It is a common experience in thermal power plants that the coalreceived deviates from design values in terms of calorific value as well as ash content.The increased ash content in the coal increase the auxiliary of mills, PA fans and ID fans.The increased ash content also increase the power consumption of crushers and conveyorsystem. The presence of stones in the coal will increase the auxiliary power of crushersand conveyor system. 20 % stone in uncrushed coal will increase the auxiliary power ofcrushers by 12 % and 4 % of conveyor system. The other effects of high ash content incoal are:
i) Lower calorific value of coal and additional requirement of handling and millingcapacities. The existing design of power plants does not consider the effect of highparticulate presence on heat transfer and estimated value of gas temperatures.This quite often leads to high exit flue gas temperatures and consequent loss ofefficiency.
ii) Higher loading of Electrostatic Precipitators (ESPs). Compared to design coal, theadditional quantity of fly ash to be handled for worst quality coal. However, providingextra stream or extra field for ESPs to capture this extra ash has an impact on thelength of duct and consequently the ID fan capacity. Due to this limitation the ESPupgrade efforts are limited to reducing stack emissions to the extent possible andreducing energy consumption with pulse energization of ESPs.
iii) The ash handling system has to be run for longer durations because of increasedflyash quantity to be handled. This will increase the auxiliary power consumption ofash handling plant.
iv) Fouling of heat transfer surfaces, resulting in forced outages due to tube leakages.
Rajashekar P. Mandi

III-13
3.3 Grid specific factors
3.3.1 Backing down of units
Power demand in the system varies widely over a 24 hour period. The ratio of peak to off-peakdemand is of the order of 1.8 to 2. This requires backing down of substantial thermal capacityduring the night off peak hours, in order to regulate the frequency. Since the thermal (coalbased) units are primarily designed for base load operation, backing down of units can havethe following impacts on efficiency :
a) Percentage of auxiliary consumption is higher at part load because the reduction inauxiliary consumption is much less compared to reduction in generation due to backingdown
b) Operational constraints restrict the reduction in the number of auxiliaries in service duringpart load operation. For instance, due to unreliable operation of coal mills, all mills arerequired to be kept in service. Only the loading on the mills is reduced.
c) There are some technical constraints in reducing the output of auxiliaries during partload operation. Major auxiliaries like ID fans do not have variable speed drives (VSD).Control is affected by inlet guide vane control resulting in higher losses at part loads.Most of the auxiliaries have not been optimally sized from the point of view of part loadoperation and therefore the number of auxiliaries in service cannot be optimally selected.Some of the auxiliaries have technological constraints that prevent them from being shutdown and therefore have to be kept in service even when not required.
3.3.2 Reactive power generation by units
Due to mismatch of reactive power requirements in the grid and that generated, the systemvoltage dips. To stabilize the system voltage profile, generating units are asked to reduce theactive power generation and increase the reactive power generation from the unit. This isdone by increasing the excitation which is limited by the cooling efficiency of the generator.The increased reactive power generation will cause increased auxiliary power consumption.
4.0 OTHER ENERGY CONSERVATION MEASURES
4.1 Pumps
Table 2 gives the pressure survey of feed water – steam – condensate circuit at typical 210MW plant [5]. The SEC of BFP varies between 8.6 and 12.4 kWh/t of feed water flow and theSEC of CEP is in the range of 0.82 and 2.15 kWh/t of condensate flow.
Improvement in energy efficiency of auxiliary equipment in TPS

III-14
Some of the energy conservation measures are as follows:
i. In small units i.e., 62.5 MW and 30 MW units, BF pump motors are provided with solid coupling.In these situations, when the load reduces the water will be recirculated through the recirculationvalve. In order to reduce the recirculation, scoop coupling can be introduced in these unitswhich will reduce the energy consumption at BFP by about 10 to 25 % of power based onloading and the payback period will be 3 to 4 years.
ii. The re-circulation valve of BFP will be closed during normal operation but it was observedthat the passing through their recirculation valve i.e., in a case study at 210 MW plant thepassing through re-circulation was measured to about 4.1 % and this increases the power by3.1 % of input power.
iii. The hydodynamic pressure drop across BFP cicuit is 17.2 % of the BFP dischargepressure(design value : 13.5 %) whereas for CEP circuit is 69.5 % of the CEP discharge(design value : 67.5 %). This hydrodynamic resistance (pressure drop ) can be minimised to13.5 % in BFP circuit and 67.5 % CEP circuit by chemical cleaning and optimising the pipelengths to improve the pump efficiencies by 3 to 4 % and will lead to energy saving 2.1 MU/year.
iv. The higher power consumption by BFP and CEP due to increased specific steam consumption,increased auxiliary steam consumption, HP/LP turbine by passing flow, increase in boilerdrum blowdown.
v. The water to ash ratio in various plants was measured in the range of 14:1 to 5:1. Theincreased water to ash ratio will increase the power at ash slurry pumps (ASP), LP and HPwater pumps, raw water pumps, etc., and also more water make up at the plant. Thus theoptimised value of water to ash ratio should be 5:1 or 4:1. This will reduce the energyconsumption by about 10 - 15 % of the power used by these pumps.
Table 2: Pressure survey of feed water–steam–condensate circuit.
Particulars Design (MCR) Operating (210 MW)
Pin Pout ∆P Pin Pout ∆P
Gain in BFP 6.5 170 163.5 5.8 174.6 168.8
Gain in CEP -0.9 20 20.9 -0.9 19.0 19.9
BFP – HPT 170 147 23 174.6 144.5 30.1
HPH Train 170 166.9 3.1 174.6 168.5 6.1
Economizer 166.9 163 3.9 168.5 161.5 7.0
Superheaters 136 152 11.0 161.5 149.1 12.4
Reheaters 38 36.5 1.5 36.4 34.9 1.5
LPH Train 20 6.5 13.5 19.0 5.8 13.2
Rajashekar P. Mandi

III-15
vi. The increased presure drop across the condenser tubes cause more power at CW pumpsand higher pressure of circulating water at the top of the cooling tower also cause the increasedpower. Thus, it is suggested to optimise the pressure and reduce the pressure drop acrossthe condenser tubes by cleaing of tubes periodically. The normal pressure drop should be 0.4to 0.6 kg
f/cm2.
4.2 Fans
The SEC of PA fans is in the range of 2.4 and 7.4 kWh/t of primary air. The SEC of 30, 62.5 and 110MW plants are lower because the PA fans are in series with FD fans. Thus, these units consumeless energy compared to 210 and 500 MW plants where the PA fans draw the atmospheric airdirectly.
The SEC of FD fans are varying between 1.32 and 2.18 kWh/t of air. In 30, 62.5 and 110 MW plantsthe FD fan has to handle total air, thus higher SEC compared to 210 and 500 MW plants.
The SEC of ID fans is varying between 1.95 and 3.15 kWh/t of flue gas. At lower load the SEC ishigh for 500 MW plant
Figures 3, 4 and 5 show the variation of pressure drop across the air ducts and flue gas ducts.
Figure 3 : Variation of Secondary air pressure
-40
0
40
80
120
160
200
240
280
320
FD fan suction FD fan discharge AH inlet AH outlet Wind box pressure
Sec
on
dar
y ai
r P
ress
ure
, m
mW
C
Fan rated Pressure output = 494 mmWCFan pressure reserv e = 44.4 %
Design value at MCR
Some of the energy conservation measures for fans are as follows:
i. The air leakage through the air preheater increase the quantity of flue gas and subsequentlyincrease the power consumption of ID fans and air fans.
ii. Since the flue gas pressure inside the duct is negative, the air ingress is experienced in theflue gas ducts and ESPs. The air ingress in the duct and furnace will increase the powerconsumption of ID fans.
Improvement in energy efficiency of auxiliary equipment in TPS

III-16
iii. The operating air pressure in the secondary air circuit will always be less than the designvalue may be due to oversizing of equipment, furnace air ingress, etc.
iv. The operating air pressure in the primary circuit is higher than the design values may be dueto increased pressure drop in the ducts, air pre-heaters and mills. The increased pressuredrop increase the power of PA fans.
v. The FD fans in most of the plants are oversized and their load factors are in the range of 30 to50 %. At low load factor the motor efficiency and power factor will be low. Thus in a 210 MWunit if the existing FD fan motors of 820 kW (load factor of 30 %) are replaced by 320 kWmotors (load factor 81 %), will lead to energy savings of 0.3 MU/year.
Figure 4: Variation of Primary air pressure
43 mmWC
299 mmWC
-100
0
100
200
300
400
500
600
700
800
900
PA fan suction PA fan discharge Mill Inlet DP across AH DP across Mill
Pri
mar
y ai
r P
ress
ure,
mm
WC
Design value at MCR
Fan rated Pr. output = 1180 mmWCFan pressure reserv e = 30.8 %
vi. The operating pressure drop in the flue gas circuit is as high as 345 mmWC as against to thedesign value of 270 mmWC. This higher pressure drop consume more auxiliary power. Thispressure drop can be reduced by clearing the debris in the ducts.
vii. The increase in excess air flow causes more auxiliary power for ID fans and air fans. 25 %excess air will increase the ID fan power by 10.2 % and air fans by 3.8 %.
viii. The dust collection efficiency of ESP directly affects the increased power at ID fans.
ix. The leakage in Air preheater cause more power of air fans i.e., a leakage of 10 % will increasethe power of air fans by 9.7 %.
x. Maintaining the motor & fan bearing temperature by applying appropriate cooling system willreduce the frictional losses.
xi. Maintaining the appropriate clearance between impeller and casing will help in reduction ofauxiliary power.
Rajashekar P. Mandi

III-17
4.3 Mills
Figure 6 gives the variation of specific energy consumption for mills at different units. It can be seenfrom the figure that the SEC is varyiing between 5.31 kWh/t of coal and 15.89 kWh/t of coal.
In older units of 62.5 MW and 110 MW units are provided with drum type tube and ball mills whosespecific energy consumption is normally higher but it gives better performance and there is no millrejects. In present days 210 MW units and 500 MW units are provided with bowl mills of XRP type.The SEC of these mills is lower but if the rolls are not changed intime the out let coal quality will bepoor and gives more mill rejects.
Figure 5: Variation of flue gas pressure inside furnace
-350
-300
-250
-200
-150
-100
-50
0
50
Furnace RH inlet SH finishinlet
LTSH inlet ECO inlet AH inlet ESP inlet ID inlet ID outlet
Fu
rnac
e d
raft
, mm
WC
Design value at MCR
Fan rated Pressure output = 494 mmWCFan pressure reserve = 47.9 %
Figure 6 : Variation of SEC of Mills with plant load
5.0
7.0
9.0
11.0
13.0
15.0
17.0
60 70 80 90 100
Plant Load, %
SE
C, k
Wh
/t o
f co
al f
low
30 MW
62.5 MW
110 MW
210 MW
500 MW
Improvement in energy efficiency of auxiliary equipment in TPS

III-18
The mill SEC can be controlled by:i. Replacing the bowls with centrifugally cast Ni -hard bowls with properties guranteed for 6000
hours of operation.
ii. Restricting the mill input coal size below 25mm. If the raw coal size is 50 mm at mill inlet theauxiliary power mill increases by 1.5 %.
iii. The air to fuel ratio in mills may be maintained to the optimum value (i.e., between 1.8 – 2.0).
iv. Periodic monitoring of coal fineness and adjustment of spring tension.
v. Grinding the coal to more fine partii.e., more than 70 % below 75 micron size will increase themill power. 80 % pulverized coal below 75 microns will increase the mill power by 9 %.
4.4 Crushers and conveyors
The coal will be crushed in two stage crushing (primary crusher & secondary crusher) or singlestage crushing. The two stage crushing is advantages where big lumps of coal and stones arereceived. In primary crusher the coal size will be reduced to 100 to 125 mm and in secondarycrusher the coal size will be reduced to 25 mm. In single stage crusher, the coal size will be directlyreduced to 25 mm in single stage. The SEC of these crushers will be higher if the coal size is verybig. Generally in most of the plants adopt two stage crushing. The crushed coal will be transportedeither to the coal bunkers directly through different conveyor belts or stored in reclaimation coalyard for future use.
The SEC of coal handling plant will vary in the range of 1.1 and 1.6 kWh/t of coal. The SEC of coalcrushing and bunkering is varying between 0.7 and 1.2 kWh/t of coal and for re-claimation it is inthe range of 0.5 and 0.7 kWh/t of crushed coal. These SECs are mainly depending on how far thecoal handling plant is situated from the coal bunkers and the quality of the coal received.
The stones in the coal can be separated before passing through the crusher by manually becausethe stones in the coal will increase the power consumption of crushers, conveyor motors and finallymills. The other concept is to use of beneficiated coal. 20 % stones in the coal will increase thecrusher power by 4 % and conveyor motors by 12.3 %.
Table 3 gives the coal size analysis at crushers. It can be seen from the Table that about 78.7 % ofthe coal inlet to crusher is below 25 mm which can be by-passed by using the vibratory by-passscreen at the crusher inlet. This will reduce the power by about 30 %.
Table 3 : Coal particle size analysis at crusher.
Sl. Particulars Before AfterNo. crusher, % crusher, %01. Less tan 12.5 mm 55.12 74.2502. Between 12.5 mm – 25 mm 23.62 18.2303. Between 25 mm – 125 mm 16.54 7.5204. Above 125 mm 4.72 -
Rajashekar P. Mandi

III-19
The reduced coal flow through the system, the SEC of crushers and conveyor motors increases.The SEC of conveyor motors is very sensitive to the variation in coal flow. At 30 % of design coalflow, the SEC of conveyor motors is doubled (i.e., increased from 0.67 to 1.34) whereas the SEC ofcrusher motors is increased by 32 % (i.e., increased from 0.22 to 0.29). Therefore, it is economicalto operate the plant near full load.
Generally, the crusher motors are oversized and the load factors will be in the range of 20 – 30 %.The oversizing will reduce the motor efficiency and power factor. The optimum sizing of thesecrushers will enhance the energy saving of the order of 0.14 – 0.18 MU/year with a pay back periodof 3 – 4 years.
The no load power of crusher motor vary between 4 – 6 % whereas the no load power of conveyormotors will be in the range of 8 – 10 %. But in many cases, the no load power of conveyor motorswill be high because of increased frictional loss, non working of supporting rollers, misalignment ofconveyor motors and drive system, improper ventilation for motors, etc.
The load factors of conveyor motors at full capacity vary between 20 and 60 %. At low load factor,the motor efficiency and power factor will be poor. In order to improve the motor performance atpart load operation, the intelligent motor controller (POWER BOSS) can be used for theseconveyor motors. These controllers will reduce the energy consumption by 15 – 20 %.
4.5 LT and HT motors
In a power plant about 92 % of the auxiliary power is being used for induction motors. In which82.5% accounts for HT motors and 9.5 % for LT motors.
i. The voltage unbalance at motor input terminal cause more loss in motor i.e., an unbalance of3 % will increase the motor loss by about 28 %.
ii. The reduced voltage and frequency at the motor input will increase motor losses at the samepower output. 10 % voltage drop will increase the motor loss by 11 % and reduce the startingtorque by 19 %.
iii. The increased motor winding temperature cause more losses in motors. The highertemperature may be due to improper heat removal (i.e., blocking of air passages by dust) orby increased eddy current loss (i.e., melting of varnish inbetween the stator core stampings).
iv. The increased frictional losses due to poor heat removal at lub oil coolers. The cleaning oflube oil coolers and adequate quantity of cooling medium will reduce the frictional losses.
4.6 Distribution system
Considering the variation of auxiliary power with time for a typical day, the peak demand coincidingwith the grid peak demand can be off-set by de-energizing non-essential loads and staggering theoperation of bottom ashing, coal handling, etc., during peak hours.
Improvement in energy efficiency of auxiliary equipment in TPS

III-20
The power factor of auxiliary power is 0.80 to 0.83 (lag.) and can be improved by installing capacitorbanks. In a 210 MW plant, the estimated capacitor banks of about 12.5 MVAR will improve thepower factor to near unity and will reduce the in-house demand from 23.53 MVA to 19.54 MVA.Capacitive compensation not only releases the MVA to the grid but also reduces the network I2Rlosses and losses in transformers by about 13.3 % of total distribution losses (2.2 % of totalauxiliary power).
Power losses in transformers account for 12.8 % of total auxiliary power. Table 4 gives the loadfactors of station auxiliary transformers for a 210 MW plant. The load factors vary between 3.6 %and 50.3 %. Each transformer is provided with a stand-by transformer which will be charged on theprimary and provided with auto signal on secondary. It is suggested to de-energise the stand-bytransformer on the primary side and divert the load of all less loaded transformers on to a singletransformer whose load factor should be near to full load but should not exceed the full load. Thisleads to power savings of 0.54 MW (2.8 % of total auxiliary power).
4.7 Lighting
Lighting is the most visible form of electricity consumption and lighting load in power plant accountsfor 5 – 7 % of auxiliary power. By increasing the efficiency of lighting system will have certainlysignificant energy saving and improvement in the lighting level. A good lighting system design is toincrease the specific power consumption per illumination level index which can achieved by; use ofmore efficient lighting source, suitable to the specific visual task; use of proper luminaries and
Table 4 : Load factors of auxiliary transformers.
Sl. Particu- Voltage, Rating, Load Sl. Particu- Voltage, Rating, LoadNo. lars kV MVA factor, % No. lars kV MVA factor, %
1 SST 1 6.6/0.415 1.60 12.9 13 A/C T 1 6.6/0.415 2.00 5.7
2 SST 2 6.6/0.415 1.60 17.9 14 A/C T 2 6.6/0.415 2.00 22.9
3 SST 3 6.6/0.415 1.60 9.3 15 A/C T 3 6.6/0.415 2.00 16.0
4 SST 4 6.6/0.415 1.60 5.7 16 A/C T 4 6.6/0.415 2.00 22.9
5 DMT 1 6.6/0.415 1.25 - 17 AHST 1 6.6/0.415 2.00 28.6
6 DMT 2 6.6/0.415 1.25 50.3 18 AHST 2 6.6/0.415 2.00 29.7
7 LT 1 6.6/0.415 0.315 30.8 19 AHST 3 6.6/0.415 2.00 40.0
8 LT 2 6.6/0.415 0.315 38.1 20 AHST 4 6.6/0.415 2.00 30.9
9 LT 3 6.6/0.415 0.315 23.6 21 CHPT A 6.6/0.415 1.60 7.6
10 LT 4 6.6/0.415 0.315 25.4 22 CHPT B 6.6/0.415 1.60 7.2
11 CWPT 1 6.6/0.415 1.25 - 23 CHPT C 6.6/0.415 1.60 -
12 CWPT 2 6.6/0.415 1.25 11.0
Rajashekar P. Mandi

III-21
control gear; proper maintenance and automatic scheduling of the lamp groups; proper architecturaldesign of the plant to utilise the day light to the maximum extent.
Some of the energy conservation measures in lighting system are as follows:
i. Use of LED lamps for indicating lamps will reduce the energy consumption.
ii. Use of compact fluorescent lamps in place of incandescent lamps, reduce the lighting energyby 70 %.
iii. Use of mirror optic fluorescent lamps increase the lighting level by considerably.
iv. Use of HPSV lamps in place of MPSV lamps reduce the energy consumption by 60 %.
v. As the lighting level is inversely proportional to square of the distance, optimizing the height oflamp will aid in reduction of lighting energy.
vi. Use of electronic ballasts for discharge lamps, reduce the energy consumption by 20 %.
vii. Installation of intelligent lighting controller will help in controlling the lighting energy.
viii. Discharge lamps consume the rated power during starting only, afterwards a small portion ofthe power is required for the lamp to maintain the lighting level and the rest of the power isbeing dissipated in energizing the ballast. Therefore, the installation BEBLEC lightingcontroller will reduce the energy consumption by 20 %.
ix. Use of photo sensor switch for street light controlling helps in conserving the lighting energy.
x. Installation of auto cut-off switch to put off lights during lunch hours at the office buildingswill reduce the lighting energy.
xi. At street lights, in many places, the reflectors inside the HPSV fittings are damaged, it issuggested to replace the fittings with anodised aluminium reflectors. This will improve thelighting level by 20-25 %.
xii. The bifurcation of the lighting circuits in plant area into three or four groups based on therequirement and installing a intelligent lighting controller will lead to energy saving of the order0.3 – 0.4 MU/year with a pay back period of 13 – 15 months. The different circuits may be:
a) Continuos operation : Continuously charged.
b) Night time operation : Charged during night hours through photo sensor switch.
c) Lighting for maintenance : Charged while attending the faults and other maintenanceactivities.
d) Lighting for overhaul time : Charged for activities during overhaul.
Improvement in energy efficiency of auxiliary equipment in TPS
III-22
5.0 CONCLUSIONS
The main conclusions from the study are as follows:
i. Introduction of scoop coupling for BF pumps and ID fans will enhance the power generationby 0.2 - 0.6 % of plant load in 30 MW and 62.5 MW units and ensuring the no passing in re-circulation valve by perfect valve seat will save the energy.
ii. Reduction of hydrodynamic resistance of pipelines and ducts will reduce the energyconsumption at BF pumps, CE pumps, ID fans, FD fans and PA fans.
iii. Minimization of furnace ingress and air leakage through APH and ducts will reduce the auxiliarypower by about 0.2 to 0.6 %.
iv. Ensuring of correct size of coal at mill inlet i.e., below 25 mm and periodic adjustment ofspring setting at mills, periodic monitoring of mill fineness and mill rejects and correctiveaction at intime will reduce the auxiliary power by about 0.1 to 0.4 %.
v. Minimizing of voltage unbalance and maintaining the adequate level of voltage at motorterminals, keeping the winding temperature and bearing temperature to minimum level byperiodic maintenance will reduce the motor losses by about 20 to 30 %.
vi. Peak demand reduction, capacitive power compensation and higher loading of transformerswill reduce the network and transformer I2R losses by about 4.0 % of the total auxiliary power.
vii. The overall energy conservation of the scheme will yield to reduction of auxiliary powerconsumption from 9.3 % to 8.2 % at rated load in a 210 MW plant and energy savings of15.84 MU/year.
6.0 REFERENCES
1. Srivastava, “Indian power development scenario a success story, but ahead lies the challenge”,Electrical India, Vol. No. 37, Issue No.15, 15th August 1997, pp. 15-28.
2. Siddhartha Bhatt M. and Mandi R.P., “Performance enhancement in coal fired thermal powerplants, part III: Auxiliary power”, International Journal of Energy Research, No.23, 1999,pp.779-804.
3. CPRI, 2002, Instrumented & Diagnostic Energy audit at Firoz Gandhi Unchahar ThermalPower Project, Unchahar, Report No: ERC/PS/02/2002, pp. 1 – 138 .
4. Rajashekar P. Mandi, R.K. Hegde & S.N. Sinha, ‘Performance Enhancement of CoolingTowers in Thermal Power Plants through Energy Conservation’, published at“International conference on POWERTECH 2005” at St. Petersburg, Russia, Organized byIEEE Power Engineering Society, 27-30 June, 2005. paper No. #461.
5. CPRI, 2000, Instrumented & Diagnostic Energy audit at Raichur Thermal Power Station, KPCL,Raichur, Report No: ERC/PS/25/1999, pp. 1 – 71.
Rajashekar P. Mandi

III-23
BIO-DATA OF AUTHOR
Rajashekar P. Mandi is working as Engineering Officer in Central PowerResearch Institute, Bangalore since 1989. He received M.Tech. degree inEnergy Systems Engineering from Visweswaraiah Technological University,Belgaum.
His industrial experience includes energy auditing and energy conservation inthermal power plants, process industries, industrial establishments andelectrical distribution system. His research interests include renewable energy
systems, energy conservation, strengthening of electrical distribution systems, etc. He has publishedmore than 30 technical papers in International & Indian Journals, Conferences & Seminars in thefield of energy conservation and renewable energy systems.
Improvement in energy efficiency of auxiliary equipment in TPS

III-24
APPLICATION OF AC DRIVE TECHNOLOGYIN THERMAL POWER PLANTS
Prachi Rao, V. Nagesh Rao, S. ChandrashekarSubhash K. Iyengar & Rajiv PuriDrives, Power Supplies & Traction Electronics Dept.,BHEL-Electronics Division, Bangalore – 560 026Phone: 080 26744531 Fax: 080 26740137
ABSTRACT: This paper describes the various applications of Variable Frequency ACDrives in Thermal Power Plants including case studies of possible applications ofVFDs in new areas in Thermal Power Plants.
Using Variable Frequency Drives for flow control is an attractive techno-economicsolution. The VFDs can be used for Induced Draft, Forced Draft, and Primary Air fans,Boiler Feed Pumps, Condensate Extraction Pumps and Circulating Water Pumps aslong as these are radial or centrifugal type. A number of technical advantages, likesoft starting, increased life of mechanical equipment due to absence of jerks duringstart, unlimited number of starts, zero current contribution to grid faults, no inrushcurrent at start, lower overall system noise etc has been discussed.
A number of power plants in India are using Variable Frequency Drives. A powersaving analysis done for some of the power plants using VFDs for ID fan application iscompared with actual site re-sults. Use of VFDs for Boiler Feed Pump and powersavings calculation for a power plant in India is discussed. Typical analysis for aCondensate Extraction Pump is included at Table 5.
1.0 INTRODUCTION
The cost of electricity generation has been going up with time and the demand of electricity hasoutstripped the availability. Energy conservation has become a key factor in the fields of utilization,trans-mission and generation. Industries and Utilities have become appreciative of reducing theconsumption of power. Variable Frequency Drives have become popular for fans, pumps andcompressors because of the safety margins kept during the design stage to take care of theuncertainties. This forces the equipment to operate at lower than rated capacity (and efficiency)even during the base load operation of the plant.
In a power plant, the margins kept during selection of fans and pumps are even higher. Powerconsumption in auxiliaries of a coal based power plant is of the order of 6 to 8%.To reduceauxiliary power consumption, losses in air/flue gas and water/steam flow paths because ofmechanical flow control de-vices shall be reduced.
In a coal fired thermal power plant, there are basically two flow paths viz.
- Air / Flue gas path
National Symposium on Energy Conservation Measures in Generating Sector, Nov. 17-18, 2005, Bangalore

III-25
- Water/ Steam path
The major power consuming auxiliaries in the air/flue gas path are Induced Draft (ID) fans, ForcedDraft (FD) fans & Primary Air (PA) fans with ID fans being the biggest consumer of power. BoilerFeed Pumps (BFP), Condensate Extraction Pumps (CEP) and Circulating Water (CW) pumps arethe major auxiliaries in the water/steam path and among them BFPs are the biggest consumers ofpower.
Hitherto, it has been common practice to use constant speed induction motor for fans with inletguide vane/ outlet damper/ hydraulic coupling for control of air/flue gas. In case of inlet guide vane/outlet damper, due to increase in the system resistance, lot of energy is wasted resulting in a lowsystem efficiency. In case of a hydraulic coupling, the efficiency of the coupling itself is very low,approximately equal to the ratio of output speed to input speed. In the case of a VFD, speed of themotor is varied rather than varying the system resistance for changing the operating point. Sincethe power is proportional to cube of speed there will be an appreciable saving in power consumption,especially when the fans/ pumps are required to operate at low loads. Efficiency of hydraulic couplingis very poor at reduced speeds (at 50% speed efficiency will be less than 50 %). Because of designmargins, the ID fans normally operate at around 70% of rated loads even when the power plant isoperating at its rated capacity, thus making the available mechanical means for flow control highlyinefficient.
Typical efficiency curves of VFD, hydraulic coupling, inlet guide vane and outlet damper or throttlingare shown in Figure 1.
Variable Frequency Drives for Induced Draft Fans arein operation in a number of utilities like Tata ElectricCompanies, Andhra Pradesh State Electricity Board(APSEB), National Thermal Power Corporation,Maharashtra State Electricity Board etc. Experience andoperating confidence gained in VFDs for ID fan drivesin Indian Power Plants have paved the way for use ofVFD for biggest auxiliary drive in fluid path, namelyBoiler Feed Pump. The first Boiler Feed Water pumpwith a Variable Speed Drive has been in service atKothagudem Thermal Power Station of APGENCOsince 1997. It was decided to carry out measurementsat some of these sites for ID Fan Drives and site resultsare presented here. Comparison of energy consumedby VFD driven ID fans vis-a-vis other alternatives usedin earlier identical rated units at the same stations ispresented. Normally FD Fans are axial type and VFDs
are not recommended to be used. Fan design margins kept in PA fans and their flow variation is
% EFFICIENCY 100 LOAD CO MMUTAT ED INVERTER INLET 80 DRIVE GUIDE VANE 60
40 HYDRAULIC COUPL ING OUTLET DAMPER O R 20 THROTT LING
2 0 40 60 80 10 0 % SPE ED / FL OW
Figure 1 : Efficiency Curves ofVarious Flow Control Devices
Application of AC drive technology in thermal power plants

III-26
much lower compared to ID Fans. However, it is desirable to check the economics on case to casebasis prior to selection of the type of drive.
Experience and operating confidence gained in VFDs for ID Fan drives in Indian Power Plantshave paved the way for use of VFD for the biggest auxiliary drive in fluid path, namely Boiler FeedPump. A techno-economic analysis for a typical 250 MW thermal power plant station under normaland sliding pressure operation is presented. Description of VFDs and precautions required arediscussed below.
2.0 LOAD COMMUTATED INVERTER
LCI VFD is a variable speed mechanism which adjusts the fan or pump speed so as to get thedesired output. In this type of drive system, flow demand signal is received from the control systemdue to change in load conditions and the system adjusts the speed of the motor to the desired levelresulting in optimum power consumption. Apart from saving in operational cost due to reducedpower consumption, VFD offers major intangible benefits like:
� Absence of voltage dip problems associated with Direct On Line starting of large motorssince the starting current in this drive is limited to about 100% of the motor full loadcurrent.
� Increased motor life due to the lower thermal and mechani-cal stresses in view of theabsence of starting inrush currents and reduced speed operation.
� No limitation on the number of starts.
� No contribution to fault current.
LCI type VFD can be either (6 pulse) single channel type (Figure 2) or (12 pulse) dual channel type(Figure 3). Each channel consists of an isolating transformer, source converter, DC link inductorand load converter. In a single channel type VFD, synchro-nous motor will have one windingwhereas in dual channel type VFD, the synchronous motor will have two windings, one for eachchannel. The source side converter operates in rectifier mode whereas the load side converteroperates in inverter mode. Commu-tation VARs for source side converter is taken from the sourcewhereas leading VARs produced by the synchronous motor is used for commutation of load sideconverter. The DC link inductor effectively isolates load side frequency and source side frequencyand smoothens DC Link Current.
The demand signal received from the control system prompts the source side converter to providethe required current to the DC link inductor at the DC voltage level set by the load side converter.
Thus the source side converter plus the DC link inductor become a current source controller to themotor. The motor torque, frequency (hence speed), and voltage level get adjusted to the loadrequirements.
The choice of (6 pulse) single channel or (12 pulse) dual channel VFD depends on harmonics thatare allowed to be injected into the grid and whether a redundant fan/pump is available.
Prachi Rao, V. Nagesh Rao, S. Chandrashekar, Subhas K. Iyengar & Rajiv Puri

III-27
A 12 pulse system is recommended where lower harmonic injection is desired (weak grids) andfan/pump redundancy is not available. The components in each channel can be rated for desiredcapac-ity and hence in case of dual channel, redundancy can be built into the VFD system. A 6pulse system, because of lower cost, is recommended where redundant fan/pump is available andthe grid is strong.
3.0 ID FANS FOR 500 MW UNITS AT TROMBAY GENERATING STATION
Tata Electric Companies Trombay generating station-B has two numbers 500 MW units, Unit No.5and Unit No.6. Both the units have 4 numbers of 33-1/3% rated ID fans of identical ratings. Flue
gas is controlled by outlet dampers in ID fans ofunit 5 whereas this function is achieved in unit 6by LCI.
Dual channel 12 pulse VFD was specified forthis plant. Each channel was rated such that withthree ID Fans running and only one channel ineach VFD in operation, it was possible to operatethe boiler at its rated capacity. Synchronousmotor was specified with class F insulation withtemperature rise limited to class B under 12pulse operation and limited to class F operationunder 6 pulse operation.
Equipment connected with LCI were located ina separate building close to the ID fans. Thelayout of the equipment is shown in Figure 4.The equipment belonging to two channels for adrive have been installed in two different rowswith sufficient clearance between them. Line sideand load side converter panels are installed inan air conditioned room for trouble freeoperation.
3.1 Site Measurements
To compare power consumption of ID fans of unit 5 (controlled by damper) and unit 6 (controlled byLCI), site measurements were taken at various generating points. These readings indicate anannual power saving to the tune of 23 MU (Table 1I) for these 2050 KW LCI drives.
4.0 ID FANS FOR 210 MW UNITS AT VIJAYWADA
Units 3 and 4 at Vijayawada Thermal Power Station of APGENCO are 210 MW units, each havingtwo 1600 KW, 710 RPM ID fans. Unit 3 ID fans are driven by squirrel cage induction motors and
Application of AC drive technology in thermal power plants

III-28
hydrau-lic couplings are provided for speed control. Unit 4 ID fans are provided with LCI. Powersavings due to use of LCIs works out to an annual average of 3 MU (Table 2).
5.0 BOILER FEED PUMPS FOR 250 MW UNITS
Table 3 gives a detailed techno-economic analysis for use of VFD for Boiler Feed Pump operations.
The analysis is based on design parameters for a typical 250 MW unit. Again taking 7200 hours asthe operating time per year and 2400 oper-ating hours each at 100%, 80% and 60% of themaximum generat-ing capacity, energy saved per year works out to 3.8 MU. If sliding pressureoperation for the boiler is considered, 5.1 MU of energy is saved per year (Table 4).
Table 1:ID fan drive – Tata Electric Company, Mumbai
Figure 4: Layout for 12 Pulse VFDs for ID fans
Prachi Rao, V. Nagesh Rao, S. Chandrashekar, Subhas K. Iyengar & Rajiv Puri

III-29
Table 2: ID fan drive – Vijayawada 2x210 MW TPS, M/s. APGENCO
Table 3: Techno-economic analysis of 6 pulse VFD over hydraulic coupling for 250 MWBFP drives (constant pressure operation) Motor rating : 3900 kW, 5300 rpm, No. of BFPs
per boiler : three
SL.NO HYDRAULIC COUPLING VFD SYSTEMMCR (PERCENT) 60% 80 % 100% 60% 80 % 100%SPEED (RPM) 4459 4596 4815 4459 4596 4815FLOW (PER HOUR) 221 293 367 221 293 367PRESSURE (MLC) 1780 1860 1965 1780 1860 1965
1 POWER INPUT TO 1398 1693 2141 1398 1693 2141PUMP SHAFT FOR ONE BFP (KW)
2 HYDRAULIC COUPLING 0.793 0.825 0.871 - - -EFFICIENCY (INCLUDESGEAR BOX LOSS) %
3 INDUCTION MOTOR 0.940 0.945 0.950 - - -EFFICIENCY (%)
4 EFFICIENCY OF VFD - - 0.900 0.905 0.910INCLUDING SYNCH-RONOUS MOTOR (%)
5 POWER DRAWN FROM 1875 2172 2588 1553 1871 2353GRID / BFP (KW)
6 POWER DRAWN FROM 3750 4344 5176 3106 3742 4706GRID BY TWO BFPs (KW)
7 OPERATING HOURS 2400 2400 2400 2400 2400 24008 ENERGY CONSUMED 9000 10426 12423 7455 8981 11295
BY TWO BFPs (MW. HR)9 ENERGY CONSUMED - - 120 120 120
BY AIR CONDITIONER,AUXILIARIES (MW.HR)
10 TOTAL ENERGY CON- _______31849_________ _______28091_________SUMED / YEAR (MW.HR)
11 RUNNING ENERGY COST 63.7 MILLION RUPEES 56.18 MILLION RUPEESAT RUPEE 2.00/KW.HR
12 SAVINGS IN ENERGY 7.52 MILLION RUPEESCOST / YEAR
13 PAYBACK PERIOD APPROXIMATELY 6.7 YEARSOF VFD
Application of AC drive technology in thermal power plants

III-30
Table 4: Techno-economic analysis of 6 pulse VFD over hydraulic coupling for 250 MWBFPdrives (sliding pressure operation) Motor rating : 3900 kW, 5300 rpm, No. of BFP per
boiler : three
SL.NO HYDRAULIC COUPLING VFD SYSTEM
MCR (PERCENT) 60% 80 % 100% 60% 80 % 100%SPEED (RPM) 3493 4119 4746 3493 4119 4746
1 POWER INPUT TO 734 1265 2021 734 1265 2021PUMP SHAFT FOR ONE BFP (KW)
2 HYDRAULIC COUPLING 0.609 0.734 0.858 - - -EFFICIENCY (INCLUDESGEAR BOX LOSS) %
3 INDUCTION MOTOR 0.920 0.937 0.948 - - -EFFICIENCY (%)
4 EFFICIENCY OF VFD - - 0.870 0.895 0.910INCLUDING SYNCH-RONOUS MOTOR (%)
5 POWER DRAWN FROM 1310 1839 2485 844 1413 2221GRID / BFP (KW)
6 POWER DRAWN FROM 2620 3678 4970 1688 2826 4442GRID BY TWO BFPs (KW)
7 OPERATING HOURS 2400 2400 2400 2400 2400 24008 ENERGY CONSUMED 6288 8827 11928 4051 6783 10661
BY TWO BFPs (MW. HR)9 ENERGY CONSUMED - - 120 120 120
BY AIR CONDITIONER,AUXILIARIES (MW.HR)
10 TOTAL ENERGY CON- _______27043_________ _______21855_________SUMED / YEAR (MW.HR)
11 RUNNING ENERGY COST 54.08 MILLION RUPEES 43.68 MILLION RUPEESAT RUPEE 2.00/KW.HR
12 SAVINGS IN ENERGY 10.4 MILLION RUPEESCOST / YEAR
13 PAYBACK PERIOD APPROXIMATELY 6.25 YEARSOF VFD
6.0 ADDITIONAL REQUIREMENTS OF VFD
6.1 Environment/Layout
As the modern day VFDs are all microprocessor based sys-tems capable of self diagnostics, itis recommended to house them in an air-conditioned room for a long trouble free opera-tion. VFDs
Prachi Rao, V. Nagesh Rao, S. Chandrashekar, Subhas K. Iyengar & Rajiv Puri

III-31
have forced cooling fans, the noise pollu-tion because of the cooling fans need to be taken care of.Past experience has shown that a duct should be provided to throw the hot air from the VFDsabove false ceiling of VFD room to reduce noise. The layout should be such that control panels arehoused separately from the thyristor/cooling fan panels.
6.2 Harmonics & Torsional Analysis
Because of the phase controlled thyristors, cur-rent harmonics are generated and fed to the grid.IEEE lists down the dis-tortion factor (DF) allowed on different buses. DF shall be limited to lessthan 5% on a power plant bus. It is essential that a harmonic analysis study be carried out on VFDgrid and user shall be advised to connect harmonic filters, if required. A feature of converter feddrives is the presence of oscillating harmonic torque superimposed upon the steady torque ofthe synchronous motor. It is necessary that the effect of these harmonic torques be calculated bydoing torsional analysis.
7.0 OTHER APPLICATIONS OF VFDS
7.1 Large Pumps Startup and Synchronization to grid
The first indigenously designed and manufactured 4 KV, 7.5 MW, Static Frequency Converter hasbeen commissioned at Srisailam Left Bank Canal. This is Asia’s largest lift irrigation project. Thisstarting system consists of a converter to convert AC Voltage to DC Voltage, a DC Link and aninverter to convert DC to a variable frequency, variable voltage AC output. The output is connectedto a 18 MW, 11 KV, synchronous motor for smooth starting without any inrush current. SFC takespower from the supply grid at constant voltage and constant frequency, and converts it into powerof variable voltage and frequency in order to start and accelerate the synchronous machine. Themachine is then synchronized to the supply grid after matching motor voltage/frequency to gridvalues and SFC is disconnected. The starting equipment is suitable to start four motors one afterthe other.
7.2 Pumped Storage Scheme
Static Frequency Converter for Pumped Storage has been supplied by BHEL for Srisailam LeftBank Project. This system is rated at 13.8 KV, 18.5 MVA capable of starting 6 machines one afterthe other. These machines can operate either in Pump-mode or in Turbine-mode depending on theload requirement. In the daytime when the load is higher the machines work as turbines and duringthe night they operate as pumps. This SFC system uses a water cooling system.This type of StaticFrequency Converter enables meeting of peak power requirement during daytime by utilizing excesspower available during night time.
7.3 Gas Turbine Starting
VFD equipment can also used for Gas-Turbine starting. Gas Turbines can either be soft started byusing a pony motor or by using SFC. SFC is normally preferred for bigger frame Turbines (greater
Application of AC drive technology in thermal power plants
III-32
than 150 MW).The Alternator is soft started by SFC and accelerated till it gets into Generationmode.
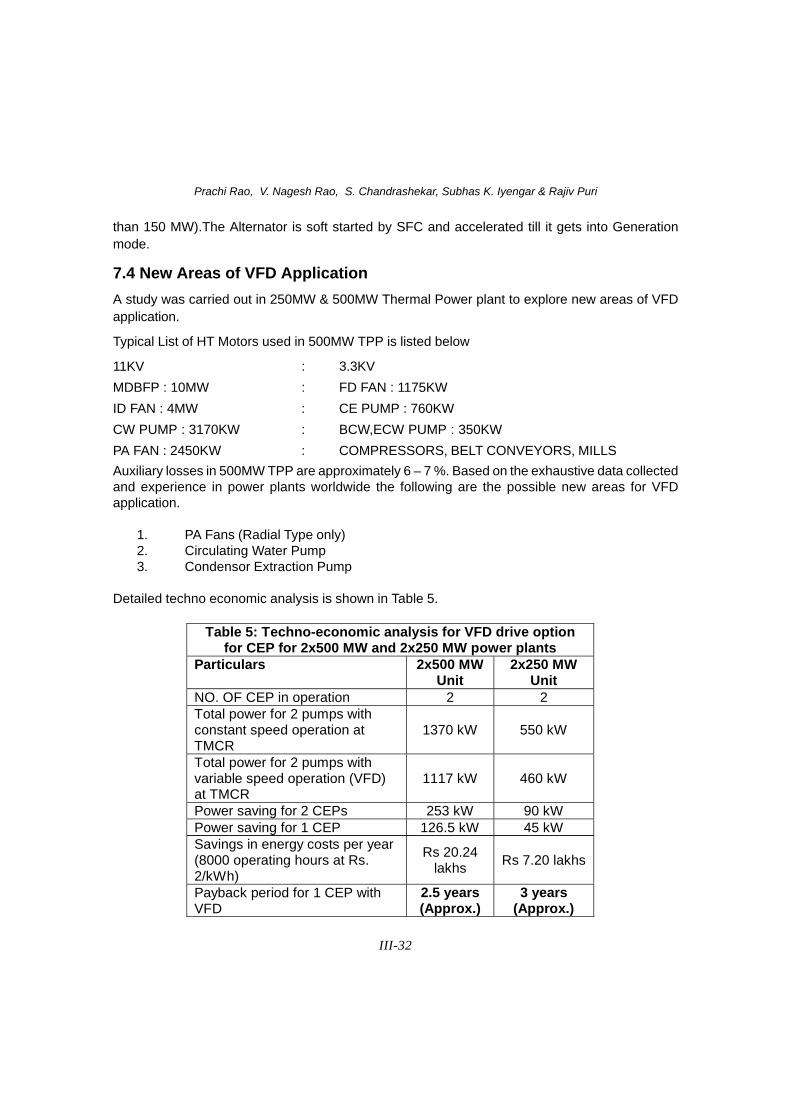
7.4 New Areas of VFD Application
A study was carried out in 250MW & 500MW Thermal Power plant to explore new areas of VFDapplication.
Typical List of HT Motors used in 500MW TPP is listed below
11KV : 3.3KV
MDBFP : 10MW : FD FAN : 1175KW
ID FAN : 4MW : CE PUMP : 760KW
CW PUMP : 3170KW : BCW,ECW PUMP : 350KW
PA FAN : 2450KW : COMPRESSORS, BELT CONVEYORS, MILLS
Auxiliary losses in 500MW TPP are approximately 6 – 7 %. Based on the exhaustive data collectedand experience in power plants worldwide the following are the possible new areas for VFDapplication.
1. PA Fans (Radial Type only)2. Circulating Water Pump3. Condensor Extraction Pump
Detailed techno economic analysis is shown in Table 5.
Table 5: Techno-economic analysis for VFD drive option for CEP for 2x500 MW and 2x250 MW power plants
Particulars 2x500 MW Unit
2x250 MW Unit
NO. OF CEP in operation 2 2 Total power for 2 pumps with constant speed operation at TMCR
1370 kW 550 kW
Total power for 2 pumps with variable speed operation (VFD) at TMCR
1117 kW 460 kW
Power saving for 2 CEPs 253 kW 90 kW Power saving for 1 CEP 126.5 kW 45 kW Savings in energy costs per year (8000 operating hours at Rs. 2/kWh)
Rs 20.24 lakhs
Rs 7.20 lakhs
Payback period for 1 CEP with VFD
2.5 years (Approx.)
3 years (Approx.)
Prachi Rao, V. Nagesh Rao, S. Chandrashekar, Subhas K. Iyengar & Rajiv Puri
III-33
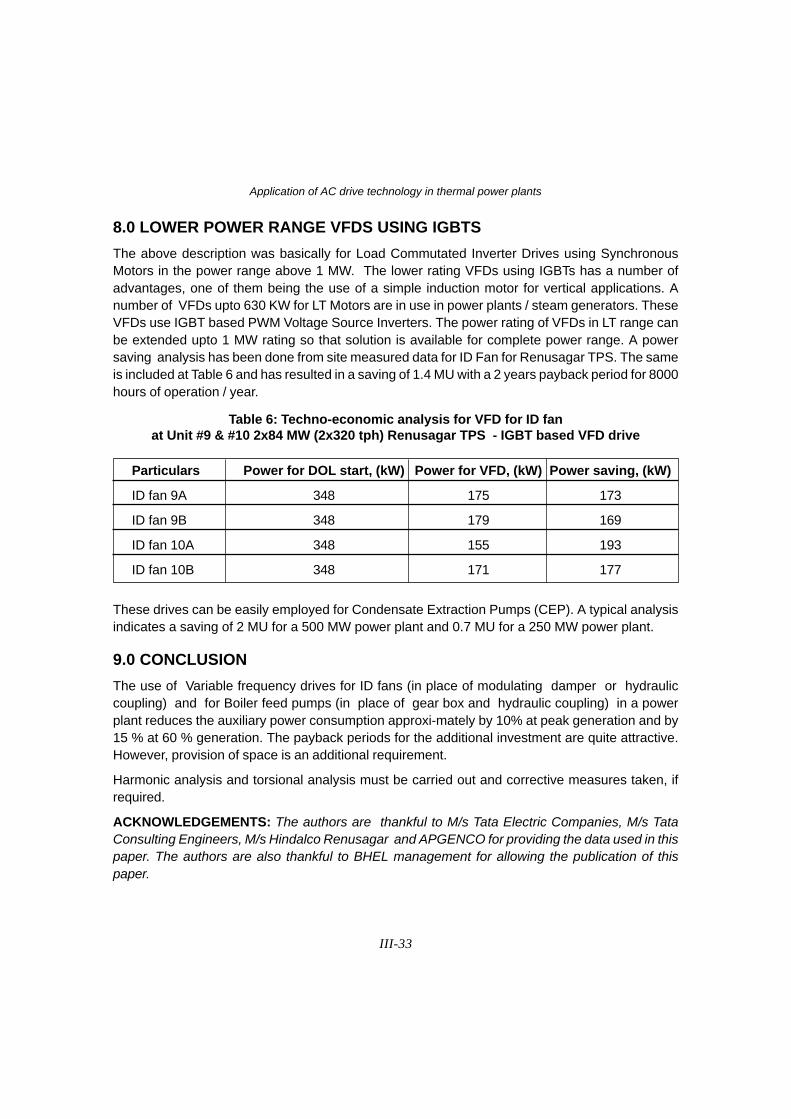
8.0 LOWER POWER RANGE VFDS USING IGBTS
The above description was basically for Load Commutated Inverter Drives using SynchronousMotors in the power range above 1 MW. The lower rating VFDs using IGBTs has a number ofadvantages, one of them being the use of a simple induction motor for vertical applications. Anumber of VFDs upto 630 KW for LT Motors are in use in power plants / steam generators. TheseVFDs use IGBT based PWM Voltage Source Inverters. The power rating of VFDs in LT range canbe extended upto 1 MW rating so that solution is available for complete power range. A powersaving analysis has been done from site measured data for ID Fan for Renusagar TPS. The sameis included at Table 6 and has resulted in a saving of 1.4 MU with a 2 years payback period for 8000hours of operation / year.
Particulars Power for DOL start, (kW) Power for VFD, (kW) Power saving, (kW)
ID fan 9A 348 175 173
ID fan 9B 348 179 169
ID fan 10A 348 155 193
ID fan 10B 348 171 177
Table 6: Techno-economic analysis for VFD for ID fanat Unit #9 & #10 2x84 MW (2x320 tph) Renusagar TPS - IGBT based VFD drive
These drives can be easily employed for Condensate Extraction Pumps (CEP). A typical analysisindicates a saving of 2 MU for a 500 MW power plant and 0.7 MU for a 250 MW power plant.
9.0 CONCLUSION
The use of Variable frequency drives for ID fans (in place of modulating damper or hydrauliccoupling) and for Boiler feed pumps (in place of gear box and hydraulic coupling) in a powerplant reduces the auxiliary power consumption approxi-mately by 10% at peak generation and by15 % at 60 % generation. The payback periods for the additional investment are quite attractive.However, provision of space is an additional requirement.
Harmonic analysis and torsional analysis must be carried out and corrective measures taken, ifrequired.
ACKNOWLEDGEMENTS: The authors are thankful to M/s Tata Electric Companies, M/s TataConsulting Engineers, M/s Hindalco Renusagar and APGENCO for providing the data used in thispaper. The authors are also thankful to BHEL management for allowing the publication of thispaper.
Application of AC drive technology in thermal power plants

III-34
ENERGY CONSERVATION OPPORTUNITIESIN COAL PULVERISERS
N. Rajkumar & K.R.C.NairEnergy Research Centre, Central Power Research Institute,Thiruvananthapuram – 695 017Phone : +91 471 2596004, FAX: +91 471 2599687, email: [email protected]
ABSTRACT: The performance test on various pulverisers of thermal power stationwas studied and the common problems encountered by the Indian thermal powerstations are described in this paper. Based on the findings, various opportunities forenergy conservation and performance optimization in coal pulverisers in thermal powerstations are discussed.
Key words: Pulverisers, thermal power station, coal flow balancing
1.0 INTRODUCTION
The pulverizing process in a thermal power station is composed of several stage. The very first isthe feeding system which regulates the feed rate to the steam generator according to demand andthe air rates for drying and transporting the pulverized coal to the burner. The next stage is drying.These dryers are an integral part of the pulverisers. The primary air from the air pre-heater isforced into the pulveriser at 300°C or higher, by the primary air fan. There it is mixed with the coal,as it is being circulated and ground. This equipment is the pulveriser, also called grinding mill.Grinding is accomplished by impact, attrition, crushing or combinations of these. The pulverisersare classified [1] as follows:
1. Low speed - below 75 rpm; the ball-tube mills
2. Medium speed - 75 to 225 rpm; the ball and race and roll and race mill
3. High speed - above 225 rpm; the impact or hammer mill and the attrition mill
2.0 BACKGROUND
Pulverising constitutes 8.4 % of the auxiliary power consumption in a coal fired thermal powerstation among the in-house auxiliaries [2]. Based on the earlier studies carried out over 22 thermalpower stations by M.S.Bhatt et al [2], the operating specific energy consumption ranges from 7.75to9 8.55 kWh/t for bowl mills, 10.20 to 23.00 kWh/t for drum mills and 8.40 to 10.25 kWh/t for balland race mills. The other study carried established a specific technology and reference equipment(EMIR II) for a more accurate and easier characterization coal and air supplies to the boiler. Furtherreductions in mill energy consumption of up to 10% have already been achieved, with potentialreductions in fan consumption of over 25%. Furthermore, reductions in unit heat rate of up to 1%have been reached by milling and boiler adjustments, with significant reductions in NO
x emissions
(up to 30%)[3].
National Symposium on Energy Conservation Measures in Generating Sector, Nov. 17-18, 2005, Bangalore

III-35
3.0 RESULTS AND DISCUSSION
The optimum performance requirement for pulveriser is given in Table 1. The predicted performanceparameters for different pulverisers are given in Table 2. The typical performance parameters of apulveriser are given in Table 3. The pulverized coal samples were collected iso-kinetically using aniso-kinetic coal sampler as per ASTM procedure.
The typical coal flow percentage in each corner of a thermal power station steam generator is givenin Figure 1. From figure 1 it can be observed that the coal flow is varying from corner to corner.
The typical coal flow balance is given in Figure 2. From figure 2 it can be seen that the percentagedeviation of the pulverized coal flow from the mean is more than 10 % as described in Table 1.
Figure 1: Coal flow deviation of a mill
0
5
10
15
20
25
30
35
1 2 3 4Cor ner
Co
al f
low
, %
Pipe: CPipe: D
Figure 2: Coal flow balance for a Mill
-40
-20
0
20
40
60
80
Corner 1 Corner 2 Corner 3 Corner 4
Coal pipe
% D
evia
tio
n f
rom
mea
n
Elevation AElevation B
Table 1: Optimum mill performance requirements
Sl. Particular Unit ValueNo.
01 Clean air balance % ± 2.00
02 Coal flow balance % ± 10.00
03 Dirty air flow balance % ± 5.00
04 Air to fuel ratio — 1.80
05 Fineness (Passing through 75 micron mesh) % 75.00
06 Fineness (Retained on 300 micron mesh) % 0.3
This kind of situation was observed in the present study in most of the thermal power stations. Thisis mainly due to.
1. Fixed coal equivalisation nozzles are not monitored and maintained
2. In most of the power stations, only clean air flow test is carried out and dirty air flow (coaland air two phase flow) is not carried out due to lack of instrumentation and hence theunbalance goes unnoticed

III-36
3. Online corrective action cannot be taken in fixed coal equivalisation nozzles
4. Coal line and burner line erosion
5. Eroded fixed coal flow-equivalisation nozzles
This kind of situation shall lead to
1. High NOx emissions
2. High residual carbon in fly ash and bottom ash
3. High tube metal hotspots and tube failure
4. Increased coal line puncture and leakage of pulverized coal
Other problems encountered are.
1. The percentage of pulverized coal passing through 75 micron mesh (200 No. mesh {BSSand ASTM}) is varying widely from 50 to 80%
2. The raw coal fed to the mills is having a high percentage of coal larger than 25mm.
4.0 REMEDIAL MEASURES
The remedial measures for energy conservation and performance optimization of pulverisers areas follows:
Table 2 : Predicted mill performance parameters for 100 % MCR
Sl. Particular Unit ValueNo.
01 Type — XRP, pressurized, bowl mill BBD, doublepressurized, ended, ball
tube mill
02 Dirty air flow t/h 56.00 130.92
03 Coal flow t/h 28.6 74.25
04 Air to fuel ratio — 1.96 1.76
05 Coal air mixture temperature 0C 65 – 95 85.00
06 Fineness ( -75 micron) % 70.00 76.00
07 Raw coal Grindability HGI 45 58.00
08 Raw coal moisture % 8 - 12 12.00
N. Rajkumar & K.R.C.Nair

III-37
Table 3 : Performance parameters of Mills
Sl. Particular Unit Elevation A Elevation BNo. Corner Corner
1 2 3 4 1 2 3 4
01 Dirty air flow t/h 23.53 22.46 24.31 22.90 25.61 25.26 24.41 23.09
02 Total dirty air flow t/h 93.20 98.37
03 Coal flow t/h 9.72 12.86 9.19 13.09 7.78 7.80 6.96 16.05
04 Total coal flow t/h 44.86 38.59
05 Air to fuel ratio — 2.42 1.75 2.65 1.75 3.29 3.24 3.51 1.44
06 Air to fuel ratio of themill — 2.08 2.55
07 % deviation of dirty
air flow from mean % 0.99 -3.61 4.33 -1.72 4.11 2.68 -0.77 -6.14
08 % deviation of coalflow from mean % -13.33 14.62 -18.01 16.72 -19.37 -19.16 -27.87 66.39
09 Fineness (-75 micron) % 68.60 58.74 64.00 74.60 68.40 78.00 60.60 66.40
10 Fineness(+300 micron) % 0.80 0.50 0.30 0.50 0.60 0.40 0.40 0.30
11 Power kW 1250.00
12 Specific energy
consumption kWh/t 14.98
4.1 Operational optimization
1. Crusher screens must be maintained properly to ensure that the oversized raw cola particleof size larger than 25 mm is not conveyed for bunkering. This will reduce energyconsumption required for milling
2. Adjustment of the classifiers of mills based on the operating coal fineness
3. All types of mills must be loaded optimally. During part load operation, mill operationmust be taken on manual control to ensure high loading rates in individual mills
4. In drum-type ball mills, minimize the ball charge hold up when the coal quality is better,ensuring a mill inlet air temperature of 300°C and mill outlet fuel-air temperature of85-90°C
Energy conservation opportunities in coal pulverisers

III-38
5. In medium speed large ball and race mills, balls of 660 mm can be allowed to reduce to585 mm at which point a filler ball is to be inserted. When the size is below 560-570 mm,the balls must be replaced. The gap between the ring and throat must be adjusted to 10mm. The pressure of the tempering air must be lowered to ensure a high fuel air mixturetemperature at the mill outlet.
4.2 Technology options
1. The pulverized coal flow unbalancing can be overcome by using fixed geometry devicessuch as combined riffle and egg box bifurcator or variable geometry devices such asfoster wheeler or variable orifice dampers[4]
2. Online pulverized fuel flow meters based on electrostatic, acoustic and microwave-basedtechnologies can be used to optimize the mill performance.
3. Alternatively, the iso-kinetic sampling and coal flow measurement can be made usingdirty pitot tube (as per ASTM) or rotary probe (as per ISO: 9931) on a defined schedule tomonitor the mill performance.
5.0 CONCLUSIONS
The main conclusions of the study is, by making use of the operational optimization and varioustechnology options, the pulveriser performance can be improved. This will in turn improve theenergy efficiency of the milling system and reduce the auxiliary power consumption.
6.0 REFERENCES
1. El-Wakil M.M., “Powerplant Technology – International Edition 1985”, McGraw-HillBook Company, Singapore, pp. 135.
2. Siddhartha Bhatt M. and Mandi R.P., “Performance enhancement in coal fired thermalpower plants, part III: Auxiliary power”, International Journal of Energy Research, No.23,1999, pp.779-804
3. Salvador-Camacho L., Rodriiguez F., Cortes V., Canadas L., Albaladejo J.L. and OteroP., “Cost reduction in coal fired power stations through optimization of milling systems”Sixth international conference on technologies and combustion for a cleanenvironment, Oporto (Portugal), July 2001.
4. Pulverised Fuel (PF) Flow Measurement and Control Methods for Utility Boilers,“Technology Status Report”, Department of Trade and Industry, United Kingdom,January 2001.
N. Rajkumar & K.R.C.Nair

III-39
BIO-DATA OF AUTHOR
N.Rajkumar is working as Engineering Officer in Central Power ResearchInstitute, Energy Research Centre, Trivandrum since 1996. He received M.Scin Energy Science from Madurai Kamaraj University and M.Tech in EnergyManagement from Devi Ahilya Viswavidyalaya, Indore.
He has carried out energy audit in thermal power stations, buildings and variousprocess industries. He has designed and developed solar thermal systems.He has published more than 20 technical papers in international and nationaljournals, conferences and seminars in energy conservation and renewableenergy. He is a life member of Solar Energy Society of India (SESI).
Energy conservation opportunities in coal pulverisers
III-40
AUXILIARY POWER CONSUMPTION OPTIMISATION INTHERMAL POWER STATIONS
P.K. Dave & S.K. SharmaNTPC Ltd - Unchahar Thermal Power station – 229406 Distt.- Raebareli, UPMobile – 9415501105; 9415501237E-mail: [email protected], [email protected]
Rajashekar P. MandiEnergy Conservation & Development Division,Central Power Research Institute, Bangalore -560 080Phone: 080 2360 4682, Fax: 080 2360 1213,E-mail: [email protected]
ABSTRACT : Overall efficiency of a thermal power station i.e. energy conversionfrom coal to electricity export to grid, in India, ranges between 30 – 38 %. It impliesthat energy conversion / use efficiencies of various processes / equipments requirecritical performance analysis vis-à-vis design and, if done judiciously, potentialopportunities for optimising select processes / equipments could be identified alongwith probable reasons responsible for overall poor operating efficiency. By way ofinvolving various working groups & initiating suitable actions considerable quantum ofenergy can be conserved within the power station premises and additionally exportedto grid.
Avoiding visible wastages, minimising extra-running equipments, optimisingperformance of running equipments and maximising generation during low frequencyyields substantial dividends in terms of energy and profitability mainly as a result ofoptimised in-house energy consumption & thus increased energy exports to grid. Paperdescribes, selectively, eye-opening findings of energy audits yielding energy savingpossibilities in selected auxiliaries.
Staggering of auxiliary loads, reduction in hydrodynamic resistance of pipes and ducts,minimising visible leakages, optimizing excess air, reduction in furnace ingress,monitoring of coal size at mill inlets, adopting latest control techniques & technologicalup- gradations will result into substantial energy savings. The energy conservationschemes are economically attractive with break-even / payback periods rangingbetween few months to < 5 years.
1.0 INTRODUCTION
Installed capacity has crossed 1,24,000 MW, out of which 81566 MW i.e. 70 % is thermal, 31877MW hydro, 3130 MW nuclear & 3650 MW grid connected wind out of 6100 MW grid connectedrenewable energy based generation. Despite continual increase in installed capacity and thusgeneration energy shortages are prevailing across the country and ranging between 8 – 10 %.
National Symposium on Energy Conservation Measures in Generating Sector, Nov. 17-18, 2005, Bangalore

III-41
Due to increasing energy insecurity it is of paramount importance that energy should be used mostefficiently everywhere & it was the basic reason that Govt. notified initially Energy Conservation act2001 and later comprehensive Electricity Act 2003. Creation of additional capacity requires hugeinvestment, long execution periods and conventional energy sources for operating power stationsthus it becomes increasingly important to manage & operate power stations at optimum efficiencies.
NTPC Ltd owns 24664 MW i.e. 20.1 % of grid / 30.2 % of thermal capacity. The auxiliary consumptionof thermal plants, in India, varies between 7 – 17 % depending on station capacity, unit’s sizes,edge of the plant etc. More than 5 years working experience of CPRI & NTPC together in NTPCplants, in the field of energy auditing, brought out that performance of equipments, sub-systems &systems has improvement margin of upto 15 % & thus energy could be conserved in power stationsby way of auditing, process benchmarking and operating processes review without requiring muchinvestments. It is worthy to bring out that even 1 % absolute auxiliary power consumption optimisationcould yield additional dispatch of energy to grid amounting equivalent generation by 1200 MW byacting upon & implementing selective energy conservation measures.
Importantly, energy conservation measures requires a fraction of fund and payback period rangesbetween few months to < 5 years. Additionally these measures contribute in optimising greenhouse gases released into environment, improvement in fuel oil consumption, lubes, chemicalsand water conservation.
The auxiliary power is tapped through station transformers during start-up of unit from the grid / unitauxiliary transformers during most of the period i.e. units own generation remain > 30 % of the unitcapacity.
2.0 UNCHAHAR THERMAL POWER STATION
Unchahar thermal power station is having 4 units each of 210 MW in operation, out of which 2 unitswere commissioned in late eighties and 2 units subsequently in late nineties. Station is performingat its ever best PLF during the year and till Sept’05 ranks first among NTPC’s stations and sixthcountrywide.
The connected capacity of 98 transformers i.e. except generator transformers is 405.23 MVA. Theauxiliary power is fed through auxiliary transformers having connected capacity of 128 MVA. Mostof the energy is consumed, in main plant and off-lying auxiliaries, by HT and LT motors. HT & LTmotors number 144 & 1728 respectively and have together connected load of 147.2 MW i.e 17.5 %of station capacity.
The 144 HT motors ( rating 140 to 3500 kW ) accounts for 121.3 MW i.e. > 82 % of the total motorscapacities. Major energy consuming equipment are boiler feed pumps, forced draft fans, primaryair fans, induced draft fans, condensate extraction pumps, circulating water pumps, CT pumps,ash slurry pumps, coal mills, coal crushers, coal conveyors etc. Variation in auxiliary powerconsumption vis-à-vis gross generation during the energy audit period is plotted in the following
Auxiliary power consumption optimisation in thermal power stations

III-42
graph. The auxiliary power includes the power used within the plant & township premises & it isvarying between 7.9 % at a PLF of 102 % and between 9.0 – 10 % at a PLF of < 70 %.
7.0
7.5
8.0
8.5
9.0
9.5
10.0
14 15 16 17 18 19 20 21
Tota l generation, M U /da y
Au
xil
iary
po
we
r, %
of
gro
ss
ge
n
Thermal power station is one of the most complex set-up wherein variety of process remain operativeparallely requiring thousands of different types / sizes of equipments mostly powered by in-housegeneration. Equipments can be broadly classified as pumps, fans, compressors etc. Measuredauxiliary power, for a day, along with energy used for various purposes is given in Table 1 below :
As above, the auxiliary power consumption is 8.24 % & is comparable with similar power plants.Out of it about 94 % is used by above tabulated equipment and remaining in lighting & colony. Asgenerating units have been installed in two stages, major auxiliaries i.e. CW pumps, CHP, ashhandling system, compressors, etc, are in parallel and thus consume increased auxiliary powervis-à-vis 4x210 MW.
Motors design efficiency very between 80 – 97 % depending on size and nature of application anddriven equipments design efficiencies are mostly < 80. The combined design efficiencies of HTdriven equipments are < 85 % & ranges between 55 – 82 % vis-à-vis operating efficiency rangingbetween 38 – 79 %.
Actual energy consumption of various equipment depends on mostly operating and maintenancepractices / parameters, edge of the system etc. Targeting optimizing auxiliary consumption patternof various systems / sub-systems in-depth analysis of selective equipment / processes have beencarried out. During the exercise ample opportunities for optimising auxiliary consumption wereidentified.
BFP’s alone consumes about ~ 34 % of total auxiliary power consumption. Efficiency test data andenergy conservation measures are summarized and given in Table 2.
Figure 1 Variation of Auxilary Power with gross energy generation
P.K. Dave, S.K. Sharma & Rajashekar P. Mandi

III-43
Particulars 1B 1C 2A 2B 3A 3C 4A 4BBooster pump suction pr. – kg/cm2 8.62 8.43 8.00 9.27 8.20 7.70 8.04 7.60Main pump suction pressure – kg/cm2 16.90 16.70 17.80 17.10 17.50 17.30 17.02 17.49Actual pr. rise across booster pump - kg /cm2 8.28 8.27 9.80 7.83 9.30 9.60 8.98 9.89Main pump Discharge pressure – kg/cm2 163.5 177.6 182.7 191.1 180.0 173.0 177.5 177.0Actual pr. rise across main pump - kg /cm2 155.22 169.33 172.90 183.27 170.70 163.40 168.52 167.11Feed Water flow - t/h 359.9 305.0 342.5 389.9 345.0 320.00 368.0 326.0Main pump design efficiency % 80.50 80.50 80.50 80.50 82.00 82.00 82.00 82.00Main pump operating efficiency % 58.68 52.41 60.44 72.04 64.61 56.30 62.64 56.76Pumps combined operating efficiency - % 63.20 56.17 65.27 76.74 69.63 60.93 67.43 61.44Motor rating - KW 3500 3500 3500 3500 3500 3500 3500 3500Motor actual input - KW 2909 3020 3047 3034 2802 2852 3028 2953Motor loading - % 83.12 86.30 87.06 86.68 80.05 81.48 86.51 84.36BFP’s overall design efficiency - % 76.84 76.84 76.84 76.84 78.27 78.27 78.27 78.27Operating overall efficiency - % 58.54 52.20 60.00 71.40 64.64 56.68 62.93 57.15Design SEC, kWh/t 8.25 8.25 8.25 8.25 8.50 8.50 8.50 8.50Operating SEC, kWh/t 8.08 9.90 8.90 7.78 8.12 8.91 8.23 9.06�P across BFP circuit, % of dis. pr. 19.90 19.90 25.50 25.50 16.85 16.85 16.29 16.29
Table 1: Measured generation and auxiliary power consumption
Generator-1 5064 BFP 558.58 33.85Generator-2 5088 Mills 181.85 11.02Generator-3 5071.2 CWP 177.36 10.75Generator-4 5117.76 IDF 155.5 9.42Total 20340.96 PAF 153.36 9.29UAT-1A 132 CEP 95.83 5.81UAT-1B 156 FDF 40.22 2.44UAT-2A 120 Ash handling pumps 45.41 2.75UAT-2B 180 SW pumps 28.97 1.76UAT-3A - CT pumps 28.47 1.73UAT-3B - Air Compressor 24.95 1.51UAT-4A 199.44 CHP 24.53 1.49UAT-4B 198.48 ACW pumps 21.88 1.33ST-1 128 DMCW pumps 18.98 1.15ST-2 98 CLPRW pumps 9.31 0.56ST-3 431 HP Flush pump 5.76 0.35ST-4 38 CW service pump 3.77 0.23
Total 1680.82 Total 1574.73 95.44
Particulars Energy measured,MWh/day
Energy used for variouspurpose
EnergyMWh/day
% of AP
Table 2: BFPs performance data
Auxiliary power consumption optimisation in thermal power stations
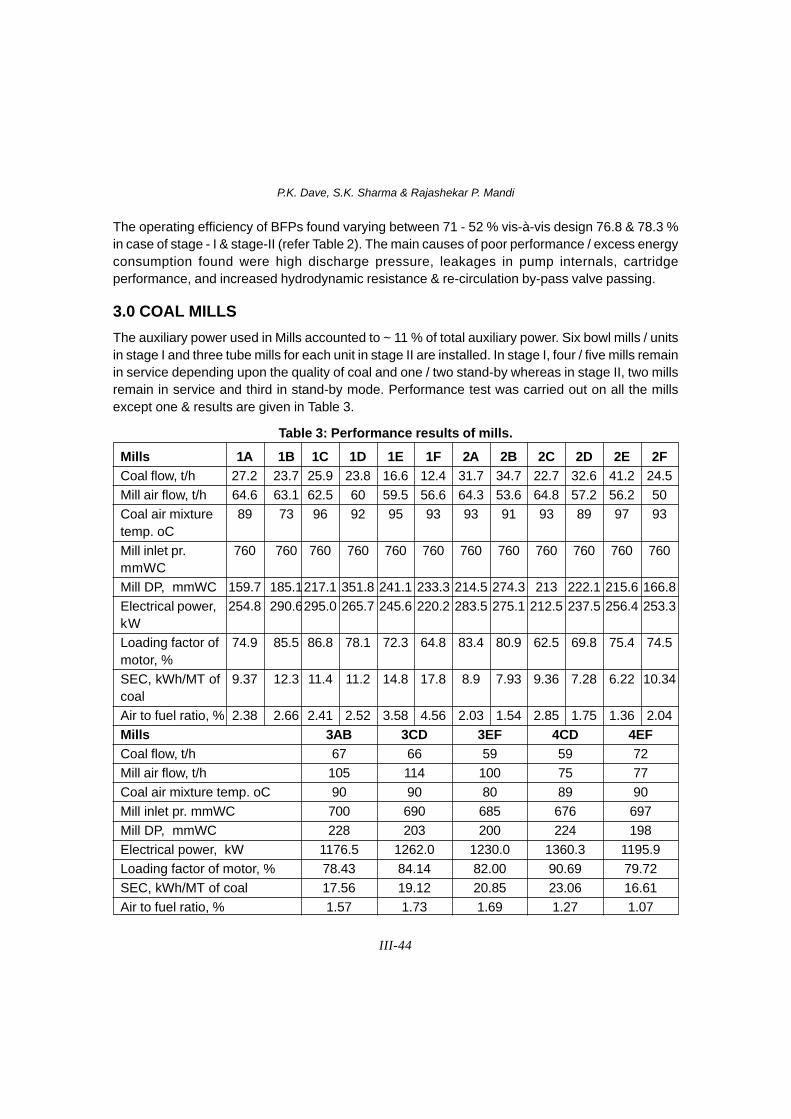
III-44
The operating efficiency of BFPs found varying between 71 - 52 % vis-à-vis design 76.8 & 78.3 %in case of stage - I & stage-II (refer Table 2). The main causes of poor performance / excess energyconsumption found were high discharge pressure, leakages in pump internals, cartridgeperformance, and increased hydrodynamic resistance & re-circulation by-pass valve passing.
3.0 COAL MILLS
The auxiliary power used in Mills accounted to ~ 11 % of total auxiliary power. Six bowl mills / unitsin stage I and three tube mills for each unit in stage II are installed. In stage I, four / five mills remainin service depending upon the quality of coal and one / two stand-by whereas in stage II, two millsremain in service and third in stand-by mode. Performance test was carried out on all the millsexcept one & results are given in Table 3.
Mills 1A 1B 1C 1D 1E 1F 2A 2B 2C 2D 2E 2FCoal flow, t/h 27.2 23.7 25.9 23.8 16.6 12.4 31.7 34.7 22.7 32.6 41.2 24.5Mill air flow, t/h 64.6 63.1 62.5 60 59.5 56.6 64.3 53.6 64.8 57.2 56.2 50Coal air mixture 89 73 96 92 95 93 93 91 93 89 97 93temp. oCMill inlet pr. 760 760 760 760 760 760 760 760 760 760 760 760mmWCMill DP, mmWC 159.7 185.1217.1 351.8 241.1 233.3 214.5 274.3 213 222.1 215.6 166.8Electrical power, 254.8 290.6295.0 265.7 245.6 220.2 283.5 275.1 212.5 237.5 256.4 253.3kWLoading factor of 74.9 85.5 86.8 78.1 72.3 64.8 83.4 80.9 62.5 69.8 75.4 74.5motor, %SEC, kWh/MT of 9.37 12.3 11.4 11.2 14.8 17.8 8.9 7.93 9.36 7.28 6.22 10.34coalAir to fuel ratio, % 2.38 2.66 2.41 2.52 3.58 4.56 2.03 1.54 2.85 1.75 1.36 2.04Mills 3AB 3CD 3EF 4CD 4EFCoal flow, t/h 67 66 59 59 72Mill air flow, t/h 105 114 100 75 77Coal air mixture temp. oC 90 90 80 89 90Mill inlet pr. mmWC 700 690 685 676 697Mill DP, mmWC 228 203 200 224 198Electrical power, kW 1176.5 1262.0 1230.0 1360.3 1195.9Loading factor of motor, % 78.43 84.14 82.00 90.69 79.72SEC, kWh/MT of coal 17.56 19.12 20.85 23.06 16.61Air to fuel ratio, % 1.57 1.73 1.69 1.27 1.07
Table 3: Performance results of mills.
P.K. Dave, S.K. Sharma & Rajashekar P. Mandi
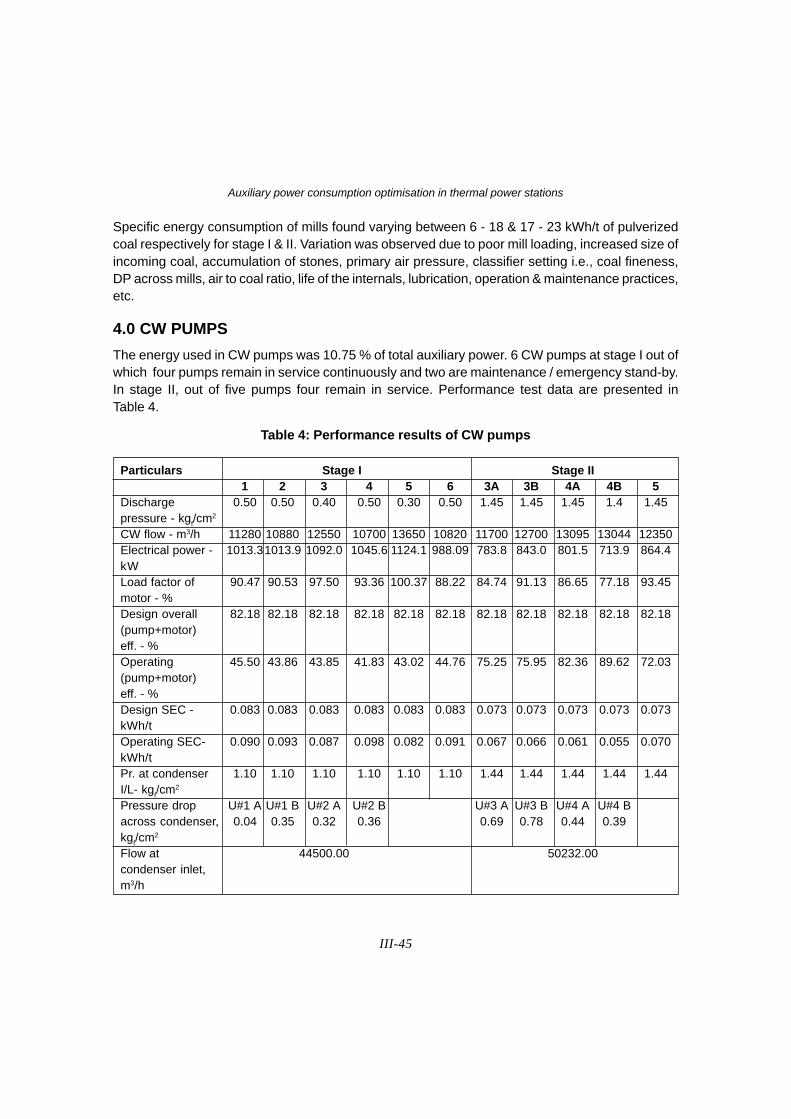
III-45
Specific energy consumption of mills found varying between 6 - 18 & 17 - 23 kWh/t of pulverizedcoal respectively for stage I & II. Variation was observed due to poor mill loading, increased size ofincoming coal, accumulation of stones, primary air pressure, classifier setting i.e., coal fineness,DP across mills, air to coal ratio, life of the internals, lubrication, operation & maintenance practices,etc.
4.0 CW PUMPS
The energy used in CW pumps was 10.75 % of total auxiliary power. 6 CW pumps at stage I out ofwhich four pumps remain in service continuously and two are maintenance / emergency stand-by.In stage II, out of five pumps four remain in service. Performance test data are presented inTable 4.
Particulars Stage I Stage II1 2 3 4 5 6 3A 3B 4A 4B 5
Discharge 0.50 0.50 0.40 0.50 0.30 0.50 1.45 1.45 1.45 1.4 1.45pressure - kgf/cm2
CW flow - m3/h 11280 10880 12550 10700 13650 10820 11700 12700 13095 13044 12350Electrical power - 1013.31013.9 1092.0 1045.6 1124.1 988.09 783.8 843.0 801.5 713.9 864.4kWLoad factor of 90.47 90.53 97.50 93.36 100.37 88.22 84.74 91.13 86.65 77.18 93.45motor - %Design overall 82.18 82.18 82.18 82.18 82.18 82.18 82.18 82.18 82.18 82.18 82.18(pump+motor)eff. - %Operating 45.50 43.86 43.85 41.83 43.02 44.76 75.25 75.95 82.36 89.62 72.03(pump+motor)eff. - %Design SEC - 0.083 0.083 0.083 0.083 0.083 0.083 0.073 0.073 0.073 0.073 0.073kWh/tOperating SEC- 0.090 0.093 0.087 0.098 0.082 0.091 0.067 0.066 0.061 0.055 0.070kWh/tPr. at condenser 1.10 1.10 1.10 1.10 1.10 1.10 1.44 1.44 1.44 1.44 1.44I/L- kgf/cm2
Pressure drop U#1 A U#1 B U#2 A U#2 B U#3 A U#3 B U#4 A U#4 Bacross condenser, 0.04 0.35 0.32 0.36 0.69 0.78 0.44 0.39kgf/cm2
Flow at 44500.00 50232.00condenser inlet,m3/h
Table 4: Performance results of CW pumps
Auxiliary power consumption optimisation in thermal power stations

III-46
The operating efficiency of CWPs found varying widely, mainly in stage-I, due to aging / internalerosion, increased differential pressure across condensers, silt accumulation in pump house forebay, flow & pressure, duct leakages etc.
5.0 INDUCED DRAFT FANS
The auxiliary power used by Induced draft fans is ~ 9.4 % of total auxiliary power. The performancetest findings are summarized in Table 5.
The operating efficiency of IDFs found varying between 56 - 46 % & 68 - 64 % vis-à-vis designvalues of 60.7 & 75.4 % in case of stage - I & stage-II. Main causes of poor performance / excess
energy consumption found were poor suction pressure, high loading due to air ingress betweeneconomizer and fan inlet, dust deposition in flue gas ducts, the increased hydrodynamic resistancebecause of more pressure drop in furnace i.e. in Economizer coils, APH, Super heaters, ESP, etc.
Particulars 1A 1B 2A 2B 3A 3B 4A 4B
Suction Pressure - mmWC -324 -345 -255 -260 -260 -266 -267 -234
O2 in flue gas at Eco. 3.90 3.53 3.50 3.00 3.67 3.67 3.65 3.65O/L - %
O2 at ID I/L - % 8.30 9.90 8.60 9.10 7.40 7.30 6.20 6.70
Flue gas flow - t/h 471.5 489.1 430.7 439.41 437.01 427.47 429.38 425.1
Motor input power - kW 1086.5 1138.5 880.3 889.35 660.59 621.96 655.82 546.17
Motor loading factor - % 83.58 87.58 67.72 68.41 45.56 42.89 45.23 37.67
Design fan efficiency - % 63.91 63.91 63.91 63.91 79.32 79.32 79.32 79.32
Operating fan efficiency - % 54.54 59.43 48.87 51.48 69.36 73.97 69.11 73.48
Design overall (fan+motor) 60.75 60.75 60.75 60.75 75.40 75.40 75.40 75.40eff. - %
Operating overall 51.66 56.18 46.05 48.50 64.21 68.09 64.03 66.99(fan+motor) eff. -%
Design SEC - 1.94 1.94 1.94 1.94 2.40 2.40 2.40 2.40kWh/t of flue gas
Operating SEC - 2.30 2.33 2.04 2.02 1.51 1.45 1.53 1.28kWh/t of flue gas
Furnace pressure - -10.00 -10.00 -5.00 -5.00 -10.00 -10.00 -9.40 -9.40mmWC
Pressure drop in ID 314.00 335.00 250.00 255.00 250.00 256.00 257.60 224.60fan circuit - mmWC
Table 5: Performance results of ID fans.
P.K. Dave, S.K. Sharma & Rajashekar P. Mandi

III-47
Other major energy consuming areas are ESP's, ash handling system, compressed air system andair conditioning system. Installation of automatic temperature controller for CT fans and ESP heatersyields substantial energy savings. Lighting requires small proportion of energy but enormousopportunities exists to conserve energy by avoiding visible wastage, increasing use of natural lighting,time based switching and also by voltage optimization.
6.0 CONCLUSION
Unchahar Power Station have well equipped dedicated "Energy Conservation Lab" and gainedadequate experience to carry out most of the audits using in-house expertise. Expert services ofCPRI are being used selectively and as a result substantial improvement have been attained.
Energy audit findings immerging are being acted upon and thus improvement in auxiliary powerconsumption is being realized progressively. Aiming further, "Benchmarking" study of auxiliary powerconsumption have been completed and subsequently "Performance optimization Group" have beenset-up.
With an objective of real time consumption deviation tracking, "on-line energy metering, monitoringand management system" is under implementation & it will enable various groups to interact closelyand initiate timely actions aiming continual improvements.
Systematic energy auditing is the first step and visual / walk-through audit itself helps in identificationof various measures yielding savings up to 5 % of the in-house energy consumptions. Detailedenergy audit requires in-depth understanding and variety of instruments / equipment and shouldfollow afterwards.
Auxiliary power consumption optimisation in thermal power stations

III-48
BEST PRACTICES FOR AUXILIARY POWER REDUCTION INTHERMAL POWER STATIONS
R. Virendra & G. SubramanyamEnergy ManagementNational Productivity Council, Hyderabad,Phone: 040-24733473/24730904Email: [email protected]
1.0 INTRODUCTION
India has an installed capacity of 1,12,581 MW ( as on 1st May 2004) of which the thermal share is77,931 MW (69%). It’s worth considering that even a 1% reduction in auxiliary power consumptionfrom the existing levels, would yield energy of the order of 480 MU annually, worth Rs.100 Crores( @Rs.2/kWh).
Realising this need and opportunity, several progressive power stations (like NPTC) have alreadyinitiated voluntary energy audits, quite a while ago.
As per the Energy Conservation act 2001, it is now mandatory for all the power generating stationsto audit their facilities by an accredited energy auditor. The process of implementing the provisionscontained in the EC Act, digs in from March 2007 onwards.
On the strength of several energy audit & conservation studies undertaken by National ProductivityCouncil (NPC), India, in various thermal & super thermal power stations, the authors in this paperpresent a comparison of auxiliary power consumption trend and it’s break-up, amongst differentcapacity units, ranging from 500 MW, 210 MW to 110 MW units.
The 500MW units, register the least Auxiliary Power Consumption (APC), largely due to theincorporation of Turbine Driven Boiler Feed Water Pumps (TDBFP), in these units. Energy audit ina vast Thermal Power Station (TPS) , is better tackled when the thermal power plant operationsare segregated into different sub-areas like: Main plant auxiliaries, Draft system (consisting of ID/FD/PA fans), Feed water system (consisting of BFP’s /CEP’s, CW system-including CT’s) , and Offsites (consisting of Coal handling Plant, Ash Handling Plant, Air Compressors, A/c plant, Stationlighting etc.).
The Table 1 presents a comparison of the typical break-up of APC for different capacity ratings, allof which, have Cooling towers with fans.
BFP’s constitute the single largest contributor to the APC (excepting in the case of 500 MW unitswhere TDBFP’s are used), ID Fans, FD fans, PA Fans, CW Pumps follow, all of these are generallyHT Drives.
National Symposium on Energy Conservation Measures in Generating Sector, Nov. 17-18, 2005, Bangalore

III-49
Plant 500 MW 210 MW 110 MWCap.Load Actual % of % Of Actual % of % Of Actual % of % Of
Load kW Gen. APC Load kW Gen. APC Load kW Gen. APCBFP 0 0.00 0.00 5380 2.69 33.63 2793 2.94 24.50CEP 1903 0.40 5.66 534 0.27 3.34 364 0.38 3.19CW pump 4754 0.99 14.15 1329 0.66 8.31 1197 1.26 10.50ID fans 6289 1.31 18.72 2523 1.26 15.77 1622 1.71 14.23PA fans 2845 0.59 8.47 1360 0.68 8.50 1648 1.73 14.46FD fans 1368 0.29 4.07 800 0.40 5.00 243 0.26 2.13Mills 2776 0.58 8.26 1157 0.58 7.23 789 0.83 6.92CT fans 1083 0.23 3.22 630 0.32 3.94 456 0.48 4.00Air 385.5 0.08 1.15 249 0.12 1.56 228 0.24 2.00Compr.A/C 175 0.04 0.52 150 0.08 0.94 105 0.11 0.92PlantCHP 591 0.12 1.76 272 0.14 1.70 275 0.29 2.41AHP 455 0.09 1.35 266 0.13 1.66 290 0.31 2.54Lighting 266 0.06 0.79 160 0.08 1.00 100 0.11 0.88Others 10709.5 2.23 31.87 1190 0.60 7.44 1290 1.36 11.32Aux. 33600 7.00 100.00 16000 8.00 100.00 11400 12.00 100.00PowerCons.Gen. 480000 100.00 200000 95000
Table 1: Typical break-up of auxiliary power consumption in thermal power stations
2.0 BEST PRACTICES
Based on the experience gained from the vast number of NPC energy audit studies in ThermalPower Plants and also drawing from several other Industrial study experiences, an attempt hasbeen made to bring out a few of the worthwhile and easily implementable best practices, towardsreducing APC in different sub-systems, in Thermal Power Stations.
2.1 Draft system
The Draft system, comprises of Forced Draft (FD) Fans, Primary Air (PA) Fans and Induced Draft
Note: 1. Others include: Raw water pumps, DM plant, ESP's, service & Admin. Buildings, etc.
2. Power consumption in common auxiliaries like Air Compressors, A/c Plant, CHP, AHP,Lighting are divided per unit basis.
3. BFP - Boiler Fed Pumps, CEP - Condensate Extraction Pumps, CW-Circulating Water,ID-Induced Draft, PA-Primary Air, FD-Forced Draft, CT-Cooling Tower
Best practices for auxiliary power reduction in thermal power stations

III-50
The analysis, based on comparison of as-run combined (motor and fan) efficiency and specificenergy consumption (SEC) with corresponding rated values, would indicate the margins availablefor improvement in performance. The typical bench mark SEC values for the fans are given below:
� PA fan = 3.75 - 4 kWh per ton air
� FD fan = 1.2 - 1.3 kWh per ton air
� ID fan = 2.3 - 2.4 kWh per ton flue gas
NPC studies have been able to demonstrate upto 1100 KW (in all FD, ID and PA fans of NTPCpower station), simply by arresting air ingress in the flue gas path.
Power plant O&M ersonnel are certain to be familiar with the phenomena of sizeable power reductionin fans systems, immediately after an overhaul of the fans and it's associated ducting system. Allthe more reason why it is so vital to periodically assess % O2 levels at different locations in the fluegas path, which reflect the extent of stray air ingress through the Air pre-heater and ESP system.
Simple corrective measure to arrest identified stray air in leaks, bring about huge energy savings.
Given the fact that, very often, all these fans are required to operate below their rated dischargecapacity and head, (to achieve this dampering is resorted to), imposing by default an intrinsicinefficiency on these equipment.
The situation offers an opportunity for power saving in the draft systems by judicious incorporationof VFDs for PA and ID Fans.
In the case of FD fans, the operating duty parameters are so low that one could easily justifiedreplacement of existing oversized fan with more efficient properly matched smaller fans.
Recent genre power stations are incorporating VFDs at the design stage itself for PA and ID Fans.For a typical 210 MW unit, the difference in power consumption in ID fans alone with and withoutVFDs, is 500 KW/Unit, a reduction 2.4% in power consumption worth around Rs.75 lakhs/annumper 500 MW unit. VFDs, of course are very expensive, and HT VFDs (3.3, 6.6 kV) are doubly so.
Some smart industries, adopt the less expensive route by employing LT VFDs with step down andstep up transformers back to back, to reduce their initial investment.
(ID) Fans which together account for more than 30% of the auxiliary power consumption (around12-13 MW of power in 500 MW Units).
Interestingly there exists ample scope for conservation in the draft system. NPC experience suggestscope for improvement, potentially for at least 15-20% energy savings.
The audit of the above fans would involve measurement of duty parameters like air flow, headdeveloped and motor input power drawal.
R. Virendra & G. Subramanyam
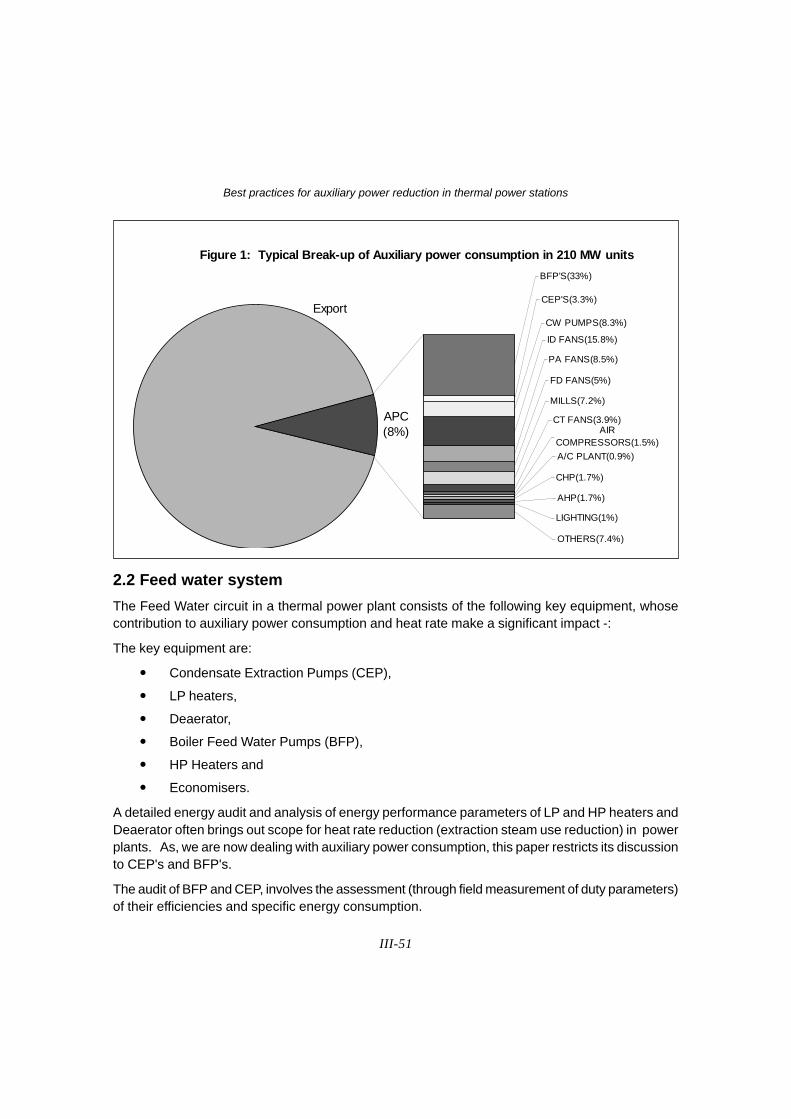
III-51
Figure 1: Typical Break-up of Auxiliary power consumption in 210 MW units
Export
OTHERS(7.4%)
LIGHTING(1%)
AHP(1.7%)
CHP(1.7%)
A/C PLANT(0.9%)
AIR COMPRESSORS(1.5%)
CT FANS(3.9%)
MILLS(7.2%)
FD FANS(5%)
PA FANS(8.5%)
ID FANS(15.8%)
CW PUMPS(8.3%)
CEP'S(3.3%)
BFP'S(33%)
APC(8%)
2.2 Feed water system
The Feed Water circuit in a thermal power plant consists of the following key equipment, whosecontribution to auxiliary power consumption and heat rate make a significant impact -:
The key equipment are:
� Condensate Extraction Pumps (CEP),
� LP heaters,
� Deaerator,
� Boiler Feed Water Pumps (BFP),
� HP Heaters and
� Economisers.
A detailed energy audit and analysis of energy performance parameters of LP and HP heaters andDeaerator often brings out scope for heat rate reduction (extraction steam use reduction) in powerplants. As, we are now dealing with auxiliary power consumption, this paper restricts its discussionto CEP's and BFP's.
The audit of BFP and CEP, involves the assessment (through field measurement of duty parameters)of their efficiencies and specific energy consumption.
Best practices for auxiliary power reduction in thermal power stations

III-52
The 500 MW Units in India are usually provided with a steam Turbine Driven Boiler Feed Pump(TDBFP) an hence the APC in 500 MW units is as low as 5 % whereas in 210 MW units and 110MW units it is in the range of 34 % and 25 % respectively. This gives an indication of the awesomeimpact that an electric driven BFP has on APC, and hence the need for a closer look and observationof these pumps from time to time.
The specific power energy consumption of BFP range between 8 - 9 kWh/m3 feed water and thatfor CEP ranges between 0.8-1.0 kWh/m3 of condensate.
Due to their criticality, the BFP always operate with a standby and hence it is easy to performoverhaul of the spare BFP without disturbing the main stream activity, and thus ensure that the BFPare always at peak efficiency and performance.
It would be worthwhile to remember that even a 1 % power reduction in BFP could mean a hugesavings in terms of energy (around 60 - 70 Million Units (MU) annually in a 500 MW unit).
Similarly the CEP also always have a stand-by and frequent performance assessment to determinemargins for saving and prompt overhaul augurs well for CEP energy conservation.
Some of the best practices and energy conservation scope areas in BFP and CEP are:
� Replacement of inefficient BFP as a part of renovation and modernization in some of theold plants.
� Clipping of one stage from the multi stage BFP to balance the pressure drop requirementsbetween HP heaters, Economiser and boiler drum etc.
� Use of higher pressure in the deaerator to commensurately reduce BFP powerconsumption (reduced head developed
� Running of two CEP instead of 3 CEP (3 CEP are run to avoid tripping due to lowerfrequency in some of the power plants)
� Application of variable speed drivers
� Installation of hydraulic turbine instead of feed regulating section to avoid pressure dropsand generate additional power.
2.3 Milling system
Mills or pulverisers in Thermal Power plants, single - handedly contribute to around 6-7% of Auxiliarypower consumption.
Typically, in 500 MW units, 8 mills are operated while in 210 MW units, 4-5 mills are normallyoperated.
The key indicators for assessing the performance of Coal mills are, Specific energy consumption(SEC), Air to Fuel ratio (A/F), Mill fineness, Pressure drop across the mill (dp) and Mill rejects.
R. Virendra & G. Subramanyam

III-53
The specific power consumption varies from 8 - 9 kWh/t of coal for bowl mills. This value is slightlyhigher for tubular mills ranging from 10-12 kWh/t of coal.
The key contributing factors towards higher SEC are
� Low coal output (part load operations)
� High ash in coal
� Condition of grinding rolls and bull rings
� Grindability index
� Wetness of coal
� Quantity and temperature of primary air
� Classifier settings
� Rejects etc.
The designed Air to Fuel ratio would normally be in the range of 1.5 - 2.0 tons of air/ton of coal. Thisratio largely depends on the moisture content in the coal (quality of coal), and temperature of theprimary air. One can measure coal flows and air flows by employing a dirty pitot tube, formeasurements.
The desired air to fuel ratio, for the as-run operating conditions, can be assessed by drawing up aheat balance across the mill. The pulverized fuel distribution in the each of the outlet coal pipes,has a profound influence on air to flue ratio and is a key issue while attempting to maintain propercombustion.
Mill fineness has a direct impact on the specific power energy consumption. Normally fineness of75% passing through, is desirable. Over grinding, drastically increases the power consumption.
By systematic energy audit of the milling system, one can optimize power consumption by identifyingthose mills having higher specific power consumption.
In one 500 MW unit for instance, normal overhauling and periodic maintenance of the badlyperforming mills yielded it energy savings to tune of 2.77 MU per annum.
Similarly, in another instance, optimizing air to fuel ratios yield a reduction of 3.1 MU per annum inthe energy consumption of PA fans.
One of commonly employed 'best practice' for reducing auxiliary power consumption in millingsystem is by operating only 4 mills instead of 5 mills in 210 MW units and modification/retrofitting ofthe existing XRP type of mills.
2.4 Circulating Water (CW) System:
The CW system consists of Cooling Water pumps and Cooling Towers. In some of the Thermalpower Stations, one can find Cooling Tower (CT) pumps too, in addition to CW pumps.
Best practices for auxiliary power reduction in thermal power stations

III-54
The contribution of APC in CW system ranges from 9-17%, depending on, whether it is a oncethrough system or a re-circulating Cooling Tower system, or a combination of both CW pumps andCT pumps.
By conducting an energy audit of CW system, the performance of CW pumps can be evaluated.The measurements of water flows (by online flow meters where ever feasible or by ultrasonic flowmeters) and simultaneous head and motor input power measurements need to be made at site.
The specific energy consumption, along with combined (motor and pump) efficiency of the pumpsgives clues about the margins and scope for improvement.
The specific energy consumption figures typically vary from 0.06 - 0.1 KWh/M3 CW water. Thevariation in specific energy consumption largely depends on factors like:
� the fore bay level
� bowl condition
� profile condition of Impeller and casing
� availability of suction lift
� throttling
� bends and scaling effects
� discharge side lifts
The design efficiency levels of most of the vertical centrifugal CW pumps would be in the range of85 - 89 %.
Inter-se comparison of the battery of pumps in the CW pump house is strongly recommended,mainly from the point of view that it would be profitable and energy efficient to work the moreefficient pumps for longer periods in preference to the inefficient ones. In the intervening period theinefficient pumps could be examined closely and necessary corrective measures be incorporated,at leisure.
It is possible to achieve substantial energy saving by judiciously switching off one or more of thepumps, based on favourable condenser vacuum and favourable weather conditions.
Optimised cleaning schedules for condenser tube cleaning augurs well for the overall performanceof the station and CW water flow optimization in particular (reduction in CW pumping energyconsumption).
Depending on the quantum of cooling water flow needed, in tune with the weather condition andcondenser cleanliness as well as forebay level variation, it is possible to reduce CW pump energyconsumption by incorporating two speed motors.
Refurbishing the casing and impellers and alternatively, going in for application of special coatingsto improve the impeller the casing profile condition, it is possible to increase the efficiency of theCW pumps by 3-4%, thus lowering SEC and realizing energy savings.
R. Virendra & G. Subramanyam

III-55
The contribution of Cooling Tower alone (with fans), to APC would be around 3-4%.
Periodic assessment of CT performance would enable timely intervention of corrective action thatwould result in cooler CW water enabling better condenser vacuum & heat rate.
It is worth remembering that priority should always be given for improvement in condenser backpressure (through any means) in preference reduction in fans power consumption in CT's (byshutting off fans during favourable weather.
A useful performance indicator applicable in Thermal power plants would the specific circulationflow rate i.e. CW flow/MW. This value ought to be around 120-150 m3/MW in 500 MW and 210 MWplants.
Reduction of energy consumption in CT's could include blade angle reduction, shutting of CT'scells in conjunction with favourable weather conditions, and replacing existing aluminum cast andGRP blades with FRP blades. Also incorporation of efficient nozzles for efficient water spare/atomization, incorporation of efficient fill material for providing mass and heat transfer areas areother option that can be considered.
2.5 Coal Handling Plant (CHP)
Though the connected load of the CHP is huge, the actual operating load is surprisingly low.
The contribution of CHP in overall APC ranges between 1.5 - 2.5 %.
The specific energy consumption is a key indicator that reflects the performance of CHP. Thetypical specific energy consumption figures would be in the order of 1 - 1.2 kW/t of coal handled.Again this figure varies depending on the type of operations i.e. direct bunkering or stacking &reclaiming, wagon tippling instead of Track hopper system etc.
By simultaneous measurement of power and coal flow for different coal handling equipment like,conveyors, paddle feeders, crushers, stacker/reclaimer etc. one can determine the specific energyconsumption, depending on the conveyor route followed.
The CHP is very critical component of the power plant and strangely, also a very neglected areadue to the harsh working environment.
Several NPC energy audit studies of CHP, indicate energy saving potential of 30-40%. Some of thegood practices in CHP area are:
� increasing the Plant Utilisation Factor (PUF) or throughput
� incorporating PLC controllers
� avoiding idle running of conveyors & crushers
� incorporating Soft starter - energy saver etc.
Best practices for auxiliary power reduction in thermal power stations

III-56
2.6 Ash Handling System
The ash Handling plant (AHP) consists of ash water pumps and Ash slurry series pumps.
Many recent genre plants have design their AHP on dry ash handling mode using transport aircompressors for movement of ash.
Some of these plants also supplying fine fly ash collected from ESP's on a continuous basis toCement Plants.
The contribution of wet AHP in APC varies between 1.5 to 2%. In some of the NTPC plants likeDadri, where dry AHPs are prevalent, the contribution of AHP in APC is around 3.5%.
Some of the best practices (for energy conservation) applicable to AHPs are:
Constant monitoring of ash to water ratio. The designed ash water ratios are around 1: 5 for fly ashand 1:8 for bottom ash. But in reality one encounter ash to water ratios as high as 1:20.
� Reducing ash to water ratios directly result in pump power savings as also water savings.NPC studies have shown savings to the tune of 0.2 MU/annum for every 1% reduction inash water ratio.
� Changing of worn out series pump internals based on periodic pump efficiency assessment
� Variation of scoop angle (control position) of Ash slurry disposal pumps based on slurrylevel in the pit etc.
� Replacement of inefficient pumps with high efficiency pumps
� Optimization of pump operations (reduced hours are operation or use of smaller pumps)
2.7 Compressed Air System
Compressed Air system, consists of Instrument Air Compressors (IAC) and Process AirCompressors (PAC) and Air Drying units. Transport air compressors (TAC) are not included in thissystem.
The contribution of Air compressors system in APC would range between 1- 1.5%.
The best way to assess the performance of Air compressors is by generating specific energyconsumption figures for each of the bank of compressors. An inter-se comparison of SEC's wouldhelp decide which air compressor to operate for longer duration of time to achieve reduced energyconsumption.
Simultaneous measurement of power and flow delivered (by FAD test method), would enablecalculation of specific power consumption (SPC) values. These can be compared with eitherDesign or with Performance Guarantee (PG) values to assess margins for improvement.
For typical reciprocating Air Compressors or screw compressors, the SECs values very betweenfrom 7.5 - 8.5 kW/Nm3. The present genre of modern modular screw compressors have SECs aslow as 6.7 kW/Nm3.
R. Virendra & G. Subramanyam

III-57
A selection of best practices, for reducing power consumption in the compressed air system arepresented as under-:
� Reduction of air leaks. Conducting leakage tests would be difficult in continuous runningplants (a plant shutdown is essential for evaluating leakage by this method). How ever byphysically identifying leaks, one can quantify compressed air leakage to a fair extent(tables showing leakage from different hole sizes are available).
� Optimizing discharge pressure by toning down as per needs. This can be affected throughpressure settings alterations.
� Regular assessment of Inter Cooler/ After Cooler performance and periodic cleaning oftubes
� Adoption of heat of compression (HOC) dryers for Air Drying units.
� Use of demand controller for optimal pressure setting
� Use of transvector nozzles for cleaning application etc.
Based on NPC's energy audit experience in compressed air systems it is possible to save 25-30%of energy in compressed air systems.
A recent compressed air system follow-up study, at one of the thermal power stations, by NPC, hasindicated savings to the tune of 28%, worth Rs.73 Lakhs annually.
2.8 Air Conditioning System
It is normal practice to provide unit control rooms (UCBs), in the thermal power plants, with centralizedair conditioning.
A typical UCB of a 200 MW unit has a connected load of 150 TR. The normal operating electricalload is around 150 kW (including chilled water pumps, condenser water pumps and Cooling towerfans.
The A/C system contribution in APC would be around 0.5-1% (The a/c load of administration buildingand ESP control rooms are not included in this).
The ideal way to evaluate the performance of A/C system is by measuring specific powerconsumption in terms of kW/TR.
Typical kW/TR values for centralized reciprocating machines ranges between 1.0-1.1 kW/TR.
A list of a few of the best practices for energy conservation in A/C system are :
� Incorporation of variable speed devices for AHU fans
� Periodic cleaning of condensers and improving its performance
� Periodic cleaning of evaporator and improving its performance
Best practices for auxiliary power reduction in thermal power stations

III-58
� Installation of absorption refrigeration system instead of present vapour compressionsystem
� Incorporation of SCADA/Building management system (BMS)
� Improving CT performance
� Improving pump performance
� Incorporation of 3 way valves in AHU's
2.9 Lighting System
The station lightning system consists of main plant lighting, off sites lighting and service buildingslighting. A typical connected load of lightning system in a Super thermal Power Project of 2000 MWwould be around 2 MW, but the operating load including day and night time would be around 1.2MW.
Though the lighting loads are wide spread, the contribution of lighting consumption in APC is merelyaround 0.8 - 1 %. Despite the low consumption by lighting system (< 1%), there exists a goodscope for reducing energy consumption to the tune of 20-30%, by adopting energy efficient practices.
A recent energy audit study of station lighting system at a thermal power plant yielded savings ofthe order of 27%, equivalent to 2.9 MU worth Rs.43 lakhs annually (@ Rs.1.5/kWh).
Some of the best practices for conserving energy in lighting are:
Reducing single phase voltage to 220 - 230 V by transformer tap setting (since most of the generatingstations, the single phase voltage observed in the range of 250 - 260 V).
� Use of electronic ballasts
� Incorporation of CFLs
� Incorporation of lighting energy savers
� Use of metal halide lamps by replacing HPSV lamps
� Incorporation of timers
� Incorporation of photo sensors etc.
3.0 CONCLUSION
It is evident that thermal power stations offer tremendous scope of reducing auxiliary powerconsumption. In fact the auxiliary power consumption of 200 MW unit is closed to the connectedload of large cement plant.
Detailed energy audit and analysis, can help identify a number of energy conservation options.
NPC has brought out energy audit procedures for all these systems and identified some of the bestpractices that are applicable in thermal power stations.
R. Virendra & G. Subramanyam

III-59
It is immaterial whether energy audit is mandatory or not. Ample scope for energy conservation andone needs to continuously identify ways and means to conserve energy and retain ones competitiveedge in this fiercely competitive world.
BIO-DATA OF AUTHORS
R. Virendra is presently working as Director, National Productivity Council, Hyderabad. He hasobtained degree in Chemical Engineering and PG Diploma in Energy Management. He hadundergone advanced training in Energy efficiency at Stratholyde University, Glasgow, UK.
His areas of specialization are: Energy Management (Audit & Conservation); Resource Conservation;Cleaner Production - Energy Efficiency and Demand Side Management
G. Subramanyam is presently working as Senior Deputy Director in National Productivity Council,Hyderabad. He has obtained degree in Chemical Engineering and PG Diploma in EnergyManagement. He had undergone advanced training in Power Plant Practice - organised by NationalPower Training Institute; Productivity Improvement in Foundry - Indonesia and ManagementConsultancy for Productivity Improvement - Tokyo, Japan
His areas of specialization are: Energy Management (Audit & Conservation); Water Conservationand Demand Side Management
Best practices for auxiliary power reduction in thermal power stations