![Energy Eciency and eliability in nderwater :ireless ensor Networks … · 2020-06-23 · In [12], Depth-Based Multi-hop Routing (DBMR) algorithm was used to save energy and solve](https://static.fdocuments.us/doc/165x107/5f37c488d286fb5893336db1/energy-eciency-and-eliability-in-nderwater-ireless-ensor-networks-2020-06-23.jpg)
T raits and M etatraits: T heir R eliability, S tability, and S...
13
PERSONALITY PROCESSES AND INDIVIDUAL DIFFERENCES Traits and Metatraits: Their Reliability, Stability, and Shared Genetic Influence Scott L. Hershberger and Robert Plomin Pennsylvania State University Nancy L. Pedersen The Karolinska Institute Metatraits measure individual differences in construct relevancy, whereas traits measure individual differences in construct extremity. Twenty-four traits and metatraits were examined in this study using 157 pairs of identical twins reared together, 95 pairs of identical twins reared apart, 211 pairs of fraternal twins reared together, and 228 pairs of fraternal twins reared apart obtained from the Swedish Adoption/Twin Study of Aging (see N. L. Pedersen et al., 1991). Reliability and stability analyses of the metatraits revealed generally lower reliability and stability across time compared to traits. Quantitative genetic analyses of the relationship between traits and metatraits indicated that approximately 69% of the metatrait's genetic variance is shared with the trait, with 31% of its genetic variance unique to the metatrait. These results suggest that metatraits provide a useful additional view of personality. The most common measure of individual differences in per- sonality research has undoubtedly been the total scale score ob- tained on an inventory or questionnaire. This total scale score, formed by the sum of item responses, serves as a measure of an individual's standing on a trait. Although the conclusion has been vigorously contested (e.g., Epstein, 1983), some research- ers have asserted that the use of total scale scores for the investi- gation of personality, particularly for the prediction of behavior, has been less than productive (e.g., Mischel, 1968). Bern and Allen (1974) suggested that the source of this predictive diffi- culty might rest with the relevancy of the personality trait for the individual's behavior. According to Bern and Allen, if a per- son is behaviorally consistent across situations, the personality trait responsible for the behavior may be more relevant to this person than to a behaviorally inconsistent person. As one mea- sure of consistency, Bern and Allen calculated an ipsatized vari- ance index, or the variance of item responses on one trait scale divided by the total variance across all items on several trait Scott L. Hershberger and Robert Plomin, Department of Psychology, Pennsylvania State University; Nancy L. Pedersen, The Karolinska In- stitute, Stockholm, Sweden. The Swedish Adoption/Twin Study of Aging (SATSA) is an ongoing study conducted at the Department of Epidemiology of the Institute for Environmental Medicine at the Karolinska Institute in Stockholm in collaboration with the Research Center for Developmental and Health Genetics at Pennsylvania State University. SATSA is supported in part by grants from the National Institute on Aging (AG-04563 and AG- IO 175), the Swedish Social Research Council, and the John D. and Catherine T. MacArthur Foundation Research Network on Successful Aging. Correspondence concerning this article should be addressed to Scott L. Hershberger, who is now at the Department of Psychology, University of Kansas, 426 Fraser Hall, Lawrence, Kansas 66045-2160. scales. In their study, the ipsatized variance index proved suc- cessful in differentiating individuals who were cross-situation- ally consistent from those who were inconsistent in conscien- tiousness, but it was not successful for the trait of friendliness. Various efforts to reproduce and extend Bern and Allen's re- sults have met with modest success (e.g., Chaplin & Goldberg, 1985). Some researchers have pointed to statistical difficulties with the ipsatized index itself, among which is the confounding of item variance caused by the trait with the interitem variance of all other measured traits (e.g., Paunonen & Jackson, 1985). Others have claimed that measures of consistency possess little discriminant validity from total scale scores (e.g., Burke, Kraut, & Dworkin, 1984). Yet another problem exists with the correlation between the total scale score and ipsatized variance index, which is frequently not linear but curvilinear because of the restrictions placed on the extremity of the total scale scores of inconsistently responding persons (Paunonen, 1988). Nonetheless, recent reviews of attempts to use behavioral consistency as a measure of trait relevancy have found some promise in the approach (Paunonen, 1988; Tellegen, 1988). In- deed, the work of Baumeister and Tice (1988; Baumeister, 1991; Tice, 1989) has been particularly supportive of the use- fulness of behavioral consistency as an index of trait relevancy. Baumeister and Tice (1988) proposed the term metatrait to de- scribe that "trait of having versus not having a particular trait." A metatrait is measured by the simple standard deviation of an individual's item responses, thus avoiding the problems atten- dant on the Bern and Allen ipsatized variance index. Although not without its critics (e.g.,. Paunonen, 1988), the interitem standard deviation index has proved useful in many contexts (Tice, 1989). Metatraits, as measured by the interitem stan- dard deviation index, have been shown to mediate the relation- ship between total scale score (locus of control) and a behav- ioral criterion (persistence on a laboratory task) and, when the Journal of Personality and Social Psychology, 1995, Vol. 69, No. 4,673-685 Copyright 1995 by the American Psychological Association, Inc. 0022-3514/95/S3.00 673
Transcript of T raits and M etatraits: T heir R eliability, S tability, and S...
PERSONALITY PROCESSES AND INDIVIDUALDIFFERENCES
Traits and Metatraits: Their Reliability, Stability,and Shared Genetic Influence
Scott L. Hershberger and Robert PlominPennsylvania State University
Nancy L. PedersenThe Karolinska Institute
Metatraits measure individual differences in construct relevancy, whereas traits measure individualdifferences in construct extremity. Twenty-four traits and metatraits were examined in this studyusing 157 pairs of identical twins reared together, 95 pairs of identical twins reared apart, 211 pairsof fraternal twins reared together, and 228 pairs of fraternal twins reared apart obtained from theSwedish Adoption/Twin Study of Aging (see N. L. Pedersen et al., 1991). Reliability and stabilityanalyses of the metatraits revealed generally lower reliability and stability across time compared totraits. Quantitative genetic analyses of the relationship between traits and metatraits indicated thatapproximately 69% of the metatrait's genetic variance is shared with the trait, with 31% of its geneticvariance unique to the metatrait. These results suggest that metatraits provide a useful additionalview of personality.
The most common measure of individual differences in per-sonality research has undoubtedly been the total scale score ob-tained on an inventory or questionnaire. This total scale score,formed by the sum of item responses, serves as a measure of anindividual's standing on a trait. Although the conclusion hasbeen vigorously contested (e.g., Epstein, 1983), some research-ers have asserted that the use of total scale scores for the investi-gation of personality, particularly for the prediction of behavior,has been less than productive (e.g., Mischel, 1968). Bern andAllen (1974) suggested that the source of this predictive diffi-culty might rest with the relevancy of the personality trait forthe individual's behavior. According to Bern and Allen, if a per-son is behaviorally consistent across situations, the personalitytrait responsible for the behavior may be more relevant to thisperson than to a behaviorally inconsistent person. As one mea-sure of consistency, Bern and Allen calculated an ipsatized vari-ance index, or the variance of item responses on one trait scaledivided by the total variance across all items on several trait
Scott L. Hershberger and Robert Plomin, Department of Psychology,Pennsylvania State University; Nancy L. Pedersen, The Karolinska In-stitute, Stockholm, Sweden.
The Swedish Adoption/Twin Study of Aging (SATSA) is an ongoingstudy conducted at the Department of Epidemiology of the Institute forEnvironmental Medicine at the Karolinska Institute in Stockholm incollaboration with the Research Center for Developmental and HealthGenetics at Pennsylvania State University. SATSA is supported in partby grants from the National Institute on Aging (AG-04563 and AG-IO 175), the Swedish Social Research Council, and the John D. andCatherine T. MacArthur Foundation Research Network on SuccessfulAging.
Correspondence concerning this article should be addressed to ScottL. Hershberger, who is now at the Department of Psychology, Universityof Kansas, 426 Fraser Hall, Lawrence, Kansas 66045-2160.
scales. In their study, the ipsatized variance index proved suc-cessful in differentiating individuals who were cross-situation-ally consistent from those who were inconsistent in conscien-tiousness, but it was not successful for the trait of friendliness.
Various efforts to reproduce and extend Bern and Allen's re-sults have met with modest success (e.g., Chaplin & Goldberg,1985). Some researchers have pointed to statistical difficultieswith the ipsatized index itself, among which is the confoundingof item variance caused by the trait with the interitem varianceof all other measured traits (e.g., Paunonen & Jackson, 1985).Others have claimed that measures of consistency possess littlediscriminant validity from total scale scores (e.g., Burke,Kraut, & Dworkin, 1984). Yet another problem exists with thecorrelation between the total scale score and ipsatized varianceindex, which is frequently not linear but curvilinear because ofthe restrictions placed on the extremity of the total scale scoresof inconsistently responding persons (Paunonen, 1988).
Nonetheless, recent reviews of attempts to use behavioralconsistency as a measure of trait relevancy have found somepromise in the approach (Paunonen, 1988; Tellegen, 1988). In-deed, the work of Baumeister and Tice (1988; Baumeister,1991; Tice, 1989) has been particularly supportive of the use-fulness of behavioral consistency as an index of trait relevancy.Baumeister and Tice (1988) proposed the term metatrait to de-scribe that "trait of having versus not having a particular trait."A metatrait is measured by the simple standard deviation of anindividual's item responses, thus avoiding the problems atten-dant on the Bern and Allen ipsatized variance index. Althoughnot without its critics (e.g.,. Paunonen, 1988), the interitemstandard deviation index has proved useful in many contexts(Tice, 1989). Metatraits, as measured by the interitem stan-dard deviation index, have been shown to mediate the relation-ship between total scale score (locus of control) and a behav-ioral criterion (persistence on a laboratory task) and, when the
Journal of Personality and Social Psychology, 1995, Vol. 69, No. 4,673-685Copyright 1995 by the American Psychological Association, Inc. 0022-3514/95/S3.00
673
674 S. HERSHBERGER, R. PLOMIN, AND N. PEDERSEN
metatrait is self-esteem, to predict a behavioral criterion(advice seeking) directly (Baumeister & Tice, 1988). Meta-traits have also been shown to be stable across time and to beequally reliable for "traited" and "untraited" individuals(Baumeister, 1991). However, the reliability estimates were re-stricted to test-retest correlations. Reliability estimates ob-tained from test-retest correlations commonly confound the re-liability of a trait with its stability across time.
Behavioral genetic studies of personality scale scores have re-vealed a substantial degree of genetic influence on personality,with heritabilities ranging typically between .25 and .50(Bouchard & McGue, 1990; Plomin, Chipuer, & Loehlin,1990). However, the heritabilities of metatraits are unknown.Waller and Reise (1992) examined genetic influence on indi-vidual differences in scalability, a concept related to but distinctfrom the concept of metatraits. Scalability refers to the degreeto which an individual's item response pattern conforms to aperfect Guttman scale. Although an extreme degree of item re-sponse inconsistency is incompatible with a perfect Guttmanscale, two individuals with item patterns conforming identicallyto a Guttman scale may nonetheless demonstrate dramaticallydifferent degrees of response variability.
One goal of the present study was to examine genetic andenvironmental influences on metatraits. A second goal was toaddress the important issues of the reliability and stability ofmetatraits. Baumeister's (1991) study addressed the two latterissues with the correlation between metatrait scores assessed attwo time periods several weeks apart. The current study in-cludes three periods of measurement spanning 6 years, thus al-lowing for a more refined approach to reliability and stabilityestimation. A third goal was to examine the correlation betweentrait and metatrait scores. If, as Burke et al. (1984) claim,metatraits essentially provide no information in addition to thatprovided by the level of a trait, the metatrait and trait levelshould be highly correlated. If this is the case, most of the ge-netic influence affecting the metatrait should be shared with thetrait, with little genetic influence affecting the metatraituniquely. If metatraits capture an aspect of personality not cap-tured by the trait level, a significant proportion of the geneticvariance affecting the metatrait should be unique to the meta-trait and not shared with the trait.
MethodParticipants
The data for this study were obtained from the Swedish Adoption/Twin Study of Aging (SATSA; see Pedersen et al., 1991), a longitudinalstudy of the cognitive, personality, and health characteristics of a sampleof twins. The twins were identified from the Swedish Twin Registry,which includes nearly 25,000 pairs of same-sex twins born in Swedenbetween 1886 and 1958 (Cederlof & Lorich, 1978). The twins rearedtogether were matched to the twins reared apart on the basis of age,gender, and county of birth. For the twins reared apart, the average ageof separation was 2.8 years; 48% were separated before their first birth-day and 82% before their fifth. None of the twin pairs were separatedafter the age of 10.
The first wave of testing was conducted in two parts in 1984. Re-sponses to the first questionnaire were received from 724 intact twinpairs: 99 identical twins reared apart (MZA), 166 identical twinsreared together (MZT), 238 fraternal twins reared apart (DZA), and221 fraternal twins reared together (DZT). A second questionnaire was
mailed directly after receipt of the first; responses were received from576 intact twin pairs: 83 MZA, 136 MZT, 182 DZA, and 175 DZT. Thesecond wave of testing was conducted in 1987, with a single question-naire sent to all individuals who had not requested discontinuation ofparticipation. Responses were received from 532 intact twin pairs: 72MZA, 127 MZT, 178 DZA, and 155 DZT. An identical questionnairewas used for the third wave of testing in 1990. Responses were receivedfrom 474 intact twin pairs: 62 MZA, 114 MZT, 153 DZA, and 145DZT.
The average age of the twins was 58.6 years at the first wave of testing,ranging from 26 to 87 years. Forty percent of the sample was male and60% female. Initially, zygosity status was based on the physical sim-ilarity reported at the first wave. All twins older than 50 years, both ofwhom had responded to the first wave's questionnaires, were ap-proached for participation in a later health interview; during this healthinterview, in which approximately 50% of the first-wave twin pairs par-ticipated, all had their zygosity status determined by comparing serumproteins and red cell enzymes from blood assays. Zygosity was changedfor 8% of the sample on the basis of the assay results. Subsequent analy-ses comparing behavioral genetic results before and after the zygositychanges showed little difference in results. Further information concern-ing SATSA may be found in Pedersen et al. (1991).
MeasuresEach of the measures used in this study was translated into Swedish
by a professional translator and back-translated into English to ensurethat the meaning of the original items was retained.
Short form of the Eysenck Personality Inventory. The short form ofthe Eysenck Personality Inventory (Floderus, 1974) was used to mea-sure extraversion and neuroticism. Each scale consists of nine items,with a yes or no response format. Internal consistency as measured byCronbach's a was .66 for extraversion and .75 for neuroticism(Pedersen, Plomin, McClearn, & Friberg, 1988).
EAS Temperament Survey. The EAS Temperament Survey foradults (Buss & Plomin, 1984) assesses the temperament traits of dis-tress, fear, anger (the three composing an emotionality factor), activity,and sociability. Each trait is assessed with four items answered on a 5-point Likert scale. Buss and Plomin reported average 2-week test-retestreliability estimates of .81 for emotionality, .81 for activity, and .85 forsociability.
Karolinska scales oflmpulsivity, Monotony Avoidance, and Inhibitionof Aggression. Three scales were selected from the Karolinska Scalesof Personality (Schalling, Edman, & Asberg, 1983)—impulsivity, mo-notony avoidance, and inhibition of aggression—each measured on a5-point Likert scale. The impulsivity scale measures the individual'spropensity to act on the spur of the moment (e.g., "I tend to speak firstand think afterwards"). The monotony avoidance scale measures theindividual's desire to seek out novelty and excitement (e.g., "I amdrawn to places where exciting things happen"). Cronbach's a is .72 forimpulsivity and .76 for monotony avoidance (Pedersen et al., 1988).The inhibition of aggression scale is more accurately conceived of as ameasure of assertiveness rather than inhibited aggression, with itemssuch as, "If I'm treated badly at a restaurant I don't like to complain"and "I find it difficult to refuse when someone asks me to do somethingfor them even if I don't feel like doing it." Cronbach's a for inhibition ofaggression is .69 (Pedersen, Lichtenstein etal., 1989).
Framingham hard-driving. Five items, responded to on a 5-pointLikert scale, were adopted from the Framingham scale of Type A Be-havior (Haynes, Levine, Scotch, Feinleib, & Kanner, 1978) to assess thetrait of hard-driving. The hard-driving items measure the demands thatpeople put on themselves in their interactions with others (e.g., "I canbe described as domineering"). Cronbach's a for the hard-driving scaleis .70 (Pedersen, Lichtenstein, et al., 1989).
Luck, life direction, and responsibility. Twenty-three forced-choiceitems from the Rotter (1966) Locus of Control Scale were converted to
METATRAITS 675
46 Likert-type items; of these, 12 items (4 for each) were selected tomeasure the traits of Luck, Life Direction, and Responsibility. Thesethree scales previously were identified by Klockars and Varnum (1975)in a factor analysis of Rotter's scale. The Luck items assess the individ-ual's belief in the importance of luck in determining life events (e.g.,"Most people don't realize to what extent their lives are ruled bycoincidences"). The Life Direction items assess the individual's beliefin personal control over life events (e.g., "When I make plans I'm almostcertain that I can follow them through"). The Responsibility items areconcerned with personal responsibility for not having a successful careeror friendships ("People who are disliked don't know how to get on withothers"). Cronbach's as for Luck, Life Direction, and Responsibilityare .55, .49, and .66, respectively (Pedersen, Gatz, Plomin, Nesselroade,&McClearn,1989).
NEO openness. A shortened version of the Openness to Experiencescale from the NEO Personality Inventory (Costa & McCrae, 1985)was used. Of the original 48 items, 6 were retained. The validity of theshortened Openness to Experience scale was assessed by its correlationwith an adjective checklist, a method employed by McCrae and Costa(1985) for the original Openness to Experience scale. The correlationsfor the short and long versions of the scale did not differ significantly.Cronbach's a is .77 for the Openness to Experience scale (Bergeman etal., 1993).
OARS depression, somatic symptom, and alienation. The ShortPsychiatric Evaluation Schedule from the OARS (Duke University,1978) comprises three scales—depression, somatic symptom, andalienation—each assessed with five yes or no response-type items. Thedepression items are concerned with mood and sleep patterns; the so-matic-symptom items, with perceived healthfulness; and the alienationitems, with difficulty in interpersonal relations. Gatz, Pedersen, andHarris (1987) cite internal consistency (Cronbach's a) estimates of .57for depression, .64 for somatic symptom, and .72 for alienation.
Cook-Medley hostility. The original Cook-Medley Hostility Scale(Cook & Medley, 1954) contains 50 items; however, 10 items were re-tained on the basis of a factor analysis in which 5 items loaded highlyon a Paranoid Hostility factor, and 5 items loaded on a Cynicism factor.These 10 items were combined to create a hostility scale, each with a 5-point Likert-scale format. Examples include, for Paranoid Hostility, "Ihave a feeling that I've often been punished unjustly," and for Cynicism,"I think most people would lie to get ahead." Cronbach's a for the hos-tility scale is .83 (Pedersen, Lichtenstein, et al., 1989).
Life satisfaction. Life satisfaction was measured by 13 items, scoredon a 5-point Likert-type scale, taken from Wood, Wylie, and Sheafor(1969). One example is, "Most of my expectations have been filled."Cronbach's a for this scale is .81.
State anxiety. Three scales, adapted from Spielberger (1979), wereused to measure state anxiety: a 5-item state anxiety scale referring topositive affective states (e.g., "I feel relaxed"); a 5-item state anxietyscale referring to negative affective states (e.g., "I feel nervous"); anda total state anxiety scale that sums the positive and negative scales.Responses were obtained on a 5-point Likert-type scale.
Metatrait scales. The metatrait scales corresponding to each of the23 traits described above were constructed by calculating the standarddeviation of item responses for each individual. In addition, a metatraitfactor was created by conducting a principal components analysis of 21of the metatrait scales (leaving out state anxiety positive and negativebecause of their dependency on the state anxiety total score) and retain-ing the first component. This first principal component accounted for21% of the variance at the first occasion, 25% of the variance at thesecond occasion, and 26% of the variance at the third occasion. Themetatrait factor represents the general behavioral consistency of the in-dividual. However, given the great heterogeneity in the personality scalesused in this study, a comparable component for the trait scale has nomeaning and was not created.
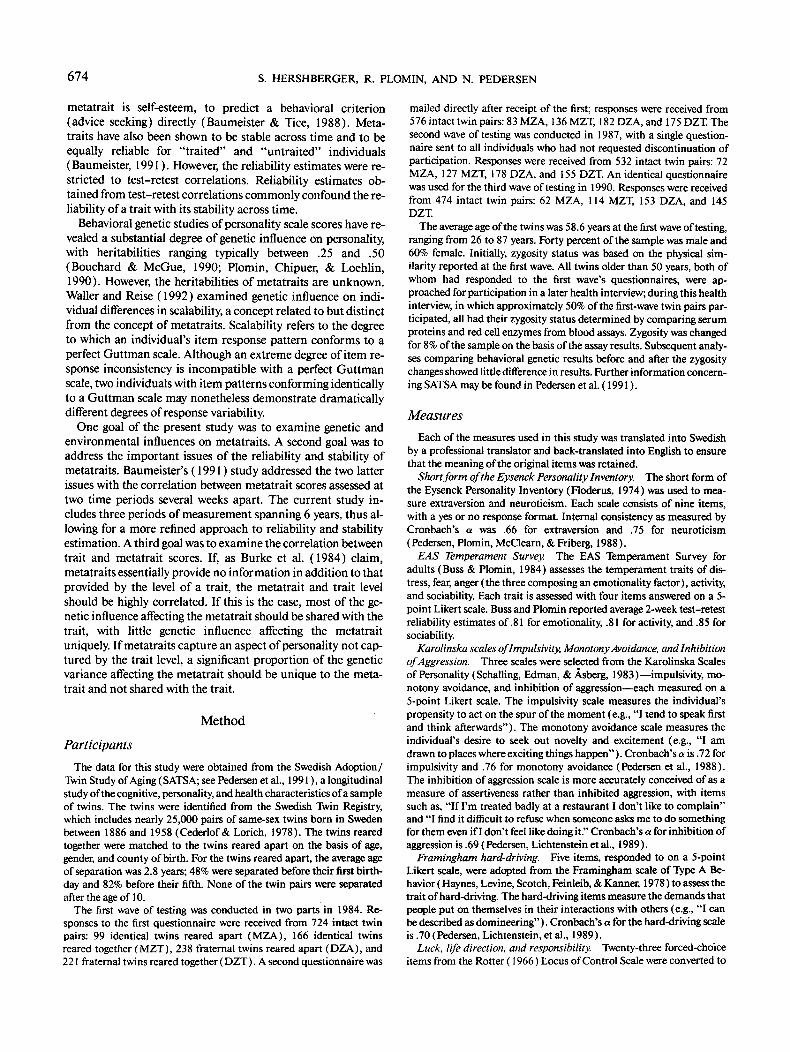
Figure 1. Reliability and stability model across three occasions ofmeasurement for metatraits and trait levels, where Xr = the true score;Xo = the observed score; r»x = the square root of the reliability coeffi-cient; j8 = the stability coefficient; and e - random error.
Model FittingTwo models were evaluated in the present study: The first model as-
sesses the reliability and stability of trait and metatrait scores; the sec-ond was a bivariate behavioral genetic model that indicates the degreeto which the observed correlation between traits and metatraits is dueto shared genetic and environmental influences.
Reliability and stability model. The model used to estimate the re-liability (rxx
2) of the trait and metatrait scores is shown in Figure 1. Inthis model, adapted from Heise (1969), at each of the three occasions,the observed score (Xo) is a linear function of the true score (XT) andrandom measurement error (e). The relationship between the truescores across time is represented by ft the coefficient of stability. Thismodel assumes, in accordance with the classical test theory model (e.g.,Allen & Yen, 1979), that random measurement error is uncorrelatedwith true scores and uncorrelated with the random measurement errorfrom other occasions. Although /32, and fe may be unequal, the reli-ability of the scores is assumed constant across time. In addition, thedisturbances from the second and third occasions are also assumed tobe equal. The model may then be tested with one (fe # /832) or two (/321= /332) degrees of freedom. The model of Figure 1 was evaluated by themodel-fitting program LISREL 8 (Joreskog & Sorbom, 1993), whichprovides maximum-likelihood estimates of the parameters.
Bivariate behavioral genetic model. The linear model underlyingquantitative genetic theory posits that the variance in a phenotype maybe partitioned into genetic and environmental sources (Plomin, De-Fries, & McClearn, 1990). When two or more phenotypes are analyzedsimultaneously, the degree of shared genetic and environmental sourcesamong the phenotypes can be determined as well. In this study, a bivar-iate model-fitting analysis was conducted on the covariance betweentrait and metatrait scores to determine (a) the proportion of varianceattributable uniquely to genetic and environmental sources for meta-traits, and (b) the extent of shared genetic and environmental sourcesof variance between trait and metatrait scores.
To conduct a quantitative genetic analysis, the correlations betweenrelatives of varying genetic relatedness are required. When the relativeshave been exposed to differing environments, further information of theeffect of the environment is obtained. With MZ and DZ twins rearedapart and together, the SATS A study provides a powerful design to assessgenetic and environmental parameters. The first parameter, additive ge-netic effects (A), represents the additive (or summative) influence ofthe multiple genes affecting the phenotype. Identical twins share all theirgenetic effects and have a unit correlation for additive genetic effects;fraternal twins share, on average, 50% of their genes and are correlated.50 for additive genetic effects.
The second parameter, nonadditive genetic effects, or dominance
676 S. HERSHBERGER, R. PLOMIN, AND N. PEDERSEN
MZ=1 DZ=.5
Trait LevelScore
MetatraitScore
MetatraitScore
Trait LevelScore
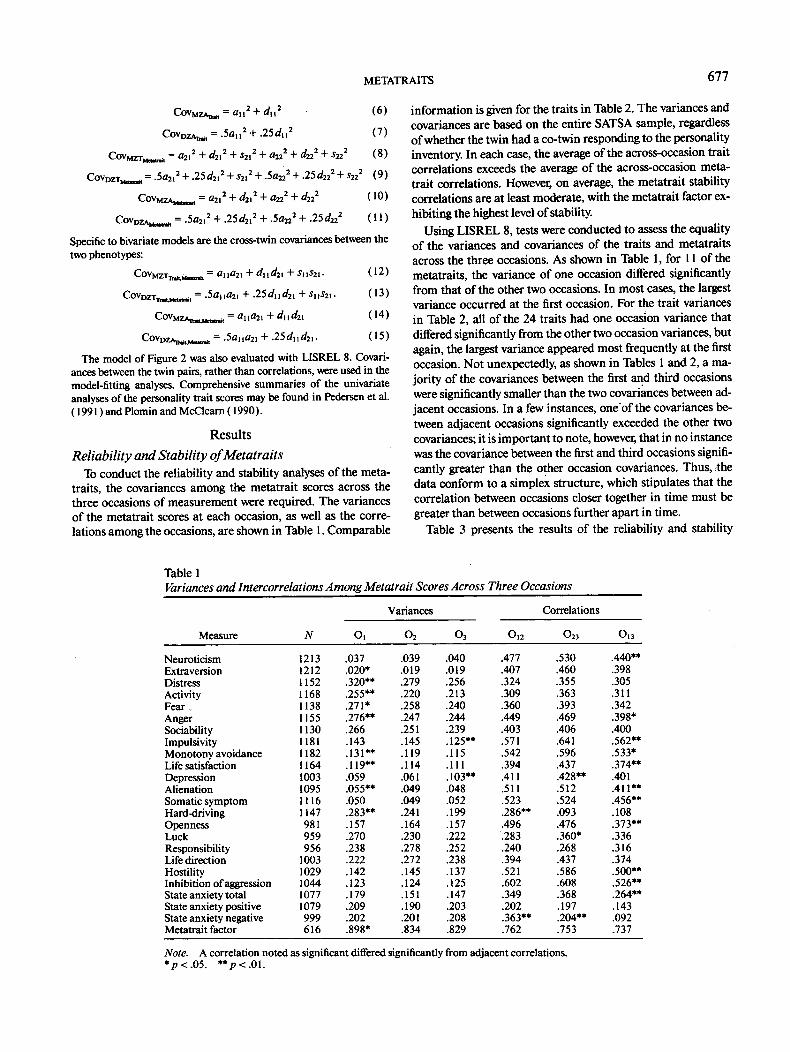
MZ=1 DZ=.5Figure 2. Bivariate path model showing common and unique factors for genetic and environmentalsources of variance and covariance for trait levels and metatraits. Latent variables Ens, A, D, and Esrefer to nonshared environmental, additive genetic, nonadditive genetic, and shared rearing environmentaleffects, respectively. All primed (') symbols refer to the co-twin.
(D), refers to the nonlinear interaction between alleles at the same lo-cus. Identical twins are again correlated unity for nonadditive domi-nance effects, whereas fraternal twins are, on average, correlated .25 fornonadditive dominance effects. In general, significant genetic effects ona phenotype are indicated when the identical twin correlation signifi-cantly exceeds the fraternal twin correlation. When the concern is withthe genetic mediation between two phenotypes, a greater identical twincross-correlation (the correlation between one twin's metatrait scoreand the co-twin's trait scale score) is indicative of significant sharedgenetic effects.
The third parameter, shared-rearing environmental effects (Es), re-fers to environmental factors that produce similarities in siblings rearedtogether. By definition, twins reared together, MZT and DZT, are corre-lated unity for shared-rearing environmental effects; twins reared apart,MZA and DZA, are correlated zero. Thus, if the shared-rearing envi-ronment is significant, the average of the MZT and DZT correlationsshould exceed the average of the MZA and DZA correlations. Analo-gously, if the average of the MZT and DZT cross-correlations exceedsthe average of the MZA and DZA cross-correlations, the correlationbetween the two phenotypes is mediated by significant shared-rearingenvironmental effects.
The fourth parameter, nonshared environmental effects (Ens), refersto environmental effects that contribute to a lack of twin resemblance.The correlation for each of the twin types attributable to nonsharedenvironmental effects is therefore zero. Unsystematic measurement er-ror (unreliability), itself an effect that cannot contribute to the correla-tion between the twins, must by necessity inflate the estimate of thenonshared environment when no information is included in the analy-sis concerning reliability of measurement.
Figure 2 presents the bivariate model of trait and metatrait scores.The bivariate (or Cholesky) model is commonly used in quantitativegenetic analyses (Neale & Cardon, 1992) and allows for the decomposi-tion of the correlation between two phenotypes into components ofvariance shared between the phenotypes and unique to one of the phe-notypes. It should be noted that only sources of variance unique to onephenotype are identifiable in the Cholesky model with the four twintypes; the metatraits were selected for the identification of unique effectsbecause of the emphasis of this study o"n the properties of metatraits.Each of the four parameters discussed previously is included in themodel. Path coefficients subscripted with 22 represent effects unique tothe metatrait scores. Path coefficients subscripted with 11 or 12 repre-sent effects emanating from factors shared by the two phenotypes.
Thus, the model of Figure 2 implies the following variances of thetraits and metatraits, as well as their covariance:
Var,
VarTtait = nu2 + au
2 + dn2 + sn2. (1)
= «2l2 + fl2i2 + ^212 + *212 + «222 + <Z222 + ^222 + .S222- (2 )
C0VT + S,,S2I. (3)
The model of Figure 2 also implies the following twin covariance traits(Equations 4 through 7) and twin covariances for the metatraits(Equations 8 through 11):
CovM a,,2 + dn2 +
CovDZTTniii = .5an2 + .25 dn
2
(4)
(5)
METATRAITS 677
, = an2 + d2x2
.5a2i2 2
s2l2 + a22
2
(7)
d222 + s22
2 (8)
+ s2l2 + .5fl22
2 + -25d222 + s22
2 (9)
= a2l2 + d2,2 + a22
2 + d222 (10)
.5a2 .25d2t2 .5a22
2 .25d222 (11)
+dud2l +sns2i.
CovDZTltailJiltuli>it = .5a, ifl2i + -25 d,, d2x
i +dud2l
.25dud2l.
COVDZAM
Specific to bivariate models are the cross-twin covariances between thetwo phenotypes:
(12)
(13)
(14)
(15)
The model of Figure 2 was also evaluated with LISREL 8. Covari-ances between the twin pairs, rather than correlations, were used in themodel-fitting analyses. Comprehensive summaries of the univariateanalyses of the personality trait scores may be found in Pedersen et al.(1991) and Plomin and McClearn (1990).
ResultsReliability and Stability of Metatraits
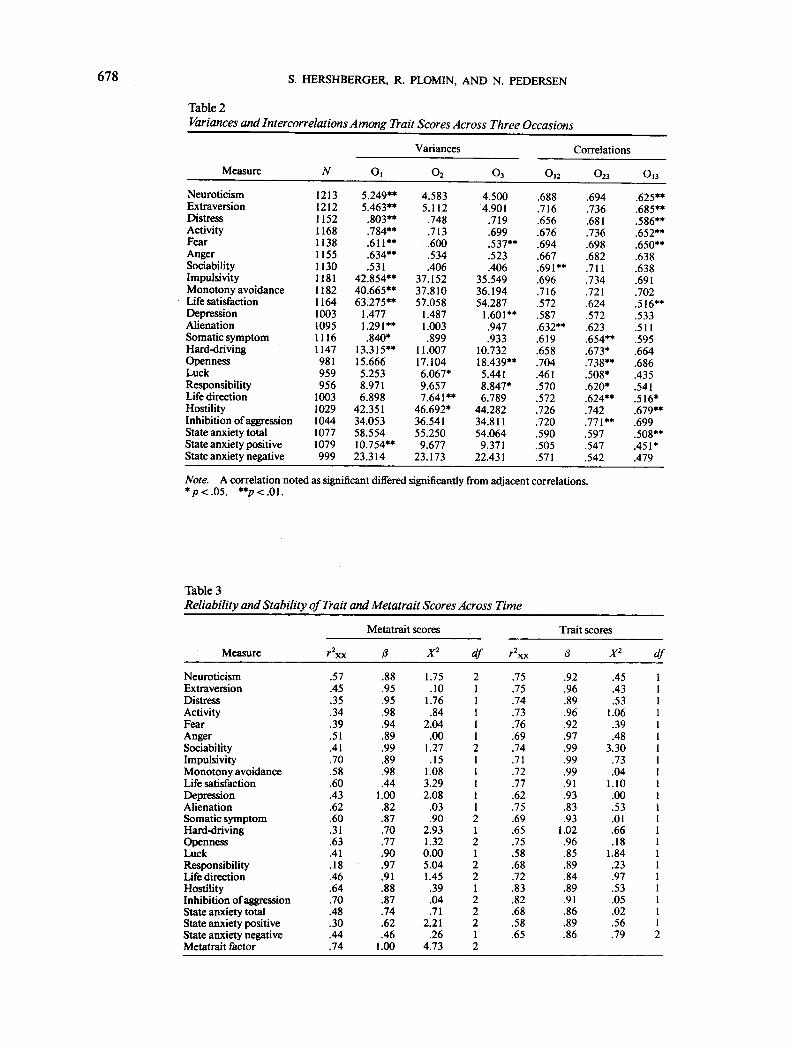
To conduct the reliability and stability analyses of the meta-traits, the covariances among the metatrait scores across thethree occasions of measurement were required. The variancesof the metatrait scores at each occasion, as well as the corre-lations among the occasions, are shown in Table 1. Comparable
information is given for the traits in Table 2. The variances andcovariances are based on the entire SATSA sample, regardlessof whether the twin had a co-twin responding to the personalityinventory. In each case, the average of the across-occasion traitcorrelations exceeds the average of the across-occasion meta-trait correlations. However, on average, the metatrait stabilitycorrelations are at least moderate, with the metatrait factor ex-hibiting the highest level of stability.
Using LISREL 8, tests were conducted to assess the equalityof the variances and covariances of the traits and metatraitsacross the three occasions. As shown in Table 1, for 11 of themetatraits, the variance of one occasion differed significantlyfrom that of the other two occasions. In most cases, the largestvariance occurred at the first occasion. For the trait variancesin Table 2, all of the 24 traits had one occasion variance thatdiffered significantly from the other two occasion variances, butagain, the largest variance appeared most frequently at the firstoccasion. Not unexpectedly, as shown in Tables 1 and 2, a ma-jority of the covariances between the first and third occasionswere significantly smaller than the two covariances between ad-jacent occasions. In a few instances, one of the covariances be-tween adjacent occasions significantly exceeded the other twocovariances; it is important to note, however, that in no instancewas the covariance between the first and third occasions signifi-cantly greater than the other occasion covariances. Thus, thedata conform to a simplex structure, which stipulates that thecorrelation between occasions closer together in time must begreater than between occasions further apart in time.
Table 3 presents the results of the reliability and stability
Table 1Variances and Intercorrelations Among Metatrait Scores Across Three Occasions
Measure
NeuroticismExtraversionDistressActivityFearAngerSociabilityImpulsivityMonotony avoidanceLife satisfactionDepressionAlienationSomatic symptomHard-drivingOpennessLuckResponsibilityLife directionHostilityInhibition of aggressionState anxiety totalState anxiety positiveState anxiety negativeMetatrait factor
N
12131212115211681138115511301181118211641003109511161147981959956
10031029104410771079999616
o,.037.020*.320**.255**.271*.276**.266.143.131**.119**.059.055**.050.283**.157.270.238.222.142.123.179.209.202.898*
Variances
o2
.039
.019
.279
.220
.258
.247
.251
.145
.119
.114
.061
.049
.049
.241
.164
.230
.278
.272
.145
.124
.151
.190
.201
.834
o3
.040
.019
.256
.213
.240
.244
.239
.125**
.115
.111
.103**
.048
.052
.199
.157
.222
.252
.238
.137
.125
.147
.203
.208
.829
O,2
.477
.407
.324
.309
.360
.449
.403
.571
.542
.394
.411
.511
.523
.286**
.496
.283
.240
.394
.521
.602
.349
.202
.363**
.762
Correlations
O23
.530
.460
.355
.363
.393
.469
.406
.641
.596
.437
.428**
.512
.524
.093
.476
.360*
.268
.437
.586
.608
.368
.197
.204**
.753
o13
.440**
.398
.305
.311
.342
.398*
.400
.562**
.533*
.374**
.401
.411**
.456**
.108
.373**
.336
.316
.374
.500**
.526**
.264**
.143
.092
.737
Note. A correlation noted as significant differed significantly from adjacent correlations.*p<.05. **p<.0l.
678 S. HERSHBERGER, R. PLOMIN, AND N. PEDERSEN
Table 2Variances and Intercorrelations Among Trait Scores Across Three Occasions
Measure
NeuroticismExtraversionDistressActivityFearAngerSociabilityImpulsivityMonotony avoidanceLife satisfactionDepressionAlienationSomatic symptomHard-drivingOpennessLuckResponsibilityLife directionHostilityInhibition of aggressionState anxiety totalState anxiety positiveState anxiety negative
N
12131212115211681138115511301181118211641003109511161147981959956
10031029104410771079999
o,5.249*5.463*
.803*'
.784*'
.611*"
.634*'
.53142.854*"40.665*"63.275"
1.4771.291*'.840*
13.315*11
15.6665.2538.9716.898
42.35134.05358.55410.754"23.314
Variances
o2
* 4.583• 5.112" .748* .713* .600* .534
.406* 37.152' 37.810* 57.058
1.4871.003.899
11.00717.1046.067*9.6577.641**
46.692*36.54155.2509.677
23.173
o3
4.5004.901
.719
.699
.537**
.523
.40635.54936.19454.287
1.601**.947.933
10.73218.439**5.4418.847*6.789
44.28234.81154.0649.371
22.431
.688
.716
.656
.676
.694
.667
.691**
.696
.716
.572
.587
.632**
.619
.658
.704
.461
.570
.572
.726
.720
.590
.505
.571
Correlations
o23
.694
.736
.681
.736
.698
.682
.711
.734
.721
.624
.572
.623
.654**
.673*
.738**
.508*
.620*
.624**
.742
.771**
.597
.547
.542
O,,
.625**
.685**
.586**
.652**
.650**
.638
.638
.691
.702
.516**
.533
.511
.595
.664
.686
.435
.541
.516*
.679**
.699
.508**
.451*
.479
Note. A correlation noted as significant differed significantly from adjacent correlations.*p<.05. **p<.0l.
Table 3Reliability and Stability of Trait and Metatrait Scores Across Time
Measure
NeuroticismExtraversionDistressActivityFearAngerSociabilityImpulsivityMonotony avoidanceLife satisfactionDepressionAlienationSomatic symptomHard-drivingOpennessLuckResponsibilityLife directionHostilityInhibition of aggressionState anxiety totalState anxiety positiveState anxiety negativeMetatrait factor
. 2' XX
.57
.45
.35
.34
.39
.51
.41
.70
.58
.60
.43
.62
.60
.31
.63
.41
.18
.46
.64
.70
.48
.30
.44
.74
Metatrait scores
.88
.95
.95
.98
.94
.89
.99
.89
.98
.441.00.82.87.70.77.90.97.91.88.87.74.62.46
1.00
X2
1.75.10
1.76.84
2.04.00
1.27.15
1.083.292.08
.03
.902.931.320.005.041.45.39.04.71
2.21.26
4.73
df
211111211111212122122212
r XX
.75
.75
.74
.73
.76
.69
.74
.71
.72
.77
.62
.75
.69
.65
.75
.58
.68
.72
.83
.82
.68
.58
.65
Trait scores
/3
.92
.96
.89
.96
.92
.97
.99
.99
.99
.91
.93
.83
.931.02.96.85.89.84.89.91.86.89.86
X2 c
.45
.43
.531.06.39.48
3.30.73.04
1.10.00.53.01.66.18
1.84.23.97.53.05.02.56.79 :
VI
>

METATRAITS 679
analyses of the trait and metatrait scores. The reliability of avariable is a function of the intercorrelations across the threeoccasions and is given by ( r ^ ^ / r u , for example, in the caseof the neuroticism metatrait, (.48 X .53)/.44 = .57. The reli-abilities of the metatraits vary widely, ranging from .18 for re-sponsibility to .74 for the metatrait factor. The trait reliabilitiesvary less widely, from .58 for luck to .83 for hostility. For eachvariable, the reliability of the trait scores exceeded the reliabilityof the metatrait scores.
The stability of the variables is, as in the case of reliability, afunction of the correlations between occasions. For example, •the stability of the neuroticism metatrait between the first twooccasions (/82i) is given by r13/r23 and between the second andthird occasions ( f e ) by r,3/r ,2 , or .44/.53 = .83and.44/.48 =.92, respectively. The average of these two stability coefficientsis equal to .88, the average of the maximum-likelihood esti-mates of the stability coefficients obtained from the model fit-ting. For a majority of the variables, the stabilities of the meta-trait scores were within 10 points of the stabilities of the traitscores, the trait stabilities generally exceeding the metatrait sta-bilities. Notably, the metatrait stabilities of life satisfaction,hard-driving, openness, state anxiety positive, and state anxietynegative were more than 10 points lower than the comparabletrait stabilities. All of the models fit from Table 3 had nonsig-nificant chi-squares, indicating that the reliability-stabilitymodel fit the data acceptably for all variables.
In conclusion, although some of the test-retest reliabilities ofthe metatraits were barely acceptable, others were close to thegenerally more reliable trait scale scores. On the other hand,traits and metatraits differ less in stability, with the stability ofmetatraits on the whole only slightly less than that of traits.
Correlation Between Traits and Metatraits
One goal of the present analysis was to determine to whatextent the correlation between traits and metatraits is mediatedgenetically. But a question that arises is this: Does the (linear)correlation between traits and metatraits capture adequatelythe relationship between the two? Past research suggested astrong nonlinear component to the correlation, resulting fromthe improbability of receiving a high metatrait score at the ex-tremes of the trait level. To the degree that this is so, the linearcorrelation may underestimate the true relationship, possiblyleading to the underestimation of shared genetic influence.Thus, to determine if a significant nonlinear component under-lies the relationship between traits and metatraits, hierarchicalmultiple regressions were conducted, with the metatrait scorefirst regressed onto the trait score alone and, in a second step,regressed onto both the trait score and the square of the traitscore to detect the presence of a significant quadratic relation-ship. The cube of the trait score was added in the equation in athird step to detect a significant cubic relationship. Results fromthe regression analyses are presented in correlational form inTable 4.
The correlations presented in the table are the semipartialcorrelations between the traits and metatraits from the step atwhich a term entered the equation. It is important to note thatthe linear relationship between the trait and metatrait scoreshas been partialed from the quadratic correlation and that thelinear and quadratic have both been partialed from the cubic
Table 4Semipartial Correlations Between Trait and Metatrait Scores
Measure 'Quadratic tubic N
NeuroticismExtraversionDistressActivityFearAngerSociabilityImpulsivityMonotony avoidanceLife satisfactionDepressionAlienationSomatic symptomHard-drivingOpennessLuckResponsibilityLife directionHostilityInhibition of aggressionState anxiety totalState anxiety positiveState anxiety negative
.54
.Ola
.24
.15
.29
.06a
.28
.17
.26
.28
.62
.72
.75
.38
.14
.07a
.08a
.24
.31-.15
.51
.33
.55
-.95-.96-.45-.41-.43-.43
.41-.21-.17-.24-.98-.98-.98-.52-.21-.06a-.18-.23-.20
.15-.38
.26-.44
.50
.02a
.02a
.04a
.01a
.06a-.12a
.05a
.09
.04a
.58-.55-.67
.17
.07a
.08a-.00a
.07a
.07a
.05a
.11-.09
.17
689690655649649644638667672654556615631661427412417444455478458488479
Note, p < .05 for all correlations unless indicated otherwise, a = notsignificant.
correlation. This is important because, with the exception ofluck, which did not have a significant linear, quadratic, or cubiccorrelation, each of the quadratic correlations and several of thecubic correlations were significant. Indeed, in most cases, thequadratic term not only added significantly to the regressionequation, it also was significantly greater than the value of thelinear term. Furthermore, three scales—extraversion, anger,and responsibility—had a significant quadratic but not a sig-nificant linear correlation. For these three variables, the rela-tionship between traits and metatraits resembled an inverted U-shaped function, illustrated most dramatically by extraversion.Figure 3 shows the plot of extraversion metatrait scores againsttrait scores. The general shape of the function for variables withan additional, significant cubic term did not differ from thosewith a significant quadratic term, illustrated in Figure 4 bydepression.
Given the existence of significant nonlinear correlations fornearly all the scales, the question remained whether the magni-tude of the shared genetic influence would be underestimated ifthe linear correlation were used for the analysis. To examinethis, modeling analyses were conducted on both the linear andquadratic correlations for extraversion, a trait for which the lin-ear correlation did not differ from zero and the quadratic cor-relation was near unity, and for life direction, for which the cor-relations were approximately equal.
Behavioral Genetic Model-Fitting Analyses
Model-fitting analyses of the model depicted in Figure 2 wereconducted with the covariances between twins, computed froma double-entry data file from the first wave of data collection,shown in Table 5. All twin data were corrected for the effects of

680 S. HERSHBERGER, R. PLOMIN, AND N. PEDERSEN
0.6 H
0.5-
0.4
0.3-
0.2-
0.1 -
0.0-
011
I2
13
14
Trait
1—5
Level
— i —6
17
18
19
Figure 3. The relationship between extroversion metatrait scores and trait level scores.
age, gender, and the Age X Gender interaction within each twingroup separately.
The standardized maximum-likelihood path coefficientsfrom the modeling analyses are presented in Table 6. The chi-square goodness-of-fit test indicated a good fit of the model for17 of the 24 variables. Note that the metatrait factor was ana-lyzed under a univariate model.
To calculate the proportion of genetic and environmentalvariance attributable uniquely to the metatrait scores, each ofthe paths leading to the metatrait were squared and summed.For example, for neuroticism, the proportion of variance
caused by additive genetic effects is a2i2 + #222 (- . 162 + .002 =.03); the proportion of variance caused by nonadditive effectsis cfei2 + fi?222(--562 + .002 = .31); the proportion of variancecaused by the shared-rearing environment is 52i2 + s222(—.232
+ .002) = .05; and the proportion of variance caused by non-shared environmental effects is «2i2 + «222(-352 + —.702 = .61).The results of these univariate calculations for the 24 metatraitsare presented in Table 7.
On average, 15% of the variance in the metatrait scores wasattributable to genetic influence (6% to additive effects and 9%to nonadditive effects); 5% to shared-rearing environmental in-
0.6-1
0.5-
0.4-
0.3-
0.2-
0.1-
0.0-2 3Trait Level
Figure 4. The relationship between depression metatrait scores and trait level scores.
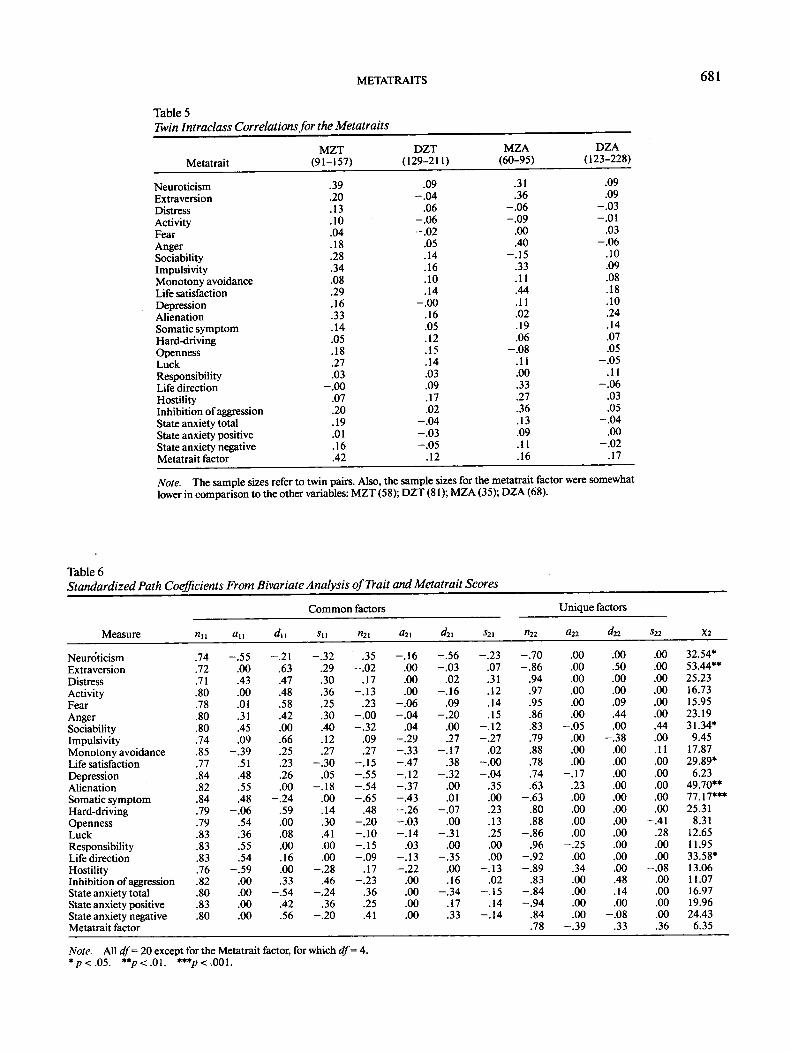
Table 5
METATRAITS
Twin Intraclass Correlations for the Metatraits
Metatrait
NeuroticismExtraversionDistressActivityFearAngerSociabilityImpulsivityMonotony avoidanceLife satisfactionDepressionAlienationSomatic symptomHard-drivingOpennessLuckResponsibilityLife directionHostilityInhibition of aggressionState anxiety totalState anxiety positiveState anxiety negativeMetatrait factor
MZT(91-157)
.39
.20
.13
.10
.04
.18
.28
.34
.08
.29
.16
.33
.14
.05
.18
.27
.03- .00
.07
.20
.19
.01
.16
.42
DZT(129-211)
.09- .04
.06- .06- .02
.05
.14
.16
.10
.14- .00
.16
.05
.12
.15
.14
.03
.09
.17
.02- .04- .03- .05
.12
MZA(60-95)
.31
.36- .06- .09
.00
.40- .15
.33
.11
.44
.11
.02
.19
.06- .08
.11
.00
.33
.27
.36
.13
.09
.11
.16
DZA(123-228)
.09
.09- .03- .01
.03- .06
.10
.09
.08
.18
.10
.24
.14
.07
.05- .05
.11—.06
.03
.05- .04
.00- .02
.17
681
Note The sample sizes refer to twin pairs. Also, the sample sizes for the metatrait factor were somewhatlower in comparison to the other variables: MZT (58); DZT (81); MZA (35); DZA (68).
Table 6Standardized Path Coefficients From Bivariate Analysis of Trait and Metatrait Scores
Common factors Unique factors
Measure
NeuroticismExtraversionDistressActivityFearAngerSociabilityImpulsivityMonotony avoidanceLife satisfactionDepressionAlienationSomatic symptomHard-drivingOpennessLuckResponsibilityLife directionHostilityInhibition of aggressionState anxiety totalState anxiety positiveState anxiety negativeMetatrait factor
«n
.74
.72
.71
.80
.78
.80
.80
.74
.85
.77
.84
.82
.84
.79
.79
.83
.83
.83
.76
.82
.80
.83
.80
On
-.55.00.43.00.01.31.45.09
-.39.51.48.55.48
-.06.54.36.55.54
-.59.00.00.00.00
dn
-.21.63.47.48.58.42.00.66.25.23.26.00
-.24.59.00.08.00.16.00.33
-.54.42.56
S\\
-.32.29.30.36.25.30.40.12.27
-.30.05
-.18.00.14.30.41.00.00
-.28.46
-.24.36
-.20
"21
.35-.02
.17-.13
.23-.00-.32
.09
.27-.15-.55-.54-.65
.48-.20-.10-.15-.09
.17-.23
.36
.25
.41
«21
- .16.00.00.00
- .06- .04
.04- .29- .33- .47- .12- .37- .43- .26- .03- .14
.03- .13- .22
.00
.00
.00
.00
4 i
- .56- .03
.02- .16
.09- .20
.00
.27- .17
.38- .32
.00
.01- .07
.00-.31
.00-.35
.00
.16-.34
.17
.33
•S21
- .23.07.31.12.14.15
- .12- .27
.02- .00-.04
.35
.00
.23
.13
.25
.00
.00-.13
.02-.15
.14-.14
«22
-.70-.86
.94
.97
.95
.86
.83
.79
.88
.78
.74
.63-.63
.80
.88-.86
.96-.92-.89
.83-.84-.94
.84
.78
«22
.00
.00
.00
.00
.00
.00-.05
.00
.00
.00-.17
.23
.00
.00
.00
.00-.25
.00
.34
.00
.00
.00
.00-.39
dn
.00
.50
.00
.00
.09
.44
.00- .38
.00
.00
.00
.00
.00
.00
.00
.00
.00
.00
.00
.48
.14
.00- .08
.33
*22
.00
.00
.00
.00
.00
.00
.44
.00
.11
.00
.00
.00
.00
.00- .41
.28
.00
.00- .08
.00
.00
.00
.00
.36
X2
32.54*53.44**25.2316.7315.9523.1931.34*
9.4517.8729.89*6.23
49.70**77.17***25.318.31
12.6511.9533.58*13.0611.0716.9719.9624.436.35
Note. All df= 20 except for the Metatrait factor, for which df= 4.*/><.05. **p<.01. ***p<.001.
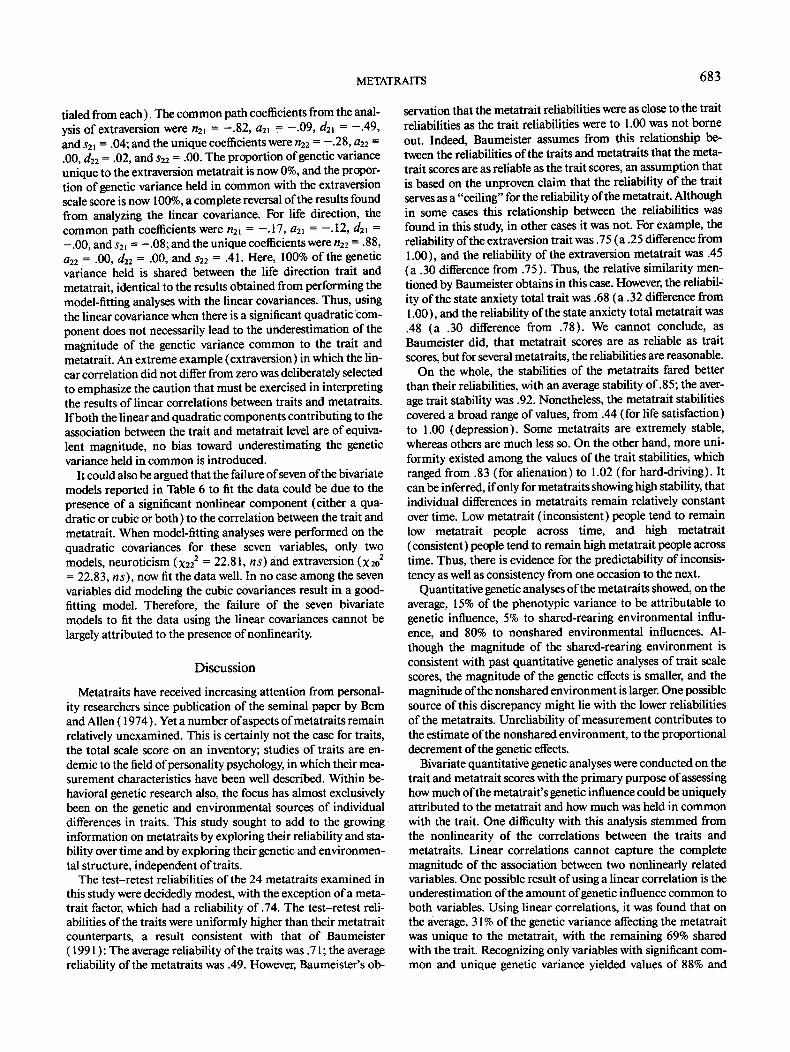
682 S. HERSHBERGER, R. PLOMIN, AND N. PEDERSEN
Table 7Proportions of Variance Attributable to Genetic andEnvironmental Sources for Metatraits
Metatrait
NeuroticismExtraversionDistressActivityFearAngerSociabilityImpulsivityMonotony avoidanceLife satisfactionDepressionAlienationSomatic symptomHard-drivingOpennessLuckResponsibilityLife directionHostilityInhibition of aggressionState anxiety totalState anxiety positiveState anxiety negativeMetatrait factor
A
30000008
11225
191880262
160000
15
D
3126
032
230
223
14100000
100
120
26143
1211
Es
50
101
Is)
221
7100
1205
19130020221
13
Ens
617490969675796385648569828781759486827484958761
Note. A = additive genetic variance; D = dominance variance; Es =shared environmental variance; Em = nonshared environmental vari-ance.
fluence; and 80% to nonshared environmental influence. Al-though the value of 15% for the average degree of variance ex-plained by genetic sources may appear to be on the low side,genetic influence varied dramatically among the metatraits,ranging from a total of 36% for life satisfaction to 0% for dis-tress, sociability, and openness to experience. Thus, whereas ge-netic influence may be relatively unimportant for some meta-traits (as is the case for some trait scale scores), it is quite im-portant for others. Shared-rearing environment was on theaverage low, similar to its magnitude for the trait scale score,although the value of 21% for the sociability metatrait is nearlytwice the value found for the sociability scale score (cf. Plomin,Pedersen, McClearn, Nesselroade, & Bergeman, 1988). Notunexpectedly, the proportion of variance caused by nonsharedenvironmental effects is high throughout, in part caused by un-reliability of measurement.
To calculate the proportion of genetic influence that is com-mon to traits and metatraits, and the proportion of genetic vari-ance that is unique to the metatrait, the genetic path coefficientsthat lead to the metatrait (e.g., a2i, a22, d2l, d22) were squaredand summed. This again represents the total amount of geneticvariance affecting the metatrait. The square of fhe path coeffi-cients a22 and d22, paths that are unique to the metatrait, is anestimate of the metatrait's genetic variance that is not sharedwith the trait. Therefore, (a22
2 + d222)/(a2
2 + a2i2 + d22 +
d222) is an estimate of the proportion of genetic variance that isunique to the metatrait. The remainder of the genetic varianceis due to genetic influence shared with the trait. For example,the sum of the four squared genetic path coefficients leading to
impulsivity (a22 + a22
2 + d2,2 + d222 or - .292 + .272 + .OO2 +
-.382) is .30 (the heritability of the impulsivity metatrait). Thesquare of the genetic paths unique to impulsivity {a22 + d22 or.002 + -.382) is .14. Then .14/.30, or 48% of the varianceaffecting the impulsivity metatrait is unique to the metatrait.The residual, 52%, is the proportion of genetic variance themetatrait shares with the trait. The results of these calculationsfor the common and unique genetic proportions of variance areshown in Table 8.
According to the results of Table 8, an average of approxi-mately 31% of the genetic variance is unique to the metatraitscores; 69% of the genetic variance is held in common with thetrait scale scores. The genetic variance unique to the metatraitscores appears to be less than half the magnitude of the geneticvariance shared with the trait scores. However, a number of theproportions in Table 8, particularly several 100% proportionsunder the column for common variance, are not significant onthe basis of the results of chi-square difference tests removingthe relevant parameters from the model. For example, although100% of the genetic variance is held in common for activity andopenness to experience, the total amount of genetic varianceis extremely small, 3% and nearly 0%, respectively. If only thevariables with significant common genetic variance are aver-aged, the average rises from 69% to 88%. On the other hand, if acomparable average is calculated only for variables with sig-nificant unique genetic variance, the average rises from 39% to84%. Notably, only one variable, impulsivity, had both signifi-cant common and significant unique genetic variance.
Separate modeling analyses were conducted with the covari-ance between extraversion and life direction metatrait scoresand squared trait scale scores (with the linear component par-
Table 8Proportion of Genetic Influence Common to Trait andMetatrait Scores and Unique to Metatrait Scores
Measure
NeuroticismExtraversionDistressActivityFearAngerSociabilityImpulsivityMonotony avoidanceLife satisfactionDepressionAlienationSomatic symptomHard-drivingOpennessLuckResponsibilityLife directionHostilityInhibition of aggressionState anxiety totalState anxiety positiveState anxiety negative
Common
100*0
10010059183952*
100*100*66*72*
100*100*100100*
1100*
141086*
10078*
Unique
0100*
00
4182*6148*
00
3428
0000
99*0
86*90*140
22
Note. Significant proportions based on Xdartest, df=1.*p<.05.
METATRAITS 683
tialed from each). The common path coefficients from the anal-ysis of extraversion were n2i = -.82, a2i = -.09, d2x = -.49,and S21 = .04; and the unique coefficients were «22 = -.28,022 =.00, d22 = .02, and s22 = 00. The proportion of genetic varianceunique to the extraversion metatrait is now 0%, and the propor-tion of genetic variance held in common with the extraversionscale score is now 100%, a complete reversal of the results foundfrom analyzing the linear covariance. For life direction, thecommon path coefficients were n2l = -.17, a2i = -.12, d2x =-.00, and s2i = -.08; and the unique coefficients were n22 = .88,a22 = .00, d22 = .00, and s22 = .41. Here, 100% of the geneticvariance held is shared between the life direction trait andmetatrait, identical to the results obtained from performing themodel-fitting analyses with the linear covariances. Thus, usingthe linear covariance when there is a significant quadratic com-ponent does not necessarily lead to the underestimation of themagnitude of the genetic variance common to the trait andmetatrait. An extreme example (extraversion) in which the lin-ear correlation did not differ from zero was deliberately selectedto emphasize the caution that must be exercised in interpretingthe results of linear correlations between traits and metatraits.If both the linear and quadratic components contributing to theassociation between the trait and metatrait level are of equiva-lent magnitude, no bias toward underestimating the geneticvariance held in common is introduced.
It could also be argued that the failure of seven of the bivariatemodels reported in Table 6 to fit the data could be due to thepresence of a significant nonlinear component (either a qua-dratic or cubic or both) to the correlation between the trait andmetatrait. When model-fitting analyses were performed on thequadratic covariances for these seven variables, only twomodels, neuroticism {\22
2 = 22.81, ns) and extraversion (X202
= 22.83, ns), now fit the data well. In no case among the sevenvariables did modeling the cubic covariances result in a good-fitting model. Therefore, the failure of the seven bivariatemodels to fit the data using the linear covariances cannot belargely attributed to the presence of nonlinearity.
Discussion
Metatraits have received increasing attention from personal-ity researchers since publication of the seminal paper by Bernand Allen (1974). Yet a number of aspects of metatraits remainrelatively unexamined. This is certainly not the case for traits,the total scale score on an inventory; studies of traits are en-demic to the field of personality psychology, in which their mea-surement characteristics have been well described. Within be-havioral genetic research also, the focus has almost exclusivelybeen on the genetic and environmental sources of individualdifferences in traits. This study sought to add to the growinginformation on metatraits by exploring their reliability and sta-bility over time and by exploring their genetic and environmen-tal structure, independent of traits.
The test-retest reliabilities of the 24 metatraits examined inthis study were decidedly modest, with the exception of a meta-trait factor, which had a reliability of .74. The test-retest reli-abilities of the traits were uniformly higher than their metatraitcounterparts, a result consistent with that of Baumeister(1991): The average reliability of the traits was .71; the averagereliability of the metatraits was .49. However, Baumeister's ob-
servation that the metatrait reliabilities were as close to the traitreliabilities as the trait reliabilities were to 1.00 was not borneout. Indeed, Baumeister assumes from this relationship be-tween the reliabilities of the traits and metatraits that the meta-trait scores are as reliable as the trait scores, an assumption thatis based on the unproven claim that the reliability of the traitserves as a "ceiling" for the reliability of the metatrait. Althoughin some cases this relationship between the reliabilities wasfound in this study, in other cases it was not. For example, thereliability of the extraversion trait was .75 (a .25 difference from1.00), and the reliability of the extraversion metatrait was .45(a .30 difference from .75). Thus, the relative similarity men-tioned by Baumeister obtains in this case. However, the reliabil-ity of the state anxiety total trait was .68 (a .32 difference from1.00), and the reliability of the state anxiety total metatrait was.48 (a .30 difference from .78). We cannot conclude, asBaumeister did, that metatrait scores are as reliable as traitscores, but for several metatraits, the reliabilities are reasonable.
On the whole, the stabilities of the metatraits fared betterthan their reliabilities, with an average stability of .85; the aver-age trait stability was .92. Nonetheless, the metatrait stabilitiescovered a broad range of values, from .44 (for life satisfaction)to 1.00 (depression). Some metatraits are extremely stable,whereas others are much less so. On the other hand, more uni-formity existed among the values of the trait stabilities, whichranged from .83 (for alienation) to 1.02 (for hard-driving). Itcan be inferred, if only for metatraits showing high stability, thatindividual differences in metatraits remain relatively constantover time. Low metatrait (inconsistent) people tend to remainlow metatrait people across time, and high metatrait(consistent) people tend to remain high metatrait people acrosstime. Thus, there is evidence for the predictability of inconsis-tency as well as consistency from one occasion to the next.
Quantitative genetic analyses of the metatraits showed, on theaverage, 15% of the phenotypic variance to be attributable togenetic influence, 5% to shared-rearing environmental influ-ence, and 80% to nonshared environmental influences. Al-though the magnitude of the shared-rearing environment isconsistent with past quantitative genetic analyses of trait scalescores, the magnitude of the genetic effects is smaller, and themagnitude of the nonshared environment is larger. One possiblesource of this discrepancy might lie with the lower reliabilitiesof the metatraits. Unreliability of measurement contributes tothe estimate of the nonshared environment, to the proportionaldecrement of the genetic effects.
Bivariate quantitative genetic analyses were conducted on thetrait and metatrait scores with the primary purpose of assessinghow much of the metatrait's genetic influence could be uniquelyattributed to the metatrait and how much was held in commonwith the trait. One difficulty with this analysis stemmed fromthe nonlinearity of the correlations between the traits andmetatraits. Linear correlations cannot capture the completemagnitude of the association between two nonlinearly relatedvariables. One possible result of using a linear correlation is theunderestimation of the amount of genetic influence common toboth variables. Using linear correlations, it was found that onthe average, 31% of the genetic variance affecting the metatraitwas unique to the metatrait, with the remaining 69% sharedwith the trait. Recognizing only variables with significant com-mon and unique genetic variance yielded values of 88% and
684 S. HERSHBERGER, R. PLOMIN, AND N. PEDERSEN
84%, respectively. Bivariate analyses of two traits using qua-dratic correlations with the linear component removed showedthat if the quadratic component contributing to the relationshipbetween the variables was about equal to the linear component,the quantitative genetic results did not differ substantially. How-ever, if the quadratic component was substantially larger, a re-duction in the estimated amount of shared genetic influencebetween the traits and metatraits occurred, with an equivalentenhancement in the magnitude of the metatrait's unique ge-netic influence. In this study, the quadratic correlation betweenthe traits and metatraits was substantially larger than the linearcorrelation in a minority of the cases. Thus, the analysis of thelinear correlation provides an accurate description of theamount of genetic influence held in common between trait andmetatraits.
Two important implications follow from the results of thisstudy. One is that the reliability and stability of metatraits canbe respectable, and depending on the phenotype, researcherscan use them with as much confidence as trait scale scores. Thesecond implication is that the concept of a metatrait provides aviable, additional view of personality. This is supported not onlyby the high stability of some of the metatraits across time, butalso by the unique genetic influence, independent of the traitlevels, found for the metatraits. The common finding of a sig-nificant association between traits and metatraits has led someresearchers (Burke et al., 1984; Tellegen, 1988) to dismiss theinteritem standard deviation as an appropriate method of mea-suring metatraits. Although better methods may be possible, theexistence of a significant correlation between traits and meta-traits does not negate the unique information brought to theinvestigation of personality metatraits. As long as the correla-tion falls below unity, metatraits have unique, reliable varianceto contribute to the prediction of individual differences in per-sonality, beyond the variance contributed by the level ofbehavior.
A useful future direction for metatrait research to take con-cerns identifying sources of influence common to two or moremetatraits. Multivariate behavioral genetic models could parti-tion the observed correlation between metatraits into sharedgenetic and environmental sources of variance, as the presentstudy did for the observed correlation between a trait andmetatrait. Undoubtedly, substantial correlations exist amongmetatraits, as evidenced by the metatrait factor used in thisstudy, which accounted for an average of 24% of the variance.Multivariate behavioral genetic modeling has successfully un-covered the genetic and environmental correlations underlyingthe association among many traits; there is no reason to assumethe same could not be accomplished for metatraits.
References
Allen, M. J., & Yen, W. M. (1979). Introduction to measurement theory.Belmont, CA: Wadsworth.
Baumeister, R. E. (1991). On the stability of variability: Retest reliabil-ity of metatraits. Personality and Social Psychology Bulletin, 17,633-639.
Baumeister, R. E., & Tice, D. M. (1988). Metatraits. Journal ofPerson-ality, 56, 571-598.
Bern, D. J., & Allen, A. (1974). On predicting some of the people someof the time: The search for cross-situational consistencies in behavior.Psychology Review, 81, 506-520.
Bergeman, C. S., Chipuer, H. M., Plomin, R., Pedersen, N. L.,McClearn, G. E., Nesselroade, J. R., Costa, P. T., Jr., & McCrae,R. R. (1993). Genetic and environmental effects on openness to ex-perience, agreeableness, and conscientiousness: An adoption/twinstudy. Journal of Personality, 61, 159-179.
Bouchard, T. J., Jr., & McGue, M. (1990). Genetic and rearing envi-ronmental influence on adult personality: An analysis of adoptedtwins reared apart. Journal of Personality, 58, 263-292.
Burke, P. A., Kraut, R. E., & Dworkin, R. H. (1984). Traits, consis-tency, and self-schemata: What do our methods measure? Journal ofPersonality and Social Psychology, 47, 568-579.
Buss, A. H., & Plomin, R. (1984). Temperament: Early developing per-sonality traits. Hillsdale, NJ: Erlbaum.
Cederlof, R., & Lorich, U. (1978). The Swedish twin registry. In W. E.Nance, G. Allen, & P. Parisi (Eds.), Twin research: Part C. Biologyand epidemiology (pp. 189-195). New York: Alan R. Liss.
Chaplin, W. E, & Goldberg, L. R. (1985). A failure to replicate theBern and Allen study of individual differences in cross-situationalconsistency. Journal of Personality and Social Psychology, 47, 1074-1090.
Cook, W. W., & Medley, D. M. (1954). Proposed hostility and phari-saic-virtue scales for the MMPI. Journal of Applied Psychology, 38,414-418.
Costa, P. T, Jr., & McCrae, R. R. (1985). The NEO Personality Inven-tory Manual. Odessa, FL: Psychological Assessment Resources.
Duke University Center for the Study of Aging and Human Develop-ment. (1978). Multidimensional functional assessment: The OARSmethodology. Durham, NC: Duke University Medical Center.
Epstein, S. (1983). Aggregation and beyond: Some basic issues in theprediction of behavior. Journal of Personality, 51, 360-392.
Floderus, B. (1974). Psycho-social factors in relation to coronary heartdisease and associated risk factors. Nordisk Hygienisk Tidskrift[Monograph, Suppl. 6], 1-148.
Gatz, M., Pedersen, N. L., & Harris, J. (1987). Measurement charac-teristics of the mental health scale from the OARS. Journal of Geron-tology, 42, 332-335.
Haynes, G. S., Levine, S., Scotch, N., Feinleib, M., & Kanner, W. B.(1978). The relationship of psychosocial factors to coronary heartdisease in the Framingham study. American Journal of Epidemiology,107, 362-383.
Heise, D. R. (1969). Separating reliability and stability in test-retestcorrelation. American Journal of Sociology, 75, 93-101.
Joreskog, K. G., & Sorbom, D. (1993). LISREL 8 user's reference.Chicago: Scientific Software.
Klockars, A. J., & Varnum, S. W. (1975). A test of the dimensionalityassumptions of Rotter's Internal-External scale. Journal of Personal-ity Assessment, 39, 397-404.
McCrae, R. R., & Costa, P. T., Jr. (1985). Openness to experience. InR. Hogan & W. H. Jones (Eds.), Perspectives in personality (Vol. 1,pp. 145-172). Greenwich, CT: JAI Press.
Neale, M. C, & Cardon, L. R. (1992). Methodology for genetic studiesof twins and families. Dordrocht, The Netherlands: Kluwer.
Mischel, W. (1968). Personality and assessment. London: Wiley.Paunonen, S. V. (1988). Trait relevance and the differential predictabil-
ity of behavior. Journal of Personality, 56, 599-619.Paunonen, S. V., & Jackson, D. N. (1985). Idiographic measurement
strategies for personality and prediction: Some unredeemed promis-sory notes. Psychological Review, 92, 486-511.
Pedersen, N. L., Gatz, M., Plomin, R., Nesselroade, J. R., & McClearn,G. E. (1989). Individual differences in locus of control during thesecond half of the lifespan for identical and fraternal twins rearedapart and reared together. Journal of Gerontology: Psychological Sci-ences, 44, 100-105.
Pedersen, N. L., Lichtenstein, P., Plomin, R., DeFaire, U., McClearn,G. E., & Matthews, K. A. (1989). Genetic and environmental influ-
METATRAITS 685
ences for Type A-like and related traits: A study of twins reared to-gether and twins reared apart. Psychosomatic Medicine, 51,428-440.
Pedersen, N. L., McClearn, G. E., Plomin, R., Nesselroade, J. R., Berg,S., & DeFaire, U. (1991). The Swedish Adoption/Twin Study ofAging: An update. Ada Geneticae Medicae et Gemmellologiae, 40,7-20.
Pedersen, N. L., Plomin, R., McClearn, G. E., & Friberg, L. (1988).Neuroticism, extraversion, and related traits in adult twins rearedapart and reared together. Journal of Personality and Social Psychol-ogy, 55, 950-957.
Plomin, R., Chipuer, H. M., & Loehlin, J. C. (1990). Behavioral genet-ics and personality. In L. A. Pervin (Ed.), Handbook of personality:Theory and research (pp. 225-243). New York: Guilford Press.
Plomin, R., DeFries, J. C, & McClearn, G. E. (1990). Behavior genet-ics: A primer. New York: Freeman.
Plomin, R., & McClearn, G. E. (1990). Human behavioral genetics ofaging. In J. E. Birren & K. W. Schaie (Eds.), Handbook of the psy-chology of aging (pp. 66-77). New York: Academic Press.
Plomin, R., Pedersen, N. L., McClearn, G. E., Nesselroade, J. R., &Bergeman, C. S. (1988). EAS temperaments during the last half ofthe life span: Twins reared apart and twins reared together. Psychol-ogy and Aging, 3, 43-50.
Rotter, J. B. (1966). Generalized expectancies for internal versus exter-
nal control of reinforcement. Psychological Monographs, 80 (1,Whole No. 609).
Schalling, D., Edman, G., & Asberg, M. (1983). Impulsive cognitivestyle and inability to tolerate boredom: Psychological studies of tem-peramental vulnerability. In M. Zuckerman (Ed.), Biological basesof sensation seeking, impulsivity and anxiety. Hillsdale, NJ: Erlbaum.
Spielberger, C. D. (1979). Preliminary manual for the State-Trait Per-sonality Inventory (STPI). Tampa: University of Florida.
Tellegen, A. (1988). The analysis of consistency in personality assess-ment. Journal of Personality, 56, 621-663.
Tice, D. M. (1989). Metatraits: Interitem variance as personality as-sessment. In D. M. Buss & N. Cantor (Eds.), Personality psychology:Recent trends and emerging directions (pp. 194-200). New York:Springer-Verlag.
Waller, N. G., & Reise, S. P. (1992). Genetic and environmental influ-ences on item response pattern scalability. Behavior Genetics, 22,135-152.
Wood, V., Wylie, M. L., & Sheafor, B. (1969). An analysis of a short self-report measure of life satisfaction: Correlation with rater judgment.Journal of Gerontology, 24,465-469.
Received January 27,1993Revision received February 8,1995
Accepted February 14,1995 •
1996 APA Convention Call for Programs
The Call for Programs for the 1996 APA annual convention appears in the September issue of theAPA Monitor. The 1996 convention will be held in Toronto, Ontario, Canada, from August 9 throughAugust 13. The deadline for receipt of program and presentation proposals is December 1, 1995.Additional copies of the Call are available from the APA Convention Office, effective in September.As a reminder, agreement to participate in the APA convention is now presumed to convey permis-sion for the presentation to be audiotaped if selected for taping. Any speaker or participant who doesnot wish his or her presentation to be audiotaped must notify the person submitting the programeither at the time the invitation is extended or before the December 1 deadline for proposal receipt.


![eliability Model for Planetary i Gear Trains 1 · rotationoT the sungear. All rotationsare taken in the coordinateframe of the ring gearwhich is heldfixea. Reaaing across in the tab]e,for](https://static.fdocuments.us/doc/165x107/5e84c9b08a378040d55a9b03/eliability-model-for-planetary-i-gear-trains-1-rotationot-the-sungear-all-rotationsare.jpg)