
T. Pradeep - Indian Institute of Technology Madras · P. R. Sajanlal and T. Pradeep, Unpublished...
102
T. Pradeep http://www.dstuns.iitm.ac.in/pradeep-research-group.php [email protected] IIT Madras April 25, 2010
Transcript of T. Pradeep - Indian Institute of Technology Madras · P. R. Sajanlal and T. Pradeep, Unpublished...

http://www.webexhibits.org/causesofcolor/9.html&usg=__eazWHmio6ubJtFEG_T6NScyGsc=&h=306&w=300&sz=9&hl=en&start=1&um=1&tbnid=g_xdRB5Fe6C6XM:&tbnh=117&tbnw=115&prev=/images%3Fq%3Dgold%2Bnanoparticles%2Bcolor%26hl%3Den%26sa%3DG%26um%3D1
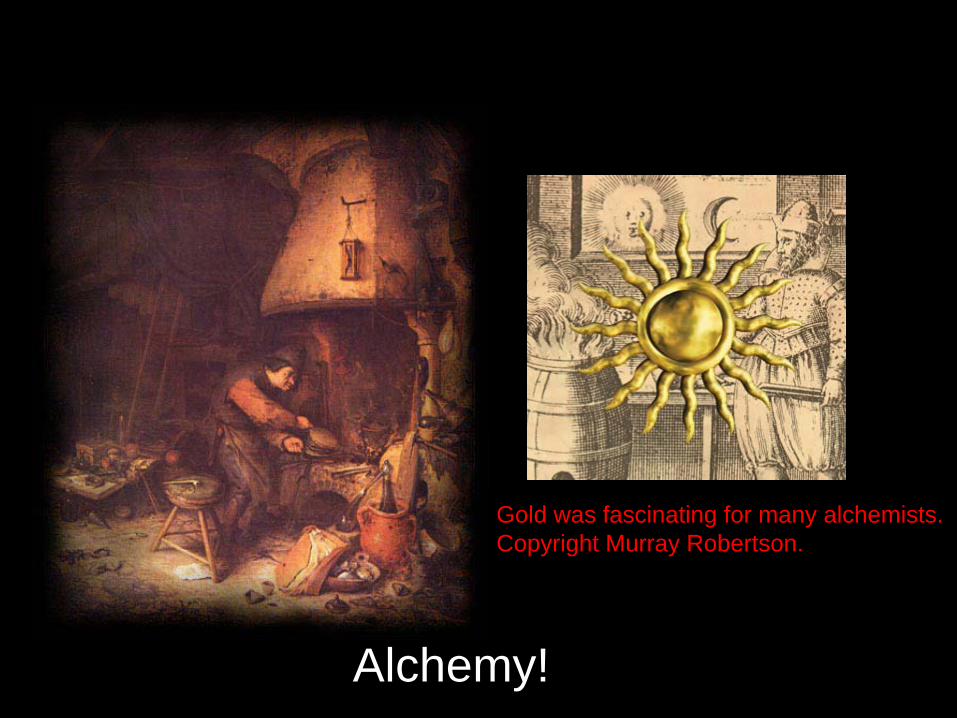
Alchemy!
Gold was fascinating for many alchemists. Copyright Murray Robertson.
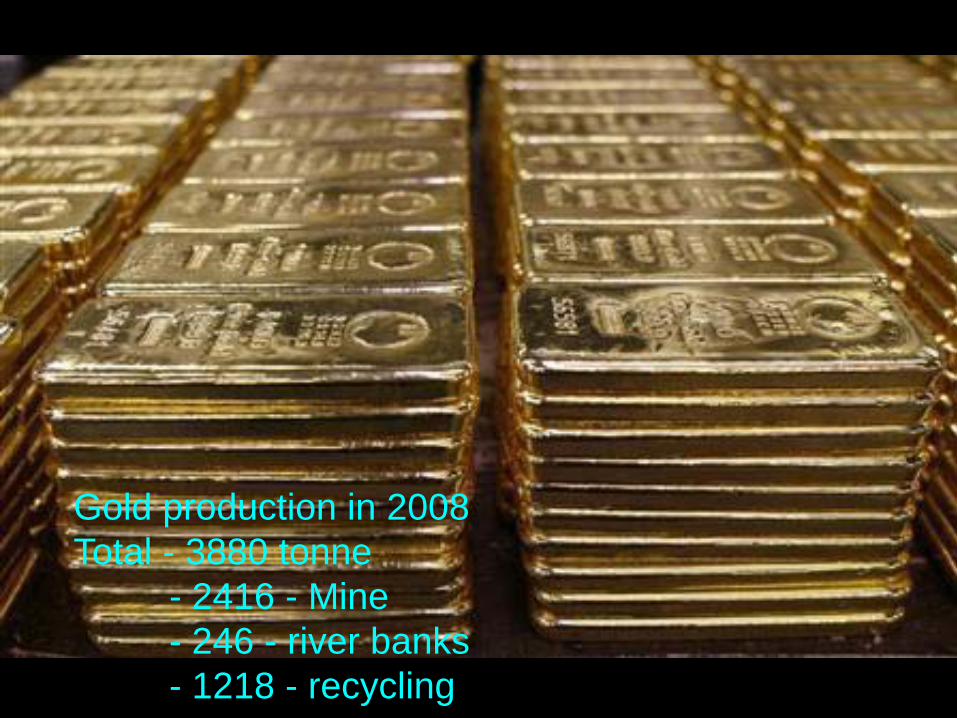
Gold production in 2008Total - 3880 tonne
- 2416 - Mine- 246 - river banks- 1218 - recycling

Hardcover: 274 pages Publisher: Elsevier Science Ltd (June 1978) Language: English ISBN-10: 0444416242 ISBN-13: 978-0444416247
Gold ChemistryISBN: 978-0-471-97369-0Hardcover908 pagesMarch 1999
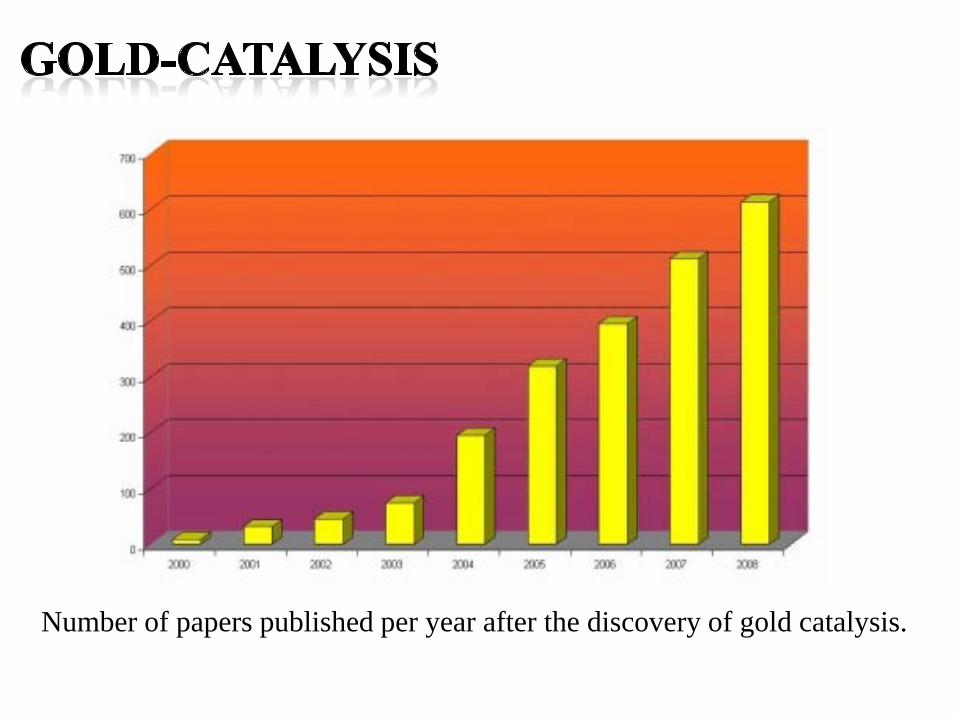
Number of papers published per year after the discovery of gold catalysis.

1992 1994 1996 1998 2000 2002 2004 2006 2008 2010
0
1000
2000
3000
4000
5000Nu
mbe r
of pu
blica
tion i
n gold
nano
parti
cle
Year
Publications per year as on December 31, 2009
With the key words, “gold” and “nanoparticle*”


The gold that is not GOLD!

AcknowledgementsM.A. Habeeb MuhammadE.S. Shibu, P. R. Sajanlal
Udayabhaskar Rao TummuK.V. Mrudula
K. Kimura, University of Hyogo, JapanT. Tsukuda, IMS, Okazaki, JapanS.K. Pal, SNBS, KolkataG.U. Kulkarni, JNCASR, BangaloreR. V. Omkumar, RGCB, TiruvananthapuramManzoor Koyakutty, Amrita, Kochi


400+ papers
Electro-magnetic rotations (1821)
Benzene (1825)
Electro-magnetic induction (1831)
The laws of electrolysis and coining words such as electrode, cathode, ion (early 1830s)
The magneto-optical effect and diamagnetism (both 1845)
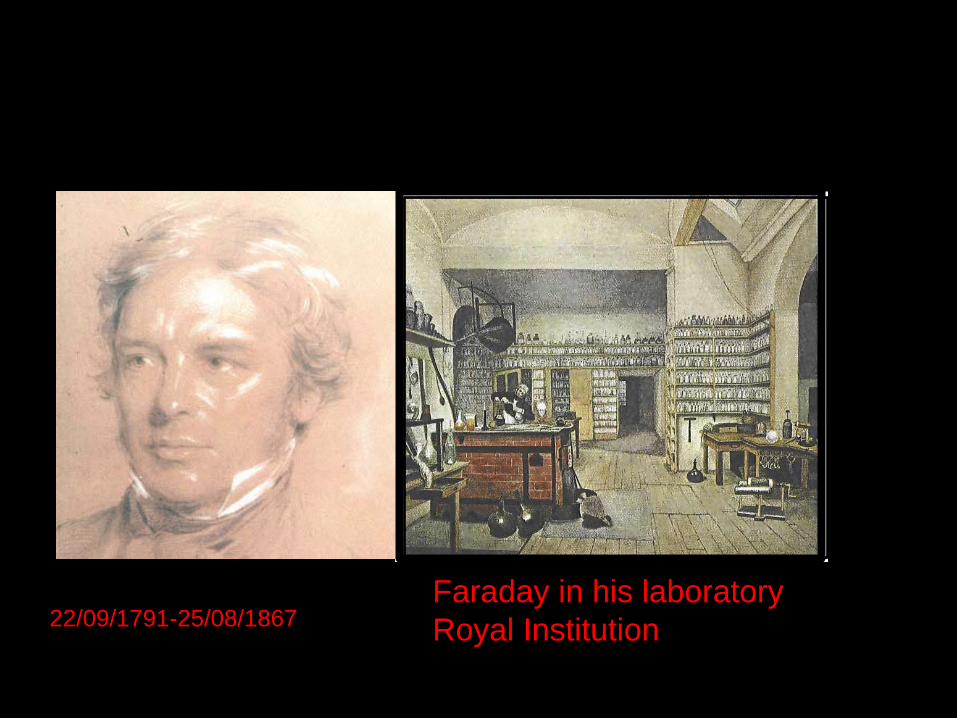
Faraday in his laboratoryRoyal Institution22/09/1791-25/08/1867

Faraday’s gold preserved in Royal Institution. From the site, http://www.rigb.org/rimain/heritage/faradaypage.jsp
50 nm
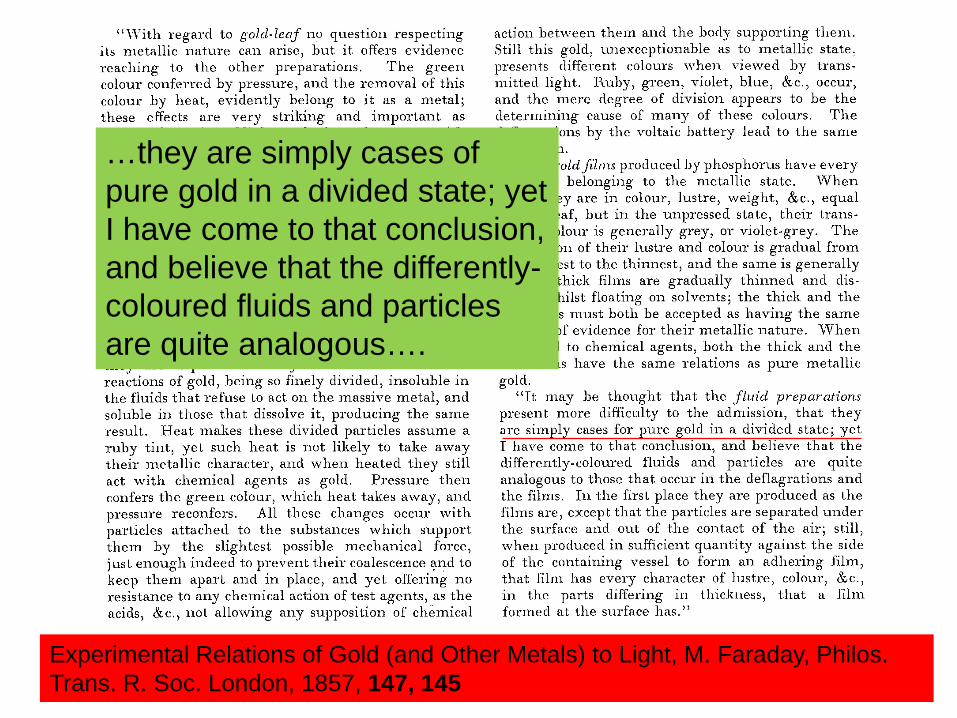
Experimental Relations of Gold (and Other Metals) to Light, M. Faraday, Philos. Trans. R. Soc. London, 1857, 147, 145
…they are simply cases of pure gold in a divided state; yet I have come to that conclusion, and believe that the differently-coloured fluids and particles are quite analogous….

Gustav Mie (1868 - 1957)
Mie G. Beiträge zur Optik trüber Medien speziell kolloidaler Goldlösungen (contributions to the optics of diffuse media, especially colloid metal solutions). Ann Phys 1908;25:377–445. This paper, including an English translation, as well as other historic papers on light scattering and absorption can be found at www.iwt-bremen.de/vt/laser/wriedt/index_ns.html .
1905
1940
By changing size
Surface plasmons

Lycurgus cup; in transmitting light (left) and in reflected light (right). From the site, http://www.thebritishmuseum.ac.uk.
Silicon dioxide in Lycurgus cup = 73%Silicon dioxide in Modern Glass = 70%Sodium oxide in Lycurgus cup = 14%Sodium oxide in Modern Glass = 15%Calcium oxide in Lycurgus cup = 7%Calcium oxide in Modern Glass = 10%
So why is it coloured? The glass contains very small amounts of gold ( about 40 parts permillion) and silver ( about 300 parts per million)

Gold shells. Nanoshells designed to absorb various wavelengths of light (the six vials on the right), including infrared (vial at far right) compared to gold colloid (far left). Used with permission from www.ece.rice.edu/people/faculty/halas.
Colours by changing shapeShells
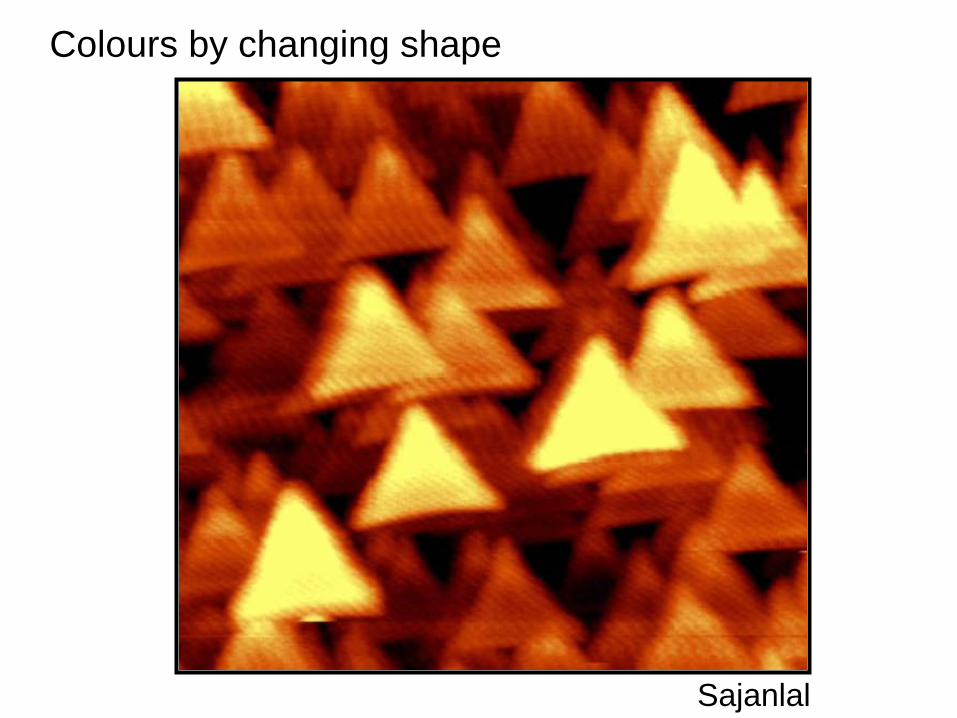
Colours by changing shape
Sajanlal
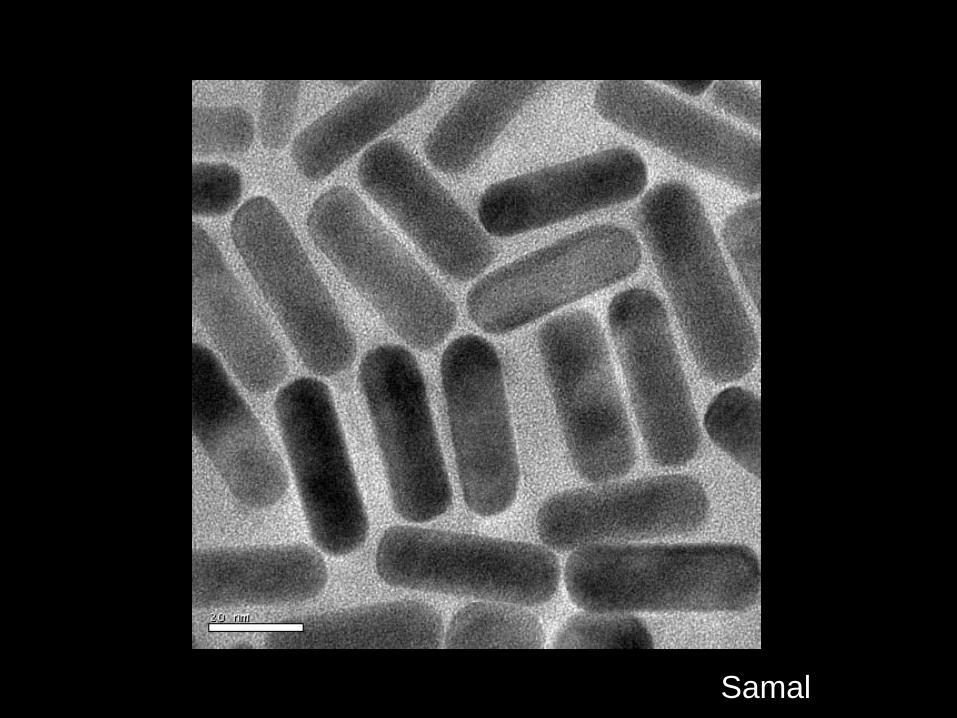
Samal

Nanorod Solution Nanorod Powder
Materials are needed for chemistry

400 600 8000.0
0.2
0.4
0.6
0.8
1.0
1.2
1.4
TSP
LSP
Ab
sorb
ance
Wavelength (nm)
LSP
TSP
Changing length by reaction
Sreeprasad
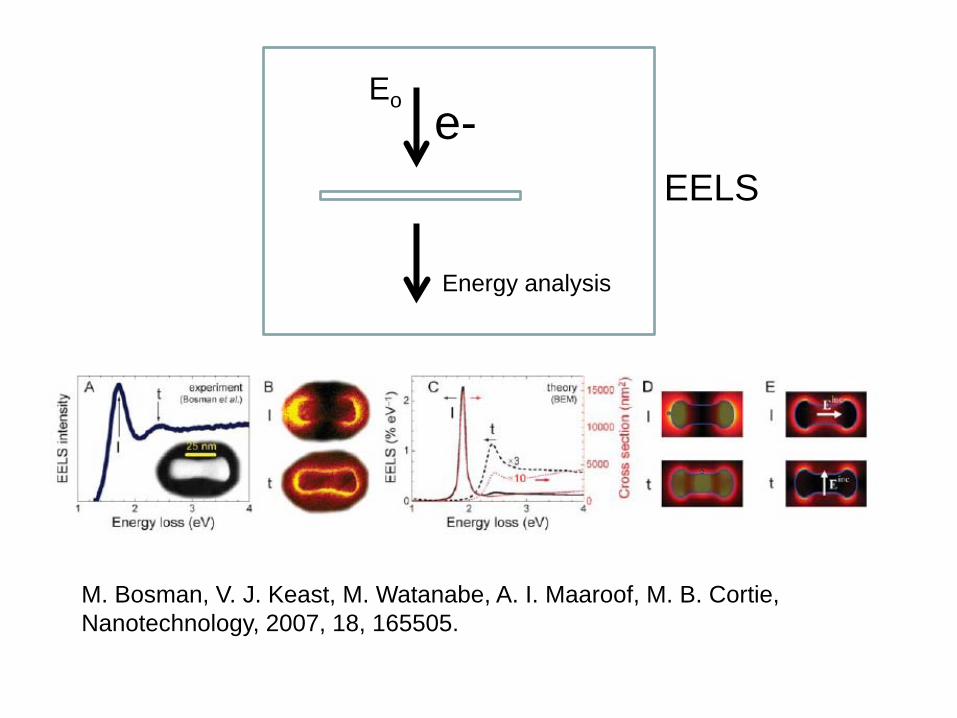
M. Bosman, V. J. Keast, M. Watanabe, A. I. Maaroof, M. B. Cortie, Nanotechnology, 2007, 18, 165505.
e-
Energy analysis
Eo
EELS
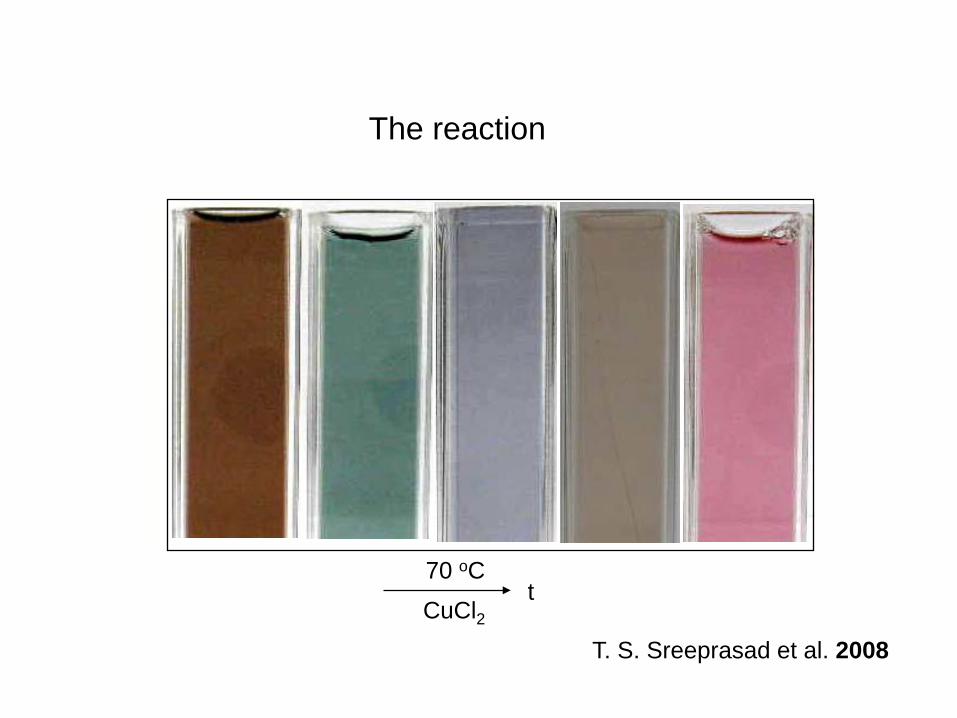
The reaction
tCuCl2
70 oC
T. S. Sreeprasad et al. 2008

400 600 8000.0
0.2
0.4
0.6
Abso
rban
ce
wavelength (nm)
A
(A)UV-visible spectrum of the starting nanorod and (B) TEM image

400 600 8000.0
0.2
0.4
0.6
Abso
rban
ce
wavelength (nm)
(A) UV-visible spectrum acquired after 1 h of reaction between gold nanorods and CuCl2. TEM taken from the same sample.
A
5nm
B
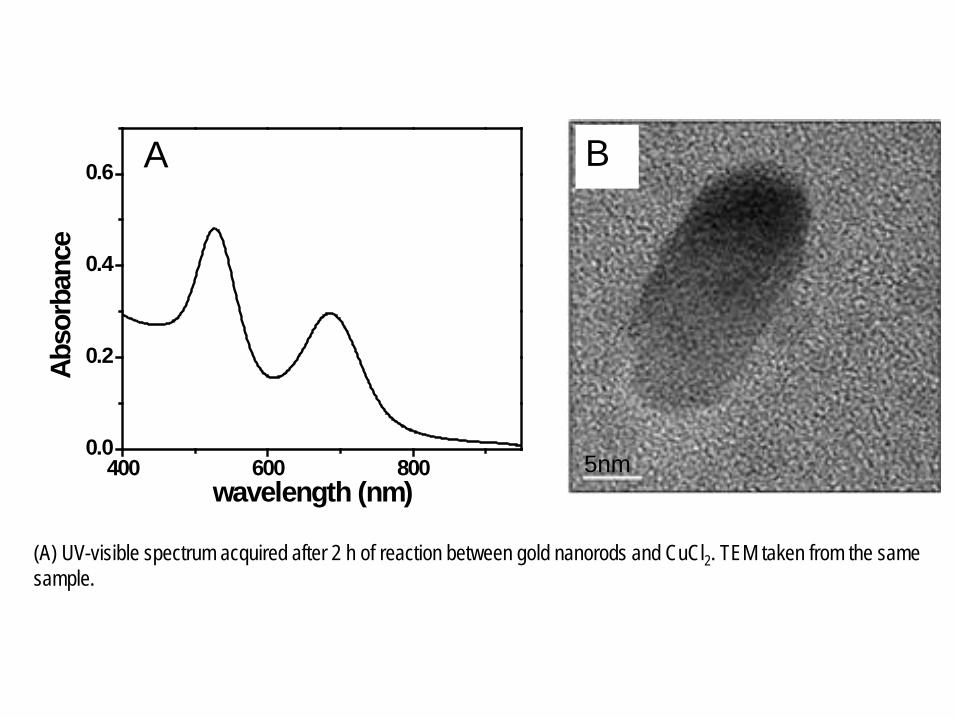
(A) UV-visible spectrum acquired after 2 h of reaction between gold nanorods and CuCl2. TEM taken from the same sample.
400 600 8000.0
0.2
0.4
0.6
Abso
rban
ce
wavelength (nm)
A B
5nm
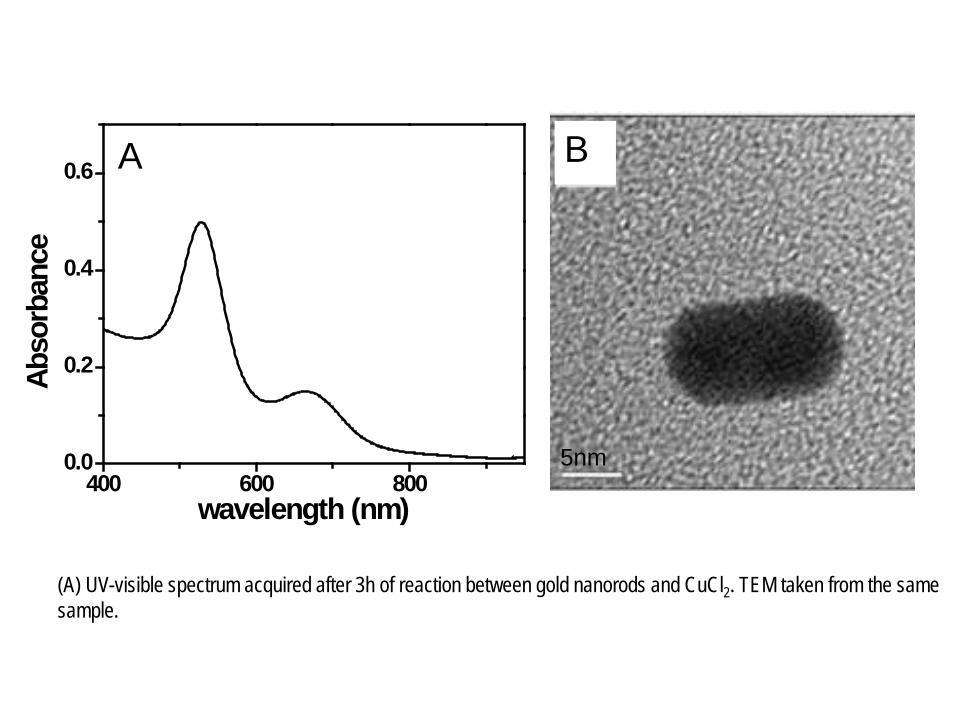
(A) UV-visible spectrum acquired after 3h of reaction between gold nanorods and CuCl2. TEM taken from the same sample.
400 600 8000.0
0.2
0.4
0.6
Abso
rban
ce
wavelength (nm)
A
5nm
B
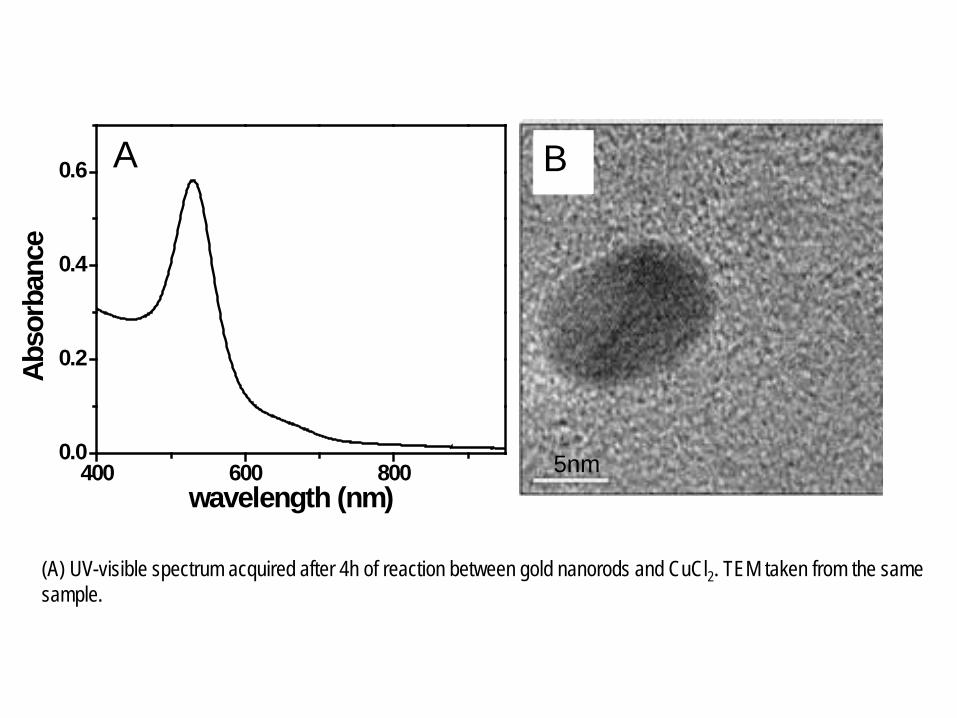
(A) UV-visible spectrum acquired after 4h of reaction between gold nanorods and CuCl2. TEM taken from the same sample.
400 600 8000.0
0.2
0.4
0.6
Abso
rban
ce
wavelength (nm)
A
5nm
B
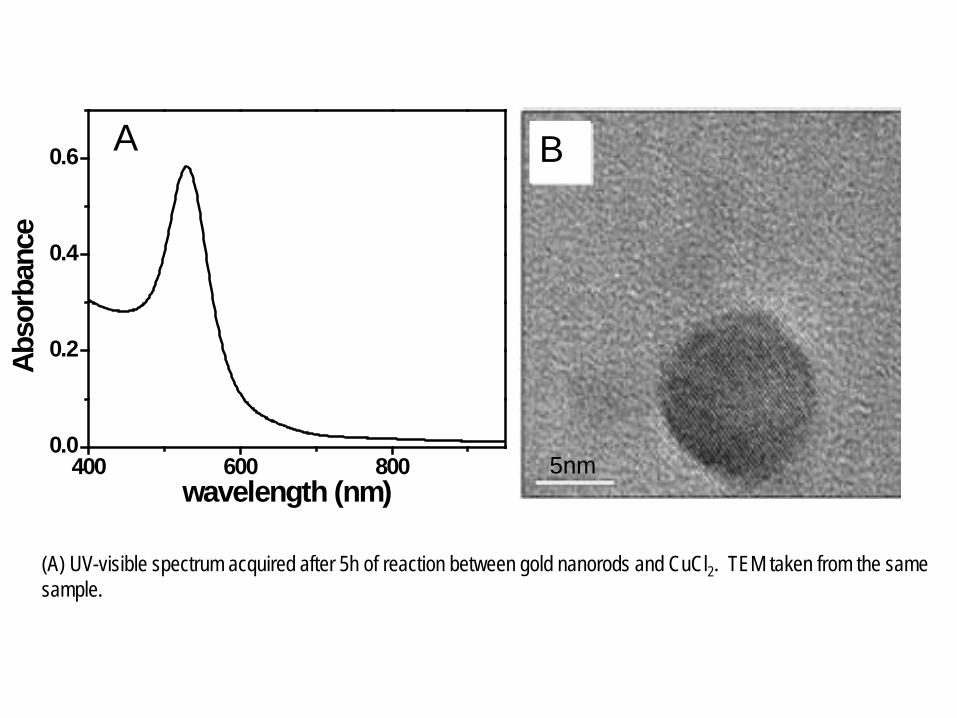
(A) UV-visible spectrum acquired after 5h of reaction between gold nanorods and CuCl2. TEM taken from the same sample.
400 600 8000.0
0.2
0.4
0.6
Abso
rban
ce
wavelength (nm)
A
5nm
B

Any shape can be prepared by arresting the reaction
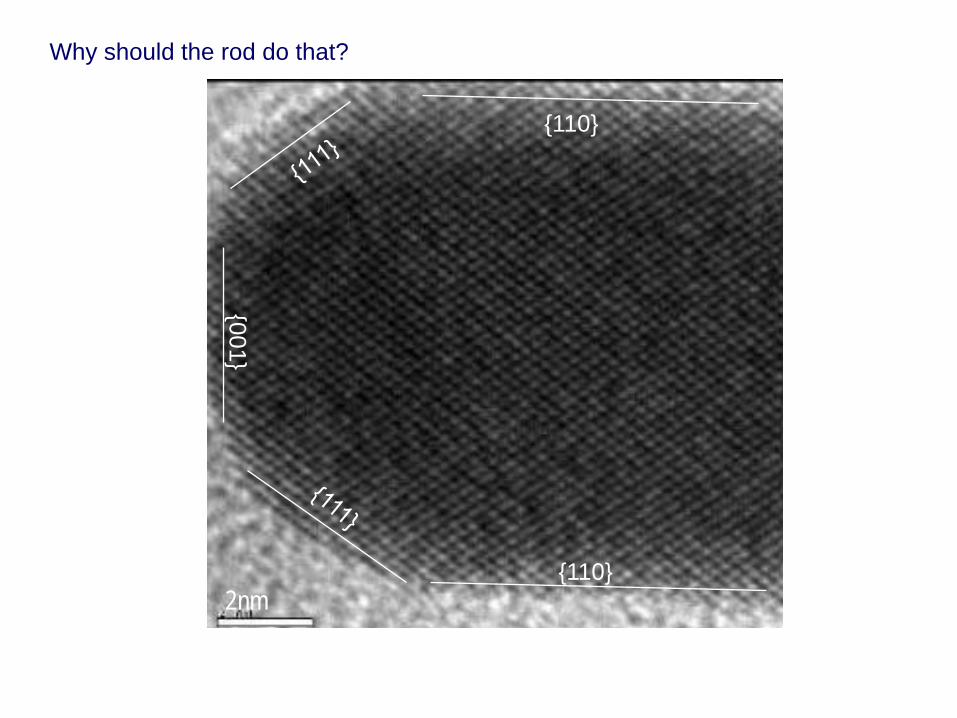
2nm{110}
{001}
{110}
Why should the rod do that?

A structural model of the Au nanorod.
Wang, Z. L.; Mohamed, M. B.; Link, S.; El-Sayed, M. A. Surf.Sci. 1999, 440, L809.

(a) Todd, B. D.; Lynden-Bell, R. M. Surf. Sci. 1993, 281, 191. (b) Uppenbrink, J.; Johnston, R. L.; Murrell, J. N. Surf. Sci.1994, 304, 223.
Reconstruction
(100)
(110)
(111)
planes
Surface Energies
0.58 J m-2
0.66 J m-2
0.70 J m-2
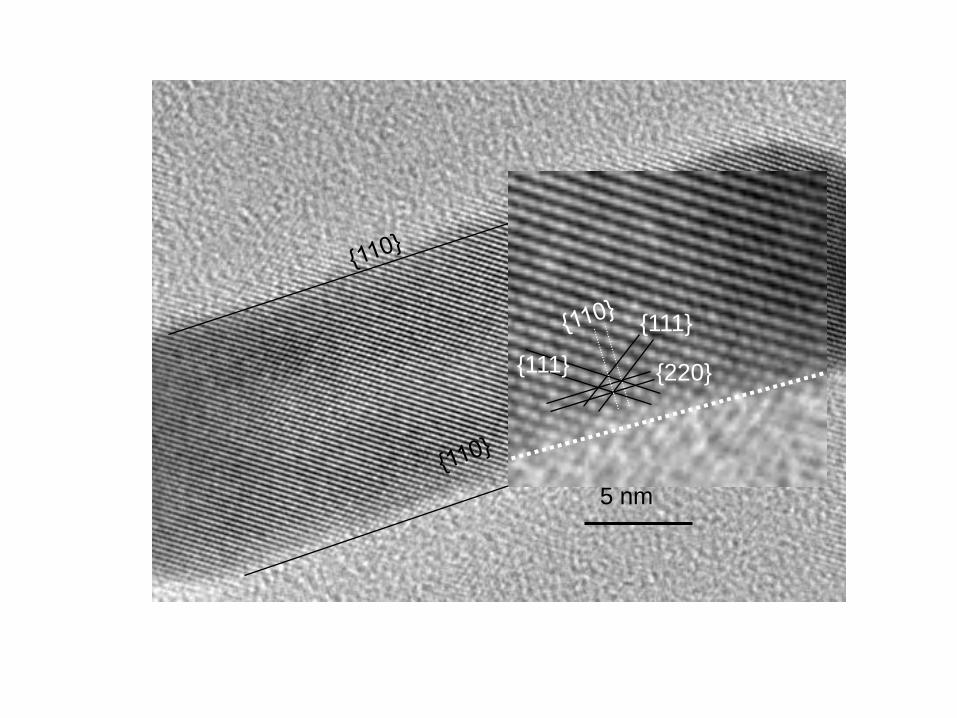
5 nm
{111}
{111} {220}
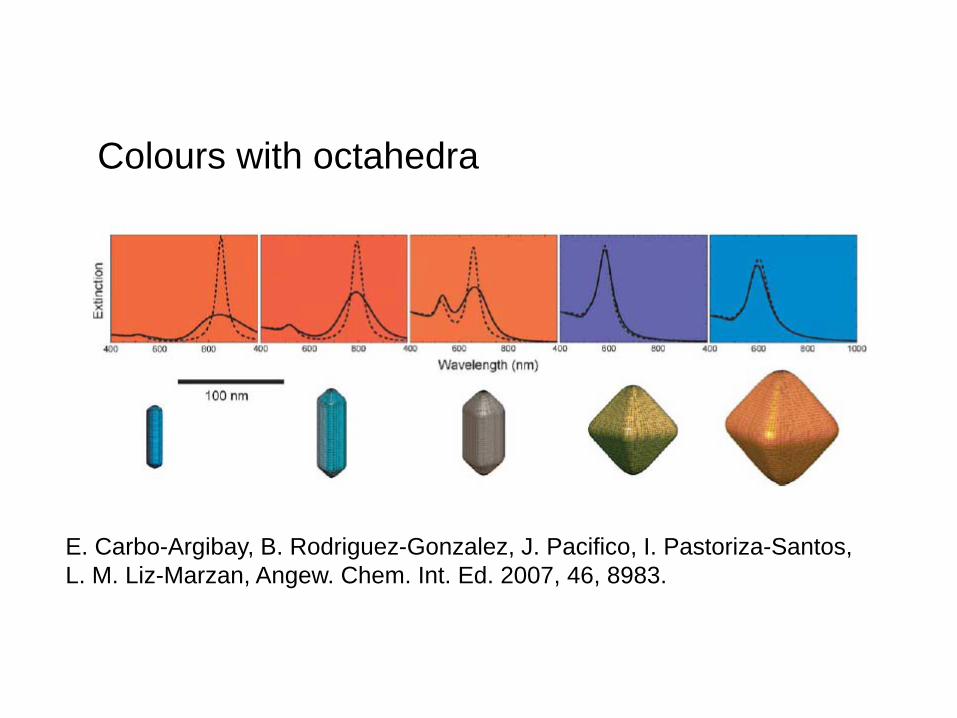
Colours with octahedra
E. Carbo-Argibay, B. Rodriguez-Gonzalez, J. Pacifico, I. Pastoriza-Santos,L. M. Liz-Marzan, Angew. Chem. Int. Ed. 2007, 46, 8983.
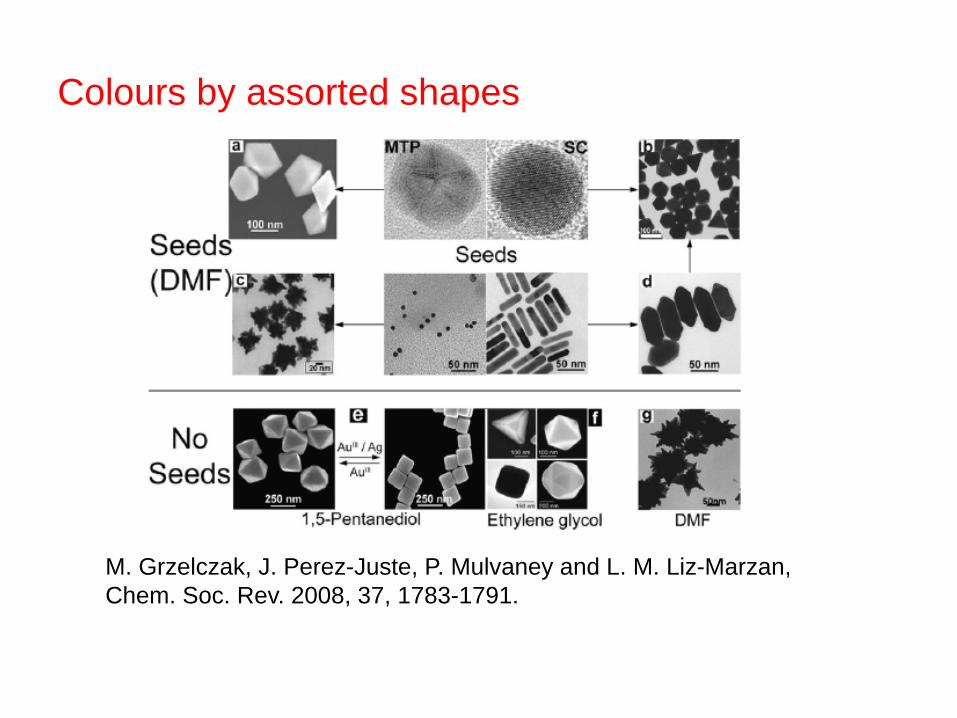
Colours by assorted shapes
M. Grzelczak, J. Perez-Juste, P. Mulvaney and L. M. Liz-Marzan, Chem. Soc. Rev. 2008, 37, 1783-1791.
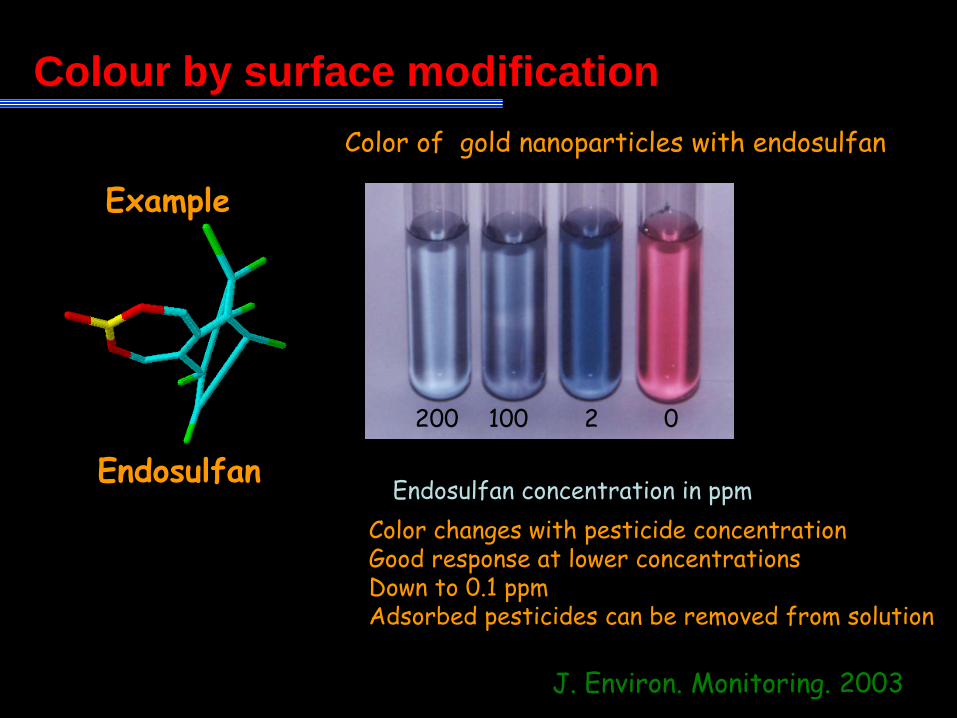
Colour by surface modification
Endosulfan
Color changes with pesticide concentrationGood response at lower concentrationsDown to 0.1 ppmAdsorbed pesticides can be removed from solution
Color of gold nanoparticles with endosulfan
Endosulfan concentration in ppm
02100 200
Example
J. Environ. Monitoring. 2003
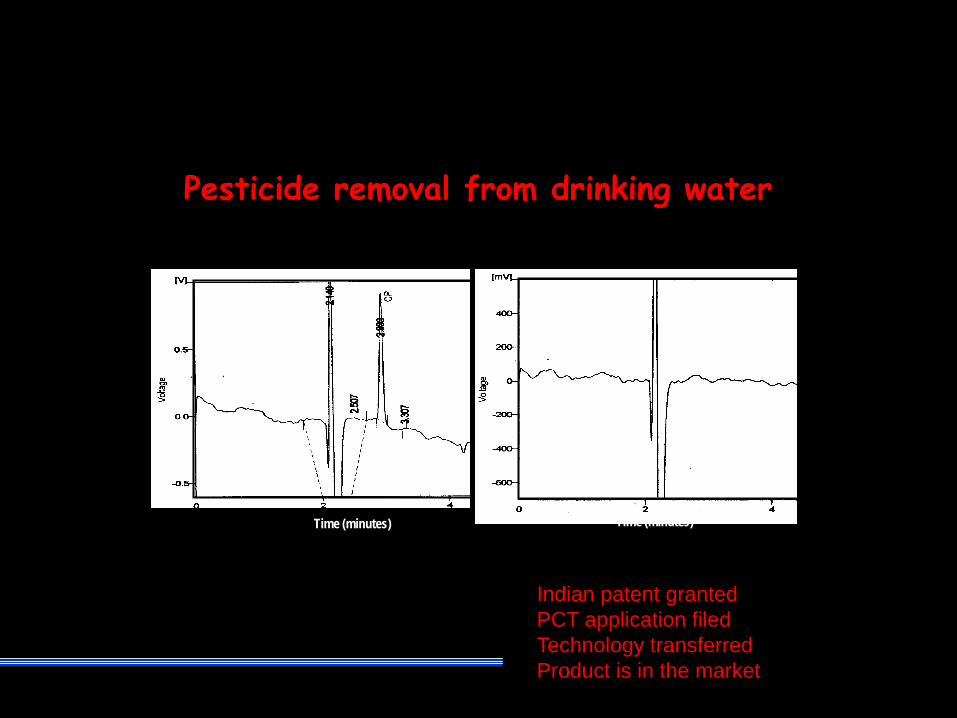
Pesticide removal from drinking water
Indian patent grantedPCT application filedTechnology transferredProduct is in the market
Time (minutes) Time (minutes)
A B

Inauguration
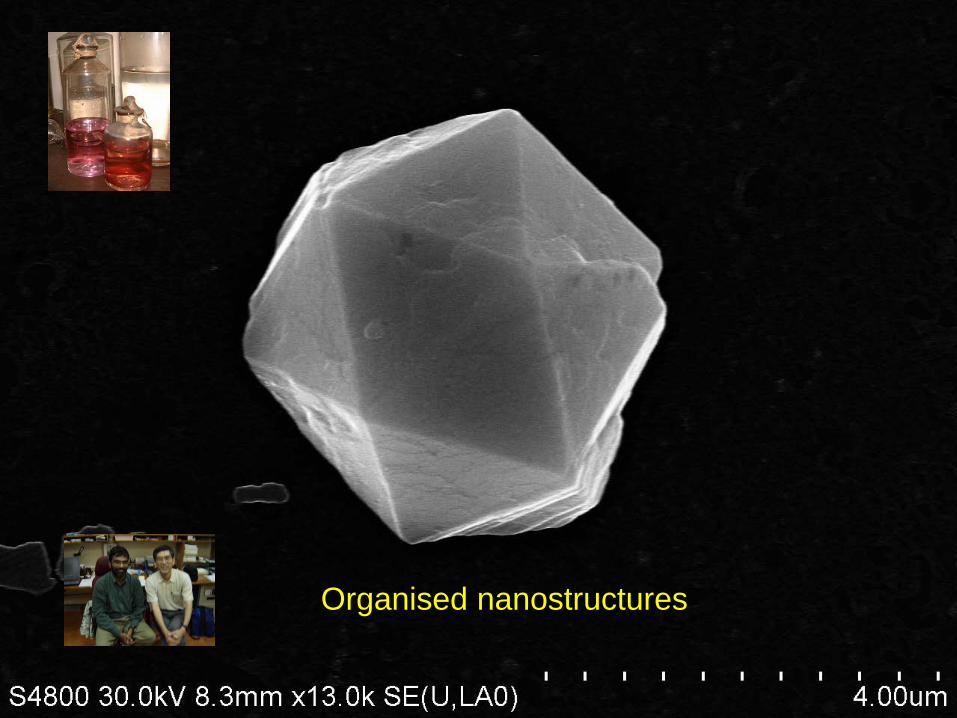
Organised nanostructures
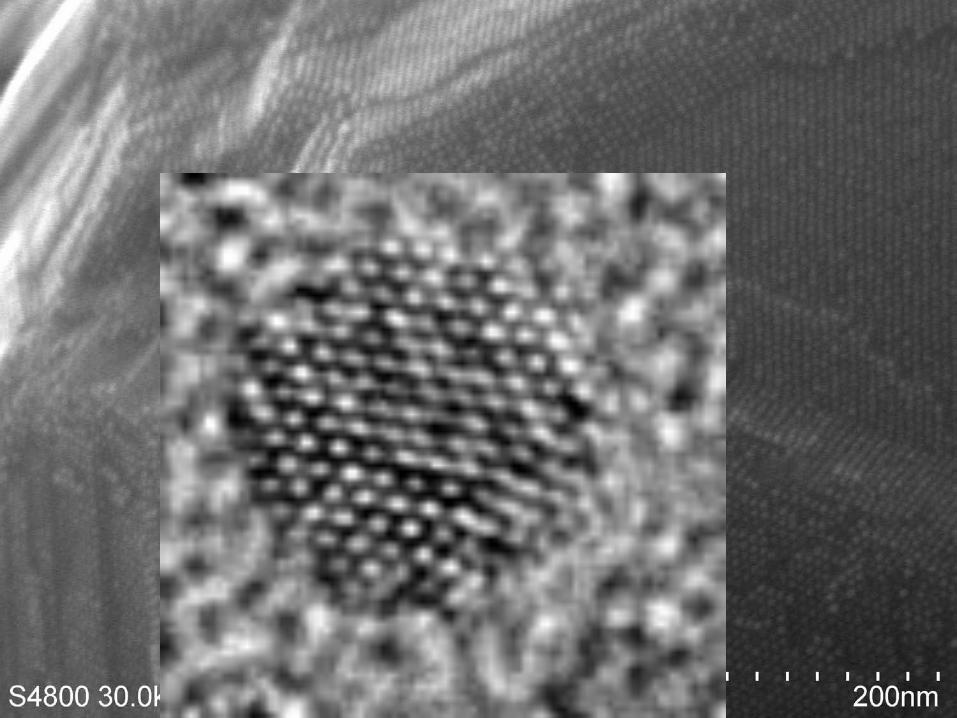
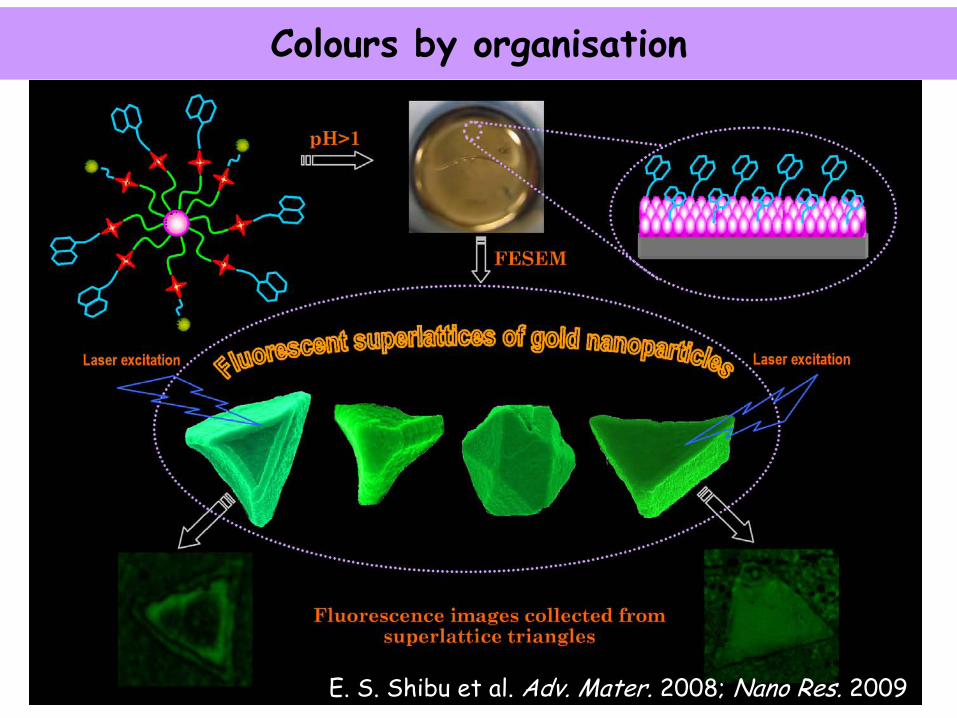
Colours by organisation
E. S. Shibu et al. Adv. Mater. 2008; Nano Res. 2009
Sajanlal and Pradeep – Nano Res. 2009
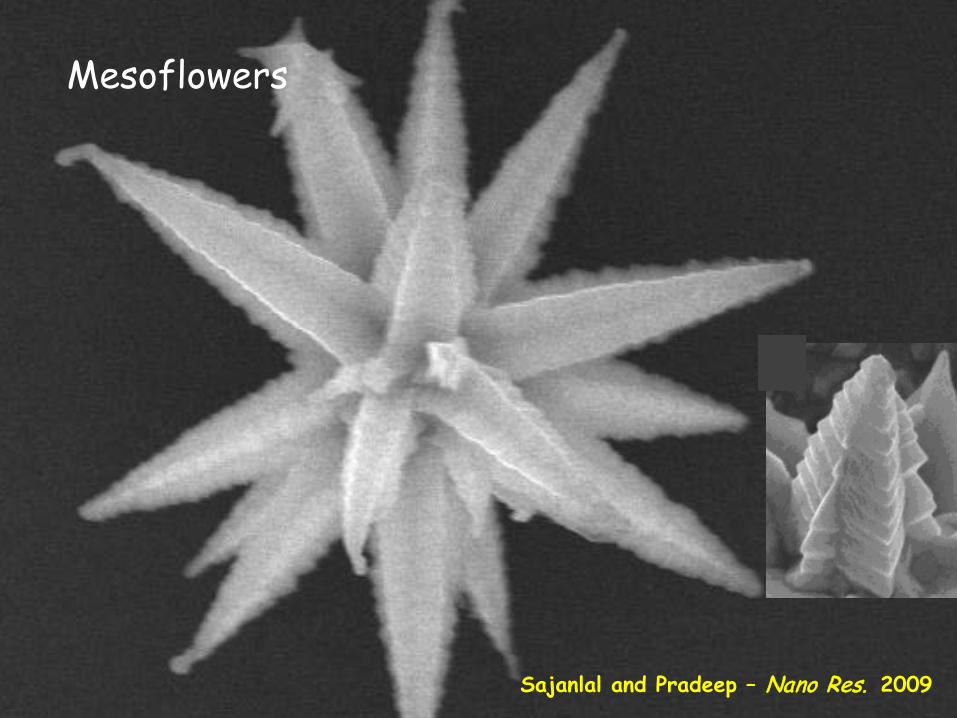
Mesoflowers
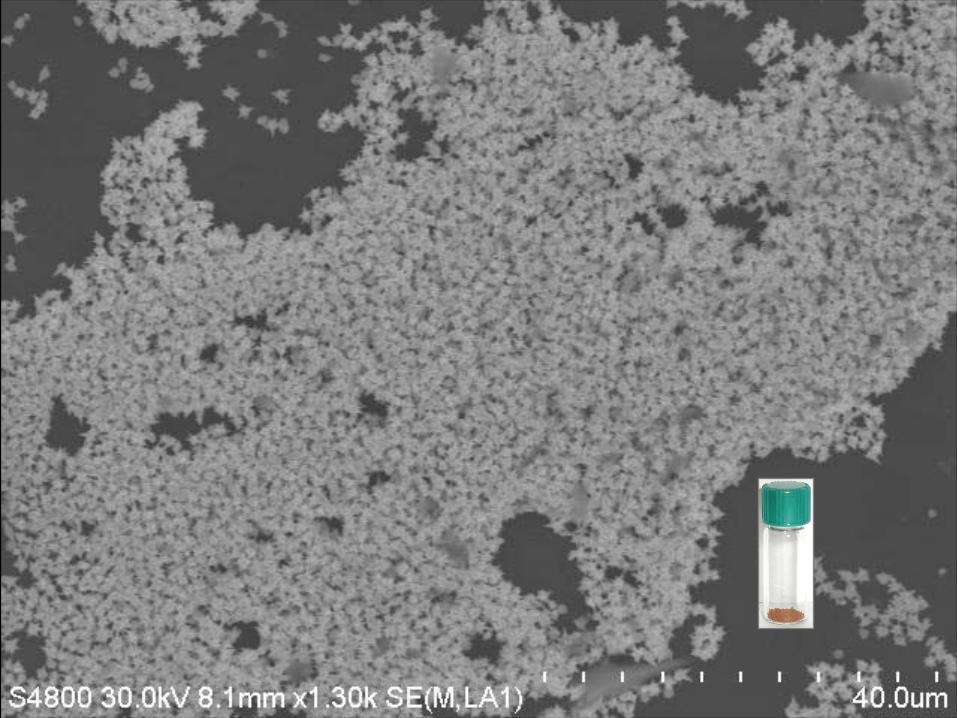
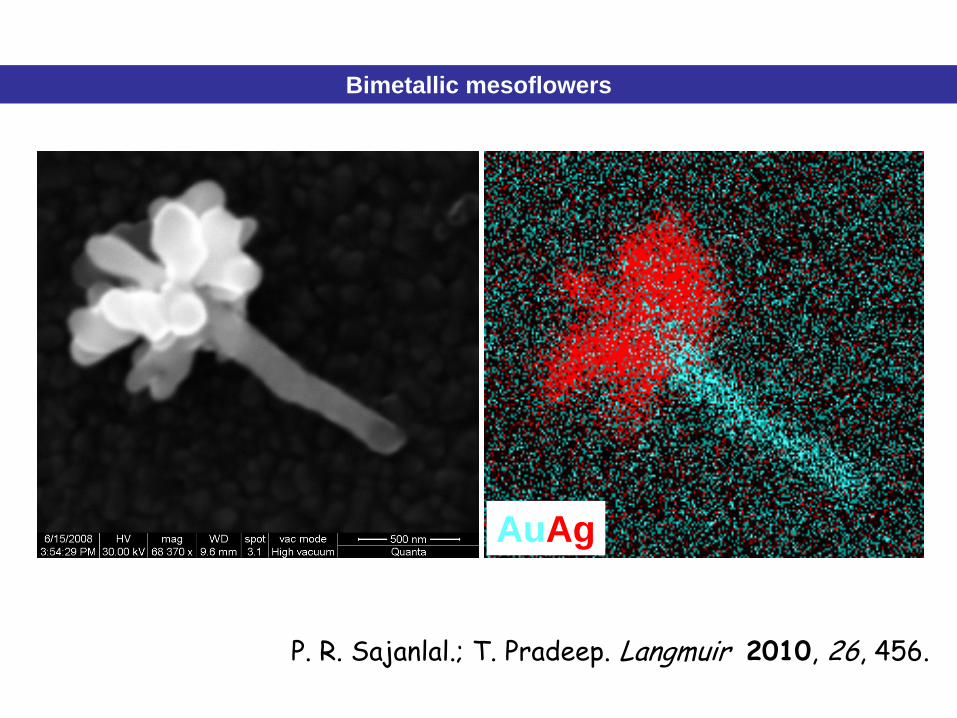
AuAg
Bimetallic mesoflowers
P. R. Sajanlal.; T. Pradeep. Langmuir 2010, 26, 456.
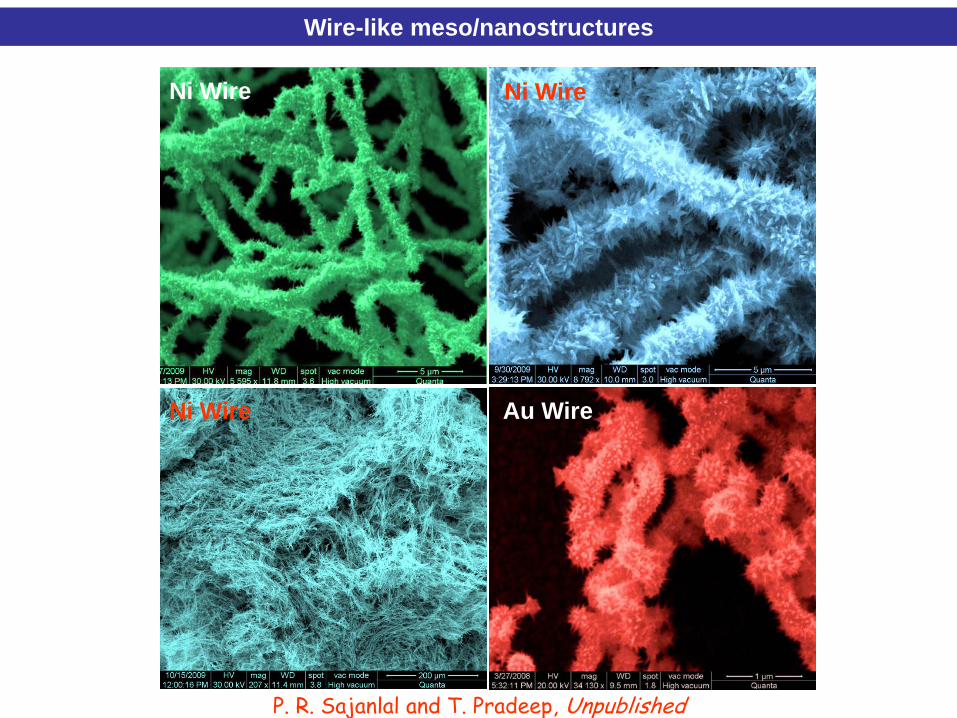
P. R. Sajanlal and T. Pradeep, Unpublished
Wire-like meso/nanostructures
Ni Wire Ni Wire
Ni Wire Au Wire
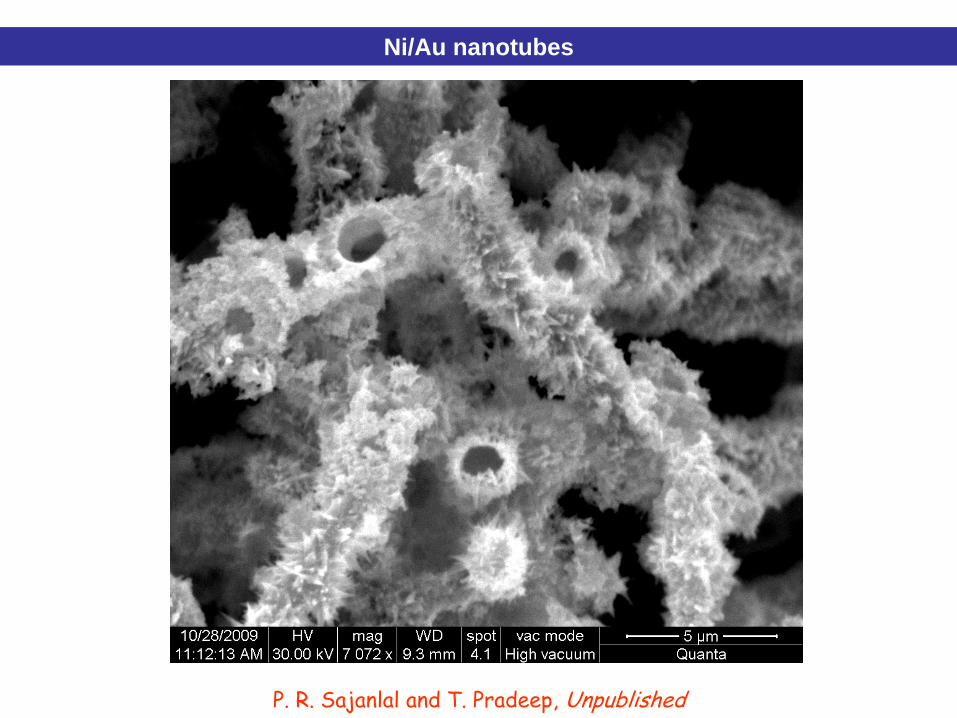
Ni/Au nanotubes
P. R. Sajanlal and T. Pradeep, Unpublished

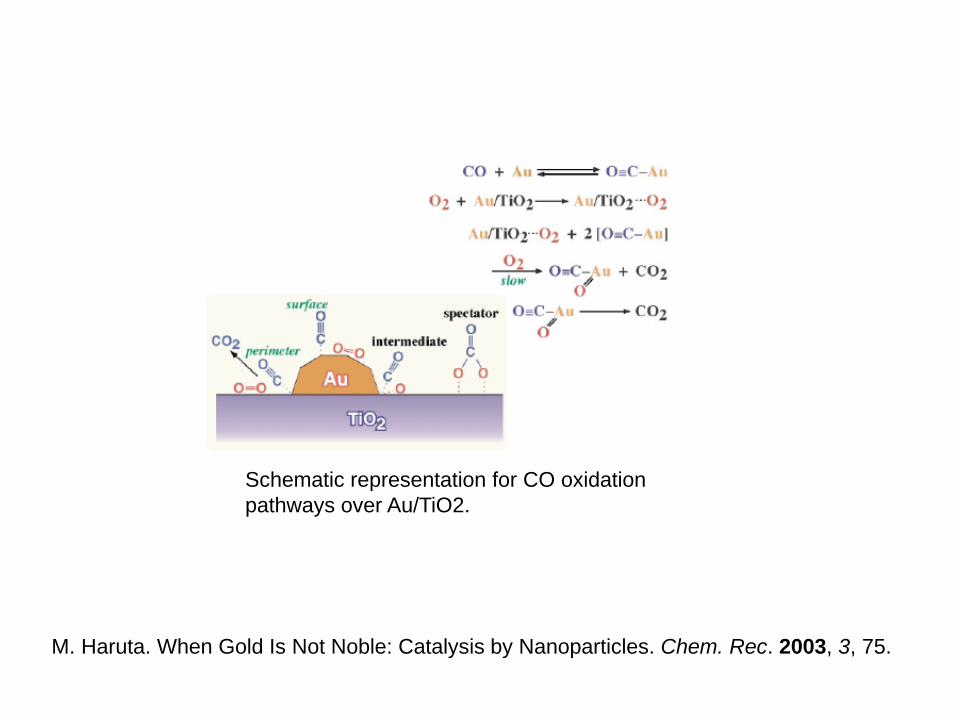
Schematic representation for CO oxidation pathways over Au/TiO2.
M. Haruta. When Gold Is Not Noble: Catalysis by Nanoparticles. Chem. Rec. 2003, 3, 75.

IR-spectra of 13CO and 15NO adsorbed on Pd30 (Figure 3a/b) and Pd8 (Figure 3c/d) clusters. Figure 3a/cshows the spectra if 13CO was predosed for both cluster sizes. Figure 3b/d shows the spectra if 15NO waspredosed. All of the spectra were taken at 90 K after annealing the cluster samples to the indicatedtemperatures.
Wörz, A. S.; Judai, K.; Abbet, S.; Heiz, U. Cluster Size-Dependent Mechanisms of the CO + NO Reaction on Small Pdn (n e 30) Clusters on Oxide Surfaces. J. Am. Chem. Soc. 2003, 125, 7964.
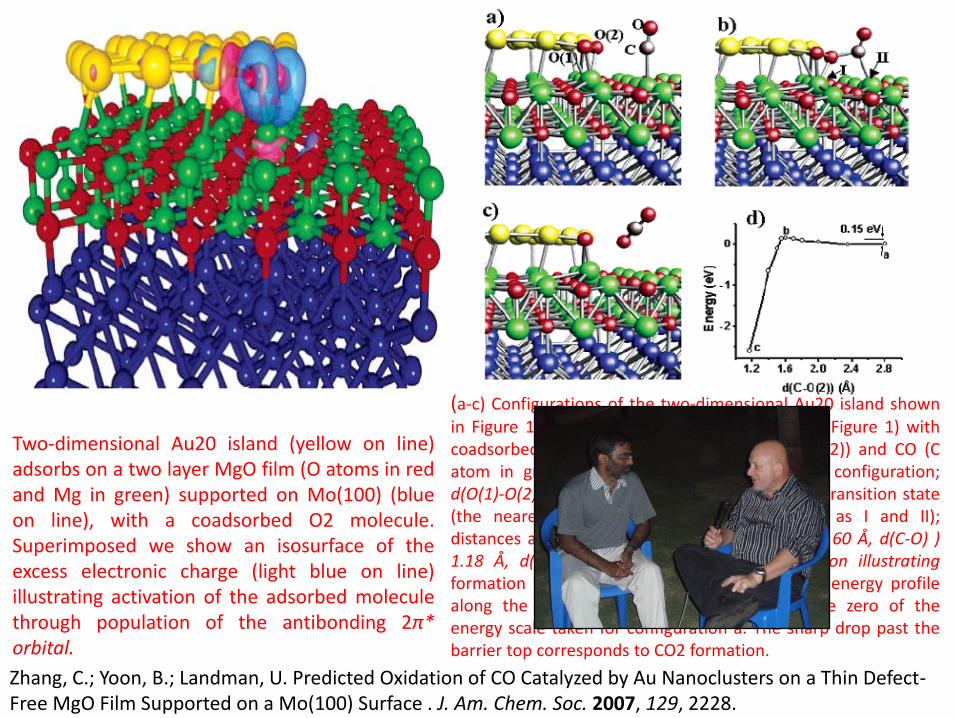
Two-dimensional Au20 island (yellow on line)adsorbs on a two layer MgO film (O atoms in redand Mg in green) supported on Mo(100) (blueon line), with a coadsorbed O2 molecule.Superimposed we show an isosurface of theexcess electronic charge (light blue on line)illustrating activation of the adsorbed moleculethrough population of the antibonding 2π*orbital.
(a-c) Configurations of the two-dimensional Au20 island shownin Figure 1 (the color scheme is the same as in Figure 1) withcoadsorbed O2 (the atoms marked O(1) and O(2)) and CO (Catom in gray online): (a) the initial optimized configuration;d(O(1)-O(2)) ) 1.52 Å, d(C-O(2)) ) 2.85 Å; (b) the transition state(the nearest-neighbor Mg atoms are marked as I and II);distances are d(O(1)-O(2)) ) 1.55 Å, d(C-O(2)) ) 1.60 Å, d(C-O) )1.18 Å, d(C-Mg(II)) ) 2.30 Å; (c) a configuration illustratingformation and desorption of CO2; (d) the total energy profilealong the C-O(2) reaction coordinate, with the zero of theenergy scale taken for configuration a. The sharp drop past thebarrier top corresponds to CO2 formation.
Zhang, C.; Yoon, B.; Landman, U. Predicted Oxidation of CO Catalyzed by Au Nanoclusters on a Thin Defect-Free MgO Film Supported on a Mo(100) Surface . J. Am. Chem. Soc. 2007, 129, 2228.

Au13
[Au13(PPhMe2) 10C12]3+
Briant, C. E.; Theobald, B. R. C.; White, J. W.; Bell, L. K.; Mingos, D. M. P.; Welch, A. J.Synthesis and x-ray structural characterization of the centered icosahedral gold clustercompound [Au13(PPhMe2)10Cl2](PF6)3; the realization of a theoretical prediction. J. C. S.Chem. Comm. 1981, 5, 201.
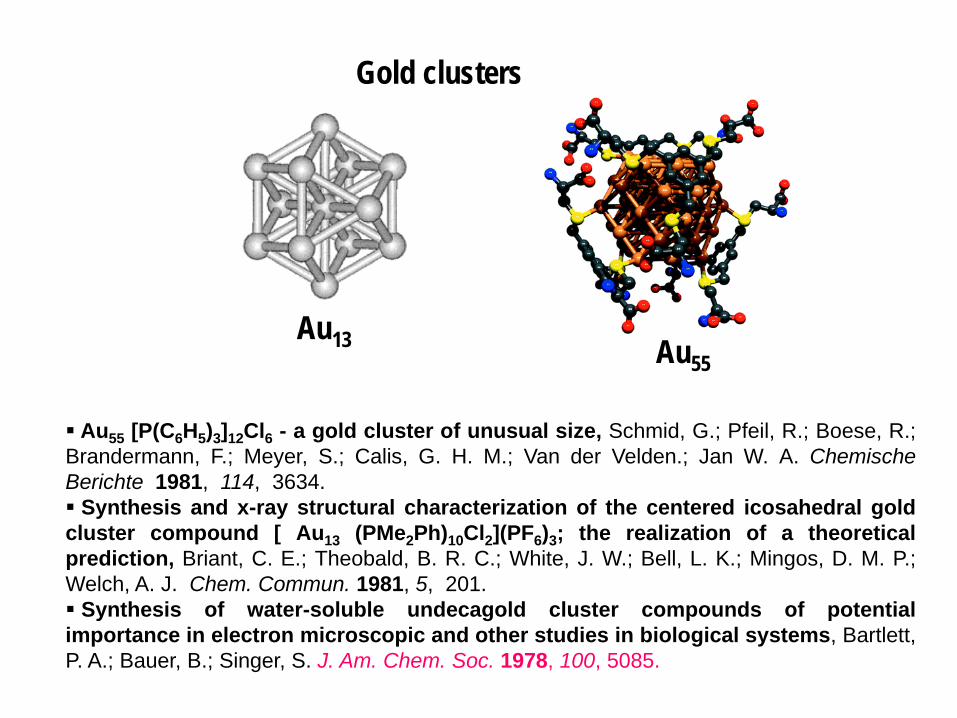
Au13 Au55
Gold clusters
Au55 [P(C6H5)3]12Cl6 - a gold cluster of unusual size, Schmid, G.; Pfeil, R.; Boese, R.;Brandermann, F.; Meyer, S.; Calis, G. H. M.; Van der Velden.; Jan W. A. ChemischeBerichte 1981, 114, 3634. Synthesis and x-ray structural characterization of the centered icosahedral goldcluster compound [ Au13 (PMe2Ph)10Cl2](PF6)3; the realization of a theoreticalprediction, Briant, C. E.; Theobald, B. R. C.; White, J. W.; Bell, L. K.; Mingos, D. M. P.;Welch, A. J. Chem. Commun. 1981, 5, 201. Synthesis of water-soluble undecagold cluster compounds of potentialimportance in electron microscopic and other studies in biological systems, Bartlett,P. A.; Bauer, B.; Singer, S. J. Am. Chem. Soc. 1978, 100, 5085.

From Gunter Schmidt, Chem. Soc. Rev. 2008, 37, 1909–1930
Magic clusters
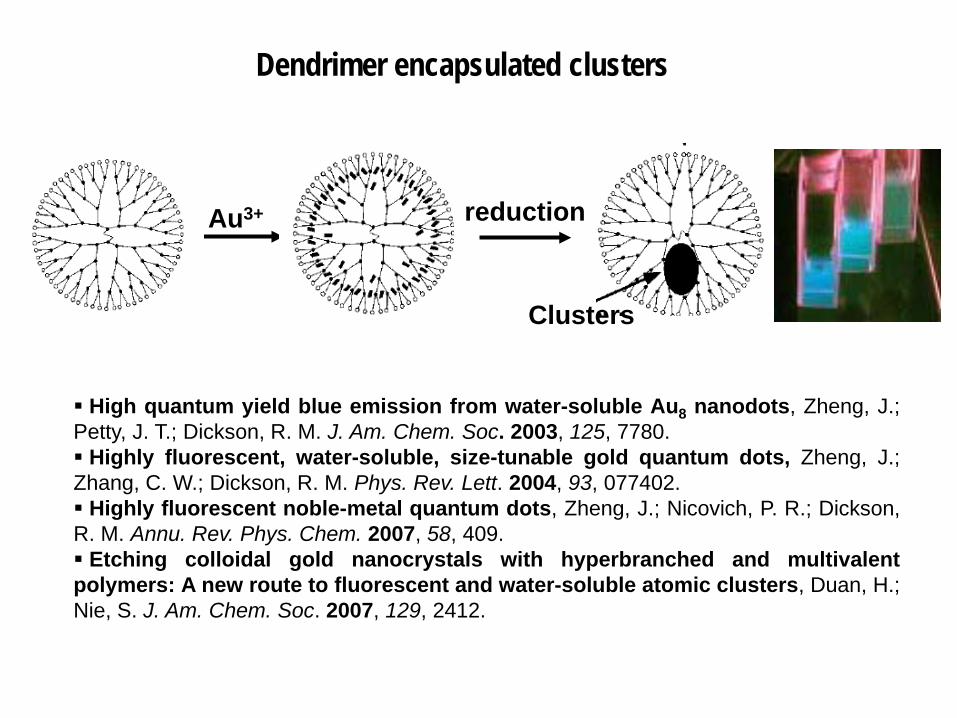
Au3+
Clusters
reduction
Dendrimer encapsulated clusters
High quantum yield blue emission from water-soluble Au8 nanodots, Zheng, J.;Petty, J. T.; Dickson, R. M. J. Am. Chem. Soc. 2003, 125, 7780. Highly fluorescent, water-soluble, size-tunable gold quantum dots, Zheng, J.;Zhang, C. W.; Dickson, R. M. Phys. Rev. Lett. 2004, 93, 077402. Highly fluorescent noble-metal quantum dots, Zheng, J.; Nicovich, P. R.; Dickson,R. M. Annu. Rev. Phys. Chem. 2007, 58, 409. Etching colloidal gold nanocrystals with hyperbranched and multivalentpolymers: A new route to fluorescent and water-soluble atomic clusters, Duan, H.;Nie, S. J. Am. Chem. Soc. 2007, 129, 2412.
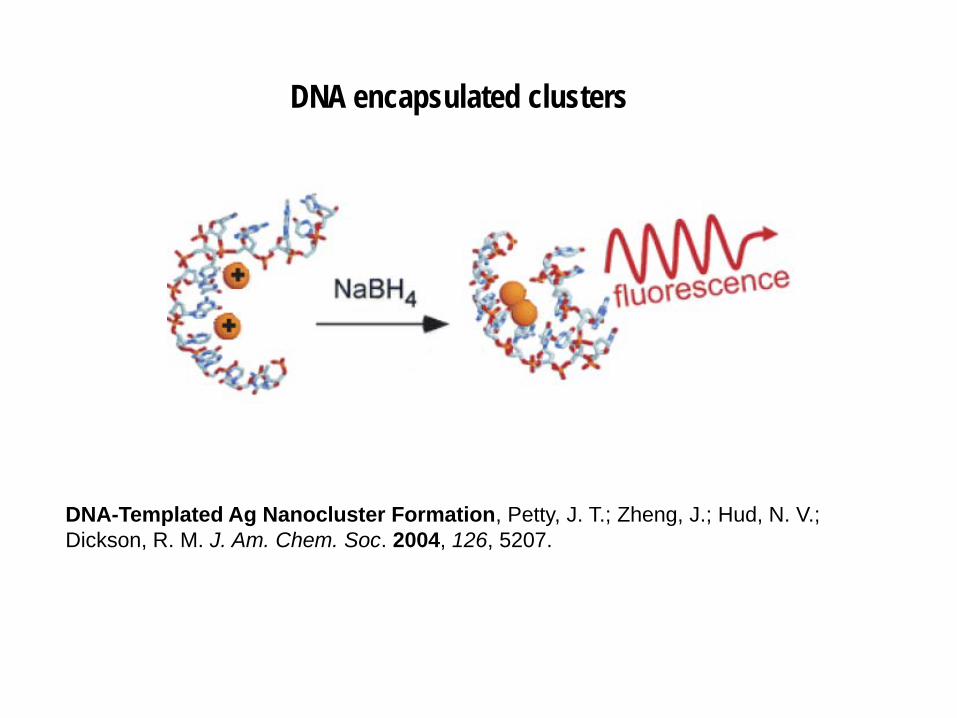
DNA encapsulated clusters
DNA-Templated Ag Nanocluster Formation, Petty, J. T.; Zheng, J.; Hud, N. V.; Dickson, R. M. J. Am. Chem. Soc. 2004, 126, 5207.
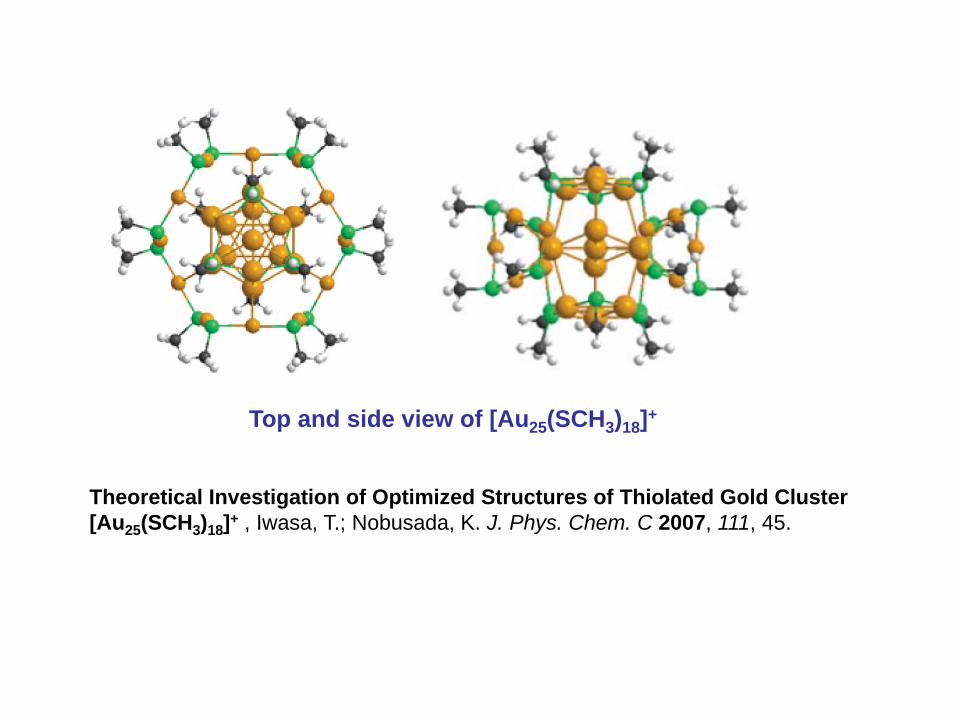
Top and side view of [Au25(SCH3)18]+
Theoretical Investigation of Optimized Structures of Thiolated Gold Cluster [Au25(SCH3)18]+ , Iwasa, T.; Nobusada, K. J. Phys. Chem. C 2007, 111, 45.

Au102
Jadzinsky, P. D.; Calero, G.; Ackerson, C. J.; Bushnell, D. A.; Kornberg, R. D. Structure of aThiol Monolayer–Protected Gold Nanoparticle at 1.1 Å Resolution Science 2007, 318,430.
Au102(p-MBA)44

400 600 8000.0
0.7
1.4
2.1
c
b
a
a - Au-citrateb - Au-C18c - Au25
Abso
rban
ce
Wavelength (nm)
Optical absorption (extinction) spectrum of (a) 15 nm gold particles in aqueous solution (labeled Au@citrate). The spectrum of (b) 3 nm particles in toluene is also shown. See the broadening of the plasmon feature. The spectrum of (c) Au25 in water. In this, there is no plasmon excitation and all the features are due to molecular absorptions of the cluster.
Das, Choi, Yu and Pradeep, Nanofluids, John Wiley, New York, 2008
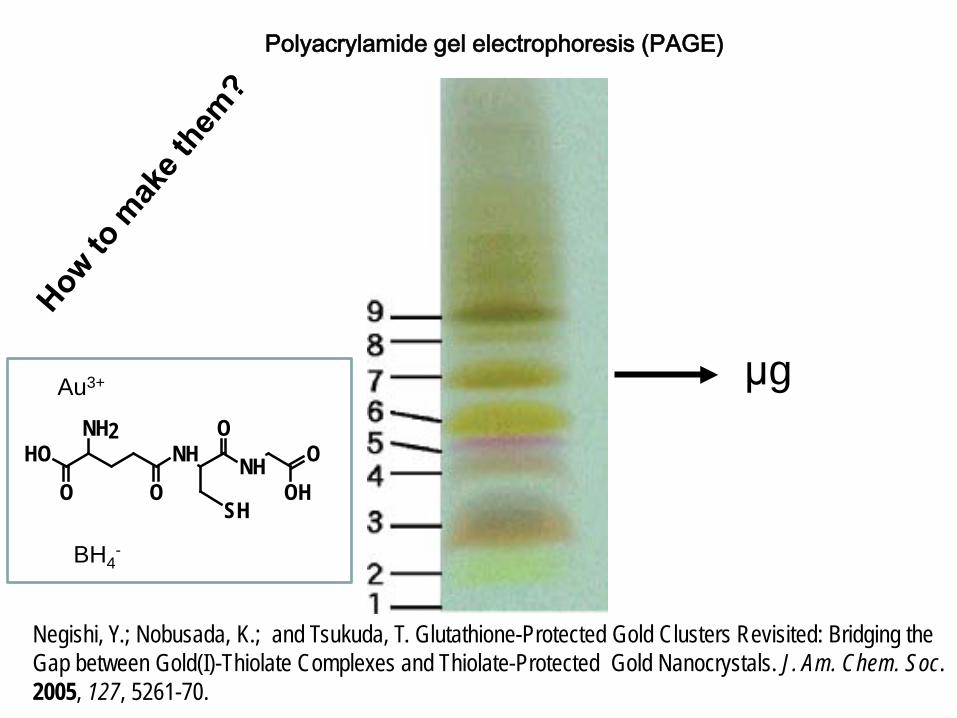
Polyacrylamide gel electrophoresis (PAGE)
Negishi, Y.; Nobusada, K.; and Tsukuda, T. Glutathione-Protected Gold Clusters Revisited: Bridging the Gap between Gold(I)-Thiolate Complexes and Thiolate-Protected Gold Nanocrystals. J. Am. Chem. Soc. 2005, 127, 5261-70.
μgO
ONHOHOO
OHNH2
NH
SH
Au3+
BH4-

Au25SG18
Synthesis: Au25 clusters can be preferentially populated by dissociative excitation of larger precursors
Scheme showing the synthesis of Au25SG18 clusters

Characterization of Au25SG18
Optical absorption spectrum with anabsorption maximum at 672 nm.
Photoluminescence profile with excitationand emission maxima at 535 and 700 nm, respectively.
Tsukuda et. al. JACS 2005
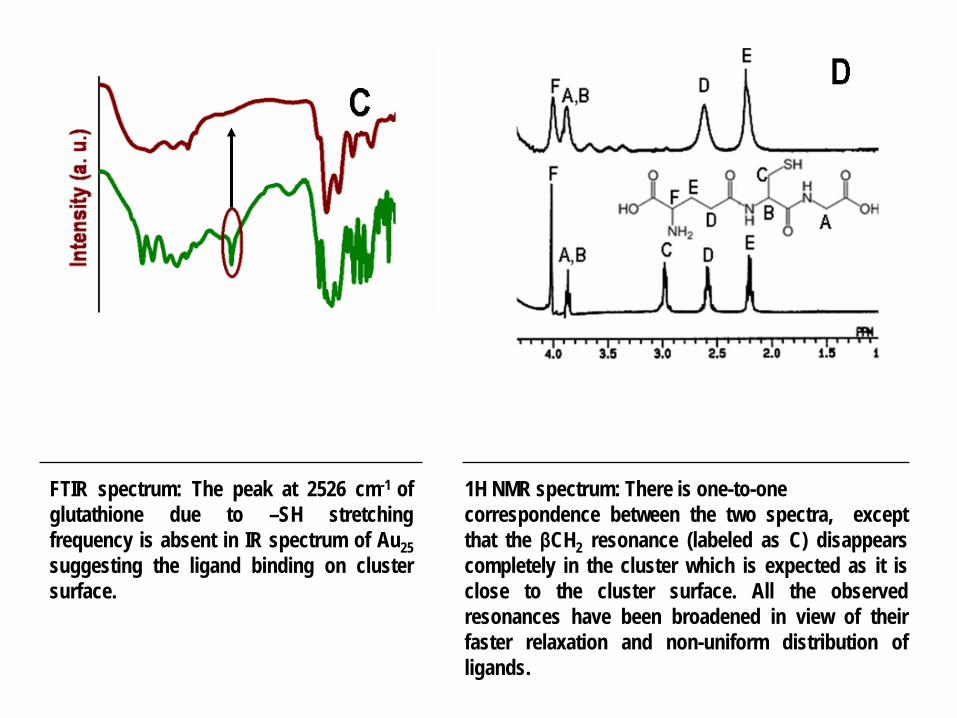
FTIR spectrum: The peak at 2526 cm-1 ofglutathione due to –SH stretchingfrequency is absent in IR spectrum of Au25suggesting the ligand binding on clustersurface.
1H NMR spectrum: There is one-to-onecorrespondence between the two spectra, exceptthat the βCH2 resonance (labeled as C) disappearscompletely in the cluster which is expected as it isclose to the cluster surface. All the observedresonances have been broadened in view of theirfaster relaxation and non-uniform distribution ofligands.
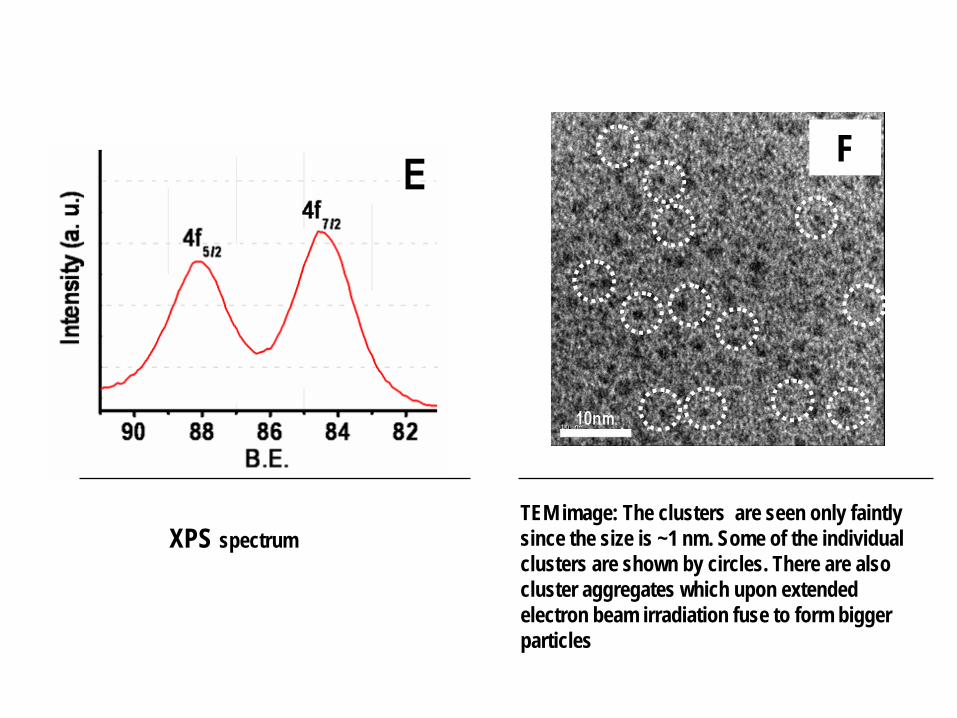
F
XPS spectrumTEM image: The clusters are seen only faintly since the size is ~1 nm. Some of the individual clusters are shown by circles. There are also cluster aggregates which upon extended electron beam irradiation fuse to form bigger particles

With Arindam Banerjee
Perumal Ramasamy et al. J. Mater. Chem., 2009, 19, 8456.

OONH
OHOOOH
NH2NH
SH(GSH)(MB) OH
HSCH3
CH3
(NAGSH and NFGSH)
OONH
OHOOOH NH
SH
NHR
O
1
1
2
3&4
Ligand exchange of Au25
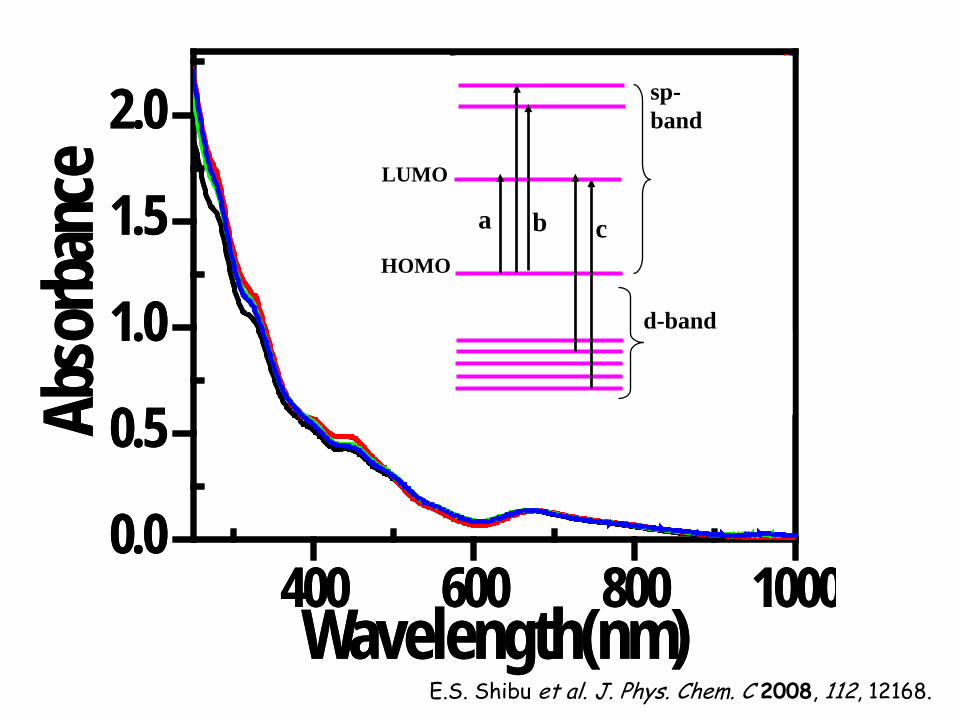
400 600 800 10000.0
0.5
1.0
1.5
2.0Ab
sorb
ance
Wavelength(nm)
2 3 4 50.00
27.00k54.00k81.00k
108.00k135.00k
I(E)=A
(W)xW
2
Energy (eV)
Au25SG18Au25-MBAu25-SGANAu25-SGFN
400 600 800 10000.0
0.5
1.0
1.5
2.0Ab
sorb
ance
Wavelength(nm)
2 3 4 50.00
27.00k54.00k81.00k
108.00k135.00k
I(E)=A
(W)xW
2
Energy (eV)
Au25SG18Au25-MBAu25-SGANAu25-SGFN
a b cHOMO
LUMO
sp-band
d-band
E.S. Shibu et al. J. Phys. Chem. C 2008, 112, 12168.
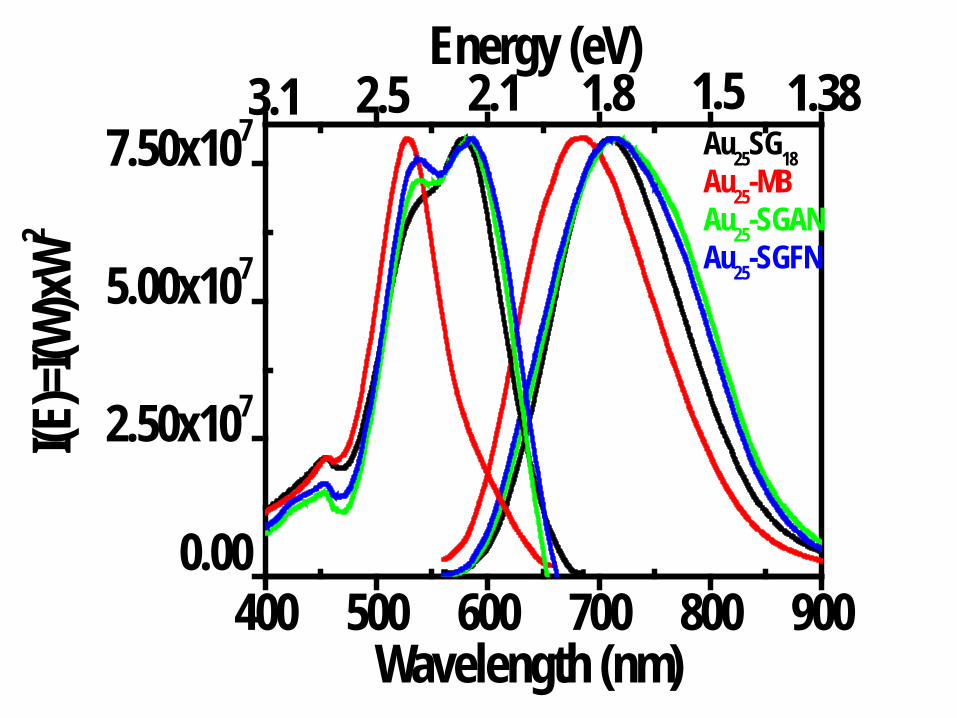
400 500 600 700 800 9000.00
2.50x10⁷
5.00x10⁷
7.50x10⁷
Energy (eV)1.381.51.82.12.53.1
I(E)=I
(W)xW
2
Wavelength (nm)
Au25SG18Au25-MBAu25-SGANAu25-SGFN

Fluorescence : A comprehensive study betweenorganic dye, gold atoms and molecular clusters of gold
Lecoultrea, S.; Rydlo, A.; F elixb, C.; Harbich, W. Eur. Phys. J. D, 2009 DOI: 10.1140/epjd/e2008-00290-0
1.5 2.0 2.50.0
5.0x10⁶
1.0x10⁷
1.5x10⁷
2.0x10⁷
Inten
sity (
a. u.)
Wavelength (eV)
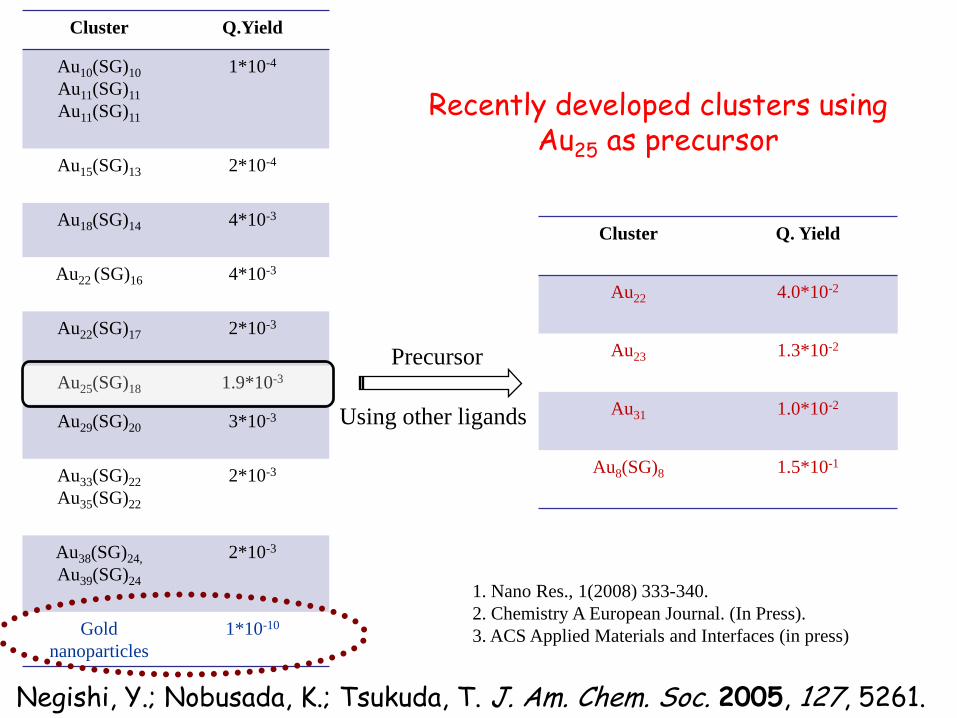
Cluster Q.Yield
Au10(SG)10Au11(SG)11Au11(SG)11
1*10-4
Au15(SG)13 2*10-4
Au18(SG)14 4*10-3
Au22 (SG)16 4*10-3
Au22(SG)17 2*10-3
Au25(SG)18 1.9*10-3
Au29(SG)20 3*10-3
Au33(SG)22Au35(SG)22
2*10-3
Au38(SG)24,Au39(SG)24
2*10-3
Goldnanoparticles
1*10-10
Negishi, Y.; Nobusada, K.; Tsukuda, T. J. Am. Chem. Soc. 2005, 127, 5261.
Cluster Q. Yield
Au22 4.0*10-2
Au23 1.3*10-2
Au31 1.0*10-2
Au8(SG)8 1.5*10-1
1. Nano Res., 1(2008) 333-340.2. Chemistry A European Journal. (In Press).3. ACS Applied Materials and Interfaces (in press)
Precursor
Using other ligands
Recently developed clusters using Au25 as precursor
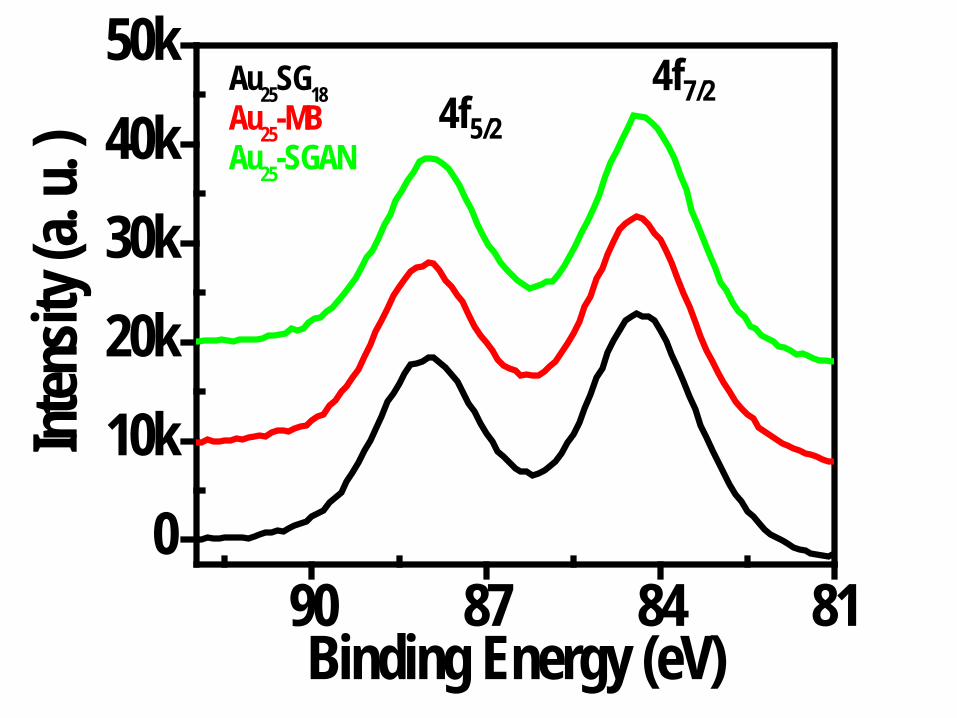
90 87 84 810
10k20k30k40k50k
Au25SG18Au25-MBAu25-SGAN
Inten
sity (
a. u.
)
Binding Energy (eV)
4f5/24f7/2
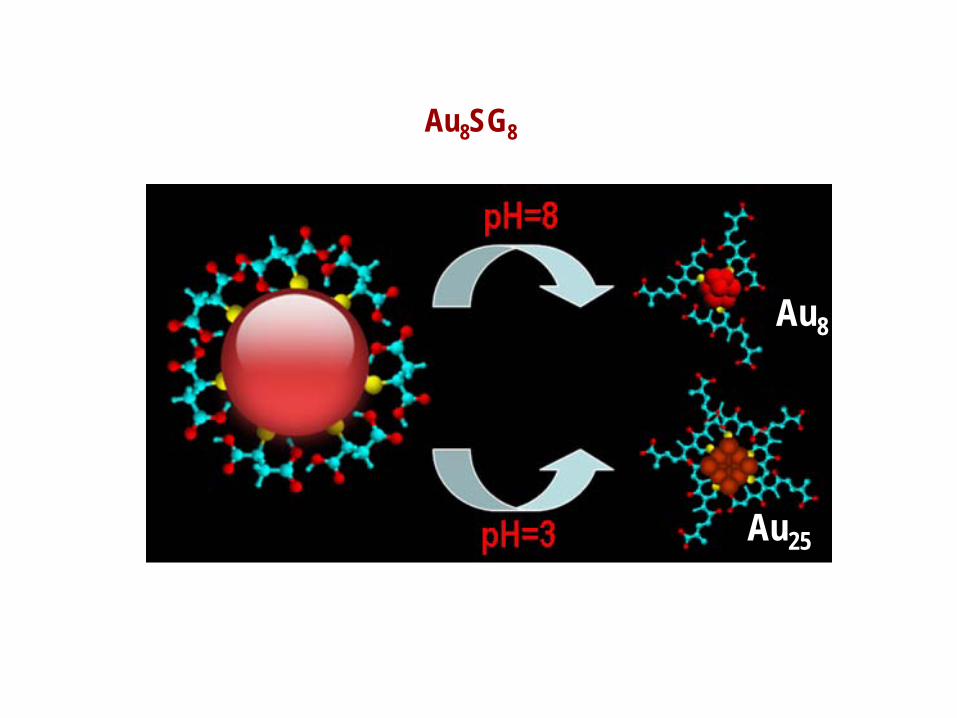
Au8SG8
Au8
Au25
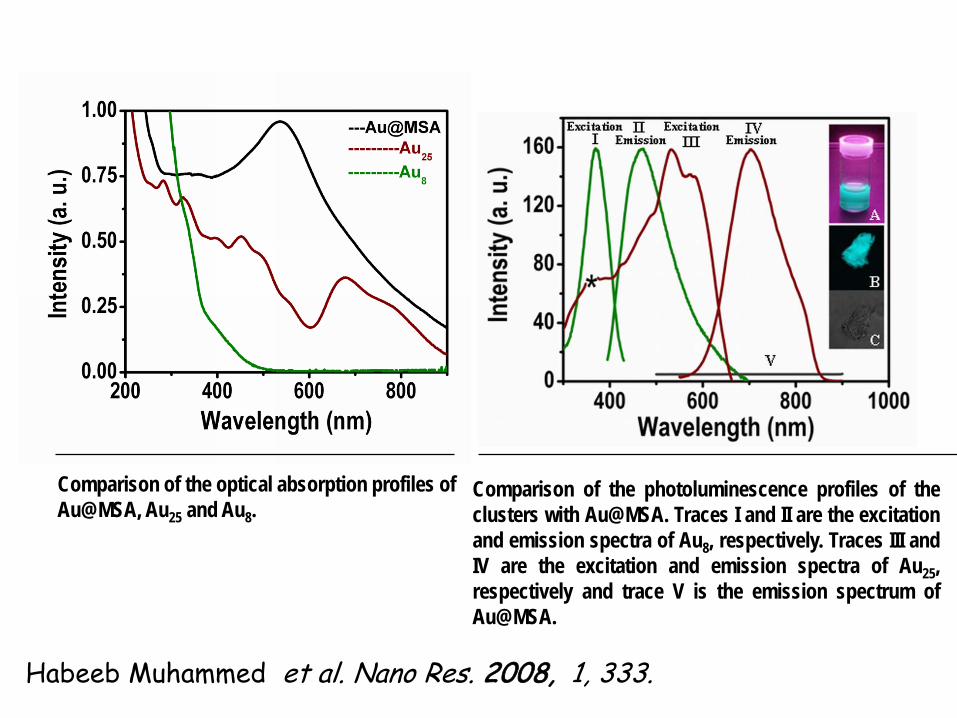
Comparison of the optical absorption profiles of Au@MSA, Au25 and Au8.
Comparison of the photoluminescence profiles of theclusters with Au@MSA. Traces I and II are the excitationand emission spectra of Au8, respectively. Traces III andIV are the excitation and emission spectra of Au25,respectively and trace V is the emission spectrum ofAu@MSA.
Habeeb Muhammed et al. Nano Res. 2008, 1, 333.
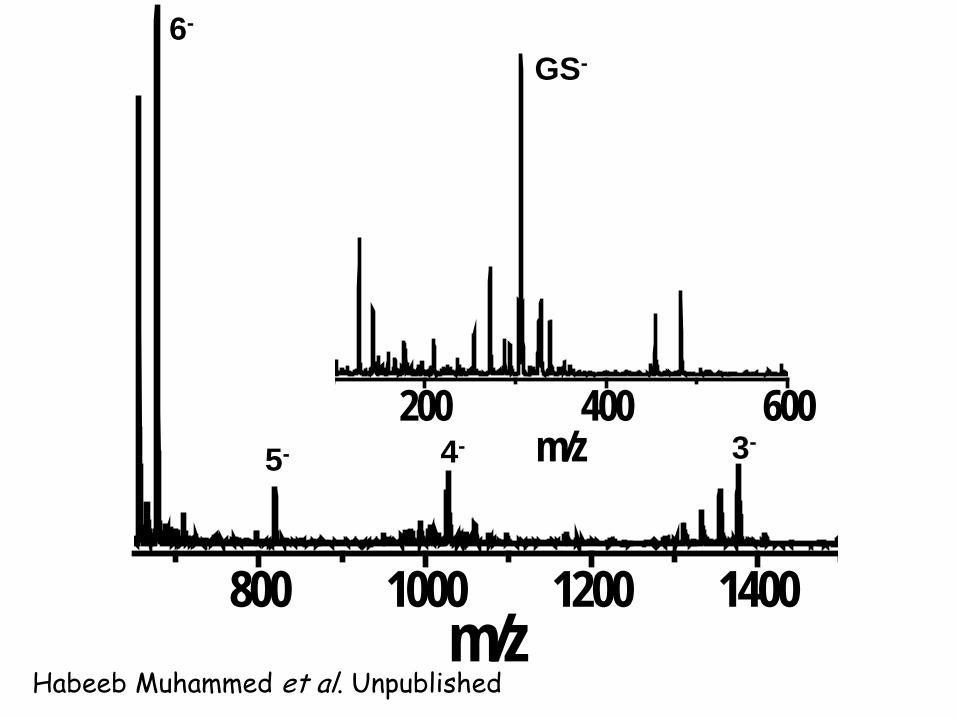
800 1000 1200 1400m/z
3-4-5-
6-
200 400 600
m/z
GS-
Habeeb Muhammed et al. Unpublished
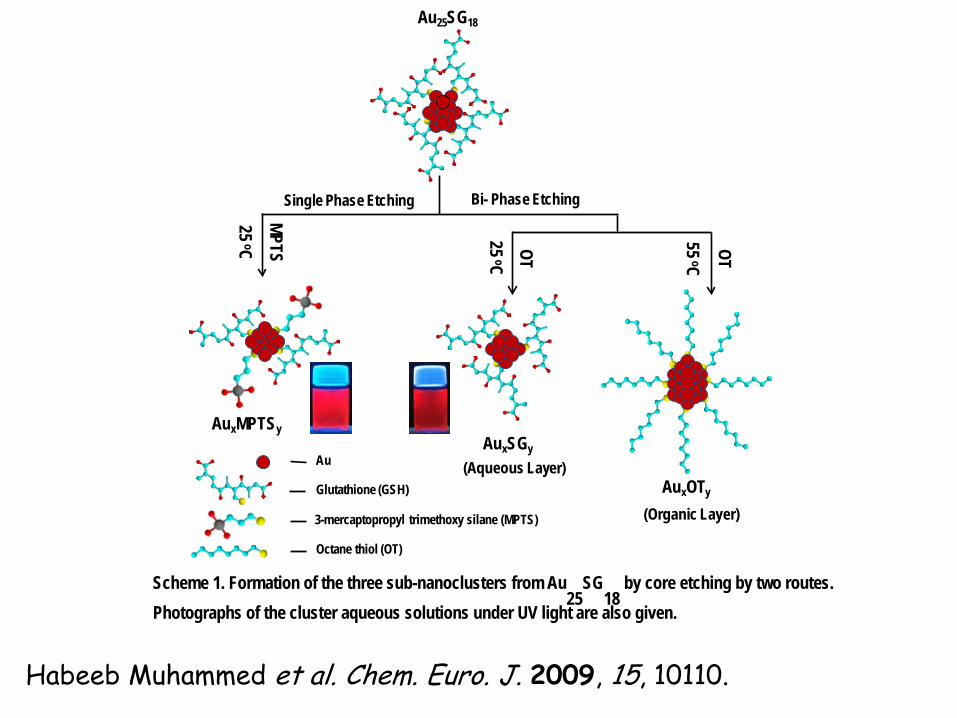
MPTS OTOT25 oC
55 oC
25 oC
3-mercaptopropyl trimethoxy silane (MPTS)
Au
Glutathione (GSH)
Octane thiol (OT)
AuxOTy
Au25SG18
AuxSGy
AuxMPTSy
Single Phase Etching Bi- Phase Etching
(Aqueous Layer)
(Organic Layer)
Scheme 1. Formation of the three sub-nanoclusters from Au25
SG18
by core etching by two routes. Photographs of the cluster aqueous solutions under UV light are also given.
Habeeb Muhammed et al. Chem. Euro. J. 2009, 15, 10110.

Wavelength (nm)
Inte
nsity
(a. u
.)
700500 600 800
3M
900
2M
1M
.5M
0
Photoluminescene profile of Au23 cluster before (pink trace) and after (orange trace) phase transfer.Emission of the cluster enhances considerably after the phase transfer. Photographs of the aqueous-toluene mixture containing the cluster before and after phase transfer under white light (A and B,respectively) and UV light (C and D, respectively). In C, only the interface is illuminated as the UV isattenuated as the sample was irradiated from the top
A
A B C
47.62 µm
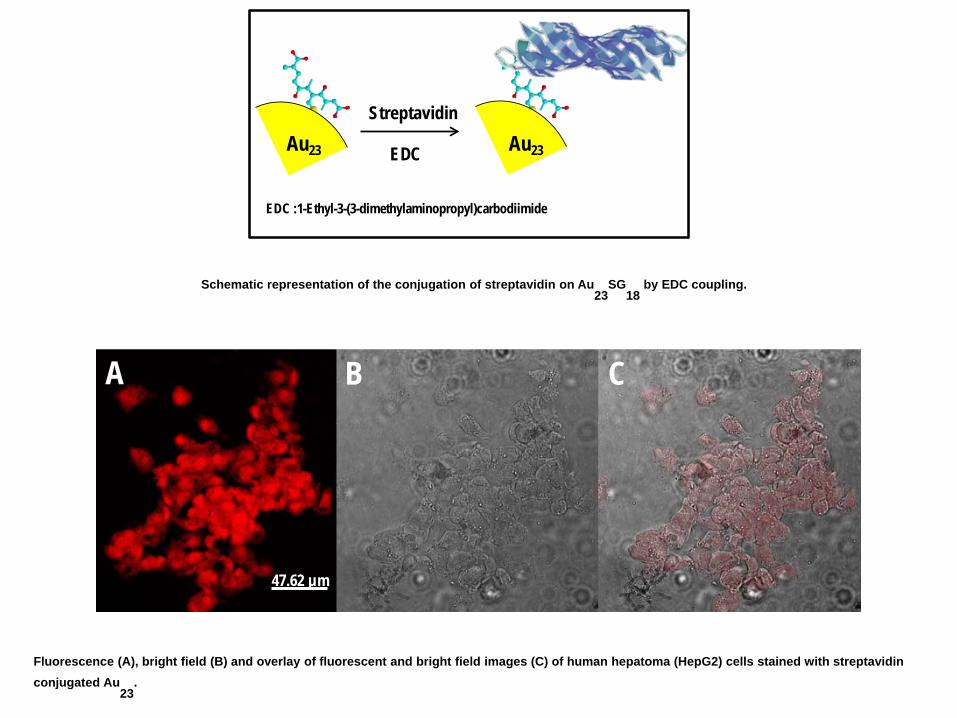
EDC
Streptavidin
EDC :1-Ethyl-3-(3-dimethylaminopropyl)carbodiimide
Au23 Au23
Schematic representation of the conjugation of streptavidin on Au23
SG18
by EDC coupling.
Fluorescence (A), bright field (B) and overlay of fluorescent and bright field images (C) of human hepatoma (HepG2) cells stained with streptavidin conjugated Au
23.

A B
Bright field (A) and fluorescence (B) images of HepG2 cells stained with unconjugated Au23clusters. No fluorescence was observed from the cells after washing

Fluorescent microscopic images showing interaction of Au-BSA-FA NCs with different types of cell lines: a1-a2) FR-ve lung carcinoma A549 after 2 hours of incubation, b1-b2) FR-ve lung carcinoma A549 after 24 hours of incubation, c1-c2) FR+ve KB cells with unconjugated Au clusters, d1-d2) FR+ve KB cells with FA conjugated Au clusters at 2 hrs, e1-e2) 4 hrs and f1-f 2) 24 hrs of incubation [Archana R, Sonali S, Deepthy M et al (2009) Molecular Receptor Specific, Non-toxic, Near-infrared Emitting Au Cluster-Protein Nanoconjugates for Targeted Cancer Imaging. Nanotechnology (in press)].
Nanotechnology 2010
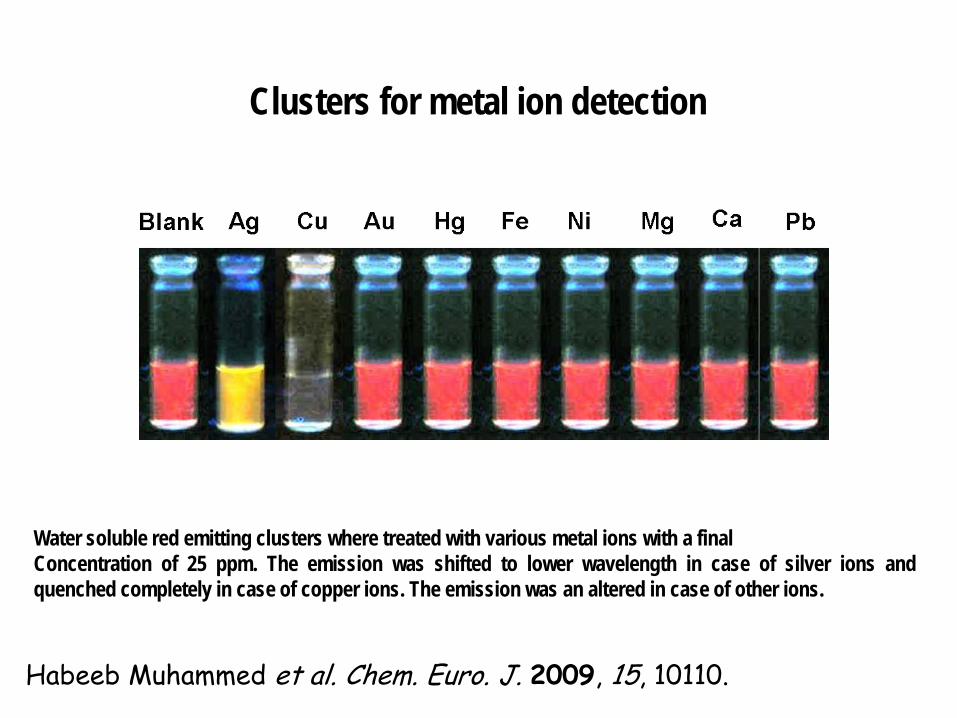
Clusters for metal ion detection
Water soluble red emitting clusters where treated with various metal ions with a finalConcentration of 25 ppm. The emission was shifted to lower wavelength in case of silver ions andquenched completely in case of copper ions. The emission was an altered in case of other ions.
Habeeb Muhammed et al. Chem. Euro. J. 2009, 15, 10110.
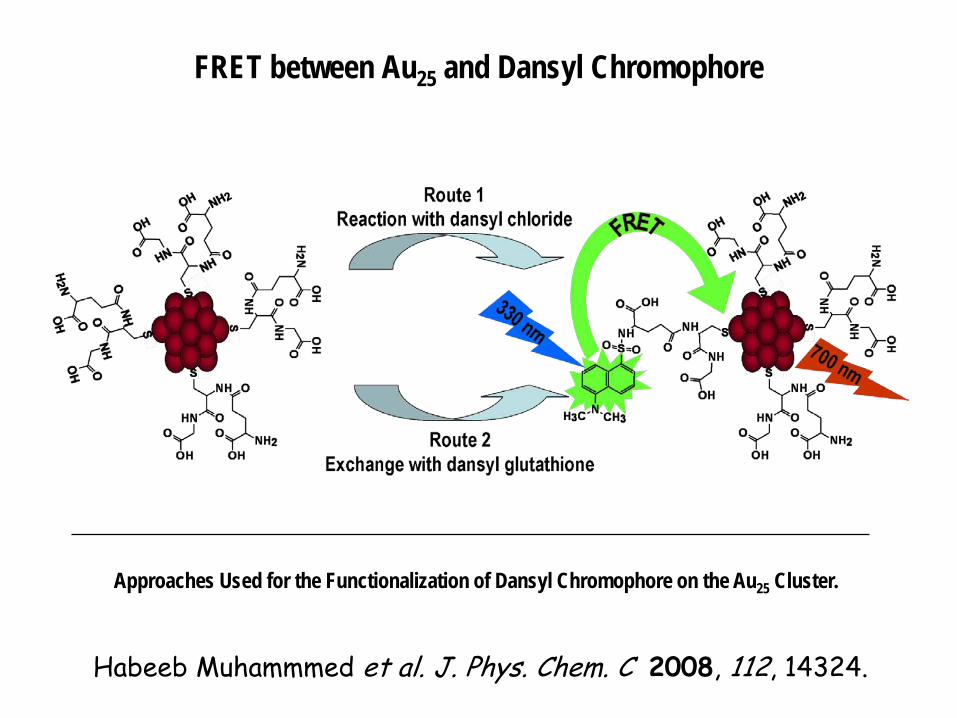
FRET between Au25 and Dansyl Chromophore
Approaches Used for the Functionalization of Dansyl Chromophore on the Au25 Cluster.
Habeeb Muhammmed et al. J. Phys. Chem. C 2008, 112, 14324.
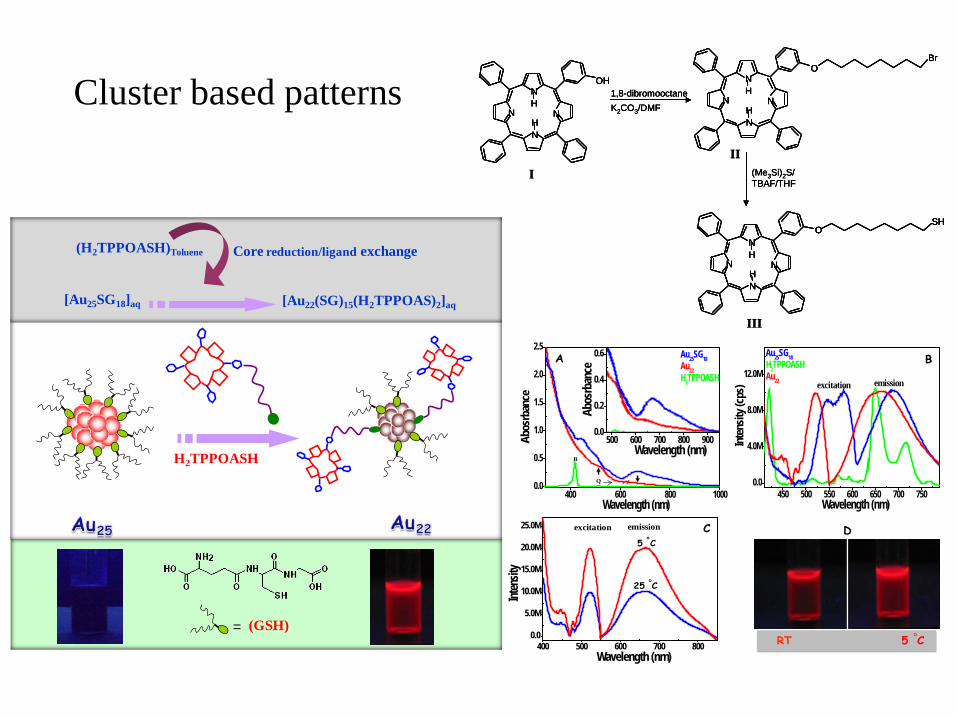
Cluster based patterns
(GSH)
H2TPPOASH
[Au25SG18]aq [Au22(SG)15(H2TPPOAS)2]aq
(H2TPPOASH)Toluene
=
Core reduction/ligand exchange
400 600 800 10000.0
0.5
1.0
1.5
2.0
2.5
Abos
rban
ceWavelength (nm)
Au25SG18Au22H2TPPOASH
450 500 550 600 650 700 7500.0
4.0M
8.0M
12.0M
Au25SG18H2TPPOASHAu22 emissionexcitation
Inten
sity (
cps)
Wavelength (nm)
RT 5 °C
A B
C D
25 °C
5 °C
400 500 600 700 8000.0
5.0M
10.0M
15.0M
20.0M
25.0M
Wavelength (nm)
Inten
sity
excitation emission
500 600 700 800 9000.0
0.2
0.4
0.6
Abos
rban
ce
Wavelength (nm)B
Q
N
N
N
N
H
H
OH1,8-dibromooctaneK2CO3/DMF
OBr
N
N
N
N
H
H
OSH
N
N
N
N
H
H
(Me3Si)2S/TBAF/THF
III
III
N
N
N
N
H
H
OH1,8-dibromooctaneK2CO3/DMF
OBr
N
N
N
N
H
H
OSH
N
N
N
N
H
H
(Me3Si)2S/TBAF/THF
N
N
N
N
H
H
OH
N
N
N
N
H
H
OH1,8-dibromooctaneK2CO3/DMF
OBr
N
N
N
N
H
H
OBr
N
N
N
N
H
H
OSH
N
N
N
N
H
H
OSH
N
N
N
N
H
H
(Me3Si)2S/TBAF/THF
III
III
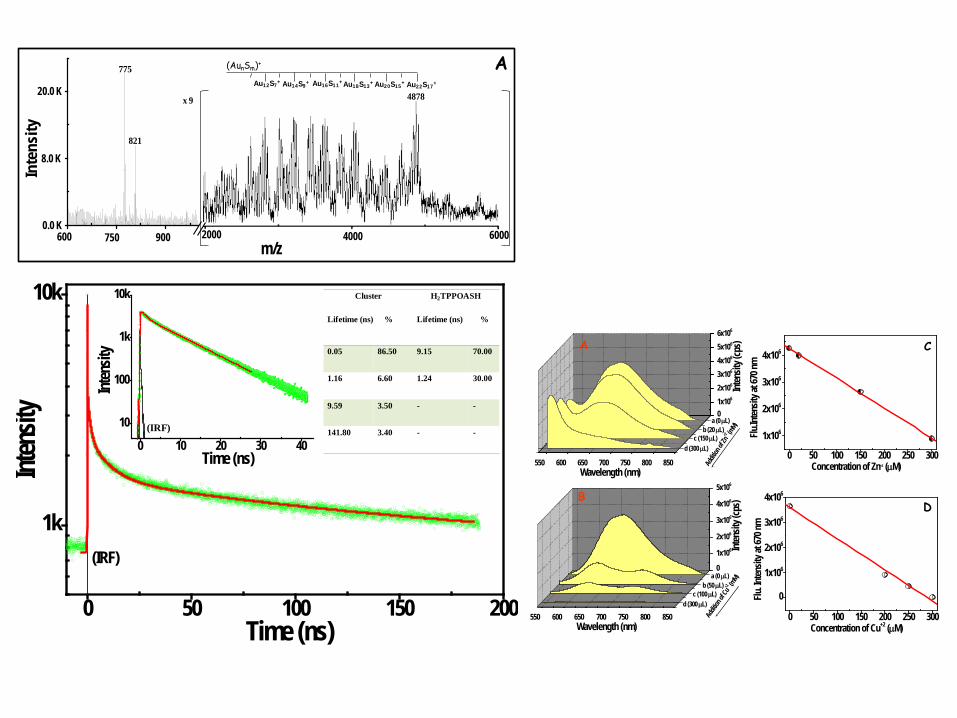
Au22S17+Au20S15
+Au18S13+Au16S11
+Au14S9+Au12S7
+
(AunSm)+775
4878
821
A
m/z2000 4000 6000600 750 900
8.0 K
20.0 K
0.0 K
Inte
nsity
x 9
550 600 650 700 750 800 850
0
1x10⁶
2x10⁶
3x10⁶
4x10⁶
5x10⁶
Addit
ion of
Cu+2 (m
M)
d (300 µL)c (100 µL)
b (50 µL)a (0 µL)
Wavelength (nm)
Inten
sity (
cps)
1
2
3
4
550 600 650 700 750 800 850
01x106
2x10⁶
3x10⁶
4x10⁶
5x10⁶
6x10⁶
Addit
ion of
Zn+2 (m
M)
d (300 µL)c (150 µL)
b (20 µL)a (0 µL)
Wavelength (nm)
Inten
sity (
cps)
0 50 100 150 200 250 300
1x10⁶
2x10⁶
3x10⁶
4x10⁶
Flu.In
tensit
y at 6
70 nm
Concentration of Zn+2 (µM)
0 50 100 150 200 250 300
0
1x10⁶
2x10⁶
3x10⁶
4x10⁶
Flu. In
tensit
y at 6
70 nm
Concentration of Cu+2 (µM)
A
B
C
D
0 50 100 150 200
1k
10k
Inten
sity
Time (ns)
(IRF)
Cluster
Lifetime (ns) %
H2TPPOASH
Lifetime (ns) %
0.05 86.50 9.15 70.00
1.16 6.60 1.24 30.00
9.59 3.50 - -
141.80 3.40 - -
0 10 20 30 40
10
100
1k
10k
Inten
sity
Time (ns)
(IRF)
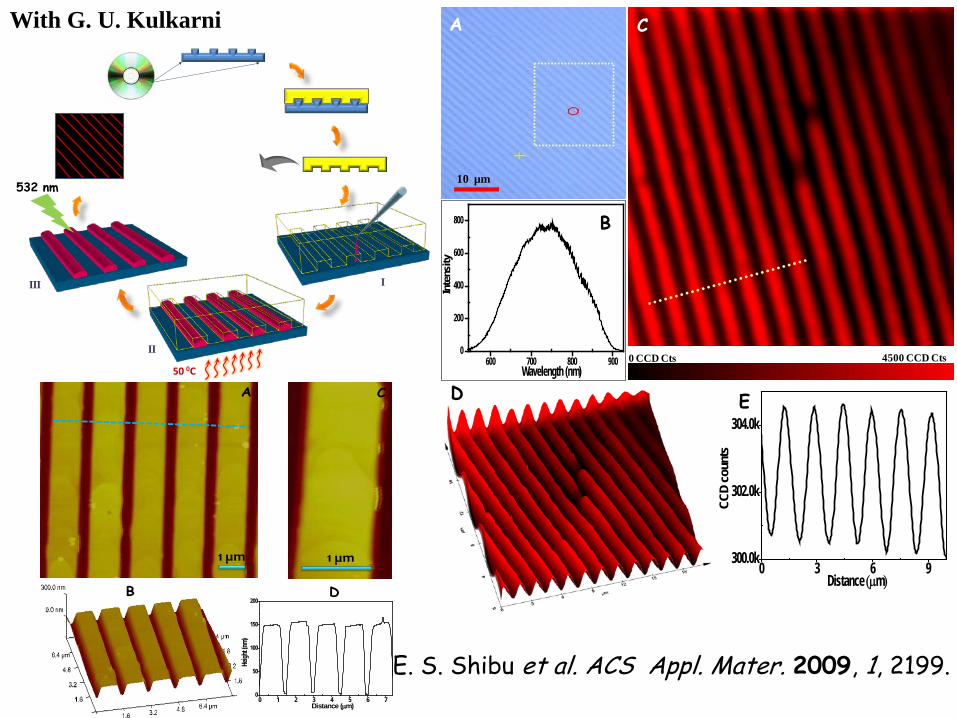
I
50 0C
II
III
532 nm
A
B D
C
1 µm 1 µm
0 1 2 3 4 5 6 70
50
100
150
200
Heigh
t (nm)
Distance (µm)
10 µm
0 CCD Cts 4500 CCD Cts600 700 800 9000
200
400
600
800
Inte
nsity
Wavelength (nm)
A C
B
D E
0 3 6 9300.0k
302.0k
304.0k
CCD
coun
ts
Distance (µm)
E. S. Shibu et al. ACS Appl. Mater. 2009, 1, 2199.
With G. U. Kulkarni
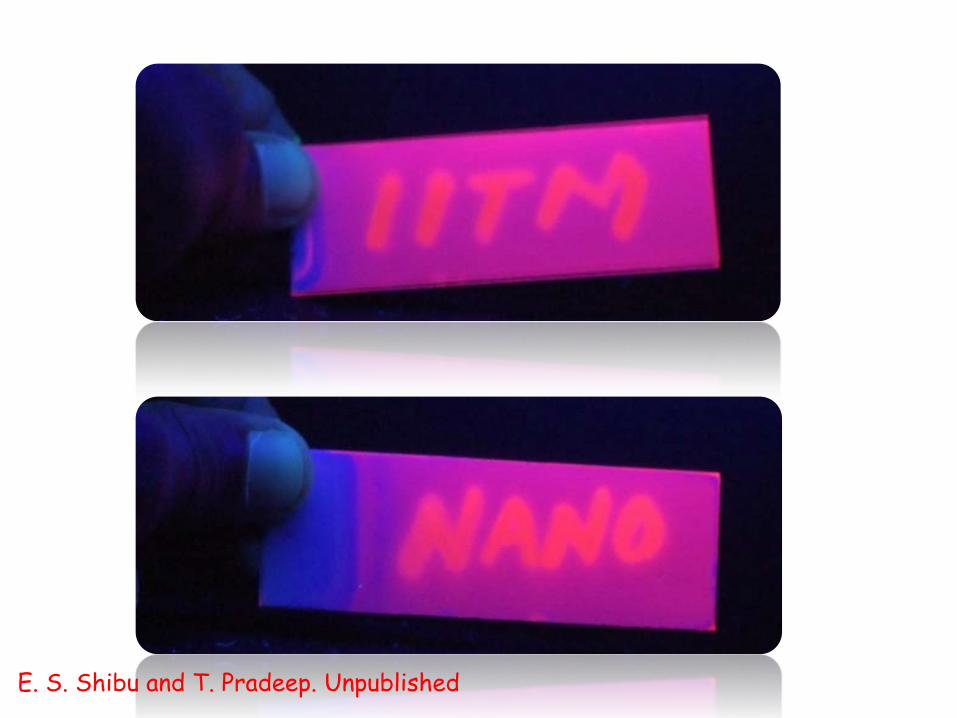
E. S. Shibu and T. Pradeep. Unpublished

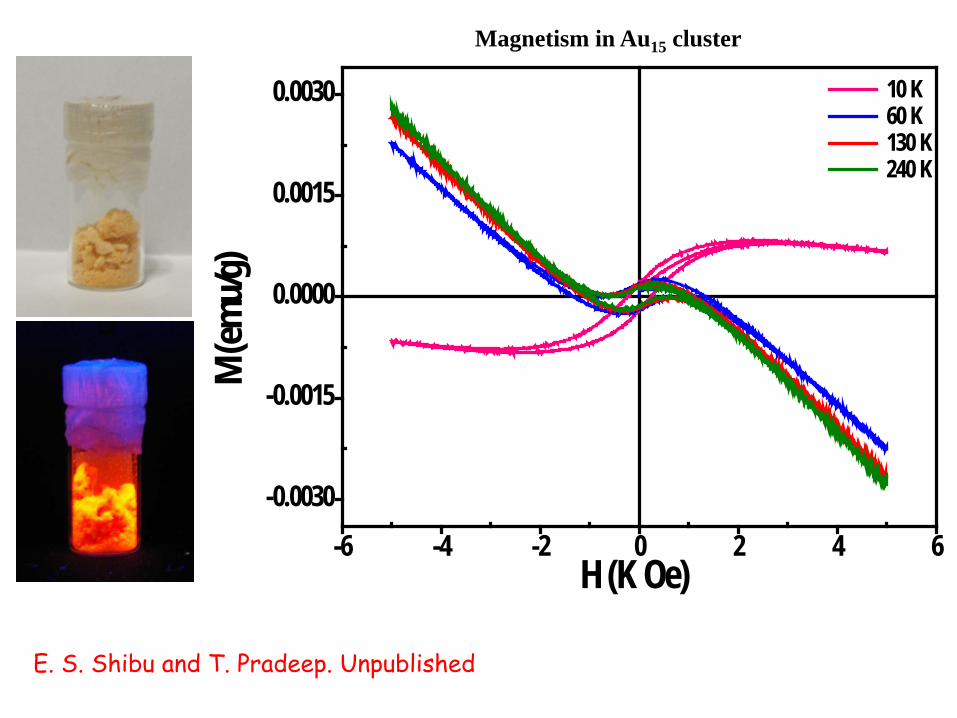
-6 -4 -2 0 2 4 6-0.0030
-0.0015
0.0000
0.0015
0.0030 10 K 60 K 130 K 240 K
M (em
u/g)
H (K Oe)
E. S. Shibu and T. Pradeep. Unpublished
Magnetism in Au15 cluster
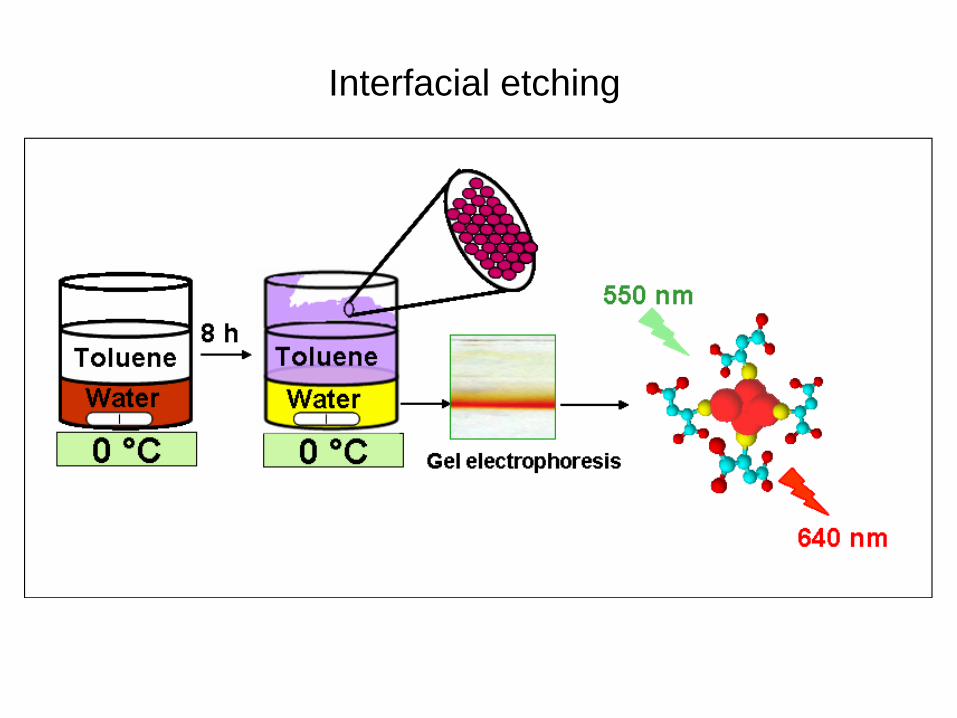
Interfacial etching
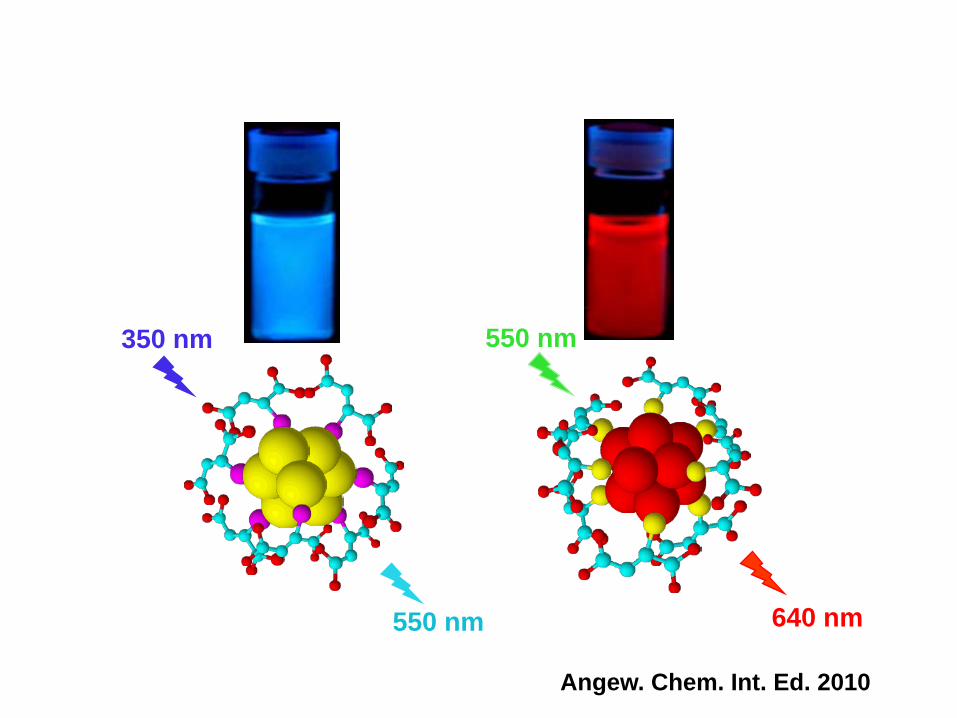
550 nm
640 nm
350 nm
550 nm
Angew. Chem. Int. Ed. 2010

White light RT
TUV lightWhite light RT
TUV lightWhite light RT
TUV light

500 1000 1500 2000 25000
3x10³
6x10³
9x10³Int
ensit
y (a.u
.)
m/z
A B
C
Ag9S5
Ag11S6
Ag13S7Ag15S8
Ag17S9
Ag7S4
Ag5S4
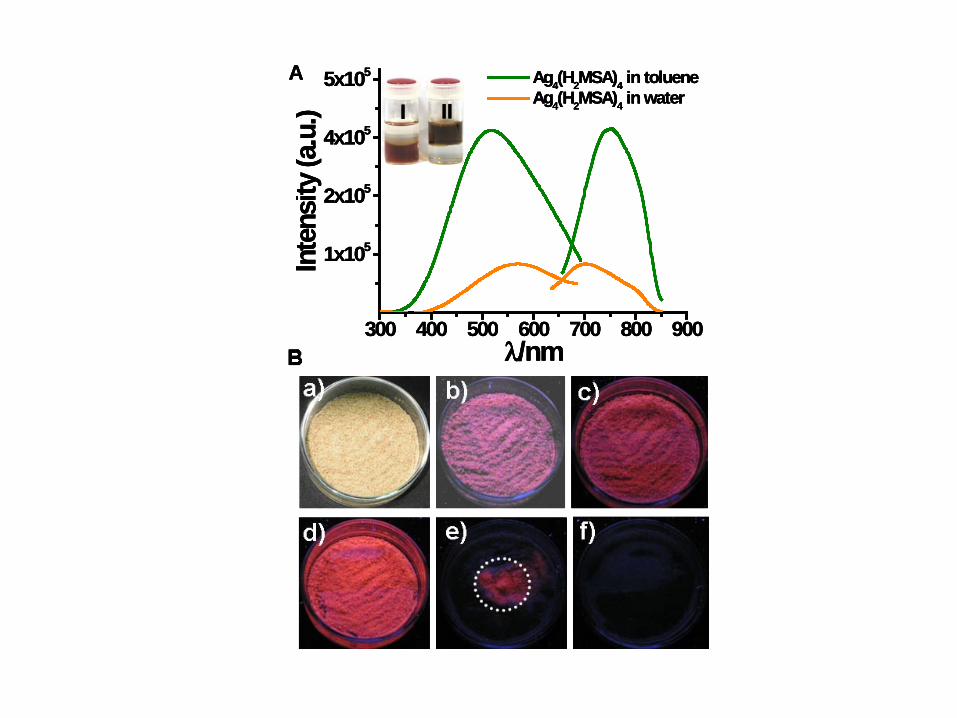
300 400 500 600 700 800 900
1x10⁵
2x10⁵
4x10⁵
5x10⁵
Ag4(H2MSA)4 in toluene Ag4(H2MSA)4 in water
Inte
nsity
(a.u
.)λ/nm
A
I II
300 400 500 600 700 800 900
1x10⁵
2x10⁵
4x10⁵
5x10⁵
Ag4(H2MSA)4 in toluene Ag4(H2MSA)4 in water
Inte
nsity
(a.u
.)λ/nm
A
300 400 500 600 700 800 900
1x10⁵
2x10⁵
4x10⁵
5x10⁵
Ag4(H2MSA)4 in toluene Ag4(H2MSA)4 in water
Inte
nsity
(a.u
.)λ/nm
A
I III III II
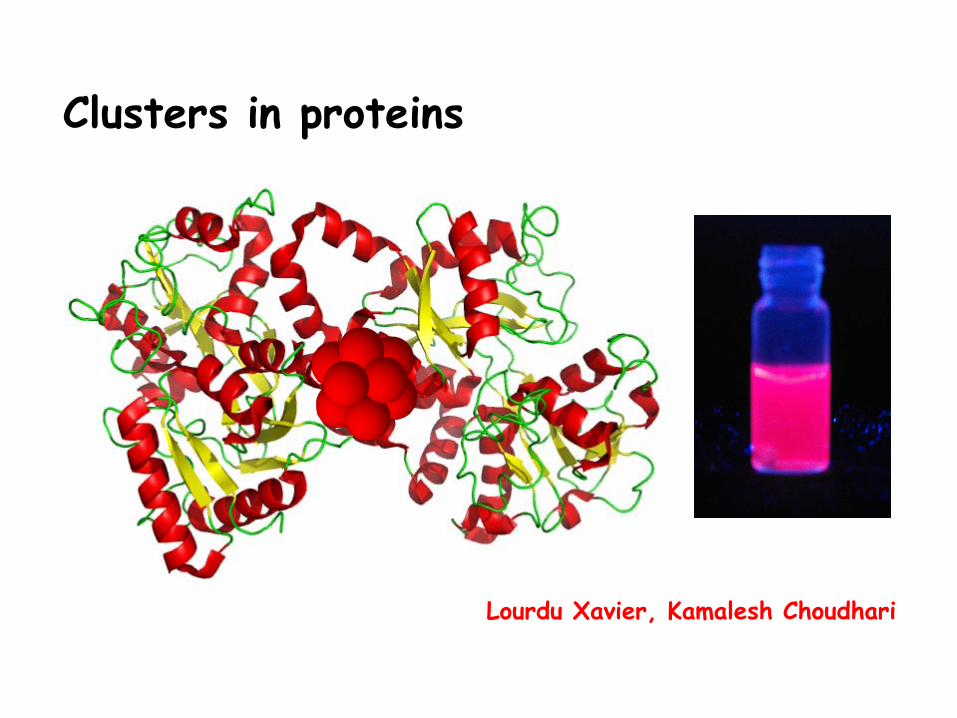
Clusters in proteins
Lourdu Xavier, Kamalesh Choudhari
Nothing Gold Can StayRobert Frost (1923)
Nature’s first green is gold,Her hardest hue to hold.Her early leaf’s a flower;But only so an hour.Then leaf subsides to leaf.So Eden sank to grief,So dawn goes down to day.Nothing gold can stay.

E. F. Schumacher
IIT Madras
Nano Mission, Department of Science and Technology
Thanks!