t) ,opoI poriotIo , - Metromedia.metro.net/board/Items/2012/07_july/20120719EMACItem55.pdfGiven that...
30
55 Los Angeles County Metro .... ,opoI ...... "poriotIo ...... ..., One Gatewa Los Angeles, '-F\ YUV' ".,,::t)" EXECUTIVE MANAGEMENT COMMITTEE July 19, 2012 SUBJECT: CUMULATIVE IMPACTS OF SERVICE CHANGES SINCE JUNE 2007 ACTION: RECEIVE AND FILE INITIAL REPORT ON CUMULATIVE IMPACTS OF SERVICE CHANGES SINCE JUNE 2007 RECOMMENDATION Receive and file this report providing an evaluation on the cumulative impacts of service changes since June 2007. ISSUE At its March 24, 2011 meeting, the MTA Board of Directors (Board) approved service changes that went into effect June 26, 2011 or later. These changes were made based on guidance from the Board-approved Transit Service Policy which sets the load standard for buses at 1.3 (130% of seated capacity), focuses on reducing duplicative and unproductive services, and better integration of bus and rail services. Given that this service change represented the fourth major change over the past several years, the Board directed staff to evaluate the cumulative impacts of the service changes on passengers starting from June 2007. This report provides an assessment of the cumulative impacts of service changes implemented between June 2007 and June 2011. DISCUSSION As evident in Table 2 and 3, Metro bus service maintains the lowest load standard compared to peer agencies. Likewise Metro maintains the lowest farebox recovery ratio and one of the lowest fare revenue per boarding and base cash fare compared to peer domestic as well as international systems. Beginning in 1985, with voter approved propositions, such as Propositions A and C and Measure R, local sales tax revenue has been allocated to municipal transit operators. As a result, municipal bus operations have expanded. Metro Bus hours
-
Upload
nguyenmien -
Category
Documents
-
view
215 -
download
1
Transcript of t) ,opoI poriotIo , - Metromedia.metro.net/board/Items/2012/07_july/20120719EMACItem55.pdfGiven that...
55 ~ Los Angeles County
~ Metro .... ,opoI ...... "poriotIo ...... ...,
One Gatewa Los Angeles, '-F\ YUV' ".,,::t)"
EXECUTIVE MANAGEMENT COMMITTEE July 19, 2012
SUBJECT: CUMULATIVE IMPACTS OF SERVICE CHANGES SINCE JUNE 2007
ACTION: RECEIVE AND FILE INITIAL REPORT ON CUMULATIVE IMPACTS OF SERVICE CHANGES SINCE JUNE 2007
RECOMMENDATION
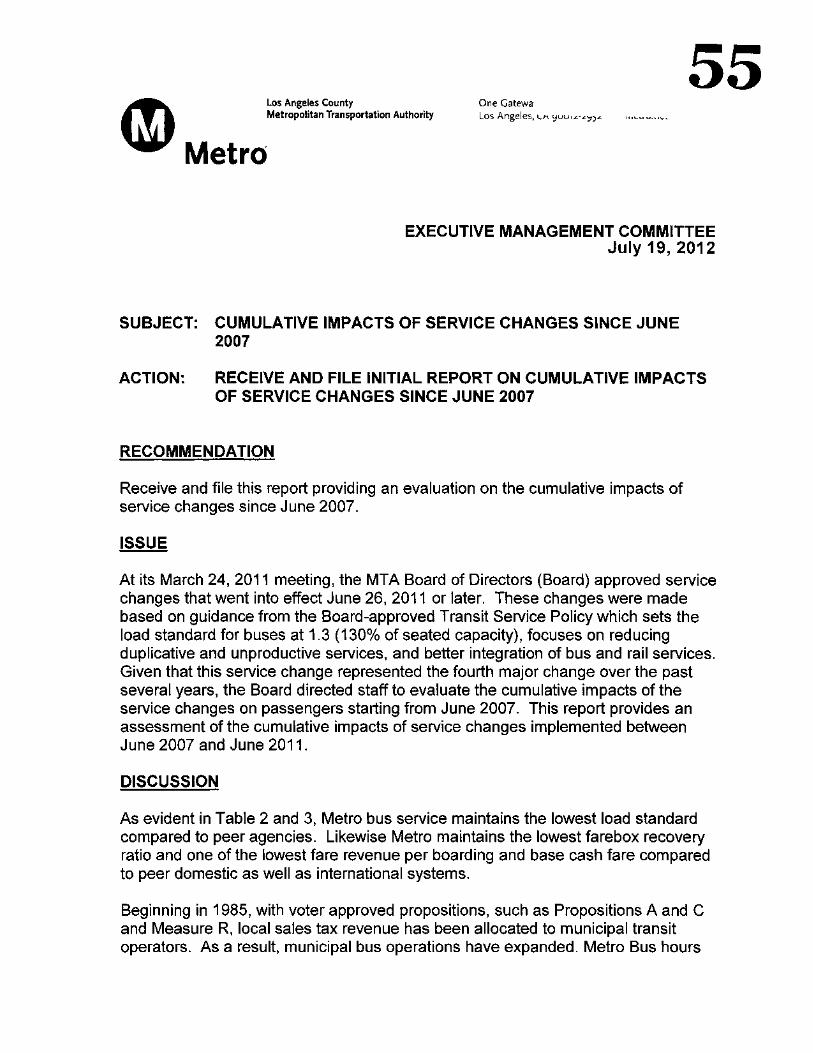
Receive and file this report providing an evaluation on the cumulative impacts of service changes since June 2007.
ISSUE
At its March 24, 2011 meeting, the MTA Board of Directors (Board) approved service changes that went into effect June 26, 2011 or later. These changes were made based on guidance from the Board-approved Transit Service Policy which sets the load standard for buses at 1.3 (130% of seated capacity), focuses on reducing duplicative and unproductive services, and better integration of bus and rail services. Given that this service change represented the fourth major change over the past several years, the Board directed staff to evaluate the cumulative impacts of the service changes on passengers starting from June 2007. This report provides an assessment of the cumulative impacts of service changes implemented between June 2007 and June 2011.
DISCUSSION
As evident in Table 2 and 3, Metro bus service maintains the lowest load standard compared to peer agencies. Likewise Metro maintains the lowest farebox recovery ratio and one of the lowest fare revenue per boarding and base cash fare compared to peer domestic as well as international systems.
Beginning in 1985, with voter approved propositions, such as Propositions A and C and Measure R, local sales tax revenue has been allocated to municipal transit operators. As a result, municipal bus operations have expanded. Metro Bus hours
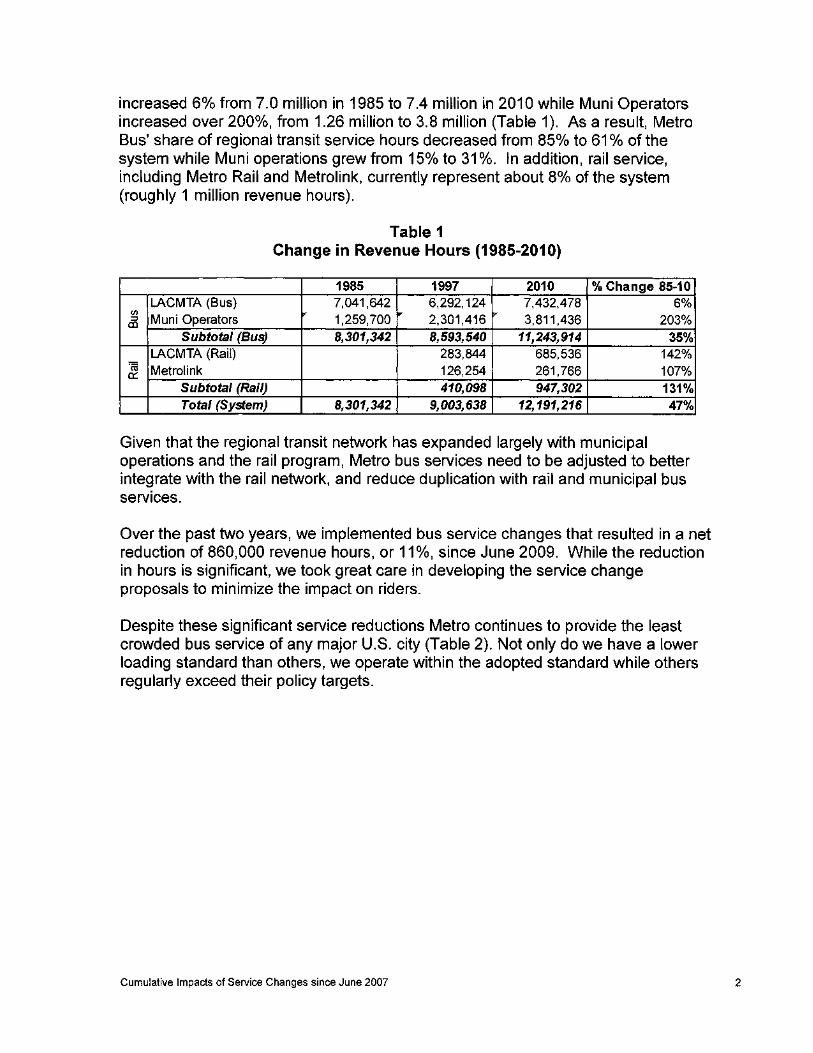
increased 6% from 7.0 million in 1985 to 7.4 million in 2010 while Muni Operators increased over 200%, from 1.26 million to 3.8 million (Table 1). As a result, Metro Bus' share of regional transit service hours decreased from 85% to 61 % of the system while Muni operations grew from 15% to 31 %. In addition, rail service, including Metro Rail and Metrolink, currently represent about 8% of the system (roughly 1 million revenue hours).
Table 1 Change in Revenue Hours (1985-2010)
1985 1997 2010 % Change 85-10 LACMTA (Bus) 7,041,642 6,292,124 7,432,478 6%
III Muni Operators v
'" v 3,811,436 &l 1,259,700 2,301,416 203% Subtotal (Bus) 8,301,342 8,593,540 11,243,914 35%
LACMTA (Rail) 283,844 685,536 142% 'ffi Metrolink 126,254 261,766 107% a::
Subtotal (Rail) 410,098 947,302 131% Total (System) 8,301,342 9,003,638 12,191,216 47%
Given that the regional transit network has expanded largely with municipal operations and the rail program, Metro bus services need to be adjusted to better integrate with the rail network, and reduce duplication with rail and municipal bus services.
Over the past two years, we implemented bus service changes that resulted in a net reduction of 860,000 revenue hours, or 11 %, since June 2009. While the reduction in hours is significant, we took great care in developing the service change proposals to minimize the impact on riders.
Despite these significant service reductions Metro continues to provide the least crowded bus service of any major U.S. city (Table 2). Not only do we have a lower loading standard than others, we operate within the adopted standard while others regularly exceed their policy targets.
Cumulative Impacts of Service Changes since June 2007 2
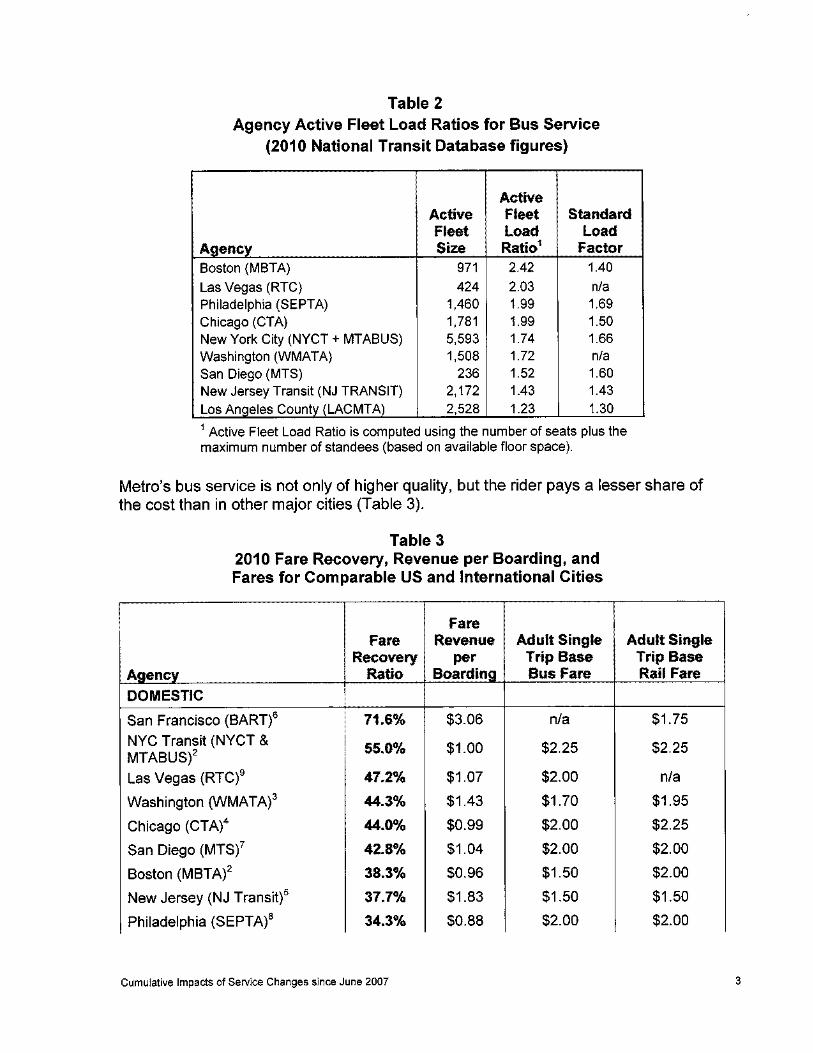
Table 2 Agency Active Fleet Load Ratios for Bus Service
(2010 National Transit Database figures)
Boston (MBTA) 971 2.42 1.40 Las Vegas (RTC) 424 2.03 nfa Philadelphia (SEPTA) 1,460 1.99 1.69 Chicago (CTA) 1,781 1.99 1.50 New York City (NYCT + MTABUS) 5,593 1.74 1.66 Washington (WMATA) 1,508 1.72 nfa San Diego (MTS) 236 1.52 1.60 New Jersey Transit (NJ TRANSIT) 2,172 1.43 1.43 Los MT 2 1.23 1.30
1 Active Fleet Load Ratio is computed using the number of seats plus the maximum number of standees (based on available floor space).
Metro's bus service is not only of higher quality, but the rider pays a lesser share of the cost than in other major cities (Table 3).
Table 3 2010 Fare Recovery, Revenue per Boarding, and Fares for Comparable US and International Cities
San Francisco (BART)6 $3.06 nla
NYC Transit (NYCT & $1.00 $2.25 MTABUS)2
Las Vegas (RTC)9 $1.07 $2.00
Washington (yIIMATA)3 $1.43 $1.70
Chicago (CTA)4 $0.99 $2.00
San Diego (MTSf $1.04 $2.00
Boston (MBTA)2 $0.96 $1.50
New Jersey (NJ Transit)5 $1.83 $1.50
Philadelphia (SEPTA)8 $0.88 $2.00
Cumulative Impacts of Service Changes since June 2007
$1.75
$2.25
nla
$1.95
$2.25
$2.00
$2.00
$1.50
$2.00
3
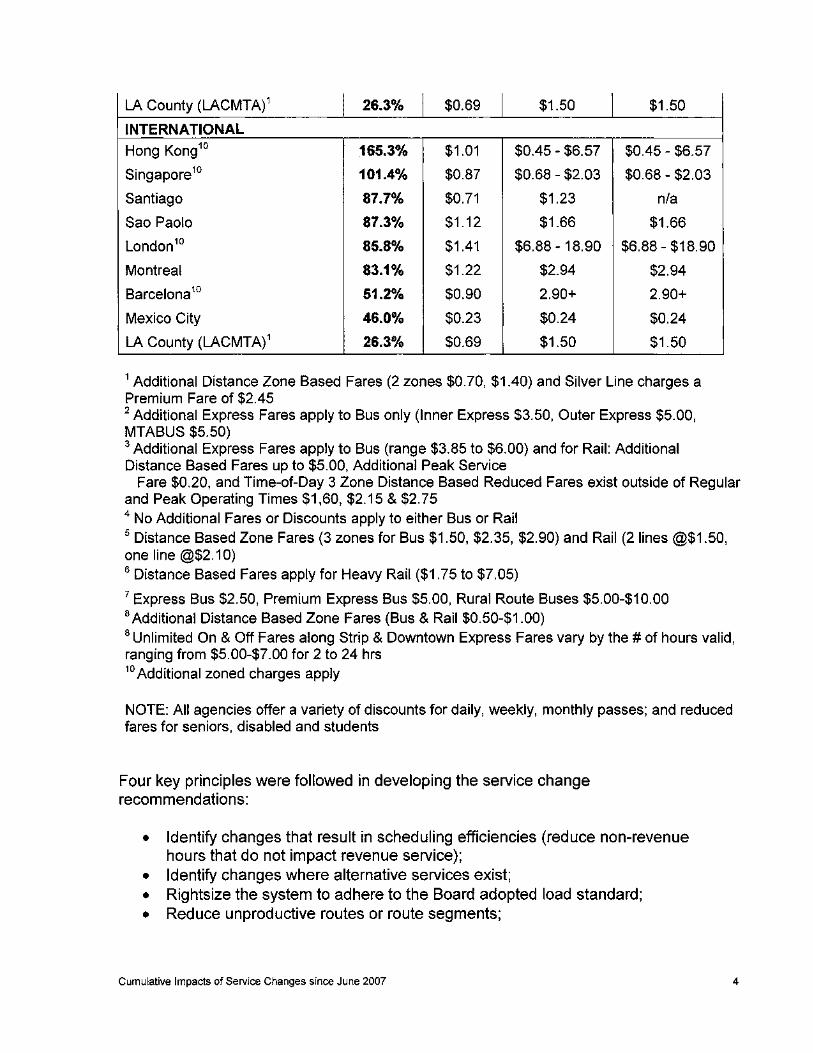
LA County (LACMTA) 1 $0.69 $1.50 $1.50
INTERNATIONAL
Hong Kong10 $1.01 $0.45 - $6.57 $0.45 - $6.57
Singapore1o $0.87 $0.68 - $2.03 $0.68 - $2.03
Santiago $0.71 $1.23 nfa
Sao Paolo $1.12 $1.66 $1.66
London1O $1.41 $6.88 - 18.90 $6.88 - $18.90
Montreal $1.22 $2.94 $2.94
Barcelona 10 $0.90 2.90+ 2.90+
Mexico City $0.23 $0.24 $0.24
LA County (LACMTA) 1 $0.69 $1.50 $1.50
1 Additional Distance Zone Based Fares (2 zones $0.70, $1.40) and Silver Line charges a Premium Fare of $2.45 2 Additional Express Fares apply to Bus only (Inner Express $3.50, Outer Express $5.00, MTABUS $5.50) 3 Additional Express Fares apply to Bus (range $3.85 to $6.00) and for Rail: Additional Distance Based Fares up to $5.00, Additional Peak Service
Fare $0.20, and Time-of-Day 3 Zone Distance Based Reduced Fares exist outside of Regular and Peak Operating Times $1,60, $2.15 & $2.75 4 No Additional Fares or Discounts apply to either Bus or Rail 5 Distance Based Zone Fares (3 zones for Bus $1.50, $2.35, $2.90) and Rail (2 lines @$1.50, one line @$2.10) 6 Distance Based Fares apply for Heavy Rail ($1.75 to $7.05)
7 Express Bus $2.50, Premium Express Bus $5.00, Rural Route Buses $5.00-$10.00 8 Additional Distance Based Zone Fares (Bus & Rail $0.50-$1.00) 8 Unlimited On & Off Fares along Strip & Downtown Express Fares vary by the # of hours valid, ranging from $5.00-$7.00 for 2 to 24 hrs 10 Additional zoned charges apply
NOTE: All agencies offer a variety of discounts for daily, weekly, monthly passes; and reduced fares for seniors, disabled and students
Four key principles were followed in developing the service change recommendations:
• Identify changes that result in scheduling efficiencies (reduce non-revenue hours that do not impact revenue service);
• Identify changes where alternative services exist; • Rightsize the system to adhere to the Board adopted load standard; • Reduce unproductive routes or route segments;
Cumulative Impacts of Service Changes since June 2007 4
In addition, great care was taken to ensure that ridership impacts were minimized by revising the recommendations based on input from significant public outreach and review efforts. For each of the service changes, we conducted the following efforts:
~ 6 Public Hearings ~ Establishment of a Transit Advocate Group to review the changes for June
2011 ~ Distribution of 100,000 Take Ones ~ Grassroots public outreach at 7 locations (major transit hubs and stations) ~ Rider Bulletins on Metro Buses ~ Information on service changes posted on metro.net ~ Operator feedback on service improvements incorporated into service
changes ~ Numerous field observations conducted riding with operators ~ Service quality spot checks held at select locations.
For example, in December 2009 we reduced about 200,000 revenue hours. This was achieved by consolidating the number of trips on high frequency lines to achieve the 1.2 load standard at the time, and implementation of the Silver Line. The result of the trip adjustments was a widening of headways for high frequency service (12 min or better) of no more than 3 minutes. This change in headways is virtually unnoticeable. With the Silver Line, we eliminated the duplication of service in downtown LA at the same time we created new BRT service between EI Monte and Harbor/Gateway Transit Centers.
While we anticipate minimum impacts to riders, it is important to evaluate the effects of the changes, both immediately after the change as well as cumulatively over the years. At its March 24,2011 meeting, the Board approved service changes that went into effect June 26,2011 or later. Given that this service change represented the fourth major change over the past several years, the Board directed staff to evaluate the cumulative impacts of the service changes on passengers starting from June 2007.
Attachment A lists the major service changes implemented since June 2007. A summary of ridership impacts, both immediately after the service change and compared cumulatively to today, is presented below along with highlights of each service change. A detailed impact evaluation is presented in Attachment B. The ridership numbers presented represent ridership only for the lines that were affected by the changes, both the lines that were adjusted and the adjacent lines where we anticipated riders to shift to.
Cumulative Impacts of Service Changes since June 2007 5
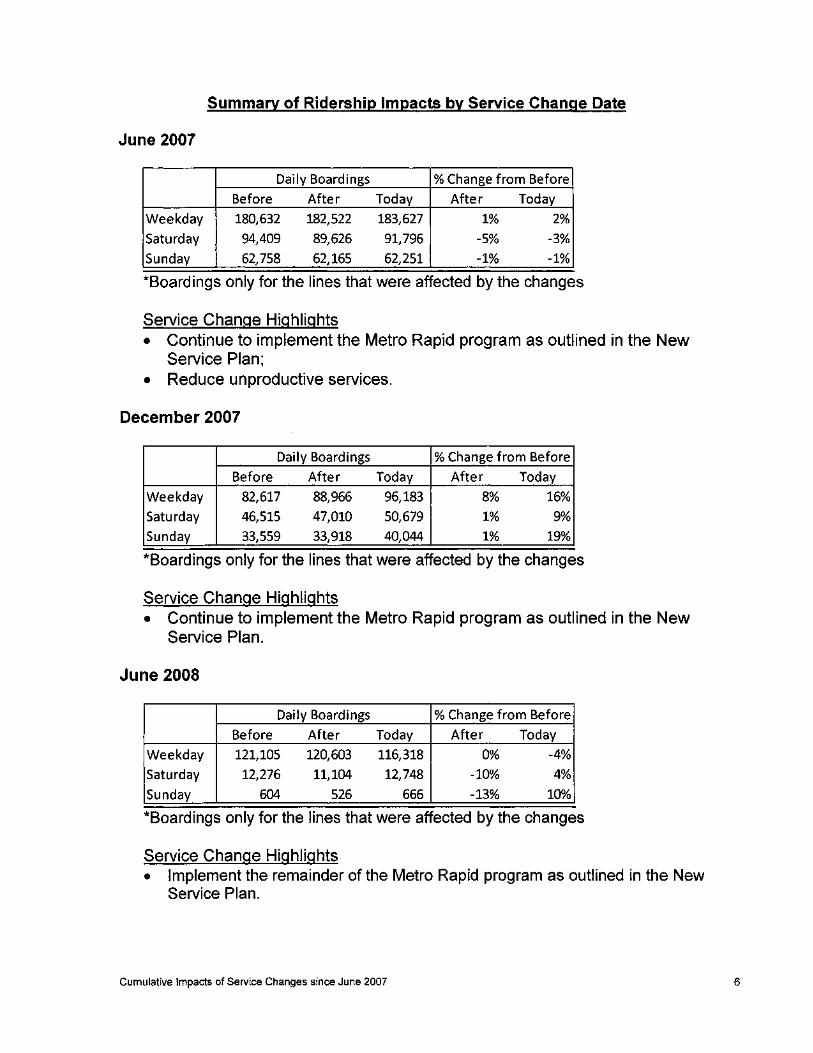
Summary of Ridership Impacts by Service Change Date
June 2007
Daily Boardings % Change from Before Before After Today After Today
Weekday 180,632 182,522 183,627 1% 2%
Saturday 94,409 89,626 91,796 -5% -3%
Sunday 62,758 62,165 62,251 -1% -1%
*Boardings only for the lines that were affected by the changes
Service Change Highlights • Continue to implement the Metro Rapid program as outlined in the New
Service Plan; • Reduce unproductive services.
December 2007
Daily Boardings % Change from Before
Before After Today After Today
Weekday 82,617 88,966 96,183 8% 16%
Saturday 46,515 47,010 50,679 1% goA>
Sunday 33,559 33,918 40,044 1% 19%
*Boardings only for the lines that were affected by the changes
Service Change Highlights • Continue to implement the Metro Rapid program as outlined in the New
Service Plan.
June 2008
Daily Boardings % Change from Before
Before After Today After Today
Weekday 121,105 120,603 116,318 OOA> -4%
Saturday 12,276 11,104 12,748 -10% 4%
Sunday 604 526 666 -13% 100A>
*Boardings only for the lines that were affected by the changes
Service Change Highlights • Implement the remainder of the Metro Rapid program as outlined in the New
Service Plan.
Cumulative Impacts of Service Changes since June 2007 6
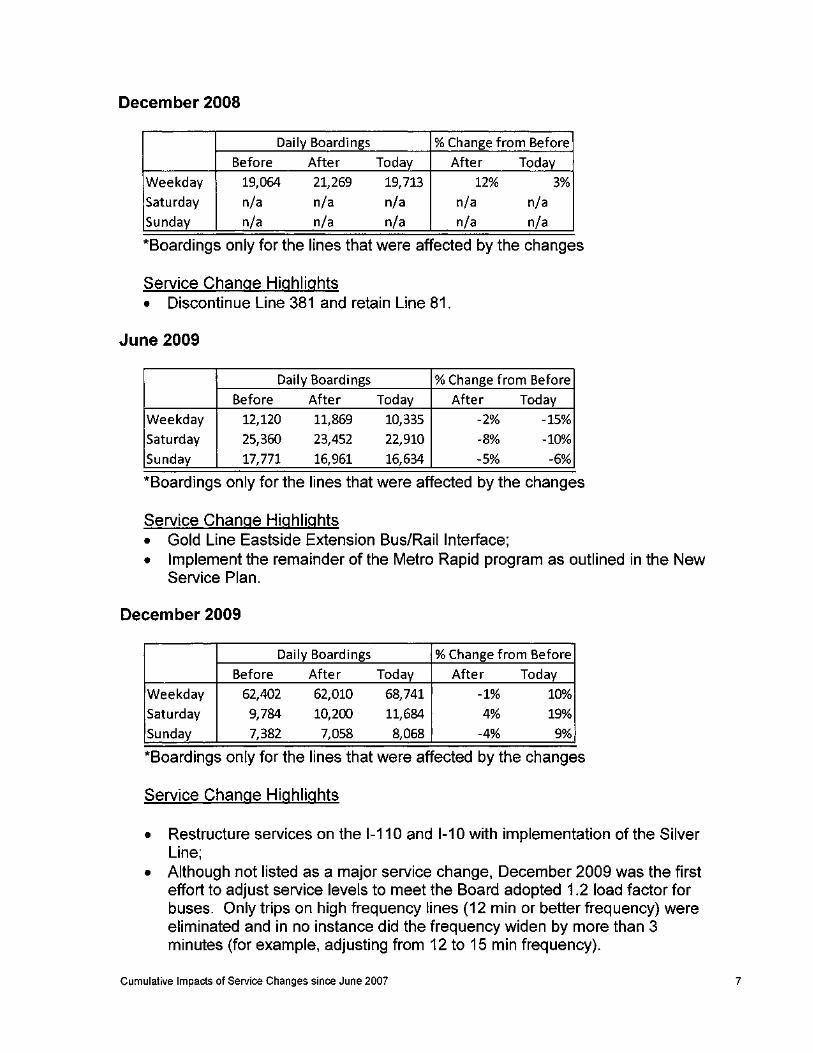
December 2008
Daily Boardings % Change from Before
Before After Today After Today
Weekday 19,064 21,269 19,713 12% 3%
Saturday n/a n/a n/a n/a n/a
Sunday n/a n/a n/a n/a n/a
*Boardings only for the lines that were affected by the changes
Service Change Highlights • Discontinue Line 381 and retain Line 81.
June 2009
Daily Boardings % Change from Before
Before After Today After Today
Weekday 12,120 11,869 10,335 -2% -15%
Saturday 25,360 23,452 22,910 -8% -10%
Sunday 17,771 16,961 16,634 -5% -6%
*Boardings only for the lines that were affected by the changes
Service Change Highlights • Gold Line Eastside Extension Bus/Raillnterface; • Implement the remainder of the Metro Rapid program as outlined in the New
Service Plan.
December 2009
Daily Boardings % Change from Before
Before After Today After Today
Weekday 62,402 62,010 68,741 -1% 10%
Saturday 9,784 10,200 11,684 4% 19%
Sunday 7,382 7,058 8,068 -4% 9%
*Boardings only for the lines that were affected by the changes
Service Change Highlights
• Restructure services on the 1-110 and 1-10 with implementation of the Silver Line;
• Although not listed as a major service change, December 2009 was the first effort to adjust service levels to meet the Board adopted 1.2 load factor for buses. Only trips on high frequency lines (12 min or better frequency) were eliminated and in no instance did the frequency widen by more than 3 minutes (for example, adjusting from 12 to 15 min frequency).
Cumulative Impacts of Service Changes since June 2007 7
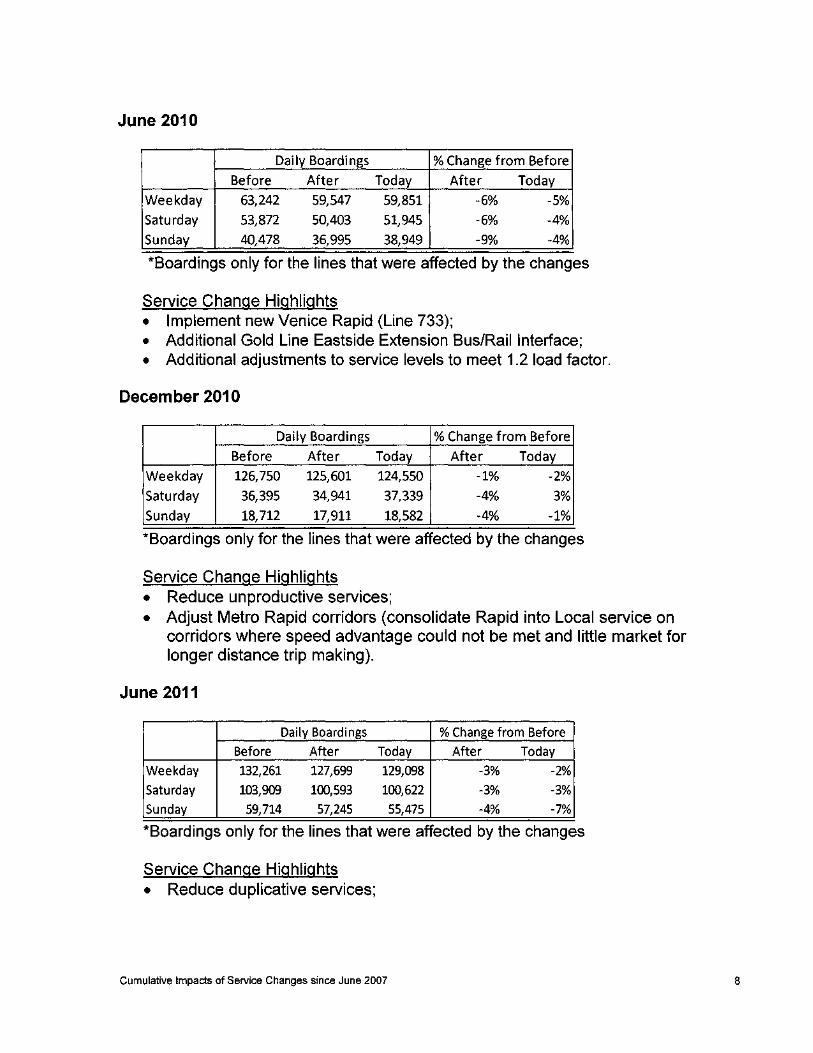
June 2010
Daily Boardings % Change from Before
Before After Today After Today
Weekday 63,242 59,547 59,851 -6% -5%
Saturday 53,872 50A03 51,945 -6% -4%
Sunday 4OA78 36,995 38,949 -9% -4%
*Boardings only for the lines that were affected by the changes
Service Change Highlights • Implement new Venice Rapid (Line 733); • Additional Gold Line Eastside Extension Bus/Raillnterface; • Additional adjustments to service levels to meet 1.2 load factor.
December 2010
Daily Boardings % Change from Before
Before After Today After Today
Weekday 126,750 125,601 124,550 -1% -2%
Saturday 36,395 34,941 37,339 -4% 3%
Sunday 18,712 17,911 18,582 -4% -1%
*Boardings only for the lines that were affected by the changes
Service Change Highlights • Reduce unproductive services; • Adjust Metro Rapid corridors (consolidate Rapid into Local service on
corridors where speed advantage could not be met and little market for longer distance trip making).
June 2011
Daily Boardings % Change from Before
Before After Today After Today
Weekday 132,261 127,699 129,098 -3% -2%
Saturday 103,909 100,593 100,622 -3% -3%
Sunday 59,714 57,245 55,475 -4% -7%
*Boardings only for the lines that were affected by the changes
Service Change Highlights • Reduce duplicative services;
Cumulative Impacts of Service Changes since June 2007 8
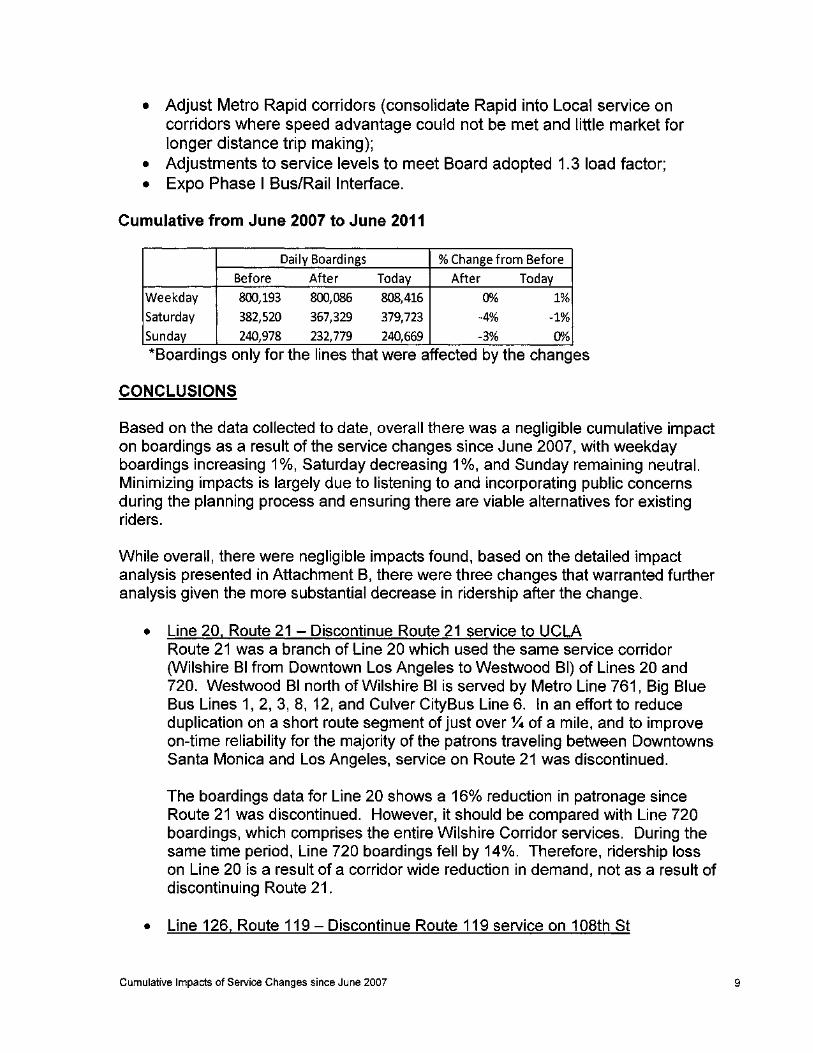
• Adjust Metro Rapid corridors (consolidate Rapid into Local service on corridors where speed advantage could not be met and little market for longer distance trip making);
• Adjustments to service levels to meet Board adopted 1.3 load factor; • Expo Phase I Bus/Raillnterface.
Cumulative from June 2007 to June 2011
Daily Boardings % Change from Before
Before After Today After Today Weekday 800,193 800,086 808,416 (lO/o 1% Saturday 382,520 367,329 379,723 -4% -1% Sunday 240,978 232,779 240,669 -3% 0% *Boardlngs only for the lines that were affected by the changes
CONCLUSIONS
Based on the data collected to date, overall there was a negligible cumulative impact on boardings as a result of the service changes since June 2007, with weekday boardings increasing 1 %, Saturday decreasing 1 %, and Sunday remaining neutral. Minimizing impacts is largely due to listening to and incorporating public concerns during the planning process and ensuring there are viable alternatives for existing riders.
While overall, there were negligible impacts found, based on the detailed impact analysis presented in Attachment B, there were three changes that warranted further analysis given the more substantial decrease in ridership after the change.
• Line 20, Route 21 - Discontinue Route 21 service to UCLA Route 21 was a branch of Line 20 which used the same service corridor (Wilshire BI from Downtown Los Angeles to Westwood BI) of Lines 20 and 720. Westwood BI north of Wilshire BI is served by Metro Line 761, Big Blue Bus Lines 1, 2, 3, 8, 12, and Culver CityBus Line 6. In an effort to reduce duplication on a short route segment of just over % of a mile, and to improve on-time reliability for the majority of the patrons traveling between Downtowns Santa Monica and Los Angeles, service on Route 21 was discontinued.
The boardings data for Line 20 shows a 16% reduction in patronage since Route 21 was discontinued. However, it should be compared with Line 720 boardings, which comprises the entire Wilshire Corridor services. During the same time period, Line 720 boardings fell by 14%. Therefore, ridership loss on Line 20 is a result of a corridor wide reduction in demand, not as a result of discontinuing Route 21.
• Line 126, Route 119 - Discontinue Route 119 service on 108th St
Cumulative Impacts of Service Changes since June 2007 9
For the June 2007 service changes, Line 126 and Route 119 were discontinued. These lines provided minimal service on small city streets. Subsequently, Beach Cities Transit began operating service along the Line 126 alignment during the peak hours, so previous Line 126 patrons likely migrated to Beach City Transit services. Previous Route 119 patrons are % mile away from either Line 117 on Century BI or Line 120 on Imperial Highway so some patronage may have migrated to the remaining services.
• Line 10. Route 11 - Discontinue Route 11 Line 10 and Route 11 used the same streets from Downtown Los Angeles to the intersection of Hoover St and Beverly BI. At this point, Route 11 branched up Virgil Av. up % mile in length to Clinton St.; Line 10 at Beverly BI branched north on Hoover St to Clinton St, travel east two short blocks and rejoined the now combined route out Melrose Av to the Beverly Center. Both routes served the exact same alignment except for the Route 11 % mile deviation. The decline in patronage appears minor except for Saturday service. However, Line 14 on Beverly BI., adjacent to Line 10 Melrose Ave., also experienced a significant drop on Saturday. Therefore, the significant decrease in Saturday ridership on Line 10 can be partially attributed to reduced travel demand in the area.
While service levels have been reduced, staffing has been maintained for support services to improve service quality. By maintaining transportation supervisor and increasing maintenance staffing levels, despite the reduction in service and fleet size, we have been able to improve the quality of service to our riders. From April 2009 to March 2012, on time performance has improved 11 %, from 68.7% to 76.6%. Mean miles between total roadcalls has improved 41 %, from 1,615 to 2,285.
This evaluation indicates that careful development of service proposals through extensive public involvement, and focusing on providing high quality services, can minimize impacts of service reductions to ridership.
In addition, as part of the Title VI corrective action plan, a cumulative review of service changes between December 2009 and June 2011 will be conducted based on methodology to be developed in coordination with, and approved by the Federal Transit Administration.
POLICY IMPLICATIONS
Monitoring the effects of implemented service changes is necessary to ensure that intended results have been achieved consistent with the Board-approved policy and fiscal capacity of the agency.
Cumulative Impacts of Service Changes since June 2007 10
DETERMINATION OF SAFETY IMPACT
If approved by the Board, the details outlined in this report are expected to have a positive impact on safety with further improvements of service levels and quality for passengers.
NEXT STEPS
Staff will continue to evaluate service changes implemented in the future.
ATTACHMENTS
A. Major Service Changes June 2007 through June 2011 B. Impacts of Service Changes from June 2007 through June 2011
Prepared by: Dana Woodbury, Manager of Strategic Service Planning Conan Cheung, DEO of Service Planning & Development
Cumulative Impacts of Service Changes since June 2007 11
/~ /' /
-.~/-/ ~---."~-~-~------.--/'
// /
Fra91<Alejand ro Ghief Operations Officer
Arthur Leahy Chief Executive Officer
Cumulative Impacts of Service Changes since June 2007 12
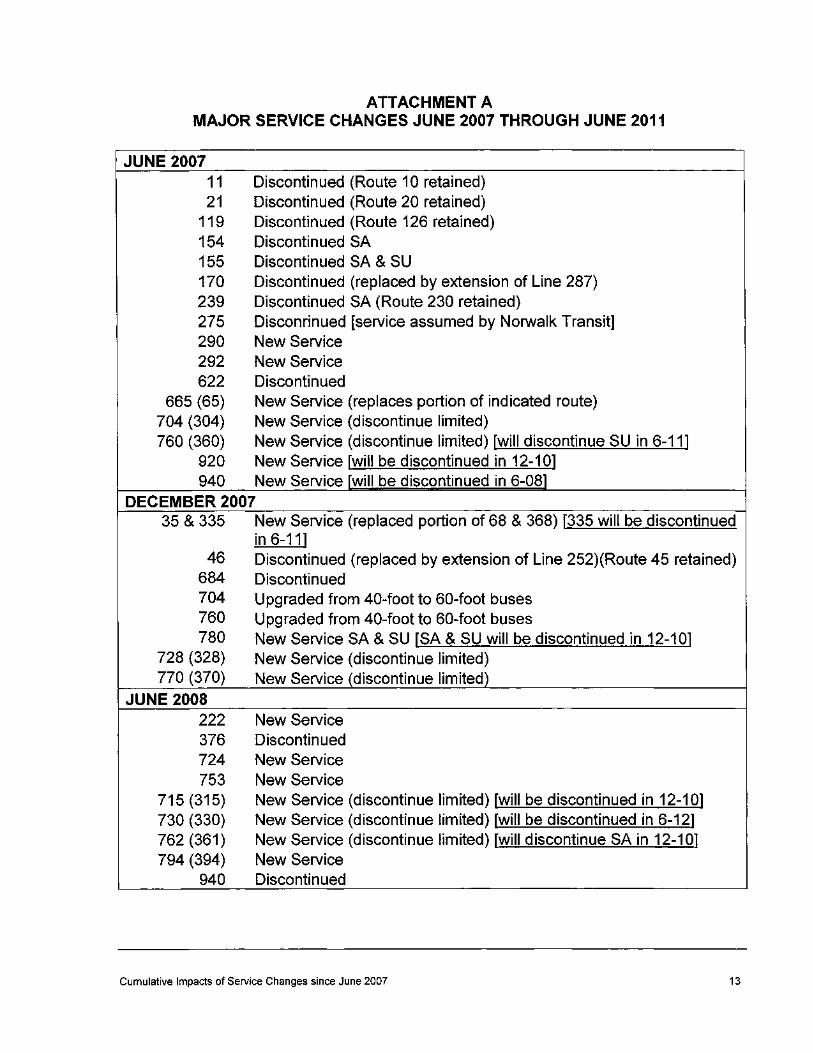
ATTACHMENT A MAJOR SERVICE CHANGES JUNE 2007 THROUGH JUNE 2011
JUNE 2007 11 Discontinued (Route 10 retained) 21 Discontinued (Route 20 retained)
119 Discontinued (Route 126 retained) 154 Discontinued SA 155 Discontinued SA & SU 170 Discontinued (replaced by extension of Line 287) 239 Discontinued SA (Route 230 retained) 275 Disconrinued [service assumed by Norwalk Transit] 290 New Service 292 New Service 622 Discontinued
665 (65) New Service (replaces portion of indicated route) 704 (304) New Service (discontinue limited) 760 (360) New Service (discontinue limited) [will discontinue SU in 6-11]
920 New Service [will be discontinued in 12-10] 940 New Service [will be discontinued in 6-081
DECEMBER 2007 35 & 335 New Service (replaced portion of 68 & 368) [335 will be discontinued
in 6-11] 46 Discontinued (replaced by extension of Line 252)(Route 45 retained)
684 Discontinued 704 Upgraded from 40-foot to 60-foot buses 760 Upgraded from 40-foot to 60-foot buses 780 New Service SA & SU [SA & SU will be discontinued in 12-10]
728 (328) New Service (discontinue limited) 770 (370) New Service (discontinue limited)
JUNE 2008 222 New Service 376 Discontinued 724 New Service 753 New Service
715(315) New Service (discontinue limited) [will be discontinued in 12-10] 730 (330) New Service (discontinue limited) [will be discontinued in 6-12] 762 (361) New Service (discontinue limited) [will discontinue SA in 12-101 794 (394) New Service
940 Discontinued
Cumulative Impacts of Service Changes since June 2007 13
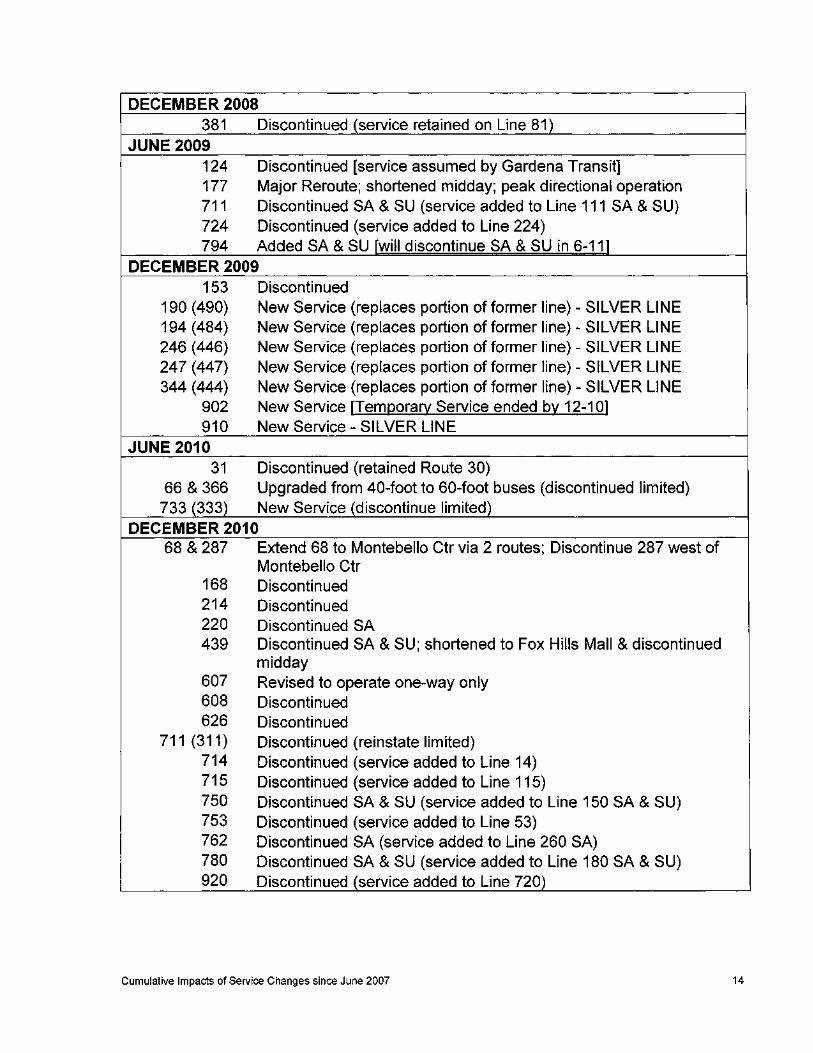
DECEMBER 2008 381 Discontinued (service retained on Line 81)
JUNE 2009 124 Discontinued [service assumed by Gardena Transit] 177 Major Reroute; shortened midday; peak directional operation 711 Discontinued SA & SU (service added to Line 111 SA & SU) 724 Discontinued (service added to Line 224) 794 Added SA & SU rwill discontinue SA & SU in 6-111
DECEMBER 2009 153 Discontinued
190 (490) New Service (replaces portion of former line) - SILVER LINE 194 (484) New Service (replaces portion of former line) - SILVER LINE 246 (446) New Service (replaces portion of former line) - SILVER LINE 247 (447) New Service (replaces portion offormer line) - SILVER LINE 344 (444) New Service (replaces portion of former line) - SILVER LINE
902 New Service [Tem(2ora~ Service ended b~ 12-10] 910 New Service - SILVER LINE
JUNE 2010 31 Discontinued (retained Route 30)
66 & 366 Upgraded from 40-foot to 60-foot buses (discontinued limited) 733 (333) New Service (discontinue limited)
DECEMBER 2010 68 &287 Extend 68 to Montebello Ctr via 2 routes; Discontinue 287 west of
Montebello Ctr 168 Discontinued 214 Discontinued 220 Discontinued SA 439 Discontinued SA & SU; shortened to Fox Hills Mall & discontinued
midday 607 Revised to operate one-way only 608 Discontinued 626 Discontinued
711(311) Discontinued (reinstate limited) 714 Discontinued (service added to Line 14) 715 Discontinued (service added to Line 115) 750 Discontinued SA & SU (service added to Line 150 SA & SU) 753 Discontinued (service added to Line 53) 762 Discontinued SA (service added to Line 260 SA) 780 Discontinued SA & SU (service added to Line 180 SA & SU) 920 Discontinued (service added to Line 720)
Cumulative Impacts of Service Changes since June 2007 14
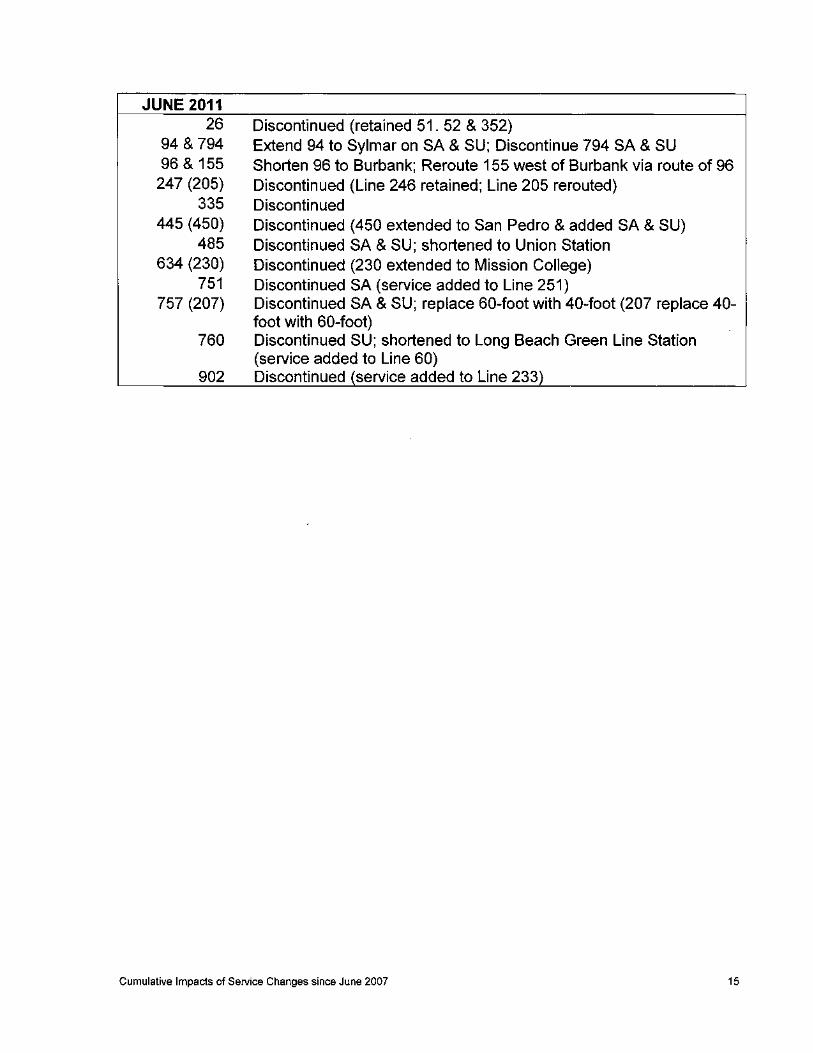
JUNE 2011 26
94 & 794 96 & 155
247 (205) 335
445 (450) 485
634 (230) 751
757 (207)
760
902
Discontinued (retained 51. 52 & 352) Extend 94 to Sylmar on SA & SU; Discontinue 794 SA & SU Shorten 96 to Burbank; Reroute 155 west of Burbank via route of 96 Discontinued (Line 246 retained; Line 205 rerouted) Discontinued Discontinued (450 extended to San Pedro & added SA & SU) Discontinued SA & SU; shortened to Union Station Discontinued (230 extended to Mission College) Discontinued SA (service added to Line 251) Discontinued SA & SU; replace 60-foot with 40-foot (207 replace 40-foot with 60-foot) Discontinued SU; shortened to Long Beach Green Line Station (service added to Line 60) Discontinued (service added to Line 233)
Cumulative Impacts of Service Changes since June 2007 15
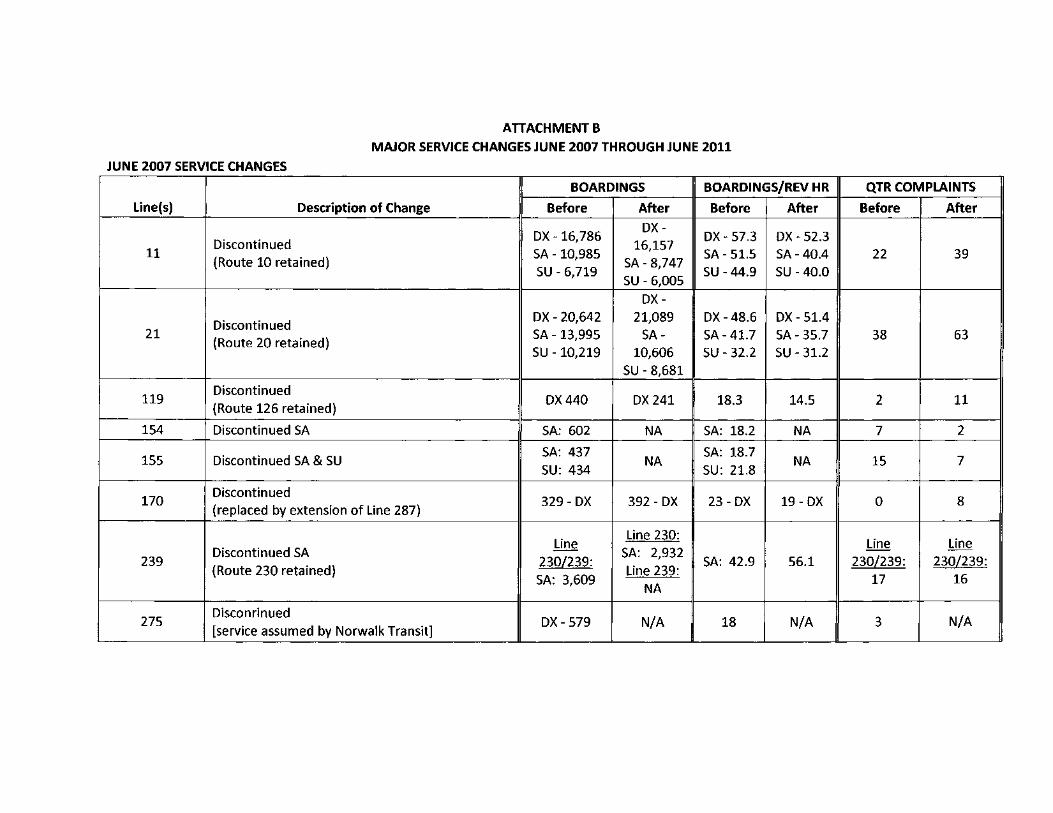
ATTACHMENT B MAJOR SERVICE CHANGES JUNE 2007 THROUGH JUNE 2011
JUNE 2007 SERVICE CHANGES
BOARDINGS BOARDINGS/REV HR OTR COMPLAINTS
Line(s) Description of Change Before After Before After Before After
DX -16,786 DX-
DX - 57.3 DX - 52.3 11
Discontinued SA -10,985
16,157 SA- 51.5 SA-40.4 22 39
(Route 10 retained) SA- 8,747 SU - 6,719
SU - 6,005 SU -44.9 SU -40.0
DX-
Discontinued DX - 20,642 21,089 DX -48.6 DX - 51.4
21 (Route 20 retained)
SA-13,995 SA- SA-41.7 SA - 35.7 38 63 SU -10,219 10,606 SU - 32.2 SU - 31.2
SU - 8,681
119 Discontinued
DX440 DX241 18.3 14.5 2 11 (Route 126 retained)
154 Discontinued SA SA: 602 NA SA: 18.2 NA 7 2
155 Discontinued SA & SU SA: 437
NA SA: 18.7
NA 15 7 SU: 434 SU: 21.8
170 Discontinued
329 - DX 392 - DX 23 - DX 19- DX 0 8 (replaced by extension of Line 287)
Line Line 230:
Line Line i
239 Discontinued SA
230[239: SA: 2,932
SA: 42.9 56.1 230[239: 230[239: (Route 230 retained)
SA: 3,609 Line 239:
17 16 NA
275 Disconrinued
DX- 579 N/A 18 N/A 3 N/A [service assumed by Norwalk Transit]
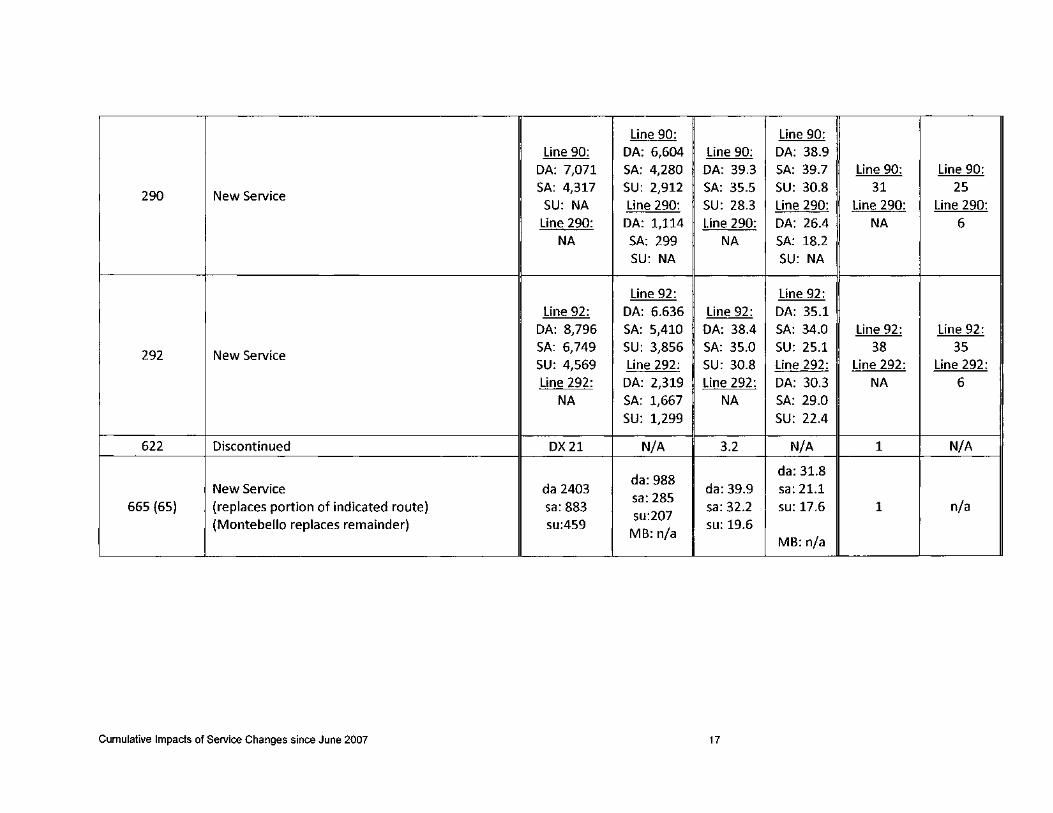
Line 90: Line 90: Line 90: DA: 6,604 Line 90: DA: 38.9
DA: 7,071 SA: 4,280 DA: 39.3 SA: 39.7 Line 90: Line 90:
290 New Service SA: 4,317 SU: 2,912 SA: 35.5 SU: 30.8 31 25
SU: NA Line 290: SU: 283 Line 290: Line 290: Line 290: Line 290: DA: 1,114 Line 290: DA: 26.4 NA 6
NA SA: 299 NA SA: 18.2 SU: NA SU: NA
Line 92: Line 92: Line 92: DA: 6.636 Line 92: DA: 35.1
DA: 8,796 SA: 5,410 DA: 38.4 SA: 34.0 Line 92: Line 92:
292 New Service SA: 6,749 SU: 3,856 SA: 35.0 SU: 25.1 38 35 SU: 4,569 Line 292: SU: 30.8 Line 292: Line 292: Line 292: Line 292: DA: 2,319 Line 292: DA: 303 NA 6
NA SA: 1,667 NA SA: 29.0 SU: 1,299 SU: 22.4
622 Discontinued DX21 N/A 3.2 N/A 1 N/A
da:988 da: 31.8
New Service da 2403 da: 39.9 sa: 21.1 665 (65) (replaces portion of indicated route) sa: 883
sa: 285 sa: 32.2 su: 17.6 1 n/a
su:207 (Montebello replaces remainder) su:459
MB: n/a su: 19.6
MB: n/a - -----
Cumulative Impacts of Service Changes since June 2007 17
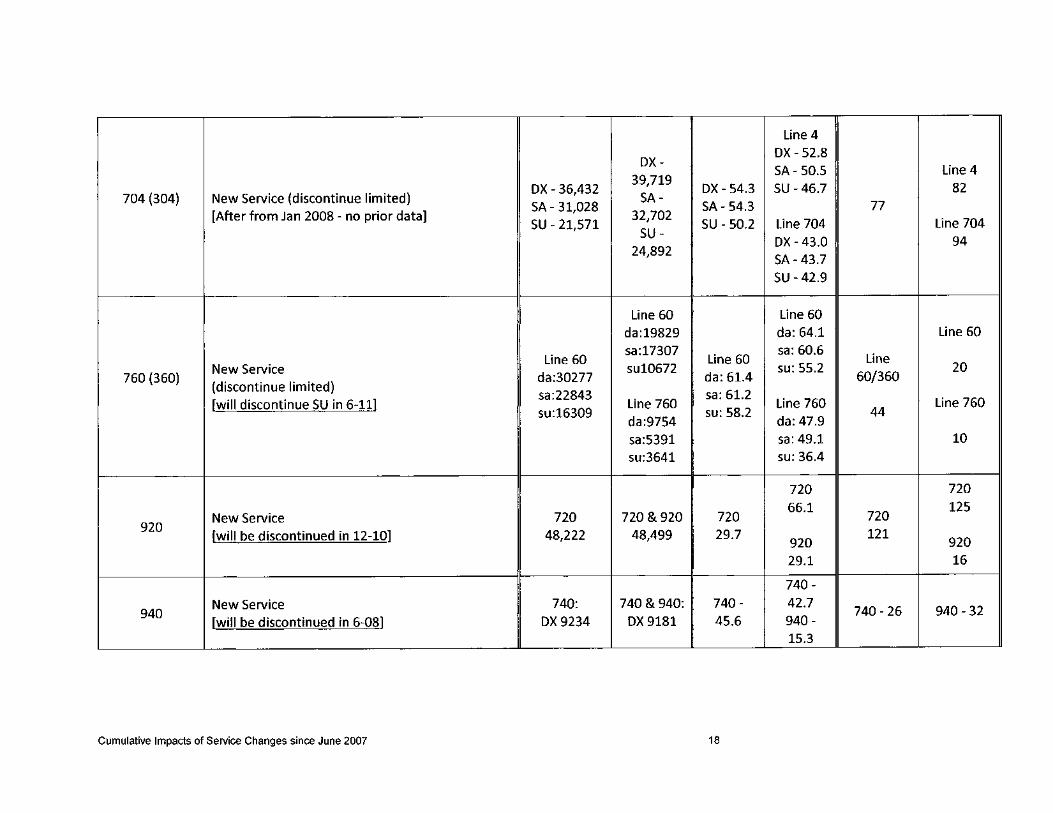
Line 4
OX-OX- 52.8
39,719 SA- 50.5 Line 4
704 (304) New Service (discontinue limited) OX - 36,432
SA-OX - 54.3 SU - 46.7 82
[After from Jan 2008 - no prior data] SA- 31,028
32,702 SA - 54.3 77
SU - 21,571 SU -
SU - 50.2 Line 704 Line 704
24,892 OX- 43.0 94 SA-43.7 SU - 42.9
Line 60 Line 60 da:19829 da: 64.1 Line 60
Line 60 sa:17307
Line 60 sa: 60.6
Line
760 (360) New Service
da:30277 sul0672
da: 61.4 su: 55.2
60/360 20
(discontinue limited) [will discontinue SU in 6-11]
sa:22843 Line 760
sa: 61.2 Line 760 Line 760
su:16309 da:9754
su: 58.2 da: 47.9
44
sa:5391 sa: 49.1 10 su:3641 su: 36.4
720 720
New Service 720 720 & 920 720 66.1
720 125
920 [will be discontinued in 12-10] 48,222 48,499 29.7 121
920 920 29.1 16
740-
940 New Service 740: 740 & 940: 740- 42.7
740 - 26 940 - 32 [will be discontinued in 6-08] OX 9234 OX 9181 45.6 940-
15.3 --_ .... _----
Cumulative Impacts of Service Changes since June 2007 18
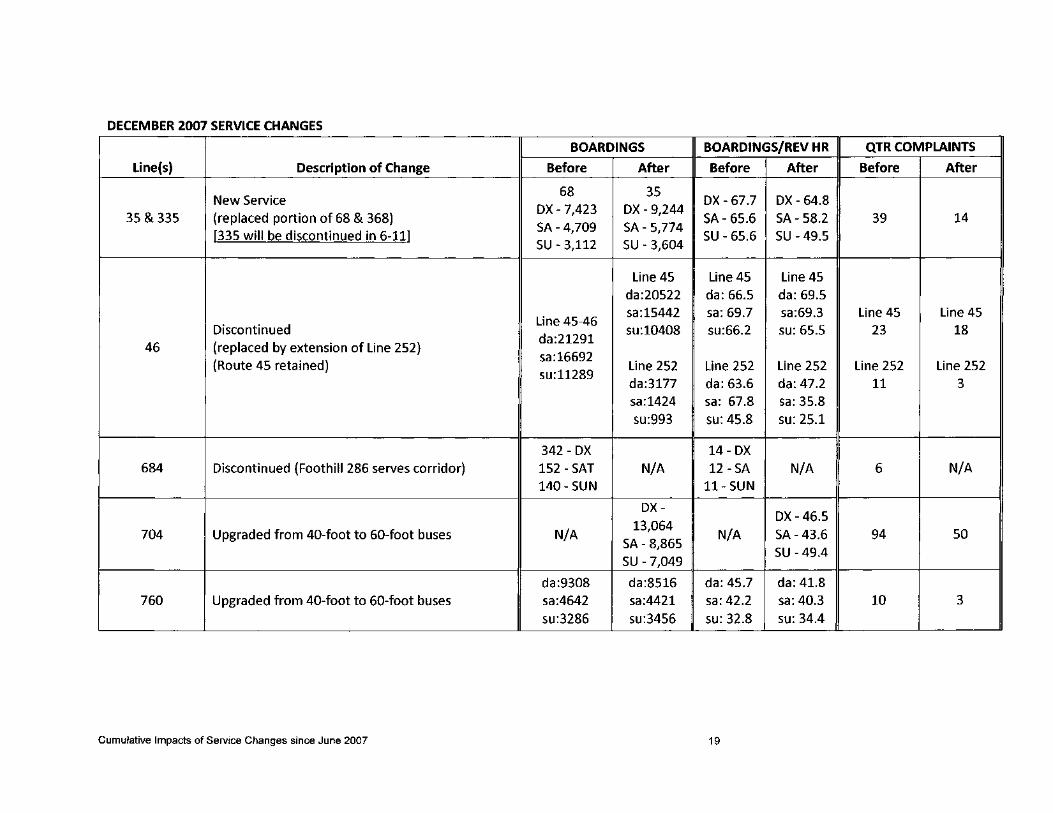
DECEMBER 2007 SERVICE CHANGES
BOARDINGS BOARDINGS/REV HR QTR COMPLAINTS
Line(s) Description of Change Before After Before After Before After
New Service 68 35
DX - 67.7 DX - 64.8 35 & 335 (replaced portion of 68 & 368)
DX -7,423 DX-9,244 SA- 65.6 SA - 58.2 39 14
[335 will be discontinued in 6-11] SA-4,709 SA - 5,774
SU - 65.6 SU -49.5 SU - 3,112 SU - 3,604
Line 45 Line 45 Line 45 da:20522 da: 66.5 da: 69.5
Line 45-46 sa:15442 sa: 69.7 sa:69.3 Line 45 Line 45
Discontinued su:l0408 su:66.2 su: 65.5 23 18 46 (replaced by extension of Line 252)
da:21291 sa:16692
(Route 45 retained) su:11289
Line 252 Line 252 Line 252 Line 252 Line 252 da:3177 da: 63.6 da: 47.2 11 3 sa:1424 sa: 67.8 sa: 35.8 su:993 su: 45.8 su: 25.1
342 - DX 14-DX 684 Discontinued (Foothill 286 serves corridor) 152 - SAT N/A 12 -SA N/A 6 N/A
140 - SUN 11- SUN
DX-DX -46.5
704 Upgraded from 40-foot to 60-foot buses N/A 13,064
N/A SA-43.6 94 50 SA- 8,865 SU -7,049
SU -49.4
da:9308 da:8516 da: 45.7 da: 41.8 760 Upgraded from 40-foot to 60-foot buses sa:4642 sa:4421 sa: 42.2 sa: 40.3 10 3
su:3286 su:3456 su: 32.8 su: 34.4 ..... -- .. - . . ._ ....
Cumulative Impacts of Service Changes since June 2007 19
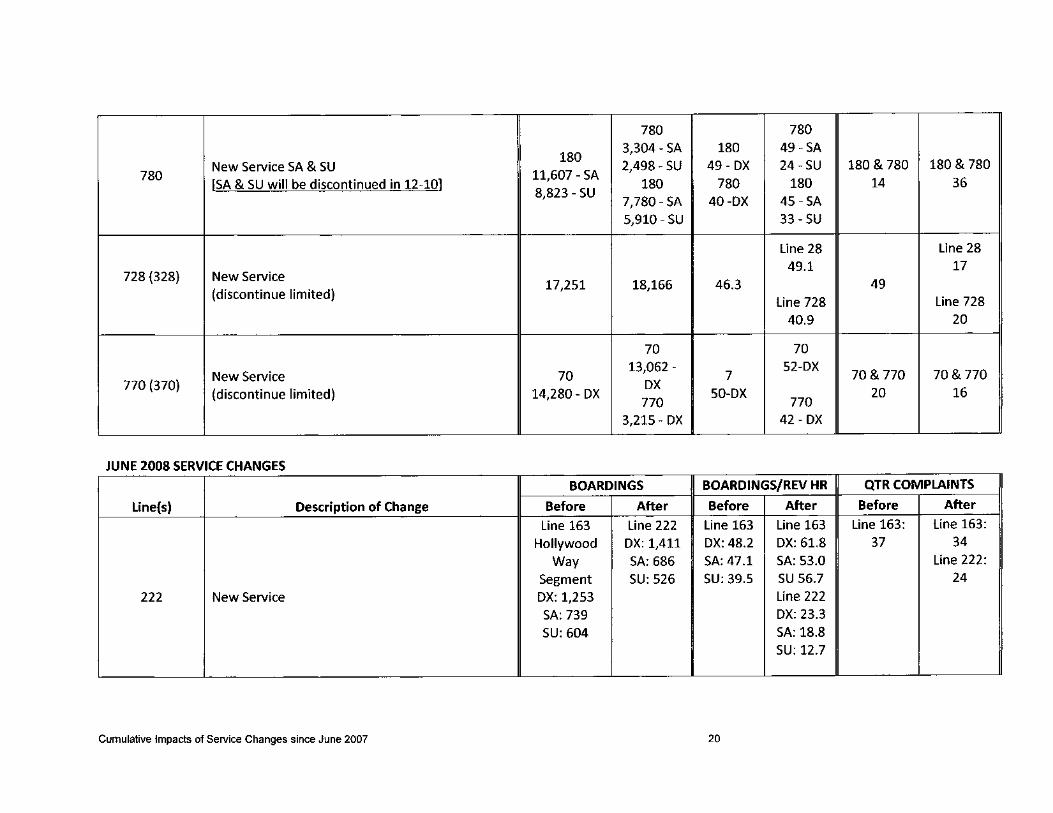
780 780
180 3,304- SA 180 49-SA
780 New Service SA & SU
11,607 -SA 2,498 - SU 49- OX 24-SU 180 & 780 180 & 780
[SA & SU will be discontinued in 12-10] 180 780 180 14 36 8,823 - SU
7,780 - SA 40-0X 45 -SA
5,910 - SU 33 -SU
Line 28 Line 28
728 (328) New Service 49.1 17
(discontinue limited) 17,251 18,166 46.3 49
Line 728 Line 728 40.9 20
...
70 70
New Service 70 13,062 -
7 52-OX
70& 770 70& 770 770 (370)
(discontinue limited) 14,280 - OX OX
50-OX 20 16 770 770
3,215 - OX 42- OX
JUNE 2008 SERVICE CHANGES
BOARDINGS BOARDINGS/REV HR QTR COMPLAINTS
Line(s) Description of Change Before After Before After Before After
Line 163 Line 222 Line 163 Line 163 Line 163: Line 163:
Hollywood OX: 1,411 OX: 48.2 OX: 61.8 37 34
Way SA: 686 SA: 47.1 SA: 53.0 Line 222:
Segment SU:526 SU: 39.5 SU 56.7 24
222 New Service OX: 1,253 Line 222
SA: 739 OX: 23.3
SU:604 SA: 18.8 SU: 12.7
--
Cumulative Impacts of Service Changes since June 2007 20
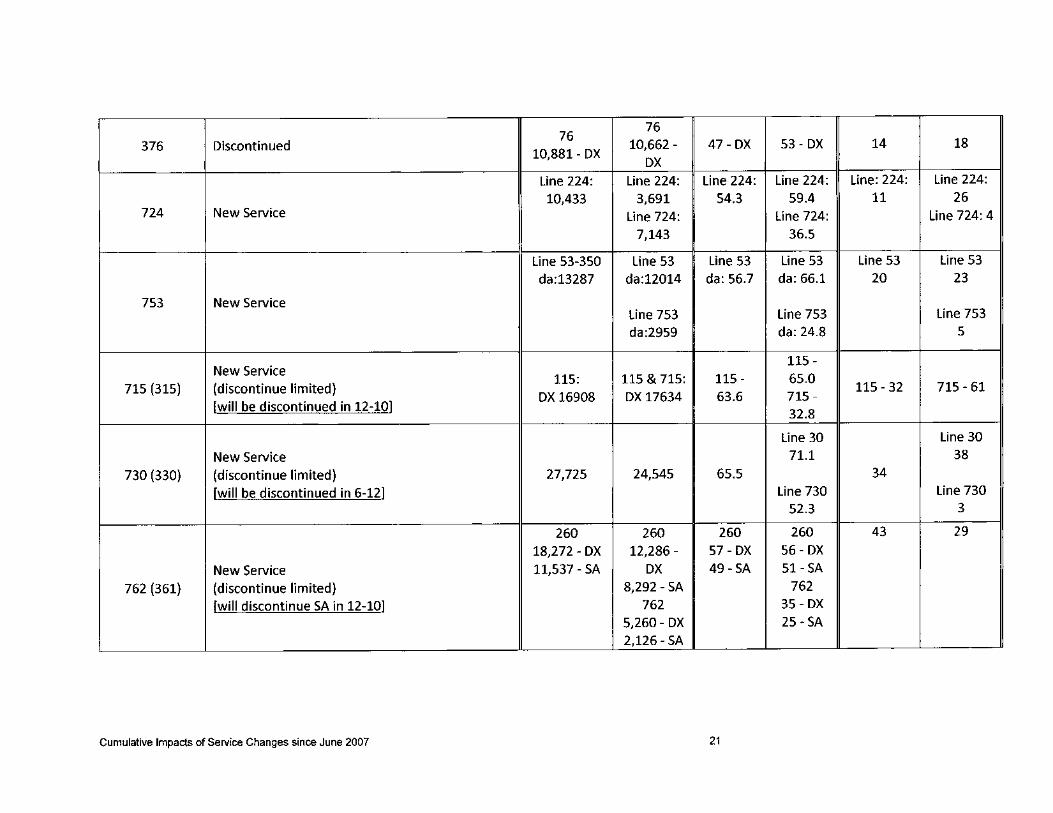
76 76
376 Discontinued 10,881- DX
10,662 - 47- DX 53 - DX 14 18
DX
Line 224: Line 224: Line 224: Line 224: Line: 224: Line 224:
10,433 3,691 54.3 59.4 11 26 724 New Service Line 724: Line 724: Line 724: 4
7,143 36.5
Line 53-350 Line 53 Line 53 Line 53 Line 53 Line 53
da:13287 da:12014 da: 56.7 da: 66.1 20 23
753 New Service Line 753 Line 753 Line 753
da:2959 da: 24.8 5
New Service 115 -
715 (315) (discontinue limited) 115: 115 & 715: 115- 65.0
115 - 32 715 - 61 DX 16908 DX 17634 63.6 715-
[will be discontinued in 12-10] 32.8
Line 30 Line 30
New Service 71.1 38
730 (330) (discontinue limited) 27,725 24,545 65.5 34
[will be discontinued in 6-12] Line 730 Line 730 52.3 3
260 260 260 260 43 29
18,272 - DX 12,286 - 57 - DX 56-DX
New Service 11,537 - SA DX 49-SA 51-SA
762 (361) (discontinue limited) 8,292 - SA 762
[will discontinue SA in 12-10] 762 35 - DX
5,260- DX 25 -SA
2,126 - SA
Cumulative Impacts of Service Changes since June 2007 21
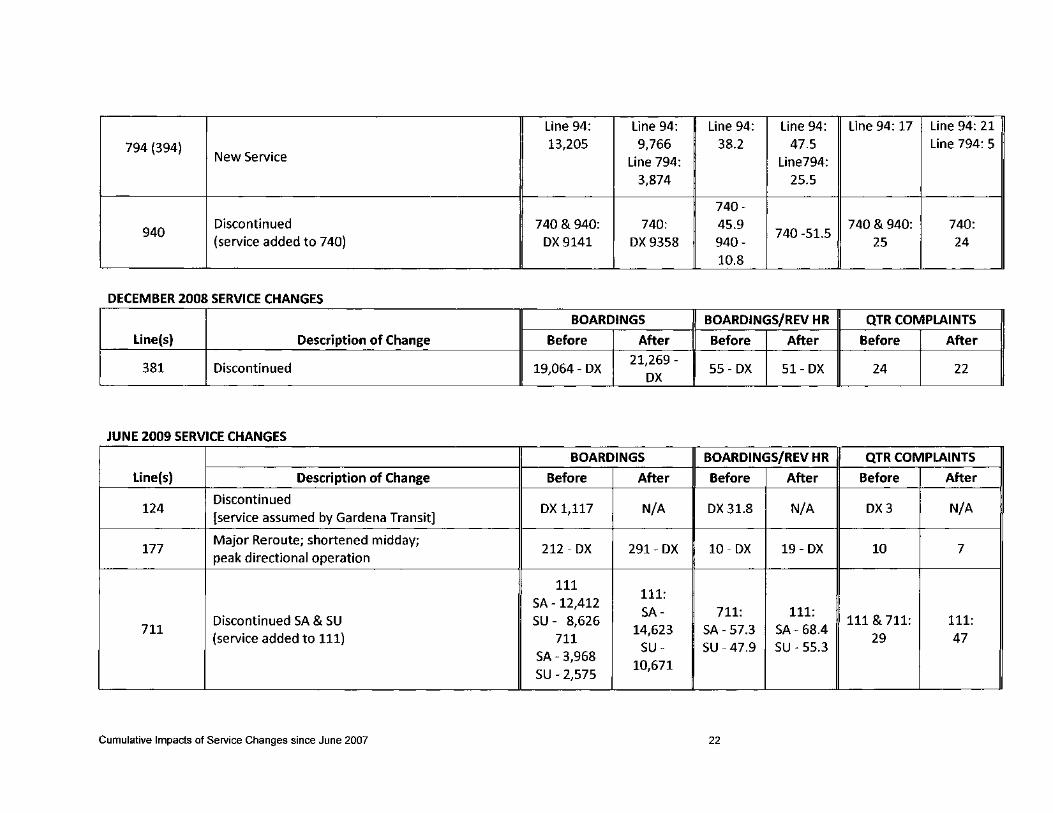
line 94: line 94: line 94: line 94: line 94: 17 line 94: 21
794 (394) 13,205 9,766 38.2 47.5 line 794: 5 New Service line 794: line794:
3,874 25.5
740-
940 Discontinued 740 & 940: 740: 45.9
740 -51.5 740&940: 740:
(service added to 740) DX9141 DX9358 940- 25 24 10.8
DECEMBER 2008 SERVICE CHANGES
BOARDINGS BOARDINGS/REV HR QTR COMPLAINTS
Line(s) Description of Change Before After Before After Before After
381 Discontinued 19,064 - DX 21,269 -
55- DX 51-DX 24 22 i DX
JUNE 2009 SERVICE CHANGES
BOARDINGS BOARDINGS/REV HR QTR COMPLAINTS
Line(s) Description of Change Before After Before After Before After
124 Discontinued
DX 1,117 N/A DX31.8 N/A DX3 N/A [service assumed by Gardena Transit]
177 Major Reroute; shortened midday;
212 - DX 291- DX 10-DX 19 - DX 10 7 peak directional operation
111 111:
SA -12,412 SA- 711: 111:
711 Discontinued SA & SU SU - 8,626
14,623 SA- 57.3 SA - 68.4 111 & 711: 111:
(service added to 111) 711 SU - SU -47.9 SU - 55.3
29 47 SA- 3,968
10,671 SU - 2,575
-_ ... _--------- - .... _--- -
Cumulative Impacts of Service Changes since June 2007 22
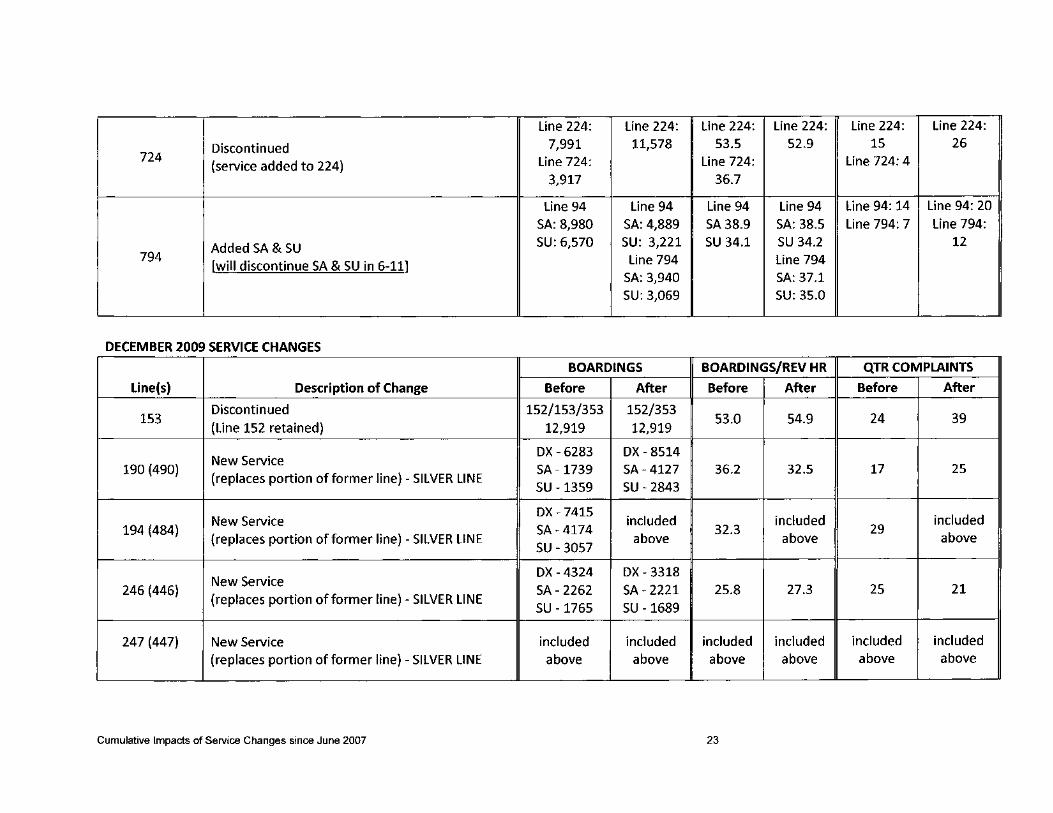
Line 224: Line 224: Line 224: Line 224: Line 224: Line 224:
724 Discontinued 7,991 11,578 53.5 52.9 15 26
(service added to 224) Line 724: Line 724: Line 724: 4
3,917 36.7
Line 94 Line 94 Line 94 Line 94 Line 94: 14 Line 94: 20
SA: 8,980 SA: 4,889 SA 38.9 SA: 38.5 Line 794: 7 Line 794:
Added SA & SU SU: 6,570 SU: 3,221 SU 34.1 SU 34.2 12 794
[will discontinue SA & SU in 6-11] Line 794 Line 794 SA: 3,940 SA: 37.1 SU: 3,069 SU: 35.0
DECEMBER 2009 SERVICE CHANGES
BOARDINGS BOARDINGS/REV HR QTR COMPLAINTS
Line(s) Description of Change Before After Before After Before After
153 Discontinued 152/153/353 152/353
53.0 54.9 24 39 (Line 152 retained) 12,919 12,919
New Service DX - 6283 DX - 8514
190 (490) (replaces portion of former line) - SILVER LINE
SA -1739 SA - 4127 36.2 32.5 17 25
SU -1359 SU - 2843
New Service DX -7415
included included included 194 (484)
(replaces portion of former line) - SILVER LINE SA - 4174
above 32.3
above 29
above SU - 3057
New Service DX -4324 DX - 3318
246 (446) (replaces portion of former line) - SILVER LINE
SA - 2262 SA - 2221 25.8 27.3 25 21
SU -1765 SU -1689
247 (447) New Service included included included included included included
(replaces portion of former line) - SILVER LINE above above above above above above -~-
Cumulative Impacts of Service Changes since June 2007 23
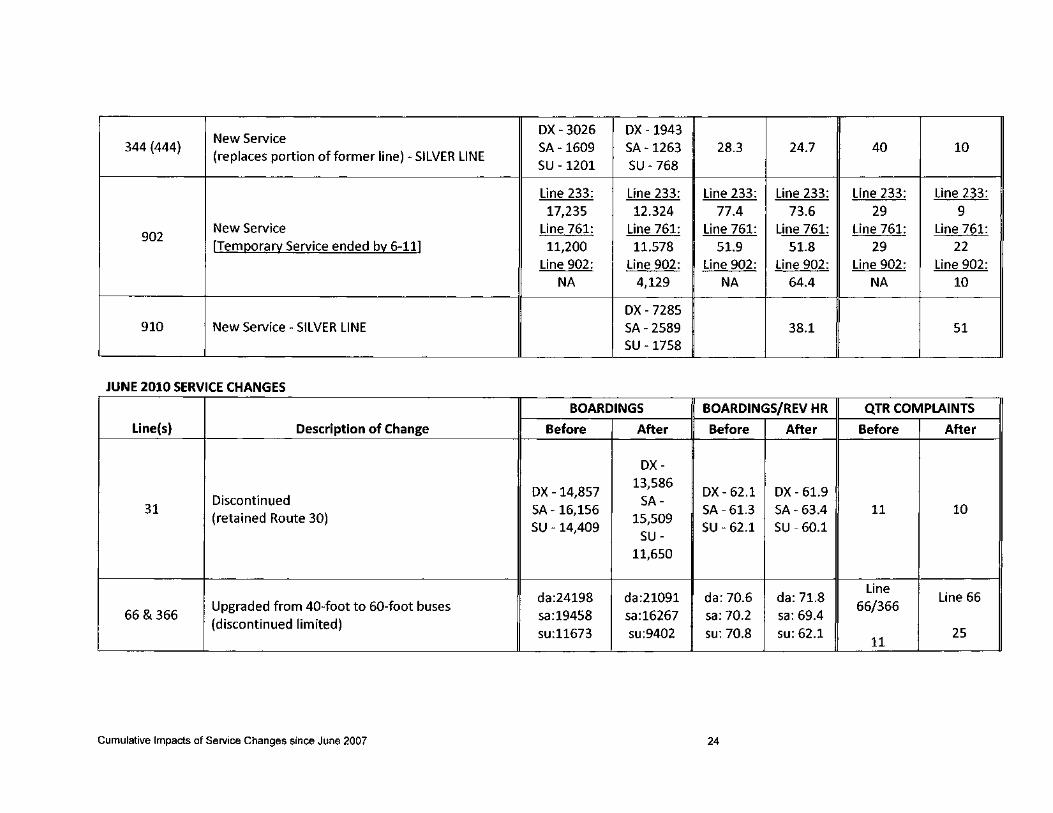
New Service OX - 3026 OX -1943
344 (444) (replaces portion of former line) - SILVER LINE
SA-1609 SA-1263 28.3 24.7 40 10 SU -1201 SU -768
line 233: line 233: line 233: line 233: line 233: line 233: 17,235 12.324 77.4 73.6 29 9
902 New Service line 761: line 761: line 761: line 761: line 761: line 761: [Teml2orarv Service ended b~ 6-11] 11,200 11.578 51.9 51.8 29 22
line 902: line 902: line 902: line 902: line 902: line 902: NA 4,129 NA 64.4 NA 10
OX -7285 910 New Service - SILVER LINE SA- 2589 38.1 51
SU -1758 -
JUNE 2010 SERVICE CHANGES
BOARDINGS BOARDINGS/REV HR QTR COMPLAINTS i
Line(s) Description of Change Before After Before After Before After
DX-
OX -14,857 13,586
DX- 62.1 OX - 61.9 Discontinued SA-
31 (retained Route 30)
SA - 16,156 15,509
SA- 61.3 SA- 63.4 11 10 SU -14,409
SU -SU - 62.1 SU - 60.1
11,650
da:24198 da:21091 da: 70.6 da: 71.8 line
line 66 66& 366
Upgraded from 40-foot to 60-foot buses sa:19458 sa:16267 sa: 70.2 sa: 69.4
66/366 (discontinued limited)
su:11673 su:9402 su: 70.8 su: 62.1 25 11
~- ----- ~~- -~-
Cumulative Impacts of Service Changes since June 2007 24
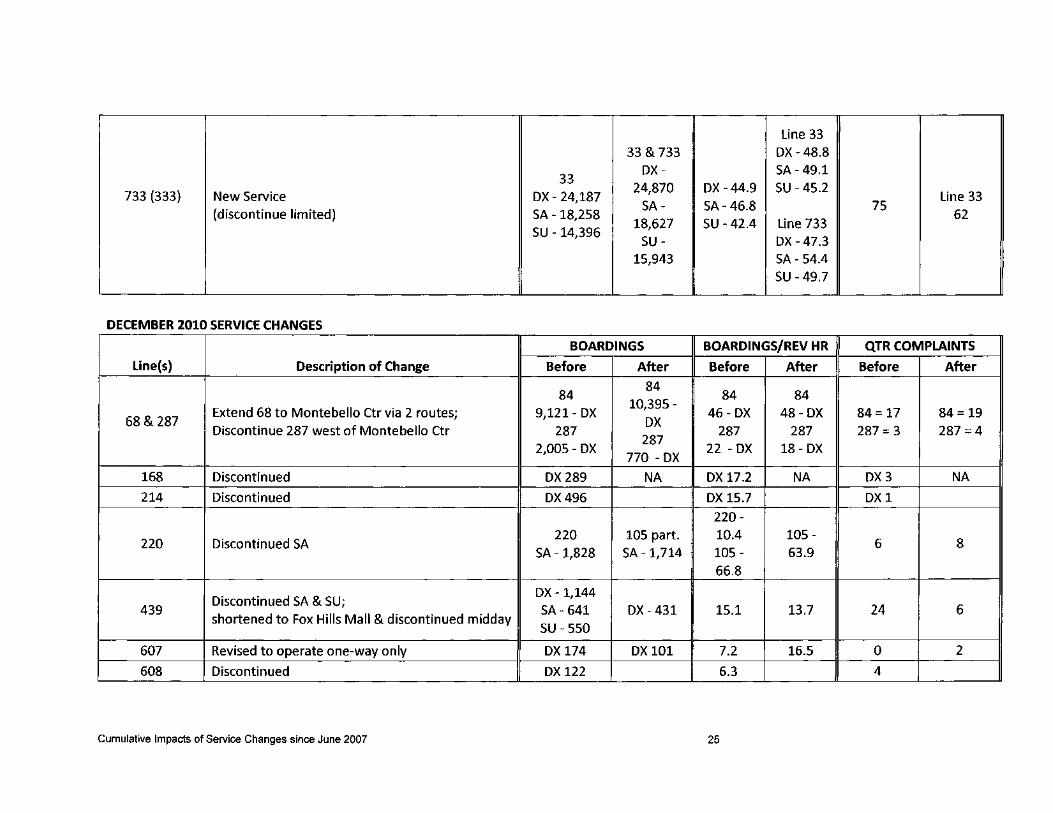
line 33 33 & 733 OX -48.8
33 DX- SA-49.1
733 (333) New Service OX - 24,187 24,870 DX-44.9 SU -45.2
(discontinue limited) SA- SA- 46.8
line 33 SA -18,258
75 18,627 SU - 42.4 line 733
62 SU -14,396
SU - OX - 47.3 15,943 SA- 54.4
SU - 49.7 --- - --- -- - ---
DECEMBER 2010 SERVICE CHANGES
BOARDINGS BOARDINGS/REV HR QTR COMPLAINTS
Line(s) Description of Change Before After Before After Before After
84 84
84 84 Extend 68 to Montebello Ctr via 2 routes; 9,121- OX
10,395 -46- OX 48- OX 84= 17 84= 19
68 & 287 OX Discontinue 287 west of Montebello Ctr 287
287 287 287 287 =3 287 =4
2,005 - OX 770 - OX
22 - OX 18 - OX !
168 Discontinued OX 289 NA OX 17.2 NA DX3 NA I
214 Discontinued OX 496 OX 15.7 DXl
220-
220 Discontinued SA 220 105 part. 10.4 105 -
6 8 SA -1,828 SA-l,714 105 - 63.9
66.8
Discontinued SA & SU; OX -1,144
439 SA - 641 OX -431 15.1 13.7 24 6 shortened to Fox Hills Mall & discontinued midday
SU - 550
607 Revised to operate one-way only OX 174 OX 101 7.2 16.5 0 2
608 Discontinued OX 122 6.3 4
Cumulative Impacts of Service Changes since June 2007 25
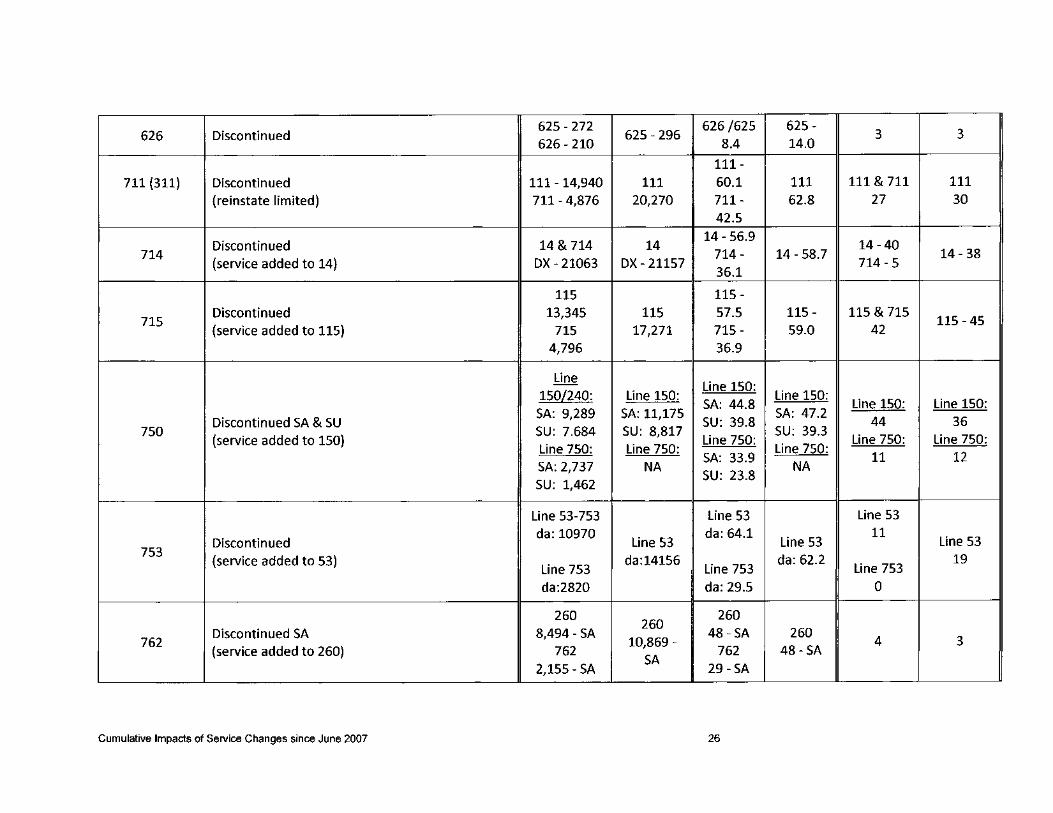
626 Discontinued 625 - 272
625 - 296 626/625 625 -
3 3 626 - 210 8.4 14.0
111-
711 (311) Discontinued 111-14,940 111 60.1 111 111 & 711 111
(reinstate limited) 711-4,876 20,270 711- 62.8 27 30 42.5
Discontinued 14& 714 14 14- 56.9
14-40 714 714- 14 - 58.7 14- 38
(service added to 14) OX - 21063 OX - 21157 36.1
714-5
115 115-
715 Discontinued 13,345 115 57.5 115 - 115 & 715
115 -45 (service added to 115) 715 17,271 715 - 59.0 42
4,796 36.9
Line Line 150:
150[240: Line 150: SA: 44.8
Line 150: Line 150: Line 150:
SA: 9,289 SA: 11,175 SA: 47.2 Discontinued SA & SU SU: 39.8 44 36
750 (service added to 150)
SU: 7.684 SU: 8,817 Line 750:
SU: 39.3 Line 750: Line 750:
Line 750: Line 750: Line 750: SA: 2,737 NA
SA: 33.9 NA
11 12
SU: 1,462 SU: 23.8
Line 53-753 Line 53 Line 53
Discontinued da:l0970
Line 53 da: 64.1
Line 53 11
Line 53 753
(service added to 53) da:14156 da: 62.2 19 Line 753 Line 753 Line 753
da:2820 da: 29.5 0
260 260
260
762 Discontinued SA 8,494- SA
10,869 -48-SA 260
4 3 (service added to 260) 762
SA 762 48-SA
2,155 - SA 29 -SA
Cumulative Impacts of Service Changes since June 2007 26
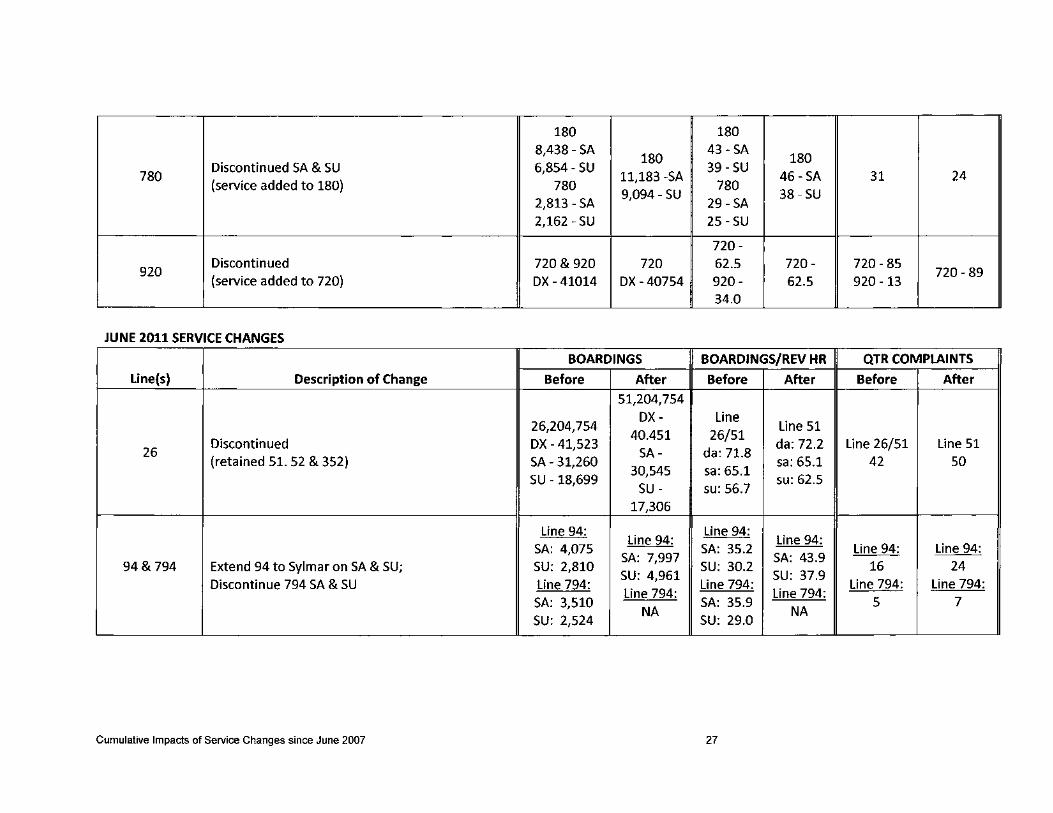
180 180 8,438 - SA
180 43 -SA
180 780
Discontinued SA & SU 6,854 - SU 11,183 -SA
39 -SU 46 -SA 31 24
(service added to 180) 780 780 2,813 - SA
9,094 - SU 29 -SA
38 -SU
2,162 - SU 25-SU
720-
920 Discontinued 720 & 920 720 62.5 720- 720 - 85
720 - 89 (service added to 720) DX - 41014 DX - 40754 920- 62.5 920 -13
I ---- ,---- -----------_~.O_
~ ---_ .. _---
JUNE 2011 SERVICE CHANGES
BOARDINGS BOARDINGS/REV HR QTR COMPLAINTS
Line(s) Description of Change Before After Before After Before After
51,204,754
26,204,754 DX- Line
Line 51 40.451 26/51
26 Discontinued DX - 41,523
SA- da: 71.8 da: 72.2 Line 26/51 Line 51
(retained 51. 52 & 352) SA - 31,260 30,545 sa: 65.1
sa: 65.1 42 50 SU -18,699
SU - su: 56.7 su: 62.5
17,306
Line 94: Line 94:
Line 94: Line 94:
SA: 4,075 SA: 35.2 Line 94: Line 94: SA: 7,997 SA: 43.9
94 & 794 Extend 94 to Sylmar on SA & SU; SU: 2,810 SU: 4,961
SU: 30.2 SU: 37.9
16 24
Discontinue 794 SA & SU Line 794: Line 794: Line 794: Line 794:
SA: 3,510 Line 794:
SA: 35.9 Line 794:
5 7 NA
SU: 2,524 NA
SU: 29.0
Cumulative Impacts of Service Changes since June 2007 27
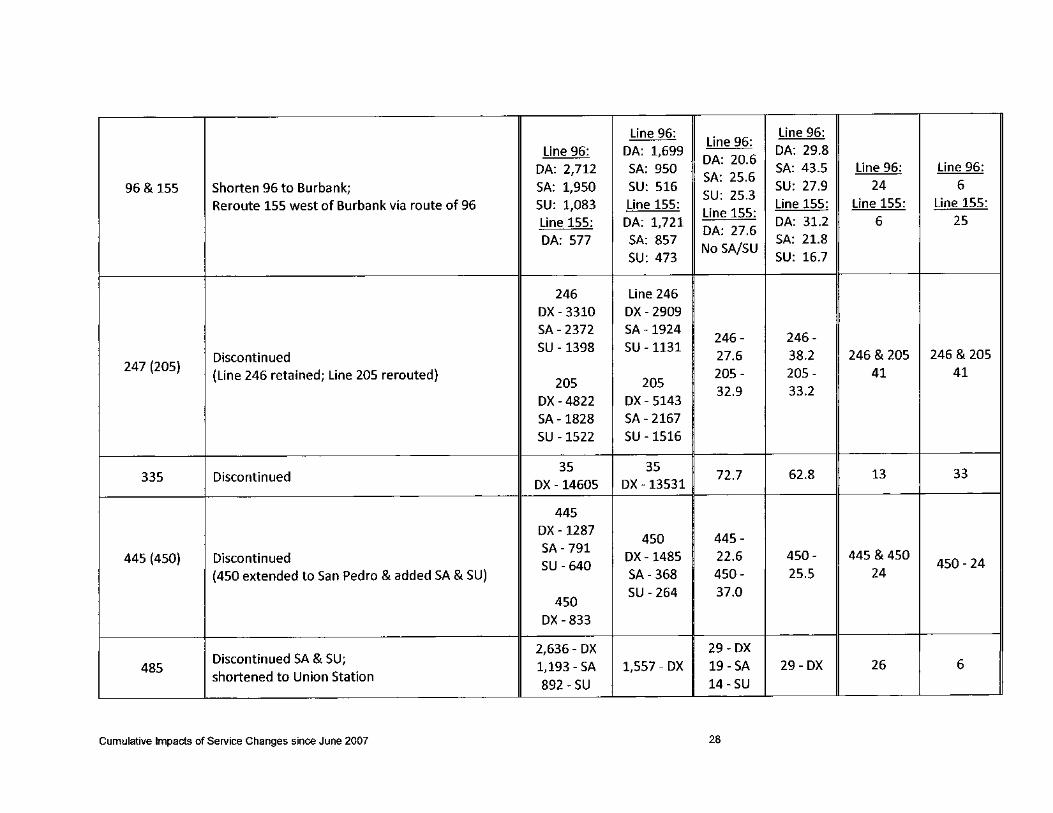
Line 96: Line 96:
Line 96:
Line 96: DA: 1,699 DA: 29.8 DA: 20.6
DA: 2,712 SA: 950 SA: 43.5 Line 96: Line 96:
96 & 155 Shorten 96 to Burbank; SA: 1,950 SU: 516 SA: 25.6
SU: 27.9 24 6 SU: 25.3
Reroute 155 west of Burbank via route of 96 SU: 1,083 Line 155: Line 155:
Line 155: Line 155: Line 155:
Line 155: DA: 1,721 DA: 27.6
DA: 31.2 6 25
DA: 577 SA: 857 No SA!SU
SA: 21.8
SU: 473 SU: 16.7
246 Line 246 DX - 3310 DX - 2909 SA- 2372 SA -1924
246- 246-
Discontinued SU -1398 SU -1131
27.6 38.2 246 &205 246 & 205 247 (205)
(Line 246 retained; Line 205 rerouted) 205 - 205 - 41 41 205 205
DX -4822 DX - 5143 32.9 33.2
SA-1828 SA - 2167 SU -1522 SU -1516
335 Discontinued 35 35
72.7 62.8 13 33 DX -14605 DX-13531
445 DX -1287
450 445 -
445 (450) Discontinued SA-791
DX -1485 22.6 450- 445 &450
(450 extended to San Pedro & added SA & SU) SU - 640
SA- 368 450- 25.5 24 450 - 24
450 SU - 264 37.0
DX -833
Discontinued SA & SU; 2,636 - DX 29- DX
485 shortened to Union Station
1,193 - SA 1,557 - DX 19 -SA 29- DX 26 6
892 - SU 14-SU
Cumulative Impacts of Service Changes since June 2007 28
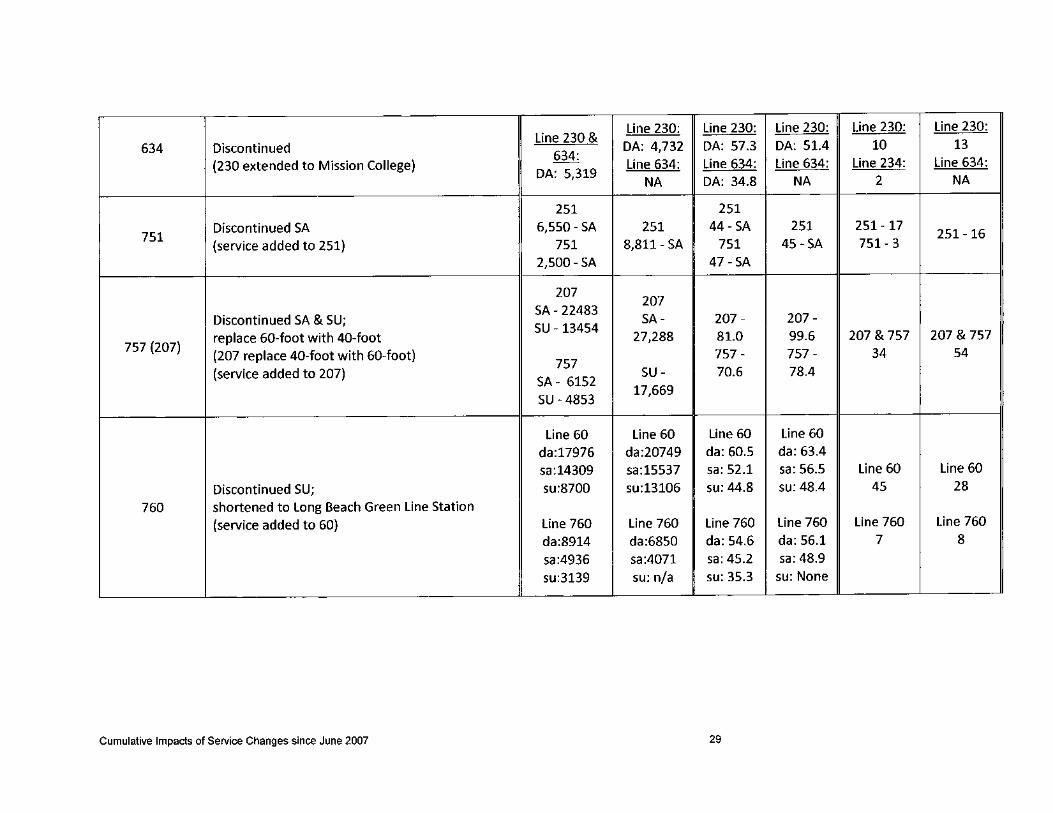
line 230 & line 230: line 230: line 230: line 230: line 230:
634 Discontinued DA: 4,732 DA: 57.3 DA: 51.4 10 13 634:
(230 extended to Mission College) line 634: line 634: line 634: line 234: line 634: DA: 5,319
NA DA: 34.8 NA 2 NA
251 251
751 Discontinued SA 6,550 - SA 251 44-SA 251 251-17
251-16 (service added to 251) 751 8,811- SA 751 45-SA 751- 3
2,500- SA 47-SA
207 207
Discontinued SA & SU; SA- 22483
SA- 207 - 207 -SU -13454
757 (207) replace 60-foot with 40-foot 27,288 81.0 99.6 207 & 757 207 & 757
(207 replace 40-foot with 60-foot) 757 - 757 - 34 54
(service added to 207) 757
SU - 70.6 78.4 SA- 6152 SU - 4853
17,669
line 60 line 60 line 60 line 60 da:17976 da:20749 da: 60.5 da: 63.4 sa:14309 sa:15537 sa: 52.1 sa: 56.5 line 60 line 60
Discontinued SU; su:8700 su:13106 su: 44.8 su: 48.4 45 28
760 shortened to Long Beach Green line Station (service added to 60) line 760 line 760 line 760 line 760 line 760 line 760
da:8914 da:6850 da: 54.6 da: 56.1 7 8
sa:4936 sa:4071 sa: 45.2 sa: 48.9 su:3139 su: n/a su: 35.3 su: None
Cumulative Impacts of Service Changes since June 2007 29
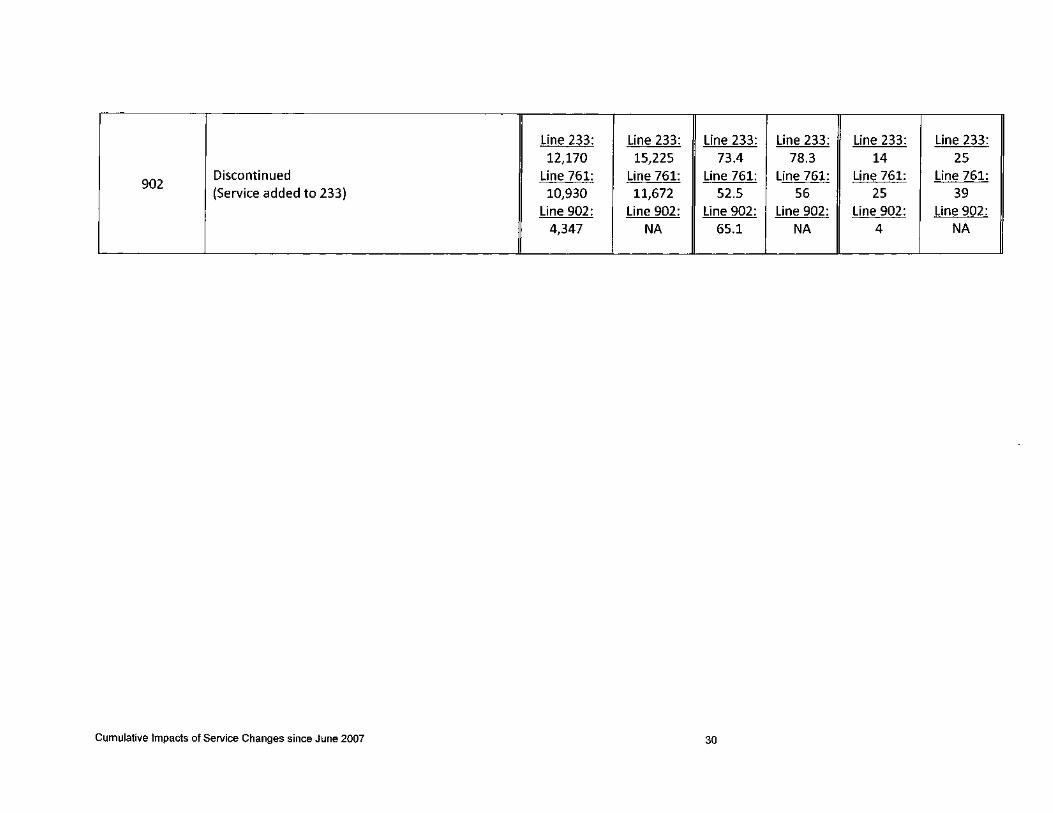
Line 233: Line 233: Line 233: Line 233: Line 233: Line 233: 12,170 15,225 73.4 78.3 14 25
902 Discontinued Line 761: Line 761: Line 761: Line 761: Line 761: Line 761: (Service added to 233) 10,930 11,672 52.5 56 25 39
Line 902: Line 902: Line 902: Line 902: Line 902: Line 902: 4,347 NA 65.1 NA 4 NA
-------------- .... _- ---- - --- - - -- ---------
Cumulative Impacts of Service Changes since June 2007 30